people management: developing and testing a measurement...
TRANSCRIPT
Seediscussions,stats,andauthorprofilesforthispublicationat:https://www.researchgate.net/publication/320570227
Peoplemanagement:developingandtestingameasurementscale
ArticleinTheInternationalJournalofHumanResourceManagement·October2017
DOI:10.1080/09585192.2017.1375963
CITATIONS
0
READS
37
3authors:
Someoftheauthorsofthispublicationarealsoworkingontheserelatedprojects:
FormalizationandevaluationofpriorknowledgeViewproject
‘Fitternakanker':Studyingtheeffectivenessandworkingmechanismsoftwodifferente-health
interventionsforpeoplesufferingfromchronicfatigueaftercancer.Viewproject
EvaKnies
UtrechtUniversity
36PUBLICATIONS172CITATIONS
SEEPROFILE
P.L.M.Leisink
UtrechtUniversity
126PUBLICATIONS692CITATIONS
SEEPROFILE
RensvandeSchoot
UtrechtUniversity
152PUBLICATIONS2,121CITATIONS
SEEPROFILE
AllcontentfollowingthispagewasuploadedbyEvaKnieson26October2017.
Theuserhasrequestedenhancementofthedownloadedfile.
People Management: Developing and Testing a Measurement Scale
1
People Management: Developing and Testing a Measurement Scale
Eva Knies*, Peter Leisink, and Rens van de Schoot
Utrecht University, The Netherlands
* Corresponding author: [email protected]
Full correspondence details:
Dr. Eva Knies (corresponding author)
Utrecht University School of Governance
Bijlhouwerstraat 6, 3511 ZC Utrecht, The Netherlands
Tel +31-30 253 9696
Prof. Peter Leisink
Utrecht University School of Governance
Bijlhouwerstraat 6, 3511 ZC Utrecht, The Netherlands
Tel + 31-30 253 6661
Dr. Rens van de Schoot
Utrecht University, Department of Methods and Statistics and
North-West University, Optentia Research Program, Faculty of Humanities, South Africa
Padualaan 14, 3584 CH Utrecht, The Netherlands
Tel + 31 30 253 4594
Acknowledgements: The third author mainly had an advisory role in the data analysis.
People Management: Developing and Testing a Measurement Scale
2
People Management: Developing and Testing a Measurement Scale
Abstract
The central concept in this study is people management, referring to line managers’
implementation of human resource management practices and their leadership behaviour
oriented at supporting the employees they supervise at work. In this study we conceptualize
people management and develop a multidimensional scale to measure it from the perspectives
of both employees and line managers. Using a Study 1/Study 2 design, including two-wave
multilevel data from employees and line managers of a financial service provider, and cross-
sectional data from teachers, educational support staff, and supervisors, we demonstrate the
scale’s reliability and multidimensionality across samples and over time. We provide
evidence of the convergent validity by showing that employees’ and line managers’
perceptions of people management are significantly related, and that people management is
significantly related to transformational and transactional leadership. Also, we demonstrate
that people management adds explained variance above and beyond transformational and
transactional leadership in predicting team performance. We demonstrate criterion-related
validity through people management’s relationship with job satisfaction, commitment, and
work engagement. We discuss the implications of our measure for theory and research on
people management, its antecedents, and its effects.
Keywords: HRM implementation; leadership behaviour; line managers; people management;
scale development
People Management: Developing and Testing a Measurement Scale
3
Introduction
From the 1990s onwards, we have witnessed a growing scholarly interest in Human Resource
Management (HRM), its antecedents, and its effects on organizational and employee
outcomes. In particular, research has focused on the antecedents and effects of HR practices,
either single practices (such as training and development or compensation and benefits) or
systems/bundles of practices. A large majority of the empirical studies into HRM apply a
quantitative research design. This raises the question of how HRM is to be defined and
measured. Although the conceptualization and operationalization of HRM have improved
significantly over the past decades, we signal three measurement issues that remain.
First, many measures generate an over-simplified assessment of HR practices. Boselie,
Dietz, and Boon (2005) distinguish three types of measures and conclude that, in most
studies, the presence of practices is determined by using a dichotomous variable (present/not-
present). Notable exceptions are studies by Huselid (1995) and Guest, Michie, Conway, and
Sheehan (2003) that use a so-called coverage measure, reflecting the proportion of the
workforce covered by certain HR practices. According to Boselie et al., the most
‘sophisticated’ measure is one that measures the intensity of HR practices, i.e. the degree to
which an individual employee is exposed to the practices. However, with the exception of
Truss (2001), this type of measure is hardly ever used.
Second, in many studies, it is the presence of HR practices as such that is measured.
Although it is recognized that, in many organizations, line managers are increasingly
responsible for HR implementation (Brewster, Brookes, & Gollan, 2015), their critical role in
the enactment process is under-researched (Gilbert, De Winne, & Sels, 2011; Purcell et al.,
2003). In response, Guest and Bos-Nehles (2013) advocate a shift from the measurement of
practices as such to how these are applied, typically by line managers.
People Management: Developing and Testing a Measurement Scale
4
Third, the role of line managers’ leadership behaviour in shaping employees’ perceptions
of HRM is often overlooked. According to Guest (2011, p. 7): ‘Advocates of the influence of
leadership will tell us that it is good leadership that makes a difference; and leadership will
have an impact on the content and practice of HRM as well as on management activities’.
However, HRM and leadership appear to be two rather separate academic disciplines and, as a
consequence, insights from leadership theory and research are rarely used in HRM studies.
Addressing the issues outlined above, Purcell and Hutchinson (2007) introduced the
concept of people management. This concept acknowledges that line managers play a crucial
role in shaping employees’ perceptions of HRM through their implementation of HR practices
and their leadership activities. This is an important advance in theory development. However,
Purcell and Hutchinson did not offer a systematic conceptualization and operationalization of
people management. That is a good reason to examine related concepts and measures that tap
into dimensions of people management, such as Gilbert et al.’s (2011) measure of line
manager enactment of HR practices, perceived supervisor support (Eisenberger et al., 2002),
and taxonomies of leadership behaviour (Bass & Bass, 2008; Yukl, 2012). We will examine
these related measures in the next section where we will also elaborate on the theoretical
reasons for the need for a systematic measure of people management.
In this article, we conceptualize people management and develop a multidimensional
scale to measure it. In so doing, we contribute to the literature by addressing the issues
outlined above. Specifically, the measure of people management we present (1) captures the
degree to which individual employees are exposed to people management (i.e. intensity of
people management), (2) is based on the acknowledgement that line managers play a crucial
role in shaping perceptions of HRM, and (3) combines insights from the HRM and leadership
bodies of knowledge to conceptualize the symbiotic relationship between the implementation
of HR practices and line managers’ leadership behaviour. Our people management scale
People Management: Developing and Testing a Measurement Scale
5
provides scholars with a reliable and valid measure, which allows them to examine people
management from the perspectives of both employees and line managers.
Theoretical Framework
In this section, we first discuss the theoretical distinction between intended, implemented, and
perceived HRM. Next, we introduce the concept of people management. Then, we provide the
theoretical case for the need for a measure of people management. We conclude by outlining
our conceptualization of people management, which lays the foundations for our scale
development.
HRM from Three Perspectives: The Role of Line Managers
Recent conceptual frameworks (Purcell & Kinnie, 2007; Wright & Nishii, 2013) make a
distinction between intended, implemented, and perceived HRM. The underlying assumption
is that there can be differences between the designed HR practices, the way these are
implemented, and employees’ perceptions of these practices. Intended practices are those
designed by senior management or HR management. Implemented practices are those that are
actually applied, typically by line managers. This conceptual differentiation is based on an
awareness that not all practices are implemented in the ways intended, and that some will not
be implemented at all. According to the framework, the implemented practices will then be
subjectively perceived by employees. Thus, we arrive at perceived practices: those
experienced and judged by individual employees.
This distinction has implications when it comes to selecting respondents to rate HRM and
for the level of analysis. HR representatives or senior management can be asked about
intended HRM, line managers about implemented HRM, and employees about perceived
People Management: Developing and Testing a Measurement Scale
6
HRM (Gerhart, Wright, McMahan, & Snell, 2000). This implies that perceived practices
should be measured at the individual level of analysis. Implemented practices are situated on
the team level, since all employees supervised by one manager are subjected to the HR
practices implemented by this manager. Intended practices can be measured at the
organizational level. This is graphically displayed in Figure 1. In this article, we will develop
a scale to measure both implemented and perceived people management because this is an
underdeveloped area compared to intended practices.
[Insert Figure 1 about here]
The distinction between intended and implemented HRM draws attention to the actors
responsible for the translation of intended into implemented HR practices. The literature
mentions several HR ‘delivery channels’ such as HR shared service centres, HR
professionals, and line managers (Farndale, Paauwe, & Boselie, 2010). In this article we
specifically focus on line managers as organizational agents (Eisenhardt, 1989). This choice is
based on the observation that, in many organizations, line managers have an important
responsibility for HRM (Brewster et al., 2015).
People management: Theoretical Case for a Systematic Measure
The theoretical case for developing a measure of people management is based on our view of
the nature of the relationship between the two core components, which subsequently has
implications for their operationalization. According to Purcell and Hutchinson (2007, pp. 3-
4):
The twin aspects of FLMs’ [frontline managers] people management activities,
leadership behaviour and the application of HR practices, imply a symbiotic
People Management: Developing and Testing a Measurement Scale
7
relationship between them. FLMs need well designed HR practices to use in their
people management activities in order to help motivate and reward employees and
deal with performance issues and worker needs. The way FLMs enact these practices
will be influenced by their leadership behaviour.
The view taken here is that line managers have a set of roles including the manager
motivating subordinates and the human resource management role which do not operate
independently. As Purcell and Hutchinson, we see line managers’ people management
activities as ‘more discretionary than other aspects of FLM duties especially those related to
the primary task of the work unit’ (p. 6). The discretionary nature of their people management
activities implies that line managers’ implementation of HR practices will be influenced by
their leadership behaviour. The degree of discretion may vary between HR practices
depending on the degree of formalization of an organization’s HR policies (Purcell &
Hutchinson, 2007, p. 6). However, the discretionary nature of line managers’ people
management as such suggests the need to conceptualize HRM more broadly, including both
the implementation of HR practices and line managers’ leadership behaviour, and the need to
recognize that these components can mutually reinforce each other.
The variability of line managers’ people management is an important factor explaining
differences in perceived HR practices among employees. Purcell and Hutchinson (2007, p. 5)
add that the quality of the relationship between employees and line managers is also likely to
influence employees’ perceptions of HR practices. Following LMX theory (Graen & Uhl-
Bien, 1995), they argue that the quality of the LMX relationship and the extent to which the
line manager is seen as people manager both contribute to the strength of the HRM system (p.
17). We follow the suggestion inherent in this argument that people management and the
LMX relationship are conceptually distinct.
People Management: Developing and Testing a Measurement Scale
8
Anticipating more detailed arguments in later sections, we see the symbiotic relationship
between the implementation of HR practices and line managers’ leadership behaviour as
requiring operationalizations that are mutually attuned and oriented to the support of the
individual employee the line manager supervises. This means that existing related measures
were not incorporated as components of our people management measure, although we made
use of these in developing our items. More concretely, concerning the implementation of HR
practices, we followed Boselie et al.’s (2005) argument that the most sophisticated measure of
HRM is one that measures the degree to which an individual employee is exposed to HR
practices. Therefore, we developed items from the employee perspective that referred to the
perception of the individual employee of a specific HR practice or leadership behaviour with
regard to him or herself. This theoretical rationale differs from the concept of line managers’
enactment of HR practices and line managers’ relations-oriented leadership behaviour
developed by Gilbert et al. (2011), which concerns the individual employee’s perception of
how his/her supervisor acts towards all subordinates generally.
Regarding the leadership behaviour component of people management, we examined
taxonomies of leadership behaviour such as Yukl’s (2012) which differentiates between four
meta-categories that are held to influence performance. However, many of these leadership
behaviours are not related to line managers’ implementation of HR practices, and are not
oriented to the support of employees at their job. For our purpose the relations-oriented
leadership behaviours are the most relevant, which following Yukl (2012) consist of
supporting, developing, recognizing, and empowering employees. Focusing on these, we note
that relevant measures have been developed but that these still require adaptation to fit the
people management concept. Rafferty and Griffin (2006) are an interesting example in this
respect as their study includes three items for both supportive and developmental leadership,
which relate to the two leadership dimensions in our study (see further). However, their items
People Management: Developing and Testing a Measurement Scale
9
are rather abstract dealing with supervisors’ attention to personal feelings, personal needs, and
employees’ interests, rather than for instance concretely showing an interest in how the
individual employee does his/her job.
This evaluation also holds for the related concept of perceived supervisor support (PSS),
which is commonly measured as perceived organizational support (POS) but replacing the
word ‘organization’ with ‘supervisor’(Eisenberger et al., 2002). The items that make up the
PSS measure concern the individual employee (‘me’) but refer mostly to general attitudes of
human beings that are not set in the work context (Rhoades, Eisenberger, & Armeli, 2001, p.
828). Example items that illustrate this observation are ‘My supervisor really cares about my
well-being’ and ‘My supervisor strongly considers my goals and values’. Therefore, these
existing measures of relations-oriented leadership behaviour and PSS were not incorporated
in the people management concept, but we drew on these literatures for developing our people
management measure.
Summarizing, we argue that the people management concept requires a systematic
operationalization which fits the symbiotic relationship between its two main components,
and its orientation on line managers’ support for the employees they supervise at their job. To
our knowledge there are no existing measures that meet these requirements and that can be
incorporated as such. Therefore, we developed and validated a multidimensional scale to
measure people management, for which we drew on existing measures by adapting items to
the people management concept. We will return to this choice in the conclusions and
discussion section. We proceed by elaborating on the two components of people management.
Implementation of HR Practices
The first element of the people management concept, the implementation of HR practices, has
its roots in the HR devolution literature (Perry & Kulik, 2008). According to Larsen and
People Management: Developing and Testing a Measurement Scale
10
Brewster (2003, p. 228), ‘the notion of line management accepting greater responsibility for
human resource management within employing organizations is now received wisdom’. They
distinguish several HR policy areas, such as pay, training and development, and health. These
policy areas closely reflect the seven HR practices scale developed by Boon, Den Hartog,
Boselie, and Paauwe (2011) that together represent a set of ‘high performance’ HR practices.
In contrast to Boon et al., we do not focus on HR practices as such, but on their
implementation by line managers towards the employees they supervise.
When studying employees’ perceptions of their line manager’s implementation it is not
sufficient to focus solely on the presence of practices (Boselie et al., 2005). The perceptions
that employees have of the reasons why management has adopted certain HR practices (so-
called ‘HR attributions’) are also important. Nishii, Lepak, and Schneider (2008) introduced
this concept, arguing that HR attributions have consequences for employees’ attitudes. They
show that practices that are perceived as commitment-focused (i.e. intended to enhance
service quality and employee wellbeing) are positively related to employees’ attitudes,
whereas practices that are perceived as control-focused (i.e. designed to reduce costs and
exploit employees) are negatively associated with their attitudes. This important distinction is
not recognized by Gilbert et al.’s hypothesis (2011, p. 1622) that ‘employee perceptions of
effective enactment of HR practices by their line managers are positively related to
employees’ affective commitment’. In the notion of effective enactment, ‘effective’ refers to
producing the results that were intended. However, when management’s intentions are aimed
at reducing costs, the effective implementation of HR practices by line managers will likely
be perceived by employees as control-focused and, following Nishii et al., be negatively
related to employees’ affective commitment. Because we share the scholarly interest in the
effect HRM can have on organizational and employee outcomes through positively affecting
People Management: Developing and Testing a Measurement Scale
11
employees’ attitudes and behaviours, this study will operationalize the implementation of HR
practices and line managers’ leadership as supportive behaviours.
According to Guest (2007), two levels of HR implementation can be distinguished. On the
one hand, line managers implement general practices, ones that apply to all employees in their
team. On the other hand, line managers are increasingly expected to make tailor-made
arrangements with individual employees. HR practices established at the organizational level
outline the framework for such deals.
The literature on high performance or high commitment work practices is closely related
to the implementation of general practices. The basic assumption is that organizations develop
practices aimed at stimulating employees’ ability, motivation, and opportunity to perform
(Wright and Boswell, 2002). In this article, we will study line managers’ implementation of
HR practices in the various HR areas distinguished by Boon et al. (2011).
In terms of the implementation of tailor-made arrangements we were inspired by the
literature on idiosyncratic deals (Rousseau, 2005) and deals made in a ‘cafeteria’ system
(Benders, Delsen, & Smits, 2006). Tailor-made arrangements can take various forms, but
have two common characteristics. First, these are voluntary ‘deals’ that employees make with
their supervisor and that potentially can cover any HR practice or aspect of their employment
relationship. Second, these must, in some way, contribute to the functioning or well-being of
employees. One type of tailor-made arrangement (idiosyncratic deals or i-deals) is completely
individualized and differs in some fashion from those received by colleagues hired to do the
same work (Rousseau, 2005, p. 8). Another type of tailor-made arrangement is made in a
‘cafeteria’ system, in which employees exchange money and free time to suit their
preferences (Benders et al., 2006).
People Management: Developing and Testing a Measurement Scale
12
Leadership Behaviour
The second element of the people management concept, leadership behaviour, builds on the
notions of social exchange, PSS, and POS. Eisenberger, Huntington, Hutchinson, and Sowa
(1986) used the concept of POS to explain employee commitment to an organization. Based
on social exchange theory, they argue that high levels of POS create feelings of obligation,
through which employees feel that they ought to reciprocate and engage in behaviour that
supports organizational goals. Organizational support theory holds that employees see
supervisors as agents acting on behalf of the organization. Several studies (Eisenberger et al.,
2002; Rhoades & Eisenberger, 2006) have shown that employees’ PSS is positively related to
employees’ POS, organizational commitment, and performance.
In this article, leadership behaviour is understood as a manager demonstrating supportive
behaviour through specific acts that aim to help employees at work. That is, we focus on the
relations-oriented dimension of leadership (Bass & Bass, 2008; Yukl, 2012) which aims at
fostering the quality of human relations, organizational commitment, and other employee
attitudes in which we are interested from the perspective of the effect that HRM can have on
organizational and employee outcomes through positively affecting employees’ attitudes and
behaviours. As Gilbert et al. (2011, p. 1622), we did not include task-oriented leadership
because its primary objective is associated with improving productivity and reducing costs,
which following Nishii et al. (2008) is likely to evoke control-oriented perceptions among
employees. More specifically, Greenhaus, Parasuraman, and Wormley (1990) describe
supportive behaviour by supervisors as including the provision of career guidance,
performance feedback, and opportunities that promote employee development. Oldham and
Cummings (1996) observe that supervisors are supportive when they show concern for their
employees’ feelings and needs, encourage them to voice their own concerns, provide
feedback, and facilitate their development.
People Management: Developing and Testing a Measurement Scale
13
Based on earlier research by Knies and Leisink (2014), a distinction can be made between two
focal points: supportive behaviour aimed at increasing employees’ personal commitment; and
supportive behaviour aimed at supporting their career development. This parallels the
distinction in the leadership literature between supportive and developmental leadership
(Rafferty & Griffin, 2006), and the distinction made in the literature on mentoring (Allen et
al., 2004) which distinguishes between psychosocial support and career-related support
provided by mentors to their protégés.
Concluding Remarks
People management is defined as line managers’ implementation of HR practices and their
leadership behaviour in supporting the employees they supervise at work. We distinguish two
components of people management: the implementation of HR practices by line managers and
their leadership behaviour. Both components are broken down into two sub-dimensions. In
the implementation of HR practices, we distinguish two levels of implementation: general
practices and tailor-made arrangements. With regard to the leadership behaviour of line
managers, two focal points are distinguished: the support of employees’ commitment and the
support of employees’ career development. Our conceptualization of people management is
graphically displayed in Figure 2.
[Insert Figure 2 about here]
Study 1: Research Design
People Management: Developing and Testing a Measurement Scale
14
We conducted two studies to develop our people management scale and accumulate evidence
on the validity of the measure. In this section, we introduce the four-step procedure followed
in Study 1, and then present the research sample used in Study 1.
Steps in Scale Development and Validation
In developing and testing the validity of our people management measure, we followed the
procedure outlined by DeVellis (2003). The data analysis was carried out using Mplus
(Muthén & Muthén, 2012).
Phase 1: Item Generation
In Phase 1, we generated a pool of potential items to measure the four theoretically-derived
dimensions of people management.
Phase 2: Psychometric Properties of the Scale
In Phase 2, we evaluated the proposed multidimensional scale for measuring people
management for its psychometric properties. First, we examined dimensionality by
performing an exploratory factor analysis (EFA) using the data from those employees who
only participated in our study at Time 2 (see under research sample), and confirmatory factor
analyses (CFAs) using the data from those employees and their line managers who
participated in the survey at both Time 1 and Time 2. We conducted both first- and second-
order CFAs because the literature suggests that people management is a multidimensional
construct with four underlying dimensions. We examined the fit of the models and determined
whether the models needed to be modified to improve the fit. Second, we assessed reliability
by examining the Cronbach’s alpha coefficients. Third, in order to assess the extent to which
People Management: Developing and Testing a Measurement Scale
15
the instrument measured the same constructs across time, we tested for metric invariance over
time. Finally, we assessed the temporal stability of the people management scale.
Phase 3: Convergent Validity of the Scale
In order to establish convergent validity, we examined the relationship between our scale and
conceptually similar constructs. In Phase 3, we examined the relationship between line
managers’ and employees’ perceptions of people management. We expected to find a positive
relationship between the two variables based on theoretical models of the HRM-performance
chain, which assume that the implemented HRM has an effect on employees’ perceptions of
HRM (Purcell & Kinnie, 2007; Wright & Nishii, 2013). Moreover, research on multisource
performance ratings (Conway & Huffcutt, 1997) indicates that managers’ self-ratings and
employees’ ratings are significantly correlated. Therefore we test the following hypothesis:
there is a positive relationship between line managers’ and employees’ perceptions of people
management.
In line with Wright and Boswell’s (2002) call for more multilevel analyses in the field of
HRM, we conducted a multilevel analysis to test the hypothesis with implemented people
management from a line manager’s perspective measured on the team level of analysis, and
employees’ perceptions measured on the individual level. That is, individual employees are
nested in supervisor groups.
Phase 4: Criterion-Related Validity of the Scale
In Phase 4, we determined the criterion-related validity of the scale by examining the
relationship between people management and two outcomes with which people management
should be theoretically related: job satisfaction and affective commitment. The premise that
people management is positively related to employee attitudes such as job satisfaction and
People Management: Developing and Testing a Measurement Scale
16
commitment is founded in social exchange theory that suggests that employees will have
positive attitudes towards their job and their organization if they have the feeling that the
organization values their contribution and cares about their wellbeing (Settoon, Bennett, &
Liden, 1996). Empirical studies by Takeuchi, Chen, and Lepak (2009) and by Wu and
Chaturvedi (2009) found that supportive HR practices indeed have a positive effect on
employees’ job satisfaction. There is also empirical evidence that HRM has a positive effect
on affective commitment (Allen, Shore, & Griffeth, 2003; Gould-Williams, 2003). In
addition, studies of PSS and POS have reported positive relationships with job satisfaction
and affective commitment (Rhoades & Eisenberger, 2002). Therefore, the hypothesis that will
be tested is: the extent to which employees perceive people management activities being
practiced is positively related to their (1) job satisfaction, and (2) affective commitment. We
measured job satisfaction with a single item: ‘Generally speaking, I am very satisfied with my
job’. Wanous, Reichers, and Hudy (1997) demonstrated that satisfaction can be reliably
measured with a single item. We measured commitment using four items from Allen and
Meyer’s (1990) scale. A sample item is: ‘My team has a great deal of personal meaning for
me’. Cronbach’s alpha was .83. Respondents used a five-point Likert scale to rate all items.
Research Sample
The data assessed in Study 1 come from a two-wave study (time lag: 17 months) in a financial
service provider in the Netherlands. At Time 1, 6,160 employees and 730 line managers
completed the questionnaire. This is a response rate of 44 and 58 percent respectively. At
Time 2, 3,368 employees and 354 line managers participated in the survey. The data for this
article come from those respondents who completed the questionnaire on both occasions. To
check for a potential attrition bias in the data, we compared those respondents who
participated in the research once, to those who participated twice. T-tests showed no
People Management: Developing and Testing a Measurement Scale
17
significant differences between the two groups on this study’s variables. Thus, the analysis
provides evidence against there being an attrition bias. The data from those employees who
only participated in the study at Time 2 (n=3,255) are used for performing the EFA.
The employees and line managers in the data set are linked in the dyad, based on the team
code included in the survey. 53.8 percent of the employees were male, 46.2 percent were
female. 72.6 percent of the line managers were male and 27.4 percent were female. The mean
age of employees was 42.5 years (SD=8.9 years), the mean age of line managers was 43.2
years (SD=6.9 years). Fifty-five percent of all employees and 80 percent of all line managers
had completed a higher education, and a further 37 percent of the employees had completed
mid-level education.
Study 1: Results
In this section, we present the results of Study 1 of the successive steps in the empirical
development and collection of evidence on the validity of our people management scale. We
performed all the steps using both employee and line manager data collected at Time 1 and at
Time 2. For each step, we first present the results generated by analysing our employee data,
followed by those generated from our line manager sample.
Phase 1: Item Generation
The goal of the first phase in the procedure was to operationalize the dimensions of people
management. Items were generated targeting the four dimensions of people management.
For the dimension supportive HR practices we first made an inventory of possible HR
practices. As this list consisted of 38 HR practices the limits set on the survey for Study 1
required us to cluster these practices. Consultation with a practitioner panel for Study 1,
People Management: Developing and Testing a Measurement Scale
18
which consisted of three HR professionals and two line managers, ultimately resulted in a list
of seven clusters which resembles the seven dimensions of perceived HR practices by Boon et
al. (2011). One difference is that employees who pilot-tested our questionnaire advised us not
to include recruitment and selection, because employees with a long organizational tenure
would not have a reliable recollection of whether the selection process had supported them at
the time. Other differences are that our list split performance appraisal and compensation
(which are combined by Boon et al.) and that we included job mobility as a separate HR
cluster while Boon et al. include this in the training and development cluster.
Based on Rousseau (2005) and Benders et al. (2006) we developed four items for the
implementation of tailor-made arrangements. The items dealing with the tailor-made
arrangements were formulated rather generally because these arrangements can potentially
concern any HR practice. Rather than elaborating on specific types of tailor-made
arrangements distinguished in the literature (see Hornung, Rousseau, & Glaser, 2008), we felt
that it was relevant to concentrate on arrangements to support the employee’s personal
situation on the one hand and their job performance on the other. One item was deleted based
on the feedback from the practitioner panel because it did not refer to the implementation of
tailor-made arrangements itself but rather to precedents which these may cause.
The items for the dimensions support of employees’ commitment and support of
employees’ development were taken from an earlier study of line manager support for older
workers (Leisink & Knies, 2011) and adapted for support for employees in general
(irrespective of age). The scale measuring support of employees’ commitment corresponds
with the scale to measure support of older workers’ commitment, which originally consisted
of six items which were derived from open interviews with older workers and related to
Oldham and Cummings’ (1996) concept of supervisor support. Based on expert judgements
by three researchers, two items were deleted because they did not fit construct validity.
People Management: Developing and Testing a Measurement Scale
19
The scale measuring support of employees’ career development consisted originally of
six items which were also derived from open interviews with older workers and related to
Greenhaus et al.’s (1990) concept of supervisor support. Based on expert judgements by three
researchers, three items were deleted because they did not fit construct validity. One item was
split in two items to differentiate unequivocally between horizontal and vertical mobility. The
two resulting scales with four items each, which had been rephrased to refer to employees
generally, were discussed and accepted by the practitioner panel of Study 1.
As outlined above, most of the generated items were co-developed with practitioners. We
also discussed the items with several academic experts on HRM and organizational behaviour
(n=4), and with a methodology expert. Based on their comments, we modified several items.
Next, the questions were tested with a small panel of testers (n=5) to ensure the clarity of the
items.
Ultimately, our item generation activities resulted in two comparable eighteen-item
questionnaires. Given that our goal was to develop a scale to measure both perceived and
implemented people management, we developed two sets of paired items to reflect both
employees’ and line managers’ perspectives. An example of the paired items is: ‘My
supervisor shows an interest in how I do my job’ (employee) and ‘I show an interest in how
employees do their job’ (line manager). Table 1 lists the questionnaire items.
[Insert Table 1 about here]
The items reflecting the employee’s perspective were formulated with regard to the individual
employee by the use of ‘I’ and ‘me’. We chose to address the individual employee’s
perception of line manager’s behaviour with regard to him/herself for two reasons. First, we
followed Boselie et al.’s (2005) assessment that the most sophisticated measure is one that
People Management: Developing and Testing a Measurement Scale
20
measures the degree to which an individual employee is exposed to HR practices. Second,
employees can more accurately assess their own situation than that of employees generally.
The items reflecting the line manager’s perspective are formulated with regard to all
employees who are supervised by the line manager. The individual line manager is addressed
by ‘I’, while the plural ‘employees’ refers to all his/her subordinates. All items
operationalizing the dimensions implementation of tailor-made arrangements, support of
employees’ commitment, and support of employees’ career development include some kind
of individual manager behaviour such as ‘I show…’, ‘I ask…’, and ‘I offer…’. These
dimensions refer to HR practices and leadership behaviour in which line managers can exert
considerable agency. In case of the implementation of general HR practices, line managers
may have less discretion depending on the degree of formalization of an organization’s HR
policies (see Purcell & Hutchinson, 2007, p. 6). HR practices such as performance appraisal
and compensation are often regulated by protocols and collective systems. Therefore, the
wording of these questionnaire items was adapted to ‘I experience the following HR practices
[7 practices, each of which was assessed separately] as being implemented to support my
employees’, where the passive form ‘being implemented’ reflects the relative lack of
discretion line managers may experience in their implementation, and the words ‘support my
employees’ explicitly focus on their own subordinates rather than employees generally.
All items were formatted to be responded to using a five-point Likert scale, from strongly
disagree to strongly agree. There were three reasons for adopting a 5-point Likert scale. First,
there are many other HRM concepts measured using this scale. This means that respondents
are used to answering these kind of questions. Also, we wanted to adopt the same scale
throughout the questionnaire. Third, we wanted to prevent that respondents would not be able
to distinguish reliably between adjacent categories, which can be the case when adopting a 7-
point scale (Groves et al., 2009, p. 239).
People Management: Developing and Testing a Measurement Scale
21
Phase 2: Psychometric Properties of the Scale
The goal of the second phase was to test the following psychometric properties of our scale:
its dimensionality, reliability, metric invariance, and temporal stability.
Dimensionality
First, we examined the dimensionality of the people management construct by performing an
EFA and CFAs to determine the relationship between the observed variables (questionnaire
items) and the latent variables (constructs). To determine model fit, following the
recommendations by Jackson, Gillaspy, and Purc-Stephenson (2009), we examined the
comparative fit index (CFI), the Tucker-Lewis index (TLI), the root mean square error of
approximation (RMSEA), and the value for χ2/df. A fit is considered acceptable provided both
the CFI and the TLI are .90 or above, and the RMSEA is no greater than .08 (Bentler, 1990).
To determine the relative quality of our models, and to provide a logic for model selection, we
used the Akaike information criterion (AIC) and the Bayesian information criterion (BIC) fit
indices. Before conducting the EFA and CFAs, we screened the data for influential outliers,
missing data, and tested the distributional characteristics of the data. There were no influential
outliers, and only limited missing data which occurred randomly. However, our data were not
normally distributed. Therefore, and because we used a 5-point Likert scale, we decided to
treat all the observed variables as categorical (ordinal) data (Johnson & Creech, 1983). As a
result, most of the fit indices of our models improved, as will be demonstrated below. We
used the WLSMV estimator (Weighted Least Squares with a mean and variance correction for
non-normality) because this is a robust estimator which does not assume normally distributed
variables and provides the best option for modelling categorical data (Brown, 2015). The
WLSMV estimator provides WLS parameters estimates by using a diagonal weight matrix.
People Management: Developing and Testing a Measurement Scale
22
In the EFA, we included the 18 original items and compared a one-factor, two-factor, three-
factor, and four-factor model to assess if our assumption of a four-dimensional structure
indeed fits the data. We used oblimin rotation because this allows for the factors being
correlated, which is expected to be the case for the dimensions of people management.
Table 2 shows the model fits of the different models. The four-factor solution showed the best
fit compared to the one-factor, two-factor, and three-factor models. The factor structure was
as we had expected theoretically. However, we had to delete one item (ITA3) because it had a
factor loading of .223 which is below the suggested cut-off value of .40. A reason why ITA3
showed insufficient internal consistency might be that it was the only item that was
formulated negatively (see Morren, Gelissen, & Vermunt, 2010). We will return to this issue
in the discussion section. The factor loadings ranged from .577 to .820 for supportive HR
practices, from .727 to .731 for implementation of tailor-made arrangements, from .698 to
.880 for support of employees’ commitment, and from .733 to .888 for support of employees’
career development. None of the items loaded on more than one factor.
[Insert Table 2 about here]
Next, based on the results of the literature study and the EFA, we tested both first- and
second-order models using CFAs. In the first-order models, seven items loaded onto the
supportive HR practices dimension (SP1-SP7), two items loaded onto the implementation of
tailor-made arrangements dimension (ITA1-ITA2), four items onto the support of employees’
commitment dimension (SEC1-SEC4), and four onto the support of employees’ career
development dimension (SED1-SED4). To verify whether these four suggested dimensions
People Management: Developing and Testing a Measurement Scale
23
were indeed dimensions of the underlying people management construct, we conducted
second-order CFAs, loading the four dimensions on the second-order construct people
management.
We first conducted a first-order CFA. The fit indices for the resulting model using the
employee data were: CFI=.976; TLI=.973; RMSEA=.053; χ2/df=10.38, p<.001;
AIC=216,877; BIC=217,557. All the items loaded significantly onto the latent variables
(p<.001). Factor loadings ranged from .705 to .937 at Time 1 and from .695 to .954 at Time 2
(see Table 3). When we compare these results with the fit of the model in which all the
observed variables were treated as continuous (CFI=.937; TLI=.929; RMSEA=.054;
χ2/df=10.67, p<.001; AIC=215,802; BIC=216,598), we see that three of the six fit indices
(CFI, TLI, RMSEA) are substantially improved by using categorical data. Despite two other
fit indices (AIC, BIC) suggesting that the model with continuous variables was preferable, we
treated all the variables as categorical because they were not normally distributed.
To check the robustness of our four-factor solution we compared it with a one-factor
model, a two-factor model combining the items for the dimensions implementation of HR
practices and leadership behaviour, and all possible three-factor models combining two
dimensions (see also Armenakis et al., 2007). The fit indices for all these alternative models
are worse than for our four-factor model. These results provide evidence for the validity of
our four-factor model.
We conducted the same first-order CFA using the data from the line managers. The fit
indices treating the line manager data as categorical were as follows: CFI=.934; TLI=.925;
RMSEA=.051; χ2/df=1.92, p<.001; AIC=21,914; BIC=22,417. All the items loaded
significantly onto the latent variables (p<.001). Factor loadings ranged from .560 to .815 with
the Time 1 data and from .569 to .972 with the Time 2 data (see Table 3). This model again
People Management: Developing and Testing a Measurement Scale
24
fitted the data better than when all the observed variables were treated as continuous
(CFI=.848; TLI=.829; RMSEA=.056; χ2/df=2.12, p<.001; AIC=21,914; BIC=22,417).
[Insert Table 3 about here]
Next, because these four variables had been conceptualized as dimensions of the underlying
people management construct, we conducted second-order CFAs. Using the employee data,
the results of this analysis confirm the proposed structure (CFI=.945; TLI=.940;
RMSEA=.078; χ2/df=21.66, p<.001). The factor loadings of the four dimensions onto the
second-order people management construct varied between .728 and .864 using the Time 1
data and between .718 and .838 using the Time 2 data. Figure 3 displays the final factor
structure of the items that measure people management.
We also conducted a second-order CFA using the line manager data and the resulting
model fit (CFI=.877; TLI=.887; RMSEA=.068; χ2/df=2.63, p<.001) was slightly below the
recommended criteria. However, the factor structure, specifying that the four variables tested
in the first-order model are dimensions of the underlying people management construct, is
confirmed by the second-order model test. The factor loadings of the four dimensions onto the
second-order construct vary between .339 and .842 with the Time 1 data and between .363
and .693 with the Time 2 data. The factor loadings of supportive HR practices onto the
second-order people management construct are .339 and .363 using the Time 1 and Time 2
datasets respectively. Given these low values, we decided to also test the second-order model
without this dimension. The model fit then satisfied the usual criteria (CFI=.926; TLI=.919;
RMSEA=.053; χ2/df=1.99, p<.001). Factor loadings onto the second-order construct are then
.725 or higher with the Time 1 data and .574 or higher with the later data. Although a three-
dimensional model better fitted the data than a four-dimensional model, we decided to retain
People Management: Developing and Testing a Measurement Scale
25
all the dimensions in our second-order model (see Figure 3). The main reason for this is that
we wanted to maintain the parallel factor structures for perceived and implemented people
management and the fit indices were only slightly below the suggested criteria. In the
discussion section, we will return to this issue.
[Insert Figure 3 about here]
Thus, overall, the results of the EFA and CFAs support the use of a four-dimensional people
management scale made up of 17 items across our two different samples. The only slight
reservation is that the supportive HR practices dimension did not load very highly onto the
second-order people management construct when using the line manager sample.
Reliability
Second, we assessed the reliability of the scales by examining the Cronbach’s alphas. Here,
we were guided by Nunally’s (1978) suggestion that Cronbach’s alpha should be at least .70
for acceptable reliability. The four people management subscales all showed sufficient
reliability, using the employee data at both Time 1 and Time 2 (see Table 3).
We conducted similar analyses using the line manager data, and here the indicated
reliabilities were more variable (see Table 3). Despite three of these Cronbach’s alphas being
below the cut-off point of .70 suggested by Nunally, we decided to include these scales in our
study for three reasons. First, the factor loadings all had acceptable values (>.560). Second,
Kline (1999, in Field, 2005) suggests that, when dealing with psychological constructs, values
of Cronbach’s alpha below .70 can realistically be expected because diverse constructs are
being measured. Third, because there are only two items measuring the implementation of
tailor-made arrangements, the obtained values are acceptable. For the support of employees’
People Management: Developing and Testing a Measurement Scale
26
commitment subscale, we decided to maintain all four items because three of the four
Cronbach’s alphas were well above the suggested cut-off point.
To sum up, the results of our analyses show that the seventeen items used to measure the
multidimensional people management concept form a reliable measure.
Metric Invariance
Third, we carried out an analysis of the measurement invariance of our people management
latent construct and its underlying dimensions. By establishing metric invariance, one can
assure that any comparisons made based on the latent variable are valid over time. In practice
this means that, if their scores remain unchanged over time, then individuals retain the same
position on the latent construct (Schmitt & Kuljanin, 2008). In determining whether our
people management scale is indeed metric invariant, we followed the procedure outlined by
Van de Schoot, Lugtig, and Hox (2012). We compared two models: a model where factor
loadings are allowed to differ over time (Model A) and a model where factor loadings are
constrained to be equal over time (Model B). In both models, all the other parameters are
freely estimated. The calculated fit indices indicate that, using the employee data, Model B
(CFI=.947; TLI=.944; RMSEA=.076; χ2/df=20.20, p<.001; AIC=216,891; BIC=217,491) fits
the data better than Model A (CFI=.945; TLI=.940; RMSEA=.078; χ2/df=21.66, p<.001;
AIC=216,877; BIC=217,557). This is an indication of metric invariance.
A similar finding was found using the line manager data with Model B (CFI=.879;
TLI=.892; RMSEA=.066; χ2/df=2.56, p<.001; AIC= 21,986; BIC= 22,066) better fitting the
data than Model A (CFI=.877; TLI=.887; RMSEA=.068; χ2/df=2.63, p<.001; AIC= 22,003;
BIC= 22,432), further demonstrating metric invariance.
People Management: Developing and Testing a Measurement Scale
27
Thus, based on our comparison of two models, we conclude that our measure is metric
invariant, indicating that comparisons made on the basis of the latent variable are valid over
time.
Temporal stability
Fourth, we assessed the temporal stability of our people management scale and its underlying
dimensions. We examined stability by conducting a test-retest analysis calculating the
correlation between the pre- (Time 1) and post-test (Time 2) scores (see Table 4).
Using the employee sample, all the people management dimensions and the second-order
construct at Time 1 were significantly related to the same measures at Time 2. We conducted
similar analyses using the line manager sample and obtained similar results.
Thus, our people management analysis showed evidence of temporal stability.
[Insert Table 4 about here]
Phase 3: Convergent Validity of the Scale
In order to establish convergent validity, we examined the relationship between line
managers’ and employees’ perceptions of people management. We performed a multilevel
analysis to test our hypothesis that there is a positive relationship between implemented and
perceived people management.
The first step in the multilevel analysis was to determine the intra-class correlations
(ICCs). These values indicate how much of the variance is situated on the team level of
analysis and can potentially be explained by team-level variables. ICC values for supportive
HR practices show that 15.1 (Time 1) and 17.1 percent (Time 2) of the variance in supportive
HR practices is to be found on the team level of analysis. The remainder of the variance (84.9
People Management: Developing and Testing a Measurement Scale
28
and 82.9 percent respectively) is therefore situated on the individual level of analysis.
Similarly, ICC values indicate that 14.1 / 16.1 percent of the variance in implementation of
tailor-made arrangements is on the team level of analysis, as is 24.6 / 19.0 percent of the
variance in support of employees’ commitment, and 24.7 / 18.6 percent of the variance in
support of employees’ career development. For the second-order people management
construct, the ICC values show that 15.9 / 39.3 percent of the variance is on the team level of
analysis. According to Hox (2010, p. 249), ICC values of .150 or above indicate that a
substantial proportion of the variance is on the team level. In our case, almost all the ICC
values are above .150.
The next step in the multilevel analysis is to determine which of the people management
activities implemented by line managers account for the team-level variance. For supportive
HR practices, the regression coefficients are .291 (p<.001) and .297 (p<.001) at Time 1 and
Time 2 respectively. This means that, at Time 1, 8.5 percent of the variance between teams
can be explained by the people management activities undertaken by the line managers. That
is, 8.5 percent of the variance that is situated at the team level of analysis (here 15.1 percent)
is due to different implementations of people management activities. At Time 2, the
equivalent figures are 8.8 percent of the 17.1 percent variance can be explained by line
managers’ scores on this dimension. Due to space limitations, the regression coefficients for
the other people management dimensions can be found in Table 5.
The multilevel analysis provides support for the hypothesis that there is a positive
relationship between the people management activities undertaken by line managers and
employees’ perceptions of these activities. As such, these findings provide evidence of
convergent validity of our people management scale.
[Insert Table 5 about here]

People Management: Developing and Testing a Measurement Scale
29
Phase 4: Criterion-Related Validity of the Scale
In this final phase, we tested the criterion-related validity of our scale by examining the
relationships between people management and both job satisfaction and commitment (see
Table 6). In order to minimize concerns about common method bias in the data, we used the
people management variables measured at Time 1, and the job satisfaction and commitment
values recorded at Time 2.
The results show that people management and its underlying dimensions are significantly
related to job satisfaction. These results provide support for the hypothesis that the extent to
which employees perceive people management activities is positively related to their job
satisfaction.
We then performed a similar analysis but this time including commitment. The results
indicate that people management and its underlying dimensions were significantly related to
commitment. Our results provide support for the hypothesis that the extent to which
employees perceive people management activities has a positive relationship with their
commitment.
To summarize, these analyses have shown that our people management scale is related to
other established constructs to which it should theoretically relate (i.e. job satisfaction and
commitment). The results from Phase 4 thus support the criterion-related validity of the
people management scale.
[Insert Table 6 about here]
Study 2: Research Design
People Management: Developing and Testing a Measurement Scale
30
In order to test the generalizability of the results beyond the single organization that was
studied in Study 1, we replicated Study 1 using different samples. In this section, we
introduce the procedure followed in Study 2, and then present the research sample.
Steps in Scale Development and Validation
In Study 2 we followed the same procedure as described in the research design for Study 1
(see for details Study 1). The seventeen-item scale that resulted from Study 1 was our point of
departure.
Phase 1: Psychometric Properties of the Scale
Phase 1 was to examine the dimensionality and reliability of the scale in order to test the
psychometric properties of the scale. Since our Study 2 data are cross-sectional, we have not
examined the metric invariance and temporal stability.
Phase 2: Convergent Validity of the Scale
Phase 2 was to test the convergent validity of our scale. We examined our scale and its
relationship with often used operationalizations of leadership (i.e. transformational and
transactional leadership; Bass, 1985). On the one hand, we expect a significant relationship
between people management and transformational and transactional leadership. This would
provide evidence of the convergent validity of our scale. On the other hand, we expect that
our people management scale explains additional variance above and beyond transformational
and transactional leadership in predicting team performance. We measured transformational
and transactional leadership using two four-item scales validated by Oterkiil and Ertesvåg
(2014) in schools. We used this particular measure for three reasons: the fact that this scale
was developed and validated to fit the school context, the length of the questionnaire
People Management: Developing and Testing a Measurement Scale
31
(traditional measures such as the MLQ are quite extensive), and the fact that the instrument is
freely available for researchers. Sample items are: ‘I involve staff in debates concerning the
school’s goals and visions’ (transformational leadership) and ‘I make sure that each individual
staff member is given clear instructions of what their responsibility is regarding their tasks’
(transactional leadership). The values for Cronbach’s alpha were .67 and .72 respectively.
Team performance was measured by using the scale validated by Gould-Williams (2003). A
sample item is: ‘The quality of education provided by my team is excellent’. Cronbach’s
alpha for this measure was .87. All items were measured on a five-point Likert scale.
Phase 3: Criterion-Related Validity of the Scale
Phase 3 was the examination of the criterion-related validity of the scale by testing the
hypothesis that the extent to which employees perceive people management activities being
practiced is positively related to their (1) job satisfaction (see Study 1), and (2) work
engagement. As discussed in Study 1, the premise that people management is positively
related to employee-attitudes such as work engagement is founded in social exchange theory.
Empirical studies show that perceived line manager behaviour and perceived HR practices are
positively related to work engagement (Alfes et al., 2013; Bal, Kooij, & De Jong, 2013).
Therefore, the additional hypothesis that will be tested here is: the extent to which employees
perceive people management activities being practiced is positively related to their work
engagement. We measured work engagement using the short version of the Utrecht Work
Engagement Scale (Schaufeli, Bakker, & Salanova, 2006). A sample item is ‘At my work I
feel bursting with energy’. Cronbach’s alpha was .90. Again, all items were measured on a
five-point Likert scale.
Research Sample
People Management: Developing and Testing a Measurement Scale
32
The data used in Study 2 come from a study in Dutch secondary education schools. These are
very relevant to use in collecting additional evidence on the validity of our Study 1 findings,
because education and the financial sector are very dissimilar. Not only does the sector
(private versus public) differ, the demographics of the population vary as well. This means
that if Study 1 results are replicated, this provides evidence for the generalizability of our
results.
The data for this article come from 1,485 teachers, 590 support staff employees, and 137
supervisors (team leaders). These respondents are employed at 17 different schools. The data
from teachers and support staff employees are used for accumulating evidence of the validity
of the scale for perceived people management (from an employee perspective). The data from
supervisors are used for the scale for implemented people management (from a line manager
perspective). 50.9 percent of the teachers, 58.1 percent of the support staff employees, and
39.1 percent of the supervisors were female. The mean age for the different samples was as
follows: 43.4 years (SD=12.7 years) (teachers), 47.6 years (SD=11.3 years) (educational
support staff), and 49.1 years (SD=9.1 years) (supervisors). This is fairly representative in
terms of the demographics in the education sector as a whole.
Study 2: Results
In this section, we present the results of the successive steps in Study 2 in accumulating
additional evidence on the validity of our people management scale.
Phase 1: Psychometric Properties of the Scale
The goal of the first phase was to test the dimensionality and reliability of our scale.
People Management: Developing and Testing a Measurement Scale
33
Dimensionality
To examine the dimensionality of the people management construct, we performed first-order
CFAs, loading the 17 items on the four dimensions. We treated all observed variables as
categorical data. The fit indices for the resulting models using the employee data are:
CFI=.984; TLI=.981; RMSEA=.062; χ2/df=6.73, p<.001 (teachers), and CFI=.986; TLI=.984;
RMSEA=.073; χ2/df=4.15, p<.001 (educational support staff). All items loaded significantly
onto the latent variables (p<.001). Factor loadings ranged from .704 to .952 for teachers, and
from .648 to .976 for educational support staff.
We conducted the same first-order CFA using data from supervisors. The model fit
indices are as follows: CFI=1.00; TLI=1.00; RMSEA=.00; χ2/df=0.83, p=.731. All the items
loaded significantly onto the latent variables (p<.001). Factor loadings ranged from .671 to
.902.
Next, we conducted second-order CFAs, loading the four dimensions on the overall people
management construct. Using the employee data, the results of this analysis confirm the
proposed structure: CFI=.980; TLI=.976; RMSEA=.069; χ2/df=8.12, p<.001 (teachers), and
CFI=.987; TLI=.985; RMSEA=.072; χ2/df=4.05, p<.001 (educational support staff). The
factor loadings of the four dimensions on the second-order construct varied between .594 and
.927 with the teacher data, and between .691 and .931 with the educational support staff data.
We also conducted a second-order CFA using the supervisor data: CFI=1.00; TLI=1.00;
RMSEA:.00; χ2/df=0.918, p=.622. The factor loadings of the four dimensions onto the
second-order construct vary between .435 and .838. The factor loading of supportive HR
practices onto the second-order people management construct is .435.
People Management: Developing and Testing a Measurement Scale
34
Thus, again the results of the CFAs support the use of a four-dimensional people management
scale made up of 17 items across our three different samples. Our results corroborate our
Study 1 findings. A slight reservation is that the supportive HR practices dimension did not
load very highly onto the second-order construct. See Study 1 for an elaborate discussion of
this issue. Another slight reservation is the value for χ2/df in our supervisor sample. This
might have to do with the small sample size (n=137).
Reliability
To assess the reliability of the scales, we examined the Cronbach’s alphas. The four people
management subscales all showed sufficient reliability, using the employee data from teachers
and educational support staff respectively. With this data, the Cronbach’s alphas were .91 and
.91 for supportive HR practices, .86 and .90 for implementation of tailor-made arrangements,
.92 and .95 for support of employees’ commitment, and .88 and .91 for support of employees’
career development. The reliability estimates for the overall people management scale were
.85 and .86.
We conducted similar analyses using the supervisor data. The Cronbach’s alphas were
.62 for the implementation of tailor-made arrangements, .81 for support of employees’
commitment, and .83 for support of employees’ career development. The reliability for the
overall people management scale was .75.
Overall, these results show that the items used to measure the multidimensional people
management construct form a reliable scale. Only one of the Cronbach’s alphas
(implementation of tailor-made arrangements measured using supervisor data) had a value
slightly below the suggested cut-off point of .70. This is in line with Study 1 results. See
Study 1 for an elaborate discussion of this issue.
People Management: Developing and Testing a Measurement Scale
35
Phase 2: Convergent Validity of the Scale
In order to establish the convergent validity of our scale, we examined the relationship
between people management and transformational and transactional leadership. Using the
supervisor data, we found a significant relationship between people management and
transformational leadership (r=.706, p<.001) and between people management and
transactional leadership (r=.325, p<.001).
Next, we performed regression analyses with people management, transformational, and
transactional leadership as independent variables, and team performance as the dependent
variable. First, we conducted three separate regression analyses each including one of the
independent variables. The results show that people management has a positive impact on
team performance (β=.424, p<.001). The same holds for transformational (β=.419, p<.001)
and transactional (β=.493, p<.001) leadership when these variables are included as the only
independent variable. Thus, the impact of people management on team performance is about
the same strength as the independent impact of both transformational and transactional
leadership. Second, we performed a regression analysis including all three independent
variables at the same time. The results show that people management significantly relates to
team performance (β=.603, p=.017), when transformational (β=-.495, p=.210) and
transactional (β=.467, p=.024) leadership are also included in the model. The level of
explained variance is 28.5 percent. The results show that people management is a stronger
predictor of team performance than transformational leadership, since this variable is no
longer significant when people management is added to the model.
As a robustness check we compared this model with the model including only
transformational and transactional leadership as independent variables. Based on the fit
People Management: Developing and Testing a Measurement Scale
36
indices we can conclude that the model including people management as an additional
independent variable fits the data better (CFI=.965; TLI=.959; RMSEA=.050; χ2/df=1.41,
p<.001; AIC=5242,211; BIC=5462,499) compared to the model including only
transformational and transformational leadership (CFI=.961; TLI=.955; RMSEA=.053;
χ2/df=1.37, p<.001; AIC=5249,566; BIC=5466,868).
We also performed a dominance analysis (Azen & Budescu, 2003) to compare the relative
importance of people management, transformational, and transactional leadership. Because
we want to determine the added value of our independent variables when one or two of the
other predictors are also included in our model, we performed a constrained dominance
analysis (Azen & Budescu, 2003, pp. 138-139) evaluating the k=1 and k=2 subsets. Based on
pairwise comparisons, the results of this dominance analysis suggest that people management
dominates both transformational and transactional leadership in both subsets. The evaluation
of the k=2 subset is particularly relevant, as this provides the most conservative test
comparing the additional contribution of either people management, transformational, or
transactional leadership when the other two predictors are also included in the model. The
results show that the additional contribution of people management to the k=2 model is .123,
compared to .109 for transformational, and .117 for transactional leadership.
These results provide evidence of the convergent validity of our multidimensional people
management scale, and show that our measure adds explained variance above and beyond
alternative scales when predicting important outcome variables.
Phase 3: Criterion-Related Validity of the Scale
People Management: Developing and Testing a Measurement Scale
37
To test the criterion-related validity of our scale, we examined the relationships between
people management and both job satisfaction and work engagement (see Table 7). The results
show that people management and its underlying dimensions are significantly related to job
satisfaction, using the employee data from teachers and educational support staff respectively.
These results provide support for the hypothesis that the extent to which employees perceive
people management activities is positively related to their job satisfaction. As such, this
corroborates our Study 1 finding.
We then performed a similar analysis but this time including work engagement. The
results indicate that people management and its underlying dimensions were significantly
related to work engagement, using the employee data from teachers and educational support
staff respectively. Our findings provide support for our hypothesis that the extent to which
employees perceive people management activities has a positive relationship with their work
engagement.
[Insert Table 7 about here]
These analyses show that our people management scale is related to other established
constructs to which it should theoretically relate (i.e. job satisfaction and work engagement).
These results provide support for our hypotheses. These findings corroborate Study 1 findings
and again provide support for the criterion-related validity of our scale.
Conclusions and Discussion
Conclusions
People Management: Developing and Testing a Measurement Scale
38
The purpose of our study has been to address three measurement issues in research of HRM,
by providing a clear definition of people management, building on the work of Purcell and
Hutchinson (2007), and creating a reliable and valid scale to measure this concept. People
management is defined as line managers’ implementation of HR practices and their leadership
behaviour oriented at supporting the employees they supervise at work. There is a symbiotic
relationship between the twin aspects of implementation of HR practices and leadership
behaviour. Following Boselie et al.’s (2005) argument about the most sophisticated measure,
the concept of people management focuses on employees’ and line managers’ perceptions of
the degree of support employees receive at work through line managers’ activities. The
developed scale can be used by researchers in the field, as well as by practitioners such as HR
managers.
First, we conducted a literature review to clarify the definition of people management.
Next, we generated 18 items to measure people management and its four underlying
dimensions in co-production with practitioners. We also discussed these items with several
academic experts and HR professionals who agreed on their appropriateness. Following this,
we collected empirical evidence on the validity of our scale using a Study 1/Study 2 design
with data from 5,443 employees and 491 line managers in total, employed in two different
sectors (financial services and secondary education). We empirically tested the psychometric
properties and the convergent and criterion-related validities of our scale. The results
indicated that people management was accurately reflected in a four-dimensional construct
consisting of 17 items that further demonstrated strong internal consistency. Moreover, our
measure was shown to be metric invariant as well as stable over time, indicating that
comparisons of the latent variable are valid over time. We provided evidence of the
convergent validity by showing that employees’ and line managers’ perceptions of people
management are significantly related, and that people management is significantly related to
People Management: Developing and Testing a Measurement Scale
39
transformational and transactional leadership. Also, we demonstrated that people management
explains variance above and beyond transformational and transactional leadership in
predicting team performance. Further, we demonstrated the criterion-related validity of our
scale by presenting evidence that people management is significantly related to job
satisfaction, affective commitment, and work engagement.
Discussion
Two results from the empirical tests of our people management scale are worthy of further
comment. First, the only item that was formulated negatively (item ITA3) showed insufficient
internal consistency and consequently was removed from the measurement model. It is
possible that respondents did not pay adequate attention to the wording of the item even
though we emphasized the negative format using italics (Morren et al., 2010). Although we
added this negatively formulated item to avoid response patterns, this might have created
some confusion in our respondents. Second, one of the people management dimensions (i.e.
supportive HR practices) loaded well onto the second-order people management construct
when using employee data, whereas the model fit was just below the suggested level using the
line manager data. Despite this result, we decided to retain all the dimensions in our second-
order model in order to maintain the parallel factor structure for perceived and implemented
people management. The relatively low factor loadings for supportive HR practices in the
case of line managers may be because, compared to the other dimensions, line managers
experience less agency regarding this element of people management. That is, the other
components might, at least from their own perspective, be dependent on their own
discretionary actions whereas, with supportive HR practices, their role is to implement
‘standardized’ practices. It is possible that, as a result, line managers rate this dimension of
people management less positively. For theoretical and empirical reasons, the agency that line
People Management: Developing and Testing a Measurement Scale
40
managers experience in the implementation of supportive HR practices is a relevant issue to
address in future research. Theoretically, it is assumed that line managers have at least some
degrees of freedom in the implementation of HR practices, depending on the degree of
formalization of an organization’s HR policies (Purcell & Hutchinson, 2007). The empirical
results presented suggest that this is the case, as employees do perceive the level of support
from HR practices, along with the other dimensions of people management, as resulting from
their line manager’s activities. This is substantiated by the fact that the multilevel analyses
(Study 1, Phase 3) showed that a substantial proportion of the variance in supportive HR
practices is found on the team level of analysis. This implies that line managers’
implementation matters for the perceptions that employees who share the same supervisor
have of supportive HR practices.
Theoretical Contributions
Our study contributes to existing theory and research in several ways. First, in providing a
scale to measure implemented and perceived people management, we avoid that research can
but rely on HR professionals as respondents in rating HRM. We demonstrated that it is
possible to validly measure both implemented and perceived people management by asking
similar questions to line managers and employees respectively. The factor structures for both
groups are very similar, with the wording used in the questionnaire items needing only to be
slightly different to reflect both employees’ and line managers’ perspectives.
Second, in our definition and operationalization of people management we capture the
crucial role that line managers play in HR implementation (Guest & Bos-Nehles, 2013).
Purcell et al. (2003) noted that the role line managers play in the enactment process had
received little attention. By showing that the implementation of both general HR practices and
of tailor-made arrangements is an essential element of people management, we bring line
People Management: Developing and Testing a Measurement Scale
41
manager implementation into the limelight, and provide researchers with a valid scale to
measure HR implementation. The results from Study 1 indicate that even though all line
managers in our sample were employed by the same organization (and therefore
implementing the same practices), there is considerable variation on the team level of
analysis. This implies that implementation matters and that, both in theory and in practice, it
is important to focus not only on the content of HR practices but also to consider the role of
supervisors in the implementation.
Third, by including line managers’ leadership behaviour as a second element in our
definition and operationalization of people management, we have integrated insights from the
HRM and the leadership literature streams. Previously, these two bodies of knowledge have
been regarded as rather separate disciplines (Wright & Boswell, 2002), and this has meant
that the scope of the people management concept has not been fully explicit. By integrating
insights from HRM and leadership literature, we recognize that people management has both
functional and relational sides. However, we recognize that the leadership literature has more
to offer than we have made use of. The taxonomy of leadership behaviours (Yukl, 2012)
elaborates on task- and change-oriented behaviours, elements of which could fit the people
management concept, provided that they are related to the line manager’s human resource
management role and oriented on support for the individual employee at work. For instance, if
task-related leadership behaviours are not conceptualized as having the primary objective of
efficient production (cost reduction) but the objective of serving professional performance,
their operationalization would add to the current people management measure and increase its
relevance for predicting employee outcomes and performance (Rowold, Borgmann, &
Bormann, 2014). We encourage further research on the integration of the HRM and
leadership bodies of literature.
People Management: Developing and Testing a Measurement Scale
42
Limitations
We recognize that our study has limitations. First, although the use of two-wave data in
Study 1 has allowed us to assess the temporal stability of our people management scale (an
important advantage over using cross-sectional data), the time lag between the two surveys
was only seventeen months. It would be interesting to study the robustness of our scale by
collecting data at a third point in time. Second, although our test results do overall provide
robust evidence of the reliability and validity of our people management scale, some of the
test results just fail to meet the suggested criteria. Third, the line managers are surveyed about
the people management support they provide to employees (plural), whereas employees have
answered questions about the support they receive from their own supervisor (singular). This
introduces a potential bias in that line managers may only consider one or two employees
when answering the questions, and quite likely preferred workers to whom they offer the most
people management support. In future research, it could be useful to ask line managers to
complete the questionnaire several times, each time with a different employee in mind.
Managerial Implications
This study not only contributes to research and theory, but also has important implications for
practice. Our people management scale can become a valuable diagnostic tool in an
organizational context. The measure can help in gaining insights into the way employees and
line managers experience people management and how this affects several relevant outcomes.
The scale provides practitioners with an analytical tool with which to determine important
drivers of employee wellbeing and performance, and to identify, through benchmarking,
organizational units that require specific attention. Moreover, HR professionals could
administer this scale to facilitate team-level discussions on the people management support
People Management: Developing and Testing a Measurement Scale
43
provided by line managers and the support perceived by employees, and on any potential
differences in their perceptions.
To conclude, our study has generated a reliable and valid multidimensional people
management scale. This scale contributes significantly to both research and practice: it
measures employees’ and line managers’ perceptions of people management, a concept that
includes both the implementation of HR practices and line managers’ leadership behaviour.
We hope that this people management scale will contribute to and encourage further growth
in the knowledge of implemented and perceived people management, their antecedents, and
their effects.
People Management: Developing and Testing a Measurement Scale
44
REFERENCES
Alfes, K., Truss, C., Soane, E.C., Rees, C., & Gatenby, M. (2013). The relationship between
line manager behavior, perceived HRM practices, and individual performance: Examining
the mediating role of engagement. Human Resource Management, 52, 839-859.
Allen, T.D., Eby, L.T., Poteet, M.L., Lentz, E., & Lima, L. (2004). Career benefits associated
with mentoring for protégés: a meta-analysis. Journal of Applied Psychology, 89, 127-136.
Allen, N.J., & Meyer, J.P. (1990). The measurement and antecedents of affective,
continuance and normative commitment to the organization. Journal of Occupational
Psychology, 63, 1-18.
Allen, D.G., Shore, L.M., & Griffeth, R.W. (2003). The role of perceived organizational
support and supportive human resource practices in the turnover process. Journal of
Management, 29, 99-118.
Armenakis, A.A., Bernerth, J.B., Pitts, J.P., & Walker, H.J. (2007). Organizational change
recipients' beliefs scale development of an assessment instrument. The Journal of Applied
Behavioral Science, 43, 481-505.
Azen, R., & Budescu, D. V. (2003). The dominance analysis approach for comparing
predictors in multiple regression. Psychological methods, 8, 129-148.
Bal, P.M., Kooij, D.T., & De Jong, S.B. (2013). How do developmental and accommodative
HRM enhance employee engagement and commitment? The role of psychological
contract and SOC strategies. Journal of Management Studies, 50, 545-572.
Bass, B. (1985). Leadership and performance beyond expectations. New York: Free Press
Bass, B.M., & Bass, R. (2008). The Bass handbook of leadership: Theory, research, and
managerial applications. New York: Free Press.
People Management: Developing and Testing a Measurement Scale
45
Benders, J., Delsen, L., & Smits, J. (2006). Bikes versus lease cars: the adoption, design and
use of cafeteria systems in the Netherlands. The International Journal of Human Resource
Management, 17, 1115-1228.
Bentler, P.M. (1990). Comparative fit indexes in structural models. Psychological Bulletin,
107, 238-246.
Boon, C., Den Hartog, D.N., Boselie, P., & Paauwe, J. (2011). The relationship between
perceptions of HR practices and employee outcomes: examining the role of person-
organisation and person-job fit. The International Journal of Human Resource
Management, 22, 138-162.
Boselie, P., Dietz, G., & Boon, C. (2005). Commonalities and contradictions in HRM and
performance. Human Resource Management Journal, 15, 67-94.
Brewster, C., Brookes, M., & Gollan, P. (2015). The institutional antecedents of the
assignment of HRM responsibilities to line managers. Human Resource Management, 54,
577-597.
Brown, T.A. (2015). Confirmatory Factor Analysis for Applied Research. Guilford
Publications.
Conway, J.M., & Huffcutt, A.I. (1997). Psychometric properties of multisource performance
ratings: A meta-analysis of subordinate, supervisor, peer, and self-ratings. Human
Performance, 10, 331-360.
DeVellis, R.F. (2003). Scale development: theory and applications. Thousand Oaks: Sage.
Eisenberger, R., Huntington, R., Hutchinson, S., & Sowa, D. (1986). Perceived organisational
support. Journal of Applied Psychology, 71, 500-507.
Eisenberger, R., Stinglhamber, F., Vandenberghe, C., Sucharski, I., & Rhoades, L. (2002).
Perceived supervisor support: Contributions to perceived organizational support and
employee retention. Journal of Applied Psychology, 87, 565-573.
People Management: Developing and Testing a Measurement Scale
46
Eisenhardt, K.M. (1989). Agency theory: an assessment and review. The Academy of
Management Review, 14, 57-74.
Farndale, E., Paauwe, J., & Boselie, P. (2010). An exploratory study of governance in the
intra-firm human resources supply chain. Human Resource Management, 49, 849-868.
Field, A. (2005). Discovering Statistics Using SPSS. London: Sage.
Gerhart, B., Wright, P., McMahan, G., & Snell, S. (2000). Measurement error in research on
human resources and firm performance: how much error is there and does it influence
effect size estimates? Personnel Psychology, 53, 803-834.
Gilbert, C., De Winne, S., & Sels, L. (2011). The influence of line managers and HR
department on employees’ affective commitment. The International Journal of Human
Resource Management, 22, 1618-1637.
Gould-Williams, J. (2003). The importance of HR practices and workplace trust in achieving
superior performance: a study of public-sector organizations. The International Journal of
Human Resource Management, 14, 28-54.
Graen, G.B. & Uhl-Bien, M. (1995). Relationship-based approach to leadership: development
of leader-member exchange (LMX) theory of leadership over 25 years: Applying a multi-
level multi-domain perspective. The Leadership Quarterly, 6, 219-247.
Greenhaus, J., Parasuraman, A., & Wormley, W. (1990). Effects of race on organizational
experiences, job performance evaluations, and career outcomes. Academy of Management
Journal, 33, 64-86.
Groves, R.M., Fowler Jr, F.J., Couper, M.P., Lepkowski, J.M., Singer, E., & Tourangeau, R.
(2009). Survey methodology. John Wiley & Sons.
Guest, D.E. (2007). HRM: towards a new psychological contract? In P. Boxall, J. Purcell &
P. Wright (eds), The Oxford Handbook of Human Resource Management (pp. 128-146).
Oxford: Oxford University Press.
People Management: Developing and Testing a Measurement Scale
47
Guest, D.E. (2011). Human resource management and performance: still searching for some
answers. Human Resource Management Journal, 21, 3-13.
Guest, D.E., & Bos-Nehles, A. (2013). HRM and performance: The role of effective
implementation. In J. Paauwe, D. Guest & P. Wright (eds), HRM and Performance:
Achievements and Challenges (pp. 79-96). Chichester, West Sussex: Wiley.
Guest, D.E., Michie, J., Conway, N., & Sheehan, M. (2003). Human resource management
and corporate performance in the UK. British Journal of Industrial Relations, 41, 291-314.
Hornung, S., Rousseau, D.M., & Glaser, J. (2008). Creating flexible work arrangements
through idiosyncratic deals. Journal of Applied Psychology, 93, 655-664.
Hox, J.J. (2010). Multilevel analysis: techniques and applications. New York: Routledge.
Huselid, M. (1995). The impact of human resource management practices on turnover,
productivity, and corporate financial performance. Academy of Management Journal, 38,
635-672.
Jackson, D.L., Gillaspy Jr., J.A., Purc-Stephenson, R. (2009). Reporting practices in
confirmatory factor analysis: an overview and some recommendations. Psychological
Methods, 14, 6-23.
Johnson, D.R., & Creech, J.C. (1983). Ordinal measures in multiple indicator models: a
simulation study of categorization error. American Sociological Review, 48, 398-407.
Knies, E., & Leisink, P.L.M. (2014). Leadership behavior in public organizations: a study of
supervisory support by police and medical center middle managers. Review of Public
Personnel Administration, 34, 108-127.
Larsen, H.H., & Brewster, C. (2003). Line management responsibility for HRM: what is
happening in Europe? Employee Relations, 25, 228-244.
Leisink, P.L.M, & Knies, E. (2011). Line managers’ support for older workers. The
International Journal of Human Resource Management, 22, 1902-1917.
People Management: Developing and Testing a Measurement Scale
48
Morren, M., Gelissen, J.P., & Vermunt, J.K. (2010). Dealing with extreme response style in
crosscultural research: a restricted latent class factor analysis approach. Sociological
Methodology, 41, 1-35.
Nishii, L.H., Lepak, D.P., & Schneider, B. (2008). Employee attributions of the ‘why’ of HR
practices: their effects on employee attitudes and behaviors, and customer satisfaction.
Personnel Psychology, 61, 503-545.
Nunnaly, J.C. (1978). Psychometric theory. New York: McGraw-Hill.
Oldham, G., & Cummings, A. (1996). Employee creativity: personal and contextual factors at
work. Academy of Management Journal, 39, 607-634.
Oterkiil, C., & Ertesvåg, S.K. (2014). Development of a measurement for transformational
and transactional leadership in schools taking on a school-based intervention. Educational
Management Administration & Leadership, 42, 5-27.
Perry, E.L., & Kulik, C.T. (2008). The devolution of HR to the line: implications for
perceptions of people management effectiveness. The International Journal of Human
Resource Management, 19, 262-273.
Purcell, J., & Hutchinson, S. (2007). Front-line managers as agents in the HRM-performance
causal chain: theory, analysis and evidence. Human Resource Management Journal, 17, 3-
20.
Purcell, J., & Kinnie, N. (2007). HRM and business performance. In P. Boxall, J. Purcell &
P. Wright (eds), The Oxford Handbook of Human Resource Management (pp. 533-551).
Oxford: Oxford University Press.
Purcell, J., Kinnie, N., Hutchinson, S., Rayton, B., & Swart, J. (2003). Understanding the
People and Performance Link: Unlocking the Black Box, London: CIPD.

People Management: Developing and Testing a Measurement Scale
49
Rafferty, A., & Griffin, M. (2006). Refining individualized consideration: Distinguishing
developmental leadership and supportive leadership. Journal of Occupational and
Organizational Psychology, 79, 37-61.
Rhoades, L., & Eisenberger, R. (2002). Perceived organizational support: a review of the
literature. Journal of Applied Psychology, 87, 698-714.
Rhoades, L., & Eisenberger, R. (2006). When supervisors feel supported: Relationships with
subordinates’ perceived supervisor support, perceived organizational support, and
performance. Journal of Applied Psychology, 91, 689-695.
Rhoades, L., Eisenberger, R., & Armeli, S. (2001). Affective commitment to the
organization: The contribution of perceived organizational support. Journal of Applied
Psychology, 86, 825-836.
Rousseau, D.M. (2005). I-deals: idiosyncratic deals employees bargain for themselves. New
York/ London: M.E. Sharpe.
Rowold, J., Borgmann, L., & Bormann, K. (2014). Which leadership constructs are important
for predicting job satisfaction, affective commitment, and perceived job performance in
profit versus non-profit organizations? Nonprofit Management & Leadership, 25, 147-164.
Schaufeli, W.B., Bakker, A.B., & Salanova, M. (2006). The measurement of work
engagement with a short questionnaire: A cross-national study. Educational and
psychological measurement, 66, 701-716.
Schmitt, N., & Kuljanin, G. (2008). Measurement invariance: review of practice and
implications. Human Resource Management Review, 18, 210-222.
Settoon, R.P., Bennett, N., & Liden, R.C. (1996). Social exchange in organizations: perceived
organizational support, leader-member exchange, and employee reciprocity. Journal of
Applied Psychology, 81, 219-227.
People Management: Developing and Testing a Measurement Scale
50
Takeuchi, R., Chen, G., & Lepak, D. (2009). Through the looking glass of a social system:
cross-level effects of high-performance work systems on employees’ attitudes. Personnel
Psychology, 62, 1-29.
Truss, C. (2001). Complexities and controversies in linking HRM with organizational
outcomes. Journal of Management Studies, 38, 1121-1149.
Van de Schoot, R., Lugtig, P., & Hox, J. (2012). A checklist for testing measurement
invariance. European Journal of Developmental Psychology, 9, 486-492.
Wanous, J.P., Reichers, A.E., & Hudy, M.J. (1997). Overall job satisfaction: how good are
single-item measures? Journal of Applied Psychology, 82, 247-252.
Wright, P., & Boswell, W. (2002). Desegregating HRM: a review and synthesis of micro and
macro human resource management research. Journal of Management, 28, 247-276.
Wright, P., & Nishii, L.H. (2013). Strategic HRM and Organizational Behaviour: Integrating
Multiple Levels of Analysis. In J. Paauwe, D. Guest & P. Wright (eds), HRM and
Performance: Achievements and Challenges (pp. 97-110). Chichester: Wiley.
Wu, P.C., & Chaturvedi, S. (2009). The role of procedural justice and power distance in the
relationship between high performance work systems and employee attitudes: a multilevel
perspective. Journal of Management, 35, 1228-1247.
Yukl, G. (2012). Effective leadership behavior: What we know and what questions need more
attention. Academy of Management Perspectives, 26, 66-85.
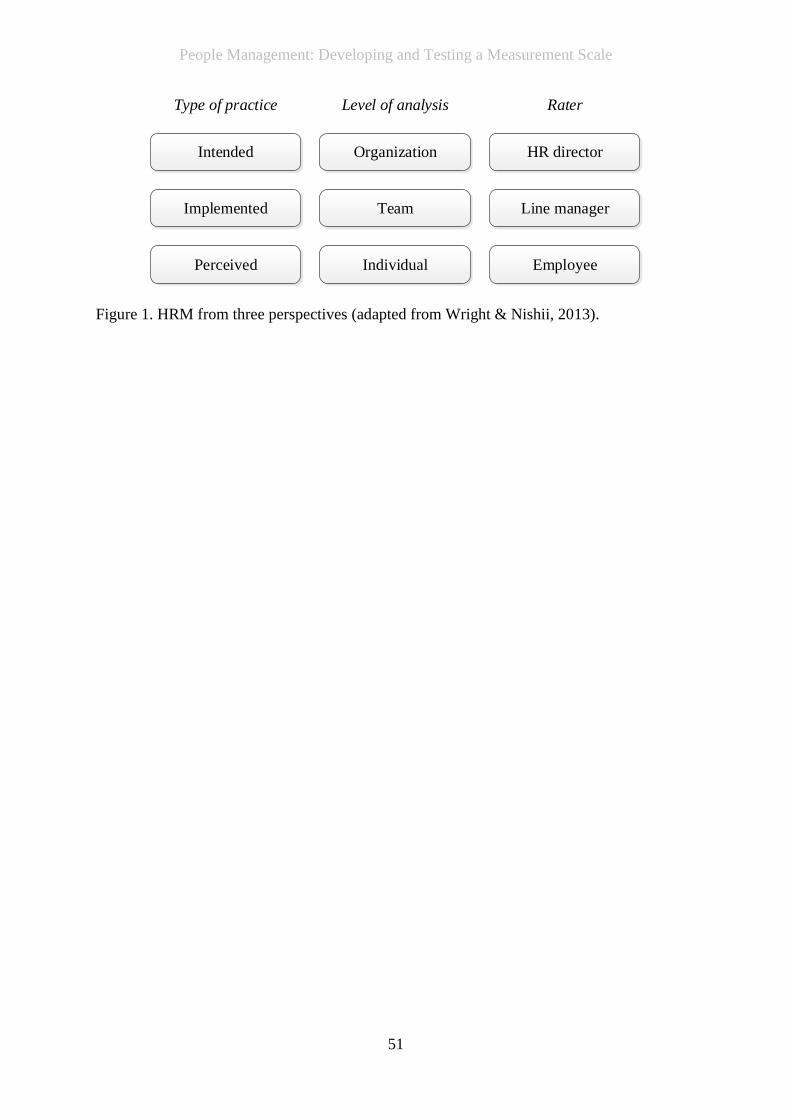
People Management: Developing and Testing a Measurement Scale
51
Intended
Implemented
Perceived
Organization
Team
Individual
HR director
Line manager
Employee
Type of practice Level of analysis Rater
Figure 1. HRM from three perspectives (adapted from Wright & Nishii, 2013).
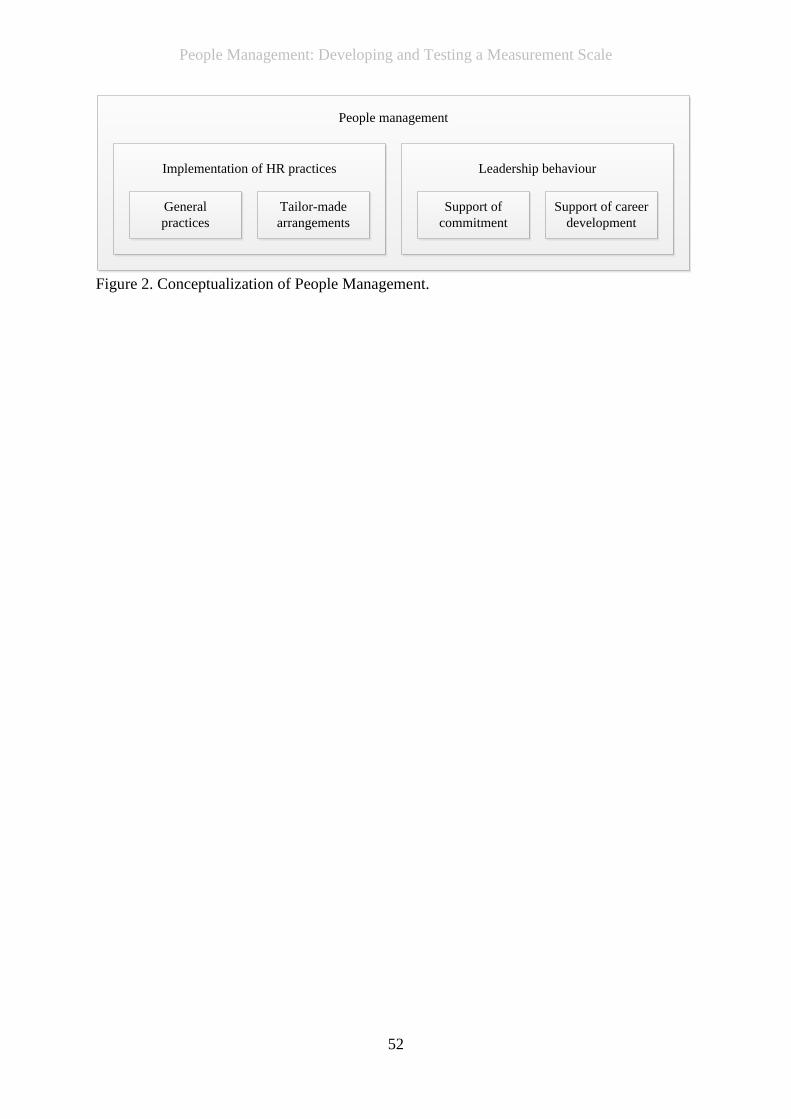
People Management: Developing and Testing a Measurement Scale
52
General
practices
Tailor-made
arrangements
Support of
commitment
Support of career
development
People management
Implementation of HR practices Leadership behaviour
Figure 2. Conceptualization of People Management.
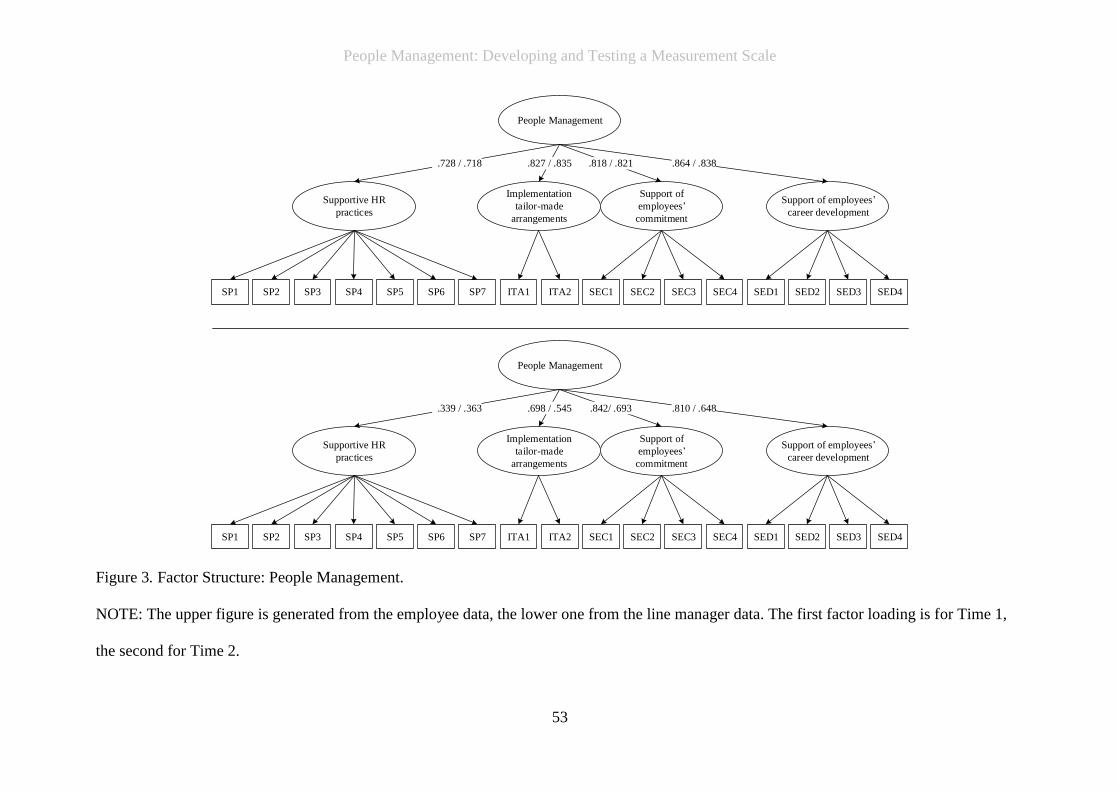
People Management: Developing and Testing a Measurement Scale
53
People Management
Supportive HR
practices
Implementation
tailor-made
arrangements
Support of
employees�
commitment
Support of employees�
career development
SP1 SP2 SP3 SP4 SP5 SP6 SP7 ITA1 ITA2 SEC1 SEC2 SEC3 SEC4 SED1 SED2 SED3 SED4
.818 / .821 .864 / .838.827 / .835 .728 / .718
People Management
Supportive HR
practices
Implementation
tailor-made
arrangements
Support of
employees�
commitment
Support of employees�
career development
SP1 SP2 SP3 SP4 SP5 SP6 SP7 ITA1 ITA2 SEC1 SEC2 SEC3 SEC4 SED1 SED2 SED3 SED4
.842/ .693 .810 / .648.698 / .545 .339 / .363
Figure 3. Factor Structure: People Management.
NOTE: The upper figure is generated from the employee data, the lower one from the line manager data. The first factor loading is for Time 1,
the second for Time 2.
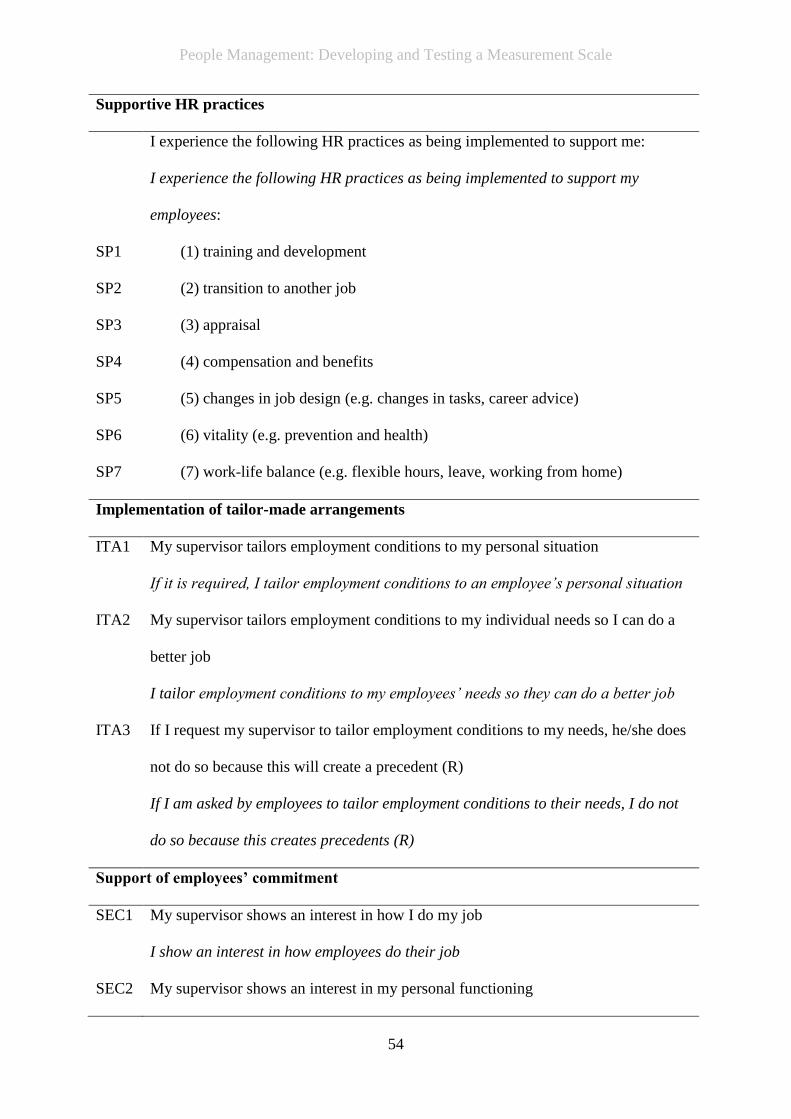
People Management: Developing and Testing a Measurement Scale
54
Supportive HR practices
I experience the following HR practices as being implemented to support me:
I experience the following HR practices as being implemented to support my
employees:
SP1 (1) training and development
SP2 (2) transition to another job
SP3 (3) appraisal
SP4 (4) compensation and benefits
SP5 (5) changes in job design (e.g. changes in tasks, career advice)
SP6 (6) vitality (e.g. prevention and health)
SP7 (7) work-life balance (e.g. flexible hours, leave, working from home)
Implementation of tailor-made arrangements
ITA1 My supervisor tailors employment conditions to my personal situation
If it is required, I tailor employment conditions to an employee’s personal situation
ITA2 My supervisor tailors employment conditions to my individual needs so I can do a
better job
I tailor employment conditions to my employees’ needs so they can do a better job
ITA3 If I request my supervisor to tailor employment conditions to my needs, he/she does
not do so because this will create a precedent (R)
If I am asked by employees to tailor employment conditions to their needs, I do not
do so because this creates precedents (R)
Support of employees’ commitment
SEC1 My supervisor shows an interest in how I do my job
I show an interest in how employees do their job
SEC2 My supervisor shows an interest in my personal functioning
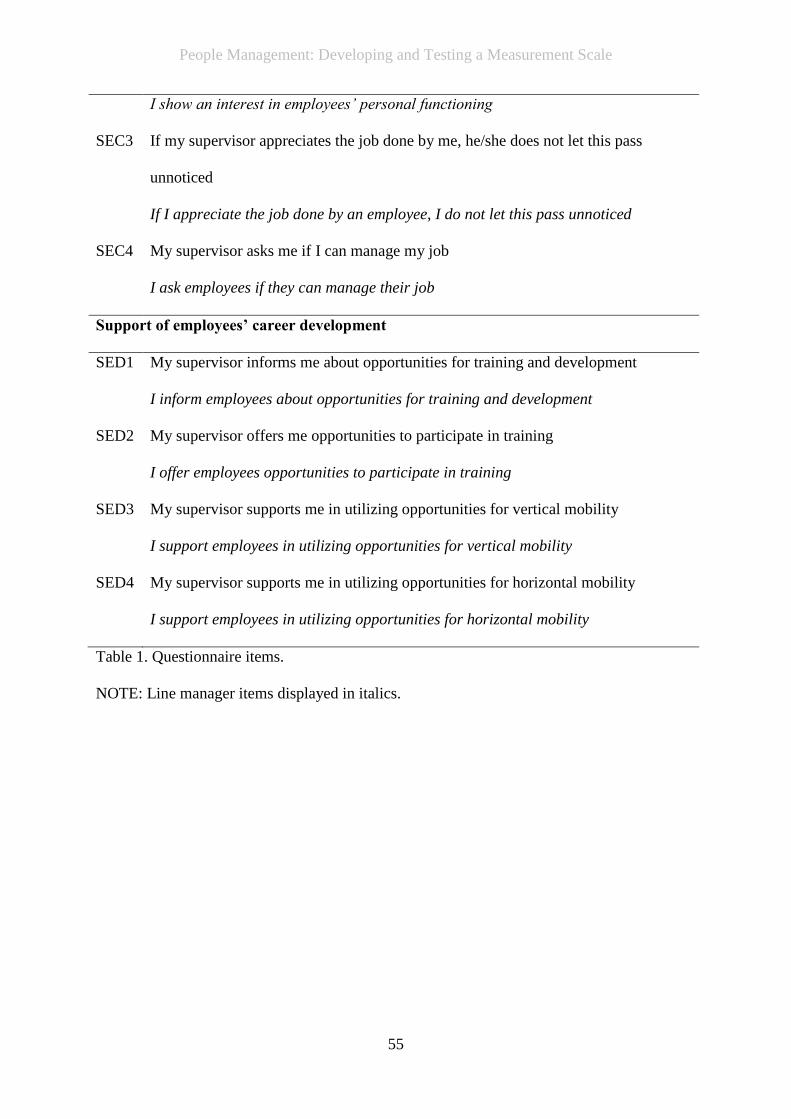
People Management: Developing and Testing a Measurement Scale
55
I show an interest in employees’ personal functioning
SEC3 If my supervisor appreciates the job done by me, he/she does not let this pass
unnoticed
If I appreciate the job done by an employee, I do not let this pass unnoticed
SEC4 My supervisor asks me if I can manage my job
I ask employees if they can manage their job
Support of employees’ career development
SED1 My supervisor informs me about opportunities for training and development
I inform employees about opportunities for training and development
SED2 My supervisor offers me opportunities to participate in training
I offer employees opportunities to participate in training
SED3 My supervisor supports me in utilizing opportunities for vertical mobility
I support employees in utilizing opportunities for vertical mobility
SED4 My supervisor supports me in utilizing opportunities for horizontal mobility
I support employees in utilizing opportunities for horizontal mobility
Table 1. Questionnaire items.
NOTE: Line manager items displayed in italics.
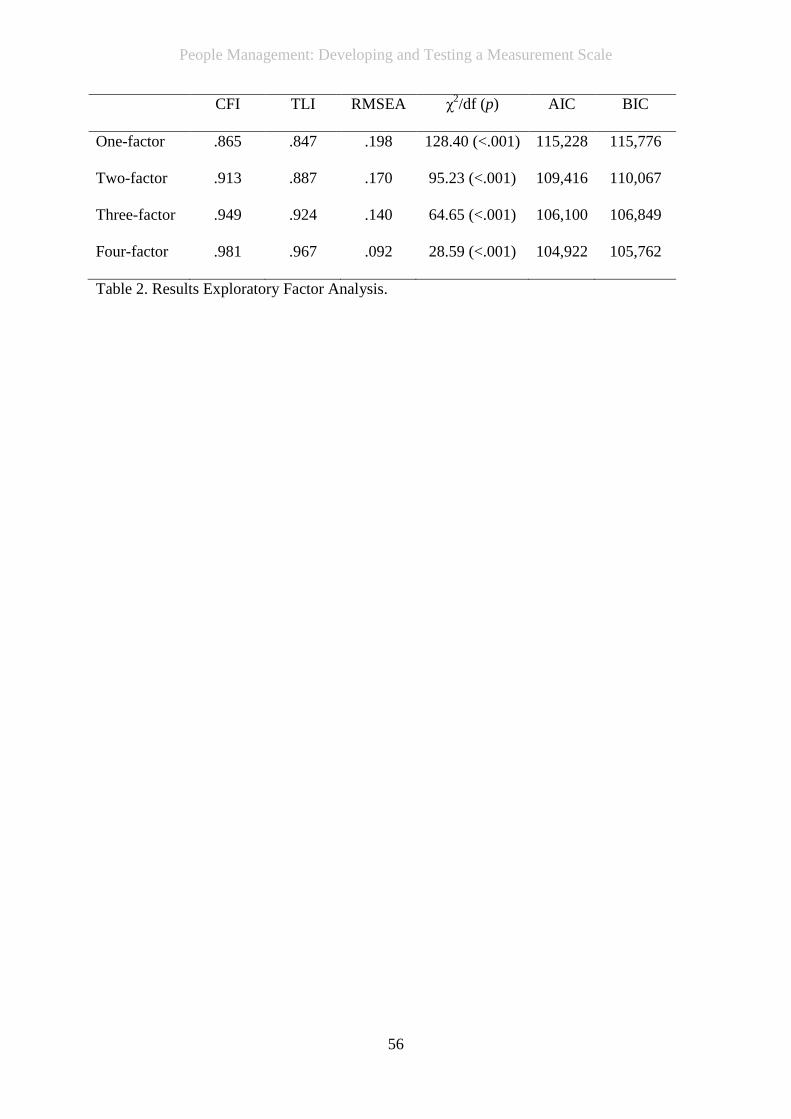
People Management: Developing and Testing a Measurement Scale
56
CFI TLI RMSEA χ2/df (p) AIC BIC
One-factor .865 .847 .198 128.40 (<.001) 115,228 115,776
Two-factor .913 .887 .170 95.23 (<.001) 109,416 110,067
Three-factor .949 .924 .140 64.65 (<.001) 106,100 106,849
Four-factor .981 .967 .092 28.59 (<.001) 104,922 105,762
Table 2. Results Exploratory Factor Analysis.
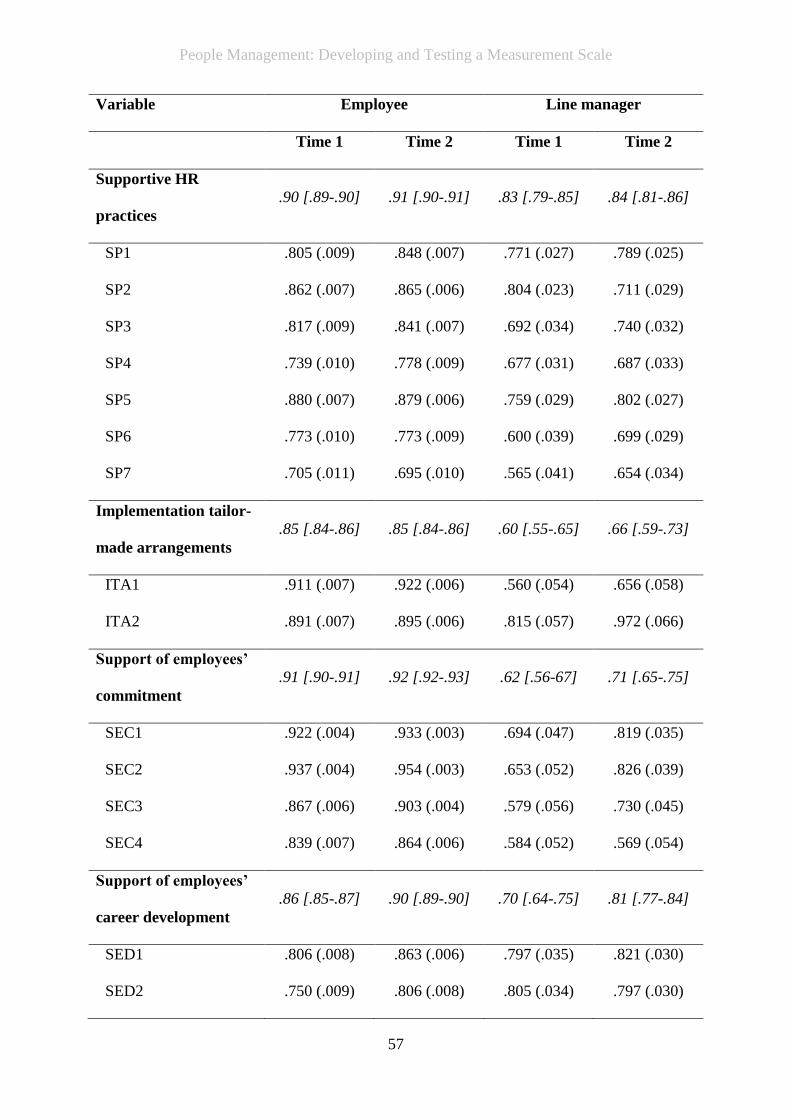
People Management: Developing and Testing a Measurement Scale
57
Variable Employee Line manager
Time 1 Time 2 Time 1 Time 2
Supportive HR
practices
.90 [.89-.90] .91 [.90-.91] .83 [.79-.85] .84 [.81-.86]
SP1 .805 (.009) .848 (.007) .771 (.027) .789 (.025)
SP2 .862 (.007) .865 (.006) .804 (.023) .711 (.029)
SP3 .817 (.009) .841 (.007) .692 (.034) .740 (.032)
SP4 .739 (.010) .778 (.009) .677 (.031) .687 (.033)
SP5 .880 (.007) .879 (.006) .759 (.029) .802 (.027)
SP6 .773 (.010) .773 (.009) .600 (.039) .699 (.029)
SP7 .705 (.011) .695 (.010) .565 (.041) .654 (.034)
Implementation tailor-
made arrangements
.85 [.84-.86] .85 [.84-.86] .60 [.55-.65] .66 [.59-.73]
ITA1 .911 (.007) .922 (.006) .560 (.054) .656 (.058)
ITA2 .891 (.007) .895 (.006) .815 (.057) .972 (.066)
Support of employees’
commitment
.91 [.90-.91] .92 [.92-.93] .62 [.56-67] .71 [.65-.75]
SEC1 .922 (.004) .933 (.003) .694 (.047) .819 (.035)
SEC2 .937 (.004) .954 (.003) .653 (.052) .826 (.039)
SEC3 .867 (.006) .903 (.004) .579 (.056) .730 (.045)
SEC4 .839 (.007) .864 (.006) .584 (.052) .569 (.054)
Support of employees’
career development
.86 [.85-.87] .90 [.89-.90] .70 [.64-.75] .81 [.77-.84]
SED1 .806 (.008) .863 (.006) .797 (.035) .821 (.030)
SED2 .750 (.009) .806 (.008) .805 (.034) .797 (.030)

People Management: Developing and Testing a Measurement Scale
58
SED3 .884 (.006) .915 (.004) .691 (.042) .792 (.029)
SED4 .901 (.006) .933 (.004) .627 (.039) .836 (.027)
Table 3. Psychometric properties: factor loadings, standard errors and Cronbach’s alpha.
NOTE: Standardized factor loadings of the unconstrained model are displayed. Standard
errors are displayed between parentheses. Values for Cronbach’s alpha are displayed in
italics; 95% confidence intervals are between brackets.

People Management: Developing and Testing a Measurement Scale
59
Employees Line managers
Supportive HR practices .630 .478
Implementation tailor-made arrangements .495 .636
Support of employees’ commitment .479 .719
Support of employees’ career development .510 .542
Second-order people management .681 .934
Table 4. Results test-retest analysis (correlations between Time 1 and Time 2 scores).
NOTE: All correlations are significant (p<.001).
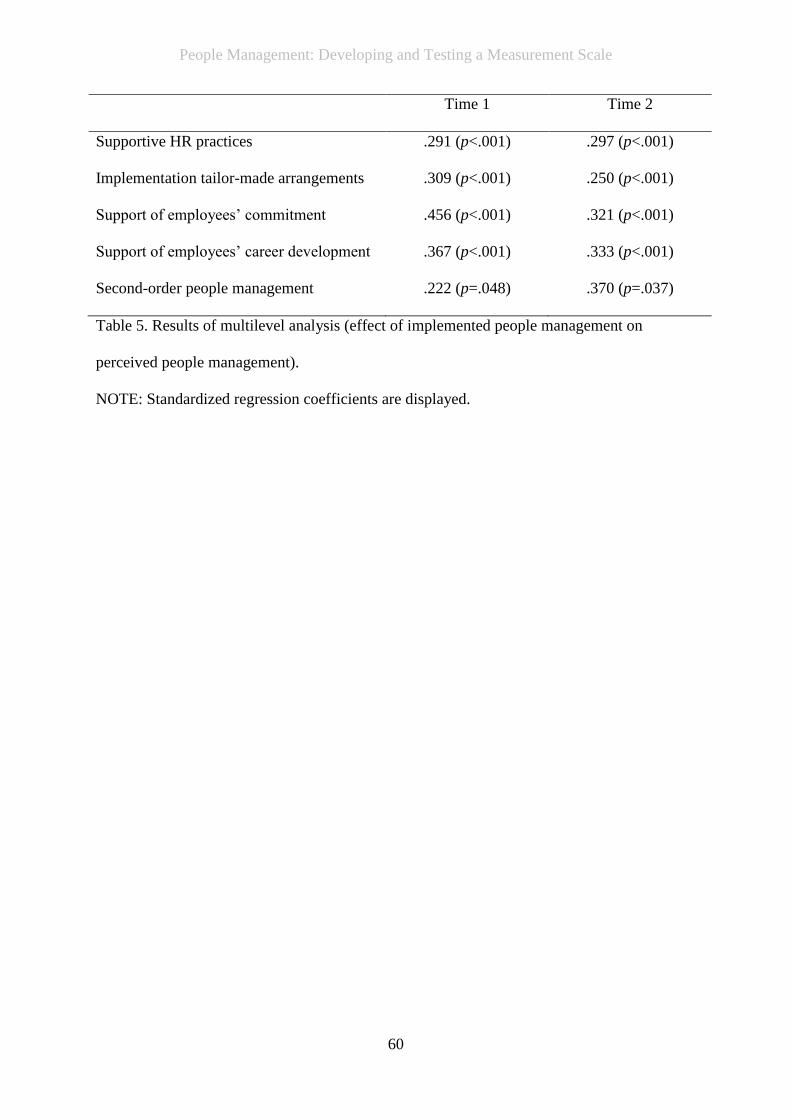
People Management: Developing and Testing a Measurement Scale
60
Time 1 Time 2
Supportive HR practices .291 (p<.001) .297 (p<.001)
Implementation tailor-made arrangements .309 (p<.001) .250 (p<.001)
Support of employees’ commitment .456 (p<.001) .321 (p<.001)
Support of employees’ career development .367 (p<.001) .333 (p<.001)
Second-order people management .222 (p=.048) .370 (p=.037)
Table 5. Results of multilevel analysis (effect of implemented people management on
perceived people management).
NOTE: Standardized regression coefficients are displayed.
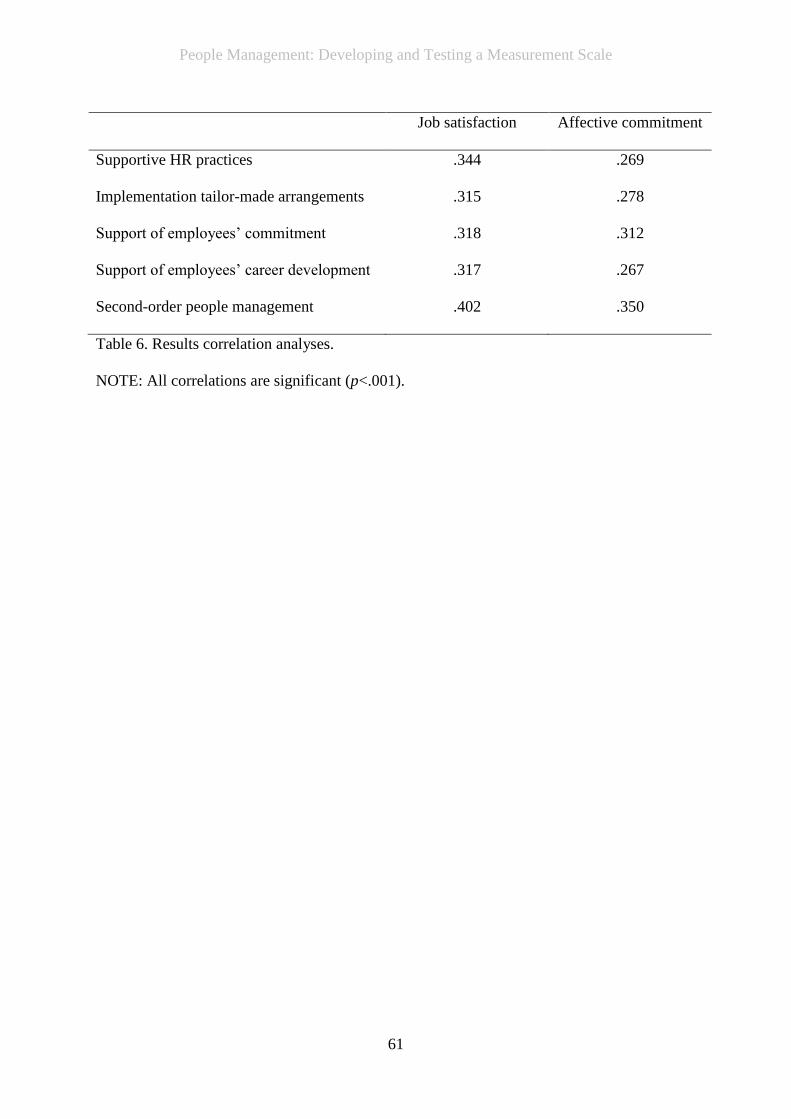
People Management: Developing and Testing a Measurement Scale
61
Job satisfaction Affective commitment
Supportive HR practices .344 .269
Implementation tailor-made arrangements .315 .278
Support of employees’ commitment .318 .312
Support of employees’ career development .317 .267
Second-order people management .402 .350
Table 6. Results correlation analyses.
NOTE: All correlations are significant (p<.001).
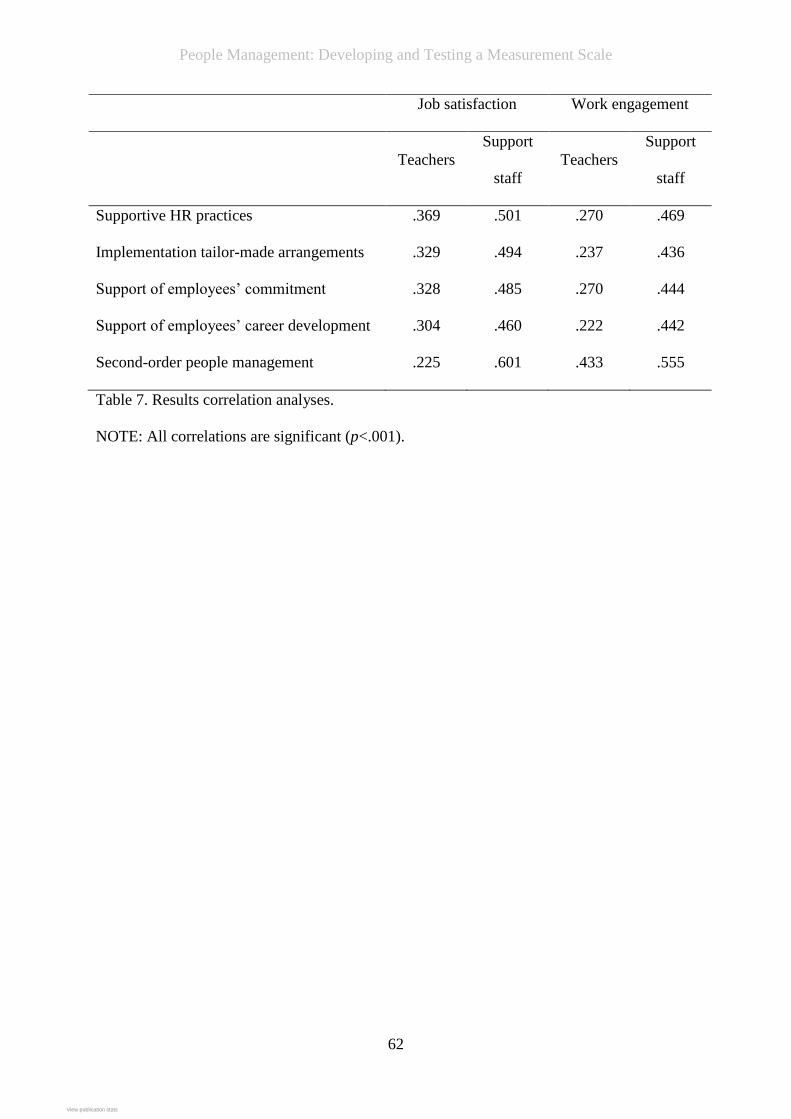
People Management: Developing and Testing a Measurement Scale
62
Job satisfaction Work engagement
Teachers
Support
staff
Teachers
Support
staff
Supportive HR practices .369 .501 .270 .469
Implementation tailor-made arrangements .329 .494 .237 .436
Support of employees’ commitment .328 .485 .270 .444
Support of employees’ career development .304 .460 .222 .442
Second-order people management .225 .601 .433 .555
Table 7. Results correlation analyses.
NOTE: All correlations are significant (p<.001).
View publication statsView publication stats