percep&ons*towards*sound*levels,* music*volumes*and*noise...
TRANSCRIPT

Percep&ons Towards Sound Levels, Music Volumes and Noise-‐Induced Hearing Loss Among Churchgoers in
Singapore
Supervisor: Prof William Hal Mar&n Co-‐Inves&gator: Penuel Lau

Aims • To find out the differences in the percep&ons and
knowledge towards sound levels, music volumes and noise-‐induced hearing loss among four main groups of churchgoers
Groups 1 – Pastors, Elders, Church Leaders 2 – Song Leaders, Vocalists, Musicians 3 – PA, Sound/Audio Engineers 4 – Normal Churchgoers

5 Hypotheses 1. Different preferences in music volumes
SoTest Loudest 1 4 3 2
2. Different knowledge regarding sound levels, sound safety standards, hearing health, and hearing protec&on and preserva&on Least knowledge Most knowledge
4 1 2 3 3. Different views regarding how the accompanying music affects the
spirituality of the worship service Smallest rela&onship Largest rela&onship 3 4 1 2

5 Hypotheses 4. Different concerns regarding the safety of their hearing with regards
to sound exposure that they receive from their church service Least concerned Most concerned
3 2 1 4 5. Differ in the accuracy of their perceived risk of hearing loss from the
sound exposures experienced during their church service Least accurate Most accurate 4 1 2 3

Background (1) • Noise exposure of priests in churches
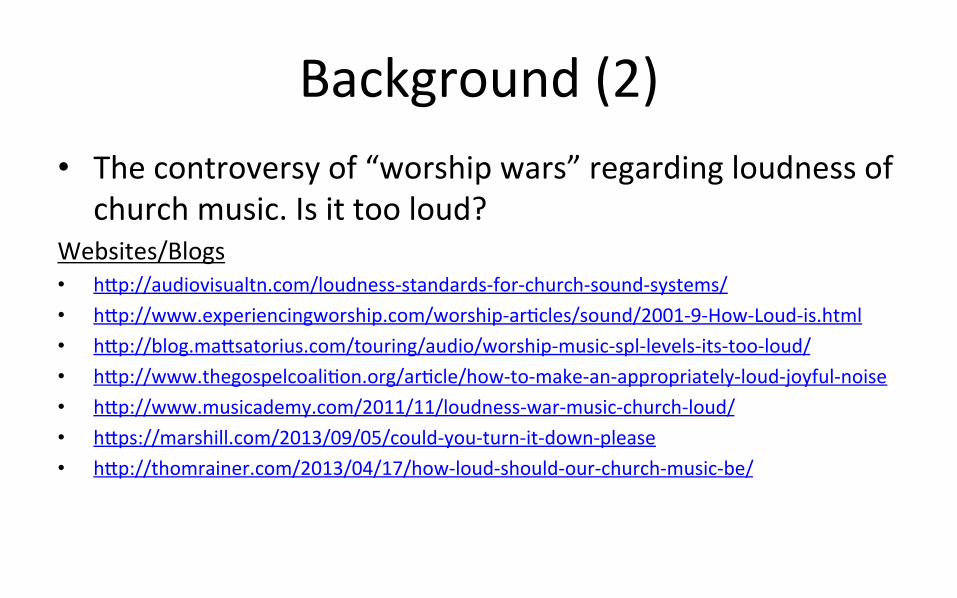
Background (2) • The controversy of “worship wars” regarding loudness of
church music. Is it too loud? Websites/Blogs • h]p://audiovisualtn.com/loudness-‐standards-‐for-‐church-‐sound-‐systems/ • h]p://www.experiencingworship.com/worship-‐ar&cles/sound/2001-‐9-‐How-‐Loud-‐is.html • h]p://blog.ma]satorius.com/touring/audio/worship-‐music-‐spl-‐levels-‐its-‐too-‐loud/ • h]p://www.thegospelcoali&on.org/ar&cle/how-‐to-‐make-‐an-‐appropriately-‐loud-‐joyful-‐noise • h]p://www.musicademy.com/2011/11/loudness-‐war-‐music-‐church-‐loud/ • h]ps://marshill.com/2013/09/05/could-‐you-‐turn-‐it-‐down-‐please • h]p://thomrainer.com/2013/04/17/how-‐loud-‐should-‐our-‐church-‐music-‐be/

Ques&onnaire • English, 2 pages, 14 ques&ons, less than 5mins • Some ques&ons based on Dangerous Decibels©
programme’s ques&onnaire • Assess percep&ons and knowledge of churchgoers • Each hypothesis have at least one ques&on to address it • Responses will prove/disprove hypotheses • Par&cipants ages 18 and above

Dosimetry • Done with 3M Quest NoisePro Dosimeter • Record SPLs, calculate Lavg and TWA • Readings will validate percep&ons of churchgoers and
responses on one of the ques&ons
Dosimeter Sehngs Slow response, dBA weigh&ng, 40-‐110dB range, 85dB criterion level for 8 hours, 3dB exchange rate, 80/70dB threshold, 110dB upper limit.

Research Timeline • IRB submission – 1 Sep 2014 • IRB approval – 15 Oct 2014 • Recruitment of Churches – July 2014 to Jan 2015 • Data Collec&on Start – 19 Oct 2014 to 8 Mar 2015 • Thesis wri&ng – October 2014 to 29 Mar 2015

Research Details • Collected 446 ques&onnaires from all 4 groups of
churchgoers from ages 18-‐76 across 5 churches • English-‐speaking church services that uses contemporary
Chris&an music and rock band set up with sound amplified through speakers

Research Obstacles or Limita&ons • Privacy issues & ques&onnaire controversy • Dosimetry varies in different churches • Only one dosimetry loca&on per church • Long correspondence &me with churches • Some churches take longer &me, some take shorter &me
(weeks) to complete dosimetry • Distribu&ng ques&onnaires aTer services may drag into
the next service

Research Findings • Dosimetry readings
• Church B the loudest church, exceeded Pdose, sound levels at certain loca&ons harmful
• Church C might have exceeded Pdose in some loca&ons
Figure 4. Average Lavg and duration, time-weighted averages (TWA), percentage doses (Pdose), and L-peak (Lpk) values across the five churches
Church
Average TWA (dBA)
Pdose (%)
Max Lpk hit (dB)
Total no. Lpk in 5 services
Avg. no. of Lpk > 120dB
Lavg (Leq T) SD
Time (s) SD
Time (m)
A 82.64 1.64 5552 689.58 92.53 75.4 11% 122.6 5 1 B 91.25 2.13 6164 315.96 102.73 84.6 92% 127.3 233 46.6 C 88.22 1.06 6066 413.74 101.10 81.4 44% 125.4 211 42.2 D 85.15 2.39 6272 347.95 104.53 78.6 23% 122.4 12 2.4 E 84.09 1.52 6380 774.44 106.33 77.6 18% 122.4 1 0.2 Total 86.27 - 6086.8 - 101.45 79.7 29% - - -

Research Findings • Par&cipant demography – Age
Figure 1. Means and standard deviation of age in each group and in each church
Group 1 Group 2 Group 3 Group 4 All groups M SD M SD M SD M SD M SD
Church A 47.08 9.087 35.77 7.528 32.67 8.042 43.15 16.588 40.78 13.517 Church B 31.43 7.815 31.14 7.520 32.00 5.632 31.82 7.506 31.68 7.381 Church C 48.11 12.283 32.65 9.773 40.17 10.667 40.93 10.902 39.40 11.503 Church D 37.71 7.158 30.24 4.944 34.67 6.282 31.92 7.871 32.28 7.327 Church E 44.33 8.563 34.12 14.097 36.80 10.281 44.63 13.433 41.48 13.433 All churches 39.92 11.208 33.08 9.242 35.84 8.871 37.27 12.351 36.60 11.479

Research Findings • Par&cipant demography – Age
• Generally, Group 1 oldest, Group 2 youngest
Figure 2. Age group distribution in each group across all five churches
Group 1 Group 2 Group 3 Group 4 No. % No. % No. % No. %
Age 50 and below 50 80.65% 92 93.88% 32 86.49% 212 85.14% Age 51 and above 12 19.35 6 6.12% 5 13.51% 37 14.86% Total 62 100% 98 100% 37 100% 249 100%

Research Findings • Par&cipant demography – Gender
• Generally, more males in Group 1 and 3
Figure 3. Gender distribution in each group across all five churches
Group 1 Group 2 Group 3 Group 4 No. % No. % No. % No. %
Male 40 64.52% 42 42.86% 30 81.08% 117 46.99% Female 22 35.48% 55 56.12% 7 18.92% 132 53.01% Unknown 0 0% 1 1.02% 0 0% 0 0% Total 62 100% 98 100% 37 100% 249 100%

Research Findings • Ques&ons from the ques&onnaire were scored and responses analysed sta&s&cally between the 4 groups
• Results were compared to the 5 hypotheses
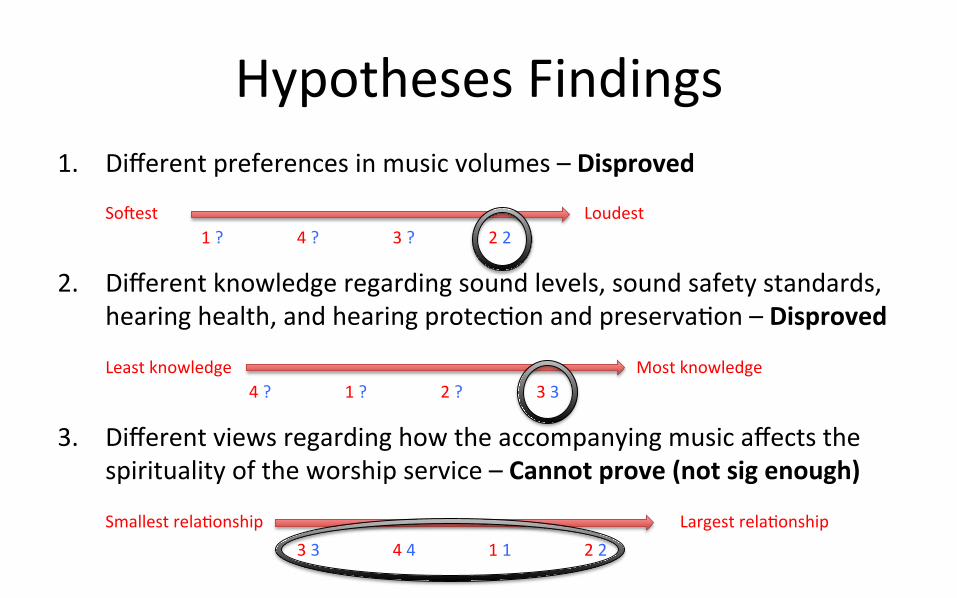
Hypotheses Findings 1. Different preferences in music volumes – Disproved
SoTest Loudest 1 ? 4 ? 3 ? 2 2
2. Different knowledge regarding sound levels, sound safety standards, hearing health, and hearing protec&on and preserva&on – Disproved Least knowledge Most knowledge
4 ? 1 ? 2 ? 3 3 3. Different views regarding how the accompanying music affects the
spirituality of the worship service – Cannot prove (not sig enough) Smallest rela&onship Largest rela&onship 3 3 4 4 1 1 2 2

Hypotheses Findings 4. Different concerns regarding the safety of their hearing with regards
to sound exposure they receive from their church service -‐ Disproved Least concerned Most concerned
3 2 2 4 1 1 4 3 5. Differ in the accuracy of their perceived risk of hearing loss from the
sound exposures experienced during their church service – Disproved Least accurate Most accurate 4 3 1 1 2 4 3 2
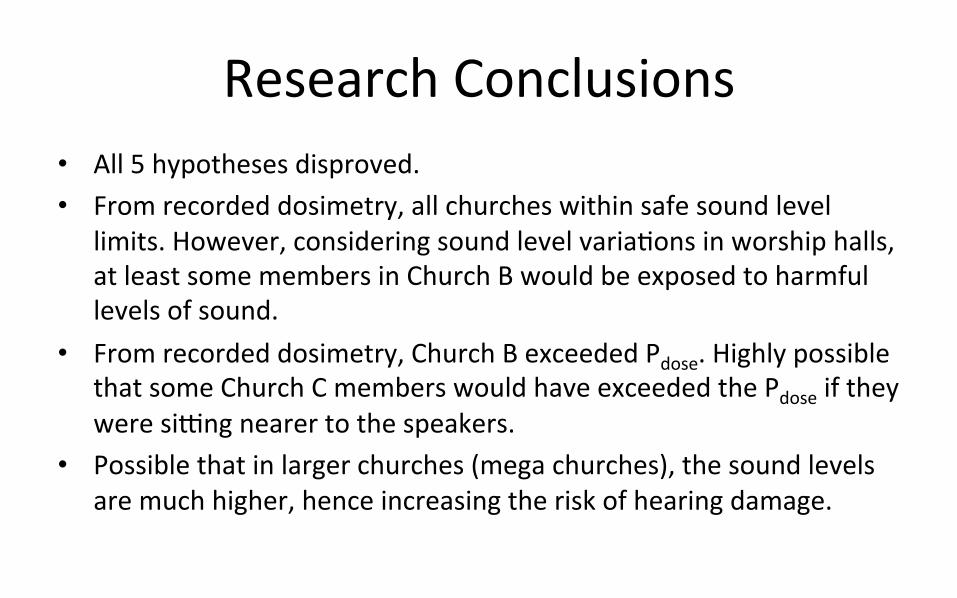
Research Conclusions • All 5 hypotheses disproved. • From recorded dosimetry, all churches within safe sound level
limits. However, considering sound level varia&ons in worship halls, at least some members in Church B would be exposed to harmful levels of sound.
• From recorded dosimetry, Church B exceeded Pdose. Highly possible that some Church C members would have exceeded the Pdose if they were sihng nearer to the speakers.
• Possible that in larger churches (mega churches), the sound levels are much higher, hence increasing the risk of hearing damage.

Research Conclusions • Par&cipants from the 5 churches generally displayed a lack in
knowledge regarding hearing health, noise exposure safety limits, and noise-‐induced hearing loss issues. Certain groups had more or less knowledge than the others.
• There is need to educate the public on hearing health issues, especially regarding noise exposure safety limits.
• Having these knowledge will influence behavior and mo&vate individuals to protect their hearing, thereby reducing the risk of noise-‐induced hearing loss.

Further Research • Mul&ple dosimeter loca&ons • Cover more churches of various sizes, musical and
worship styles • Online version of ques&onnaire • Efficacy of educa&onal programmes (such as Dangerous
Decibels©) to change behaviours and improve hearing health knowledge
Acknowledgements • God • 3M for dosimeter • Friends who referred churches • Friends who provided various forms of assistance

Thanks! • Q&A