performance analysis of the stop-and-wait arq …smacs.ugent.be/intern/doc/smacs/j122.pdf ·...
TRANSCRIPT
Performance Analysis of the Stop-and-Wait ARQ Protocol
over a Channel with Bursty Errors
S. De Vuyst, S. Wittevrongel and H. BruneelSMACS∗ Research Group, Vakgroep Telecommunicatie en Informatieverwerking,
Ghent University, Sint-Pietersnieuwstraat 41, 9000 Gent, Belgium
Tel. : +32-9-2648902 Fax : +32-9-2644295 e-mail : [email protected]
Abstract
In this paper, we present the analysis of the Stop-and-Wait ARQ(Automatic Repeat reQuest) protocol with the notable compli-cation that the transmission errors occur in a bursty, correlatedmanner. Fixed-length packets of data are sent from transmitterto receiver over an error-prone channel. The receiver notifies thetransmitter whether a packet was received correctly or not byreturning a feedback message over the backward channel. If nec-essary, the packet is retransmitted until it is received correctly,after which the transmission of another packet starts. For theStop-and-Wait protocol, no other packets are transmitted whilethe transmitter waits for a feedback message.
We model the transmitter side as a discrete-time queue withinfinite storage capacity and independent and identically dis-tributed (iid) packet arrivals. Arriving packets are stored in thequeue until they are successfully transmitted over the channel.The probability of an erroneous transmission is modulated by atwo-state Markov Chain, rather than assuming stationary chan-nel errors.
Our analysis is based on the use of probability generating func-tions (pgf ) and is exact at the packet level. We first derive theequilibrium distribution of the system’s state and the queue con-tent, after which we focus on the throughput and the distributionof the packet delay. For the latter, we use the spectral decom-position theorem from linear algebra. Additionally, a lower andupper bound for the probability that the queue is empty is alsogiven. Finally, we illustrate the importance of accounting for theerror correlation by means of some numerical examples.
1 Introduction
Whenever packets of data need to be transmitted from pointA (the transmitter) to point B (the receiver), there is alwaysa chance that something bad happens to them while they movethrough the medium between A and B (the channel): some pack-ets may be corrupted or even lost entirely. To cope with this,ARQ (Automatic Repeat reQuest) protocols have been used toprovide a more reliable way of communication between the trans-mitter and the receiver.
There are many types of ARQ, but all protocols have thesame two prerequisites : First, there must be some way for the
∗SMACS: Stochastic Modeling and Analysis of Communication Systems
. . .
NACK
ACK
P arrives
P queued retransmission
P leavestransmitterqueue
(s = 4)
transmitter
channel
receiver
s
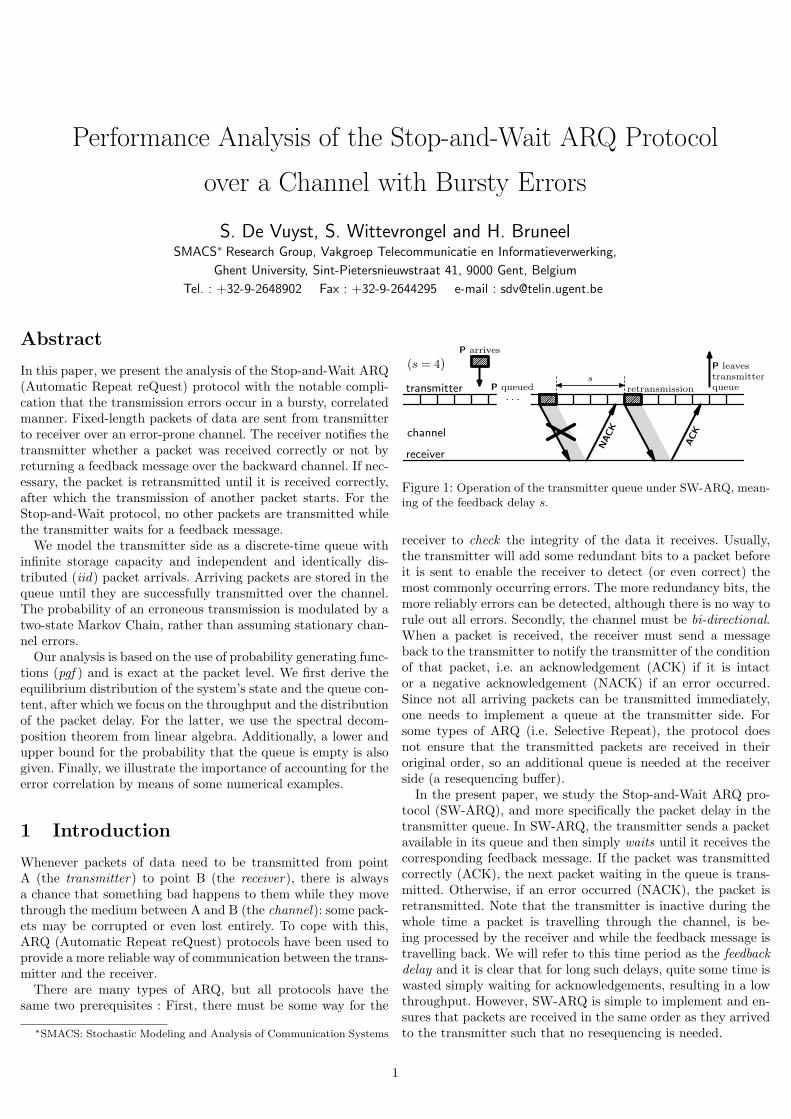
Figure 1: Operation of the transmitter queue under SW-ARQ, mean-ing of the feedback delay s.
receiver to check the integrity of the data it receives. Usually,the transmitter will add some redundant bits to a packet beforeit is sent to enable the receiver to detect (or even correct) themost commonly occurring errors. The more redundancy bits, themore reliably errors can be detected, although there is no way torule out all errors. Secondly, the channel must be bi-directional.When a packet is received, the receiver must send a messageback to the transmitter to notify the transmitter of the conditionof that packet, i.e. an acknowledgement (ACK) if it is intactor a negative acknowledgement (NACK) if an error occurred.Since not all arriving packets can be transmitted immediately,one needs to implement a queue at the transmitter side. Forsome types of ARQ (i.e. Selective Repeat), the protocol doesnot ensure that the transmitted packets are received in theiroriginal order, so an additional queue is needed at the receiverside (a resequencing buffer).
In the present paper, we study the Stop-and-Wait ARQ pro-tocol (SW-ARQ), and more specifically the packet delay in thetransmitter queue. In SW-ARQ, the transmitter sends a packetavailable in its queue and then simply waits until it receives thecorresponding feedback message. If the packet was transmittedcorrectly (ACK), the next packet waiting in the queue is trans-mitted. Otherwise, if an error occurred (NACK), the packet isretransmitted. Note that the transmitter is inactive during thewhole time a packet is travelling through the channel, is be-ing processed by the receiver and while the feedback message istravelling back. We will refer to this time period as the feedbackdelay and it is clear that for long such delays, quite some time iswasted simply waiting for acknowledgements, resulting in a lowthroughput. However, SW-ARQ is simple to implement and en-sures that packets are received in the same order as they arrivedto the transmitter such that no resequencing is needed.
1

The model we propose distinguishes itself from previous stud-ies in that we allow the errors occurring in the channel to becorrelated in time. Instead of assuming that the probability ofan erroneous packet is static in time, we propose that this prob-ability depends on what state the channel is in when the packetis transmitted. Specifically, the channel alternates between twostates which could be termed the GOOD state and the BADstate, both of which reflect different conditions with regard tothe error probability. The channel state process is modelled asa two-state Markov Chain with a fixed error probability in ei-ther state, resulting in what is also known as the Gilbert-Elliottmodel [1, 2]. This complication is inspired by the observationthat real-life communication channels rarely have the same er-ror sensitivity during their whole time of operation. Factors suchas electromagnetic interference, availability of intermediate net-work nodes and links, presence of data traffic with higher pri-ority and so on, may all influence the behaviour of the chan-nel and are mostly time-varying in nature. This holds especiallywhen the wireless medium is considered where the conditionsmay change on an even more diverse set of timescales than in awired medium due to user mobility, noise, reflection, scattering,shadowing, or any other physical effect that causes the radio sig-nal to change in both amplitude and phase. Such inherent signalchanges over time and space impairing the data transmission isknown as channel fading.
In wireless radio communication, a signal usually reaches thereceiver along many different reflective paths while the motionbetween transmitter and receiver results in propagation changesalong each of these paths. Therefore, the actually received signalis a superposition of many time-variant components that occa-sionally interfere in a destructive way. If the multiple reflectivepaths are large in number and there is no line-of-sight compo-nent, this fading on a small scale (as small as half a wavelength)is called Rayleigh fading [3]. The conditions of a flat (i.e. fre-quency non-selective) Rayleigh fading are statistically describedby Clarke’s model [4] and are widely accepted as a general-purpose description of wireless signal propagation [5–11].
During the last decade, there has been a lot of discussionwhether or not the transmission errors on a Rayleigh fadingchannel can be adequately modelled as a Markov process [5].Using an information theoretic metric, it was shown for the firsttime in [6] that the envelope of a Rayleigh fading process doesindeed have a Markov character. Shortly after, [7] has drawn thesame conclusion for the successes and failures of packet transmis-sions over such a channel. However, according to [8], some seriouscaveats must be placed with these results in case a slowly fadingchannel is observed for a longer period of time. In that paper,the authors use stochastic process theory rather than the infor-mation metric of [6,7] and compare the autocorrelation functionof the Rayleigh fading process with that of some well-chosenMarkov models under various conditions. Nevertheless, althoughthey may not always be able to capture all nuances of the er-ror statistics on the physical level, Markovian channel modelsfor the wireless link have been used very frequently, especiallyfor the performance analysis of the communication protocols inthe upper layers. These models are certainly more accurate thanindependent error models, while still allowing for a reasonablytractable analysis, often resulting in closed-form intuitive results.
Several error models with an underlying Markov chain have
been proposed, differing in the number of states to be used, thetransitions the states and the error statistics within each state.The capacity of a general Finite-Sate Markov Channel (FSMC)with a specific error probability in each state was studied in [9],where the correlated Rayleigh channel is given as an example.The FSMC proposed in [10] is derived from modelling the signal-to-noise ratio at the receiver under Rayleigh fading assumptions.Here, only transitions to adjacent states are possible, which is avalid assumption in case the channel fades slowly compared tothe time between packet transmissions. A classic type of FSMCsknown as the Fritchman models [11] divides the N states intotwo classes, namely error-free states and error states, withoutrestrictions for the transition probabilities. As to the number ofstates required to give a good description, that is a matter oftrade-off between accuracy and tractability (see the discussionin [5]). Interestingly, [12] explores the conditions under whichthe number of states can be reduced and shows how to stochas-tically upper and lower bound an N -state Markovian channelmodel with a 2-state model. Note however, that in a two-stateMarkovian channel both BAD and GOOD periods have geo-metrically distributed lengths, which is not always in agreementwith measurements in practical systems, for instance in the caseof UDP traffic over 802.11 Wireless LAN [13, 14]. Both paperssuggest to use a two-state semi -Markov process instead, by al-lowing a non-geometric distribution for the sojourn time in eachstate.
Nevertheless, the Gilbert-Elliott channel model with only twostates certainly has its merits when used for the analysis of ARQprotocols, see e.g. [5, 18, 27] as well as the examples in [24]. Asdemonstrated in the current paper, some of the qualitative effectson the queueing performance of the protocol that are causedby the correlation in the error process are manifested in theirpurest form precisely when using only two states. The distinctionmade between symmetric and compensated stability in Section6.2 is an example. We also note that in principle, our analytictechnique can equally well be used in the case of a model with Nstates, although explicit results for the queue content and delaydistribution can in general only be provided for N=2.
The performance of SW-ARQ has been studied before, both interms of throughput and queueing behaviour, but almost alwaysin case of static error probabilities. Several modifications havebeen proposed to enhance the performance of SW-ARQ, such assending multiple copies of a packet during the time the trans-mitter is waiting for feedback [15–18] or combining ARQ withimproved error correction techniques, known as hybrid ARQ [19].In [18], the influence of decoding with memory has been stud-ied as well. Another improvement is the SW-ARQ protocol sug-gested in [20], where each packet is divided in n parts and onlythose parts that were received in error are retransmitted. [22]studies the throughput and packet delay distribution of all threemajor ARQ protocols over a TDMA channel with static errors,although for Selective Repeat ARQ (SR-ARQ), only bounds forthe mean packet delay are given. In [21], the transmitter queuebehaviour of SW-ARQ is analysed in a continuous-time setting.Towsley [23, 24] has worked on the SW-ARQ model with corre-lated errors as well, but did not have results for the distributionof the packet delay as we do in Section 5. Also, our analysis isquite different on several accounts and we provide more explicitresults in case of a two-state error channel.
2

The organisation of the paper is as follows. The mathemat-ical model of the SW-ARQ transmitter queue is introduced inSection 2, along with some specific assumptions. In Section 3 weidentify a sufficient description for the state of the system at anarbitrary slot and provide the main equations that govern itsbehaviour. We obtain closed-form expressions for the joint pgfof the system state as well as the pgf of the queue content inequilibrium. In Section 4 we prove a simple expression for thethroughput of the system by observing the system at departureslots rather than arbitrary slots. In Section 5 the concept of con-ditional service period is used to obtain the pgf of the packetdelay, hereby referring to Appendix A for a brief review of thespectral decomposition theorem and Appendix B for the asymp-totic analysis of the delay distribution. In the special cases ofthe channel being either heavily correlated, or not correlated atall, we derive expressions for the probability that the queue isempty in Section 6. Some numerical examples are discussed inSection 7 and finally, conclusions are drawn in Section 8.
2 Model Description
We model the transmitter of a system operating under the Stop-and-Wait (SW) ARQ protocol as a discrete-time queue. We as-sume that time is divided in fixed-length intervals called slots,whereby one slot is the time required to transmit one packetfrom the queue into the channel. In our analysis, the length of acertain time period is always expressed as an (integer) number ofslots. Let us assume the feedback delay is a fixed number of slotstoo, denoted by s. The operation of SW-ARQ is illustrated inFig. 1. A packet P arrives at the system and is queued for sometime until all preceding packets are transmitted correctly andthe ACK of the previous packet is received. Then P is transmit-ted for the first time. If the transmission is erroneous, a NACKis returned and P is retransmitted s+1 slots after its previoustransmission. The packet is retransmitted until finally, an ACKis returned. Then the transmitter knows P was transmitted cor-rectly and there is no need to keep it in the queue any longer.One may wonder if the feedback messages can be corrupted too,since they use the same error-prone channel as the data packets.However, these messages are usually small and easier to protectthan the data packets. Hence, our model does not account for er-roneous ACK/NACK messages, which is in fact a non-restrictiveassumption [25].
Packets of information enter the system according to a generalindependent arrival process, i.e. the numbers of arrivals duringconsecutive slots form a sequence of independent and identicallydistributed random variables with common mass function a(n)=Prob[a=n] (n> 0) and probability generating function A(z) =∑∞
n=0 a(n)zn. Let ak be the number of arriving packets duringslot k, then we denote their mean value by α , E[ak] = A′(1).Furthermore, we assume that the arrivals ak are not stored inthe queue until the end of slot k. This way, an arriving packetcan only be served (i.e. transmitted) for the first time during thenext slot (k+1) at the very earliest.
When a packet is transmitted, its successful receipt depends onthe channel state during the slot in which the feedback messageis returned to the transmitter. The transitions between thosestates, the 0-state (GOOD) and the 1-state (BAD), are governedby a two-state Markov Chain as depicted in Fig. 2: if the feed-
1−q0
q1
1−q1
q0 GOOD‘0’
BAD‘1’
error
probability
e0
error
probability
e1
Figure 2: Markovian error model for the transmission channel.
back of a packet is returned during a 0-slot, this means the packetwas transmitted erroneously with probability e0. Similarly, dur-ing a 1-slot a feedback message is a NACK with probability e1and ACK with probability 1−e1. In other words, if we adoptthe notation q , 1−q, then ei is the probability of a correcttransmission, i = 0, 1. Evidently, the designations GOOD andBAD are only meaningful if e0 < e1, although this condition isnot a requirement for the analysis. At first it may seem strangethat we choose not to probe the channel state during the slot inwhich the packet is transmitted but during the slot in which itsfeedback is returned to the transmitter. However, this modellingchoice makes the analysis less complicated while the results re-garding the equilibrium behaviour stay the same. Indeed, it isonly a matter of definition to which actual slot k−s we referto by the name ‘channel state in slot k’. Since the evolution ofthe channel state is not influenced by the rest of the system, theresults of the analysis are not affected by a fixed time shift ofthis definition.
First of all, as a convention for the remainder of this paper,let the index i always be either 0 or 1. As indicated in Fig. 2,the probability of remaining in state i during a slot transition isgiven by qi. We denote the channel state (0 or 1) in slot k by rkand let ωi,k ,Prob[rk = i]. Then we have
ωk+1 = ωkq with q ,
[q0 q0q1 q1
], (1)
where ωk is the row vector with elements ω0,k and ω1,k
and q is the transition probability matrix of the channelstate process. Since the channel states are Markovian, boththe 0-periods and 1-periods are geometrically distributed, i.e.Prob[i-period of length n] = (1−qi)qn−1
i (n > 1). Also from Fig.2, we have for the conditional pgfs of rk:
r0(z) , E[zrk+1 |rk = 0] = q0z + q0 ,
r1(z) , E[zrk+1 |rk = 1] = q1z + q1 ;(2)
where E[X|Y ] is the expected value of X given that Y holds. Itturns out that the lengths of 0- and 1-periods (i.e. the values q0and q1) determine the performance of the queue in a crucial way.However, rather than using q0 and q1, we define the parameters
σ =1− q0
2− q0 − q1and K =
12− q0 − q1
,
to be understood as follows. Suppose the channel is in state 0with probability σ and in state 1 with probability σ, indepen-dently from slot to slot, such that the mean sojourn times are1/σ and 1/σ respectively. It is clear that the overall fractionof 1-slots remains equal to σ if the mean lengths of 0- and 1-periods are both multiplied by the same factor K, i.e. if the ge-ometric distributions are chosen such that the mean lengths are
3

A B C D E B
sendA
ACK
sendB
NACK
sendB
ACK
sendC
uk
1 0 0 0 . . . 0 0 1 1 1 1 . . . 0 0 0 . . . 0 0 1 . . . rk
0 0 s+1 s . . . 1 0 0 0 s+1 s . . . 1 s+1 s . . . 1 s+1 s . . . mk
Figure 3: Evolution of the system state given by the channel staterk, the residual roundtrip time mk and the queue content uk.
1/(1−q0) = K/σ and 1/(1−q1) = K/σ respectively. Therefore,the factor K can be seen as a measure for the absolute lengths ofthe 0- and 1-periods, while σ characterises their relative lengths.Indeed, σ is the relative fraction of 1-slots, since we have from(1) in equilibrium:
ω = limk→∞
ωk =[σ σ
]. (3)
Moreover, the correlation coefficient φ between the channelstates in two consecutive slots is determined by the value K:
φ = limk→∞
E[rk rk+1]− E[rk]E[rk+1]√Var[rk]Var[rk+1]
=−1+q0+q1 = 1− 1K.
Note that φ= 0 and K = 1 for uncorrelated errors, whereas forpositive correlation we have 0 < φ < 1 and K > 1. The morecorrelation present in the channel state process {rk}, the higherK is and the fewer the channel changes state. For example, ifσ = 0.5, typical samples of {rk} may be :
011000110101000110111001101001001101000110111 K small,000000001111111111110000000111111111111000000 K large.
3 Distribution of System State andQueue Content
The analysis of this model with regard to the queue content waspresented before in detail in [27]. However, since our analysis ofthe packet delay in Section 5 relies on these results, we repeat themain steps here and extend them where necessary. Our study ofthe transmitter queue described above is done by modelling thesystem as a (multi-dimensional) Markov Chain and calculatingits equilibrium distribution, assuming such equilibrium exists.Hence, we first need a description of the system state in theMarkovian sense, i.e. a set of random variables such that theirdistribution in slot k+1 depends only on the values of the corre-sponding variables in slot k (and not on those in previous slots).The set must also be sufficiently large to solve the problem athand. In other words, what is the information we need to keeptrack of if we can only look back one slot?
As the system state variables, we choose the set illustrated inFig. 3, constructed as follows. Let uk be the queue content atthe beginning of slot k, which obviously needs to be includedsince {uk} is the process we are interested in. Next, we also needto know how far a packet has progressed through the channel
during slot k and when we can expect its feedback message.For this purpose we define the supplementary variable mk, ina similar way as was done in [28]. The residual roundtrip timemk indicates the remaining number of slots at the beginning ofslot k, needed to complete the roundtrip of the most recentlytransmitted packet if uk >1, and mk =0 if and only if uk =0. Somk =s+1 when a packet is transmitted and then counts one downin each of the following slots. After s slots, whenmk =1, we knowthat the feedback message for this packet is being returned andthe packet will either leave the queue at the end of the slot (ACK)or be retransmitted in the next slot (NACK). Finally, as before,let the random variable rk be the channel state during slot k. Thechannel state comes into play during slots with mk = 1, whereit determines the probability that either an ACK or a NACK isreturned, or equivalently, that the packet departs from the queueor is to be retransmitted. Let dk be equal to 1 if a packet departsat the end of slot k and equal to 0 otherwise. Then if mk =1, theprobability of an error, and therefore of ‘dk = 0’, is ei if rk = i.Hence, the pgf of dk is given by di(z)= eiz+ ei if rk = i. We alsodefine
di(z) , eiz+ei , (4)
which is the pgf of dk =1−dk.
3.1 System Equations
One verifies that the triple (rk,mk, uk) is an adequate Markoviandescription of the system state at the beginning of slot k. Thetransitions from slot k to slot k+1 in this (three-dimensional)Markov Chain are described by the following set of system equa-tions. We specify from what possible events in slot k the events‘mk+1 = h’, h= 0, 1, . . . , s, s+1 can be the result. Note that inall cases, the transitions for rk are given by (2).
• mk+1 =0 (and therefore uk+1 =0):An empty system in slot k+1 can be the result of two dis-tinct events in slot k. Either the queue was empty then too,or the queue contained exactly one packet which departed.Obviously, no new packets should arrive in either case:
‘mk+1 =0’ = ‘mk =0, ak =0’∨ ‘mk =1, uk =1, dk =1, ak =0’ .
(5)
• 0 < mk+1 < s+1:In this case, we know that in slot k the system is not emptyand that there can be no departures, since no feedback mes-sage is expected. Hence:
mk+1 = mk − 1 , (6)uk+1 = uk + ak . (7)
• mk+1 = s+1 :In this case, a new roundtrip period starts with the trans-mission of a packet in slot k+1. Therefore, in slot k, thequeue was either empty but with the arrival of new pack-ets, or it was at the last slot of a roundtrip period (mk =1).However, in the latter case we have to exclude the possibilitymentioned in (5) that the roundtrip ends with a departureand there is no packet available to start a new one in slotk+1:
‘mk+1 =s+1’ = ‘mk =0, ak > 0’∨ ‘mk =1,¬(uk =1, dk =1, ak =0)’ .
(8)
4
In either case we have:
uk+1 = uk − dk + ak . (9)
3.2 Equilibrium Distribution of the SystemState
We use the above relations to obtain separate expressions for thedistribution of the system state during slots where the queue isidle (mk =0) and during slots where the queue is busy (mk>0).First, let us define pi,k as the probability that the queue is emptyand that the channel is in state i in slot k,
pi,k , Prob[mk =0, rk = i] . (10)
Secondly, let yzHi,k(y, z) be the joint partial pgf of the residualroundtrip time and the queue content in slot k for a busy queueand channel state i in that slot:
Hi,k(y, z) , E[ymk−1zuk−1{mk > 0, rk = i}] , (11)
where we use the notation E[X{Y }]=E[X|Y ] Prob[Y ]. Addition-ally, we define zRi,k(z) as the partial pgf of the queue content inslot k for the case it is the last slot of a roundtrip period (mk =1)and the channel state is i:
Ri,k(z) , E[zuk−1{mk =1, rk = i}] = Hi,k(0, z) . (12)
Note that Hi,k(y, z) and Ri,k(z) are only partial pgf’s such that
Ri,k(1)=Prob[mk =1, rk = i]< Hi,k(1, 1)=Prob[mk>0, rk = i] < 1 .
We proceed by using the system equations (2)–(9) to de-vise a relation between pi,k+1 and pi,k on the one hand, andHi,k+1(y, z) and Hi,k(y, z) on the other. First, from (10), andsubsequently using (5), the uncorrelated nature of the arrivalprocess, (2) and (12), we find
p0,k+1 + xp1,k+1 = E[xrk+1{mk+1 =0}]
=A(0)[E[xrk+1{mk =0}] + E[xrk+1{mk =1, uk =1, dk =1}]
]=A(0)
[ 1∑i=0
ri(x)pi,k +1∑
i=0
ri(x)eiRi,k(0)]. (13)
Secondly, from (11), and using the equations (6)–(9) we have
H0,k+1(y, z) + xH1,k+1(y, z)
= E[xrk+1ymk+1−1zuk+1−1{mk+1 > 0}]= y−1E[xrk+1ymk−1zuk+ak−1{1 < mk 6 s+1}] (14)
+ E[xrk+1yszak−1{mk =0, ak > 0}]+ E[xrk+1yszuk+ak−dk−1{mk =1,¬(uk =1, dk =1, ak =0)}] ,
which can readily be written in terms of pi,k, Ri,k(z) andHi,k(y, z) using (2) and the definitions (10)–(12).
We assume that for k → ∞, the system reaches equilibrium,such that pi,k and the functions Ri,k(z) and Hi,k(y, z) convergeto a limiting value which we indicate by dropping the index k.Also, let r, m, u and a denote the channel state, the remaining
roundtrip time, the queue content and the number of arrivalsrespectively, in an arbitrary slot during equilibrium. The condi-tion for the system to reach such an equilibrium will be discussedfurther in Section 4. Due to (13), the partial pgf of the channelstate in equilibrium for an idle queue, is thus implicitly given by
p0 + xp1 = A(0)1∑
i=0
ri(x)(pi + eiRi(0)
). (15)
Likewise, we find from (14) the following relation for the equi-librium distribution of the system state for a busy queue:
H0(y, z) + xH1(y, z) =1∑
i=0
ri(x)[1yA(z)
(Hi(y, z)−Ri(z)
)+ys
zA(z)
(pi + di(z)Ri(z)
)− ys
zA(0)
(pi + eiRi(0)
)].
(16)
The relations (15) and (16) constitute a set of (functional) equa-tions that implicitly determine the distribution of the systemstate in equilibrium, i.e. the probabilities pi and the functionsHi(y, z). Let us arrange these quantities in the row vectors pand H(y, z) respectively as
p =[p0 p1
], H(y, z) =
[H0(y, z) H1(y, z)
]. (17)
Fortunately, it is possible to solve (15) and (16) for the func-tions Hi(y, z). We observe that these equations are polynomialsof degree 1 in x. Therefore, we can identify the coefficients of x onboth sides of either equation. For (15), this yields the followingtwo relations between the probabilities p0, p1 and R0(0), R1(0):
A(0)(e0R0(0) + e1R1(0)
)= (1−A(0))
(p0 + p1
);
φA(0)(σe0R0(0)− σe1R1(0)
)= (1−φA(0))
(σp0 − σp1
).
(18)
In the same way, we find these explicit expressions for Hi(y, z)from (16):
(y−A(z))(y−φA(z))Hi(y, z)
=A(z)z
[yqi
(ys+1di(z)−z
)Ri(z)
+ (yqi−φA(z))(ys+1di(z)−z
)Ri(z)
]+
ys+1
(1−φ)z
[qi(φA(z)−y)(1−A(z))(p0+p1)
+ (φA(z)−1)(y−A(z))(qipi−qipi)],
(19)
where we already have included the relations (18) to eliminatethe probabilities Ri(0). The only remaining unknowns in (19)are the probabilities pi and the functions Ri(z). An expressionfor the latter can be obtained using the following property of(partial) pgfs (see also [28]). The functions Hi(y, z), as a resultof their definition (11), must be bounded for all values of y andz with |y|6 1 and |z|6 1. In particular, because A(z) is a pgf,this should be the case for y=A(z) and y=φA(z) with |z|6 1,since φ61 and |A(z)|61 for all such z. Now, if we choose eithery=A(z) or y=φA(z) in (19) where |z| 6 1, the left hand side ofthis equation vanishes. Since Hi(y, z) is bounded for these valuesof y, the right hand side must be equal to zero too. Applying thesubstitutions y =A(z) and y = φA(z) into (19) for either i= 0
5
or i=1 yields the same set of two relations between R0(z) andR1(z) from which these functions can be determined as:
Ri(z) =A(z)s
N(z)
[φs(φA(z)−1)
(A(z)s+1di(z)−z
)(qipi−qipi)
− qi(A(z)−1)((φA(z))s+1di(z)−z
)(p0+p1)
], (20)
where the denominator N(z) follows as a known function of thesystem parameters:
N(z) =1∑
i=0
qi((φA(z))s+1di(z)−z
)(A(z)s+1di(z)−z
). (21)
3.3 Probability of an Empty Queue
At this point, the only remaining unknowns in our analysis arethe probabilities p0 and p1 of having an empty queue while thechannel is in state 0 or 1 respectively. To determine those, weneed two additional relations. A first relation can be found fromthe normalisation condition 1 = p0+p1+H0(1, 1)+H1(1, 1), whichafter taking the limit y → 1 and z → 1 in (19), turns out to beequivalent to
α = e0R0(1) + e1R1(1) , (22)
where α=A′(1) is the mean number of arriving packets per slot.Again, by taking the limit z → 1 in (20), we explicitly find
(1−φs+1)[(s+1)α+ (p0+p1 − 1)(σe0+σe1)
]= φs(s+1)(e0−e1)(q0p0+q1p1) .
(23)
Note that multiple applications of de l’Hopital’s rule were re-quired to obtain both (22) and (23). The normalisation condi-tion (23) allows us to write all results with only a single unknownp0+p1 which indicates the equilibrium probability that the queueis empty. It is possible to determine this last unknown proba-bility numerically. Indeed, a second relation for p0 and p1 canbe obtained from (20) in a similar way as before. Again, we canuse either R0(z) or R1(z) for the procedure, since both yield thesame result. Because Ri(z) is a (partial) pgf, it must be analyticand therefore bounded in the unit disc |z|<1. Hence, if we canfind a value z = z∗ in the unit disc for which the denominatorN(z) of Ri(z) vanishes, the numerator must also be equal tozero for z = z∗. Conveniently, it can be proven with Rouche’stheorem that the denominator N(z) has exactly one zero z∗
inside the unit disc, i.e. N(z∗) = 0. This zero can easily be cal-culated using a numerical root-finding algorithm, such as e.g.the Newton-Raphson scheme. The additional relation betweenp0 and p1 we were looking for is thus obtained by substitutingz∗ into the numerator of (20) and let it equal zero. The obtainedexpression then determines the probability p0+p1, which com-pletes our analysis of the equilibrium distribution of the systemstate (r,m, u). From (19) and (20), one finds the (unconditional)joint pgf of the system state in equilibrium as
P (x, y, z) , E[xrymzu]= p0 + xp1 + yzH0(y, z) + xyzH1(y, z) ,
(24)
where the probabilities pi can be eliminated as explained.
3.4 Distribution of the Queue Content
Obviously, if we know the joint distribution of the system state(r,m, u), we can also obtain the marginal distribution of thequeue content u in equilibrium. Let U(z) be the pgf of the queuecontent at the beginning of an arbitrary slot, then
U(z) = P (1, 1, z) = E[zu] =1∑
i=0
E[zu{r= i}]
=1∑
i=0
E[zu{r= i,m=0}] + E[zu{r= i,m > 0}] (25)
=1∑
i=0
pi + zHi(1, z) =(1−z)A(z)1−A(z)
(e0R0(z) + e1R1(z)
),
for which we took the limit y → 1 in (19). After using the ex-pressions (20) for Ri(z) and the normalisation condition (23),we finally find
U(z) =(1−z)A(z)s+1(1−A(z)
)N(z)
[z(1−φs+1)
(1−φA(z)
)(1−A(z)s+1
)·(α+
σe0+σe1s+1
(p0+p1−1))
+ (p0+p1)φ(1−A(z)
)(26)
·(e0e1(1−z)φs+1A(z)s+1 −z(σe0+σe1)
(1−φs+1A(z)s+1
))].
As was explained in [27], various interesting measures concerningthe behaviour of the queue content can be derived from this pgf.Invoking the moment generating property of pgfs on (26) yieldsclosed-form expressions for the moments of the queue contentup to any desired order, although the subsequent differentia-tions quickly become very involved for higher-order moments.For instance, the mean queue content E[u]=U ′(1) follows as
E[u] = α(s
2− φ
φ
)+
12(1−φs+1)[σe0+σe1 − (s+1)α]
·[2φs+1
[(p0+p1)e0e1−(e0−(s+1)α)(e1−(s+1)α)
]+α
(p0+p1)1−φ
(σe0+σe1)[(s+2)(φ−φs+1)+s(φs+2−1)
]+(1−φs+1)(s+1)
[A′′(1)− (s+2)α2 + 2α
]]. (27)
We defer the discussion about the tail distribution Prob[u= n]for large n to Appendix B.
4 Calculation of the Throughput
We now focus on the calculation of the throughput of the SW-ARQ system described above. What follows is a new and moreintuitive proof for the throughput expression already stated in[24]. Let us call the service period of a packet the period it staysin the server of the queue, i.e. from the slot in which it is trans-mitted for the first time, up to and including the slot in which itdeparts from the queue. The length of a service period is calledthe service time of that packet. Clearly, the service time is al-ways an integer multiple of s+1, as it is always composed ofa number of roundtrip periods: one for the initial transmission
6
NACK
NACK
ACK
i i′ rk
roundtrip
period
service period
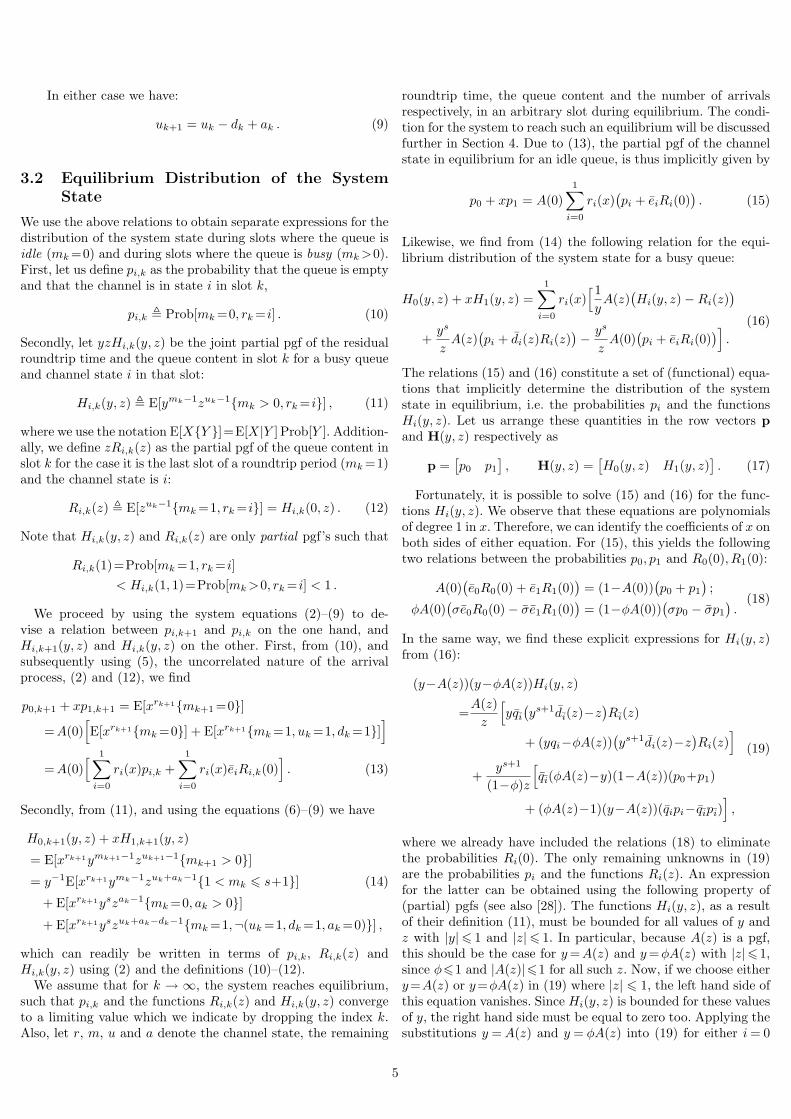
Figure 4: The service time of a packet of n = 3 roundtrip periodsstarting in channel state i and ending in state i′.
of the packet and possibly an additional number for retransmis-sions. We define the throughput η of the system as the maximumnumber of packets per slot that can be correctly delivered to thereceiver. Hence, η is a measure for the maximum output rateat which the system can transmit incoming packets and shouldtherefore be compared to α, the mean arrival rate. Indeed, inorder to have a stable queue that reaches equilibrium, we musthave
α < η , or ρ ,α
η< 1 , (28)
where we call ρ the load of the system. Obviously, the maxi-mum output rate is only achieved if the system operates underoverload conditions, i.e. if we assume there are always packetswaiting in the queue for transmission. Thus, as soon as a packetis ACKed and leaves the queue, there is always another packetavailable to transmit immediately. Under these conditions, wecan also define the throughput η as the inverse of the meanservice time of an arbitrary packet. Therefore, we proceed byderiving the service time distribution of the packets. For this,we do not need to consider the queued packets as in the previ-ous Section, but only the server and the state of the channel.
Unfortunately, as a consequence of the correlated nature ofthe channel, the service times are not independent. Specifically,a packet’s service time distribution will generally be differentdepending on whether its initial transmission happens during a0-slot or during a 1-slot. Let us say that the service time of apacket starts in channel state i if the channel is in state i in theslot before the initial transmission of the packet, as indicatedin Fig. 4. Conversely, the service ends in channel state i′ if thechannel state is i′ in the slot where the packet leaves the queue.Now, let us define γii′(n) (n> 1) as the conditional probabilitythat the service of a packet requires n roundtrip periods (or ntransmission attempts) and that the channel state is i′ at theend of the service given that the service time starts in state i(i, i′=0, 1), i.e.
γii′(n) = Prob[n roundtrips, rk+n(s+1)−1 = i′ | rk−1 = i ] (29)
if the packet is first transmitted in slot k.Since we assume that the service periods are not interrupted
by idle periods, every service period starts in the same channelstate as the previous one ended with, which clearly is also thechannel state during the departure slot of the previous packet.As such, the departure slots mark the boundaries between twosuccessive service periods while the length of a service dependson the channel state during the preceding departure slot, in viewof (29). Therefore, the channel state during departure slots formswhat is called a (special) Semi-Markov Process. This embedded
channel state process is of particular importance to us, sincewe need to know the equilibrium probabilities of being in eitherchannel state when a service period starts (or ends), or equiv-alently, the channel state at departure slots only. Let r∗k be thechannel state during the k-th departure slot and πi,k the prob-ability that r∗k = i. Then we have for the row vector πk withelements π0,k and π1,k respectively,
πk+1 = πk
∞∑n=1
γ(n) with γ(n) =[γ00(n) γ01(n)γ10(n) γ11(n)
], (30)
which is to be compared with (1) for the channel state proba-bilities ωk at consecutive slots. The row vector of equilibriumprobabilities of {r∗k} is π = limk→∞ πk which is different fromthe probabilities ω in (3), as will be shown.
The probabilities γ(n) can be found as follows. According to(1), the (s+1)-step transition probabilities of the channel stateprocess {rk} are given by the matrix qs+1, such that [qs+1]ii′is the probability that the channel state is i′ at the end of aroundtrip period given that it is i at the end of the previousroundtrip. This matrix has eigenvalues 1 (since it is stochastic)and φ. The spectral decomposition representation (see AppendixA) for qh is given by
qh =[σ σσ σ
]+ φh
[σ −σ−σ σ
](h>0) . (31)
Now, the matrix γ(n) in (30) is found as
γ(n) =(qs+1e
)n−1qs+1e , n > 1 , (32)
where the channel error probabilities are arranged in the matri-ces
e =[e0 00 e1
]and e =
[e0 00 e1
].
The geometric-like expression (32) can easily be interpreted asfollows. If the service of a packet requires n roundtrip periods,then there are first n−1 roundtrip periods – each of length s+1– wherein an error occurred followed by one roundtrip withoutchannel error.
The z-transform of the matrix γ(n) gives us the probabilitygenerating matrix (or pgm) g(z) of the number of roundtripperiods required for the successful transmission of a packet, ac-counting for the channel state at the start and end of the service.From (32), we find
g(z) =∞∑
n=1
γ(n) zn
= (I− z qs+1e)−1qs+1ez , (33)
where I is the 2 × 2 identity matrix. Note that the inverse ma-trix in (33) always exists for |z|61, in the first place because theelements of g(z) are (partial) pgfs and must be analytic in thatregion. Another reason why I−z qs+1e is nonsingular for |z|61is due to the Perron-Frobenius (PF) Theorem, see [31, 32]. Theeigenvalues of the matrix qs+1e are found as the roots of its char-acteristic polynomial det(λI − qs+1e) and must necessarily besmaller than one since the matrix is substochastic (except per-haps for some boundary values of q and e for which the channelis static instead of correlated). Let us define
ν(z) =det(I− z qs+1e) (34)
7

=1− z(e0(σ+φs+1σ) + e1(σ+φs+1σ)
)+ z2e0e1φ
s+1 ,
then it is clear that the eigenvalues satisfy ν(λ−1) = 0 and areequal to the inverse of the roots of ν(z). These roots, for whichthe matrix I−z qs+1e is singular, are therefore situated outsidethe unit disc. We find from (33) the following expression for thepgm g(z):
g(z) =z
ν(z)(qs+1e− z φs+1
[e0e1 00 e0e1
] ). (35)
Recall that the element [g(z)]ii′ is the partial pgf of the numberof roundtrip periods required to successfully transmit a packetending the service in state i′, given that it starts in state i. Forfuture purposes, we also introduce the pgm S(z) as
S(z) , g(zs+1) , (36)
which gives the distributions of the number of slots in a serviceperiod rather than the number of roundtrips. The nice thingabout the matrix representation S(z) is that it allows us to han-dle the distribution of contiguous service times as if they wereindependent. Indeed, the conditional distribution of the lengthof n contiguous services (i.e. without idle periods in between)ending in state i′, given that the first service starts in state i issimply given by [S(z)n]ii′ .
From (29), (30) and (33), the transition probability matrix ofthe embedded process {r∗k} is seen to be given by g(1) and iseasily obtained from (35) as
g(1) =[q∗0 q∗0q∗1 q∗1
]with q∗i =
ei
ν(1)(σ + φs+1(σ−ei)
).
Hence, the equilibrium probabilities π of the channel state r∗ atan arbitrary departure slot must satisfy π=πg(1), from which
π =[π0 π1
]=
[e0σ
e0σ + e1σ
e1σ
e0σ + e1σ
]. (37)
Remember that for the queue working under overload conditionswe have defined the throughput η as the inverse of the meanservice time. The distributions of the service times conditionedon the channel state in which the service starts are given by (36),whereas π in (37) are the equilibrium probabilities of being ineither state 0 or 1 at the start of a service time. Therefore, usingthe moment generating property of pgfs, we find the throughputas
η−1 = π S′(1)1 = (s+1)π g′(1)1 with 1 ,
[11
], (38)
where 1 is the 2 × 1 column vector with 1 on both entries andwhere S′(1) indicates the matrix S(z) with each element differ-entiated to z and evaluated for z = 1 (and likewise for g′(1)).After properly evaluating (38), we finally find the following ex-pression for the throughput of the Stop-and-Wait ARQ protocolover the correlated error channel:
η = σe0s+1
+ σe1s+1
=1− (σe0+σe1)
s+1. (39)
Note that this expression is surprisingly simple and is equal tothat of the throughput for Stop-and-Wait ARQ with an uncor-related error channel, see e.g. [15–17,23],
ηstatic =e
s+1,
which we would get if the channel has a static error probabilitye , σe0+σe1. Equivalently, another way to interpret (39) is tosay that the throughput η for our two-state modulated channelis simply the weighted sum
η = ση0 + ση1 , with ηi =ei
s+ 1(i=0, 1) , (40)
of the ‘static’ throughputs which would be obtained in the (fic-titious) case of a static channel error probability ei. Or in otherwords, ηi is the throughput in case the channel has error prob-ability ei in every slot. The coefficients in (40) are equal to theequilibrium channel state probabilities ω of (3), which is consis-tent with the findings in [24]. Observe also that η is independentof K, i.e. as far as the mean service time of an arbitrary packetis concerned, it does not matter how often the channel changesstate as long as the overall ratio of 0- and 1-slots remains thesame. Unlike the throughput however, the probability p0+p1 ofan empty queue does decrease with K. See Section 6 for furtherdiscussion.
5 Analysis of the Packet Delay
In this Section, we derive an expression for the pgf D(z) of thetotal delay d experienced by an arbitrary packet traversing thetransmitter queue. Of all the packets arriving to the system,consider an arbitrary packet and tag it as packet P. Also, letus mark the arrival slot of P as slot I. We define the delay das the number of slots between the end of the slot in which Parrives (slot I) and the end of the slot in which P departs fromthe transmitter queue.
We can quantify the delay as the amount of time required toprocess the unfinished work present in the queue directly afterthe arrival of P, if we assume for a moment that the arrivalsduring a slot occur one by one. Clearly, this unfinished workforemost depends on the system state (rI ,mI , uI) at the begin-ning of slot I. Hence, we first need an expression for the systemstate distribution PI(x, y, z) in slot I. Now, it has been arguedbefore (see e.g. [26]) that due to the uncorrelated (iid) nature ofthe packet arrival process, the system as ‘seen’ by an arbitraryarriving packet has the same distribution as the system in anarbitrary slot. Therefore, we can immediately use the result (24)of Section 3 for the joint pgf P (x, y, z) as it is also the distribu-tion of the system state during the arrival slot of an arbitrarypacket,
(rI ,mI , uI)d= (r,m, u) , PI(x, y, z) = P (x, y, z) . (41)
Apart from the system state at the beginning of slot I, the delayof P also depends on the number and order of arrivals duringthat slot. Let ` be the number of packets arriving in the queuein slot I that will be served no later than (but including) P, asindicated in Fig. 5. The pgf L(z) of ` is found as (see [26])
L(z) =z(1−A(z))α(1− z)
, (42)
by considering the fact that the pgf of the number of arrivals aI
in slot I is not A(z), but rather zA′(z)/α and that P could beany of the aI arrivals with equal probability. In the following,we derive the pgf D(z) of the delay of P by conditioning on the
8

uk
mk
{uI
P{`aI
d
6= a
mI . . . 2 1 s+1 s . . . 1 s+1 s . . . 1
slot I
system state(rI , mI , uI)d= (r, m, u)
finishroundtripin progress
(qz)mI−1
additional retransmissions forservice in progress(
e+eS(z)) uI−1 service times for the packets waiting for their
initial transmission in slot I(S(z)
)uI−1
` service times for the packetsarriving in slot I(
S(z))`
delay d of packet P
P
Figure 5: The delay d of the arbitrary packet P that arrives in slot I with system state (rI , mI , uI).
system state at the beginning of slot I. Specifically, as in Section3, we make the distinction between the cases where the systemis idle in slot I (i.e. mI =0) or busy (mI>0). In both cases, wecan refer to Fig. 5 for a visual representation of the time periodsthat constitute the total delay of P.
Let us first consider the case where P arrives when the queueis idle. This means that the first of the ` packets will immediatelybe transmitted in the next slot. If the service period of the firstpacket is finished, the next of the ` packets is served, withoutinterruption in between, and so forth until finally, the packetP is served. Therefore, we know from the previous Section thatthe pgfs of the length of these ` contiguous services ending inchannel state i′ given that they start in state i (i, i′ = 0, 1) arethe entries of the pgm
DmI=0(z) =∞∑
v=1
S(z)v Prob[`=v] , L(S(z)) , (43)
where the notation L(S(z)) stands for a matrix that is a powerseries in the matrix S(z) with the same coefficients as the powerseries expansion in z of L(z) given by (42). As argued in (41),the probabilities that the queue is empty and in either channelstate during slot I, are given by the vector p in (17). Hence,
E[zd{mI =0}] = pDmI=0(z)1 = pL(S(z))1 . (44)
In Appendix A, we derive the spectral decomposition (73) of thematrix S(z) with eigenvalue functions λ1(z) and λ2(z). Let usagree that the index j is always used to indicate one of the twoeigenvalues (i.e. j=1, 2) and that we may write λj when in fact,we mean λj(z). We find
E[zd{mI =0}] =2∑
j=1
L(λj)pSj(z)1 , (45)
where S1(z) and S2(z) are the so-called spectral projectors ofS(z) that are derived explicitly in Appendix A, see (71), (72).
Secondly, we consider the more complicated case when P ar-rives when the queue is busy serving another packet. Suppose the
system state at the beginning of slot I is (rI ,mI , uI)=(i, h, n).From Fig. 5 it is seen that the pgfs of the delay period endingin channel state i′ given that it starts in state i (i.e. rI = i)(i, i′=0, 1) are the entries of the pgm
DmI>0(h, n, z) = (46)
(qz)h−1 ·(e + eS(z)
)· S(z)n−1 · L(S(z)) ,
where each factor corresponds to a certain part of the delay.The first factor indicates the number of slots needed to finishthe roundtrip period of the packet being served during slot I. Ifthis roundtrip period is finished, either an ACK or NACK wasreturned to the transmitter. In case of an ACK, no channel er-ror occurred (probabilities e) which means the service is finishedand the packet departs from the queue. In case of a NACK, achannel error occurred (probabilities e) and the packet is retrans-mitted such that an additional remaining service time must beaccounted for. Note that the conditional length of this remainingservice time has a distribution that is also given by S(z). Thisexplains the second factor e + eS(z). The third factor is due tothe service times of the uI−1 packets waiting in the queue atthe beginning of slot I but that were not yet transmitted then.Finally, the fourth factor accounts for the packets arriving dur-ing slot I that are transmitted before P and for P itself, similarto (43). Now, for 1<h6s+1 and n>1, let
χ(h, n) ,[Prob[rI =0,mI =h, uI =n] Prob[rI =1,mI =h, uI =n]
],
then by using (46) we find for the distribution of the delay d incase the queue is busy during slot I:
E[zd{mI>0}] =s+1∑h=1
∞∑n=1
χ(h, n)DmI>0(h, n, z)1 (47)
=s+1∑h=1
∞∑n=1
χ(h, n)(qz)h−12∑
j=1
(e+eλj)λn−1j L(λj)Sj(z)1
=2∑
j=1
s+1∑h=1
∞∑n=1
L(λj)[zh−1λn−1
j χ(h, n)[σ σσ σ
](e+eλj)Sj(z)1
9
+ (φz)h−1λn−1j χ(h, n)
[σ −σ−σ σ
](e+eλj)Sj(z)1
].
Note that we have used the spectral decomposition (73) againapplied to DmI>0(h, n, z) in the second line and the represen-tation (31) for qh−1 in the third. From (11) and (17) it is clearthat the pgfs of the entries of χ(h, n) are given by H0(y, z) andH1(y, z) respectively, which were determined in Section 3. Hence,we find for the partial pgf of the delay if the packet P arrives ina busy slot:
E[zd{mI>0}] =2∑
j=1
L(λj)Cj(z)(e + eλj)Sj(z)1 , (48)
where we have used the row vectors Cj(z) defined as
Cj(z) , H(z, λj)[σ σσ σ
]+ H(φz, λj)
[σ −σ−σ σ
]. (49)
The entries C0j(z) and C1j(z) follow from (19) by applying theappropriate substitutions for z and y:
Cij(z)=A(λj)φ−1
λj(z−A(λj))
[((qi + φs+1qi)zs+1di(λj)− φλj
)Ri(λj)
+ qi(1−φs+1)zs+1di(λj)Ri(λj)]
+−zs+1φ−1
λj(z−A(λj))
[(1−A(λj))qi(p0+p1)
+ φs(1−φA(λj))(qipi−qipi)], (50)
in which everything is already known from Sections 2 and 3.After substitution of expression (20) for the functions Ri(z) into(50), we find the more explicit expression
Cij(z) =As+1(λj)−zs+1
φλj(z−A(λj))N(λj)
[qiA
s+1(λj)di(λj)λj(1−φs+1)
·[qi(1−A(λj))(p0+p1)− φs(1−φA(λj))(qipi−qipi)
]+
[N(λj)−As+1(λj)di(λj) (51)
·(di(λj)φs+1φAs+1(λj)− λj(qi+φ
s+1qi))]
·[qi(1−A(λj))(p0+p1) + φs(1−φA(λj))(qipi−qipi)
]].
Finally, we can bring together (45) and (48) to obtain theunconditional pgf D(z) of the packet delay d:
D(z) = E[zd] = E[zd{mI =0}] + E[zd{mI>0}] (52)
=2∑
j=1
L(λj)[p + Cj(z)(e + eλj)
]Sj(z)1 .
This can be simplified further by observing that ei+eiλj is in factdi(λj) and by using the expression (74) for the vector Sj(z)1.We find
D(z) =2∑
j=1
1∑i=0
12L(λj)
[pi + di(λj)Cij(z)
]·[1± (−1)iφ µ(zs+1) + 2eiqi(1−φs+1)
φ√ψ(zs+1)
], (53)
with ± being + if j=1 and − if j=2. To summarise, in (53) onehas to substitute (51) for Cij(z), (70) for the eigenvalue functionsλj(z), (4) for di(z), (69) for µ(z), (68) for ψ(z) and (42) for L(z).
The mass function d(n) = Prob[d= n] can be obtained fromthe pgf D(z) by using a numerical inversion algorithm, as willbe done for the examples in the next Section. Unfortunately,the computational cost of calculating d(n) increases with n suchthat numerical inversion becomes impractical for large n. Never-theless, an elegant and accurate approximation for the tail dis-tribution of the packet delay can be found from the asymptoticanalysis of D(z), for which we refer to Appendix B. As withexpression (25) for the pgf of the queue content, it is possibleto derive the moments of the packet delay from (53) by usingthe moment generating property of pgfs. For example, we haveverified numerically that the mean packet delay E[d] found asD′(1) is exactly equal to U ′(1)/α, with U ′(1) given by (27), asrequired by Little’s theorem [30].
6 Bounds for the probability of anempty queue
The final step in the analysis of Section 3 was the numericalcomputation of the last unknown p0+p1, being the probabilityof having an empty system during equilibrium. Nevertheless, it isnot always necessary to go through these numerical calculations.In the following, we derive a simple upper and lower bound forProb[u=0]= p0+p1. The upper bound corresponds to the caseK=1 of an uncorrelated channel and the lower bound is asymp-totically correct for K→∞, i.e. in case the channel is heavilycorrelated.
6.1 No channel correlation (K =1)
The analysis of the transmitter queue content for Stop-and-WaitARQ with an uncorrelated channel and static error probabilitye is given in [23], where the pgf of the transmitter queue contentin an arbitrary slot during equilibrium is found to be
Ustatic(z) = Ustatic(0)(z−1) e A(z)s+1
z −A(z)s+1(e+ ez). (54)
The probability of an empty queue Ustatic(0) then follows fromthe normalisation condition Ustatic(1)=1 as
Prob[ustatic =0] = Ustatic(0)
= 1− α
ηstatic= 1− αs+1
e, (55)
and the condition (28) for the queue to reach equilibrium is
α < ηstatic =e
s+ 1. (56)
Regarding our model of the transmitter queue with a two-stated channel model, it is not difficult to express the probabilityof an empty queue in the special case that the channel is uncor-related, i.e. in case K = 1 (or φ = 0). Indeed, if we choose thetransition probabilities q0 and q1 in Fig. 2 such that q0+q1 =1or equivalently, K = 1, our model reduces to a simpler modelwith a static channel and the results of [23] can be used. The
10

local
equilibrium
build-up
phase
build-down phase
0 1000 2000 3000 40000
10
20
30
k
Figure 6: Evolution of the content in the transmitter queue in case of compensated stability. A trace over 4000 slots is shown for theparameters s=3, e0 =0.1 and e1 =0.5. The correlation in the channel has parameters σ=0.5 and K =100. The 1-periods (bad channel state)are indicated by a grey background. The bold straight lines indicate the mean excess work Qk.
probability that a packet is transmitted erroneously is then in-dependent from slot to slot and equal to e= σe0+σe1, which is infact equal to ω e 1, the error probabilities in both channel statesweighted with the equilibrium probabilities of those states. Sothe probability of an empty queue follows as
Prob[u=0] = 1− α s+ 11− (σe0+σe1)
= 1− α
η= 1− ρ if K=1 , (57)
where the load ρ of the system was defined in (28).
6.2 Heavy channel correlation (K→∞)
Secondly, we can also investigate the opposite case in which thecorrelation of the channel state from slot to slot is very large, i.e.in which asymptotically K→∞ (or φ→1). From our definitionof K at the end of Section 2 we know that if K gets larger,the channel state switches less and less often, resulting in longer0- and 1-periods of which the mean length increases linearlywith K. Note that if K should really be equal to infinity, theMarkov chain in Fig. 2 is no longer irreducible and the channelwill remain in its initial state forever, such that the channel errorprobability is the same in all slots, either e0 or e1 depending onthe starting conditions. For our purposes, it is useful to considerthese two extreme cases for K = ∞ separately. For instance,suppose the channel state is always i (i= 0, 1), then the errorsin the channel occur independently from slot to slot and alwayswith the same probability ei. If the mean arrival rate is not toohigh, i.e.
α < ηi , ei/(s+1) , (58)
the behaviour of the transmitter queue is the same as in the‘static’ case considered in Section 6.1, only this time with staticerror probability e=ei. After some time, the queue reaches equi-librium and expression (54) for the distribution of the queue con-tent applies as well as (55) for the probability that the queue isempty, both with e=ei.
For a heavily correlated channel (K→∞, but not K=∞), thebasic observation that we make is the following. Strictly speak-ing, if the 0- and 1-periods are not infinitely long, we obviouslyneed to perform the analysis as shown in the previous sectionsof this paper, complete with the numerical procedure to deter-mine Prob[u=0]= p0+p1. However, if the 0- and 1-periods are
very large, we can still reuse the results from the less compli-cated analysis with static errors. Suppose we consider a singlei-period and focus on the behaviour of the queue during thisperiod only, then we see that the queue is governed by the samesystem equations as in the model with static error probabilitye=ei. Moreover, since the i-period is also very long and assum-ing that α<ηi, we can expect that after some transitional phasea local equilibrium sets in. For the remainder of that i-period,the queue then exhibits the same kind of (local) equilibrium be-haviour as if the channel were always in state i. This local equi-librium ends when the channel switches to state i. Then, againafter some transitional phase, a new local equilibrium may setin if α<ηi, and so on.
In the following, we derive an expression for Prob[u=0] whenthe channel is heavily correlated. Without loss of generality, letus assume that e0 < e1 such that η1 < η < η0. Obviously, wealso assume that overall equilibrium can be reached, i.e. thatthe condition (28) is met. Depending on how high the load α/ηof the system is, we can distinguish two cases. In the first case,which we term symmetric stability, local equilibrium can occurduring both 0- and 1-periods. If local equilibrium only can occurduring the 0-periods, then we talk about compensated stability.
Symmetric stability (α < η1 < η < η0):In this case, the mean arrival rate α is low enough such thatboth α < η0 and α < η1. Therefore, we can safely assume thatfor the larger part of both 0- and 1-periods, the queue operatesunder local equilibrium. In fact, since the periods are very long,we can ignore the transitional phases at the beginning of eachperiod and assume that there is local equilibrium during all theslots. Therefore, given that a certain slot belongs to an i-period(i = 0, 1), the probability that the queue is empty during thatslot is given by (55) with e= ei. Since a slot belongs to a 0- or1-period with probabilities σ and σ respectively, we find
Prob[u=0] = σ(1− α
η0) + σ(1− α
η1)
= 1− α(σs+1e0
+ σs+1e1
), if K →∞ . (59)
Compensated stability (η1 < α < η < η0):Here, unlike the previous case, the mean arrival rate is higherthan the maximum throughput η1 during the 1-periods. Obvi-
11
ously, this means there will be no local equilibrium behaviourduring 1-periods, since temporarily more packets are enteringthe queue than can be processed. Instead, as illustrated in Fig.6 for a specific trace of the queue content, the queue will grad-ually build up as the 1-period advances. We can quantify therate at which the queue builds up in a fluid-flow like manner asfollows. The transmitter queue temporarily works under over-load conditions as considered in Section 4 and transmits at themaximum rate of η1 packets per slot. Hence, let us call the build-up rate Rup the average number of excess packets arriving per1-slot, then we have
Rup = α− η1 = α− e1s+1
,
i.e. the mean number of packets that enter the queue minus themean number of packets that leave the queue per 1-slot. Thelonger the 1-periods are, the longer the queue builds up at thisrate and the higher the observed queue sizes will be. Of course,the queue cannot grow indefinitely, since we know that overallstability is assured by (28). Therefore, the build-up during the 1-periods must be compensated for somehow during the 0-periods.Indeed, still reasoning in fluid-flow, there will be a phase at thestart of each 0-period during which the queue keeps transmittingat its maximum output rate as it did during the preceding 1-period. However, this output rate is now increased to η0 insteadof η1 packets per slot such that the excess amount of work builtup during the 1-periods can now gradually leave the queue. Ifthe 0-period extends long enough, all the excess work will begone at a certain point and (after a transitional phase) the localequilibrium sets in again. The rate Rdown at which the queue isemptied at the beginning of the 0-periods is
Rdown = η0 − α =e0s+1
− α ,
i.e. the maximum output rate during 0-periods minus the meanarrival rate. Incidentally, observe that the overall equilibriumcondition (28) is equivalent to
α < η = ση0 + ση1 ⇔ σ(α− η1
)< σ
(η0 − α
)⇔ σ Rup < σ Rdown ,
which states that on average, the excess work built up in thequeue during 1-periods can always be compensated for duringthe 0-periods. Let the mean excess work Qk be defined as theexpected amount of excess packets present in the queue at thebeginning of slot k due to the build-up and build-down mecha-nism, then we have, assuming that Q0 =0,
Qk+1 =
{Qk +Rup if rk+1 =1 ;max(Qk −Rdown, 0) if rk+1 =0 .
(60)
In Fig. 6, during the build-up phases, which coincide with the 1-periods, the mean excess work Qk has positive slope Rup, whileduring the build-down phases, Qk has negative slope −Rdown.In between these phases, where Qk = 0, are the parts of the0-periods where local equilibrium occurs.
Before we calculate the probability of an empty queue in caseof compensated stability with K →∞, we make the followingassumptions:
• First, observe that we can neglect the possibility that thequeue becomes empty during the 1-periods when the queueis in a build-up phase. Likewise, we also ignore this possibil-ity when the queue is building down during the 0-periods.In other words, as a first approximation, we assume thatobserving an empty queue when the mean excess work Qk
is non-zero, is a very rare event which can be ignored. Notethat in Fig. 6, this event occasionally occurs, but much lessfrequently than during the periods in which Qk =0. Also, itis seen that although the queue can be empty when Qk>0,this is only likely to happen when Qk is relatively small.Obviously, when K grows larger, the build-up phases willalso be longer, such that on the whole, there will be lessand less slots in which small non-zero values of Qk occur.Therefore, this approximation gains accuracy as K→∞.
• Secondly, we assume that in the periods during whichQk = 0, the queue is in local equilibrium, i.e. we ignorethe transitional phases in the same way as we did in thecase of symmetric stability.
The probability Prob[u=0] can now be obtained as follows. Con-sider N pairs of consecutive 0- and 1-periods, with N large. Asthe mean lengths of 0- and 1-periods are K/σ and K/σ respec-tively, these N pairs take up a total of NK(σ−1+σ−1) slots. Letχ be the fraction of slots in which Qk =0, i.e. in which the meanexcess work is not building up or down and where we assumethe system is in local equilibrium. The number of build-up slotsis given by NK/σ, being the number of 1-slots. Since it takesRup/Rdown 0-slots to compensate for the excess work built upper 1-slot, we find for the ratio χ:
χ =# total slots−# build-up slots−# build-down slots
# total slots
=NK(
1σ
+1σ
)−NK 1σ−NK 1
σ
Rup
Rdown
NK(1σ
+1σ
)
= . . . = σ − σ Rup
Rdown. (61)
During the slots in which the queue is in local equilibrium, theprobability of having an empty queue is given by (55) with e=e0.Therefore, the probability of observing an empty queue finallyfollows as
Prob[u=0] = χ(1− α
η0)
=(σ − σ (s+1)α− e1
e0 − (s+1)α
)(1− αs+1
e0
)(62)
=1e0
(σe0 + σe1 − (s+1)α
), if K →∞ .
Note that both (59) and (62) are linear functions of the meanarrival rate α and that the expressions agree when α = η1. Tosummarise, the probability that the queue is empty in case of aheavily correlated channel with error probabilities e0<e1 is
Prob[u=0] =
1− ρ(σe0+σe1)
( σe0
+σ
e1
)if ρ <
η1η,
(1− ρ) σe0+σe1e0
if ρ >η1η,
(63)
12
symmetricstability
compensatedstability
nostability
0
0.2
0.4
0.6
0.8
1
η0/η1η1/η0
Pro
b[u
=0]
ρ
K=1
K→∞
0 1 2 3 4 5
log10K
s=3
s=15s=63
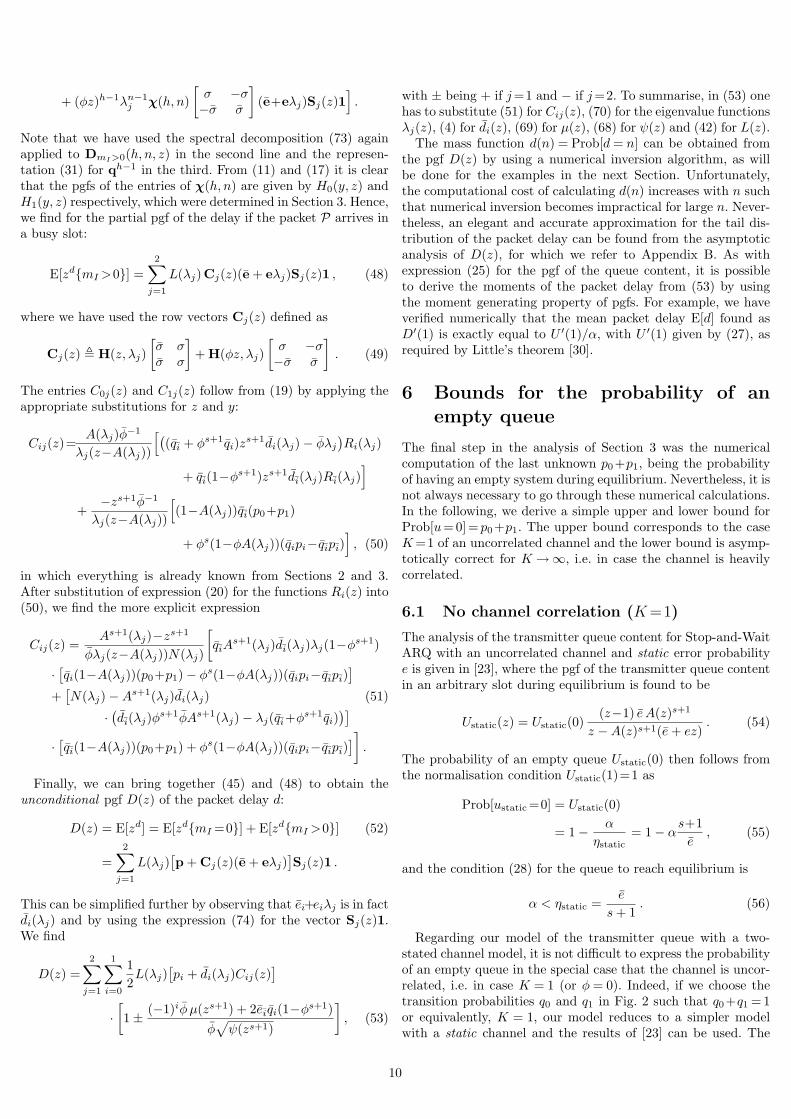
1←K
K→∞
Figure 7: On the left, we show Prob[u = 0] as a function of the load ρ = α/η both for K = 1 (solid line) and K→∞ (dashed line) in casee0 =0.1, e1 =0.7, σ =0.5 and the arrivals per slot are geometrically distributed. For three different values of the load ρ=0.25, 0.5, 0.75, thedependency of the actual probability of an empty queue on the precise value of K is shown in the right plot. Here, K varies from 1 to 105
on a logarithmic scale and three different values of the feedback delay s were considered.
where we have rewritten (59) and (62) as a function of the load ρinstead of the mean arrival rate α, such that the parameter s nolonger appears in the expressions. If the load crosses the thresh-old value η1/η, the system switches from symmetric stability tocompensated stability.
6.3 Upper and lower bound
In the following, let us only consider positively correlated chan-nels, i.e. with K > 1 or equivalently, 0 < φ < 1, which is mostoften the case in practice. Considering a large set of numericalexamples, we found that for K ranging from 1 to∞ and keepingall other parameters constant, expression (57) is an upper boundfor the probability Prob[u = 0] = p0 +p1 as obtained from thenumerical procedure in Section 3.3. Conversely, expression (63)is a lower bound. In other words, for Stop-and-Wait ARQ over apositively correlated Gilbert-Elliot channel, the probability thatthe transmitter queue is empty is always lower than in case ofequivalent operation over an uncorrelated channel (with K=1),but higher than when operating over a heavily correlated channel(with K→∞).
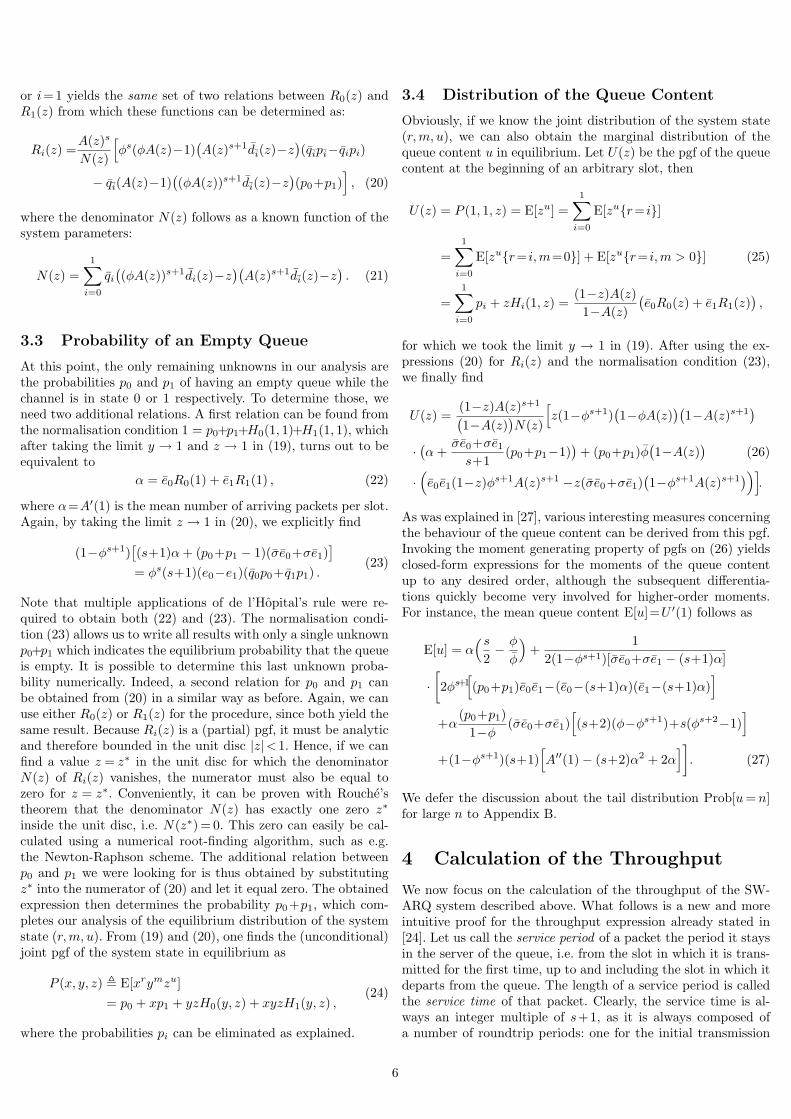
This conclusion is substantiated by the following numericalexample. In the first plot of Fig. 7, we show the probability ofan empty queue versus the system load ρ = α/η, both in casethe channel is uncorrelated (K = 1, solid line) and in case itis heavily correlated (K → ∞, dashed line), as was discussedin Sections 6.1 and 6.2 respectively. The other parameters ofthe channel model were chosen to be e0 = 0.1, e1 = 0.7 andσ = 0.5. The variation of ρ along the abscissa is due only tochanging the mean arrival rate α. As is clear from (57) and(63), both curves are (piecewise) linear in ρ. In this plot, wealso indicated the regions of stability. For a load ρ lower thanthe threshold η1/η = 0.5, the queue operates under symmetricstability, whereas if the load exceeds this threshold, it operatesunder compensated stability. Obviously, if ρ> 1, the queue canno longer reach long-term stability. For three specific values ofthe load, we show the dependency of Prob[u= 0] on the valueof K in the second plot of Fig. 7. In each case, this probabilityis plotted for feedback delays s = 3, 15, 63 and for K rangingfrom 1 to 105 on a logarithmic scale. We observe that the curvesdo indeed stay between the bounds set by the values obtained
σ=0.1
01e00
1 e10
0.5
1
σ=0.5
01e00
1 e10
0.5
1
σ=0.9
01e00
1 e10
0.5
1
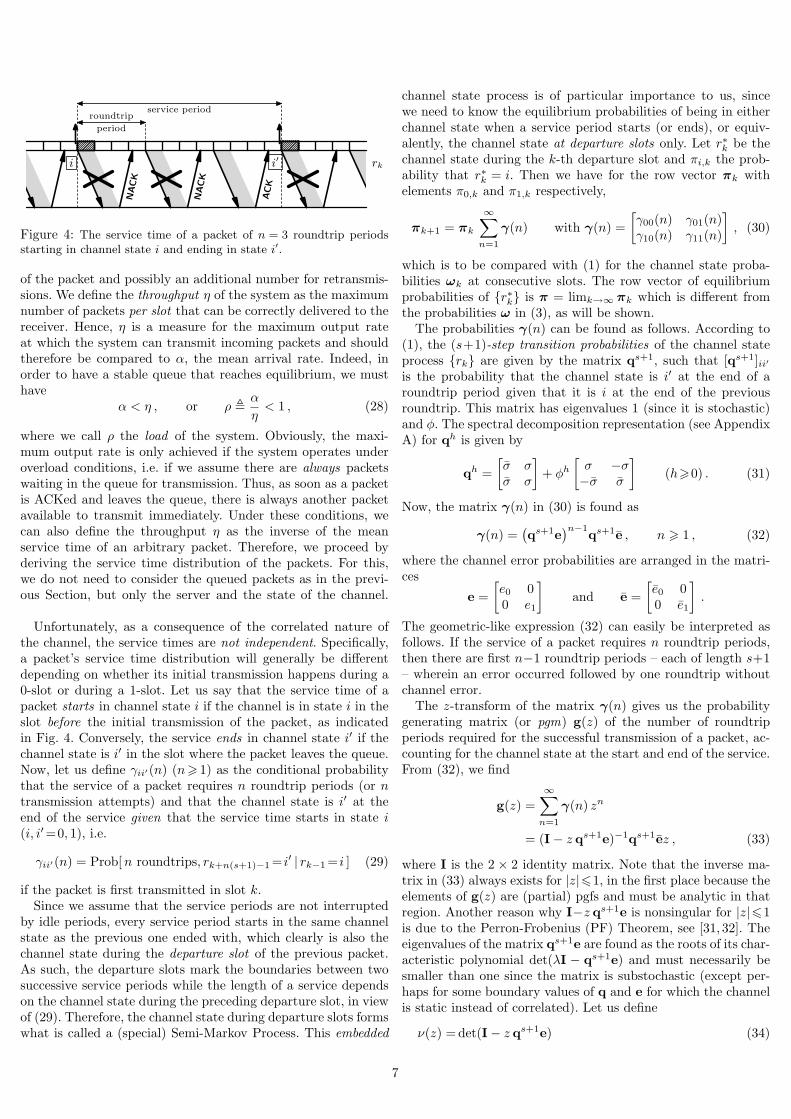
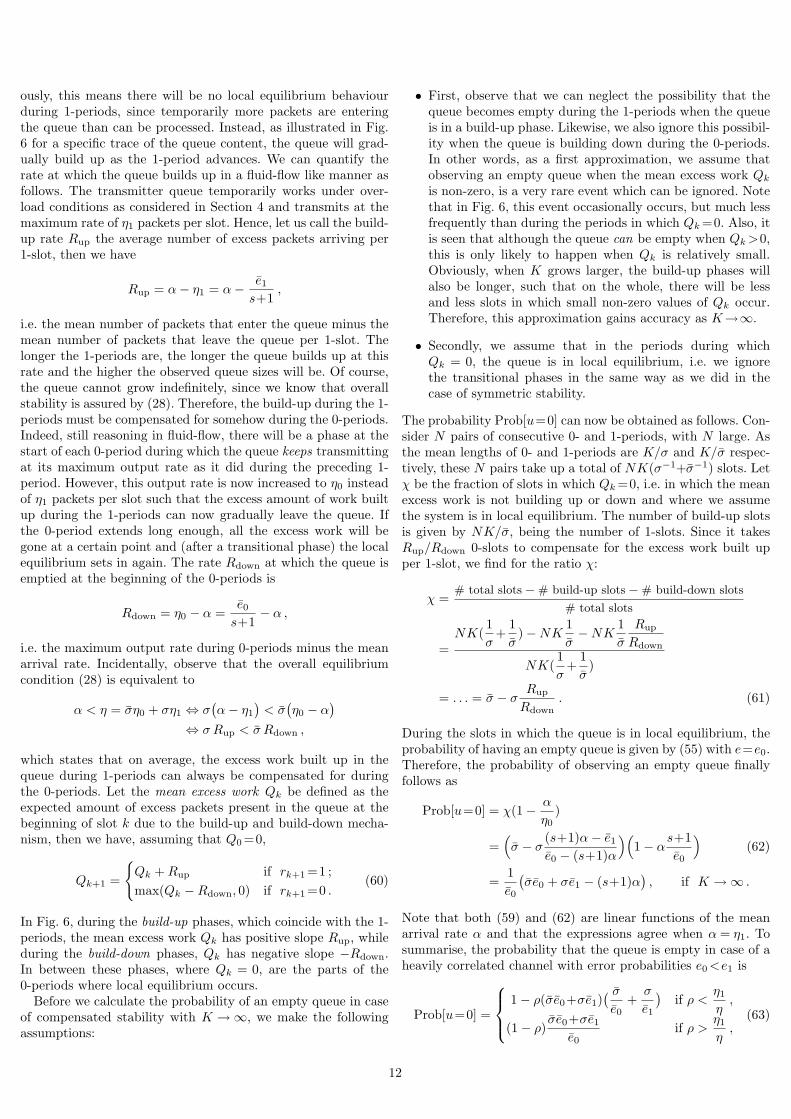
Figure 8: Worst-case difference between the upper and lower boundfor Prob[u=0] as a function of the error probabilities 0<e0 <e1 <1,in case of σ=0.1, 0.5, 0.9 respectively.
in the uncorrelated and heavily correlated cases respectively. Infact, the probability gradually decreases in a monotonous wayfrom the upper bound for K=1 to the lower bound for K→∞,whereby the value of s acts as a kind of scaling parameter.
The question is now, is there any indication of how close theupper and lower bound lie together? If the bounds are close, theyprovide a good estimate for the important quantity Prob[u=0]such that the numerical computation of this probability mayno longer be required. As can be seen from Fig. 7 the boundsare furthest apart when the load is equal to the threshold valueη1/η, so the difference in that point between the upper and lowerbound yields a worst-case measure for the distance between thebounds. Taking the difference of (57) and (63) evaluated for ρ=η1/η, we find
worst-case difference = σσ(e1 − e0)2
e0(σe0+σe1). (64)
In Fig. 8 this measure is plotted versus the error probabilitiese0 < e1 and for σ = 0.1, 0.5, 0.9. It is maximally σ in case e1 =1 and becomes very small as the error probabilities are closertogether. Note that for values of the load 0< ρ< 1 other thanthe threshold value η1/η the difference between upper and lowerbound will even be smaller than this worst-case measure.
7 Numerical Examples
In order to illustrate how the equilibrium behaviour of the queueis influenced by the parameters of the model, we now considersome practical examples. We focus mainly on the distribution ofthe packet delay d as we can refer to [27] for examples regarding
13
0.30.5
0.7
0.9
0.95
0 20 40 60 80 100 120−5
−4
−3
−2
−1
n
log
Pro
b[d
=n]
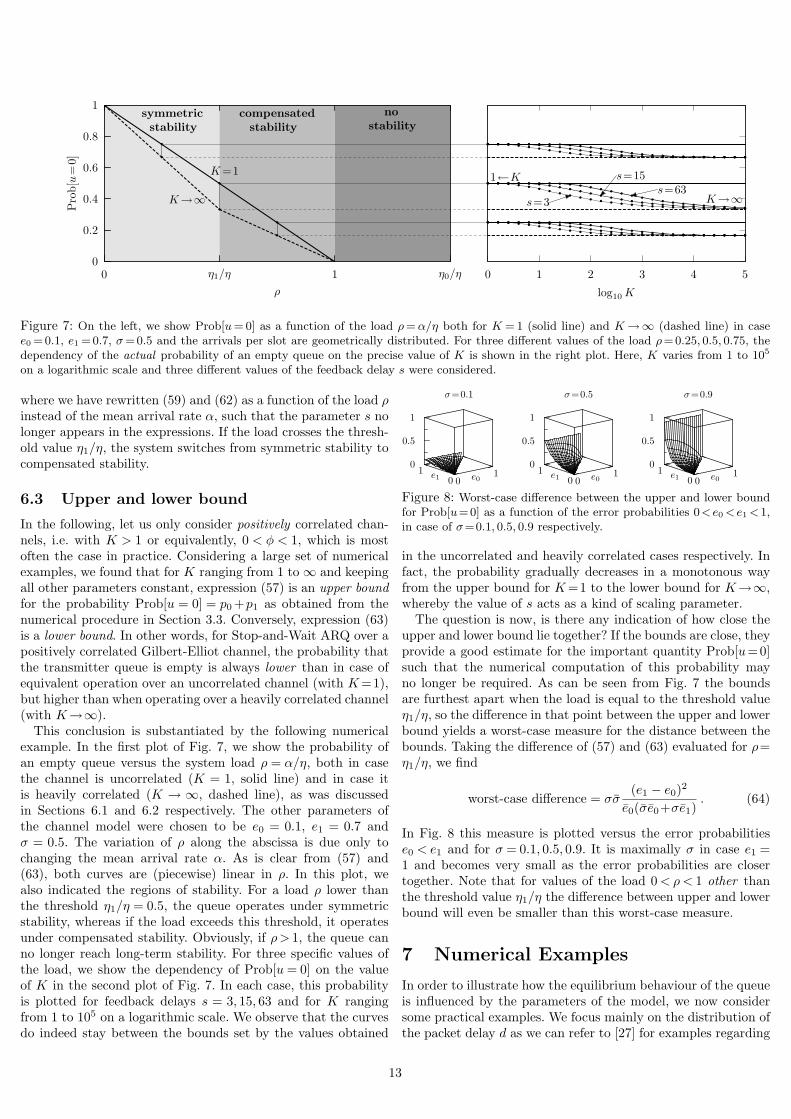
Figure 9: Logarithmic plot of Prob[d = n] versus n in case e0 = 0.1,e1 = 0.5, σ = 0.5 and K = 10 for the channel model, feedback delays = 3 and arrivals with geometric distribution, for various values ofthe load ρ=0.3, 0.5, 0.7, 0.9, 0.95.
s=1
s=3
s=7
s=15
0 100 200 300−5
−4
−3
−2
−1
n
log
Pro
b[d
=n]
Figure 10: Logarithmic plot of Prob[d=n] versus n in case e0 =0.1,e1 =0.5, σ=0.5 and K =10 for the channel and Poisson arrivals withload ρ=0.9, for various values of the feedback delay s=1, 3, 7, 15.
the queue content u. The Figs. 9 to 13 are plots of the massfunction d(n) of the packet delay. These probabilities were ob-tained by numerical inversion of the pgf D(z) given by (53) usingthe algorithm presented in [34]. For a random variable with pgfF (z), the inversion formula for z-transforms is
f(n) =1
2π
∮Cr
F (z)z−n−1dz , (65)
where is the complex imaginary unit√−1 and Cr is a circular
contour around the origin with radius 0<r<1. In [34], this inte-gral is approximated by sampling the integrand on 2n points ofthe contour Cr. Using the discrete Poisson summation formula,the error bound for this approximation is shown to be r2n forlarge n and small r, such that any desired accuracy is guaranteedby choosing r sufficiently small.
In Fig. 9 we show a logarithmic plot of the mass function d(n)for increasing values of the load ρ=α/η. The fraction of slots ineither channel state is the same (σ=0.5), the correlation factorK=10 and the error probabilities in the GOOD and BAD state
K=10
K=100
Mixed geometricGeometric
PoissonBernoulli
0 100 200 300−4
−3
−2
−1
n
log
Pro
b[d
=n]
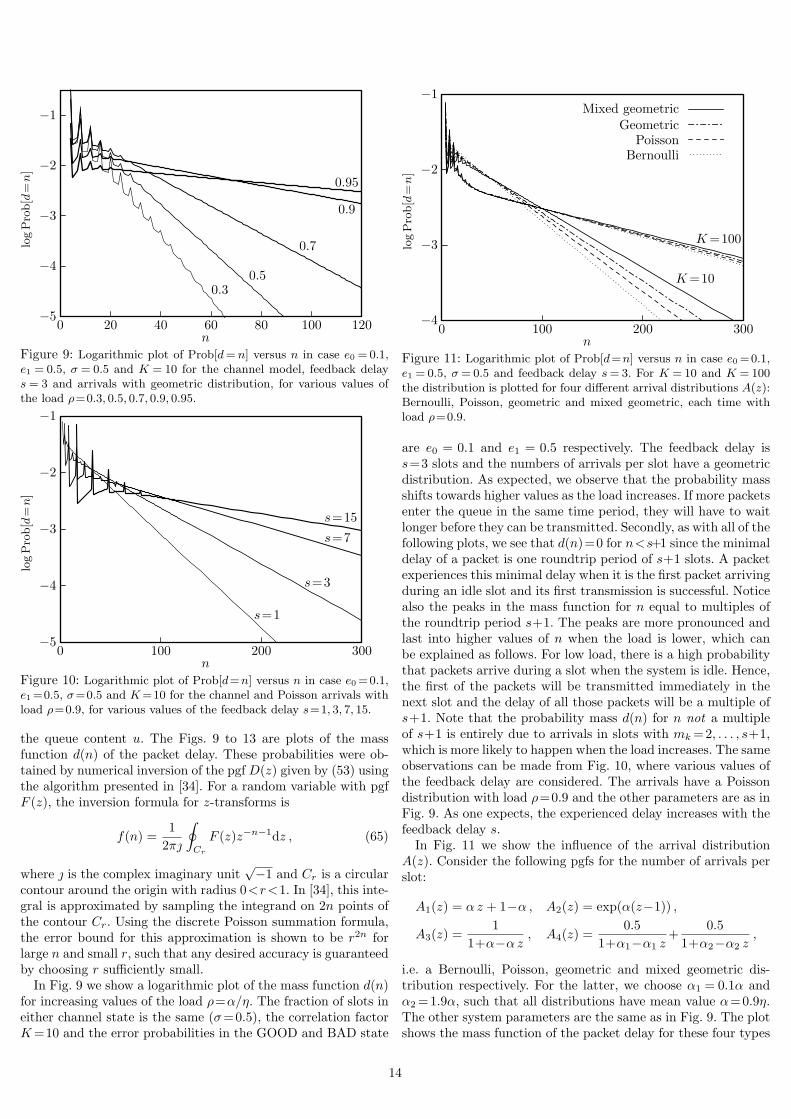
Figure 11: Logarithmic plot of Prob[d=n] versus n in case e0 =0.1,e1 = 0.5, σ = 0.5 and feedback delay s = 3. For K = 10 and K = 100the distribution is plotted for four different arrival distributions A(z):Bernoulli, Poisson, geometric and mixed geometric, each time withload ρ=0.9.
are e0 = 0.1 and e1 = 0.5 respectively. The feedback delay iss=3 slots and the numbers of arrivals per slot have a geometricdistribution. As expected, we observe that the probability massshifts towards higher values as the load increases. If more packetsenter the queue in the same time period, they will have to waitlonger before they can be transmitted. Secondly, as with all of thefollowing plots, we see that d(n)=0 for n<s+1 since the minimaldelay of a packet is one roundtrip period of s+1 slots. A packetexperiences this minimal delay when it is the first packet arrivingduring an idle slot and its first transmission is successful. Noticealso the peaks in the mass function for n equal to multiples ofthe roundtrip period s+1. The peaks are more pronounced andlast into higher values of n when the load is lower, which canbe explained as follows. For low load, there is a high probabilitythat packets arrive during a slot when the system is idle. Hence,the first of the packets will be transmitted immediately in thenext slot and the delay of all those packets will be a multiple ofs+1. Note that the probability mass d(n) for n not a multipleof s+1 is entirely due to arrivals in slots with mk =2, . . . , s+1,which is more likely to happen when the load increases. The sameobservations can be made from Fig. 10, where various values ofthe feedback delay are considered. The arrivals have a Poissondistribution with load ρ=0.9 and the other parameters are as inFig. 9. As one expects, the experienced delay increases with thefeedback delay s.
In Fig. 11 we show the influence of the arrival distributionA(z). Consider the following pgfs for the number of arrivals perslot:
A1(z) = α z + 1−α , A2(z) = exp(α(z−1)) ,
A3(z) =1
1+α−α z, A4(z) =
0.51+α1−α1 z
+0.5
1+α2−α2 z,
i.e. a Bernoulli, Poisson, geometric and mixed geometric dis-tribution respectively. For the latter, we choose α1 = 0.1α andα2 =1.9α, such that all distributions have mean value α=0.9η.The other system parameters are the same as in Fig. 9. The plotshows the mass function of the packet delay for these four types
14
0 0.25 0.5 0.751
0 50 100 150 200−3
−2.5
−2
−1.5
−1
n
log
Pro
b[d
=n]
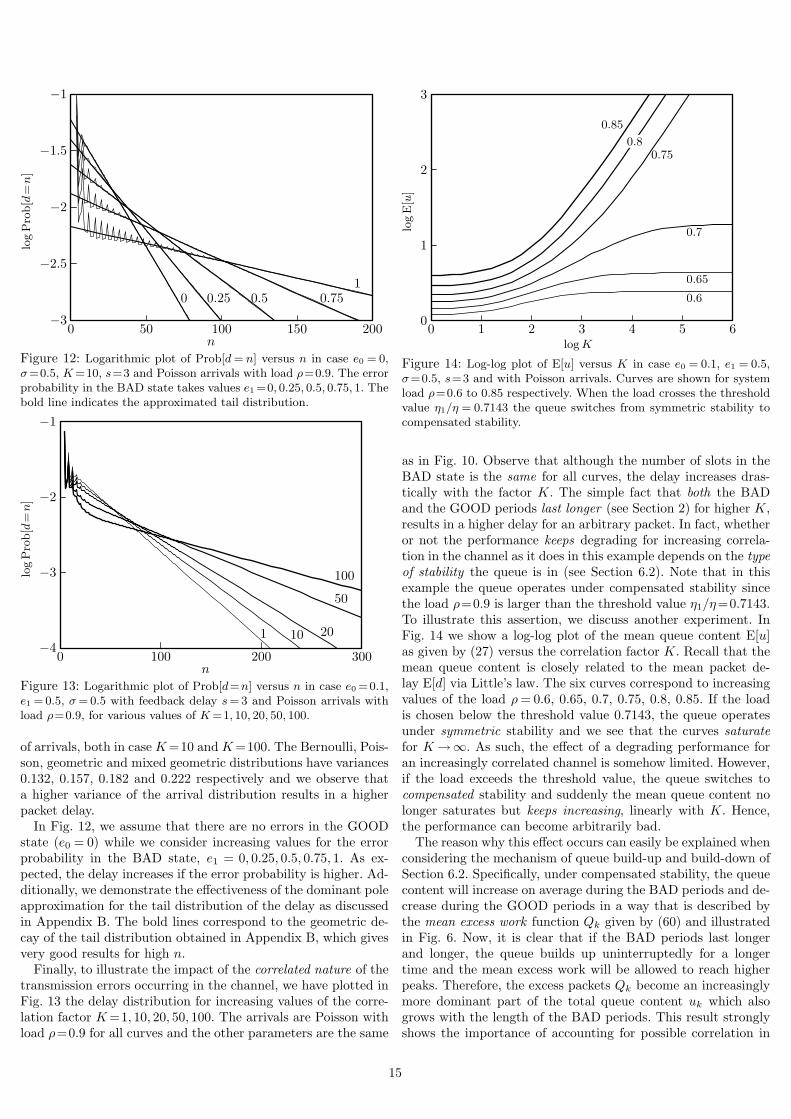
Figure 12: Logarithmic plot of Prob[d = n] versus n in case e0 = 0,σ=0.5, K =10, s=3 and Poisson arrivals with load ρ=0.9. The errorprobability in the BAD state takes values e1 =0, 0.25, 0.5, 0.75, 1. Thebold line indicates the approximated tail distribution.
1 10 20
50
100
0 100 200 300−4
−3
−2
−1
n
log
Pro
b[d
=n]
Figure 13: Logarithmic plot of Prob[d=n] versus n in case e0 =0.1,e1 = 0.5, σ = 0.5 with feedback delay s = 3 and Poisson arrivals withload ρ=0.9, for various values of K =1, 10, 20, 50, 100.
of arrivals, both in case K=10 and K=100. The Bernoulli, Pois-son, geometric and mixed geometric distributions have variances0.132, 0.157, 0.182 and 0.222 respectively and we observe thata higher variance of the arrival distribution results in a higherpacket delay.
In Fig. 12, we assume that there are no errors in the GOODstate (e0 = 0) while we consider increasing values for the errorprobability in the BAD state, e1 = 0, 0.25, 0.5, 0.75, 1. As ex-pected, the delay increases if the error probability is higher. Ad-ditionally, we demonstrate the effectiveness of the dominant poleapproximation for the tail distribution of the delay as discussedin Appendix B. The bold lines correspond to the geometric de-cay of the tail distribution obtained in Appendix B, which givesvery good results for high n.
Finally, to illustrate the impact of the correlated nature of thetransmission errors occurring in the channel, we have plotted inFig. 13 the delay distribution for increasing values of the corre-lation factor K=1, 10, 20, 50, 100. The arrivals are Poisson withload ρ=0.9 for all curves and the other parameters are the same
0.6
0.65
0.7
0.750.8
0.85
0 1 2 3 4 5 60
1
2
3
log K
log
E[u
]
Figure 14: Log-log plot of E[u] versus K in case e0 = 0.1, e1 = 0.5,σ=0.5, s=3 and with Poisson arrivals. Curves are shown for systemload ρ=0.6 to 0.85 respectively. When the load crosses the thresholdvalue η1/η = 0.7143 the queue switches from symmetric stability tocompensated stability.
as in Fig. 10. Observe that although the number of slots in theBAD state is the same for all curves, the delay increases dras-tically with the factor K. The simple fact that both the BADand the GOOD periods last longer (see Section 2) for higher K,results in a higher delay for an arbitrary packet. In fact, whetheror not the performance keeps degrading for increasing correla-tion in the channel as it does in this example depends on the typeof stability the queue is in (see Section 6.2). Note that in thisexample the queue operates under compensated stability sincethe load ρ=0.9 is larger than the threshold value η1/η=0.7143.To illustrate this assertion, we discuss another experiment. InFig. 14 we show a log-log plot of the mean queue content E[u]as given by (27) versus the correlation factor K. Recall that themean queue content is closely related to the mean packet de-lay E[d] via Little’s law. The six curves correspond to increasingvalues of the load ρ= 0.6, 0.65, 0.7, 0.75, 0.8, 0.85. If the loadis chosen below the threshold value 0.7143, the queue operatesunder symmetric stability and we see that the curves saturatefor K→∞. As such, the effect of a degrading performance foran increasingly correlated channel is somehow limited. However,if the load exceeds the threshold value, the queue switches tocompensated stability and suddenly the mean queue content nolonger saturates but keeps increasing, linearly with K. Hence,the performance can become arbitrarily bad.
The reason why this effect occurs can easily be explained whenconsidering the mechanism of queue build-up and build-down ofSection 6.2. Specifically, under compensated stability, the queuecontent will increase on average during the BAD periods and de-crease during the GOOD periods in a way that is described bythe mean excess work function Qk given by (60) and illustratedin Fig. 6. Now, it is clear that if the BAD periods last longerand longer, the queue builds up uninterruptedly for a longertime and the mean excess work will be allowed to reach higherpeaks. Therefore, the excess packets Qk become an increasinglymore dominant part of the total queue content uk which alsogrows with the length of the BAD periods. This result stronglyshows the importance of accounting for possible correlation in
15
the transmission channel when predicting the queueing perfor-mance. Indeed, as we have shown, both queue content and packetdelay may be severely underestimated when assuming only staticerrors.
8 Conclusion
We have analysed the transmitter queue of the SW-ARQ proto-col in case of a two-state Markovian error channel. Closed-formexpressions were derived for the pgf of the equilibrium distri-bution of the system state and the queue content as well as themaximum throughput. By using the eigenvalues and the spectraldecomposition of the matrix with the conditional lengths of theservice time, we obtained the pgf of the delay experienced by anarbitrary packet. Additionally, we established a useful lower andupper bound on the probability that the queue is empty, therebydistinguishing between operation under symmetric and compen-sated stability. For the queue content as well as the packet delay,we also gave an accurate approximation for the tail distributionand found that for the latter, the asymptotic contribution of thesecond eigenvalue function is zero. Finally, by means of some ex-amples we have discussed the influence of the model parameterson the queue performance. The most important observation isthat, at least when operating under compensated stability, theperformance worsens drastically as the correlation in the chan-nel is higher (i.e. if K increases), although the overall fraction ofBAD slots remains the same. This result emphasizes the impor-tance of taking into account the correlation of the errors whendimensioning the buffer space or calculating the packet loss.
A Spectral Decomposition of S(z)
For the analysis of the delay in Section 5, we need a suitablerepresentation for a function f of the pgm S(z). The followingspectral decomposition theorem allows us to determine f(S(z))by evaluating f for scalars rather than matrices and can be foundin any textbook on matrix algebra (such as e.g. [31, 32]).
A square N × N matrix A is diagonalisable if there exists asimilarity transform P such that P−1AP=D, with D a diagonalmatrix with entries taken from the spectrum σ(A) of A. Thespectrum σ(A) = {λ1, . . . , λk} (k6N) is the set of eigenvaluesof A. Let f(z) be a function that is defined on σ(A), then thereexist matrices Gj (16j6k) such that
f(A) = f(λ1)G1 + f(λ2)G2 + . . .+ f(λk)Gk .
The matrices Gj are called the constituents or spectral projec-tors of A belonging to the eigenvalue λj and have the followingproperties:• Gj is idempotent, i.e. G2
j =Gj .
• G1 +G2 + . . .+Gk = I, with I the N ×N identity matrix.
• GjGj′ = 0 whenever j 6= j′ (16j, j′6k).The projectors Gi can be obtained by using the Lagrange
interpolation formula on σ(A):
Gj =k∏
j′=1,j′ 6=j
(A− λj′I)
/k∏
j′=1,j′ 6=j
(λj − λj′) . (66)
The extension of this theorem to non-diagonalisable matrices Aalso exists but is slightly more complicated.
We can use the above to obtain the spectral decomposition ofthe pgm g(z) given by (35). First, let us denote the two eigen-values of g(z) as λ∗1(z) and λ∗2(z) respectively, which are thesolutions of the characteristic equation det(λI−g(z))=0 equiv-alent to
λ2ν(z) + λz[zφs+1(e0e1+e0e1)−e0(σ+φs+1σ)−e1(σ + φs+1σ)]
+ z2e0e1φs+1 = 0 . (67)
Let zψ(z) be the discriminant of this ordinary square root equa-tion in λ, i.e.
ψ(z) , µ2(z) + 4e0e1σσ(1−φs+1)2 , (68)
with
µ(z) , e0(σ+φs+1σ)−e1(σ+φs+1σ)−z (e1−e0)φs+1 . (69)
As in Section 5, we agree that the index j is always either 1 or2. Solving the characteristic equation then yields the eigenvaluefunctions
λ∗j (z) =z
2ν(z)
[e0(σ+φs+1σ) + e1(σ+φs+1σ)
− z φs+1(e0e1+e0e1)±√ψ(z)
],
(70)
where ± means + for j=1 and − for j=2. It can be verified thatif |z|< 1, the eigenvalue functions λ∗j (z) are situated inside theunit disc too. Therefore, in case f(z) is a pgf and thus analytic for|z|< 1, the spectral decomposition is always well defined. Also,we have that |λ∗1(z)| > |λ∗2(z)|, i.e. λ∗1(z) is the ‘larger’ of thetwo eigenvalue functions and yields the PF-eigenvalue λ∗1(1)=1of the stochastic matrix g(1) with eigenvector π as given by(37). However, although λ∗1(1)=1, the function λ∗1(z) is in gen-eral not a pgf, since its singularities with smallest modulus arenot real, as would be required by Pringsheim’s theorem (a.k.a.Vivanti’s theorem, see [33]). These singularities are the branchpoints given by the two (complex conjugate) roots of ψ(z). Thespectral projectors Gj of g(z) are found from (66) and (70) as
Gj(z) = ± 12√ψ(z)
·[µ(z)±
√ψ(z) 2e1σ(1−φs+1)
2e0σ(1−φs+1) −µ(z)±√ψ(z)
], (71)
with the same convention for ± as before. Since S(z)=g(zs+1),we now also have the spectral decomposition of S(z), with eigen-values λj(z) and spectral projectors Sj(z) given as
λj(z) = λ∗j (zs+1) , Sj(z) = Gj(zs+1). (72)
Hence, we can write for the pgm S(z):
f(S(z)) = f(λ1(z))S1(z) + f(λ2(z))S2(z). (73)
From (71) and (72) one also finds for the projectors Sj(z) post-multiplied by 1:
Sj(z)1 =121± 1
2√ψ(zs+1)
[µ(zs+1) + 2e1σ(1−φs+1)−µ(zs+1) + 2e0σ(1−φs+1)
]. (74)
We prove the following properties regarding the eigenvalue func-tions:
16
Prop. 1: The function λ1(z) is related to the throughput as
λ′1(1) = η−1 . (75)
This follows directly from (70), (72) and (39). �
Prop. 2: For j=1, 2, and the function N(z) given by (21):
z−A(λj(z))=0 ⇒ N(λj(z))=0 . (76)
The eigenvalues λj(z) are functions for which the charac-teristic polynomial det(λj(z)I−S(z)), given by (67) with alloccurrences of z replaced by zs+1, is zero. Now, substitutionof λj(z) into (21) yields an expression for N(λj(z)) whichafter some careful rearranging of the terms and substitu-tion of A(λj(z)) = z reduces exactly to the characteristicpolynomial of S(z) in λj(z). Hence, N(λj(z))=0. �
B Asymptotic Analysis of Queue Con-tent and Delay Distribution
We now use the pgfs U(z) and D(z) to assess the asymptoticbehaviour of the queue content and delay distribution, i.e. themass functions u(n) and d(n) for large n.
Let us consider a discrete random variable f with pgf F (z).We use a well-known approximation technique (see e.g. [29]) toobtain the mass function f(n) based on the dominant singu-larity of F (z). Applying the principle of analytic continuationand Cauchy’s theorem, it is possible to extend the contour Cr
in (65) to contain the whole complex plane (r → ∞) except forthe singularities of the integrand. Instead of one contour aroundthe origin, there is now a big contour around the z-plane and anumber of small contours around the singularities of F (z)z−n−1
other than the origin. For large n, the contribution to f(n) ofthe contour around the singularities with smallest modulus willdominate the contributions of the other contours. Note that sinceF (z) is analytic within the unit disc, all these singularities havea modulus larger than 1. Both in the case of U(z) and D(z), thedominant singularity is a single pole, which must necessarily bereal and positive in order to ensure a nonnegative mass function.Now, with F (z) having a dominant pole zf of multiplicity one,it follows from the partial fractions expansion of F (z) around zf
that the (dominant) contribution to f(n) of the contour aroundzf can be expressed by the following geometric form:
Prob[f=n] ∼= −θf z−n−1f , (77)
where θf is the residue of F (z) in the point z=zf , i.e.
θf = ReszfF (z) = lim
z→zf
(z−zf )F (z) . (78)
In the examples of Section 7 we have plotted the probabilitiesProb[f = n] on a logarithmic scale, which produces a straightline when n is large as can be seen from (77):
log Prob[f=n] ∼= log−θf
zf+ n log
1zf. (79)
The slope of this line is determined by z−1f which is the ge-
ometric decay rate of the tail. Both the queue content and thepacket delay distribution exhibit this geometrically decaying tailbehaviour. All that remains is to determine the values of zu, θu,zd and θd.
B.1 Queue content tail distribution
We now determine the dominant pole zu and the residue θu fromthe queue content distribution U(z). It is seen from (26) that thedominant pole zu is given by the smallest zero larger than oneof the factor N(z). Hence, zu satisfies
N(zu) = 0 , (80)
and can be determined numerically by using e.g. the Newton-Raphson method. To calculate the residue θu of U(z) in thepoint z = zu, we use the expression for U(z) found in (25) andexpression (20) for Ri(z). Using de l’Hopital’s rule, this yields
θu = ReszuU(z) = lim
z→zu
(z − zu)U(z)
=(1−zu)A(zu)s+1
(1−A(zu))N ′(zu)(81)
·1∑
i=0
ei
[φs(φA(zu)−1)
(A(zu)s+1di(zu)−zu
)(qipi−qipi)
− qi(A(zu)−1)((φA(zu))s+1di(zu)−zu
)(p0+p1)
].
B.2 Delay tail distribution
After close inspection of the factors in (53), we found that thedominant pole zd of D(z) is always the smallest zero larger thanone of the factor z−A(λ1(z)) in the denominator of the functionsCi1(z) given by (50). It can be shown that the other poles allhave a larger modulus. Again, the value of zd must be obtainednumerically. From (76) we observe that zd is also a zero of thedenominator N(λ1(z)) of the functions Ri(λ1(z)) (see (20)) inCi1(z), i.e.
N(λ1(zd)) = 0 . (82)
This would lead us to believe that zd is a pole of Ci1(z) withmultiplicity 2. However, after elimination of the functions Ri(z)it becomes clear in (51) that the numerator is also zero for z=zd
due to the factor As+1(λ1(z))−zs+1. The concerning factors innumerator and denominator annihilate for z → zd (again usingde l’Hopital’s rule) as
limz→zd
As+1(λ1(z))−zs+1
z −A(λj(z))= −(s+1)zs
d , (83)
and zd proves to be a pole with single multiplicity due to thefactor N(λ1(z)) in the denominator of Ci1(z).
For convenience, let us define
yd , λ1(zd) and y′d , λ′1(zd) , (84)
then, we have from (53):
θd = ReszdD(z) = lim
z→zd
(z − zd)D(z)
=1∑
i=0
12L(yd)di(yd)Reszd
Ci1(z)
·[1 +
(−1)iφ µ(zs+1d ) + 2eiqi(1−φs+1)
φ√ψ(zs+1
d )
], (85)
17

where the residues of Ci1(z) in zd follow from (51) as
ReszdCi1(z) =
(s+1)z2s+1d
φN ′(yd)y′dyd
[qidi(yd)yd(1−φs+1) (86)
·[− qi(1−zd)(p0+p1) + φs(1−φzd)(qipi−qipi)
]+ di(yd)
(di(yd)φs+1φzs+1
d − (qi+φs+1qi)yd
)·[qi(1−zd)(p0+p1) + φs(1−φzd)(qipi−qipi)
]].
Note that the second eigenvalue function λ2(z) has no contribu-tion to the tail distribution d(n). Finally, from (80) and (82) wefind the following interesting relation between the decay ratesz−1u and z−1
d of the queue content distribution and the delaydistribution:
zu = λ1(zd) . (87)
Acknowledgements
This work has been supported by the Interuniversity AttractionPoles Programme – Belgian Science Policy.
References
[1] E.N. Gilbert, Capacity of a Burst-noise Channel, Bell Sys-tems Technical Journal, Vol. 39, No. 9, 1960, pp. 1253–1265.
[2] E.O. Elliott, Estimates of Error Rates for Codes on Burst-Noise Channels, Bell Systems Technical Journal, Vol. 42,No. 9, 1963, pp. 1977–1997.
[3] B. Sklar, Rayleigh Fading Channels in Mobile Digital Com-munications Systems, Part I: Characterization, IEEE Com-munications Magazine, July 1997, pp. 90–100.
[4] R.H. Clarke, A Statistical Theory of Mobile Radio Recep-tion, Bell Systems Technical Journal, Vol. 47, No. 7, 1968,pp. 957–1000.
[5] M. Zorzi, R.R. Rao, On Channel Modeling for Delay Analy-sis of Packet Communications over Wireless Links, Proceed-ings of the 36th Allerton Conference on Communications,Control and Computing (23–25 September 1998, Monticello,Illinois, USA).
[6] H.S. Wang, P.C. Chang, On Verifying the First-OrderMarkovian Assumption for a Rayleigh Fading ChannelModel, IEEE Transactions on Vehicular Technology, Vol.45, No. 5, 1996, pp. 353–357.
[7] M. Zorzi, R.R. Rao, L.B. Milstein, ARQ Error Control forFading Mobile Radio Channels, IEEE Transactions on Ve-hicular Technology, Vol. 46, No. 5, 1997, pp. 445–455.
[8] C.C. Tan, N.C. Beaulieu, On First-Order Markov Modelingfor the Rayleigh Fading Channel, IEEE Transactions onCommunications, Vol. 48, No. 12, 2000, pp. 2032–2040.
[9] A.J. Goldsmith, P.P. Varaiya, Capacity, Mutual Informa-tion, and Coding for Finite-State Markov Channels, IEEETransactions on Information Theory, Vol. 42, No. 5, 1996,pp. 868–886.
[10] H.S. Wang, N. Moayeri, Finite State Markov Channel – AUseful Model for Radio Communication Channels, IEEETransactions on Vehicular Technology, Vol. 44, No. 1, 1995,pp. 163–171.
[11] B.D. Fritchman, A Binary Channel Characterization UsingPartitoned Markov Chains, IEEE Transactions on Infor-mation Theory, Vol. 13, No. 2, 1967, pp. 221–227.
[12] A.M. Chen, R.R. Rao, On Tractable Wireless Channel Mod-els, Proceedings of the 9th IEEE Internatonal Symposiumon Personal, Indoor and Mobile Radio Communications,PIMRC98, (September 1998, Boston, MA, USA).
[13] J. Arauz, P. Krishnamurthy, Markov Modeling of 802.11Channels, Proceedings of the IEEE Vehicular Technol-ogy Conference, VTC 2003 (4–9 October 2003, Orlando,Florida, USA).
[14] J. McDougall, S. Miller, Sensitivity of Wireless NetworkSimulations to a Two-State Markov Model Channel Ap-proximation, Proceedings of the IEEE Global Telecommu-nications Conference, GLOBECOM 2003, (1–5 December2003, San Francisco, USA).
[15] M. Moeneclaey, H. Bruneel, I. Bruyland and D.Y. Chung,Throughput Optimization for a generalized Stop-and-WaitARQ Scheme, IEEE Transactions on Communications, Vol.34, No. 2, February 1986, pp. 205–207.
[16] R. Fantacci, Performance Evaluation of Some EfficientStop-and-Wait Techniques, IEEE Transactions on Commu-nications, Vol. 40, No. 11, November 1992, pp. 1665–1669.
[17] M. De Munnynck, A. Lootens, S. Wittevrongel, H. Bruneel,Transmitter Buffer Behaviour of Stop-and-Wait ARQSchemes with repeated transmissions, IEE Proceedings-Communications, Vol. 149, No. 1, 2002, pp. 13–17.
[18] C. Tison, H. Bruneel, Improving the Throughput of Stop-and-Wait ARQ Schemes with Repeated Transmissions,AEU International Journal of Electronics and Communi-cations, Vol. 51, No. 1, 1997, pp. 1–8.
[19] R. Mukhtar, M. Zukerman, F. Cameron, Packet Latencyfor Type-II Hybrid ARQ Transmissions over a CorrelatedError Channel. Proceedings of European Wireless 2002 Con-ference (February 2002, Florence, Italy), pp. 107-113.
[20] P.F. Turney, An Improved Stop-and-Wait ARQ Logic forData Transmission in Mobile Radio Systems, IEEE Trans-actions on Communications, Vol. 29, No. 1, 1981, pp. 68–71.
[21] G. Fayolle G., E. Gelenbe, G. Pujolle, An Analytic Eval-uation of the Performance of the “Send and Wait” Proto-col, IEEE Transactions on Communications, Vol. 26, No. 3,1978, pp. 313–319.
[22] B.H. Saeki, I. Rubin I., An Analysis of a TDMA Chan-nel Using Stop-and-Wait, Block, and Select-and-RepeatARQ Error Control, IEEE Transactions on Communica-tions, Vol. 30, No. 5, 1982, pp. 1162–1173.
[23] D. Towsley, J.K. Wolf, On the Statistical Analysis of QueueLengths and Waiting Times for Statistical Multiplexerswith ARQ Retransmission Schemes, IEEE Transactions onCommunications, Vol. 27, No. 4, April 1979, pp. 693-702.
[24] D. Towsley, A statistical analysis of ARQ protocols oper-ating in a nonindependent error environment, IEEE Trans-actions on Communications, Vol. 27, No. 7, July 1981, pp.971–981.
[25] M. Rossi, L. Badia, M. Zorzi, Exact statistics of ARQ packetdelivery delay over Markov channels with finite round-tripdelay, Proceedings of IEEE Globecom 2003 (December 1–52003, San Francisco), pp. 3356–3360.
[26] H. Bruneel and B.G. Kim, Discrete-time models for commu-
18

nication systems including ATM (Kluwer Academic Pub-lishers, Boston, 1993).
[27] K. Tworus, S. De Vuyst, S. Wittevrongel, H. Bruneel,Transmitter Buffer Behavior of the Stop-and-Wait ARQScheme Under Correlated Errors, Proceedings of the Con-ference on Design, Analysis and Simulation of DistributedSystems, DASD 2004 (April 18–22 2004, Washington D.C.),pp. 10–18.
[28] H. Bruneel, Performance of Discrete-time Queueing Sys-tems, Computers & Operations Research, Vol. 20, No. 3,1993, pp. 303–320.
[29] H. Bruneel, B. Steyaert, E. Desmet, G. Petit, AnalyticDerivation of Tail Probabilities for Queue Lengths andWaiting Times in ATM Multiserver Queues, European Jour-nal of Operational Research, Vol. 76, 1994, pp. 563-572.
[30] D. Fiems, H. Bruneel, A Note on the Discretization of Lit-tle’s Result, Operations Research Letters, Vol. 30, No. 1,2002, pp. 17–18.
[31] F.R. Gantmacher, The Theory of Matrices, Volume One(AMS Chelsea Publishing, Providence, Rhode Island, 1959).
[32] C.D. Meyer, Matrix Analysis and Applied Linear Algebra,(SIAM, Philadelphia, 2000).
[33] E.C. Titchmarsh, The Theory of Functions, 2nd edition,(Oxford University Press, 1939).
[34] J. Abate, W. Whitt, Numerical Inversion of ProbabilityGenerating Functions, Operations Research Letters, Vol. 12,No. 4, 1992, pp. 245–251.
19