performance analysis of various parameters on glass … 14-071.pdf · international journal of...
TRANSCRIPT

International Journal of Advance Engineering and Research Development (IJAERD)
Volume 1,Issue 3, April 2014, e-ISSN: 2348 - 4470 , print-ISSN:2348-6406
@IJAERD-2014, All rights Reserved 1
Performance Analysis of various parameters on Glass
Cover of Solar Distiller-Experimental Study
Nishant S Thakar1, Hitesh N Panchal
2, Vishal N Thakkar
3
1M.E Student, SPIT, Piludara, [email protected]
2Asst. Professor, Mechanical Engg Dept. GPERI, Mewad, [email protected]
3Asst. Professor, Mechanical Engg Dept., SPIT, Piludara, [email protected]
Abstract- In many parts of the developing countries the availability of equal quantities of drinking water is a significant problem. This does not imply that the water is not abundant in these regions,
but rather the water available is usually not potable. Solar distillation is one of the promising studies for the application of solar thermal energy due to the concurrence, in many places of the
world of water scarcity, seawater, brackish, polluted ground water availability and expert layers of solar radiation.Some of them have utilized specific heat reduction techniques and cooling method to get an increase in distiller output. Hence, here is taken various parameters for increasing
effectiveness of glass cover of the distiller. On that stage are various parameters used to enhance the productivity of distillate output. By utilizing
1.Effect of varying glass cover thickness of distiller 2.Effect of cooling techniques on glass cover Keywords-Solar distiller, glass cover, fan, Data logger, Thermocouples, Distillate output, Sprinkler
I. INTRODUCTION
Potable water is a human birthright - as much a birthright as clean air. Out of the total earth's surface,
70% is covered by water, but most of it is salty. However, much of the world's population does not have access to safe drinking water. Out of 6 billion people, more than one sixth, lack access to safe
drinking water. Fresh water covers only 3% of the earth's surface. Humans consume fresh water available from rivers, lakes, underground sources and aquifers. Collectively, these sources account only for 1% of usable water on the land. People depend on this supply and a significant portion of the
population faces the water shortage. Nowadays, 31 countries representing 2.8 billion people, including China, India, Kenya, Ethiopia, Nigeria and Peru, confront chronic water problems. After a
generation, the world's population will develop up about 8 billion people and the quantity of water will remain the same or perhaps less. The challenge is as clear and compelling as pristine water cascading down a mountain stream. Hence, we must find new and reasonable ways of saving, using
and recycling the water. [1] A. Solar Distillation
The solar distillation method is an easy, small-scale and cost efficient technique for supplying safe water at places or in small-scale communities.s. Distillation is one of many processes that can be applied for
water purification. This calls for an energy input as heat and the solar radiation can be the origin of
vitality. In this process, water is evaporated, thus, separating water vapor from dissolved matter. The vapors get condensed as pure water. A conceptual diagram showing the process of solar still is
shown in Figure 1 Most of the conventional water distillation plants discussed earlier are energy-intensive and require scarce electric power or fossil fuel. But solar energy, despite being much lower grade energy, is ideally suited. The technology involved in the distillation of saline or brackish water
using solar energy is comparatively simple and semiskilled/unskilled operators can transport out its operation and maintenance. S. Shanmugana, et al. (2013) fabricated single slope basin type solar
still is provided with a dripping system to pour saline water drop by drop in the basin by using 4mm glass cover thickness. Thermal modeling and analytical solution have been valued in the temperature of glass cover water and watershed. By Using of 4 mm glass cover thickness they found maximum
output was 3.2 liter. Maximum Efficiency of still is found to be 40.58 % and 36.24 % in summer and winter days respectively [2]. Gajendra Singh, V.K. (2013) Dwivedidesigned HPVT double slope

International Journal of Advance Engineering and Research Development (IJAERD)
Volume 1,Issue 3, April 2014, e-ISSN: 2348 - 4470 , print-ISSN:2348-6406
@IJAERD-2014, All rights Reserved 2
active solar still for their performance on the substantiation of actual modeling. Some of the
parameters measured as solar intensity, ambient temperature, water temperature inside still, inner & outer surface temperature of a glass cover, they measured the coefficient of correlation varying from
0.872 to 0.965 [3]. Omar Ansari (2013) has described that the solar desalination system used brackish water in passive solar still with a heat energy system put under the basin liner of the desalination device. It shows the whole excess energy generated during sunshine time and stored in
PCM for later use during night time and rainy day [4]. P.K Srivastava et al. (2013)developed a simple modification of single slope basin type solar still with consisted porous fins (black ended old
cotton rags) inside the basin. the distillate productivity increase with the February to may. The distillate productivity increases with the decrease in the basin water depth [5]. R. Kannan a, et al.
(2014) Designed and tested a vapor adsorption type solar still and the experimental and analytical
results were compared to the energy equation for both conventional and vapor adsorption type solar still, hence found that theoretical results performed well with experimental results [6]. Khalifa at al.
(2009) Valued correlation of solar still where the correlation shows the effect of productivity of brine
depth, cover tilt angle and dye. The correlation values find the enhancement of value of the root means square to enhance the correlation experimentally [7]. Z. M. Omara et al.(2014)Had taken
various parameters like storage bed and water depth with different sand materials (yellow and black) used experimentally. It indicated that the heat storage sends enhanced productivity. Maximum productivity was achieved at sand bed heights of 0.01m and above the sand bed layers to zero height
of saline water compared to conventional style [8]. H.N.Panchal et al. (2013) Performed a single slope, solar still 2-phase, 3D model made for evaporation conduct a condensation process in still by
using ANSYS CFX method. Proved that ANSYS CFX method is a powerful instrument to diagnose solar still [9]. K.kalidasa Murugavel et al. (2013) Defined that inclined type solar still has a higher surface area and thin water surface. It revived that different methods use data improve the
effectiveness of the inclined solar still and compared it the other’s solar still performance [10]. Husham M. Ahmed (2012) explored different methods of discovering ways of solar still efficiently
and maximum productivity still connected with different condensers condense the still to increase distillate output during any season , in regard to that produced by the conventional simple solar still, overnight production also found increases [11]. A. E. Kabeel performed an experiment about solar
still with various parameters of glass cover and evaporative surface area. Average distillate productivity during the day time is approximately 4 L/m² with a system efficiency of 0.38 at solar
noon. It is more eminent than the conventional type solar still [12]. Prof.Nilamkumar S Patel et al.
(2003) compared different solar stills which are stepwise basin solar still, pyramid solar still and concave/convex basin solar still ,due to different designs of solar still, its parameter changes and to
find out that which one is the bestest designs compare to others [13].
II. EXPERIMENTAL SET UP AND OBSERVATION
1. Effect of varying glass covers thickness of distiller
To find optimum thickness with different parameters of glass cover and made comparison to another one distiller. The meteorological parameters affect significantly the performance of solar stills. It is
reported in the literature that output from the solar d istiller is high when ambient temperature is low and solar radiation intensity is higher. These are the different activities which are affecting the parameters of the glass cover. To measure various things according to activities there are different
instruments used as: 1. Thermocouples-(K-type) 3.Data logger 5. Pyranometer
2. Measuring Jar 4. Anemometer A. Glass cover specification
1.3mm-12mmfloatglass 6. Thermal stability
2. High quality and competitive price 7. Good flexibility 3. Excellent optical performance
4. Stable chemical stability

International Journal of Advance Engineering and Research Development (IJAERD)
Volume 1,Issue 3, April 2014, e-ISSN: 2348 - 4470 , print-ISSN:2348-6406
@IJAERD-2014, All rights Reserved 3
5. Safety tempered glass
B. Absorptivity, Reflectivity and Transmittivity of Window Glass Cover Hence typical clear glass of 3, 4, & 6, 8 mm according to SGG (Saint Gobain glass)
• Absorptivity (α) =0.90 • Transmittivity (τ) = 0.81 • Reflectivity (ρ) = 0.12 (0.10-0.25) (It is not unusual to lose 20% of solar radiation; that leaves
80% of the sunlight that gets transmitted.) • Emissivity (ɛ) =0.95 for 4mm, 0.90 for 6mm and 0.86 for 8mm.
A. Experimental procedure
To take values of different parameters we need to measure maximum days with data logger and climate condition of particular locations, then after choose random days which has clear sky and maximum output of distillate.
Figure 1 Experimental Setup
The experiments were performed in November 2013 to December 2013 but typical five days in a
week. The experiments were conducted on different five days at home, Mehsana for different glass covers and water depths. All experiments were started at 7 AM local time and lasted for 24 h. In
each day experiment one water depth was used for solar stills having different glass cover for performing 2 months. Hence, due to three water depths have used in this experiment, hence it require 2 months for experiments. The following parameters were measured every hour for a period of 24 h.
• Inner glass cover temperature • Water temperature • Ambient Temperature • Ambient air velocity
• Distillate output Water and glass cover temperatures of all three solar stills were recorded witthehelplp of
temperature sensors. Temperature sensors measures temperatures and store the values in data
logger. The data logger is connected with laptop hence readings were recorded in a Laptop. Temperature sensors having a least count of 0.1°C.
The distillate output was recorded with the help of external measuring jar having least count of 1 ml.
Three solar distillers are prepared with in parallel connection. Various thermocouples are attached to measure the temperature of particular place and
connected with the overtime data recorder (Data Logger) that is simply fixed with some program
Figure 2 Thermocouples fixed with channels

International Journal of Advance Engineering and Research Development (IJAERD)
Volume 1,Issue 3, April 2014, e-ISSN: 2348 - 4470 , print-ISSN:2348-6406
@IJAERD-2014, All rights Reserved 4
software and plug in with computer. Computer records data with it and works with the day and night.
These thermocouples are mounted with logger and fixed with different channels, and indicates the channel wise simulation of temperature. Those channels are measured different input and output
parameters. Figure shows the view of channel and program run on computer.
Table 1
Temperature dependent physical properties of vapor
B. Convective heat transfer coefficient:
Free convection occurs across the humid air in the enclosure, due to the temperature difference between the water surface and the glass cover. (Fernandez and Chargoy (1990), Goosen Sabalani,
(2000), Hamdan et al. (1999), Jubran,(2000), Kalogirou ,(2004), Kalogirou , (2005)The convective heat transfer rate can be obtained from the following equation.
)( ciwcwcw TThq
Where, heat loss coefficient by convection from water hcw may be obtained from expression (G N
Tiwari, (2002)
3
1
2109.268
))(()(884.0
w
wciwciwcw
P
TPPTTh
Partial pressure of glass and water are obtained by equation given in Table H.
C. Evaporative heat transfer coefficient:
Due to condensation of the rising vapor on the glass cover, there is heat loss by the evaporation between the water surface and glass cover, this can be expressed by following equation. (G N Tiwari,
(2002))
)( ciwewew TThq
Where,
ciw
ciw
cwewTT
PPhh 016273.0
Efficiency is determined by:
AI
TTh ciwew
*
)(

International Journal of Advance Engineering and Research Development (IJAERD)
Volume 1,Issue 3, April 2014, e-ISSN: 2348 - 4470 , print-ISSN:2348-6406
@IJAERD-2014, All rights Reserved 5
III. RESULT AND DISCUSSION
In this case, the main concern is the heating of air at different air flow rates. The experimental data is collected on the number of clear sky day. The results are taken in the month of November 2013 to december2013.
Figure 3 Relation between the Time (Hr) and Solar Insolation (W/m
2)
Figure 4 Shows measured solar Time (Hr) versus Solar Insolation (W/m2) for 24 hours starting from
morning 7 am for all three solar still. Solar insolation plays direct role on the daily production of distillate output from solar still. Ahmed (1988) and Cooper (1983) have observed a continuous increase in the
output from a solar still with increase in solar insolation. They proved that, average daily output increases with the increase in solar insolation falling on solar still in a day. It is noticed that, the solar insolation increases until it reaches to the maximum in the noon, then it decreases with time after this maximum
value in the afternoon. Also from Figure 4 it can be highlight the importance of solar insolation is very important parameter for solar still,
because solar insolation possess thermal energy, which is used to increase the temperature of water for evaporation.
Figure 5 Shows relation between Time (Hr) and Ambient Temperature (ºC) for
all three solar still for day 13/11/2013 and 01/12/2013. Cooper (1969) shown that, if the Temperature decreases, the
glass cover temperature also decreases. Consequently, temperature difference
(Tw-Tg) increases. They also prove that, solar still becomes more effective
during night at higher water depth in the basin if ambient temperature is low. Figure 5 Show relation between Time (Hr) and Ambient Temperature for all three solar still for day 13/11/2013 and 01/12/2013. Cooper (1969) shown that, if the Temperature decreases, the glass cover temperature also decreases.
Consequently, temperature difference (Tw-Tg) increases. They also prove that, solar still becomes more effective during night at higher water depth in the basin if ambient temperature is low. Figure 5 Shows
relation between Time (Hr) and Ambient Temperature for all three solar still for day 13/11/2013 and 01/12/2013. Cooper (1969) shown that, if the Temperature decreases, the glass cover temperature also decreases. Consequently, temperature difference (Tw-Tg) increases. They also prove that, solar still
becomes more effective during night at higher water depth in the basin if ambient temperature is low.
Figure 4 . Relation between Time (Hr) and Ambient Temperature (ºC)

International Journal of Advance Engineering and Research Development (IJAERD)
Volume 1,Issue 3, April 2014, e-ISSN: 2348 - 4470 , print-ISSN:2348-6406
@IJAERD-2014, All rights Reserved 6
Figure 5 Relation between Time (Hr) and water temperature (°C)
Figure 6 shows relation between Time (Hr) and water temperature (°C) for all three solar still for
particular day 13/11/2013 and 01/12/2013. Higher water temperature inside the solar still, increase in water vapor formation in still, which leads to increase in distillate output of solar still. Figs. D and E.
Show that, water temperature increases from morning 7 am to 2 pm for all three solar still then decreases, because morning 7 am to 2 pm, solar insolation increases and then decreases. Hence, Cooper (1969) proved that, solar insolation is directly proportional to the water temperature inside solar still.
Absorptivity as well as Transmissivity of 4 mm glass cover is more compared with 6 mm as well as 8 mm and higher Absorptivity and Transmissivity leads to good penetration of solar insolation in still,
hence leads to higher water temperature inside solar still. As a result, solar still having 4 mm glass cover thickness produces higher water temperature than 6 mm thickness and 8 mm thickness for above particular days.Distillate output is an output of application of solar energy inside solar still. Distillate
output depends on climate conditions like insolation, water temperature, glass cover temperature and many more. Higher water temperature and lower glass cover temperature leads to distillate output of
solar still. Higher insolation on solar still also increase the distillate output of solar still.
Figure 6Relation between Time (Hr) and Distillate output (Kg/Hr)
Figure 7 relation between Time (Hr) and distillate output (Kg/hr). Figs. show that, distillate output increase from morning 7 am to 2 pm and then decrease. Here, 4 mm glass cover thickness increases the
water temperature inside the solar still; hence distillate output is more compared with 6 mm and 8 mm glass cover thickness.

International Journal of Advance Engineering and Research Development (IJAERD)
Volume 1,Issue 3, April 2014, e-ISSN: 2348 - 4470 , print-ISSN:2348-6406
@IJAERD-2014, All rights Reserved 7
Figure 7 Relation between Time (Hr) and cumulative distillate output (Kg/Hr)
Figure 8 shows relation between Time (Hr) and cumulative distillate output (Kg/Hr). Hence, It is clearly shown from figs. that, distillate output of 4 mm, 6 mm and 8 mm glass cover gained distillate output of
1.721 Kg and 1.618Kg on13/11/2013 and 1.614 Kg and 1.486 Kg on 01/12/2013.Figure 9 shows relation between Time (Hr) and Efficiency (%) on particular days of 03/11/2013 and 01/12/2013. it can be seen that, efficiency with time until it reaches the maximum value in the solar afternoon, at this period the
incident solar radiation is higher. Efficiency for solar still is ratio of Evaporative heat transfer (hew) and product of insolation and Area. Efficiency depends on evaporative heat transfer coefficient. Evaporative
heat transfer coefficient depends on the temperature difference between water and glass cover. For 4 mm glass cover thickness, temperature difference between water and glass cover is more compared with 6 mm and 8 mm thickness.
D. Result Table Table 2
Daily, monthly distillate output obtained from single slope solar distiller at constant water depth of 0.01m with
varying in glass cover thickness:
Month of the No. of Daily Yield (Kg) Monthly Yield (Kg)
Figure 8 Relation between Time (Hr) and efficiency (%)

International Journal of Advance Engineering and Research Development (IJAERD)
Volume 1,Issue 3, April 2014, e-ISSN: 2348 - 4470 , print-ISSN:2348-6406
@IJAERD-2014, All rights Reserved 8
Year Ave Clear
Sky days
4 mm
Thick
6 mm
Thick
8 mm
Thick
4 mm
Thick
6 mm
Thick
8 mm
Thick
November
2013
23 1.72 1.61 1.52 39.56 37.03 34.96
December 2013
30 1.65 1.41 1.23 49.5 42.3 36.9
Average 1.69 1.51 1.38 43.33 39.66 35.93
E. Conclusion
From above graphs and experimental data we can conclude that 4 mm thickness found as optimum thickness of glass cover during the performance 4 mm glass cover thickness gives maximum absorptivity
and Transmittivity during the month of performed month of November 2013 and December 2013. In 4 mm glass cover Distillate output increase 23 % and 10 % compare to 6mm and 8mm thickness of glass cover respectively.
2. Effect of cooling techniques on glass cover
I. INTRODUCTION
There are several methods to use more distillate output from solar distiller and it is really useful to provide such efficiency. In solar distillation, passive cooling is a conceptual design approach that focuses
on hear gain and control heat dissipation in order to improve the inside thermal strength with low or nil energy consumption. This approach works either by preventing heat from getting into the interior (heat gain prevention) or by withdrawing heat from the building (natural cooling).
Glass cover is a most vital parameter. It is only used to transmit solar energy, but also reduce top heat loss. In the solar distiller, latent heat of condensation is lost to the environment, hence it is a main
problem, which is required to reduce and higher glass cover temperature decreases condensation. There
are two cooling methods formally known as: (1) Film wise condensation (2) Drop wise condensation
Cooling techniques are employed to reduce top heat loss from the glass cover of a solar still, with its condensate heat is not transmitted through the any part of the sill. These parameters are convenient to
receive the maximum production of distillate output. II. EXPERIMENTAL SET UP AND OBSERVATION
A. Experimental Procedure
The experiments were performed January 2014 to February 2014 but typically five days in a week by using 4mm (Optimum Thickness) glass screen on three solar still apply continuous flow of water by
using sprinkler on the glass top. Likewise, use discontinuous flow on 2nd still. The 3rd one will remain as it is. By utilizing water on with a sprinkler on glass cover known method is film wise condensation. The other still will perform with a little hole, pipe supply from water tank discontinues will drop along
the glass cover slowly. That will measure and compare with the third solar still.

International Journal of Advance Engineering and Research Development (IJAERD)
Volume 1,Issue 3, April 2014, e-ISSN: 2348 - 4470 , print-ISSN:2348-6406
@IJAERD-2014, All rights Reserved 9
Fully experimental setup is performed with different sky conditions in the month of January and
February no. of clear sky days is minimum so distillate output cannot be sure for from the performance of particular months.Water spreads over the glass cover during the day time while source of water available.
III. RESULT AND DISCUSSION
Figure 13 shows measured solar time (Hr) versus solar insolation (W/m²) during 24 hours starting
from morning 7am for all three solar still. Insolation plays direct role on the daily production of distillate output from solar still. Increase continues output from a solar
still with increase in solar insolation. Here insolation gradually increases up
to at 2pm at noon. And constantly decreases after 2 pm typical day of January25th, 2014.
Figure 10 Film wise condensations
Figure 12 Experimental set up
Figure 11 Drop wise condensations

International Journal of Advance Engineering and Research Development (IJAERD)
Volume 1,Issue 3, April 2014, e-ISSN: 2348 - 4470 , print-ISSN:2348-6406
@IJAERD-2014, All rights Reserved 10
Figure 13: Relation between Time (Hr) and Insolation (W/m²)
Figure 14 shows the Relation between time (Hr) and ambient temperature (°C) of
typical day of January 25,2014. Temperature increases simultaneously
from 7 am to 2pm. It can be highlight the importance of solar insolation is very important parameters for solar still,
because solar insolation possesses thermal
energy, which is used to increase the
temperature of water.
Figure 15 shows the graph of relation between time (Hr) and water
temperature (°C) of all three solar distiller of particular day of 25/01/2014. Higher water
temperature inside the solar still, increase in water vapor formation in
still. Which leads to increase form morning 7am to 2 pm for all three solar still then decrease because on
that particular time solar insolation increases and then decrease.
Figure 16 show the graph of relation between time (Hr) and efficiency (η %) on particular day of January
25, 2014. It can be seen that efficiency with time until it reaches the maximum value in the solar afternoon.
Figure 17 show that the relation between
Time (Hr) and distillate output (Kg/hr). Figs. show that, distillate output increase
from morning 7 am to 2 pm and then decrease.
Figure 14: Relation between Time (Hr) and Ambient
Temperature (°c)
Figure 15Relations between Time (Hr) and Water
Temperature (°C)
Figure 9 Relation between Time (Hr) and Efficiency
(η %)
Figure 17 Relation between Time (Hr) and Distillate output
(Kg/Hr)
International Journal of Advance Engineering and Research Development (IJAERD)
Volume 1,Issue 3, April 2014, e-ISSN: 2348 - 4470 , print-ISSN:2348-6406
@IJAERD-2014, All rights Reserved 11
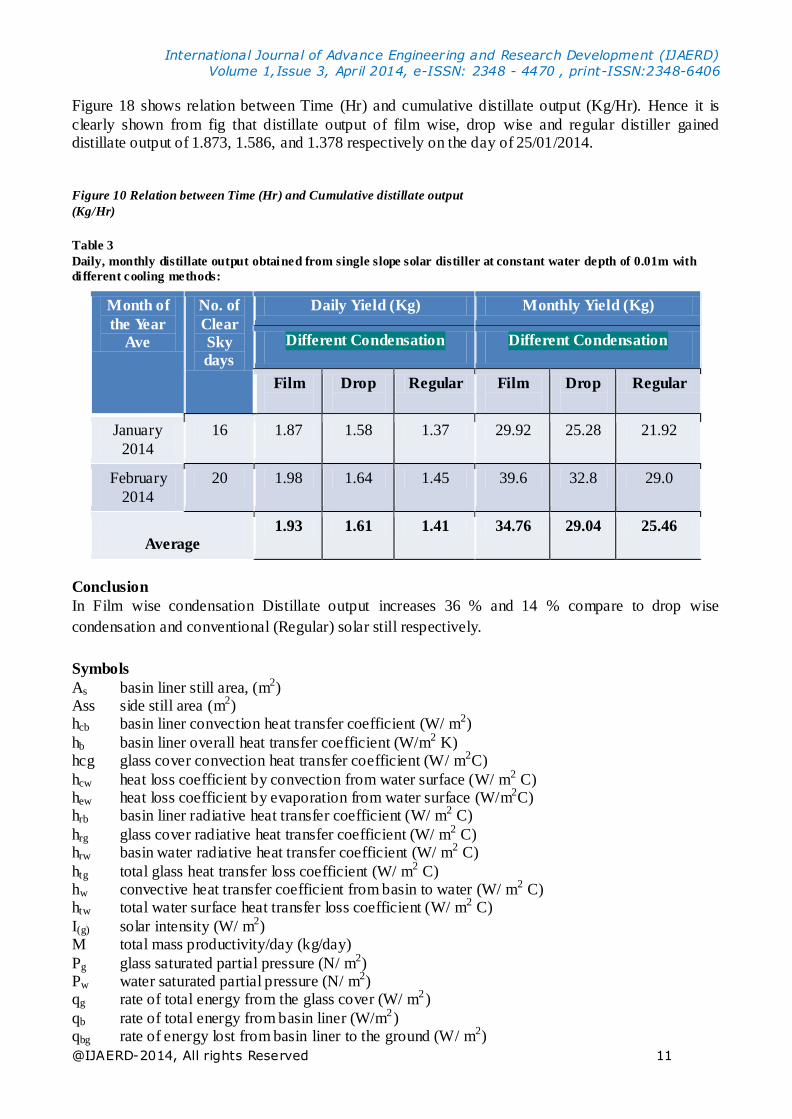
Figure 18 shows relation between Time (Hr) and cumulative distillate output (Kg/Hr). Hence it is
clearly shown from fig that distillate output of film wise, drop wise and regular distiller gained distillate output of 1.873, 1.586, and 1.378 respectively on the day of 25/01/2014.
Figure 10 Relation between Time (Hr) and Cumulative distillate output
(Kg/Hr)
Table 3
Daily, monthly distillate output obtained from single slope solar distiller at constant water depth of 0.01m with
di fferent cooling methods:
Conclusion
In Film wise condensation Distillate output increases 36 % and 14 % compare to drop wise
condensation and conventional (Regular) solar still respectively.
Symbols
As basin liner still area, (m2) Ass side still area (m2) hcb basin liner convection heat transfer coefficient (W/ m2)
hb basin liner overall heat transfer coefficient (W/m2 K) hcg glass cover convection heat transfer coefficient (W/ m2C)
hcw heat loss coefficient by convection from water surface (W/ m2 C) hew heat loss coefficient by evaporation from water surface (W/m2C) hrb basin liner radiative heat transfer coefficient (W/ m2 C)
hrg glass cover radiative heat transfer coefficient (W/ m2 C) hrw basin water radiative heat transfer coefficient (W/ m2 C)
htg total glass heat transfer loss coefficient (W/ m2 C) hw convective heat transfer coefficient from basin to water (W/ m2 C) htw total water surface heat transfer loss coefficient (W/ m2 C)
I(g) solar intensity (W/ m2) M total mass productivity/day (kg/day)
Pg glass saturated partial pressure (N/ m2) Pw water saturated partial pressure (N/ m2) qg rate of total energy from the glass cover (W/ m2)
qb rate of total energy from basin liner (W/m2) qbg rate of energy lost from basin liner to the ground (W/ m2)
Month of
the Year
Ave
No. of
Clear
Sky
days
Daily Yield (Kg) Monthly Yield (Kg)
Different Condensation Different Condensation
Film
Drop
Regular Film
Drop
Regular
January
2014
16 1.87 1.58 1.37 29.92 25.28 21.92
February
2014
20 1.98 1.64 1.45 39.6 32.8 29.0
Average 1.93 1.61 1.41 34.76 29.04 25.46
International Journal of Advance Engineering and Research Development (IJAERD)
Volume 1,Issue 3, April 2014, e-ISSN: 2348 - 4470 , print-ISSN:2348-6406
@IJAERD-2014, All rights Reserved 12
qcg rate of energy lost from the glass cover by convective (W/ m2)
qew rate of energy lost from water surface by evaporation (W/ m2) qcw rate of energy lost from water surface by convection (W/ m2)
qrg rate of energy lost from the glass cover by radiation (W/ m2) qrw rate of energy lost from water surface by radiation (W/ m2) qs rate of energy lost from the basin liner through the side of the still(W/ m2)
Tg0 temperature of basin water (C) Tgin temperature of inside glass (C)
Ta ambient temperature (C) Tb basin liner temperature (C) Tsky sky temperature (C)
Tw still water temperature (C) t time (s) Ub overall bottom heat lost coefficient (W/ m2 C)
Ut overall top heat loss coefficient (W/ m2 C) Ue overall side heat loss coefficient (W/ m2 C)
v Wind velocity (m/s)
REFERENCES [1] G.N Tiwari and A.K. Tiwari “Solar Distillat ion Practice for water Desalination Systems" ISBN-10:1905740883
ISBN-13: 978-1905740888 Edit ion:1Publication Date: March 15, 2008.
[2] S. Shanmugan et al. “Energy and exergy analysis of single slope single basin solar still.” International Journal
of Ambient Energy 33 (2013) 142-151.
[3] Gajendra Singh et al. “Experimental validation of thermal model of hybrid photovoltaic thermal (HPVT)
double slope active solar still” Desalination and water treatment 45 (2013) 182–190.
[4] O. Ansari et al. “Desalination of the brackish water using a passive solar still with a heat energy storage
system” Desalination 324 (2013) 10–20.
[5] P.K. Srivastava, S.K. Agrawal“winter and summer performance of single sloped basin type solar still
integrated with extended porous fins” Desalination 319 (2013) 73–78.
[6] R. Kannan et al. “Solar still with vapor adsorption basin: Performance analysis” Renewable Energy 62
(2014) 258-264.
[7] Abdul Jabbar N. Khalifa & Ahmad M. Hamood “Experimental validation and enhancement of some solar still
performance correlations” Desalination and Water Treatment, 4:1-3, 311-315.
[8] Omar and Kabeel. “The Performance of different sand beds solar stills” International Journal of Green
Energy,” 11: 240–254, 2014.
[9] Panchal HN, Shah PK “Modeling and verification of solar still using ANSYS CFX” International journal
of Energy and Environment 4 (2013) 13-28.
[10] K. Kalidasa Murugavel & P.Anburaj “Progresses in inclined type solar stills“Renewable and Sustainable
Energy Reviews 20 (2013) 364–377.
[11] Husham M. Ahmed “Seasonal performance evaluation of solar stills connected to passive external condensers”
Scientific Research and Essays ,DOI: 10.5897, SRE12.177 ISSN 1992-2248 ©2012 Academic Journals. Vol.
7(13), (2012), pp. 1444-1460 /
[12] A. E. Kabeel “Performance of a solar still with a wick concave evaporation surface” Twelfth International
Water Technology Conference, IWTC12 2008 Alexandria, Egypt.
[13] Prof.Nilamkumar S Patel “Effect of various parameters on different types of solar still: Case Study”
International Journal of Innovative Research in Science, Engineering and Technology, ISSN: 2319-8753 MAY
2013, VOL. 2, ISSUE 5.