performance modelling of fuel cells systems through petri nets
TRANSCRIPT

Performance Modelling of
Fuel cells Systems Through Petri Nets
Claudia Fecarotti1, John Andrews1 and Rui Chen2
1 The University of Nottingham , 2 Loughborough University
Hydrogen & Fuel Cell SUPERGEN Researcher Conference University of Birmingham
December 2014

Motivations and Aim of the Research
• FC technology is developed for commercial exploitation in a wide range of applications (automotive, telecommunication, stationary power, etc)
• Reliability and durability are among the main barriers to commercialisation
• The lifetime of a fuel cells stack is difficult to estimate:
• standard engineering measures of lifetime (MTTF) are difficult to specify since fuel cell’s performance degrades gradually and strongly depends on the operating conditions
• Lack of available data on FC behaviour
• Clearly the system performance depends on the reliability of the overall system including both the stack and the balance of plant
This research seeks at introducing a modelling method for the performance analysis of fuel cell systems including the stack and the supporting system, aimed at predicting the system lifetime.

The Fuel Cells System Model
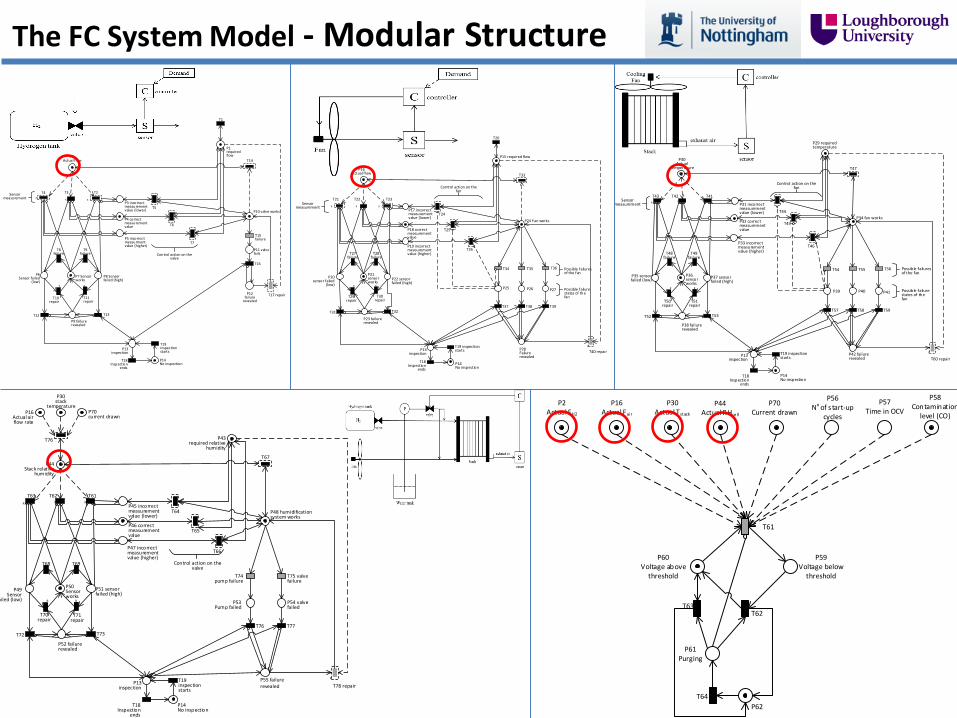
Aim of the model Simulate the operation of the fuel cell stack and its supporting system to predict the system lifetime based on the system structure and the components deterioration processes.
• Malfunctioning and/or failures of components of the BOP affect the operating parameters and in turn the stack performance.
• The model takes into account the causal relationships between the operation of the balance of plant (BOP) and the fuel cell stack performance.
• The stochastic approach accounts for the data uncertainty and variability of voltage
decay rates with operating conditions
Boundaries: Stack + BOP

Modelling Method: Petri Nets
Advantages Models the state of the system
Dynamic system modelling methodology
Models dependencies and concurrencies within the
system
No limit to the level of detail included
Modularization
Any distribution for event times
Operational and purging strategy options can be
switched on and off in the models
Tokens store information and can represent both
continuous and discrete variables
t

The FC System Model-Modular Structure
RR R
RR
P2Actual flow
P1 required flow
P3 incorrect measurement value (lower)
P4 correct measurement value
P5 incorrect measurment value (higher)
P11 valve fails
P12 failure
revealed
P10 valve works
P13inspection
P14No inspection
P9 failure revealed
P8 Sensor failed (high)
P7 Sensor works
P6 Sensor failed
(low)
T4 T3 T2
T5
T6
T7
T13T12
T8 failure
T10repair
T11 repair
T19 inspection starts
T18Inspection
ends
T17 repair
T16
T15failure
T14
T1
T9 failure Control action on the
valve
Sensor measurement
R R R
RR
P16Actual flow
P15 required flow
P17 incorrect measurement value (lower)
P18 correct measurement value
P19 incorrect measurement value (higher)
P25
P28Failure revealed
P24 Fan works
P23 failure revealed
P22 sensor failed (high)
P21 sensor works
P20sensor failed
(low)
T21 T22 T23
T24
T25
T26
T32T31
T27failure
T28failure
T29repair
T30repair
T40 repair
T38
T35
T33
T20
T37
T34
T39
T36
P26 P27
R
P13inspection
P14No inspection
T19 inspection starts
T18Inspection
ends
Sensor measurement
Control action on the fan
Poss ible failure states of the fan
Poss ib le failures of the fan
R R R
RR
P30Actual
temperature
P29 required temperature
P31 incorrect measurement value (lower)
P32 correct measurement value
P33 incorrect measurement value (higher)
P39
P42 failure revealed
P34 fan works
P38 failure revealed
P37 sensor failed (high)
P36 sensor works
P35 sensor failed (low)
T43 T42 T41
T44
T45
T46
T53T52
T48failure
T49 failure
T50repair
T51repair
T60 repair
T58
T55
T47
T57
T54
T59
T56
P40 P41
R
Control action on the fan
Poss ible failure states of the fan
Poss ib le failures of the fan
P13inspection
P14No inspection
T19 inspection starts
T18Inspection
ends
Sensor measurement
R R R
RR
P44Stack relative
humidity
P43 required relative
humidity
P45 incorrect measurement value (lower)
P46 correct measurement value
P47 incorrect measurement value (higher)
P55 failure revealed
P48 humidification system works
P52 failure revealed
P51 sensor failed (high)
P50 Sensor works
P49Sensor
failed (low)
T63 T62 T61
T64
T65
T66
T73T72
T68 T69
T70repair
T71repair
T78 repair
T76
T74 pump failure
T67
T77
T75 valve failure
P53Pump failed
P54 valve failed
R
P16Actual air flow rate
P30 stack
temperatureP70 current drawn
T76
P13inspection
P14No inspection
T19 inspection starts
T18Inspection
ends
Control action on the valve
P2Actual FH2
P16Actual Fai r
P30Actual Tstack
P44Actual RHcell
P56No of s tart-up
cycles
P57Time in OCV
P58Contamination
level (CO)
P70Current drawn
P59Voltage below
threshold
P60Voltage above
threshold
P61Purging
P62
T61
T63T62
T64

The FC System Model – Module example: PN for the Hydrogen Supply System
RR R
RR
P2Actual flow
P1 required flow
P3 incorrect measurement value (lower)
P4 correct measurement value
P5 incorrect measurment value (higher)
P11 valve fails
P12 failure
revealed
P10 valve works
P13inspection
P14No inspection
P9 failure revealed
P8 Sensor failed (high)
P7 Sensor works
P6 Sensor failed
(low)
T4 T3 T2
T5
T6
T7
T13T12
T8 failure
T10repair
T11 repair
T19 inspection starts
T18Inspection
ends
T17 repair
T16
T15failure
T14
T1
T9 failure Control action on the
valve
Sensor measurement
Inspection process
Sensor failure/repair process
Valve failure/repair process
Control action
Flow demand
Flow provided
Sensor measurements
The FC System Model - Modular Structure
RR R
RR
P2Actual flow
P1 required flow
P3 incorrect measurement value (lower)
P4 correct measurement value
P5 incorrect measurment value (higher)
P11 valve fails
P12 failure
revealed
P10 valve works
P13inspection
P14No inspection
P9 failure revealed
P8 Sensor failed (high)
P7 Sensor works
P6 Sensor failed
(low)
T4 T3 T2
T5
T6
T7
T13T12
T8 failure
T10repair
T11 repair
T19 inspection starts
T18Inspection
ends
T17 repair
T16
T15failure
T14
T1
T9 failure Control action on the
valve
Sensor measurement
R R R
RR
P16Actual flow
P15 required flow
P17 incorrect measurement value (lower)
P18 correct measurement value
P19 incorrect measurement value (higher)
P25
P28Failure revealed
P24 Fan works
P23 failure revealed
P22 sensor failed (high)
P21 sensor works
P20sensor failed
(low)
T21 T22 T23
T24
T25
T26
T32T31
T27failure
T28failure
T29repair
T30repair
T40 repair
T38
T35
T33
T20
T37
T34
T39
T36
P26 P27
R
P13inspection
P14No inspection
T19 inspection starts
T18Inspection
ends
Sensor measurement
Control action on the fan
Poss ible failure states of the fan
Poss ib le failures of the fan
R R R
RR
P30Actual
temperature
P29 required temperature
P31 incorrect measurement value (lower)
P32 correct measurement value
P33 incorrect measurement value (higher)
P39
P42 failure revealed
P34 fan works
P38 failure revealed
P37 sensor failed (high)
P36 sensor works
P35 sensor failed (low)
T43 T42 T41
T44
T45
T46
T53T52
T48failure
T49 failure
T50repair
T51repair
T60 repair
T58
T55
T47
T57
T54
T59
T56
P40 P41
R
Control action on the fan
Poss ible failure states of the fan
Poss ib le failures of the fan
P13inspection
P14No inspection
T19 inspection starts
T18Inspection
ends
Sensor measurement
R R R
RR
P44Stack relative
humidity
P43 required relative
humidity
P45 incorrect measurement value (lower)
P46 correct measurement value
P47 incorrect measurement value (higher)
P55 failure revealed
P48 humidification system works
P52 failure revealed
P51 sensor failed (high)
P50 Sensor works
P49Sensor
failed (low)
T63 T62 T61
T64
T65
T66
T73T72
T68 T69
T70repair
T71repair
T78 repair
T76
T74 pump failure
T67
T77
T75 valve failure
P53Pump failed
P54 valve failed
R
P16Actual air flow rate
P30 stack
temperatureP70 current drawn
T76
P13inspection
P14No inspection
T19 inspection starts
T18Inspection
ends
Control action on the valve
P2Actual FH2
P16Actual Fai r
P30Actual Tstack
P44Actual RHcell
P56No of s tart-up
cycles
P57Time in OCV
P58Contamination
level (CO)
P70Current drawn
P59Voltage below
threshold
P60Voltage above
threshold
P61Purging
P62
T61
T63T62
T64

The FC System Model – The Stack Voltage Module
P2Actual FH2
P16Actual Fai r
P30Actual Tstack
P44Actual RHcell
P56No of s tart-up
cycles
P57Time in OCV
P58Contamination
level (CO)
P70Current drawn
P59Voltage below
threshold
P60Voltage above
threshold
P61Purging
P62
T61
T63T62
T64
Operating parameters
Purging cycle
Stack voltage output gradually decreases as a result of aging and deterioration processes. The voltage decay rate can increase severely as an effect of adverse operating conditions
The voltage is treated as a continuous variable, represented by the value of the token in place P60 (or P59).
Model Analysis
The Petri net is simulated using the Monte Carlo method
• The goal is to estimate the expected system performance (system lifetime) with respect to pre-defined performance criteria (voltage threshold)
• Many simulation are run, each representing one life cycle of the system • Statistics are collected in order to provide an indication of the system
performance • Sampling from a distribution is required for all stochastic transitions in
the Petri net which represent events whose times of occurrence is not deterministic but follows a statistical distribution
• The system lifetime is obtained and recorded in each run, and the
estimate is evaluated as the average over the number of simulations

Model Analysis – System Specification
Input data
• MTTF (and MTTR) of the components of the BOP (to generate times of failures and times for repair)
𝐹 𝑡 = 1 − 𝑒−𝑡
𝑀𝑇𝑇𝐹 = 𝑋 , 𝑋 ∈ 0, 1 , 𝑡 = −𝑀𝑇𝑇𝐹 ∙ ln 𝑋
• Voltage decay rate in the range 1-10 μVh-1 for normal operating
conditions (steady-state operation, Tstack=60-70°C, RH=100%)
• Observed voltage decay rates (data from the literature ranked
according to the operating parameters)
• Inspection frequencies
• Frequencies and duration of purging
voltage decay rate is a random variable

Model Analysis – Simulations and Results
• 5000 simulations have been executed to ensure convergence of results is achieved
• The system operation has been simulated under steady state conditions. Simulations are stopped when the voltage drops below the established threshold and is not recovered to an acceptable value after purging
• At the end of each simulation, the system lifetime is recorded and the expected
value is evaluated providing the system average lifetime
6000
6200
6400
6600
6800
7000
7200
0 1000 2000 3000 4000 5000
Ava
rage
lif
eti
me
(h
)
no of simulations
Plot of average lifetime against the number of simulations (Voltage threshold 3.8V)
6720 h
4 cells stack Threshold is set to 3.8V

Model Analysis – Simulations and Results
Fitting a distribution to the lifetime values generated by the model, it was found that they follow a 3-parameter Weibull distribution
ReliaSoft W eibull++ 7 - www.ReliaSoft.com
F/S Histogram
Period
Va
lue
0-1548 1548-3... 3096-4... 4644-6... 6192-7... 7740-9... 9288-1... 10836-... 12384-... 13932-... 15480-... 17028-... 18576-...0.000
2.000E-4
4.000E-5
8.000E-5
1.200E-4
1.600E-4
FS H istogram
Pdf Line
Failures
John Andrews
University of Nottingham
21/ 10/ 2014
18:59:33
Probability density function (Voltage threshold 3.8V) 𝑓 𝑡 =𝛽 𝑡 − 𝛾 𝛽−1
𝜂𝛽𝑒𝑥𝑝 −
𝑡 − 𝛾
𝜂
𝛽
• η characteristic life, is the life time at which 2/3 of the population will have reached the prescribed threshold.
• β shape parameter gives an
indication of the rate of wear-out of the system.
• γ minimum lifetime, indicates the
minimum lifetime value in the population.
β= 2.7984; η= 5752; γ=1605

Model Analysis – Simulations and Results
ReliaSoft W eibull++ 7 - www.ReliaSoft.com
Unreliability vs Time Plot
Time, (t)
Un
re
lia
bil
ity
, F
(t)
=1
-R
(t)
0.000 20000.0004000.000 8000.000 12000.000 16000.000
0.000
1.000
0.200
0.400
0.600
0.800
Unreliability
Data 1
W eibull-3P
MLE SRM MED FM
F=5000/ S=0
Data Points
Unreliability Line
John Andrews
University of Nottingham
21/ 10/ 2014
18:57:38
ReliaSoft W eibull++ 7 - www.ReliaSoft.com
Failure Rate vs Time Plot
Time, (t)
Fa
ilu
re
Ra
te,
f(t)
/R
(t)
0.000 20000.0004000.000 8000.000 12000.000 16000.000
0.000
0.003
6.000E-4
0.001
0.002
0.002
Failure Rate
Data 1
W eibull-3P
MLE SRM MED FM
F=5000/ S=0
Failure Rate Line
John Andrews
University of Nottingham
21/ 10/ 2014
18:58:47
Unreliability function System failure rate
𝐹 𝑡 = 1 − 𝑒𝑥𝑝 −𝑡 − 𝛾
𝜂
𝛽
Increasing failure rate due to the wearing-out of the stack as a consequence of ageing and degradation mechanisms
shape parameter β= 2.7984 >1
8000 h
0.76

Model Analysis – Simulations and Results
4.00E+03
6.00E+03
8.00E+03
1.00E+04
1.20E+04
1.40E+04
1.60E+04
1.80E+04
2.5 3 3.5 4
Ava
rage l
ifeti
me (h
)
Voltage threshold (V)
Purging interval 90 mins
Purging interval 60 mins
Voltage threshold Average lifetime Variance Weibull parameters
3.8 6723 2048 β= 2.7984; η= 5752; γ=1605
3.6 9227 2403 β= 2.8846; η= 6998; γ=2986
3.4 11178 2610 β= 3.4574; η= 8781; γ=3281
3.2 12800 2886 β= 2.936; η= 8650; γ=5089
3.0 14246 3012 β= 3.5257; η= 102256; γ=5037
The behaviour of the system for different voltage threshold values and purging frequencies has been also simulated
Conclusions
• The model simulates the operation of the fuel cell stack and its supporting systems taking into account the causal relationships between the operation of the balance of plant and the fuel cell stack performance
• MTTF of BOP components and stack voltage decay rates are input parameters for
the model • Data for voltage decay rates collected from the literature have been used here in
order to demonstrate the capability of the model
• The model is analysed by means of the Monte Carlo method. The stochastic approach allows taking into account data uncertainty and variability
• The modelling process produces distributions of the output parameters (system
lifetime) as an alternative to the point estimates delivered by alternative methods • This enables an appreciation of the best and worst possible output lifetime as well
as the expected system performance