performance of a passive feedlot runoff … transactions of the asae figure 1. plan view showing the...
TRANSCRIPT
Transactions of the ASAE
Vol. 46(6): 1525-1530 � 2003 American Society of Agricultural Engineers ISSN 0001-2351 1525
PERFORMANCE OF A PASSIVE FEEDLOT RUNOFF
CONTROL AND TREATMENT SYSTEM
B. L. Woodbury, J. A. Nienaber, R. A. Eigenberg
ABSTRACT. The recent signing of the NPDES permit regulations and effluent limitations guidelines for CAFO has generatedmuch interest from smaller beef cattle feeding operations for a more cost-effective solution for managing feedlot runoff. Apassive runoff control and treatment system was constructed to reduce long-term liquid storage, provide solids separation,and evenly distribute the liquid discharge for grass hay production. The overall objective of this study was to evaluate theeffectiveness of this passive system for reducing contaminant discharge. The system effectively reduced the cumulative massof total and volatile suspended solids and reduced chemical oxygen demand by 80%, 67%, and 59%, respectively. Significantreductions of these constituents in the runoff water as it passed through the system were measured for most precipitationevents. No water was measured exiting the vegetative filter strip during the three-year period of this study. Therefore, thedischarge water was effectively contained and used for hay crop production. Estimated total nitrogen (TN) load in the dis-charge water entering the vegetative filter strip was equivalent to or less than the TN removed by the crop. System robustnesswas demonstrated during feedlot pen renovation when significant reductions in contaminant concentrations were measuredfor most all precipitation events during that period.
Keywords. Animal waste management, Feedlot runoff control, Nutrient management, Waste treatment.
n December 15, 2002, the Environmental Protec-tion Agency issued a Final Rule on NPDES PermitRegulations and Effluent Limitations Guidelinesfor Confined Animal Feeding Operations (CAFO)
(40 CFR Parts 9, 122, 123, and 412; EPA, 2003). Specifiedin this regulation (40 CFR Part 412, EPA, 2003) is the require-ment for CAFO to use the best practical control technologycurrently available to contain all runoff resulting from a25-year, 24-hour rainfall event. It is generally accepted thattraditional retention ponds are the best practical controltechnology. However, a site-specific alternative system canbe permitted if it meets performance standards (40 CFR Part412; EPA, 2003).
One of the obstacles for CAFOs, particularly for smalleroperations, will be meeting these NPDES regulations.Proven traditional structures like retention ponds are expen-sive to construct, difficult to maintain, and may requirespecialized equipment to manage. An additional problemresulting from retention ponds is the potential for groundwa-ter contamination resulting from seepage (McCullough et al.,1999; Parker et al., 1999; Huffman and Westerman, 1995;Westerman et al., 1995).
Woodbury et al. (2002) evaluated construction andoperation of a passive runoff control and treatment system
Article was submitted for review in June 2002; approved forpublication by the Soil & Water Division of ASAE in September 2003.Presented at the 2002 ASAE Annual Meeting as Paper No. 022267.
The authors are Bryan L. Woodbury, ASAE Member Engineer,Research Scientist, John A. Nienaber, ASAE Member Engineer,Agricultural Engineer, and Roger A. Eigenberg, ASAE Member,Agricultural Engineer, USDA-ARS U.S. Meat Animal Research Center,Clay Center, Nebraska.Corresponding author: Dr. Bryan Woodbury,USDA-ARS U.S. Meat Animal Research Center, P.O. Box 166, ClayCenter, NE 68933; phone: 402-762-4275; fax: 402-762-4273; e-mail:[email protected].
designed to reduce the volume of long-term liquid storage,provide adequate solids separation, and evenly distributebasin discharge water for grass hay production. Theyconcluded that the passive system demonstrated very goodsolids separation, with minimal time required for operationand maintenance. In addition, operation and maintenancerequirements were accomplished using equipment typical toCAFOs.
However, Woodbury et al. (2002) did not report theperformance of the passive system for contaminant reduc-tion. Therefore, the overall objective of this study was toevaluate the effectiveness of this passive feedlot runoffcontrol and treatment system for reducing contaminantdischarge. The specific objectives were: (1) to evaluate thesolids removal from pen runoff water as it passed through agravity -drained debris basin, and (2) to evaluate basindischarge water and nutrient usage by a vegetative filter strip(VFS).
MATERIAL AND METHODSDetails concerning the construction and instrumentation
of the passive runoff control and treatment system can befound in Woodbury et al. (2002). However, a brief descriptionis included. Eight pens (30 × 90 m each) at the Meat AnimalResearch Center (Clay Center, Neb.) feedlot were selected.These pens were stocked with 70 to 80 head per pen offinishing cattle for approximately 180-day cycles.
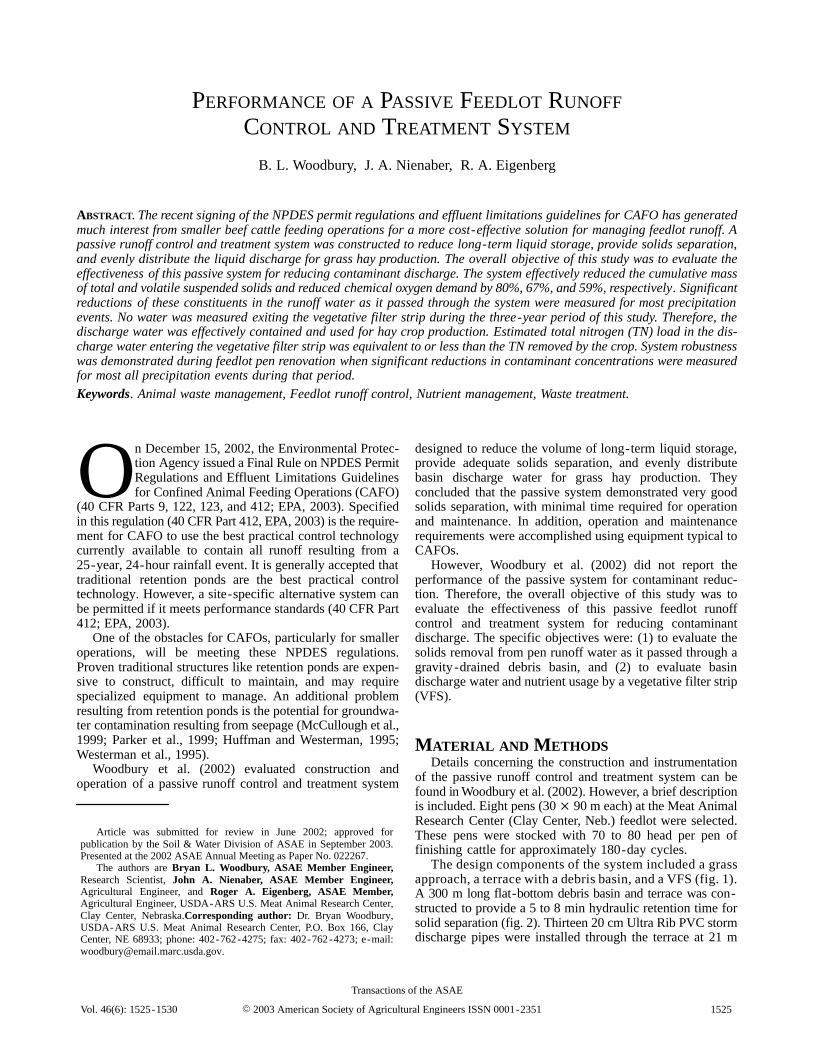
The design components of the system included a grassapproach, a terrace with a debris basin, and a VFS (fig. 1).A 300 m long flat-bottom debris basin and terrace was con-structed to provide a 5 to 8 min hydraulic retention time forsolid separation (fig. 2). Thirteen 20 cm Ultra Rib PVC stormdischarge pipes were installed through the terrace at 21 m
O

1526 TRANSACTIONS OF THE ASAE
Figure 1. Plan view showing the relationship of the feedlot pens, debris ba-sin with terrace, discharge tubes, and the vegetative filter strips. Note theaddition of the flow samplers, ceramic cups, and berms for isolation of theinstrumented section of the vegetative filter strip.
Figure 2. Schematic cross-sectional diagram of the debris basin, terrace,discharge tubes, and drain tubes.
intervals. These pipes were installed at the same elevation toprovide uniform distribution of debris basin discharge wateracross the VFS for nutrient and water utilization (fig. 2). The6.0 ha bromegrass VFS was adjacent and downslope alongthe length of the basin, and ranged from 200 to 210 m in widthat a slope of approximately 0.5% (fig. 1). The size of the VFSwas based on the expected nutrient load estimated by theNutrient Fate Model for Beef Cattle Feedlots (Eigenberg etal., 1998).
Two sets of berms were established to direct runoff fromtwo adjacent pens through one of two 0.23 m Parshall flumes(fig. 1). Samplers were installed at each flume to characterizewater quality. Two additional 0.15 m Parshall flumes, withsamplers, were installed down-gradient from discharge tubesto collect samples. Difficulties of maintaining upstream flowresulted in using the NRCS curve number method to estimaterunoff volume (Grant, 1991). Samplers were operated in thefield from April 1 to October 31 annually. Very little runoffoccurred during the 5-month period without samplersprimarily due to frozen conditions.
Berms were constructed at the down-gradient end andalong the sides of the VFS to isolate it from the surroundingenvironment (fig. 1). A portion of the VFS was divided witha berm, such that runoff from the four pens was isolated(fig. 1). At the down-gradient end of this section, a 0.15 mParshall flume was installed and instrumented with a stagerecorder to measure any runoff leaving the VFS (fig. 1). Soilwater sampling ceramic cups were placed throughout theVFS at a depth of 1.8 m (fig. 1).
Hay was harvested using conventional wind rowing andbailing equipment. Multiple vegetative samples were col-
Table 1. Chemical and physical composition of basin[a] solids,and dry matter and total nitrogen removed by the hay crop.
TotalHay Crop
Year
TotalSolids,
Dry(kg)
VolatileSolids(kg)
TotalN
(kg)
OrganicN
(kg)
DryMatter(kg)
TotalN
(kg)
1997 67,000 NA NA NA NA NA
1998 49,500 NA NA NA NA NA1999 98,000 14,500 450 380 NA NA2000 37,100 5,900 180 150 32,760 7002001 54,400 9,400 310 280 25,100 420
[a] The basin area was approximately 900 m2.NA = not available.
lected from the wind rows across the VFS just prior to bailing.Samples were analyzed for dry matter and TN (combustionanalysis, Model CN 2000, Leco Corp., St. Joseph, Mich.).Mass of harvested dry matter hay was recorded and used todetermine the mass of TN removed.
Rain events were measured during the 1999 through 2001seasons (table 1). These events were measured by the HighPlains Regional Climate Center (site number 251684),located approximately 2 km east-northeast of the researchsite. Runoff volumes for each rain event were estimated usingthe NRCS runoff curve method. These values were used withthe averaged runoff and discharge concentrations to deter-mine the mass of total suspended solids (TSS), volatilesuspended solids (VSS), chemical oxygen demand (COD),and total nitrogen (TN) entering and exiting the debris basin.The mass of TN exiting the debris basin was considered theamount entering the VFS.
Runoff and debris basin discharge samples were frozenuntil analyses could be completed. Total solids weredetermined gravimetrically at 105°C, while volatile solidswere determined by loss on ignition at 550°C. These analysesfollow Standard Methods 2540C and 2540E, respectively(APHA, 1992). Chemical oxygen demand was determinedusing Standard Method 5220 (APHA, 1992). Total nitrogenwas determined by combining analyses from a modified totalKjeldahl nitrogen procedure with a cadmium-reductionnitrate -nitrogen analysis. These procedures follow methods10072 and 10020 outlined in the Hach Water AnalysisHandbook (Hach, 1992).
Analysis of the solids removed from the debris basinconsisted of total and volatile solids, TN, and organicnitrogen. Total solids were determined gravimetrically at105°C, while volatile solids were determined by loss onignition at 550°C. Total nitrogen was approximated bysumming the total Kjeldahl nitrogen with the nitrate-nitro-gen (2M KCl extraction, colorimetric determination) (Mul-vaney, 1996). Organic nitrogen was determined by adjustingthe total Kjeldahl nitrogen for ammonium.
RESULTS AND DISCUSSIONSolids from the debris basin were removed and analyzed
during the summers of 1999 through 2001 (table 1). The totalmass of dry solids deposited in the basin varied from a highof 98,000 kg for 1999 to a low of 37,100 kg for the followingyear. When averaged over the 1999 through 2001 season,approximately 16% of solids deposited in the debris basinwere volatile (table 1). Approximately 86% of the nitrogen

1527Vol. 46(6): 1525-1530
Table 2. Predicted runoff and contaminant loads for each measured rainfall event.
EstimatedTSS VSS COD TN
DateRainfall(mm)
EstimatedPen
Runoff[a]
(m-3)
PenRunoff
(kg)
BasinDischarge
(kg)
PenRunoff
(kg)
BasinDischarge
(kg)
PenRunoff
(kg)
BasinDischarge
(kg)
PenRunoff
(kg)
BasinDischarge
(kg)
1999
June 22 59 740 1870 390 660 320 4640 3050 89 48June 27 25 120 1050 50 110 20 890 450 26 12June 28 18 70 490 20 40 40 520 400 13 2Aug. 6 39 320 1910 0 90 0 1860 0 55 0
Aug. 17 25 120 600 60 220 30 860 680 20 5
Totals 166 1350 5920 520 1120 410 8770 4580 202 67
2000
May 26 38 300 1300 460 1020 110 3390 180 67 71June 12 30 180 670 320 340 70 2210 100 37 40June 20 56 670 3860 1160 850 340 1160 220 94 44June 26 53 610 2010 1200 920 140 1340 290 98 43July 5 100 1830 4360 370 2950 370 1430 470 289 139
Aug. 19 41 350 2700 120 130 20 550 30 45 25
Totals 318 3940 14,900 3630 2740 1050 10,080 1290 630 361
2001
May 4 69 990 7300 1490 2220 490 6680 4080 307 233May 29 63 830 1570 500 1120 190 3290 1590 164 95May 30 46 880[b] 3270 510 940 510 4510 2880 165 59June 4 20 200[b] 430 0 160 0 980 0 36 0July 5 32 210 570 100 260 150 1080 300 45 10
July 28 17 60 140 0 80 0 430 0 12 0Sept. 16 42 380 1580 230 330 180 2430 830 69 36
Totals 289 3550 14,860 2830 5110 1520 19,400 9680 798 432[a] Values determined using NRCS curve number 85 for pen surfaces and 58 for grass surface assuming AMC II.[b] Values determined using NRCS curve number 93 for pen surfaces and 76 for grass surfaces assuming AMC III.Zero values indicate no measured discharge volume.
deposited in the basin was in the organic form. The overallTSS, VSS, and COD removal within the basin for the threeyears of the study averaged 80%, 67%, and 59%, respectively(table 2).
Two seasons of hay crop were removed from the VFS.There were 32,760 kg of dry matter removed during the 2000season (table 1). This dry matter contained 700 kg of TN(table 1). When compared with the estimated 361 kg TNadded by the debris basin discharge water, there was a netremoval of 339 kg of TN from the VFS (table 1 and 2). Duringthe 2001 season, 25,100 kg dry matter was harvested duringlate summer, containing 420 kg of TN (table 1). A 12 kg netgain of TN in the VFS occurred when compared with theaddition of TN by the discharge water (tables 1 and 2).
There were four measured rain events that resulted incollected runoff and discharge samples during the 1999season (table 2). The 39 mm event that occurred on August6 resulted in runoff and discharge water, but equipmentfailure prevented collection of discharge water. The largeststorm event was a 59 mm rainfall that occurred on June 22.This event was part of a week-long storm series that resultedin a total 102 mm of rainfall. These events generated anestimated 1350 m3 of runoff containing 5920, 1120, and 8770kg of TSS, VSS, and COD, respectively (table 2). Dischargefrom the debris basin contained 520, 410, and 4580 kg ofTSS, VSS, and COD, respectively (table 2). This resulted ina 5.3 TSS/VSS ratio for the runoff and a 1.3 TSS/VSS ratiofor the discharge water. The concentrations of TSS in therunoff water ranged from 2530 mg L-1 to 8500 mg L-1, while
the discharge concentrations ranged between 400 and 520 mgL-1 (fig. 3). The lowest runoff TSS concentration occurredduring the largest rainfall event due to dilution of the highlyerodible solids load, which occurred early in the runoff event.In addition, there was significant (p = 0.05) removal of TSSfor all rainfall events during the 1999 season (fig. 3).
Runoff VSS concentrations during the 1999 season rangedfrom 530 to 1810 mg L-1 (fig. 4). The discharge VSSconcentrations ranged from 200 to 590 mg L-1 (fig. 4). Itshould be noted that little or no reduction in VSS concentra-tion was measured during the rainfall event on June 28. Thisevent was relatively small and occurred at the end of aweek-long series of rainfall events. Therefore, most of thehighly erodible solids had already been removed by earlierstorms, and this runoff contained fewer carbonate complexesfrom the pen surface. Some of these complexes can bevolatilized at the combustion temperature of the analysis.The runoff COD concentrations during the 1999 seasonranged from 6280 to 7920 mg L-1, while the discharge rangedfrom 3690 to 6060 mg L-1 (fig. 5). There were significantreductions (p = 0.05) between the runoff and dischargeconcentration for all measured precipitation events (fig. 5).
A major renovation of the feedlot pens was initiated onMay 20, 2000. Renovation included dismantling pens,removing feed bunks, and reshaping the feedlot surface. Therenovation took approximately three months to complete.The samplers and runoff control structures were minimallyaffected by the renovation, so it was decided to continue thestudy to evaluate the impact on performance.

1528 TRANSACTIONS OF THE ASAE
Figure 3. Total suspended solids concentrations of the runoff and dis-charge water during the measured precipitation events. Letters representdifferences at the 0.05 level.
Figure 4. Volatile suspended solids concentrations of the runoff and dis-charge water during measured precipitation events. Letters represent dif-ferences at the 0.05 level.
Figure 5. Chemical oxygen demand concentrations of the runoff and dis-charge water during the measured precipitation events. Letters representdifferences at the 0.05 level.
Six measured rain events resulted in collected runoff anddischarge samples during the 2000 season (table 2). Thelargest storm event was a 100 mm rainfall that occurred onJuly 5. These events resulted in 3940 m3 of runoff thatcontained 14900, 2740, and 10080 kg of TSS, VSS, andCOD, respectively (table 2). The discharge contained 3630,1050, and 1290 kg of TSS, VSS, and COD, respectively(table 2). This resulted in a 5.4 TSS/VSS ratio for the runoffand a 3.5 TSS/VSS ratio for the discharge water. Concentra-tions of TSS in the runoff water ranged from 2390 mg L-1 to7640 mg L-1 (fig. 3). It was expected that these values wouldreflect the construction process and be much greater. Barrierspreventing cross-pen flow were removed during theconstruction process. This compromised the collection anddirection of the runoff through the flumes. Dischargeconcentrations ranged between 200 and 1960 mg L-1, withfour of the six events having concentrations greater that 1500mg L-1(fig. 3). These values appear to reflect the constructionprocess. Regardless of the operational problems, there weresignificant (p = 0.05) reductions in TSS concentrations forrainfall events as the runoff passed through the system.
Runoff VSS concentrations during the 2000 season rangedfrom 370 to 3390 mg L-1 (fig. 4). The highest VSSconcentration resulted on May 26, shortly after the construc-tion process began. The relatively high concentrations thatpersisted throughout the season reflected disturbance of theorganic surface layer and mound during the early part of therenovation. Discharge VSS concentrations ranged from 50 to500 mg L-1 (fig. 4). It should be noted that significant (p =0.05) reductions in VSS concentration as the runoff passed

1529Vol. 46(6): 1525-1530
though the system were measured, with the exception of anevent on August 19.
Runoff COD concentrations during the 2000 seasonranged from 790 to 12,300 mg L-1 (fig. 5). The first two rainevents appeared to pick up the organic matter disturbedduring the renovation of the mound and pen surfaces. Afterthese two events, the runoff COD concentrations wereapproximately 1/3 the average concentration measuredduring the 1999 season. The discharge COD concentrationsranged from 100 to 590 mg L-1 (fig. 5). These values weremuch lower than the previous season. This indicates that thedisturbed organic matter was settlable.
Five measured rain events resulted in collected runoff anddischarge samples during the 2001 season (table 2). Twoevents initiated runoff sample collection but were notsufficient to initiate discharge sample collection. The largeststorm event was a two-day event that resulted in 109 mm ofprecipitation. The season-long cumulative totals resulted in3550 m3 of runoff that contained 14860, 5110, and 19400 kgof TSS, VSS, and COD, respectively (table 2). This resultedin a 2.9 TSS/VSS ratio, much less than the previous twoseasons. However, the VSS and COD totals were approxi-mately twice that of the two previous seasons. One possibleexplanation for the increase could be the disturbance of thegrassy approach leading to the debris basin and terrace duringpen construction. The compromised grassy approach mayhave contributed to the previously collected organic materi-al. In addition, the pen surface was relatively new, and nottypical of most seasoned pen surfaces.
Discharge water contained 2830, 1520, and 9680 kg ofTSS, VSS, and COD, respectively (table 2). This resulted ina 1.9 TSS/VSS ratio. The discharge TSS total was less thanfor year 2000, while the VSS total was nearly 50% greater.The soil used to renovate the pen surfaces was a calcareoussubsoil that was dominated by calcium carbonate complexes.These complexes do not settle readily and would passthrough to the discharge water. These complexes arevolatilized during the 550°C of the VSS analysis (Nelson andSommers, 1994). This increase in inorganic volatile sus-pended solids appears to be confirmed by examining theCOD total for the 1999 and 2001 seasons. The 2001 CODtotals were twice the 1999 season totals; however, total runoffvolume was nearly twice as great, indicating the oxygendemand was similar.
Runoff TSS concentrations during the 2001 season rangedfrom 1900 mg L-1 to 7360 mg L-1, while dischargeconcentrations ranged between 500 and 1500 mg L-1 (fig. 3).There was significant reduction (p = 0.05) between runoffand discharge concentrations for all runoff events. The TSSconcentrations were similar to the previous two seasons.Similarly, runoff VSS concentrations ranged from 870 to2240 mg L-1, while discharge VSS concentrations rangedfrom 230 to 710 mg L-1 (fig. 4). Volatile suspended solidsconcentrations were similar to the previous two seasons, withsignificant reduction between runoff and discharge con-centrations for all precipitation events. The runoff CODconcentrations ranged from 3970 to 6730 mg L-1 (fig. 5). Theeffluent COD concentrations ranged from 1440 to 4110 mgL-1 (fig. 5). Chemical oxygen demand concentrations werecomparable to the 1999 season, and significantly reducedbetween the runoff and discharge concentration for allmeasured events.
CONCLUSIONSThere was an average 80%, 67%, and 59% reduction in
contaminants as measured by TSS, VSS, and COD, respec-tively, as the runoff passed through the debris basin for thethree seasons. These solids were retained in the basin andcollected annually for application to cropland as a fertilizeramendment. Significant reductions in TSS, VSS, and CODconcentration of runoff water were measured for most of theprecipitation events.
No water was ever detected exiting the VFS, so thedischarge water was effectively used by the hay crop forproduction. The estimated nitrogen load in the dischargewater leaving the basin and entering the vegetative filter stripwas equivalent to or less than the total nitrogen removed bythe hay crop. This would indicate that the overall runoffcontrol and treatment system was sustainable with respect tototal nitrogen discharged from the basin.
The robustness of the passive treatment system wasdemonstrated during feedlot pen renovation, when signifi-cant reductions in VSS and COD concentrations weremeasured for all events. Similarly, significant reductions inTSS concentrations were measured for all but one eventduring the 2000 season. Improvements in concentrationreduction may have been increased had more attention beenplaced on reestablishment of the grassy approach followingpen renovations.
The ratio of TSS/VSS decreased as the runoff water passedthrough the system. This would indicate that the debris basinwas most effective at removing more dense suspended solidslike soil particles. However, more data will have to becollected to evaluate this trend as the pen surface becomesmore seasoned following renovations.
ACKNOWLEDGEMENTS
The authors would like to acknowledge Kimberly Ely forher assistance in data collection and analyses.
REFERENCESAPHA. 1992. Standard Methods for the Examination of Water and
Wastewater. 18th ed. Washington, D.C.: American Public HealthAssociation.
Eigenberg, R. A., R. L. Korthals, J. A. Nienaber, and G. L. Hahn.1998. Implementation of a mass balance approach to predictingnutrient fate of manure from beef cattle feedlots. Applied Eng. inAgric. 14(5): 475-484.
EPA. 2003. Federal Register 68(29). 40 CFR Parts 9, 122, 123, and412.
Grant, D. C. 1991. Isco Open Channel Flow MeasurementHandbook. Lincoln, Neb.: Isco, Inc.
Hach. 1992. Hach Water Analysis Handbook. 2nd ed. Loveland,Colo.: Hach Company.
Huffman, R. L., and P. W. Westerman. 1995. Estimated seepagelosses from established swine waste lagoon in the lower coastalplain of North Carolina. Trans. ASAE 38(2): 449-453.
McCullough, M. C., D. B. Parker, B. W. Auvermann, and C.Robinson. 1999. Investigation of seal formation on the profile.ASAE Paper No. 994081. St. Joseph, Mich.: ASAE.
Mulvaney, R. L. 1996. Nitrogen: Inorganic forms. Chapter 38 inMethods of Soil Analysis: Part 3. Chemical Methods. J. M.Bigham, ed. Madison, Wisc.: SSSA.
Nelson, D. W., and L. E. Sommers. 1994. Total carbon, organiccarbon, and organic matter, Chapter 34 in Methods of Soil

1530 TRANSACTIONS OF THE ASAE
Analysis: Part 3. Chemical Methods, 961-1010. D. L. Sparks,ed. Madison, Wisc.: SSSA, ASA.
Parker, D. B., D. E. Eisenhauer, D. D. Schulte, and D. L. Martin.1999. Modeling seepage from an unlined beef cattle feedlotrunoff storage pond. Trans. ASAE 42(5): 1437-1445.
Westerman, P. W., R. L. Huffman, and J. S. Feng. 1995.Swine-lagoon seepage in sandy soil. Trans. ASAE 38(6):1749-1760.
Woodbury, B. L., J. A. Nienaber, and R. A. Eigenberg. 2002.Operational evaluation of a passive beef cattle runoff control andtreatment system. Applied Eng. in Agric. 18(5): 541-545.