performance pay and top-management incentives
TRANSCRIPT
Performance Pay and Top-Management IncentivesAuthor(s): Michael C. Jensen and Kevin J. MurphyReviewed work(s):Source: Journal of Political Economy, Vol. 98, No. 2 (Apr., 1990), pp. 225-264Published by: The University of Chicago PressStable URL: http://www.jstor.org/stable/2937665 .Accessed: 24/02/2012 10:24
Your use of the JSTOR archive indicates your acceptance of the Terms & Conditions of Use, available at .http://www.jstor.org/page/info/about/policies/terms.jsp
JSTOR is a not-for-profit service that helps scholars, researchers, and students discover, use, and build upon a wide range ofcontent in a trusted digital archive. We use information technology and tools to increase productivity and facilitate new formsof scholarship. For more information about JSTOR, please contact [email protected].
The University of Chicago Press is collaborating with JSTOR to digitize, preserve and extend access to Journalof Political Economy.
http://www.jstor.org

Performance Pay and Top-Management Incentives
Michael C. Jensen Harvard University
Kevin J. Murphy University of Rochester
Our estimates of the pay-performance relation (including pay, op- tions, stockholdings, and dismissal) for chief executive officers indi- cate that CEO wealth changes $3.25 for every $1,000 change in shareholder wealth. Although the incentives generated by stock ownership are large relative to pay and dismissal incentives, most CEOs hold trivial fractions of their firms' stock, and ownership levels have declined over the past 50 years. We hypothesize that public and private political forces impose constraints that reduce the pay- performance sensitivity. Declines in both the pay-performance rela- tion and the level of CEO pay since the 1930s are consistent with this hypothesis.
The conflict of interest between shareholders of a publicly owned corporation and the corporation's chief executive officer (CEO) is a
We have benefited from the assistance of Stephanie Jensen, Natalie Jensen, Mary Rojek, and Mike Stevenson and from the comments of Sherwin Rosen (the editor), George Baker, Carliss Baldwin, Ray Ball, Gary Becker, Joseph Bower, James Brickley, Jeffrey Coles, Harry DeAngelo, Robert Gibbons, Gailen Hite, Clifford Holderness, Robert Kaplan, Steven Kaplan, Edward Lazear, Richard Leftwich, John Long, Jay Lorsch, John McArthur, Paul MacAvoy, Kenneth McLaughlin, Kenneth Merchant, Andrall Pearson, Ronald Schmidt, G. William Schwert, Robert Simons, Jerold Warner, Ross Watts, and Jerold Zimmerman. This research is supported by the Division of Research, Harvard Business School; the Managerial Economics Research Center, Uni- versity of Rochester; and the John M. Olin Foundation.
Journal of Political Economy, 1990, vol. 98, no. 2] ? 1990 by The University of Chicago. All rights reserved. 0022-3808/90/9802-0006$01.50
225

226 JOURNAL OF POLITICAL ECONOMY
classic example of a principal-agent problem. If shareholders had complete information regarding the CEO's activities and the firm's investment opportunities, they could design a contract specifying and enforcing the managerial action to be taken in each state of the world. Managerial actions and investment opportunities are not, however, perfectly observable by shareholders; indeed, shareholders do not often know what actions the CEO can take or which of these actions will increase shareholder wealth. In these situations, agency theory predicts that compensation policy will be designed to give the man- ager incentives to select and implement actions that increase share- holder wealth.
Shareholders want CEOs to take particular actions-for example, deciding which issue to work on, which project to pursue, and which to drop-whenever the expected return on the action exceeds the expected costs. But the CEO compares only his private gain and cost from pursuing a particular activity. If one abstracts from the effects of CEO risk aversion, compensation policy that ties the CEO's welfare to shareholder wealth helps align the private and social costs and benefits of alternative actions and thus provides incentives for CEOs to take appropriate actions. Shareholder wealth is affected by many factors in addition to the CEO, including actions of other executives and employees, demand and supply conditions, and public policy. It is appropriate, however, to pay CEOs on the basis of shareholder wealth since that is the objective of shareholders.
There are many mechanisms through which compensation policy can provide value-increasing incentives, including performance- based bonuses and salary revisions, stock options, and performance- based dismissal decisions. The purpose of this paper is to estimate the magnitude of the incentives provided by each of these mechanisms. Our estimates imply that each $1,000 change in shareholder wealth corresponds to an average increase in this year's and next year's salary and bonus of about two cents. We also estimate the CEO wealth conse- quences associated with salary revisions, outstanding stock options, and performance-related dismissals; our upper-bound estimate of the total change in the CEO's wealth from these sources that are under direct control of the board of directors is about 75? per $1,000 change in shareholder wealth.
Stock ownership is another way an executive's wealth varies with the value of the firm. In our sample CEOs hold a median of about 0.25 percent of their firms' common stock, including exercisable stock options and shares held by family members or connected trusts. Thus the value of the stock owned by the median CEO changes by $2.50 whenever the value of the firm changes by $1,000. Therefore, our final all-inclusive estimate of the pay-performance sensitivity-
TOP-MANAGEMENT INCENTIVES 227
including compensation, dismissal, and stockholdings-is about $3.25 per $1,000 change in shareholder wealth.
In large firms CEOs tend to own less stock and have less compensa- tion-based incentives than CEOs in smaller firms. In particular, our all-inclusive estimate of the pay-performance sensitivity for CEOs in firms in the top half of our sample (ranked by market value) is $1.85 per $1,000, compared to $8.05 per $1,000 for CEOs in firms in the bottom half of our sample.
We believe that our results are inconsistent with the implications of formal agency models of optimal contracting. The empirical relation between the pay of top-level executives and firm performance, while positive and statistically significant, is small for an occupation in which incentive pay is expected to play an important role. In addition, our estimates suggest that dismissals are not an important source of mana- gerial incentives since the increases in dismissal probability due to poor performance and the penalties associated with dismissal are both small. Executive inside stock ownership can provide incentives, but these holdings are not generally controlled by the corporate board, and the majority of top executives have small personal stockholdings.
Our results are consistent with several alternative hypotheses; CEOs may be unimportant inputs in the production process, for ex- ample, or their actions may be easily monitored and evaluated by corporate boards. We offer an additional hypothesis relating to the role of political forces in the contracting process that implicitly regu- late executive compensation by constraining the type of contracts that can be written between management and shareholders. These polit- ical forces, operating both in the political sector and within organiza- tions, appear to be important but are difficult to document because they operate in informal and indirect ways. Public disapproval of high rewards seems to have truncated the upper tail of the earnings distri- bution of corporate executives. Equilibrium in the managerial labor market then prohibits large penalties for poor performance, and as a result the dependence of pay on performance is decreased. Our findings that the pay-performance relation, the raw variability of pay changes, and inflation-adjusted pay levels have declined substantially since the 1930s are consistent with such implicit regulation.
I. Estimates of the Pay-Performance Sensitivity
We define the pay-performance sensitivity, b, as the dollar change in the CEO's wealth associated with a dollar change in the wealth of shareholders. We interpret higher b's as indicating a closer alignment of interests between the CEO and his shareholders. Suppose, for example, that a CEO is considering a nonproductive but costly "pet

228 JOURNAL OF POLITICAL ECONOMY
project" that he values at $100,000 but that will diminish the value of his firm's equity by $10 million. The CEO will avoid this project if his pay-performance sensitivity exceeds b = .01 (through some combina- tion of incentive compensation, options, stock ownership, or probabil- ity of being fired for poor stock price performance) but will adopt the project if b < .01.
Incentives Generated by Cash Compensation
The pay-performance sensitivity is estimated by following all 2,213 CEOs listed in the Executive Compensation Surveys published in Forbes from 1974 to 1986. These surveys include executives serving in 1,295 corporations, for a total of 10,400 CEO-years of data. We match these compensation data to fiscal year corporate performance data obtained from the data files of the Compustat and the Center for Research in Security Prices (CRSP). After observations with missing data are eliminated, the final sample contains 7,750 yearly "first dif- ferences" in compensation and includes 1,688 executives from 1,049 corporations. Fiscal year stock returns are unavailable for 219 of the 7,750 observations; calendar-year returns are used in these cases. (Deleting these 219 observations does not affect the results.) All mon- etary variables are adjusted for inflation (using the consumer price index for the closing month of the fiscal year) and represent thousands of 1986 constant dollars.
Table 1 summarizes estimates of the relation between CEO cash compensation and firm performance as measured by the change in shareholder wealth. Column 1 of table 1 reports estimated coeffi- cients from the following least-squares regression:
A(CEO salary + bonus)t = a + bA(shareholder wealth)t. (1)
The change in shareholder wealth variable is defined as rt~tV 1, where rt is the inflation-adjusted rate of return on common stock realized in fiscal year t, and Vi I is the firm value at the end of the previous year.
Our measure of firm performance is subject to two qualifications. First, performance should be evaluated before compensation expense, and yet rt~tV 1 is the change in firm value after compensation expense; the associated bias in our estimates is small, however, because CEO pay changes are tiny relative to changes in firm value. Second, our measure of performance ignores payments to capital. When capital is an important input, a better performance measure is rt~tV 1 - ftKt- 1, where ft and Kt -1 are the risk-free interest rate for period t and the opportunity cost of the capital stock at the beginning of period t. Since f and shareholder return r tend to be uncorrelated, this adjustment will not substantially affect our estimates. Fama and Schwert (1977)

TOP-MANAGEMENT INCENTIVES 229
TABLE 1
ESTIMATES OF PAY-PERFORMANCE SENSITIVITY: COEFFICIENTS OF ORDINARY LEAST
SQUARES REGRESSIONS OF A(SALARY + BONUS), A(TOTAL PAY), AND A(PAY-RELATED
WEALTH) ON CURRENT AND LAGGED A(SHAREHOLDER WEALTH)
DEPENDENT VARIABLE
(in Thousands of 1986 Constant Dollars)
Total Pay + A(Salary + Bonus) PV[A(Salary
INDEPENDENT A(Total Pay)t + Bonus)]t VARIABLE (1) (2) (3) (4)
Intercept 31.7 30.8 36.6 918.0
Change in shareholder .0000135 .0000139 .0000235 .000197 wealth (thousands of (8.0) (8.4) (5-2) (9.7) 1986 dollars)
Change in shareholder ... .0000080 .0000094 .000103 wealth in year t - 1 (5.5) (2.4) (5.8)
R 2 .0082 .0123 .0041 .0157
Estimated pay-perfor- mance sensitivity, bP .0000135 .0000219 .0000329 .000300
F-statistic for b 64.0* 93.0* 28.5* 117.7*
Sample size 7,750 7,688 7,688 7,688
NOTE.-The sample is constructed from longitudinal data reported in Forbes on 1,668 CEOs serving in 1,049 firms for the years 1974-86. A(shareholder wealth) is defined as the beginning-of-period market value multiplied by the inflation-adjusted rate of return on common stock. t-statistics are in parentheses.
Significant at the 0.01 percent level. t The Forbes definition of total compensation typically includes salary, bonus, value of restricted stock, savings and
thrift plans, and other benefits but does not include the value of stock options granted or the gains from exercising stock options.
t Present value based on the assumption that the CEO receives salary and bonus increment until age 70 at a discount rate of 3 percent.
? Estimated b is the sum of the coefficients on the contemporaneous and lagged shareholder wealth change
find an R2 of .03 between nominal riskless rates and 1-month returns on a value-weighted portfolio of New York Stock Exchange (NYSE) firms.
The coefficient on the shareholder wealth variable of b = .0000135 in column 1 is statistically significant (t = 8.0), indicating a positive relation between cash compensation and firm performance. The eco- nomic significance of the estimated coefficient is low, however. The coefficients in column 1 imply, for example, that a CEO receives an average pay increase of $31,700 in years in which shareholders earn a zero return and receives on average an additional 1.35? for each $1,000 increase in shareholder wealth. These estimates are compara- ble with those of Murphy (1985, 1986), Coughlan and Schmidt (1985), and Gibbons and Murphy (1990), who find a pay- performance elasticity of approximately .1: salaries and bonuses in-

230 JOURNAL OF POLITICAL ECONOMY
crease by about 1 percent for every 10 percent rise in the value of the firm. Converting this estimate of the pay-performance elasticity to absolute dollars by multiplying by the median pay to value ratio of 0.057 percent (calculated for the 9,976 CEO-years in the Forbes sam- ple for 1974-86) yields an estimated coefficient b = .000057, which is larger than, but consistent with, the estimate in column 1 of table 1.
The median annual standard deviation of shareholder wealth changes for firms in our sample is about $200 million, so the average pay change associated with a stockholder wealth change two standard deviations above or below normal (a gain or loss of $400 million) is $5,400. Thus the average pay increase for a CEO whose shareholders gain $400 million is $37,100, compared to an average pay increase of $26,300 for a CEO whose shareholders lose $400 million.
Equation (1) assumes that current stock price performance affects current compensation, and yet the timing of performance payments is often ambiguous. At the simplest level, bonus decisions may be made before final fiscal year earnings data are available. In other cases boards may know this year's earnings, but the earnings and stock price changes available at the end of the fiscal year may not correctly incorporate the effects of managerial actions during the year. In addition, bonuses reported in proxy statements sometimes represent bonuses paid for performance in the previous year, and the proxies do not always clearly specify when the bonus payment year differs from the bonus measurement year.
Column 2 of table 1 reports coefficients from the following regres- sion, which allows current pay revisions to be based on past as well as current performance:
A(CEO salary + bonus)t = a + bA(shareholder wealth)t (2)
+ b2A(shareholder wealth)t 1.
The coefficient for year t - 1 is positive and statistically significant, indicating that last year's performance does matter in the determina- tion of this year's pay revision. The sum of the coefficients, b b1 + b2 = .0000219, is statistically significant (F = 93.0), suggesting that the CEO receives a total pay revision of 2.2? for each $1,000 change in shareholder wealth. We cannot tell how much of this effect represents a real lag of rewards on performance and how much represents sim- ple measurement errors caused by lags in reporting. We also estimate the relation with three years of lagged shareholder wealth changes with little difference from the results reported in column 2 of table 1; the coefficients on the contemporaneous and first lagged perfor- mance variables are essentially unchanged and those on the second and third lags are small in magnitude and statistically insignificant.

TOP-MANAGEMENT INCENTIVES 231
We reestimate the regression in column 1 of table 1 using 2- and 3- year differences; the results are quantitatively unchanged from those in the table. We also reestimate the regression in column 2 of table 1 after including year dummy variables and separate intercepts for each sample CEO, and the estimated coefficients and their sum are virtually identical to those reported in the table. To allow the pay- performance sensitivity to vary across CEOs, we also estimate separate regressions for each of 717 sample CEOs with five or more observa- tions. The median estimated 2-year pay-performance relation for the sample of individually estimated coefficients is b = .000073, or a median pay raise of 7.3? per $1,000 increase in shareholder wealth.
The regressions in columns 1 and 2 of table 1 are based only on the CEO's salary and bonus, but CEOs receive compensation in many additional forms, including deferred compensation, stock options, profit-sharing arrangements, stock grants, savings plans, long-term performance plans, and other fringe benefits. The Forbes surveys in- clude data on many of these other components of compensation. The surveys do not, however, include stock option data prior to 1978, and after 1978 the surveys report gains from exercising options but do not report the value of outstanding options or the value of stock options granted during the year.
Column 3 of table 1 reports the relation between total compensa- tion and firm performance based on the Forbes total compensation data, excluding both stock option grants and the gains from exercis- ing stock options. The Forbes definition of total compensation varies somewhat from year to year but in general includes salary, bonus, value of restricted stock, savings and thrift plans, and other benefits. The sum of the estimated coefficients of current and lagged change in shareholder wealth is b = .0000329, indicating that total compensa- tion changes by 3.3? for each $1,000 change in firm value.
The dependent variable in column 3 of table 1 represents the change in the current cash flows accruing to the CEO, while the in- dependent variables represent the discounted present value of the change in all future cash flows accruing to the shareholders. A mea- sure of the change in CEO wealth that is more consistent with the measure of the change in shareholder wealth is current compensation plus the discounted present value of the permanent component of the change in current compensation. Suppose, for example, that CEOs receive only a base salary and that firm performance is rewarded by a permanent shift in the base salary. Then the appropriate measure of the change in CEO wealth is salary + PV(Asalary), where PV(Asalary) is the present value of the salary change from next year through the year in which the CEO leaves the firm.
Measuring the discounted present value of a change in current

232 JOURNAL OF POLITICAL ECONOMY
compensation is difficult for several reasons. First, Forbes reports only the sum of salaries and bonuses, and while it may be appropriate to include PV(Asalary) in the measure of A(CEO wealth), it is less clear that PV(Abonus) should be included since bonuses may be transitory and not permanent components of income. In addition, assumptions must be made regarding the number of periods remaining over which Asalary will be realized. Even when the firm has a 65-year mandatory retirement age, there is some probability that the CEO will leave the firm before age 65. At the other extreme, pension benefits are generally based on average salaries received during some period shortly before retirement; consequently an increase in salary may increase pension payments to the CEO long after the CEO leaves the firm.
The dependent variable in column 4 of table 1 is A(CEO wealth), measured as
A(CEO wealth) = total pay + PV[A(salary + bonus)].
The present value of the salary and bonus increment is calculated assuming a real interest rate of 3 percent per year. In order to get an upper bound on the estimate of the pay-performance sensitivity, we assume that all changes in salary and bonus are permanent. We as- sume that the CEO receives the increment until age 70. If the CEO is younger than 70, we take the present value of his wage change until he reaches 70, but if he is older than 70, we assume that he is in his last year with the firm.
The coefficients in column 4 imply that, on average, CEO wealth increases by $918,000 in years in which shareholders earn a zero return (the average CEO total pay excluding stock options for the sample is $575,000). In addition, the estimate for b in column 4 im- plies that the CEO's pay-related wealth (exclusive of stock options) increases by 30? for each $1,000 increase in shareholder wealth. Thus the average pay-related wealth increase for a CEO whose sharehold- ers gain $400 million is $1.04 million, compared to an average annual wealth increase of $800,000 for a CEO whose shareholders lose $400 million.
Incentives Generated by Stock Options
The Forbes definition of total pay excludes stock options, but stock options clearly provide value-increasing incentives for chief execu- tives. Year-to-year stock option grants provide incentives if the size of the grant is based on performance. More important, the change in value of unexercised stock options granted in previous years also provides incentives.

TOP-MANAGEMENT INCENTIVES 233
To calculate a more complete measure of the CEO's wealth change, which includes options, we analyzed the proxy statements from Mur- phy's (1985) sample of 73 Fortune 500 manufacturing firms during the 15-year period 1969-83. Data on stock options, salaries, bonuses, deferred compensation, and fringe benefits from these statements are used to construct a longitudinal sample of 154 CEOs. Total compen- sation is defined as the sum of salaries, bonuses, fringe benefits, the face value of deferred compensation unadjusted for the cost of restrictions on marketability and the time value of money, and re- stricted stock awarded during the year (valued at the end-of-year stock price).
At the end of each year, CEOs typically hold stock options granted in different years at different exercise prices and exercise dates. The value of all options held by the CEO is calculated by applying the Black-Scholes (1973) valuation formula, which allows for continu- ously paid dividends (Noreen and Wolfson 1981; Murphy 1985). The value of options held at the end of year X is calculated as
L N- [S.e-dTI?(Zt) - Pte rT(Zt - he)], t 0
where Nt is the number of options granted in year t at exercise price Pt, T is the number of months until expiration of these options, r is the average monthly market yield on 5-year government securities in year T, d is the dividend yield in year X - 1 defined as ln[1 + (dividends per share/closing stock price)]/12, or is the estimated standard devia- tion of stock returns over the previous 60-month period, ST is the stock price at the end of fiscal year T, Z {ln(S,/Pt) + [r - d + (cr2/2)]T}/crNV, and F(.) is the cumulative standard normal distribu- tion function.
The change in the value of options held at the end of each year is calculated as the value of the options awarded during the year plus the change in the value of all outstanding options during the year plus the profits (price minus exercise price) from exercising options dur- ing the year. Data on actual exercise prices are not available; to get an upper bound on this measure, we assume that options are always exercised at the highest stock price observed during the year.
Column 1 of table 2 reports least-squares regression results for the 73-firm sample in which the dependent variable is the change in the value of the CEO's stock options. The sum of the estimated coeffi- cients implies that the value of CEO stock options increases an aver- age of 14.5? for each $1,000 increase in shareholder wealth. There- fore, the incentives generated by stock options are large relative to the incentives generated by annual changes in cash compensation (3.3?

TABLE 2 ESTIMATES OF PAY-PERFORMANCE SENSITIVITY INCLUDING STOCKHOLDINGS AND
OPTIONS: COEFFICIENTS OF ORDINARY LEAST SQUARES REGRESSIONS OF
A(CEO WEALTH) ON A(SHAREHOLDER WEALTH) FOR CEOs IN 73 MANUFACTURING FIRMS FOR 1969-83
DEPENDENT VARIABLE (Thousands of 1986 Constant Dollars
A(Value of Inside Stock)t
Total Pay + + Total Pay + PV[A(Salary PV[A(Salary
+ Bonus)] + + Bonus)] + A(Value of A(Value of
A(Value of Stock Options) Stock Options) INDEPENDENT Stock Options)
VARIABLE (1) (2) (3) (4) (5)
Intercept 79.4 815.9 816.1 818.4 892.9 Change in .000105 .000176 .000174 .00118 .000198
share- (8.6) (5.2) (5.0) (4.4) (3.7) holder wealth ($ thousands)
Change in .000040 .000131 .000130 .00031 .000168 share- (3.3) (3.8) (3.8) (1.2) (3.1) holder wealth in year t - 1
CEO's frac- ... ... .00294 ... 1.020 tional own- (.7) (145.0) ership X change in share- holder wealth
R 2 .0807 .0376 .0381 .0216 .9610 Estimated
pay-per- formance sensitivity, b .000145 .000307 .0003091 .00149 .0020O
F-statistic for b 58.3* 33.0* 33.2* 12.5* 565.2*
NOTE.-Sample size is 877 for all regressions. A(shareholder wealth) is defined as the beginning-of-period market value multiplied by the inflation-adjusted rate of return on common stock. A(value of stock options) includes profits from exercising options, value of options granted in current year, and the change in the value of previously granted options based on Black and Scholes (1973). Total pay includes salary, bonus, value of restricted stock, savings and thrift plans, and other benefits; PV[A(salary + bonus)] is based on the assumption that the CEO receives salary and bonus increment until age 70 at a discount rate of 3 percent. t-statistics are in parentheses.
* Significant at the 0.01 percent level. Inside stockholdings include shares held by family members and shares for which the CEO is a trustee or
cotrustee without beneficial ownership. A(value of inside stock) is defined as the beginning-of-period value of inside stock multiplied by the inflation-adjusted rate of return on common stock. Stock ownership data are unavailable for 50 of the (73 x 15) = 1,095 possible CEO-years.
i Estimated b and related test statistic for a CEO with median fractional ownership for the sample, .0016.

TOP-MANAGEMENT INCENTIVES 235
per $1,000 from col. 3 of table 1) even though options valued at date of grant account for a relatively small share of the CEO's compensa- tion (8.1 percent for CEOs in the 73-firm sample).
Column 2 of table 2 reports regression coefficients for the 73-firm sample in which the dependent variable is the change in all pay- related wealth, defined as
A(CEO pay-related wealth) = total pay + PV[A(salary + bonus)]
+ A(value of stock options).
The present value of the salary and bonus increment is again cal- culated assuming that the CEO receives the salary and bonus incre- ment until age 70 at a real interest rate of 3 percent per year. The sum of the estimated coefficients on the current and lagged shareholder wealth change variables of b = .000307 (F = 33.0) implies that CEO wealth changes by over 30? for each $1,000 change in share- holder wealth.
To check on potential differences between the 73-firm sample and the Forbes sample, we reestimated the Forbes regression in column 2 of table 1 for the 73 manufacturing firms and obtained b = .0000196 (compared to .0000219 for the Forbes sample). We also reestimated column 2 of table 2 after excluding stock options and obtained b = .0000163 (compared to .000300 as reported in table 1 for the Forbes sample).
Incentives Generated by Inside Stock Ownership
Stock ownership is another way that an executive's welfare varies directly with the performance of his firm, independent of any link between compensation and performance. Although the process through which CEOs select their equilibrium stockholdings is not well understood, the incentives generated by these shareholdings clearly add to the incentives generated by the compensation package. Stock ownership data for the CEOs in the 73 firms in the manufacturing firm sample were obtained from the proxy statements; these execu- tives held an average of $4.8 million (in 1986 constant dollars) of their firm's common stock in the period 1969-83. When we include shares held by family members and shares for which the CEO serves as a trustee or cotrustee, the average increases to $8.8 million. Year-to- year changes in the value of these holdings often exceed levels of total compensation by orders of magnitude (Lewellen 1971; Benston 1985; Murphy 1985).
Column 4 of table 2 reports regression coefficients in which the dependent variable is a measure of the change in the CEO's wealth

236 JOURNAL OF POLITICAL ECONOMY
that includes the change in the value of his inside stockholdings. Changes in the value of inside stockholdings are calculated as the value of the shares held at the beginning of the fiscal year multiplied by the realized rate of return on common stock. To get an upper bound on the estimate, inside stock ownership includes shares held by family members and shares for which the CEO is a nonbeneficial trustee or cotrustee, as well as shares held directly.
The sum of the shareholder wealth change coefficients in column 4 implies that the wealth of CEOs increases (or decreases) by about $1.50 whenever shareholder wealth increases (or decreases) by $1,000. The difference between the estimated b in columns 2 and 4 suggests that, on average, inside stock ownership plays an important role in providing managerial incentives.
Our regression specification in column 2 of table 2 assumes that the pay-performance relation is the same for all executives, regardless of their stockholdings, but it is plausible that b is large and positive for executives with negligible stockholdings but small or even negative for executives with large holdings since their wealth may be tied "too closely" to the performance of their firms. We test for this potential heterogeneity by reestimating the regressions for the 15-year, 73-firm sample after including an interaction term, CEO's fractional own- ership x> A(shareholder wealth), to capture the effects of ownership on the sensitivity of pay to performance.
The dependent variable in the regression in column 3 of table 2 is the change in all pay-related wealth (including stock options but excluding stock ownership). The small and insignificantly positive coefficient of the ownership interaction variable (t = 0.7) implies that the relation between compensation and performance is independent of an executive's stockholdings. The result that the pay-performance relation is not affected by stock ownership seems inconsistent with theory since optimal compensation contracts that provide incentives for managers to create shareholder wealth will not be independent of their shareholdings.
The dependent variable in the regression in column 5 of table 2 is the change in CEO wealth, including all forms of compensation plus changes in the value of his individual shareholdings. The coefficient on the interaction term is highly significant (t = 145.0) and close to unity, suggesting that the pay-performance sensitivity for a CEO with nonnegligible stockholdings is closely approximated by his fractional ownership. Since the total pay-performance relation is given by b = .000366 + 1.020 x fractional ownership, the sensitivity for a CEO who owns no stock is equivalent, on average, to stockholdings of 0.0366 percent of the firm. The total pay-performance sensitivity for a CEO with shareholdings of 0.16 percent (the median shareholdings

TOP-MANAGEMENT INCENTIVES 237
TABLE 3 CEO INSIDE STOCK OWNERSHIP: SUMMARY STATISTICS AND QUINTILE BOUNDARIES FOR
PERCENTAGE AND VALUE OF CEO STOCK OWNERSHIP FOR 746 CEOs LISTED IN
1987 FORBES EXECUTIVE COMPENSATION SURVEY, BY FIRM SIZE
CEO STOCK OWNERSHIP VALUE OF CEO AS PERCENTAGE OF STOCKHOLDINGS
SHARES OUTSTANDING ($ Millions)
All Small Large All Small Large
Firms Firms Firms Firms Firms Firms
(1) (2) (3) (4) (5) (6)
Mean 2.42% 3.05% 1.79% $41.0 $19.3 $62.6 Median .25 .49 .14 3.5 2.6 4.7
Quintile boundaries: Min less than .01% less than $0.1 20% .05 .11 .03 .7 .5 1.2 40% .17 .33 .10 2.5 1.9 3.3 60% .42 .73 .20 5.1 3.6 7.2 80% 1.38 1.95 .75 17.4 10.5 22.6 Max 83.00 83.00 53.50 2,304.2 1,041.0 2,304.2
Median value of equity ($ millions): $1,200 $580 $2,590
NOTE.-Stock ownership includes shares held by family members and also includes options that can be exercised within 60 days. Small firms have market value below the sample median ($1.2 billion); large firms have market value exceeding the median.
for CEOs in the 73-firm sample) is equivalent to b = .0020, or $2.00 per $1,000 change in shareholder wealth.
Table 3 summarizes fractional stock ownership data for a much larger sample of CEOs. The 746 CEOs included in the 1987 Forbes Executive Compensation Survey hold an average of 2.4 percent of their firms' common stock, including shares held by family members and options that can be exercised within 60 days. The distribution of inside stock ownership is skewed; the median CEO holds only 0.25 percent of his firm's stock. Twenty percent of the sample CEOs hold less than 0.05 percent of their firms' stock, and 60 percent hold less than 0.42 percent. Small fractional ownership is even more prevalent in the largest Forbes firms (ranked according to market value), where 80 percent of the CEOs hold less than 0.75 percent of their firms' common stock.
In dollar terms, table 3 shows that CEOs in the Forbes survey firms hold an average of over $40 million of their firms' stock. Once again, the distribution is skewed: the median stock ownership is only $3.5 million (compared to median 1986 total compensation of $700,000). The CEOs in large firms, while owning a smaller fraction of their firms' common stock, tend to have a larger dollar investment in their firms' shares.

238 JOURNAL OF POLITICAL ECONOMY
TABLE 4
RELATION BETWEEN CEO TURNOVER AND FIRM PERFORMANCE: ESTIMATED LOGISTIC
MODELS PREDICTING CEO TURNOVER USING CURRENT AND LAGGED NET-OF-MARKET SHAREHOLDER RETURN FOR CEOS GROUPED ACCORDING TO AGE
COEFFICIENT ESTIMATES, BY AGE GROUP
Less than Full 50 Years Between 50 Between 55 Between 60 64 Years
INDEPENDENT Sample Old and 55 and 60 and 64 or Older VARIABLE (1) (2) (3) (4) (5) (6)
Intercept - 2.08 - 3.30 - 3.03 - 2.66 -1.97 -.442
Current net-of-market - .6363 -1.921 - .3946 - .5307 -1.216 - .2453 return (-5.1) (-3.4) (-1.0) (-1.8) (-4.3) (-1.1)
Lagged net-of-market - .4181 - .6219 - .0651 - .2913 - .5510 - .5154 return (-3.5) (-1.3) (-.2) (- 1.0) (-2.1) (-2.3)
Sample size 9,291 1,345 1,935 2,728 2,171 1,112 Number of 992 47 87 174 258 426
CEO turnovers
Significance of model .0001 .0021 .5683 .1046 .0001 .0298
NOTE.-The sample is constructed from longitudinal data reported in Forbes on 1,896 CEOs serving in 1,092 firms for 1974-86. Net-of-market return is defined as the fiscal year shareholder return minus the value-weighted return of all NYSE firms. The dependent variable is equal to one if the CEO is serving in his last full fiscal year and zero otherwise. Asymptotic t-statistics are in parentheses.
Incentives Generated by the Threat of Dismissal
The threat of management dismissal for poor performance also pro- vides value-increasing incentives to the extent that managers are earning more than their opportunity cost. Recent studies by Cough- lan and Schmidt (1985), Warner, Watts, and Wruck (1988), and Weis- bach (1988) have documented an inverse relation between net- of-market firm performance and the probability of management turnover. These results suggest that managers are more likely to leave their firms after bad years than after good years and therefore are disciplined by the threat of termination.
Table 4 reports coefficients from logistic regressions predicting the probability of CEO turnover as a function of firm performance for the 13-year sample of 2,213 CEOs listed in the Forbes surveys. We estimate the following relation:
F prob(turnover) 1l In prob(turnover) J = a + bl(net-of-market return) I - prob(turnover)
+ b2(lagged net-of-market return).
The dependent variable equals one if the CEO is serving in his last full fiscal year and equals zero otherwise. The 1988 Forbes survey was examined to identify CEOs whose last fiscal year was 1986. The final CEO-year for firms leaving the Forbes survey is excluded since we cannot determine whether or not this is the last year for that CEO. A

TOP-MANAGEMENT INCENTIVES 239
total of 582 firms were deleted from the Forbes surveys during the 1974-86 sample period. Of these, 293 are still "going concerns" as of 1987, 214 were acquired by or merged with another firm (118 of these were acquired or merged within 2 years of the-Forbes delisting), and 35 liquidated, went bankrupt, or went private. Current status data are unavailable for 40 of the 582 firms.
Consistent with the previous studies, column 1 of table 4 shows that the probability that a CEO is serving in his last full fiscal year is negatively related to current and past firm performance as measured by the return realized by shareholders in excess of the value-weighted return on the common stock of all NYSE firms. If we convert the regression coefficients into estimated dismissal probabilities, the re- gression in column 1 implies that a CEO in a firm realizing returns equal to the market return in each of the past 2 years has a .111 dismissal probability, calculated as p = exI(l + ex), where x = - 2.08 - .6363(net-of-market return) - .4181 (lagged net-of-market re- turn). The same CEO has a .175 dismissal probability when the firm earns a - 50 percent return relative to the market in each of the two previous years. Because it is usually impossible to tell whether the CEO was fired or simply quit or retired, the term "dismissal probabil- ity" is used only as shorthand for the more accurate "probability of CEO turnover."
The specification in column 1 of table 4 assumes that the relation between performance and turnover likelihood is the same for all ex- ecutives, but Vancil (1987) argues that CEOs are more likely to be fired when they are young than when they are closer to normal retire- ment. Columns 2-6 of table 4 report results from logistic dismissal regressions for CEOs grouped according to age: younger than 50, between 50 and 55, between 55 and 60, between 60 and 64, and 64 years or older. The magnitudes of the coefficients are largest for the youngest CEOs, confirming Vancil's hypothesis that younger CEOs are more likely to be disciplined by turnover. The relation between turnover and performance is insignificant for 50-55-year-old CEOs and marginally significant for 55-60-year-old CEOs, suggesting that managers between the ages of 50 and 60 are unlikely to be dismissed subsequent to poor performance. The dismissal-performance rela- tion is highly significant for CEOs approaching retirement (between 60 and 64) and marginally significant for CEOs at or past normal retirement age.
The authors of the earlier studies documenting the dismissal- performance relation generally interpret their results as being consis- tent with the hypothesis that management termination decisions are designed to align the interests of managers and shareholders. Each author stresses, however, that managers are rarely openly fired from

240 JOURNAL OF POLITICAL ECONOMY
their positions. Warner et al. (1988), for example, analyzed 272 firms for the years 1963-78 and found only a single case of an outright firing and only 10 cases in which poor performance was cited as one of the reasons for the separation. Weisbach (1988) examined 286 management changes for 1974-83 and found only nine cases in which boards mention performance as a reason why the CEO was replaced.
The data suggest that CEOs bear little risk of being dismissed by their boards of directors. The CEOs in our sample who leave their firms during the 13-year sample period hold their jobs an average of over 10 years before leaving, and most leave their position only after reaching normal retirement age. Of the sample CEOs, 60 percent are between 60 and 66 when they leave their firm; 32 percent are aged 64 or 65. Moreover, CEOs seldom leave in disgrace. Vancil (1987) esti- mates that 80 percent of exiting (nondeceased) CEOs remain on their firms' board of directors, and 36 percent continue serving on the board as chairmen.
The infrequent termination of poorly performing CEOs does not, by itself, imply the absence of incentives since even a low probability of getting fired can provide incentives if the penalties associated with termination are sufficiently severe. Table 5 presents our estimates of the turnover-related penalties for poor performance for four hy- pothetical CEOs of various ages. Column 1 of table 5 shows the pre- dicted turnover probability (based on the estimated coefficients in table 4) for a CEO in a firm realizing exactly the market return in both the current and past fiscal years. Column 3 shows the predicted turn- over probability for a CEO in a firm realizing a - 50 percent net-of- market return in each of the past 2 years. A 46-year-old CEO, for example, has a .036 turnover probability after 2 years of 0 percent net-of-market returns but has a .116 turnover probability after 2 years in which his firm earns 50 percent below market.
Columns 2 and 4 of table 5 report the expected wealth losses associ- ated with dismissals for CEOs in firms realizing 0 percent and - 50 percent net-of-market returns, respectively, in each of the two pre- ceding fiscal years. In order to obtain an upper bound on our estimate of the turnover wealth loss, we assume that the CEO has no alterna- tive employment opportunities and that his wealth loss on dismissal is the present value (at 3 percent) of $1 million per year starting the year after dismissal and lasting until the CEO is 66 years old. The expected wealth loss is calculated as this present value multiplied by the dis- missal probabilities calculated from table 4 and reported in columns 1 and 3 of table 5. Column 5 reports the difference in the dismissal- related wealth loss associated with average performance (0 percent) and dismal performance (- 50 percent), and column 6 compares the

TOP-MANAGEMENT INCENTIVES 241
TABLE 5
PAY-PERFORMANCE SENSITIVITY FROM CEO DISMISSALS: IMPLIED TURNOVER
PROBABILITIES AND UPPER-BOUND EXPECTED WEALTH LOSSES FROM
TURNOVER FOR 46-, 53-, 58-, AND 62-YEAR-OLD CEOs
CEOs IN CEOs IN FIRMS EARNING FIRMS EARNING
0% RETURNS -50% RETURNS ESTIMATED RELATIVE TO RELATIVE TO DIFFERENCE IN PAY-PERFORMANCE THE MARKET THE MARKET THE MARKET THEMARKET
EXPECTED WEALTH SENSITIVITY FOR IN EACH OF IN EACH OF IN EACH OF IN EACH OF Loss FROM CEO DISMISSAL
THE Two THE Two-50% PREVIOUS YEARS PREVIOUS YEARS TURNO - 50% _________________ _________________ FOR 0% AND - 50% NET-OF-MARKET
Turnover Expected Turnover Expected NET-OF-MARKET RETURN IN Two CEO Probabilityt Wealth Losst Probabilityt Wealth Loss* RETURNS PREVIOUS YEARS? AGE* (1) (2) (3) (4) (5) (6)
46 .036 $510,000 .116 $1,665,000 $1,155,000 89.0 per $1,000 53 .046 $459,000 .057 $571,000 $112,000 8.6V per$1,000 58 .065 $407,000 .095 $595,000 $188,000 14.5V per $1,000 62 .122 $346,000 .252 $714,000 $368,000 28.4V per $1,000
* Ages 46, 53, 58, and 62 are sample average ages for CEOs less than 50, between 50 and 55, between 55 and 60, and between 60 and 64, respectively.
t Turnover probabilities for each age are calculated from the associated age group logistic regressions in table 4. t Expected wealth loss is calculated as the turnover probability multiplied by the present value of $1 million per
year beginning next year and lasting until the CEO is 66 years old. All amounts are in 1986 constant dollars, and the real interest rate is assumed to be 3 percent.
? Based on $1.3 billion shareholder loss, which is the shareholder loss on an average-size ($1.73 billion) firm realizing - 50 percent returns in two consecutive years.
CEO's dismissal-related wealth loss with the wealth loss of sharehold- ers of an average-size firm ($1.73 billion in our sample), realizing a sequence of two net-of-market returns of -50 percent (i.e., a 2-year cumulative return of - 75 percent).
Table 5 predicts, for example, that the expected turnover-related wealth loss for a 62-year-old CEO in a firm realizing a 0 percent net- of-market return is $346,000, compared to an expected loss of $714,000 if his firm earns -50 percent below market in each of the two previous years. Although the difference in the expected wealth loss associated with dismal performance (compared to average per- formance) of $368,000 seems large, it is small compared to the CEO's losses on his own stockholdings and trivial compared to shareholder losses. The CEOs in the 1987 Forbes survey between 60 and 64 years old hold a median of $3.2 million worth of stock, and therefore the stock market losses on a -75 percent return for a median CEO are $2.4 million. Moreover, shareholders lose an average of almost $1.3 billion on a - 75 percent return; the CEOs' expected dismissal-related losses of $368,000 imply that CEOs lose 28.40 for each $1,000 lost by shareholders.
Column 6 of table 5 shows that our upper-bound estimate of the CEO's dismissal-performance sensitivity for an average-size firm with a - 75 percent 2-year return is 8.6? and 14.50 for a 53- and 58-year- old CEO, respectively. We find a much larger dismissal-performance

242 JOURNAL OF POLITICAL ECONOMY
sensitivity for a 46-year-old CEO-89.0? per $1,000-but this result is driven by our inappropriate assumption that the CEO will never work again if dismissed but will work for his firm until age 66 if not dismissed. The dismissal-performance sensitivity for the 46-year-old CEO falls to 44.5? per $1,000 if he accepts employment at half his current pay.
Our estimates of the dismissal-performance sensitivity in column 6 represent an upper bound for several reasons. First, we have assumed that CEOs leave the labor market after turnover; this assumption may be appropriate for older CEOs but is clearly inappropriate for very young CEOs. Second, table 5 is based on extraordinarily poor per- formance-2 years at - 50 percent per year-and the estimated dis- missal-performance sensitivity increases with shareholder losses. For example, the difference in expected wealth loss for a 62-year-old CEO earning 10 percent less than the market in two consecutive years (compared to 0 percent net-of-market returns) is $58,000, or about 18? per $1,000 (based on cumulative shareholder losses of 19 percent or $330 million for an average-size firm), compared to 28? per $1,000 for the $1.3 billion loss in column 6 of table 5. Finally, most CEOs are covered by employment contracts, severance agreements, or golden parachute arrangements that further reduce or eliminate the pecuniary punishment for failure; and pensions, outstanding stock options, and restricted stock typically become fully vested on an in- voluntary separation.
The dismissal-performance sensitivities in column 6 of table 5 can be added to the 30? per $1,000 pay-performance sensitivity in col- umn 2 of table 1 and the 15? per $1,000 pay-performance sensitivity for outstanding stock options in column 2 of table 2 to construct an estimate of the total pay-performance sensitivity under direct control of the board of directors. With an average dismissal-performance sensitivity (weighted by the number of observations in each age group) of 30? per $1,000, our estimate of the total pay-performance sensitivity-including both pay and dismissal-is about 75? per $1,000 (b - .00075). Stock ownership adds another $2.50 per $1,000 for a CEO with median holdings, for a total sensitivity of $3.25 per $1,000 (b = .00325) change in shareholder wealth.
II. Is the Small Pay-Performance Sensitivity Consistent with Agency Theory?
Agency theory predicts that compensation policy will tie the agent's expected utility to the principal's objective. The objective of share- holders is to maximize wealth; therefore, agency theory predicts that CEO compensation policies will depend on changes in shareholder

TOP-MANAGEMENT INCENTIVES 243
wealth. The empirical evidence presented in Section I is consistent with this broad implication: changes in both the CEO's pay-related wealth and the value of his stockholdings are positively and statisti- cally significantly related to changes in shareholder wealth, and CEO turnover probabilities are negatively and significantly related to changes in shareholder wealth.
Although the estimated pay-performance sensitivity (with respect to compensation, dismissal, and stock ownership) is statistically signifi- cant, the magnitude seems small in terms of the implied incentives. Consider again our example of the CEO contemplating a pet project that reduces the value of the firm by $10 million. A risk-neutral CEO with median holdings (b = .00325) will adopt the project if his private value exceeds $32,500, while a CEO with no stock ownership (b .00075) will adopt the project if his private value exceeds $7,500. For comparison, the median weekly income of our sample CEOs is approx- imately $9,400.
The purpose of this section is to explore whether our results are consistent with formal agency models of optimal contracting. Our task is made difficult by the fact that the theory offers few sharp predictions regarding the form of the contract other than predicting that wages generally increase with observed output. The formal mod- els do yield clear predictions regarding the pay-performance sensitiv- ity when the CEO is risk neutral. Given the impossibility of isolating the CEO's marginal contribution to firm value, a risk-neutral CEO has incentives to pursue appropriate activities only when he receives 100 percent of the marginal profits, or b = 1. The optimal contract, in effect, sells the firm to the CEO: he receives the entire output as compensation but pays the shareholders an up-front fee so that the CEO's expected utility just equals his reservation utility. Jensen and Murphy (1988) show that the b = 1 contract that provides optimal incentives is also the contract that causes managers to optimally sort themselves among firms.
Chief executive officers are not risk neutral; indeed, the major reason for the existence of the publicly held corporation is its ability to achieve efficiencies in risk bearing. By creating alienable common stock equity claims that can be placed in well-diversified portfolios of widely diffused investors, risk-bearing costs are reduced to a fraction of those borne by owner-managers of privately held organizations. Thus setting b = 1 in a risky venture subjects risk-averse executives to large risks, and setting b < 1 to transfer risk from executives to share- holders generates costs from poor executive incentives. Optimal com- pensation contracts must reflect the trade-off between the goals of providing efficient risk sharing and providing the CEO with incen- tives to take appropriate actions.

244 JOURNAL OF POLITICAL ECONOMY
Executives Are Risk Averse
It is tempting to attribute the generally low pay-performance sensitiv- ity to CEO risk aversion, but the amount of income "at risk" for poor performance is a trivial percentage of the CEO's total income. The total compensation pay-performance sensitivity of b = .0000329 in column 3 of table 1 implies, for example, that the pay revision associ- ated with a wealth change two standard deviations below normal (a shareholder loss of $400 million) is about $13,000. The median total compensation for CEOs in our sample is $490,000; therefore the amount of compensation "at risk" for a $400 million corporate loss is only 2.7 percent of the CEO's total pay.
It is more difficult to compare the amount of the CEO's wealth at risk to his total wealth since we cannot calculate the CEO's total wealth. Column 5 of table 2 implies, however, that a CEO's wealth increases an average of $893,000 in years in which both the CEO and his shareholders earn a zero return on their shareholdings. In years in which shareholders lose $400 million, however, the wealth of a nonstockholding CEO increases by about $746,000, while the wealth of a large-firm CEO with median inside stockholdings increases by only $93,000.1 In addition, the expected wealth loss associated with dismissal is approximately 30? per $1,000, or $120,000. Therefore, although the wealth effects of dramatically poor performance are substantial, they are not large relative to the normal $893,000 annual change in the CEO's wealth, which is independent of performance.
High Pay-Performance Contracts Are Not Feasible
Highly sensitive pay-performance contracts may not be feasible even under risk neutrality since executives with limited resources cannot credibly commit to pay firms for large negative realizations of corpo- rate performance, and shareholders cannot credibly commit to huge bonuses that amount to "giving away the firm" for large positive real- izations. The numerical examples above, however, suggest that it would certainly be feasible to write binding contracts with a much larger share of income or wealth at risk.
Moreover, successful entrepreneurs regularly sell off large equity claims, thereby lowering b; avoiding such sales to maintain a high b is a feasible contracting strategy. Management buy-outs (MBOs), in which top managers take the firm private by borrowing large sums to re-
' This is calculated from col. 5 of table 2 as 893 + .0020 x ( - 400,000), where .0020 is the estimated pay-performance sensitivity for a CEO owning the 73-firm sample median of 0.16 percent of his firm's common stock.

TOP-MANAGEMENT INCENTIVES 245
purchase stock from public shareholders, are a feasible way to undo previous equity sales and are another way to accomplish high-b con- tracts. For example, Kaplan (1989) finds in a sample of 76 MBOs that the median CEO holdings increase from 1.4 percent to 6.4 percent (b = .064), and median holdings for the management team as a whole increase from 5.9 percent to 22.6 percent (b = .226). These high-b contracts not only are feasible but are growing in importance: MBOs of public corporations and divisions have increased from $1.2 billion in 1979 to almost $77 billion in 1987 (Jensen 1989).
Franchising, accounting for 12 percent of gross national product in 1986, is another feasible way to accomplish high-b contracts (U.S. Department of Commerce 1987). These contracts are very similar to optimal contracts under risk neutrality that, in effect, sell the firm to the CEO. The franchisee pays a fixed entry fee for purchase of the franchise and receives all profits after payment of an annual fee to the franchisor that commonly amounts to between 5 percent and 10 per- cent of revenues. By granting the franchisee alienable rights in the franchise, these contracts resolve most of the horizon problem associ- ated with motivating managers to make correct trade-offs among cash flows through time (Jensen and Meckling 1979). This means that the franchisee has a 100 percent claim on the capital value of the fran- chise on its sale, although the alienability is subject to various restric- tions such as approval by the franchisor. Thus for these elements of changes in value the franchisee contract has b = 1. Franchise con- tracts have many other characteristics that reduce the conflicts of interest between the franchisee and franchisor and thereby re- duce the agency costs that result therefrom (Rubin 1978; Brick- ley and Dark 1987), but these issues are beyond the scope of this paper.
Firm Value Changes Are Imperfect Measures of the CEO's Choice of Actions
The change in shareholder wealth is the appropriate measure of the principal's objective in the CEO-shareholder agency relationship, but it is an imperfect measure of the CEO's individual performance. Holmstrom (1979) argues that optimal compensation contracts for risk-averse CEOs should be based not only on the principal's objective (i.e., change in shareholder wealth) but also on any variables that provide incremental information valuable in assessing the CEO's un- observable choice of action. Examples of potentially informative de- terminants of incentive compensation include direct measures of CEO activity, accounting measures of firm performance, and mea-

246 JOURNAL OF POLITICAL ECONOMY
sures of "relative performance" based on other executives in the same industry or market. Unfortunately, the structure of the Holmstrdm model makes its conclusions irrelevant to most compensation con- tracts, including those of CEOs. His model assumes that the principal knows the utility function of the manager as well as the production function relating actions to expected outcomes. For CEOs this means that shareholders know with certainty all possible actions of the CEO and the distribution of outcomes of each action. In addition, share- holders must know the set of optimal CEO actions. It is unlikely that these conditions are often satisfied.
More important, Gibbons and Murphy (1989) argue that basing compensation on potentially informative additional variables can be counterproductive because their use provides incentives for CEOs to devote effort to actions that do not increase shareholder wealth-a phenomenon that is not modeled in Holmstrdm's analysis. Account- ing profits, for example, may yield information that is valuable in assessing an executive's unobservable actions. But paying executives on the basis of accounting profits rather than changes in shareholder wealth not only generates incentives to directly manipulate the ac- counting system but also generates incentives to ignore projects with large net present values in favor of less valuable projects with larger immediate accounting profits.
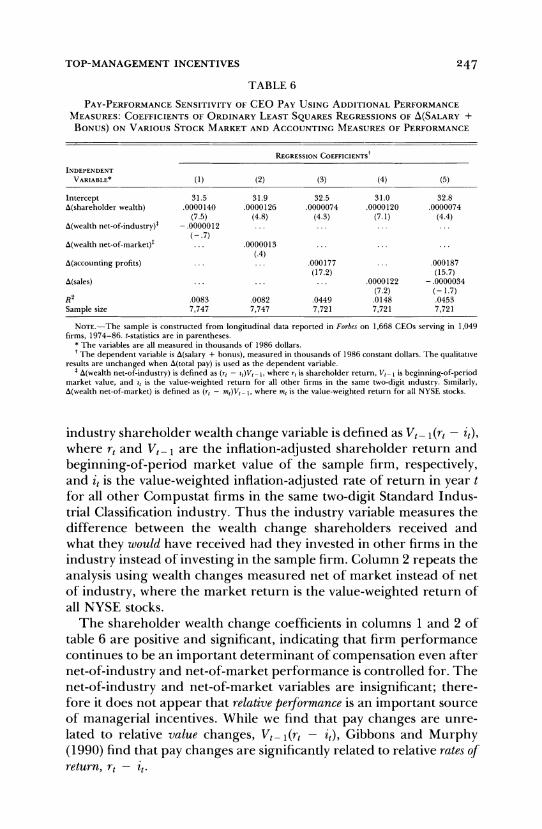
Table 6 reports coefficients of regressions of the change in salary plus bonus on changes in shareholder wealth, changes in shareholder wealth in the industry and market, and two accounting measures of performance: changes in accounting profits and changes in sales. We focus on the CEO's compensation and ignore changes in the value of his options or stockholdings because these latter components are de- termined exclusively by firm performance, independent of other vari- ables such as relative performance and accounting profits. Thus if other variables are more important than shareholder wealth changes in providing CEO incentives, their importance should show up in a strong relation with CEO compensation.
Relative Performance
Basing CEO compensation on performance measured relative to aggregate performance in the industry or market provides CEOs with incentives to increase shareholder wealth while filtering out the risk- increasing effects of industrywide and marketwide factors beyond the control of executives (Holmstrdm 1982). Column 1 of table 6 reports coefficients from a regression that includes firm performance mea- sured relative to the performance of other firms in the same indus- try as an additional explanatory variable. In particular, the net-of-
TOP-MANAGEMENT INCENTIVES 247
TABLE 6
PAY-PERFORMANCE SENSITIVITY OF CEO PAY USING ADDITIONAL PERFORMANCE
MEASURES: COEFFICIENTS OF ORDINARY LEAST SQUARES REGRESSIONS OF A(SALARY +
BONUS) ON VARIOUS STOCK MARKET AND ACCOUNTING MEASURES OF PERFORMANCE
REGRESSION COEFFICIENTSt
INDEPENDENT VARIABLE* (1) (2) (3) (4) (5)
Intercept 31.5 31.9 32.5 31.0 32.8 A(shareholder wealth) .0000140 .0000126 .0000074 .0000120 .0000074
(7.5) (4.8) (4-3) (7.1) (4.4) A(wealth net-of-industry)1 - .0000012 ... ... ... ...
(-.7) A(wealth net-of-market)1 ... .0000013 ... ... ...
(.4) A(accounting profits) ... ... .000177 ... .000187
(17.2) (15.7) A(sales) ... ... ... .0000122 - .0000034
(7.2) (-1.7) R2 .0083 .0082 .0449 .0148 .0453 Sample size 7,747 7,747 7,721 7,721 7,721
NOTE.-The sample is constructed from longitudinal data reported in Forbes on 1,668 CEOs serving in 1,049 firms, 1974-86. t-statistics are in parentheses.
* The variables are all measured in thousands of 1986 dollars. t The dependent variable is A(salary + bonus), measured in thousands of 1986 constant dollars. The qualitative
results are unchanged when A(total pay) is used as the dependent variable. I A(wealth net-of-industry) is defined as (rt - it)Vt- 1, where rt is shareholder return, Vt is beginning-of-period
market value, and it is the value-weighted return for all other firms in the same two-digit industry. Similarly, A(wealth net-of-market) is defined as (rt - mt)Vt 1, where mt is the value-weighted return for all NYSE stocks.
industry shareholder wealth change variable is defined as Vt - I (rt - it), where rt and Vt_ I are the inflation-adjusted shareholder return and beginning-of-period market value of the sample firm, respectively, and it is the value-weighted inflation-adjusted rate of return in year t for all other Compustat firms in the same two-digit Standard Indus- trial Classification industry. Thus the industry variable measures the difference between the wealth change shareholders received and what they would have received had they invested in other firms in the industry instead of investing in the sample firm. Column 2 repeats the analysis using wealth changes measured net of market instead of net of industry, where the market return is the value-weighted return of all NYSE stocks.
The shareholder wealth change coefficients in columns 1 and 2 of table 6 are positive and significant, indicating that firm performance continues to be an important determinant of compensation even after net-of-industry and net-of-market performance is controlled for. The net-of-industry and net-of-market variables are insignificant; there- fore it does not appear that relative performance is an important source of managerial incentives. While we find that pay changes are unre- lated to relative value changes, Vt I(rt - it), Gibbons and Murphy (1990) find that pay changes are significantly related to relative rates of return, rt - it.

248 JOURNAL OF POLITICAL ECONOMY
Accounting Measures of Performance
Column 3 of table 6 reports estimated coefficients from a regression of change in CEO salary and bonus on change in net accounting income measured before extraordinary items. The estimated coeffi- cient of .000177 indicates that CEOs receive 17.7? for each $1,000 change in annual income. The increased explanatory power (com- pared to col. 2 of table 1) indicates that changes in accounting income are an additional important determinant of pay changes. Since in- come is a flow rather than a stock, however, the implied pay- performance sensitivity for accounting profits is roughly comparable to the pay-performance sensitivity for firm value changes of 0.74? per $1,000 in column 3. Suppose, for example, that the market value of the firm is the capitalized value of future earnings and that earnings follow a random walk. Then, with a real discount rate of 5 percent, each $1,000 change in earnings corresponds to a pay change of 17.7? and a firm value change of $20,000, orjust under a penny per $ 1,000.
Column 4 of table 6 reports estimated pay-performance coefficients from a regression that includes the change in firm sales as an addi- tional determinant of incentive compensation. The estimated coeffi- cient of .0000122 suggests that CEOs receive 1.2? for every $1,000 of increased firm revenues, implying a pay revision of $1,900 for each standard deviation change in sales (based on the median standard deviation for sales changes of $160 million), compared to pay revi- sions of $2,400 for each standard deviation change in shareholder wealth (based on an estimated pay-performance sensitivity of .0000 12 and a standard deviation for wealth changes of $200 million). The explanatory variables in column 5 include both accounting measures of performance-changes in sales and earnings-and also include the change in shareholder wealth. The earnings change coefficient remains large and positive, indicating that CEOs receive pay raises of about 19? for each $1,000 change in income. The sales change coefficient in column 5 is negative and marginally significant, suggest- ing that, with income and firm value held constant, CEOs receive pay cuts of about one-third of a penny for each $1,000 increase in firm revenues. Finally, the shareholder wealth change coefficients suggest that, with earnings and sales held constant, each $1,000 change in shareholder wealth corresponds to a CEO pay change of three- fourths of a penny.
The purpose of including additional variables in the regressions in table 6 is to analyze whether compensation is highly sensitive to vari- ables other than the change in shareholder wealth. The results in table 6 indicate that CEO compensation is related to changes in ac-

TOP-MANAGEMENT INCENTIVES 249
counting profits and sales but is unrelated to market and industry performance. While CEO pay appears to be about equally sensitive to accounting profits and shareholder wealth, the estimated magnitude of both effects is still small: the amount of CEO pay "at risk" for a $48 million change in accounting profits (which is twice the median stan- dard deviation) is $9,000, or less than 2 percent of compensation for a CEO with median earnings of $490,000.
Unobservable Measures of Performance
The small relation between CEO pay and measures of market or accounting performance seems inconsistent with the fact that CEOs receive a large share of their total compensation in the form of ex- plicit incentive bonuses. The Conference Board (1984) reports that over 90 percent of all large manufacturing firms had bonus plans in 1983, and 87 percent of firms with bonus plans paid bonuses for 1983 performance. The median bonus award for CEOs in the Conference Board's survey is 50 percent of base salary; over 20 percent of the surveyed firms report CEO bonuses exceeding 70 percent of salary.
It is possible that CEO bonuses are strongly tied to an unexamined or unobservable measure of performance. If bonuses depend on per- formance measures observable only to the board of directors and are highly variable, they could provide significant incentives. One way to detect the existence of such "phantom" performance measures is to examine the magnitude of year-to-year fluctuations in CEO compen- sation. Large swings in CEO pay from year to year are consistent with the existence of an overlooked but important performance measure; small annual changes in CEO pay suggest that it is essentially unre- lated to all relevant performance measures. To test for the existence of such unobserved but important pay-performance sensitivity, we compare the variability of CEO pay to that of a sample of randomly selected workers.
The data indicate that year-to-year fluctuations in CEO income are not much different from income fluctuations for conventional labor groups. Column 1 in table 7 presents the frequency distribution of inflation-adjusted annual percentage changes in CEO salary plus bonus for all CEOs listed in the Forbes surveys from 1974 to 1986. A third of the sample observations correspond to inflation-adjusted pay changes between 0 percent and 10 percent, and three-fourths of the observations reflect pay changes between - 10 percent and 25 per- cent. Raises in salaries and bonus exceeding 50 percent account for only 4.4 percent of the sample, and pay cuts of more than 25 percent account for only 3.2 percent of the sample. Column 2 in table 7

250 JOURNAL OF POLITICAL ECONOMY
TABLE 7 COMPARISON OF PAY VARIABILITY OF CEOs AND RANDOMLY SELECTED WORKERS:
FREQUENCY DISTRIBUTION OF ANNUAL PERCENTAGE CHANGES IN REAL SALARY AND
BONUS AND TOTAL PAY FOR CEOs LISTED IN FORBES COMPENSATION SURVEYS,
1974-86, AND CHANGES IN REAL WAGES FOR WORKERS IN THE
1975-80 MICHIGAN PSID
CEOs IN FORBES SURVEYS, WORKERS IN 1974-86
INFLATION- MICHIGAN PSID ADJUSTED Salary Total SAMPLE, ANNUAL + Bonus Pay* 1975-80'
PERCENTAGES (1) (2) (3)
More than 50% 4.4 6.3 4.6 25% to 50% 9.4 10.5 6.8 10% to 25% 21.1 21.3 14.0 0% to 10% 32.3 29.1 34.0
- 10% to 0% 21.9 18.9 28.6 -25% to - 10% 7.7 8.9 7.8 Less than - 25% 3.2 5.0 4.2
Sample size 8,027 8,027 10,247 Standard deviation 30.5 49.3 41.7
* Total pay typically includes salary, bonus, value of restricted stock, savings and thrift plans, and other benefits but does not include the value of stock options granted or the gains from exercising stock options.
t The wage change distributions for the PSID were made available to us by Ken McLaughlin and include 10,247 male workers aged 18-59 reporting wages earned in consecutive periods.
summarizes the frequency distribution of the inflation-adjusted total pay (excluding stock options). Changes in CEO compensation exceed- ing + 25 percent account for only 21.8 percent of the sample obser- vations.
Column 3 of table 7 presents the frequency distribution of annual inflation-adjusted percentage wage changes for managerial and non- managerial workers in the Michigan Panel Study of Income Dynamics (PSID). These distributions were made available to us by Ken McLaughlin, who reports similar distributions for logarithmic wage changes (McLaughlin 1987). The subset of the PSID sample analyzed by him covers the years 1975-80 and includes 10,247 annual wage changes for male workers aged 18-59. The wage change distributions for the random sample in column 3 are remarkably similar to the wage change distribution for CEOs in columns 1 and 2. The standard deviation of percentage wage changes for the PSID sample is 41.7, compared to 30.5 and 49.3 for CEO salary plus bonus and CEO total compensation, respectively. There are a few minor differences that are interesting. Executives are less likely to receive real pay cuts than workers selected at random; CEOs receive cuts in both salary plus bonus and total pay 32.8 percent of the time, while the workers in the PSID sample received pay cuts 40.6 percent of the time. Executives are more likely to receive raises exceeding 10 percent than random

TOP-MANAGEMENT INCENTIVES 251
workers, 34.8 percent and 38 percent for salary plus bonus and total pay, respectively, for CEOs compared to 25.4 percent for all workers.
Corporate management is an occupation in which, a priori, we would expect incentive compensation to be especially important. It is therefore surprising that the distribution of wage changes for CEOs is so similar to the distribution for randomly selected workers. It ap- pears that annual executive bonuses are not highly variable. These data seem inconsistent with economic theories of compensation: in spite of the fact that bonuses nominally amount to 50 percent of salary, there seem to be too few major year-to-year percentage changes in CEO compensation to provide the incentives that are likely to make a substantial difference in executive behavior.
Direct Measures of Performance
Incentive contracts are unnecessary when CEO activities are perfectly observable and when shareholders (or boards of directors) can tell the CEO precisely which actions to take in each state of the world. When their activities are imperfectly observable, CEOs will be evaluated in part by observing output (change in shareholder wealth) and in part by observing input (CEO activities). One explanation for the small pay-performance sensitivity is that boards have fairly good informa- tion regarding managerial activity, and therefore the weight on out- put is small relative to the weight on input.
The hypothesis that corporate boards directly monitor managerial input is consistent with the data but inconsistent with generally held beliefs in the business and financial community. Outside members of corporate boards have only limited contact with the CEO-at most 1 or 2 days a month-and the meetings that do occur are typically held in the CEO's office with agendas and information controlled by him. More important, the hypothesis that "forcing contracts" can be writ- ten when managerial actions are observable hinges crucially on the assumption that shareholders or boards know what actions should be taken. Managers often have better information than shareholders and boards in identifying investment opportunities and assessing the profitability of potential projects; indeed, the expectation that man- agers will make superior investment decisions explains why share- holders relinquish decision rights over their assets by purchasing common stock. Basing compensation on observed managerial actions cannot provide CEOs with incentives to engage in value-increasing activities when the expected wealth consequences of alternative ac- tions are unknown to shareholders and board members. Appropriate incentives can be generated in these cases, however, by basing com- pensation on changes in shareholder wealth.

252 JOURNAL OF POLITICAL ECONOMY
Nonpecuniary Rewards Provide Adequate Incentives
Our estimates of the pay-performance sensitivity (with respect to compensation, stock ownership, and dismissal) include only monetary rewards for performance and ignore potentially important non- pecuniary rewards associated with managing a firm. These nonpecu- niary rewards could provide incentives for CEOs to take appropriate actions even when direct monetary incentives are absent.
Nonmonetary rewards such as power, prestige, and honor will definitely affect the level of monetary compensation necessary to at- tract properly qualified people to the firm, but unless nonmonetary rewards vary positively with the value of the firm they will not in- crease the CEO's incentives to take appropriate actions (except through the threat of performance-related dismissal). Moreover, be- cause nonpecuniary benefits tend to be a function of position or rank, it is difficult to vary the amount of nonpecuniary benefits received by an executive from period to period to correspond with increases or decreases in productivity. It is therefore unlikely that nonpecuniary factors are an important source of incentives pushing managers to maximize value.
Nonpecuniary rewards associated with success and accomplish- ment, and nonpecuniary punishments associated with failure, do pro- vide incentives for managers. However, these nonpecuniary incen- tives, generally associated with reputation in the firm and standing in the community, will motivate managers to act in shareholders' interest only if the nonpecuniary rewards and punishments are directly asso- ciated with firm value changes. This is a serious problem because there are strong political and organizational forces that tend to define success in dimensions other than shareholder wealth and exert pres- sures for actions that reduce firm value. Managerial conformance to pressures to maintain employment, peace with unions, or major con- tributions to communities by keeping unprofitable plants open can easily become synonymous with "success." In such situations, the non- pecuniary rewards come at the expense of shareholder value and economic efficiency.
External Forces Provide Adequate Incentives
Compensation and termination policy are internal tools utilized by boards of directors to provide managerial incentives. There are also competitive forces external to the corporation that provide incentives, including competition in the product market (Hart 1983), the mana- gerial labor market (Fama 1980), and the market for corporate con- trol (Manne 1965). Product market competition disciplines managers

TOP-MANAGEMENT INCENTIVES 253
since firms that are inefficiently managed will be unprofitable and will not survive. Competition in the managerial labor market, especially the labor market internal to the organization, includes the incentives of subordinates to replace inferior superiors. The threat of takeovers also provides incentives since managers are often replaced following a successful takeover. Martin and McConnell (1988) report, for ex- ample, that 61 percent of target firm managers depart within 3 years after a successful takeover compared with 21 percent for a non- merged control sample, and Walsh (1988) reports that 37 percent of the entire top-management team leaves the target firm within 2 years of a takeover compared with 13 percent of a nonmerged control sample.
Although these external forces provide incentives for existing man- agement, we focus on internal incentive mechanisms since these are under the direct control of boards of directors. Moreover, external forces such as takeovers may be a response to, instead of an efficient substitute for, ineffective internal incentives.
III. Alternative Hypotheses
The conflict of interest between managers and shareholders is a classi- cal agency problem, but the small observed pay-performance sensitiv- ity seems inconsistent with the implications of formal principal-agent models. Two alternative hypotheses consistent with the observed rela- tion between pay and performance are that (1) CEOs are not, in fact, important agents of shareholders, and (2) CEO incentives are unim- portant because their actions depend only on innate ability or compe- tence. There has not yet been careful empirical documentation of the ways in which CEOs affect the performance of their firms, but there is considerable evidence that the competence and actions of a CEO are important to the productivity of the firm. The fact that stock prices react significantly to the death (Johnson et al. 1985) or replacement (Warner et al. 1988) of CEOs, for example, is inconsistent with the hypothesis that CEOs do not matter.
The wave of MBOs and the improved productivity they generate are consistent with the hypothesis that CEOs and the incentives they face are important to firm performance. There is strong evidence that the 96 percent average net-of-market increase in value associated with these buy-outs is caused by new top-management incentives (Jensen 1989; Kaplan 1989). The experience with MBOs is inconsistent with the hypothesis that managerial incentives are unimportant because in these transactions the same top managers manage the same assets after the company goes private. Data from takeovers, which are asso- ciated with high management turnover and produce average in-

254 JOURNAL OF POLITICAL ECONOMY
creases in firm value of 50 percent, are also consistent with the hy- pothesis that top-level managers can have a large effect on firm performance.
Another hypothesis that we believe helps reconcile our empirical results concerns the important role of third parties in the contracting process. Managerial labor contracts are not, in fact, a private matter between employers and employees. Strong political forces operate in both the private sector (board meetings, annual stockholder meetings, and internal corporate processes) and the public sector that affect executive pay. Managerial contracts are not private because by law the details of the pay package are public information open to public scrutiny and criticism. Moreover, authority over compensation deci- sions rests not with shareholder-employers but rather with compensa- tion committees composed of outside members of the boards of direc- tors who are elected by, but are not perfect agents for, shareholders. Fueled by the public disclosure of executive pay required by the Secu- rities and Exchange Commission, parties such as employees, labor unions, consumer groups, Congress, and the media create forces in the political milieu that constrain the type of contracts written be- tween management and shareholders.
The benefits of the public disclosure of top-management compen- sation are obvious since this disclosure can help provide a safeguard against "looting" by management (in collusion with "captive" boards of directors). The costs of disclosure are less well appreciated. Public information on "what the boss makes" affects contracts with other employees and provides emotional justification for increased union demands in labor negotiations. Media criticism and ridicule and the threat of potential legislation motivated by high payoffs to managers reduce the effectiveness of executives and boards in managing the company. The media are filled with sensational stories about execu- tive compensation each spring at the height of the proxy season. Board members are subject to lawsuits if top-management pay is "too high" relative to pay observed in similar firms (but never if it is "too low"). Since the subjective "reasonableness" of a compensation pack- age is strongly influenced by the political process, it is natural that well-intentioned but risk-averse board members will resist innovative incentive contracts.
Strong public antagonism toward large pay changes is illustrated by the recent conflict leading to the defeat of congressional pay in- creases. National polls indicate that 85 percent of voters opposed the 50 percent increase in congressional salaries (from $89,500 to $135,000) even though this increase would have left salaries lower in real terms than 1969 levels (Rogers 1989).

TOP-MANAGEMENT INCENTIVES 255
The Implicit Regulation Hypothesis: Evidence from the 1930s
It is difficult to document the influence of the political process on compensation since the constraints are implicit rather than explicit and the public disclosure of top-management compensation has ex- isted for half a century. One possible way to test this implicit regula- tion hypothesis is to compare our pay-performance results for 1974- 86 to the pay-performance relation when regulatory pressures were less evident. We construct a longitudinal sample of executives from the 1930s using data collected by the U.S. Work Projects Administra- tion (WPA) in a 1940 project sponsored by the Securities and Ex- change Commission (1940-41). The WPA data, covering fiscal years 1934-38, include salary and bonus paid to the highest-paid executive in 748 large U.S. corporations in a wide range of manufacturing and nonmanufacturing industries. Of the WPA sample firms, 394 are listed on the NYSE; market value data for these firms are available on the CRSP Monthly Stock Returns Tape.
Comparing corporate data from the 1934-38 WPA sample to cor- responding data from the 1974-86 Forbes sample is difficult because of reporting differences and because of major secular changes in the number of corporations and the size distribution of corporations over the past five decades. The "CEO" designation was rarely used in the 1930s, and therefore for comparison purposes we define CEO as the highest-paid executive. In addition, the WPA data do not reveal the name of the highest-paid executive, and therefore some salary and bonus changes reflect management changes rather than pay revi- sions for a given manager. For comparison purposes, the 1974-86 pay change data utilized in tables 8 and 9 were constructed ignoring management changes. Finally, in order to compare similar firms in the two time periods, we restrict our analysis to firms that are in the top quartile of firms listed on the NYSE (ranked by market value). The WPA compensation data are available for 60 percent of the top- quartile NYSE firms for 1934-38 (averaging 114 firms per year), and Forbes compensation data are available for 90 percent of the top- quartile NYSE firms for 1974-86 (averaging 335 firms per year).
Table 8 presents sample compensation statistics for CEOs in the top quartile of NYSE corporations ranked by market value for 1934-38 and compares these results to similarly constructed data for 1974-86. The CEOs in the largest-quartile firms earned an average of $813,000 measured in 1986 constant dollars in the 1930s, significantly more than the average pay of $645,000 earned by CEOs in the NYSE top quartile from 1974 to 1986. Over this same time period, median pay

256 JOURNAL OF POLITICAL ECONOMY
TABLE 8
CEO COMPENSATION IN 1934-38 VERSUS 1974-86: SAMPLE COMPENSATION
STATISTICS FOR CEOs IN THE Top QUARTILE OF NYSE
CORPORATIONS RANKED BY MARKET VALUE
Test Statistic Variable (in 1986 Dollars) 1934-38 1974-86 for Difference
CEO salary + bonus: Mean $813,000 $645,000 t = 9.1 Median $639,000 $607,000
Mean market value of firm $1.6 billion $3.4 billion t = - 6.1 Mean CEO salary + bonus as a
percentage of firm market value .110% .034% t = 29.6
Change in CEO salary + bonus: Mean $31,900 $27,800 t = .4 Median $200 $21,600 Average standard deviation* $205,000 $127,000 t = 2.7
NOTE.-For the 1934-38 data, CEOs are defined as the highest-paid executive. Sample sizes are 456 and 3,988 CEO-years for the 1934-38 and 1974-86 samples, respectively.
* The standard deviation for A(salary + bonus) was calculated for each firm with at least three years of data; sample sizes are 108 firms and 436 firms for the earlier and later time periods, respectively. The t-statistic tests the equality of the average standard deviations in the two samples. The samplewide (pooled) standard deviation of pay changes was $167,500 for 3,928 CEO-years for 1974-86, compared to $463,500 for 448 CEO-years for 1934-38.
fell from $639,000 to $607,000. The current popular belief that CEO pay in the largest corporations has increased dramatically over the past several decades is therefore not supported by these sample aver- ages. Over this same time period, there has been a doubling (after inflation) of the average market value of a top-quartile firm-from $1.6 billion in the 1930s to $3.4 billion for 1974-86. Along with the decline in salaries, this means that the ratio of CEO pay to total firm value has fallen significantly in 50 years-from 0.11I percent in the early period to 0.03 percent in the later period. The mean annual change in compensation in the earlier period was $31,900 as com- pared to $27,800 in the 1974-86 period. More important, the vari- ability of annual changes in CEO pay fell considerably over this period; the average standard deviation of the annual pay changes was $127,000 in the 1970s and 1980s, significantly lower than the $205,000 average in the 1930s.
The pronounced decline in the raw variability of salary changes evident in table 8 suggests the possibility of a decreased sensitivity in the pay-performance relation. Table 9 reports estimated coefficients from regressions of change in CEO salary and bonus on this year's and last year's change in shareholder wealth. The 1930s regression indicates that each $ 1,000 increase in shareholder wealth corresponds to an 11 IAV increase in this year's pay and a 6. 1 V increase in next

TOP-MANAGEMENT INCENTIVES 257
TABLE 9
CEO PAY-PERFORMANCE SENSITIVITY IN 1934-38 VERSUS 1974-86: REGRESSIONS OF
CHANGE IN CEO SALARY + BONUS ON CHANGE IN SHAREHOLDER WEALTH FOR CEOs IN THE Top QUARTILE OF NYSE CORPORATIONS RANKED BY MARKET VALUE
REGRESSION COEFFICIENTS* INDEPENDENT
VARIABLE 1934-38 1974-86
Intercept 6.3 22.3 A(shareholder wealth) .000114 .000012
(thousands of 1986 dollars) (5.6) (7.0) A(shareholder wealth) .000061 .000007
in year t - 1 (2.8) (4.4) R2 .0702 .0165 Estimated pay-performance sensitivity, b .000175 .000019 Estimated cents per $1,000 17.5? 1.9?
NOTE.-For the 1934-38 data, CEOs are defined as the highest-paid executive. Sample sizes are 427 and 3,826 CEO-years for the 1934-38 and the 1974-86 samples, respectively t-statistics are in parentheses.
* Dependent variable is A(salary + bonus), measured in thousands of 1986 constant dollars.
year's pay; thus the total effect of a $1,000 increase in shareholder wealth is 17.5?. In contrast, the regression using the 1974-86 data implies only a 1.9? pay change for each $1,000 change in shareholder wealth. Thus the pay-performance relation for CEOs in the top quar- tile of NYSE firms has fallen by a factor of 10 over the past 50 years. These results, although not conclusive, are consistent with the implicit regulation hypothesis because political constraints and pressures, disclosure requirements, and the overall regulation of corporate America have increased substantially over the same period.
The incentives generated by CEO stock ownership have also de- clined substantially over the past 50 years. Table 10 shows time trends in the stock ownership of CEOs for two different samples of firms. The first sample consists of all CEOs in the 120 largest firms (ranked by stock market value) in 1938, 1974, and 1984; we collected stock ownership data for these CEOs from proxy statements. Proxy state- ments for 1938 were available for only 53 of the largest 120 firms in 1938; stock ownership data for CEOs in 16 additional firms were obtained using 1939 and 1940 proxy statements.
Part A of table 10 shows that CEO percentage of ownership (in- cluding shares held by family members and trusts) in the largest 120 firms fell from a median of 0.30 percent in 1938 to 0.05 percent in 1974 and fell further to 0.03 percent in 1984 (average percentage of ownership fell from 1.7 percent in 1938 to 1.5 percent and 1.0 per- cent in 1974 and 1984, respectively). In addition, the median dollar value of shares held (in 1986 constant dollars) fell from $2,250,000 in 1938 to $2,061,000 in 1974 and to $1,801,000 in 1984. The decline in

258 JOURNAL OF POLITICAL ECONOMY
TABLE 10
TIME TRENDS IN CEO INSIDE STOCK OWNERSHIP: MEDIAN CEO STOCK OWNERSHIP
FOR Two SAMPLES OF FIRMS
Median Median Value of Stock Percentage of
Sample and Year Owned (1986 Dollars) Firm Owned
A. 120 largest firms ranked by market value:
1938 $2,250,000 .30% 1974 2,061,000 .05 1984 1,801,000 .03
B. 73 manufacturing firms: 1969-73 3,531,000 .21 1974-78 1,397,000 .14 1979-83 1,178,000 .11 15-year sample 1,697,000 .16
NOTE.-Stock ownership obtained from proxy statements includes not only shares held directly but also shares held by family members or related trusts.
the value of shares held between 1974 and 1984 is especially signifi- cant since 1974 was a "bust" year in the stock market, while 1984 was a "boom" year. The value-weighted portfolio of all NYSE stocks in- creased by 113.4 percent (after inflation) over this interval, so if the median executive had maintained his stockholdings and if these had increased by the same percentage as that of the market portfolio, the value of his holdings would have increased from $2,061,000 in 1974 to $4,400,000 in 1984 instead of falling to $1,801,000.
Part B of table 10, based on the 73 manufacturing firm sample, shows the median value of stock owned by CEOs and their percentage of ownership for the full 15-year sample and for 5-year intervals. For 1969-73, the median CEO in the 73 sample firms held $3,531,000 in common stock (1986 dollars), which accounted for 0.21 percent of the shares outstanding. By 1979-83, the median ownership had fallen 67 percent to $1,178,000, accounting for only 0.11 percent of the shares outstanding. Over the same time period, the average stock ownership, which is strongly influenced by a few CEOs with extraordinarily large holdings, fell from $14,100,000 to $8,500,000.
The political pressures associated with high pay-performance con- tracts do not appear to extend to gains from stock ownership. We therefore expect increases in political pressure to correspond to de- creases in pay-performance sensitivity and increases in incentives asso- ciated with stock ownership. The dramatic decline in CEO stock own- ership over the past 50 years is contrary to the implicit regulation hypothesis and suggests a significant downward trend in managerial incentives that is not explained by existing theories.

TOP-MANAGEMENT INCENTIVES 259
Political Influence and the Effect of Firm Size on the Pay-Performance Sensitivity
Political influence is likely to be more pronounced in large firms since larger firms tend to be more visible and more closely scrutinized than smaller firms (Watts and Zimmerman 1986, chap. 10). The implicit regulation hypothesis thus predicts that the pay-performance sen- sitivity declines with firm size, but our all-inclusive estimate of $3.25 per $1,000 is based on a constant pay-performance sensitivity across firms. Although the Forbes sample analyzed in this paper includes the nation's largest firms, the size distribution of firms within the sample is highly skewed. The average and median market values of firms in our sample are $1.73 billion and $810 million (1986 dollars), respectively. The average and median market values for firms larger than the sample median are $3.1 billion and $1.6 billion, respectively, while the average and median market values for firms smaller than the sample median are $400 million and $360 million, respectively.
We test for the effect of firm size on the pay-performance sensitiv- ity by reestimating the results in tables 1, 3, 4, 5, and 6 for firms with market value in a given year above or below the sample median mar- ket value for that year. Of the 73 manufacturing firm sample (table 2), 80 percent fall into the "above-median" category (on the basis of the Forbes sample); thus we did not reestimate the results in table 2 by firm size. Our overall results are summarized in columns 2 and 3 of table 11; to save space, details of the estimates are not provided but are available on request. We have previously noted substantial differences in CEO stockholdings in small and large firms (table 3); table 11 suggests other interesting differences between the two samples. Row 1 shows that each $1,000 change in shareholder wealth corresponds to a 4.1? pay raise for CEOs in small firms, but only 2.0? for CEOs in large firms. Also, current and past net-of-market performance is a strong predictor of CEO turnover in below-median-size firms, but performance and turnover are both economically and statis- tically insignificantly related for large firms. As reported in row 5, the average dismissal-performance sensitivity (weighted by the number of observations in each age group) is $2.25 per $1,000 change in shareholder wealth for CEOs in small firms, but only 5? per $1,000 for CEOs in large firms. Our all-inclusive estimated pay-performance sensitivity (row 8) for small firms is $8.05 per $1,000, four times greater than our large-firm estimate of $1.85 per $1,000.
Varying degrees of political pressure across firms or decades are not of course the only potential explanations for the size effect or secular decline in pay-performance sensitivities; thus the evidence

26o JOURNAL OF POLITICAL ECONOMY
TABLE 11
ESTIMATED PAY-PERFORMANCE SENSITIVITY: TOTAL EFFECTS (over 2 Years) ON CEO COMPENSATION-RELATED WEALTH CORRESPONDING TO EACH $1,000 CHANGE IN SHAREHOLDER WEALTH FOR CEOs IN FORBES SAMPLE, 1974-86, BY FIRM SIZE
PREDICTED CEO WEALTH
CHANGE PER $1,000 CHANGE IN
SHAREHOLDER WEALTH
Large Small All Firms Firms Firms
(1) (2) (3)
1. Change in this year's and next year's salary + bonus $ .022 $ .020 $ .041
2. Total compensation + present value of the hange in salary + bonus .30 .25 .75
3. Change in the value of stock options .15 .15 .15 4. Change in direct pay-related wealth (row 2 +
row 3)* .45 .40 .90 5. Change in wealth due to dismissal from poor
performance .30 .05 2.25 6. Change in total pay-related wealth (row 4 +
row 5) .75 .45 3.15 7. Change in wealth related to stock ownership
for CEO with median stockholdings 2.50 1.40 4.90 8. Change in all pay- and stock-related wealth $3.25 $1.85 $8.05
SOURCE.-ROW 1: table 1, col. 2. Row 2: table 1, col. 4. Row 3: table 2, cot. 1, estimated for the 73-firm sample. We assume that the option-performance sensitivity is the same for both size groups. Row 5: table 5, col. 6. This is the weighted average of estimates for each age group. Row 7: table 3, cols. 1, 2, and 3. Stock ownership includes shares held by family members and connected trusts. Ownership also includes options that can be exercised within 60 days; thus there is some "double counting" in rows 3 and 7.
NOTE.-Estimates are rounded to the nearest nickel (except for row 1). Large firms have market value in a given year above the Forbes sample median for that year, while small firms have market value below the median. Details of the estimates by firm size are not provided in the text but are available on request.
* The direct estimate from the 73 manufacturing firms is only 3lI (table 2, col. 2); we have reported the larger estimate as an upper bound.
' Cols. 3 and 5 of table 2 show that fractional stockholdings can be added to other sources of incentives to construct an overall pay-performance sensitivity.
presented is supportive of the implicit regulation hypothesis but not conclusive. For example, higher pay-performance sensitivities for smaller firms could reflect that CEOs are more influential in smaller companies. A thorough empirical investigation of the implicit reg- ulation of executive compensation would be useful, but such an in- vestigation requires detailed data on the compensation practices of partnerships, closely held corporations, and other nonpublic organi- zations. These data are inherently difficult to obtain. In fact, it is precisely this asymmetry in data availability that forms the basis for the implicit regulation of executive compensation in publicly held corporations.

TOP-MANAGEMENT INCENTIVES 261
IV. Summary
Our analysis of performance pay and top-management incentives for over 2,000 CEOs in three samples spanning five decades indicates that the relation between CEO wealth and shareholder wealth is small and has fallen by an order of magnitude in the last 50 years. Table 11, based primarily on the Forbes sample of 1,295 firms, provides an overview of our final results for the full sample and for firms with market value in a given year above or below the sample median mar- ket value for that year. In sum, our evidence yields the following conclusions.
1. On average, each $1,000 change in shareholder wealth corre- sponds to an increase in this year's and next year's salary and bonus of about two cents. The CEO's wealth due to his cash compensation- defined as his total compensation plus the discounted present value of the change in his salary and bonus-changes by about 30? per $1,000 change in shareholder wealth. In addition, the value of the CEO's stock options-defined as the value of the outstanding stock options plus the gains from exercising options-changes by 15? per $1,000. Our final upper-bound estimate of the average compensation-related wealth consequences of a $1,000 change in shareholder value is 45? for the full sample, 40? for large firms, and 90? for small firms.
2. Our weighted-average estimate of the CEO's dismissal-related wealth consequences of each $1,000 shareholder loss for an average- size firm with - 50 percent net-of-market returns for two consecutive years is 30? for the full sample, 5V for large firms, and $2.25 for small firms. Therefore, the total pay-performance sensitivity-including both pay and dismissal-is about 75? per $1,000 change in share- holder wealth for the full sample (45? and $3.15 per $1,000 for large and small firms, respectively).
3. The largest CEO performance incentives come from ownership of their firms' stock, but such holdings are small and declining. Me- dian 1986 inside stockholdings for 746 CEOs in the Forbes compensa- tion survey are 0.25 percent, and 80 percent of these CEOs hold less than 1.4 percent of their firms' shares. Median ownership for CEOs of large firms is 0.14 percent and for small firms is 0.49 percent. Adding the incentives generated by median CEO stockholdings to our previous estimates gives a total change in all CEO pay- and stock- related wealth of $3.25 per $1,000 change in shareholder wealth for the full sample, $1.85 per $1,000 for large firms, and $8.05 for small firms.
4. Boards of directors do not vary the pay-performance sensitivity for CEOs with widely different inside stockholdings.

262 JOURNAL OF POLITICAL ECONOMY
5. Although bonuses represent 50 percent of CEO salary, such bonuses are awarded in ways that are not highly sensitive to perfor- mance as measured by changes in market value of equity, accounting earnings, or sales.
6. The low variability of changes in CEO compensation reflects the fact that in spite of the apparent importance of bonuses in CEO compensation, they are not very variable from year to year. The fre- quency distributions of annual percentage changes in CEO salary plus bonus and total pay are comparable to that of a sample of 10,000 randomly selected workers. Thus our results indicating a weak rela- tion between pay and performance are not due to boards of directors using measures of managerial performance that are unobservable to us.
7. Median CEO inside stockholdings for the 120 largest NYSE firms fell by an order of magnitude from 0.3 percent in 1938 to 0.03 per- cent in 1984.
8. The average standard deviation of pay changes for CEOs in the top quartile (by value) of all NYSE firms fell from $205,000 in 1934- 38 to $127,000 in 1974-86.
9. The pay-performance sensitivity for top-quartile CEOs fell by an order of magnitude from 17.5? per $1,000 in 1934-38 to 1.9? per $1,000 in 1974-86.
10. The average salary plus bonus for top-quartile CEOs (in 1986 dollars) fell from $813,000 in 1934-38 to $645,000 in 1974-86, while the average market value of the sample firms doubled.
The lack of strong pay-for-performance incentives for CEOs indi- cated by our evidence is puzzling. We hypothesize that political forces operating both in the public sector and inside organizations limit large payoffs for exceptional performance. Truncating the upper tail of the payoff distribution requires that the lower tail of the distribu- tion also be truncated in order to maintain levels of compensation consistent with equilibrium in the managerial labor market. The re- sulting general absence of management incentives in public corpora- tions presents a challenge for social scientists and compensation prac- titioners.
References
Benston, George J. "The Self-serving Management Hypothesis: Some Evi- dence." J. Accounting and Econ. 7 (April 1985): 67-84.
Black, Fischer, and Scholes, Myron S. "The Pricing of Options and Corporate Liabilities."J.P.E. 81 (May/June 1973): 637-54.
Brickley, James A., and Dark, Frederick H. "The Choice of Organizational Form: The Case of Franchising."J. Financial Econ. 18 (June 1987): 401-20.

TOP-MANAGEMENT INCENTIVES 263
Conference Board. Top Executive Compensation. 1985 ed. New York: Confer- ence Board, 1984.
Coughlan, Anne T., and Schmidt, Ronald M. "Executive Compensation, Management Turnover, and Firm Performance: An Empirical Investiga- tion." J. Accounting and Econ. 7 (April 1985): 43-66.
Fama, Eugene F. "Agency Problems and the Theory of the Firm."J.P.E. 88 (April 1980): 288-307.
Fama, Eugene F., and Schwert, G. William. "Asset Returns and Inflation." J. Financial Econ. 5 (November 1977): 115-46.
Gibbons, Robert, and Murphy, Kevin J. "Agency Theory and the Determi- nants of Executive Compensation." Working paper. Rochester, N.Y.: Univ. Rochester, 1989.
. "Relative Performance Evaluation for Chief Executive Officers." In- dus. and Labor Relations Rev. (1990), in press.
Hart, Oliver D. "The Market Mechanism as an Incentive Scheme." Bell J. Econ. 14 (Autumn 1983): 366-82.
Holmstrdm, Bengt. "Moral Hazard and Observability." Bell J. Econ. 10 (Spring 1979): 74-91.
. "Moral Hazard in Teams." BellJ. Econ. 13 (Autumn 1982): 324-40. Jensen, Michael C. "Eclipse of the Public Corporation." Harvard Bus. Rev.
67 (September-October 1989): 61-74. Jensen, Michael C., and Meckling, William H. "Rights and Production Func-
tions: An Application to Labor Managed Firms and Codetermination." J. Bus. 52 (October 1979): 469-506.
Jensen, Michael C., and Murphy, Kevin J. "Are Executive Compensation Contracts Structured Properly?" Manuscript. Boston: Harvard Bus. School, May 1988.
Johnson, W. Bruce; Magee, Robert P.; Nagarajan, Nandu J.; and Newman, Harry A. "An Analysis of the Stock Price Reaction to Sudden Executive Deaths: Implications for the Managerial Labor Market." J. Accounting and Econ. 7 (April 1985): 151-74.
Kaplan, Steven. "Management Buyouts: Operating Improvements as a Source of Value." Manuscript. Chicago: Univ. Chicago, June 1989.
Lewellen, Wilbur G. The Ownership Income of Management. New York: Colum- bia Univ. Press (for NBER), 1971.
McLaughlin, Kenneth J. "The Quit-Layoff Distinction in a Joint Wealth Max- imizing Approach to Labor Turnover." Ph.D. dissertation, Univ. Chicago, 1987.
Manne, Henry G. "Mergers and the Market for Corporate Control."J.P.E. 73 (April 1965): 110-20.
Martin, Kenneth J., and McConnell, John J. "Corporate Performance, Cor- porate Takeovers, and Management Turnover." Manuscript. West Lafay- ette, Ind.: Purdue Univ., November 1988.
Murphy, Kevin J. "Corporate Performance and Managerial Remuneration: An Empirical Analysis." J. Accounting and Econ. 7 (April 1985): 11-42.
."Incentives, Learning, and Compensation: A Theoretical and Empir- ical Investigation of Managerial Labor Contracts." Randj. Econ. 17 (Spring 1986): 59-76.
Noreen, Eric W., and Wolfson, Mark A. "Equilibrium Warrant Pricing Mod- els and Accounting for Executive Stock Options." J. Accounting Res. 19 (Autumn 1981): 384-98.
Rogers, David. "Grass-Roots Issue: Congress's Pay Raise, Slated for Next Week, Stirs a Spirited Debate." Wall StreetJ. (February 1, 1989).

264 JOURNAL OF POLITICAL ECONOMY
Rubin, Paul H. "The Theory of the Firm and the Structure of the Franchise Contract." J. Law and Econ. 21 (April 1978): 223-33.
U.S. Department of Commerce. Franchising in the Economy, 1986-1987. Wash- ington: Government Printing Office, January 1987.
U.S. Securities and Exchange Commission. Survey of American Listed Corpora- tions. Pts. 1-7. New York: Securities and Exchange Comm. (for Work Proj- ects Admin.), January 1940-February 1941.
Vancil, Richard F. Passing the Baton: Managing the Process of CEO Succession. Boston: Harvard Bus. School Press, 1987.
Walsh, James P. "Top Management Turnover Following Mergers and Acqui- sitions." Strategic ManagementJ. 9 (March-April 1988): 173-83.
Warner, Jerold B.; Watts, Ross L.; and Wruck, Karen H. "Stock Prices and Top Management Changes." J. Financial Econ. 20 (January/March 1988): 461-92.
Watts, Ross L., and Zimmerman, Jerold L. Positive Accounting Theory. En- glewood Cliffs, N.J.: Prentice-Hall, 1986.
Weisbach, Michael S. "Outside Directors and CEO Turnover." J. Financial Econ. 20 (January/March 1988): 431-60.