performance profiles of major energy producers 2009 profiles of major energy producers 2009 is...
TRANSCRIPT
Performance Profiles of Major Energy Producers 2009
February 2011


DOE/EIA-0206(09)
Distribution Category UC-950
Performance Profiles
of Major Energy Producers
2009
February 2011
U.S. Energy Information Administration
Office of Energy Statistics
U.S. Department of Energy
Washington, DC 20585
This report was prepared by the U.S. Energy Information Administration (EIA), the statistical and analytical agency within the U.S. Department of Energy. By law, EIA’s data, analyses, and forecasts are independent of approval by any other officer or employee of the United States Government. The views in this report therefore should not be construed as representing those of the Department of Energy or other Federal agencies.
Performance Profiles of Major Energy Producers 2009 ii
Contacts Performance Profiles of Major Energy Producers 2009 is prepared by the U.S. Energy Information Administration, Office of Energy Statistics; Office of Oil, Gas, and Coal Supply Statistics; Oil & Gas Supply & Financial Statistics Team under the general direction of Bruce Bawks of the Office of Energy Analysis, available at (202) 586-6579. Specific technical information concerning the associated data survey (Form EIA-28) may be obtained at http://www.eia.gov/emeu/finance/page1a.html. Questions about particular parts of the report may be directed to the following authors.
Major Findings.............................................................................................................Bruce Bawks, (202) 586-6579
[email protected] Financial Developments...............................................................................................Bruce Bawks, (202) 586-6579
bruce.bawks@eia. gov Oil and Gas Production ........................................................................................... Larry Spancake, (202) 586-9753
larry.spancake@eia. gov Refining and Marketing .................................................................................................. Neal Davis, (202) 586-6581
neal.davis@eia. gov
About the FRS Companies.............................................................................................. Neal Davis, (202) 586-6581 neal.davis@eia. gov
Overview of 2009 Petroleum and Natural Gas Markets ............................................... Bob Schmitt, (202) 586-8644
robert.schmitt@eia. gov

Contents
Contacts ............................................................................................................................................................ ii Major Findings ...................................................................................................................................................... vii Financial Developments........................................................................................................................................... 1 Net Income and Profitability......................................................................................................................... 1 Cash Flow and Capital Expenditures ........................................................................................................... 6 Oil and Gas Production Expenditures .......................................................................................................... 9 Refining/Marketing Capital Expenditures .................................................................................................. 12 Oil and Natural Gas Production .......................................................................................................................... 13 Oil and Natural Gas Reserves .................................................................................................................... 13 Oil and Natural Gas Reserve Additions...................................................................................................... 16 Oil and Natural Gas Production ................................................................................................................ 17 Upstream Income ........................................................................................................................................ 17 Lifting Costs ................................................................................................................................................ 18 Finding Costs .............................................................................................................................................. 20 Upstream Costs ........................................................................................................................................... 22 Refining and Marketing ........................................................................................................................................ 25 U.S. Refining/Marketing ............................................................................................................................. 25 Revenues and Costs..................................................................................................................................... 27 Operational Changes .................................................................................................................................. 31 Foreign Refining/Marketing ....................................................................................................................... 37 Consolidated Operations ............................................................................................................................ 39 Unconsolidated Operations ........................................................................................................................ 39 About the Financial Reporting System Companies ........................................................................................... 43 Changes in the Financial Reporting System Companies for the 2009 Reporting Year .............................. 43 The FRS Companies’ Importance in the U.S. Economy ............................................................................. 44 Overview of 2009 Petroleum and Natural Gas Markets .................................................................................... 47 Acronyms .......................................................................................................................................................... 53 Brief Description of Financial Terms................................................................................................................... 55 (Glossary available on EIA's website at http://www.eia.doe.gov/emeu/perfpro/glossary.html)
Performance Profiles of Major Energy Producers 2009 iii

Tables 1. Consolidated Income Statement for FRS Companies, 2008-2009................................................................ 2 2. Contributions to Net Income by Line of Business for FRS Companies, 2008-2009 .................................... 4 3. Sources and Uses of Cash for FRS Companies, 2008-2009 ......................................................................... 7 4. Reported Value of Mergers, Acquisitions, and Related Transactions by FRS Companies, 2009 ................ 9 5. Oil and Natural Gas Reserves of FRS Companies, 2008 and 2009 ............................................................ 14 6. Growth Rates of U.S. Oil and Natural Gas Reserves for FRS Companies and All Oil and Natural Gas Producers, 2001 - 2009 ................................................................................... 16 7. Oil and Natural Gas Reserve Additions by FRS Companies, 2008 and 2009 ............................................ 18 8. Oil and Natural Gas Production by FRS Companies, 2008 and 2009 ........................................................ 19 9. Income Components and Financial Ratios in Oil and Natural Gas Production for FRS Companies, 2008 and 2009 ...................................................................................................... 20 10. Lifting Costs for FRS Companies, 2008 and 2009 ..................................................................................... 21 11. Finding Costs for FRS Companies, 2006-2008 and 2007-2009 ................................................................. 23 12. Upstream Costs for FRS Companies, 2006-2008 and 2007-2009 .............................................................. 24 13. Sales, Prices, Costs, and Margins in U.S. Refining/Marketing for FRS Companies, 2008-2009............... 26 14. U.S. Refined Product Margins and Costs per Barrel Sold and Product Sales Volume for FRS Companies, 2008-2009 .......................................................................................................................... 30 15. U.S. and Foreign Refining/Marketing Financial Items for FRS Companies, 2008-2009 ........................... 31 16. Motor Gasoline Distribution and Number of Direct-Supplied Branded Outlets for FRS Companies, 2008-2009............................................................................................................. 33 17. U.S. and Foreign Refining/Marketing Investment and Refining Operating Items for FRS Companies, 2008-2009 .......................................................................................................................... 35 18. U.S. Refinery Configurations for FRS Companies, Selected Years, 1974-2009........................................ 36 19. Regional Distribution of Foreign Refinery Capacity for FRS Companies, 2008-2009 .............................. 38 20. The FRS Companies in 2009 ...................................................................................................................... 43 21. World Petroleum Balance, 2008-2009........................................................................................................ 50 22. U.S. Petroleum Balance, 2008-2009........................................................................................................... 51 23. U.S. Natural Gas Balance, 2008-2009 ....................................................................................................... 52 Illustrations 1. FRS Net Income, 1974-2009 ........................................................................................................................ 2 2. Return on Stockholders’ Equity for FRS Companies and All Manufacturing Companies, 1974-2009 ....... 3 3. Difference Between FRS and All Manufacturing Companies Return on Stockholders’ Equity, 1974-2009................................................................................................................................... 3 4. Return on Net Investment in Place for U.S. and Foreign Oil and Natural Gas Production for FRS Companies, 1977-2009.............................................................................................................. 5 5. Return on Net Investment in Place for U.S. and Foreign Refining/Marketing for FRS Companies, 1977-2009 ................................................................................................................... 5 6. U.S. Refined Product Margins and Costs per Barrel of Petroleum Product Sold for FRS Companies, 1977-2009 ................................................................................................................... 6 7. FRS Companies’ Capital Expenditures by Petroleum Business Segment, 2008-2009................................. 8 8. FRS Companies’ Net Uses of Cash Flow, 2007-2009.................................................................................. 8 9. FRS Capital Expenditures, 1986-2009.......................................................................................................... 9 10. Cash Flow from Operations and Exploration and Production (E&P) Expenditures for FRS Companies, 1986-2009............................................................................................................. 10 11. FRS Worldwide Expenditures for Exploration, Development, and Production, 1981-2009 ...................... 11 12. FRS Expenditures for Oil and Natural Gas Exploration and Development by Region, 2000-2009........... 11 13. Oil and Natural Gas Reserves of FRS Companies, 1981-2009 .................................................................. 15 14. Oil and Natural Gas Reserves of FRS Companies in Foreign Regions, 1981-2009................................... 17 15. Direct Oil and Natural Gas Lifting Costs for FRS Companies, 1981-2009................................................ 21
Performance Profiles of Major Energy Producers 2009 iv

Illustrations (continued) 16. Finding Costs for FRS Companies for Selected Regions, 1989-1991 to 2007-2009.................................. 23 17. Finding Costs for FRS Companies, 1981-1983 to 2007-2009.................................................................... 24 18. Return on Investment in U.S. and Foreign Refining/Marketing, and All Other Lines of Business for FRS Companies, 1977-2009 ............................................................................................ 25 19. Quarterly Average U.S. Crude Oil Stocks, 2003-2007 Average, 2008, and 2009...................................... 27 20. Quarterly Average U.S. Commercial Petroleum Product Stocks, 2003-2007 Average, 2008, and 2009 ... 28 21. Quarterly Average Total U.S. Motor Gasoline Stocks, 2003-2007 Average, 2008, and 2009 ................... 29 22. Company-Operated and Direct-Supplied Dealer Outlets for FRS Companies, 1989-2009........................ 34 23. Price Difference Between Light Crude Oil and Heavy Crude Oil, 1985-2009........................................... 36 24. Resale Price Difference Between Motor Gasoline and Residual Fuel Oil, 1985-2009 .............................. 37 25. Foreign Refining/Marketing Net Income from Consolidated Operations and Unconsolidated
Affiliates of FRS Companies, 1977-2009 ............................................................................................. 40 26. Petroleum Consumption by Region, 2003-2007 Average, 2008, and 2009................................................ 40 27. Operating Revenues by Line of Business for FRS Companies, 1986-2009 ............................................... 45 28. Shares of U.S. Energy Production and Refinery Capacity for FRS Companies, 1986-2009...................... 46 29. Imported Refiner Acquisition Cost of Crude Oil and Natural Gas Wellhead Prices, 1972-2009............... 48 30. Refiner Prices of Petroleum Products for Resale, 1978-2009..................................................................... 49 31. World Oil Consumption, Change from Previous Year, 2000-2009............................................................ 50 32. U.S. Petroleum Product Consumption, Change from Previous Year, 2007-2009 ...................................... 51
Performance Profiles of Major Energy Producers 2009 v

Performance Profiles of Major Energy Producers 2009 vi
Performance Profiles of Major Energy Producers 2009
vii
Major Findings This edition of Performance Profiles reviews financial and operating data for the calendar year 2009 and discusses important trends and emerging issues relevant to U.S. energy company operations. Major U.S.-based oil and natural gas producers and petroleum refiners submit the data in this report annually on Form EIA-28, the Financial Reporting System (FRS). FRS companies’ net income declined to the lowest level since 2002. Net income fell 66 percent (in constant 2009 dollars) to $30 billion in 2009 from $88 billion in 2008.
Substantial reductions in oil and natural gas prices in 2009 slowed revenue growth. FRS companies cut operating costs but by less than the decline in revenue, resulting in a 69-percent drop in operating income.
FRS companies earned a 5-percent return on stockholders’ equity (ROE) in 2009, 4 percentage points below
the average ROE of the Census Bureau’s All Manufacturing Companies. For the first time since 2002, the profitability of FRS companies fell below this industry benchmark.
Upstream and downstream profits fell substantially in 2009. Oil and natural gas production continued to be the most profitable business segment, contributing $42 billion
in net income, but this was a decline of 43 percent from 2008. Return on net investment in place (ROI) fell to 7 percent in 2009 from 13 percent in 2008.
The refining/marketing segment reported a loss of $7 billion in 2009, compared with a $14-billion gain in
2008. ROI for domestic refining/marketing in 2009 declined to the lowest level ever reported in the FRS survey, negative 7 percent. Foreign refining/marketing ROI remained positive but was significantly lower, dropping to 6 percent in 2009 from 26 percent in 2008. The FRS companies’ average domestic refining/marketing gross margin (essentially the difference between product prices and raw material input costs) dropped to the lowest level since 1999 and was the second lowest level ever reported on the survey. This contributed to the first negative net margin reported by FRS companies, negative $0.36 per barrel in 2009.
Cash flow and capital expenditures fell substantially in 2009. Cash flow from operations decreased 41 percent from 2008 to $131 billion in 2009, led by the decline in net
income. Proceeds from the sales of assets fell 52 percent from 2008 to $12 billion in 2009 as the value of assets declined in the lower price environment. Funds raised from equity security offerings declined 30 percent to $5 billion, while proceeds from issuing long-term debt increased slightly to $77 billion.
The largest use of cash was for capital expenditures, which decreased 31 percent from 2008 to $139 billion in
2009. Despite the large decline, capital expenditures in 2009 remained higher than every year prior to 2005. The amount of cash used to repurchase company stock fell 65 percent to $20 billion in 2009, but FRS companies maintained dividend payments, which increased 2 percent to $32 billion. FRS companies’ long-term debt to equity ratio rose to 39 percent, the highest since 2004. Total uses of cash exceeded sources, resulting in the largest decline in cash and cash equivalents ever reported in the FRS survey, a decrease of $21 billion in 2009.
Upstream expenditures fell but remained at historically high levels. Expenditures for exploration, development, property acquisition, and production decreased 24 percent from
2008 to $166 billion in 2009. The 2009 expenditure level remained higher than every year prior to 2006.

Performance Profiles of Major Energy Producers 2009 viii
Compared with the 2008 level, development expenditures decreased 21 percent to $71 billion in 2009. It was the first decline in development expenditures since 1999. Exploration expenditures fell 1 percent to $17 billion but remained higher than every year from 1986 through 2007.
Oil and natural gas production and reserve additions increased. Worldwide production of oil (crude oil and natural gas liquids combined) by the FRS companies was up
markedly in 2009, while natural gas production grew slightly. The increase in oil production was the first substantial increase since 2001. In contrast, the increase in natural gas production was the smallest since 2006. Beginning in 2009, oil sands and other nonconventional oil production were included in the oil and natural gas production segment. This contributed to a substantial increase in oil production in Canada. Natural gas production decreased in three of the nine FRS regions, led by Europe. In 2009, FRS companies accounted for 43 percent of U.S. oil production and 43 percent of U.S. natural gas production.
Worldwide reserve additions by the FRS companies for oil and for natural gas increased in 2009, with both
growing more than 50 percent. Additions were most notable in the U.S. Onshore and Canada regions for oil and the U.S. Onshore and Other Eastern Hemisphere regions for natural gas.
Finding and lifting costs both declined. Average worldwide finding costs for the FRS companies decreased to $18.31 per barrel of oil equivalent
(boe) of reserves added in the 2007-2009 period compared with the 2006-2008 period, a decline of $5.79 per boe from 2008. Finding costs declined in all FRS regions except the Former Soviet Union, Africa, and the Middle East. The U.S. Offshore, which had the highest finding costs among the FRS regions in 2006-2008, had the largest fall in 2007-2009. Europe’s costs also fell substantially in 2007-2009. Europe had the highest finding costs among the foreign regions in 2006-2008. Canada displayed a large decline in part likely because of the inclusion of oil sands in 2009.
Reversing an almost decade-long trend, worldwide total lifting costs for the FRS companies fell $1.19 per
boe, to $11.51 per boe, in 2009. Total lifting costs also fell in each of the FRS regions except Canada, where they rose $2.49, probably reflecting the inclusion of oil sands in 2009. Production taxes were the major contributor to the decline in total lifting costs. Worldwide they declined $0.84 per boe in 2009, which is 70 percent of the decline in total lifting costs. Production taxes typically rise and fall with changes in the prices of oil and natural gas, both of which fell in 2009. Direct lifting costs fell 14 percent in the United States but increased in every foreign region. Finding and lifting costs combined fell almost $5 per boe in the 2007–2009 period to $29.81 per boe.
U.S. refining/marketing capital expenditures declined but remained high; U.S. refinery capacity increased. Capital expenditures for the FRS companies’ domestic refining/marketing segment decreased 16 percent from
2008 to $22 billion in 2009 while foreign refining/marketing capital expenditures increased 2 percent. Despite the net income loss reported by domestic refining/marketing, capital expenditures in 2009 remained higher than all but 3 prior years in the survey.
FRS companies reported that their U.S. refinery capacity increased 2 percent, which includes the addition of
three refinery joint ventures to the FRS survey. FRS companies accounted for 78 percent of U.S. refining capacity in 2009.

Performance Profiles of Major Energy Producers 2009
1
Financial Developments The U.S. Energy Information Administration’s (EIA) Performance Profiles of Major Energy Producers 2009 provides a financial review and analysis of the domestic and worldwide activities and operations of the major U.S.-based energy-producing companies. Performance Profiles examines companies’ operations on a consolidated corporate level, by individual lines of business, by major functions within each line of business, and by geographic regions. The report focuses on annual aggregate changes in profits, cash flow, and investment in the United States and international energy industry. It also explores changes in the majors' exploration and development expenditures, production, reserves additions, and refining costs and margins. The analysis in this report is based on detailed financial and operating data and information submitted each year to EIA on Form EIA-28, the Financial Reporting System (FRS).
Net Income and Profitability Net income for FRS companies fell 66 percent (in constant 2009 dollars)1 to $30 billion in 2009 from $88 billion in 2008 (Table 1). This was the lowest level of earnings since 2002 and was sharply lower than the record high levels of recent years (Figure 1). Substantial reductions in oil and natural gas prices in 2009 slowed revenue growth. FRS companies cut operating costs but by less than the decline in revenue, resulting in a 69-percent drop in operating income. FRS companies also reported a 43-percent decline in “Other Revenue,” which was driven primarily by smaller gains on the sales of property, plant, and equipment and lower earnings for affiliates of FRS companies that are not included in the operating data. FRS companies continued to write down assets in 2009 but the amount was significantly lower than in 2008. Natural gas prices generally declined in 2009, while oil prices generally rose from their level at the end of 2008. Excluding the effect of asset impairments and other special items, net income for FRS companies decreased 66 percent to $50 billion in 2009. The FRS companies’ return on stockholders’ equity (ROE) fell to 5 percent in 2009, the lowest level since 1992 (Figure 2). For the first time since 2002, the profitability of FRS companies fell below that of the Census Bureau’s All Manufacturing Companies (Figure 3), which is a survey of the financial results of manufacturing corporations with assets greater than $250,000. From 2000 to 2008, the FRS companies outperformed the Census Bureau’s All Manufacturing Companies by an average of 7 percentage points, compared with an average 2 percentage points lower from 1985 to 1999, but in 2009, the FRS companies’ ROE fell 4 percentage points below this industry benchmark. Among the FRS companies’ lines of business and business segments, oil and natural gas production continued to be the most profitable, contributing $42 billion in net income in 2009 (Table 2), although this was a decline of 43 percent from the 2008 level, due in large part to lower revenues as a result of much lower oil and natural gas prices. Return on net investment in place (ROI) for the oil and natural gas production segment fell to 7 percent in 2009 from 13 percent in 2008. The difference between domestic and foreign ROI widened as domestic oil and gas production ROI fell to 4 percent, the lowest level since 1998 (Figure 4). The refining/marketing segment reported a loss of $7 billion in 2009, compared with a $14-billion gain in 2008. Domestic refining/marketing had a $9-billion loss in 2009, while foreign refining/marketing net income fell 77 percent to $3 billion. ROI for domestic refining/marketing in 2009 declined to the lowest level ever reported in
1 Unless otherwise indicated, all dollar values and percentage changes in this report are based in constant 2009 dollars, adjusted using the gross domestic product (GDP) deflator.

2008 2009
Percent Change
2008-2009
Operating Revenues 1,834.7 1,145.6 -37.6
Operating Expenses 1,669.1 1,094.3 -34.4
Operating Income (Revenues minus Expenses)
165.6 51.2 -69.1
Interest Expense 11.5 10.9 -5.3
Other Revenue (Expense) 32.9 18.8 -42.8
Income Tax Expense 99.4 29.7 -70.1
Net Income 87.7 29.5 -66.4
Net Income Excluding Special Items 144.7 49.8 -65.6
Note: Sum of components may not equal total due to independent rounding. Percent changes were calculated from unrounded data. NA= not available.
Source: U.S. Energy Information Administration Form EIA-28 (Financial Reporting System).
Table 1. Consolidated Income Statement for FRS Companies, 2008-2009 (Billion 2009 Dollars)
FRS Companies
Income Statement Items
0
20
40
60
80
100
120
140
1974 1977 1980 1983 1986 1989 1992 1995 1998 2001 2004 2007
Bill
ion
200
9 D
olla
rs
Figure 1. FRS Net Income, 1974-2009
Note: The FRS group of companies has changed incrementally over the years. Source: U.S. Energy Information Administration, Form EIA-28 (Financial Reporting System).
Performance Profiles of Major Energy Producers 2009 2

0
5
10
15
20
25
30
1974 1977 1980 1983 1986 1989 1992 1995 1998 2001 2004 2007
Pe
rcen
t
Sources: FRS Companies: U.S. Energy Information Administration, Form EIA-28 (Financial Reporting System). All Manufacturing Companies: U.S. Census Bureau Quarterly Financial Report, All Manufacturing Companies.
FRS Companies
Figure 2. Return on Stockholders' Equity for FRS Companies and All Manufacturing Companies, 1974-2009
All Manufacturing Companies
-10
-5
0
5
10
15
1974 1977 1980 1983 1986 1989 1992 1995 1998 2001 2004 2007
Per
cen
tag
e P
oin
ts
Figure 3. Difference Between FRS and All Manufacturing Companies Return on Stockholders' Equity, 1974-2009
Sources: FRS Companies: U.S. Energy Information Administration, Form EIA-28 (Financial Reporting System). All Manufacturing Companies: U.S. Census Bureau Quarterly Financial Report, All Manufacturing Companies.
Performance Profiles of Major Energy Producers 2009
3

Petroleum U.S. Petroleum Oil and Natural Gas Production 32,594 10,628 -67.4 52,418 24,534 -53.2 Refining/Marketing 3,045 -9,396 n.a. 8,611 -5,663 n.a. Pipelines 238 478 100.7 239 478 99.6
Total U.S. Petroleum 35,877 1,710 -95.2 61,268 19,349 -68.4
Foreign Petroleum Oil and Natural Gas Production 40,132 31,019 -22.7 66,494 31,699 -52.3
Refining/Marketinga 11,162 2,576 -76.9 11,392 2,107 -81.5
Total Foreign Petroleum 51,294 33,595 -34.5 77,886 33,806 -56.6
Total Petroleum 87,171 35,305 -59.5 139,154 53,155 -61.8
Downstream Natural Gas 3,581 6,722 87.7 3,494 6,995 100.2
Electric Power 9,396 -1,767 n.a. 9,396 -1,767 n.a.
Other Energyb -327 206 n.a. 1,187 216 -81.8
Nonenergy -2,383 1,316 n.a. 1,317 1,368 3.9
Total Allocated 97,439 41,782 -57.1 154,549 59,967 -61.2
Nontraceablec -9,731 -12,280 n.a. -9,811 -10,130 n.a.
Consolidated Net Incomed 87,708 29,502 -66.4 144,737 49,837 -65.6
n.a.: not applicable
cRevenues and expenses that cannot be directly attributed to a line of business.
Table 2. Contributions to Net Income by Line of Business for FRS Companies, 2008-2009 (Million 2009 Dollars)
Source: U.S. Energy Information Administration, Form EIA-28 (Financial Reporting System).
2008 2009
Percent Change
2008-2009
Percent Change
2008-2009
dThe total amount of special items was -$57,030 million and -$20,335 million in 2008 and 2009, respectively.
bThe Other Energy line of business includes coal, nuclear, and non-conventional energy.
aInternational Marine is included in Refining/Marketing.
Net Income Excluding Special Items
2008 2009Line of Business
Net Income
the FRS survey, negative 7 percent. Foreign refining/marketing ROI remained positive but was significantly lower, dropping to 6 percent in 2009 from 26 percent in 2008 (Figure 5). The FRS companies’ average domestic refining/marketing gross margin (essentially the difference between product prices and raw material input costs) dropped to the lowest level since 1999 and was the second lowest level ever reported on the survey (Figure 6). Per-barrel operating costs also declined, but by a much smaller amount. Refinery energy costs fell 48 percent from 2008, reflecting the decline in petroleum and natural gas prices, while marketing costs and other operating costs each decreased by 17 percent. The combination of the lower average gross margin and operating costs led to the first negative net margin reported by FRS companies, negative $0.36 per barrel in 2009.
Performance Profiles of Major Energy Producers 2009 4

0
5
10
15
20
25
30
1977 1979 1981 1983 1985 1987 1989 1991 1993 1995 1997 1999 2001 2003 2005 2007 2009
Per
cen
t
Figure 4. Return on Net Investment in Place for U.S. and Foreign Oil and Natural Gas Production for FRS Companies, 1977-2009
Source: U.S. Energy Information Administration, Form EIA-28 (Financial Reporting System).
U.S.
Foreign
-10
-5
0
5
10
15
20
25
30
35
1977 1979 1981 1983 1985 1987 1989 1991 1993 1995 1997 1999 2001 2003 2005 2007 2009
Per
cen
t
Figure 5. Return on Net Investment in Place for U.S. and Foreign Refining/Marketing for FRS Companies, 1977-2009
Source: U.S. Energy Information Administration, Form EIA-28 (Financial Reporting System).
U.S.Foreign
Performance Profiles of Major Energy Producers 2009
5

-2
0
2
4
6
8
10
12
14
16
1977 1979 1981 1983 1985 1987 1989 1991 1993 1995 1997 1999 2001 2003 2005 2007 2009
Do
llars
(20
09)
per
Bar
rel
Figure 6. U.S. Refined Product Margins and Costs per Barrel of Petroleum Product Sold for FRS Companies, 1977-2009
Note: The gross margin is refined product revenues less raw material cost and product purchases divided by refined product sales volume. Source: U.S. Energy Information Administration, Form EIA-28 (Financial Reporting System).
Net Margin
Operating Costs
Gross Margin
The marketing/trading segments of the downstream natural gas and electric power lines of business heavily influenced the earnings of these lines of business. Net income for the downstream natural gas line of business increased 88 percent to $7 billion in 2009 while electric power net income dropped from a $9-billion gain in 2008 to a $2-billion loss in 2009. The non-energy line of business reported net income of $1 billion in 2009 after showing a loss in 2008. Chemical operations account for a large portion of the non-energy line of business. Higher margins, higher sales volumes, and lower operating costs were cited as reasons for higher chemical earnings.2
Cash Flow and Capital Expenditures The cash flow statement provides information on sources and uses of cash, with sections for operations, investing activities, and financing activities. Cash flow from operations consists of net income after taxes plus depreciation and other noncash expenses. Investing activities include the net effect of buying and selling property, plant, and equipment. Financing activities include the net effect of issuing and purchasing company stock, issuing and paying off debt, and paying dividends. Major sources of cash include cash flow from operations, sales of assets, and proceeds from issuing debt or equity. Primary uses of cash include making capital expenditures, paying dividends, purchasing company stock, and paying off debt. Capital expenditures represent the value of assets acquired in the current time period net of depreciation and also include investments and advancements to unconsolidated affiliate companies. This report also refers to capital expenditures as additions to investment in place. The current cash flow statement was added to the survey in 1986.
Performance Profiles of Major Energy Producers 2009 6
2 U.S. Energy Information Administration, Financial News for Major Energy Companies, Fourth Quarter 2009 (February 2010), p. 6, available at http://www.eia.gov/emeu/perfpro/news_m/q409.pdf (as of October 13, 2010).
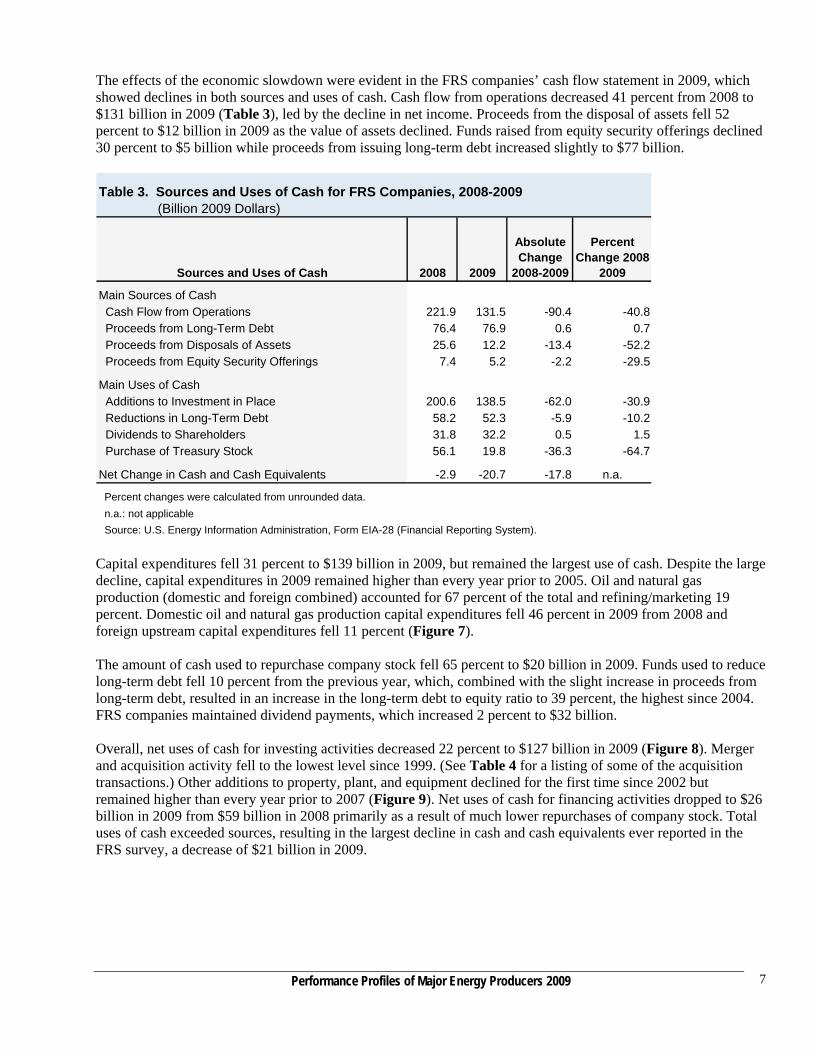
The effects of the economic slowdown were evident in the FRS companies’ cash flow statement in 2009, which showed declines in both sources and uses of cash. Cash flow from operations decreased 41 percent from 2008 to $131 billion in 2009 (Table 3), led by the decline in net income. Proceeds from the disposal of assets fell 52 percent to $12 billion in 2009 as the value of assets declined. Funds raised from equity security offerings declined 30 percent to $5 billion while proceeds from issuing long-term debt increased slightly to $77 billion.
Sources and Uses of Cash 2008 2009
Absolute Change
2008-2009
Percent Change 2008-
2009
Main Sources of Cash Cash Flow from Operations 221.9 131.5 -90.4 -40.8 Proceeds from Long-Term Debt 76.4 76.9 0.6 0.7 Proceeds from Disposals of Assets 25.6 12.2 -13.4 -52.2 Proceeds from Equity Security Offerings 7.4 5.2 -2.2 -29.5
Main Uses of Cash Additions to Investment in Place 200.6 138.5 -62.0 -30.9 Reductions in Long-Term Debt 58.2 52.3 -5.9 -10.2 Dividends to Shareholders 31.8 32.2 0.5 1.5 Purchase of Treasury Stock 56.1 19.8 -36.3 -64.7
Net Change in Cash and Cash Equivalents -2.9 -20.7 -17.8 n.a.
n.a.: not applicable
Table 3. Sources and Uses of Cash for FRS Companies, 2008-2009 (Billion 2009 Dollars)
Percent changes were calculated from unrounded data.
Source: U.S. Energy Information Administration, Form EIA-28 (Financial Reporting System). Capital expenditures fell 31 percent to $139 billion in 2009, but remained the largest use of cash. Despite the large decline, capital expenditures in 2009 remained higher than every year prior to 2005. Oil and natural gas production (domestic and foreign combined) accounted for 67 percent of the total and refining/marketing 19 percent. Domestic oil and natural gas production capital expenditures fell 46 percent in 2009 from 2008 and foreign upstream capital expenditures fell 11 percent (Figure 7). The amount of cash used to repurchase company stock fell 65 percent to $20 billion in 2009. Funds used to reduce long-term debt fell 10 percent from the previous year, which, combined with the slight increase in proceeds from long-term debt, resulted in an increase in the long-term debt to equity ratio to 39 percent, the highest since 2004. FRS companies maintained dividend payments, which increased 2 percent to $32 billion. Overall, net uses of cash for investing activities decreased 22 percent to $127 billion in 2009 (Figure 8). Merger and acquisition activity fell to the lowest level since 1999. (See Table 4 for a listing of some of the acquisition transactions.) Other additions to property, plant, and equipment declined for the first time since 2002 but remained higher than every year prior to 2007 (Figure 9). Net uses of cash for financing activities dropped to $26 billion in 2009 from $59 billion in 2008 primarily as a result of much lower repurchases of company stock. Total uses of cash exceeded sources, resulting in the largest decline in cash and cash equivalents ever reported in the FRS survey, a decrease of $21 billion in 2009.
Performance Profiles of Major Energy Producers 2009
7

Performance Profiles of Major Energy Producers 2009 8
0
20
40
60
80
100
Domestic Production DomesticRefining/Marketing
Foreign Production Foreign Refining/Marketing
Bill
ion
200
9 D
olla
rs
Figure 7. FRS Companies' Capital Expenditures by Petroleum Business Segment, 2008-2009
Capital Expenditures - additions to property, plant and equipment plus additions to investments and advances to unconsolidated affiliates. Source: U.S. Energy Information Administration, Form EIA-28 (Financial Reporting System).
2008
2009
-50
0
50
100
150
200
Investing Financing Other
Bill
ion
200
9 D
olla
rs
Figure 8. FRS Companies' Net Uses of Cash Flow, 2007-2009
Investing - buying and selling property, plant, and equipment. Financing - issuing and purchasing company stock, issuing and paying off debt, and paying dividends. Source: U.S. Energy Information Administration, Form EIA-28 (Financial Reporting System).
2007 2009
2008

Acquiring Company Assets AcquiredReported Value of Acquisition
Total 25 percent Barnett shale interest from Chesapeake 2,250Valero Ethanol plants and site development 429Occidental Phibro LLC from Citigroup, Inc. 370Occidental Plains All American Pipeline 330Occidental California properties from Crimson 300Williams Properties in the Piceance Basin 253Anadarko Property exchange 230Occidental Calcium chloride business from Dow Chemical 210Apache Nine Permian Basin properties from Marathon 187
Williams 51 percent interest in Laurel Mountain, LLC 126 Sources: Company annual reports to shareholders and press releases.
Table 4. Reported Value of Mergers, Acquisitions, and Related Transactions by FRS Companies, 2009 (Million Dollars)
0
50
100
150
200
250
1986 1989 1992 1995 1998 2001 2004 2007
Bill
ion
200
9 D
olla
rs
Figure 9. FRS Capital Expenditures, 1986-2009
PPE - property, plant, and equipment.Source: U.S. Energy Information Administration, Form EIA-28 (Financial Reporting System).
Mergers and Acquisitions
Other Additions to PPE
Oil and Gas Production Expenditures In addition to capital expenditures, FRS companies report expenditures for unproved and proved property acquisition, exploration, development, and production (E&P) for the oil and natural gas production segment. The data include current and capital expenditures, but capital expenditures predominate.
Performance Profiles of Major Energy Producers 2009
9

E&P expenditures decreased 24 percent from 2008 to $166 billion in 2009 (Figure 10). The $52 billion decline in E&P expenditures was considerably less than the $90 billion drop in cash flow from operations, and the 2009 expenditure level remained higher than every year prior to 2006. Expenditures for development accounted for 43 percent of the 2009 E&P expenditure total and production added 39 percent. Exploration comprised 10 percent of the total, the highest share since 1999. Acquisition expenditures fell in 2009; their share of expenditures declined to 7 percent. Compared with the 2008 level, development expenditures decreased 21 percent to $71 billion in 2009 (Figure 11). It was the first decline in development expenditures since 1999. Exploration expenditures fell 1 percent to $17 billion but remained higher than every year from 1986 through 2007. Expenditures for production declined 6 percent to $65 billion in 2009. Regional expenditures are also reported, which provide insight into trends in upstream investment by FRS companies across world regions. The U.S. Onshore remains the most active region for the FRS companies’ oil and natural gas operations. Expenditures for exploration and development (excluding expenditures for acquisitions) in the U.S. Onshore region fell 34 percent from 2008 to $30 billion in 2009 (Figure 12), which, despite the decline, remained nearly twice the level in 2004. Expenditures for development predominate in the U.S. Onshore region: they declined to $25 billion in 2009, which was 35 percent of FRS companies’ development expenditures worldwide. Exploration expenditures, though considerably smaller than development expenditures, decreased 2 percent in 2009 to $5 billion.
0
50
100
150
200
250
1986 1988 1990 1992 1994 1996 1998 2000 2002 2004 2006 2008
Bill
ion
200
9 D
olla
rs
Cash Flow from Operations
E&P Expenditures
Note: E&P expenditures includes exploration, development, production, unproved acreage, and proved acreage expenditures. Source: U.S. Energy Information Administration, Form EIA-28 (Financial Reporting System).
Figure 10. Cash Flow from Operations and Exploration and Production (E&P) Expenditures for FRS Companies, 1986-2009
Performance Profiles of Major Energy Producers 2009 10

0
20
40
60
80
100
1981 1983 1985 1987 1989 1991 1993 1995 1997 1999 2001 2003 2005 2007 2009
Bill
ion
200
9 D
olla
rs
Figure 11. FRS Worldwide Expenditures for Exploration, Development, and Production, 1981-2009
Source: U.S. Energy Information Administration, Form EIA-28 (Financial Reporting System).
Exploration
DevelopmentProduction
0
10
20
30
40
50
US Onshore US Offshore Canada Europe FSU Africa Middle East OEH OWH
Bill
ion
200
9 D
olla
rs
Figure 12. FRS Expenditures for Oil and Natural Gas Exploration and Development by Region, 2000-2009
Note: FSU is Former Soviet Union. OEH is Other Eastern Hemisphere, which is primarily the Asia Pacific region. OWH is Other Western Hemisphere, which is primarily Central and South America and the Caribbean. Source: U.S. Energy Information Administration, Form EIA-28 (Financial Reporting System).
2000 2009
Performance Profiles of Major Energy Producers 2009
11

Performance Profiles of Major Energy Producers 2009 12
Exploration and development expenditures in the U.S. Offshore region decreased 10 percent from 2008 to $13 billion in 2009 (Figure 12). Expenditures for exploration account for 33 percent of the total in the U.S. Offshore region, compared with an average of 20 percent for FRS worldwide expenditures. Exploration and development expenditures in foreign FRS regions decreased 5 percent from 2008 to $46 billion in 2009. All regions except Canada declined from the previous year. Exploration and development expenditures in Canada jumped 42 percent from 2008 to $8 billion in 2009. This was the first year that companies included expenditures from oil sands mining operations in the oil and gas production segment, because of a new Securities and Exchange Commission (SEC) rule. Development spending accounted for nearly all of the increase. In 2009, FRS companies put more exploration and development expenditures into Africa than any other foreign region, as they have every year since 2002. Exploration and development expenditures in Africa decreased 4 percent from 2008 to $13 billion in 2009. Exploration and development expenditures in the Other Eastern Hemisphere region were the second highest among the FRS foreign regions, remaining slightly ahead of Canada and Europe despite declining 3 percent from 2008 to $9 billion in 2009.
Refining/Marketing Capital Expenditures Capital expenditures for the FRS companies’ domestic refining/marketing segment decreased 16 percent from 2008 to $22 billion in 2009 while foreign refining/marketing capital expenditures increased 2 percent (Figure 7). Despite the net income loss reported by domestic refining/marketing, capital expenditures in 2009 remained higher than all but 3 prior years in the survey. From 2000 to 2009, average annual capital expenditures in the FRS domestic refining/marketing segment were twice that of 1990 to 1999, which reflects the improved return on investment throughout most of this period compared with the 1990s.
Performance Profiles of Major Energy Producers 2009
13
Oil and Natural Gas Production
Oil and Natural Gas Reserves At the end of 2008, the U.S. Securities and Exchange Commission (SEC) adopted a rule that made substantial changes in the ways oil (crude oil and natural gas liquids) and natural gas reserves are accounted for in the financial reporting subject to its jurisdiction. For most companies, and all FRS companies, this rule took effect when they reported their 2009 financial results. Briefly, the rule, “Modernization of Oil and Gas Reserve Reporting,” has four major stipulations.3 One changed the specification of the price of oil or natural gas that is used to determine whether oil and natural gas resources can be included in proved reserves. Previously, the price specified was the price on the last day of the previous year. The new rule uses an average of monthly prices over the time period covered by the financial report. Another change is the inclusion of nontraditional resources in oil and gas reserves. Companies will be able to include previously excluded resources such as “saleable hydrocarbons, in the solid, liquid, or gaseous state, from oil sands, shale, coalbeds, or other nonrenewable natural resources which are intended to be upgraded into synthetic oil or gas.”4 Another change redefines “reliable technology”5 to broaden the types of technologies that a company may use to estimate reserves. And finally, in addition to proved reserves, companies may now disclose probable and/or possible reserves. Proved reserves of oil and natural gas held by the Financial Reporting System (FRS) companies rose for both oil and natural gas in 2009, with oil reserves increasing at almost twice the rate of natural gas (Table 5). By far the largest increase in oil reserves occurred in Canada, with oil reserves falling in all other FRS regions, most notable the Former Soviet Union, except the U.S. Onshore and Offshore.6 The massive increase of more than 4 billion barrels in Canada is largely due to the SEC rule change that allowed for the inclusion of reserves of oil sands for the first time in 2009; Canada has an abundant endowment of this type of reserves. For the FRS companies in total, 2.7 billion barrels of their increased oil reserves came from the addition of oil sands in Canada. Oil reserve additions in the United States probably also benefited from an increase in the price of oil used to estimate proved reserves, which, as a result of another part of the SEC rule change, changed from the year-end value used in 2008 to the annual average value used in 2009. This resulted in a price increase from 2008 to 2009.7 This same effect may have mitigated the decreases in oil reserves in the other FRS regions. Natural gas reserves grew modestly in the U.S. Onshore and strongly in the Other Eastern Hemisphere; they decreased notably in Europe. In the U.S. Onshore, two of the largest contributors to the increase, Chesapeake Energy and EOG Resources, reported large increases in proved undeveloped reserves and cited the SEC rule change regarding the recognition of these
3 This discussion is derived from slides for a presentation by Rawdon J.H. Seager, “The New SEC Oil and Gas Reporting Regulations,” Gaffney, Cline & Associates, to the AAPG Geoscience Technology Workshop, September 9-11, 2009. For the complete SEC rule itself, see Securities and Exchange Commission, “Modernization of Oil and Gas Reporting,” Federal Register, January 14, 2009. 4 Securities and Exchange Commission, “Modernization of Oil and Gas Reporting,” Federal Register, January 14, 2009, p. 2163. 5 Securities and Exchange Commission, “Modernization of Oil and Gas Reporting,” Federal Register, January 14, 2009, pp. 2166-2167. 6 The reserves compared here are year-end 2008 and year-end 2009. They differences between them include the standard categories or reserve changes, revisions, improved recovery, extensions and discoveries, sales, purchases, and production, and also one category unique to 2009, changes from the new SEC rule, which, in FRS reporting, are added to beginning of year reserves and not any of in the standard categories. 7 For more information on oil and natural gas reserves for the United States, see U.S. Energy Information Administration, U.S. Crude Oil, Natural Gas, and Natural Gas Liquids Proved Reserves, 2009, http://www.eia.gov/pub/oil_gas/natural_gas/data_publications/crude_oil_natural_gas_reserves/current/pdf/arrsummary.pdf.

2008 2009Percent Change 2008 2009
Percent Change
United States Onshore 9,842 10,147 3.1 103,310 108,745 5.3
Offshore 2,972 3,040 2.3 7,603 6,811 -10.4
Total United States 12,814 13,187 2.9 110,913 115,556 4.2
Foreign Canada 1,372 5,473 298.9 9,868 9,789 -0.8
Europe 2,308 2,055 -11.0 9,956 8,523 -14.4 Former Soviet Union 1,906 1,203 -36.9 2,647 2,279 -13.9
Africa 5,070 4,718 -7.0 10,601 10,174 -4.0
Middle East 2,030 1,979 -2.5 7,566 7,488 -1.0
Other Eastern Hemisphere 1,911 1,721 -10.0 26,038 34,519 32.6
Other Western Hemisphere 486 425 -12.7 15,065 14,536 -3.5
Total Foreign 15,084 17,574 16.5 81,741 87,308 6.8
Total Worldwide 27,897 30,761 10.3 192,654 202,864 5.3
Source: U.S. Energy Information Administration, Form EIA-28 (Financial Reporting System).
Table 5. Oil and Natural Gas Reserves of FRS Companies, 2008 and 2009
Notes: The reserves compared here are at year-end. The differences between them include the standard categories or reserve changes, revisions, improved recovery, extensions and discoveries, sales, purchases, and production, and also one category unique to 2009, changes from the new SEC rule, which, in FRS reporting, are included in beginning-of-year reserves and not any of in the standard categories. Sums of elements may not add to totals due to independent rounding.
Region
Crude Oil andNatural Gas Liquids
(million barrels)Natural Gas
(billion cubic feet)
reserves as a major contributor to their reserve increases.8 In the Other Eastern Hemisphere, Exxon Mobil, a large contributor to the increase, completed the initial booking of its Gorgon Jansz liquefied natural gas (LNG) project in Australia and its Papua New Guinea LNG project, and Chevron, another large contributor, added extensions and discoveries at its Gorgon Project in Australia to its Other Eastern Hemisphere reserves.9 The domestic oil, domestic natural gas, foreign oil, and foreign natural gas reserves held by the FRS companies in 2009 all increased (Figure 13). A small increase in domestic oil reserves, in part likely because of the increase in the price used to value reserves, reversed their long-term declining trend, while a slightly larger increase in domestic natural gas reserves continued their decade-long climb, despite lower natural gas prices in 2009. The increase in natural gas reserves was partly driven by the changes in the rules for booking reserves that took effect in 2009 and also by the increases in unconventional gas reserves (shale gas), which have grown strongly in recent years.10 Foreign natural gas and especially oil reserves expanded on their small prior-year increases in 2009. As with domestic reserves, it is likely that price affected the increase in foreign oil reserves. Foreign reserves of natural gas were propelled by reserves booked for huge LNG projects in Australia and Papua New Guinea.
8 Chesapeake Energy, U.S. Securities and Exchange Commission Form 10-K, 2009, p. 10 and EOG Resources, U.S. Securities and Exchange Commission Form 10-K, 2009, p. F-39. 9 Exxon Mobil, U.S. Securities and Exchange Commission Form 10-K, 2009, p. 98, and Chevron, U.S. Securities and Exchange Commission Form 10-K, 2009, p. FS-75.
Performance Profiles of Major Energy Producers 2009 14
10 For more information on oil and natural gas reserves for the United States, see U.S. Energy Information Administration, U.S. Crude Oil, Natural Gas, and Natural Gas Liquids Proved Reserves, 2009, http://www.eia. gov/pub/oil_gas/natural_gas/data_publications/crude_oil_natural_gas_reserves/current/pdf/arrsummary.pdf.

0
5
10
15
20
25
1981 1983 1985 1987 1989 1991 1993 1995 1997 1999 2001 2003 2005 2007 2009
Bill
ion
Bar
rels
of
Oil
Eq
uiv
alen
t
Note: Natural gas was converted to barrels of oil equivalent at 0.178 barrels per 1000 cubic feet.Source: U.S. Energy Information Administration, Form EIA-28 (Financial Reporting System).
Figure 13. Oil and Natural Gas Reserves of FRS Companies, 1981-2009
Foreign Natural Gas
Domestic Natural Gas
Domestic Oil
Foreign Oil
In 2009, the growth in U.S. reserves for the FRS companies was notably less than that for the United States as a whole: 2.9 percent versus 8.7 percent, respectively, for oil and 4.2 percent versus 11.4 percent, respectively, for natural gas (Table 6). However, the annual growth rates for U.S. reserves for the FRS and the entire United States and the differences between them vary widely from year-to-year, and 2009 was for the most part anomalous for reserve growth for both the FRS and the entire country when compared to recent years. Both U.S. oil and natural gas reserves for FRS companies and for the United States grew faster in 2009 than their averages in recent years due to increases in crude oil prices and shale gas developments. However, total reserves in the United States as a whole grew faster relative to their previous averages than did FRS reserves. A further factor in the growth of U.S. reserves for the FRS companies is the extent to which the FRS companies have been relying on foreign reserves as a source of growth. While U.S. oil reserves for the FRS companies fell 15.0 percent between 2000 and 2009, foreign oil reserves for the FRS companies increased 5.2 percent. However, for natural gas, the opposite relationship holds, with U.S. natural gas reserves growing 42.3 percent and foreign natural gas reserves growing 13.2 percent. To some extent, foreign reserves have acted as a safety valve for the FRS companies. U.S. reserves for the FRS companies have been growing more slowly than reserves for the total United States in recent years. From 2000-2009, U.S. oil reserves for the FRS companies declined 15.0 percent and natural gas reserves grew 42.3 percent, while total U.S. oil reserves grew 1.6 percent and natural gas reserves grew 53.4 percent.
Performance Profiles of Major Energy Producers 2009
15

(Percent)
2001 2002 2003 2004 2005 2006 2007 2008 2009
Average Annual
Growth Rate 2001-2009
OilFRS Companies 3.6 -1.3 -3.3 -3.2 -0.8 -4.4 -2.3 -6.7 2.9 -1.8Total United States 0.2 0.8 -4.3 -0.2 2.1 -1.6 3.5 -6.8 8.7 0.2
Difference (FRS - Total) 3.4 -2.1 1.0 -3.0 -3.0 -2.8 -5.8 0.0 -5.8 -Natural Gas
FRS Companies 5.6 0.1 -0.5 7.0 8.8 1.9 8.3 1.0 4.2 4.0Total United States 3.4 1.9 1.1 1.8 6.2 3.3 12.6 2.9 11.4 4.9
Difference (FRS - Total) 2.2 -1.8 -1.7 5.2 2.7 -1.4 -4.3 -1.9 -7.2 -
Table 6. Growth Rates of U.S. Oil and Natural Gas Reserves for FRS Companies and Total United States, 2001 - 2009
Note: Differences calculated from unrounded data.
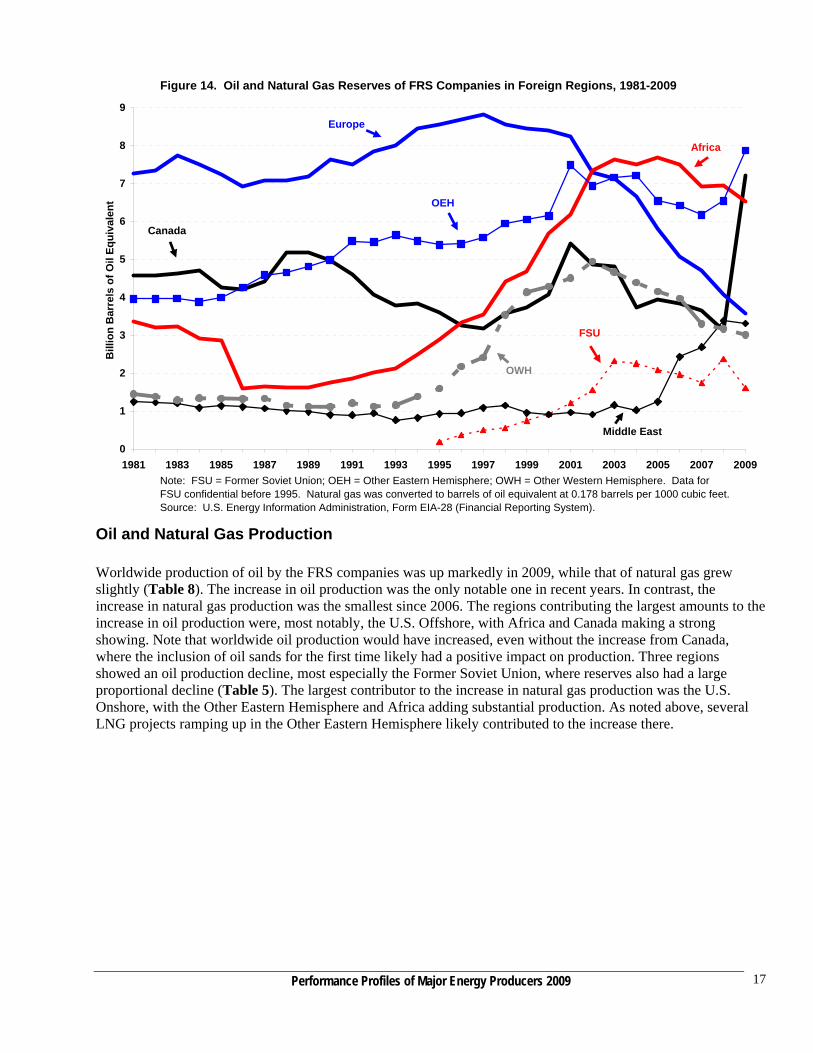
Sources: Energy Information Administration, Form EIA-28 (Financial Reporting System), and Energy Information Administration, U.S. Crude Oil, Natural Gas, and Natural Gas Liquids Proved Reserves, 2009, ( November 30, 2010), http://www.eia.gov/oil_gas/natural_gas/data_publications/crude_oil_natural_gas_reserves/cr.html. The reserves of oil and natural gas combined11 held by the FRS companies showed sharp increases in a couple of foreign regions in 2009 (Figure 14). Most outstandingly, Canadian reserves, which had been declining since 2001, achieved a remarkable gain of 131 percent, largely from the SEC accounting rule change that allowed oil sands to be included in proved reserves for the first time in 2009. Similarly, although much less dramatically, in the Other Eastern Hemisphere, where reserves had also been declining since 2001, oil and natural gas reserves increased 20 percent in 2009 (after a 6 percent increase in 2008). Reserves in the Middle East experienced a minor decline in 2009, after successive, strong increases since 2005.
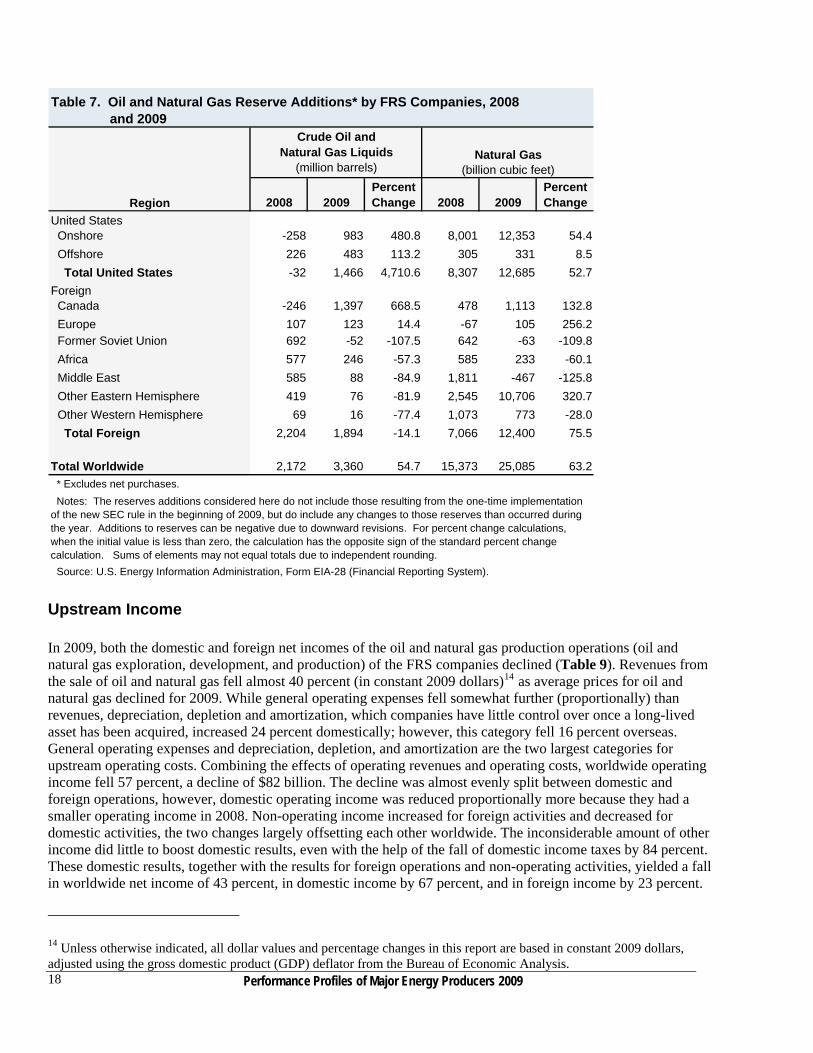
Oil and Natural Gas Reserve Additions Reserve additions (excluding purchases of reserves) are the quantities of proved reserves added each year as extensions and discoveries of reserves, improved recovery methods used to extract reserves, or revisions to previous estimates of reserves.12 Unless a company purchases its reserves, reserve additions are necessary for an upstream company to continue operating, since production reduces its inventory of oil and gas. By their nature reserve additions are often added in large blocks, such as when a new discovery is made or when a new technology makes certain reserves economic to produce. Worldwide reserve additions by the FRS companies for oil and for natural gas increased in 2009, with both growing more than 50 percent (Table 7).13 Additions were most notable in the U.S. Onshore and Canada for oil and the U.S. Onshore and the Other Eastern Hemisphere for natural gas. Declines were strongest in oil reserves in the Former Soviet Union and in natural gas reserves in the Middle East. The increase for oil in the U.S. Onshore and in Canada resulted from large positive revisions in the amount of reserves added. For natural gas in the U.S. Onshore and the Other Eastern Hemisphere, extensions and discoveries contributed the most to the increase, while the declines in the Former Soviet Union and the Middle East were caused by large negative revisions.
11 Natural gas was converted to equivalent barrels of oil at 0.178 barrels per thousand cubic feet. 12 For more detailed definitions, see the “Brief Description of Financial Terms” or the glossary at http://www.eia. gov/emeu/perfpro/glossary.html.
Performance Profiles of Major Energy Producers 2009 16
13 The reserves additions considered here do not include those resulting from the one-time implementation of the new SEC rule in the beginning of 2009, but do include any changes to those reserves than occurred during the year.
0
1
2
3
4
5
6
7
8
9
1981 1983 1985 1987 1989 1991 1993 1995 1997 1999 2001 2003 2005 2007 2009
Bill
ion
Bar
rels
of
Oil
Eq
uiv
alen
t
Note: FSU = Former Soviet Union; OEH = Other Eastern Hemisphere; OWH = Other Western Hemisphere. Data for FSU confidential before 1995. Natural gas was converted to barrels of oil equivalent at 0.178 barrels per 1000 cubic feet.Source: U.S. Energy Information Administration, Form EIA-28 (Financial Reporting System).
Figure 14. Oil and Natural Gas Reserves of FRS Companies in Foreign Regions, 1981-2009
Canada
OEH
OWH
Middle East
Europe
FSU
Africa
Oil and Natural Gas Production Worldwide production of oil by the FRS companies was up markedly in 2009, while that of natural gas grew slightly (Table 8). The increase in oil production was the only notable one in recent years. In contrast, the increase in natural gas production was the smallest since 2006. The regions contributing the largest amounts to the increase in oil production were, most notably, the U.S. Offshore, with Africa and Canada making a strong showing. Note that worldwide oil production would have increased, even without the increase from Canada, where the inclusion of oil sands for the first time likely had a positive impact on production. Three regions showed an oil production decline, most especially the Former Soviet Union, where reserves also had a large proportional decline (Table 5). The largest contributor to the increase in natural gas production was the U.S. Onshore, with the Other Eastern Hemisphere and Africa adding substantial production. As noted above, several LNG projects ramping up in the Other Eastern Hemisphere likely contributed to the increase there.
Performance Profiles of Major Energy Producers 2009
17
2008 2009Percent Change 2008 2009
Percent Change
United States Onshore -258 983 480.8 8,001 12,353 54.4
Offshore 226 483 113.2 305 331 8.5
Total United States -32 1,466 4,710.6 8,307 12,685 52.7
Foreign Canada -246 1,397 668.5 478 1,113 132.8
Europe 107 123 14.4 -67 105 256.2 Former Soviet Union 692 -52 -107.5 642 -63 -109.8
Africa 577 246 -57.3 585 233 -60.1
Middle East 585 88 -84.9 1,811 -467 -125.8
Other Eastern Hemisphere 419 76 -81.9 2,545 10,706 320.7
Other Western Hemisphere 69 16 -77.4 1,073 773 -28.0
Total Foreign 2,204 1,894 -14.1 7,066 12,400 75.5
Total Worldwide 2,172 3,360 54.7 15,373 25,085 63.2
Notes: The reserves additions considered here do not include those resulting from the one-time implementation of the new SEC rule in the beginning of 2009, but do include any changes to those reserves than occurred during the year. Additions to reserves can be negative due to downward revisions. For percent change calculations, when the initial value is less than zero, the calculation has the opposite sign of the standard percent change calculation. Sums of elements may not equal totals due to independent rounding.
Source: U.S. Energy Information Administration, Form EIA-28 (Financial Reporting System).
Table 7. Oil and Natural Gas Reserve Additions* by FRS Companies, 2008 and 2009
Region
Crude Oil andNatural Gas Liquids
(million barrels)Natural Gas
(billion cubic feet)
* Excludes net purchases.
Upstream Income In 2009, both the domestic and foreign net incomes of the oil and natural gas production operations (oil and natural gas exploration, development, and production) of the FRS companies declined (Table 9). Revenues from the sale of oil and natural gas fell almost 40 percent (in constant 2009 dollars)14 as average prices for oil and natural gas declined for 2009. While general operating expenses fell somewhat further (proportionally) than revenues, depreciation, depletion and amortization, which companies have little control over once a long-lived asset has been acquired, increased 24 percent domestically; however, this category fell 16 percent overseas. General operating expenses and depreciation, depletion, and amortization are the two largest categories for upstream operating costs. Combining the effects of operating revenues and operating costs, worldwide operating income fell 57 percent, a decline of $82 billion. The decline was almost evenly split between domestic and foreign operations, however, domestic operating income was reduced proportionally more because they had a smaller operating income in 2008. Non-operating income increased for foreign activities and decreased for domestic activities, the two changes largely offsetting each other worldwide. The inconsiderable amount of other income did little to boost domestic results, even with the help of the fall of domestic income taxes by 84 percent. These domestic results, together with the results for foreign operations and non-operating activities, yielded a fall in worldwide net income of 43 percent, in domestic income by 67 percent, and in foreign income by 23 percent.
Performance Profiles of Major Energy Producers 2009 18
14 Unless otherwise indicated, all dollar values and percentage changes in this report are based in constant 2009 dollars, adjusted using the gross domestic product (GDP) deflator from the Bureau of Economic Analysis.

2008 2009Percent Change 2008 2009
Percent Change
United States Onshore 715 717 0.3 7,677 7,950 3.6
Offshore 298 412 38.0 1,062 1,097 3.3
Total United States 1,014 1,129 11.4 8,739 9,047 3.5
Foreign Canada 153 192 25.5 1,140 1,162 1.9
Europe 383 373 -2.7 1,650 1,442 -12.6 Former Soviet Union 92 60 -34.3 85 83 -2.4
Africa 547 594 8.5 562 660 17.5
Middle East 150 150 -0.1 357 378 5.7
Other Eastern Hemisphere 227 240 5.9 1,990 2,103 5.7
Other Western Hemisphere 67 66 -1.1 1,296 1,218 -6.0
Total Foreign 1,619 1,675 3.5 7,080 7,045 -0.5
Total Worldwide 2,633 2,803 6.5 15,818 16,092 1.7
Source: U.S. Energy Information Administration, Form EIA-28 (Financial Reporting System).
Table 8. Oil and Natural Gas Production by FRS Companies, 2008 and 2009
Note: Sums of elements may not add to totals due to independent rounding.
Region
Crude Oil andNatural Gas Liquids
(million barrels)Natural Gas
(billion cubic feet)
However, it must be remembered that the results of 2008 were in part the result of some of the highest prices for crude oil and natural gas since World War II, so 2008 net income was particularly high.
Lifting Costs Lifting costs (also called production costs) are the costs to operate and maintain wells and related equipment and facilities per barrel of oil equivalent (boe) of oil and gas produced by those facilities after the hydrocarbons have been found, acquired, and developed for production.15 Direct lifting costs are total production spending minus production taxes (and also minus royalties in foreign regions) divided by oil and natural gas production in boe. Total lifting costs are the sum of direct lifting costs and production taxes. Reversing an almost decade-long upward trend, worldwide total lifting costs for the FRS companies fell $2.66 per boe, to $10.04 per boe, in 2009 (Table 10). Total lifting costs also fell in each of the FRS regions, except Canada, where they rose $2.49 dollars, probably reflecting the inclusion of oil sands there in 2009.16 The FRS regions with the largest decline in total lifting costs, the U.S. Onshore, the U.S. Offshore, the Middle East, and the Other Eastern Hemisphere, sustained declines of $4.55, $3.83, $2.91, and $2.61 dollars, respectively. Production taxes were the major contributor to the decline in total lifting costs. Worldwide they declined $2.30 per boe in 2009, which is 86 percent of the decline in total lifting costs (Table 9). Production taxes typically rise and fall with changes in the prices of oil and natural gas, both of which fell in 2009. All FRS regions except
15 Because oil and gas are often produced together, it is not usually feasible to separate their costs, so lifting cost calculations are based on oil and natural gas production combined.
Performance Profiles of Major Energy Producers 2009
19
16 Oil sands often have high lifting because of the considerable amount of processing that must be done to them before the leave the production area.

(Billion 2009 Dollars)
2008 2009 2008 2009 2008 2009
Oil Sales NA 156.3 87.6 59.2 NA 97.0 Natural Gas Sales NA 58.4 67.4 30.9 NA 27.5Total Oil and Natural Gas Sales 361.7 214.6 155.0 90.1 206.6 124.5 Other Revenues 6.5 13.1 5.1 12.6 1.3 0.5Total Revenues 368.1 227.7 160.2 102.7 208.0 125.0
Expenses General Operating Expenses 143.0 79.4 64.3 35.5 78.6 43.9 Depreciation, Depletion, and Amortization 76.6 81.1 42.8 52.8 33.9 28.3 General and Administrative Expenses 4.4 4.8 3.0 3.4 1.4 1.4Total Operating Expenses 224.0 165.3 110.1 91.7 113.9 73.6Operating Income 144.1 62.3 50.1 11.0 94.1 51.3
Other Income (Expense)a 13.9 13.7 6.5 3.4 7.5 10.3Pre-tax Income 158.0 76.1 56.5 14.4 101.5 61.6Income Tax Expense 86.3 34.5 23.9 3.8 62.4 30.7Net Income 72.7 41.6 32.6 10.6 40.1 31.0Special Items 46.1 14.6 19.8 13.9 26.3 0.7Net Income, Excluding Special Itemsb 118.8 56.2 52.4 24.5 66.5 31.7Percentage
Effective Income Tax Ratec 54.6 45.3 42.3 26.3 61.5 49.8
bSpecial Items are items that are similar to, but do not necessarily qualify as, extraordinary or unusual items under U.S. generally accepted accounting principles.
WorldwideIncome Components and Financial Ratios
Source: U.S. Energy Information Administration, Form EIA-28 (Financial Reporting System).
Table 9. Income Components and Financial Ratios in Oil and Natural Gas Production for FRS Companies, 2008 and 2009
Note: Sum of elements may not equal total due to independent rounding.
NA = Not available.
cIncome tax expense divided by pretax income.
aEarnings of unconsolidated affiliates, gain (loss) on disposition of assets, discontinued operations, extraordinary items, and cummulative effect of accounting change.
ForeignUnited States
Canada, where the increase was small, had declines in production taxes in 2009, with the largest declines in the Middle East the United States, and the Other Eastern Hemisphere. Canada and the Former Soviet Union were the lowest production tax regions in 2009, as they were in 2008. Direct lifting costs for the United States took a dramatic downward turn in 2009, falling at the fastest rate (-14 percent) since reaching their nadir in 2000 (Figure 15). This plunge follows 8 years of essentially uninterrupted growth. Direct lifting costs in combined foreign regions extended their climb that also began in 2000. But their climb has been more deliberate than the growth in domestic lifting costs. Domestic direct lifting costs still exceed foreign costs by $0.47 per boe, even with the domestic decline in 2009.
Finding Costs Finding costs are the average costs of adding proved reserves of oil and natural gas via exploration and development activities and the purchase of properties that might contain reserves. These costs are measured for oil and natural gas on a combined basis in dollars per boe. Ideally, finding costs would include all costs incurred (no matter when these costs were incurred or recognized on a company’s books) in finding any particular proved reserves (not including the purchases of already discovered reserves). In practice, and as reported here, finding
Performance Profiles of Major Energy Producers 2009 20

2008 2009Percent Change 2008 2009
Percent Change 2008 2009
Percent Change
United States Onshore NA NA NA NA NA NA 15.24 10.69 -2
Offshore NA NA NA NA NA NA 12.66 8.83 -30.2
Total United States 9.85 8.50 -13.7 4.90 1.78 -63.7 14.75 10.28 -30.3
Foreign Canada 11.90 14.38 20.8 0.43 0.44 2.5 12.33 14.82 20.2
Europe 8.69 8.96 3.1 3.02 1.79 -40.6 11.70 10.75 -8.1
Former Soviet Union 6.84 7.95 16.2 2.18 0.64 -70.8 9.03 8.59 -4.9
Africa 7.27 7.31 0.5 4.12 2.62 -36.4 11.39 9.93 -12.9
Middle East 5.53 5.75 4.0 6.31 3.17 -49.7 11.83 8.92 -24.6
Other Eastern Hemisphere 6.21 6.31 1.6 4.27 1.56 -63.4 10.48 7.87 -24.9
Other Western Hemisphere 4.32 4.36 1.1 2.49 1.32 -46.7 6.80 5.69 -16.4
Total Foreign 7.51 8.03 6.9 3.36 1.79 -46.7 10.87 9.82 -9.7
Worldwide Total 8.62 8.26 -4.2 4.08 1.78 -56.3 12.70 10.04 -20.9
Source: U.S. Energy Information Administration, Form EIA-28, (Financial Reporting System).
Table 10. Lifting Costs for FRS Companies, 2008 and 2009
NA = Data not available.
Notes: Natural gas was converted to equivalent barrels of oil at 0.178 barrels per thousand cubic feet. Sum of elements may not add to total due to independent rounding.
Region
Direct Lifting Costs Production Taxes Total
(2009 Dollars Per Barrel of Oil Equivalent)
9.9
3
4
5
6
7
8
9
10
1981
1983
1985
1987
1989
1991
1993
1995
1997
1999
2001
2003
2005
2007
2009
2009
Do
llars
per
Bar
rel o
f O
il E
qu
ival
ent
Notes: Direct lifting costs are the costs of extracting oil and gas, excluding production taxes.Source: U.S. Energy Information Administration, Form EIA-28 (Financial Reporting System).
Figure 15. Direct Oil and Natural Gas Lifting Costs for FRS Companies, 1981-2009
0
Domestic
Foreign
Performance Profiles of Major Energy Producers 2009
21

Performance Profiles of Major Energy Producers 2009 22
e
costs are actually measured as the ratio of exploration and development expenditures (including expenditures on unproved acreage but excluding expenditures on proved acreage) to proved reserve additions (excluding net purchases of proved reserves) over a specified period of time.17 Finding costs are generally calculated in Performance Profiles as a weighted average over a period of 3 years. Average worldwide finding costs for the FRS companies decreased $5.79 per boe of reserves added in the 2007-2009 period compared to the 2006-2008 period (Table 11). Finding costs declined in all FRS regions except the Former Soviet Union, Africa, and the Middle East. Europe, which had the highest finding costs of all of the foreign FRS regions in 2006-2008, had a large fall in costs in 2007-2009, $19.66 per boe, but, nonetheless, became the highest cost of any of the regions, worldwide (Figure 16). That is because the former highest cost region, the U.S. Offshore, fell the most in 2007-2009, $23.02, and lost its position as the highest cost region. Canada displayed a large decline in part likely because of the inclusion of oil sands in 2009.18 Of the regions with increasing finding costs, the largest increase was in the Former Soviet Union, with a modest increase of $3.38. For the U.S. Onshore, U.S. Offshore, and Foreign regions, finding costs fell the most in the U.S. Offshore in 2007-2009, bringing its costs closer to the lower cost U.S. Onshore and Foreign regions (Figure 17). The U.S. Offshore has had the highest finding costs of these three regions since 2001-2003, and the fall in its finding costs was its largest since 1981-1983, when data are first available.19 U.S. Onshore and Foreign finding costs also fell in 2007-2009, but not as steeply as the U.S. Offshore. All three regions experienced climbing finding costs in thmid-2000s, with those of the U.S. Offshore skyrocketing. The increases for the U.S. Offshore were reversed in the 2005-2007 period, with the region falling an amount that was at the time the largest of any decline of the three regions since 1981-1983.
Upstream Costs Total upstream costs are the sum of finding costs and lifting costs.20 Because, in the last several years, finding costs usually have been much larger than lifting costs, the calculations of upstream costs have been dominated by finding costs. Upstream costs in the aggregate fell more than $5 per boe for the FRS companies for the years 2007-2009 (Table 12). The Former Soviet Union and Africa were the only regions that had increased upstream costs, at $4.26 per boe and $3.07 per boe, respectively, while the U.S. Offshore, Europe, and Canada had conspicuous declines.
17 One inherent limitation of measuring finding costs this way is that the expenditures and the reserve additions recognized in a particular interval do not usually correspond exactly with each other. Expenditures are usually recognized in the period in which the payment actually occurred. Proved reserves are usually recognized when there is reasonable certainty that they can be produced economically. There is no reason that these must occur in the same time period (oil and gas wells are often operated over a long time period), so that some expenditures may not be recognized in the same time period in which their corresponding reserves are recognized. One way to moderate this limitation is to increase the length of the time period over which finding costs are measured, allowing reserve additions and exploration and development expenditures to match more closely. However, the longer the time period over which finding costs are measured, the more out of date they become, because they include increasingly older expenditures and reserves, and costs and technology are constantly changing. The only way to solve the correspondence problem would be to calculate an average finding cost for all oil and gas produced by a well after it is permanently shut in. But then many costs included would be far out of date. 18 Oil sands often have low finding costs in part because they are relative close to the surface and in known locations. 19 The steep fall in finding costs in 1986-1988 is excluded from this discussion because it is based on a change in reserve accounting practices, not reserves found and dollars spent to find them. Before then, natural gas reserves in the Alaska onshore were included in proved reserves, even though there was no way to get them to market. During the 1986-1988 period, these natural gas reserves were removed from the books of the companies operating in northern Alaska. 20 Lifting costs are averaged over 3 years to make them comparable with 3-year finding costs.

Region2006-2008
2007-2009
Percent Change
United States Onshore 24.61 18.65 -24.2 Offshore 64.53 41.51 -35.7 Total United States 29.45 21.58 -26.7Foreign Canada 28.08 12.07 -57.0 Europe 61.98 42.32 -31.7 Former Soviet Union 10.55 13.92 32.0 Africa 32.82 35.01 6.7 Middle East 5.17 6.99 35.1 Other Eastern Hemisphere 12.57 7.64 -39.2 Other Western Hemisphere 27.60 20.43 -26.0 Total Foreign 18.93 15.13 -20.1
Worldwide 24.10 18.31 -24.0
Table 11. Finding Costs for FRS Companies, 2006-2008 and 2007-2009
Notes: The above figures are 3-year weighted averages of exploration and development expenditures, excluding expenditures for proven acreage, divided by reserve additions, excluding net purchases of reserves. Natural gas was converted to equivalent barrels of oil at 0.178 barrels per thousand cubic feet. Sum of elements may not add to total due to independent rounding. Source: U.S. Energy Information Administration, Form EIA-28 (Financial Reporting System).
NM = Not meaningful.
(2009 Dollars per Barrel of Oil Equivalent)
0
20
40
60
80
1989-1991 1992-1994 1995-1997 1998-2000 2001-2003 2004-2006 2007-2009
2009
Do
llars
per
Bar
rel o
f O
il E
qu
ival
ent
Notes: Costs are the quotient of costs and reserve additions for each 3-year period. BOE = Barrels of oil equivalent. Source: U.S. Energy Information Administration, Form EIA-28 (Financial Reporting System).
Figure 16. Finding Costs for FRS Companies for Selected Regions, 1989-1991 to 2007-2009
U.S. Offshore
Africa
Europe
Performance Profiles of Major Energy Producers 2009
23
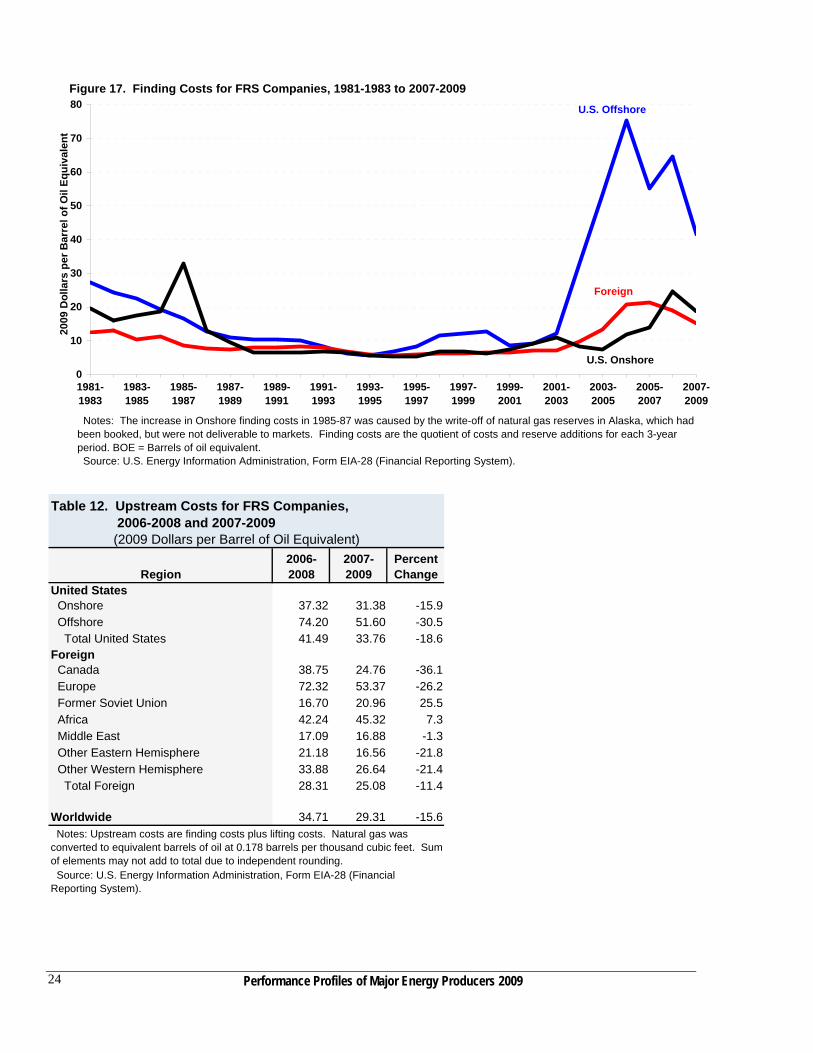
0
10
20
30
40
50
60
70
80
1981-1983
1983-1985
1985-1987
1987-1989
1989-1991
1991-1993
1993-1995
1995-1997
1997-1999
1999-2001
2001-2003
2003-2005
2005-2007
2007-2009
2009
Do
llars
per
Bar
rel o
f O
il E
qu
ival
ent
Notes: The increase in Onshore finding costs in 1985-87 was caused by the write-off of natural gas reserves in Alaska, which had been booked, but were not deliverable to markets. Finding costs are the quotient of costs and reserve additions for each 3-year period. BOE = Barrels of oil equivalent. Source: U.S. Energy Information Administration, Form EIA-28 (Financial Reporting System).
Figure 17. Finding Costs for FRS Companies, 1981-1983 to 2007-2009
U.S. Offshore
U.S. Onshore
Foreign
Region2006-2008
2007-2009
Percent Change
United States Onshore 37.32 31.38 -15.9 Offshore 74.20 51.60 -30.5 Total United States 41.49 33.76 -18.6Foreign Canada 38.75 24.76 -36.1 Europe 72.32 53.37 -26.2 Former Soviet Union 16.70 20.96 25.5 Africa 42.24 45.32 7.3 Middle East 17.09 16.88 -1.3 Other Eastern Hemisphere 21.18 16.56 -21.8 Other Western Hemisphere 33.88 26.64 -21.4 Total Foreign 28.31 25.08 -11.4
Worldwide 34.71 29.31 -15.6
Table 12. Upstream Costs for FRS Companies, 2006-2008 and 2007-2009
Notes: Upstream costs are finding costs plus lifting costs. Natural gas was converted to equivalent barrels of oil at 0.178 barrels per thousand cubic feet. Sum of elements may not add to total due to independent rounding. Source: U.S. Energy Information Administration, Form EIA-28 (Financial Reporting System).
(2009 Dollars per Barrel of Oil Equivalent)
Performance Profiles of Major Energy Producers 2009 24

Refining and Marketing
U.S. Refining/Marketing The average profitability (contribution to net income divided by net investment in place or return on investment (ROI)) of U.S. refining/marketing operations of the respondents to the Financial Reporting System (FRS) survey was negative 7 percent in 2009 (Figure 18), the lowest in the 33-year history of the FRS. Further, because the loss of 2009 almost immediately followed an unusually profitable 5-year period (2004 through 2008) that included the 4 highest returns in the history of the FRS, the perception of the loss may be magnified.
Performance Profiles of Major Energy Producers 2009
25
ed to
Changes in the profitability of the FRS companies generally happen for two reasons: differences in the rate of change of FRS21 product prices relative to the rate of change of the crude oil price; and changes in operating costs. Reductions in operating costs due to successful cost-cutting efforts during the 1990s and early 2000s lincreased profitability during that period (see Figure 6 in the “Financial Developments” section). Subsequently, product prices grew faster than crude oil prices during 2004-2008,22 leading to a period of unusually high profitability. Relative to 2008, 2009 product prices fell by more than did crude oil prices, resulting in lower profitability. Concurrent reductions in operating costs (Table 13) were insufficient to prevent the largest loss in the history of the FRS.23
-10
-5
0
5
10
15
20
25
30
1977 1979 1981 1983 1985 1987 1989 1991 1993 1995 1997 1999 2001 2003 2005 2007 2009
Per
cen
t
a: International Marine has been combined with Foreign Refining/Marketing for the years 2003-2009 to avoid disclosure of company-level data. Source: U.S. Energy Information Administration, Form EIA-28 (Financial Reporting System).
Figure 18. Return on Investment in U.S. and Foreign Refining/Marketing,a and All Other Lines of Business for FRS Companies, 1977-2009
U.S. Refining/Marketing
All Other Lines of Business
ForeignRefining/Marketing
21 Unless stated otherwise, all references to things such as prices and volumes are those reported by the FRS companies. 22 The weighted-average profitability over 2003-2008 was 16 percent, and the weighted-average profitability of the 1990-2002 period was 5 percent. 23 Although low earnings often occur over the history of the FRS, losses are unusual, occurring only in 1992, 2002, and 2009.

2008 2009
Percent Change
2008-2009
Refined Product Sales (Million Barrels per Day)a 20.4 20.6 1.0
Gasoline Average Price 110.05 74.46 -32.3Distillate Average Price 126.39 70.96 -43.9Other Products Average Price 80.87 51.09 -36.8
All Refined Products Average Price 110.20 69.41 -37.0Less: Raw Materials Costs and Product Purchases 98.97 62.46 -36.9
Equals: Gross Refining Margin 11.23 6.95 -38.1Less: Operating Costs 9.73 7.31 -24.9
Equals: Net Refining Marginb 1.49 -0.36 n.a.
Reseller/wholesaler spread (dealer price - wholesale price) 4.99 2.32 -53.5Retailer spread (company-operated price - dealer price) 8.74 7.69 -12.0
n.a.: not applicable
Table 13. Sales, Prices, Costs, and Margins in U.S. Refining/Marketing for FRS Companies, 2008-2009
(2009 dollars per barrel)
Source: U.S. Energy Information Administration, Form EIA-28 (Financial Reporting System).
aRefined product sales include sales for resale to other FRS companies and sales of imported products.
bThe components to calculate the refined product margin may be retrieved from the EIA website at http://tonto.eia.doe.gov/cfapps/frs/frstables.cfm?tableNumber=28. Note that the table may be customized by changing the years selected.
The net refined product margin (net margin) strongly correlates with profitability.24 Examination of the components of the net margin usually illuminates the underlying reasons for changes in the profitability of U.S. refining/marketing operations. The net margin is the gross margin25 minus operating costs per barrel of refined product sold. The negative $0.36-per-barrel net margin of 2009 was the lowest (in terms of 2009 dollars) 26 in the 33-year history of the FRS (see Figure 6, above) and the only time that a negative net margin occurred. The average gross refining margin reported by the FRS companies in 2009 fell 38 percent compared with 2008 (Table 13). The average price received for petroleum products in 2009 decreased almost $41 per barrel relative to the 2008 value, while raw materials and purchased product costs fell almost than $37 per barrel to $62.46. These changes resulted in a $4.27-per-barrel decrease in the gross refining margin to $6.95. Further, the gross margin of 2009 was almost the lowest in the history of the FRS, exceeding only 1999’s $6.91 gross margin.
24 The net margin highly correlates with return on investment. The latest estimation of the relationship between refining margins and profitability is that the correlation coefficient is 0.94. Regressing the change in the U.S. refining/marketing return on investment (ROI) on the change in the net refining margin (2009 dollars) yielded the following estimated equation: diff ROI = -0.124 (0.411) + (diff net margin * 4.803 (0.324)), where the standard error of each estimated coefficient is listed in parentheses. The adjusted R-squared is 0.875. The F-statistic for the regression equation is 218.53, which is significant at a 99-percent level of confidence. The data used to estimate the relationship are for the years 1977 through 2009. Statistical testing indicates that a structural change may have occurred in 1998 when the FRS selection criteria changed and that the 2004 data may be an outlier, but incorporating adjustments to account for these does not materially affect the estimation results. 25 For more detailed definitions, see the Brief Description of Financial Terms section.
Performance Profiles of Major Energy Producers 2009 26
26 Unless otherwise indicated, all dollar values and percentage changes in this report are in constant 2009 dollars, adjusted using the Gross Domestic Product implicit price deflator.

Revenues and Costs Industry-wide U.S. crude oil stock levels were higher in 2009, especially early in the year, than both 2008 and the average for 2003-2007 (Figure 19). This put downward pressure on industry-wide crude oil prices. During most of 2009 industry-wide crude oil prices were lower than in 2008 and resulted in a 37-percent lower average price.27 These changes contributed to the 36-percent decrease in FRS raw material and purchased product costs for 2009 relative to 2008 (Table 13).28
250
270
290
310
330
350
370
First Quarter Second Quarter Third Quarter Fourth Quarter
Mill
ion
Bar
rels
0
2003-2007 Average
2008
2009
Figure 19. Quarterly Average U.S. Crude Oil Stocks, 2003-2007 Average, 2008, and 2009
Source: U.S. Energy Information Administration, Petroleum Supply Monthly , DOE/EIA-0109 (Various issues, Washington, DC), Table 51.
Petroleum product prices tend to move with crude oil prices, both of which fell in 2009 (compared with 2008). Additionally, industry-wide stocks of petroleum products were higher in 2009 than in 2008 (and the average over 2003-2007) throughout the year (Figure 20). Although relatively high petroleum product stocks levels put downward pressure on product prices in general, total motor gasoline29 stock levels were essentially unchanged in 2009 relative to 2008 (or the average over 2003-2007) (Figure 21) and exerted little pressure on motor gasoline prices.
27 Calculated for composite refiner acquisition cost of crude oil, see U.S. Energy Information Administration, Petroleum Marketing Monthly (October 2010), Table 1. 28 Crude oil stock levels are only one of many factors affecting the price of crude oil. See the Short-Term Energy Outlook for a broader discussion of crude oil prices (http://www.eia.gov/emeu/steo/pub/contents.html as of November 9, 2010).
Performance Profiles of Major Energy Producers 2009
27
29 Total motor gasoline stocks are stocks of both finished motor gasoline and motor gasoline blending components. This measure of motor gasoline, rather than only finished motor gasoline, is used because the substitution of ethanol for MTBE has changed the storage pattern of motor gasoline. Less finished motor gasoline and more unfinished motor gasoline is now stored nationwide. Ethanol is added to unfinished gasoline at the terminal, only then creating finished reformulated motor gasoline.

580
600
620
640
660
680
700
720
740
760
780
800
First Quarter Second Quarter Third Quarter Fourth Quarter
Mill
ion
Bar
rels
2003-2007 Average
2009
2008
0
Figure 20. Quarterly Average U.S. Commercial Petroleum Product Stocks, 2003-2007 Average, 2008, and 2009
Source: U.S. Energy Information Administration, Petroleum Supply Monthly , DOE/EIA-0109 (Various issues, Washington, DC), Table 51.
FRS petroleum product sales increased 1 percent in 2009 relative to 2008 (Table 13), largely because of the addition of Alon, Chalmette, and Western Refining30 to the FRS group, against an industry backdrop of a 4-percent decline in product sales.31 Product sales are composed chiefly of motor gasoline and distillate. Gasoline sales increased 4 percent while distillate sales decreased slightly more than 1 percent. Sales of all other petroleum products declined 2 percent in 2009 relative to 2008 (Table 14). Negligibly higher sales and much lower average petroleum product prices reduced domestic petroleum product sales revenues by $298 billion (Table 15). Meanwhile, operating costs fell by $284 billion, resulting in a decline in operating income of more than $18 billion (including the decline in other revenue). Comparing 2009 with 2008, the changes in revenues and costs resulted in an operating loss of more than $12 billion and a net loss (including special items) of more than $9 billion in 2009. Those operating expenses most closely associated with refining and marketing operations decreased by 25 percent on a per-barrel basis between 2008 and 2009 (Table 13), led by decreases in refining energy costs and other operating costs (Table 14).
30 Product sales for Chalmette are not publicly available, however Alon and Western Refining accounted for almost 0.35 million barrels of product sales. Thus, in the absence of only Alon and Western, FRS petroleum product sales would have declined by more than 0.14 million barrels, or 0.7 percent. See Alon USA Energy Inc., 2009 U.S. Securities and Exchange Commission Form 10-K, p. 57; and Western Refining Inc., 2009 U.S. Securities and Exchange Commission Form 10-K, p. 43.
Performance Profiles of Major Energy Producers 2009 28
31 U.S. Energy Information Administration, Monthly Energy Review (September 2010), Table 3.1.

80
90
100
110
120
130
140
150
160
First Quarter Second Quarter Third Quarter Fourth Quarter
Mill
ion
Bar
rels
0
2003-2007 Average
Source: U.S. Energy Information Administration, Petroleum Supply Monthly , DOE/EIA-0109 (Various issues, Washington, DC), Table 51.
Figure 21. Quarterly Average Total U.S. Motor Gasoline Stocks, 2003-2007 Average, 2008, and 2009
2008
2009
Energy costs decreased by $1.20 to $1.32 per barrel,32 their lowest level since 2002 and one of the lowest levels ever reported in the history of the FRS.33 Average wellhead natural gas prices fell $4.46, from $8.18 in 2008 to $3.72 per thousand cubic feet34 in 2009, accounting for some of the decrease. Lower energy costs also could be attributed to factors such as lower utility costs,35 lower fuel costs,36and a full year of benefits from cost-reductions implemented during 2008.37 FRS companies continue to implement changes aimed at the containment of energy costs, but it appears that one of the major efforts over the last 10 years, U.S. cogeneration projects, have finally been completed.38
32 The per-barrel energy costs are computed by dividing U.S. refining energy costs by total product sales, and, thus, may not fully reflect changes in per-unit energy costs if there are unusual changes in the net sales/refinery output of the respondent companies. 33 The energy cost level of 2009 is the 6th lowest in the 33-year history of the FRS and was lower only in 1994 ($1.31/barrel), 2002 ($1.30/barrel), 1995 ($1.11/barrel), 1999 ($1.04/barrel), and 1998 ($0.94/barrel). 34 U.S. Energy Information Administration, Monthly Energy Review (September 2010), Table 9.11. 35 ConocoPhillips Corporation, 2009 U.S. Securities and Exchange Commission Form 10-K, p. 26 36 Chevron Corporation, 2009 U.S. Securities and Exchange Commission Form 10-K, p. FS-9. 37 For example, BP acquired a cogeneration facility from NiSource for its 405,000-barrels-per-day Whiting, Indiana refinery July 1, 2008 (BP plc, "BP Buys Whiting Clean Energy Power Plant in Indiana," press release (July 1, 2008) and 2008 U.S. Securities and Exchange Commission Form 20-F, p. 115).
Performance Profiles of Major Energy Producers 2009
29
38 This ends (or at least pauses) a recurring storyline that has characterized the FRS U.S. refining/marketing operations for 11 of the last 12 years, excepting only the year 2000. Only Exxon Mobil explicitly mentioned ongoing cogeneration projects, and both refineries were outside the United States (see Exxon Mobil Corporation, 2009 U.S. Securities and Exchange Commission Form 10-K, p. 48).

2008 2009
Percent Change
2008 - 2009
Gross Margin 11.23 6.95 -38.1- Marketing Costs 1.76 1.47 -16.6- Energy Costs 2.52 1.32 -47.6- Other Operating Costs 5.45 4.52 -17.1
= Net Margin 1.49 -0.36 n.a.
Product Sales Volumea
Motor Gasoline 10,300 10,664 3.5Distillate 6,526 6,436 -1.4Other Products 3,551 3,482 -1.9
Total 20,376 20,583 1.0
Table 14. U.S. Refined Product Margins and Costs per Barrel Sold and Product Sales Volume for FRS Companies, 2008-2009
(2009 dollars per barrel)
(Thousand Barrels per Day)
aRefined product sales include sales for resale to other FRS companies and sales of imported products. n.a.: not applicable Source: U.S. Energy Information Administration, Form EIA-28 (Financial Reporting System). Other operating costs related to refining decreased from $5.45 per barrel in 2008 to $4.52 per barrel in 2009 (Table 14). Operating costs associated with compliance with the Clean Air Act Amendments of 1990 were mixed in 2009 relative to 2008, increasing for some companies and falling for others.39 Additional reasons that other operating costs fell in 2009 include reduced negotiated prices for materials, labor, and services;40 reduced waste water-treatment costs due to recently introduced technology; 41 lower turnaround costs,42 and an absence of hurricane-related charges.43 Meanwhile, impairment write-downs were another major reason for higher costs.44
39 Although EIA has no estimate of the significance of the environmental spending in 2009 for other operating costs, some companies indicated that their operating expenses attributable to environmental cost were higher in 2009 than in 2008. For example, Sunoco reported environmental operating costs of $210 million in 2008 and of $217 million in 2009, and ConocoPhillips reported environmental expenses of $957 million in 2008 and $1,070 million in 2009 (see Sunoco Inc., 2009 U.S. Securities and Exchange Commission Form 10-K, p. 51; ConocoPhillips, 2009 U.S. Securities and Exchange Commission Form 10-K, p. 59; and ConocoPhillips Corporation, 2008 U.S. Securities and Exchange Commission Form 10-K, p. 65). Alternatively, Exxon Mobil indicated that its environmental operating costs decreased from $2,730 million in 2008 to $2,610 million in 2009 (see Exxon Mobil Corporation, 2009 U.S. Securities and Exchange Commission Form 10-K, p. 54). For additional discussion of this topic, also see an EIA study that examined the effects of environmental compliance on operating costs on EIA’s website at http://www.eia.gov/emeu/perfpro/ref_pi2/index.html. 40 Chevron Corporation, 2009 U.S. Securities and Exchange Commission Form 10-K, p. FS-9. 41 ConocoPhillips Corporation, 2009 U.S. Securities and Exchange Commission Form 10-K, p. 26. 42 Marathon Oil Corporation, “4Q 2009 Earnings Conference Call Remarks” (February 2, 2010). Available on the internet at http://www.marathon.com/Investor_Center/Speeches_and_Presentations/Speeches_and_Presentations/4Q2009_Earnings_Conference_Call_Remarks/ (as of October 11, 2010). 43 Chevron Corporation, 2009 U.S. Securities and Exchange Commission Form 10-K, p. FS-9.
Performance Profiles of Major Energy Producers 2009 30
44 For example, Valero Energy Corporation, 2009 U.S. Securities and Exchange Commission Form 10-K, p. 78.

2008 2009
Percent Change
2008-2009
Domestic Refining/Marketing Operations Refined Product Sales Revenue 819,586 521,497 -36.4
Other Revenueb 21,483 17,479 -18.6
Operating Expenseb, c 835,031 550,871 -34.0
Operating Incomec 6,038 -11,895 n.a. Net Income, excluding special Items 8,611 -12,468 n.a. Special Items -5,566 3,072 n.a. Net Income 3,045 -9,396 n.a.
Foreign Refining/Marketing Operationsa
Refined Product Sales Revenue 364,849 233,264 -36.1
Other Revenueb 15,527 10,966 -29.4
Operating Expenseb, c 365,331 240,431 -34.2
Operating Incomec 15,045 3,799 -74.7 Net Income, excluding special Items 11,393 2,557 -77.6 Special Items -231 19 n.a. Net Income 11,162 2,576 -76.9
Table 15. U.S. and Foreign Refining/Marketinga Financial Items for FRS Companies, 2008-2009 (2009 Million Dollars)
bRaw materials revenues are netted against total operating expense.
aIn order to prevent disclosure of company-level data the International Marine business segment has been combined with Foreign Refining/Marketing for this presentation. Relative to Foreign Refining/Marketing, International Marine is about one-tenth the size and has little material effect on the overall results of Foreign Refining/Marketing.
Source: U.S. Energy Information Administration, Form EIA-28 (Financial Reporting System).
cExcludes Special Items. n.a.: not applicable
Operational Changes The FRS companies refocused their marketing operations for the last several years, culminating in the lowest outlet total in the history of the FRS in 2009. Historically, this was accomplished by making selective investment in some outlets,45 acquiring some outlets,46 and divesting others,47 which also was true of 2009. However, the last
45 For example, BP continues to make investments to implement its “am pm” convenience store concept. BP plc, 2009 U.S. Securities and Exchange Commission Form 20-F, p. 37. 46 Hess “acquired 37 previously leased retail gasoline stations …” and Marathon acquired “89 new stores during … [the most recent] five-year period.” See, Hess Corporation, 2009 U.S. Securities and Exchange Commission Form 10-K, p. 52 and Marathon Oil Corporation, 2009 Annual Report, p. 11.
Performance Profiles of Major Energy Producers 2009
31
47 Chevron “sold its interest in about 465 individual service-station sites in various other countries, including the United States. The majority of these sites continue to market company-branded gasoline through new supply agreements …. The company plans to discontinue, by mid-2010, sales of Chevron- and Texaco-branded motor fuels in the mid-Atlantic and other eastern states, where the company sold to retail customers through approximately 1,100 stations and to commercial and industrial customers through supply arrangements. Sales in these markets represent approximately 8 percent of the company's total U.S. retail fuels sales volumes (see Chevron Corporation, 2009 U.S. Securities and Exchange Commission Form 10-K, p. 26).” Marathon sold or closed “155 non-core and underperforming stores (see Marathon Oil Corporation, 2009 Annual Report, p. 11).” Sunoco noted that it divested 261 outlets during the 2007-2009 period in order “to selectively reduce the Company’s invested capital in Company-owned or leased sites. Most of the sites were converted to contract dealers or
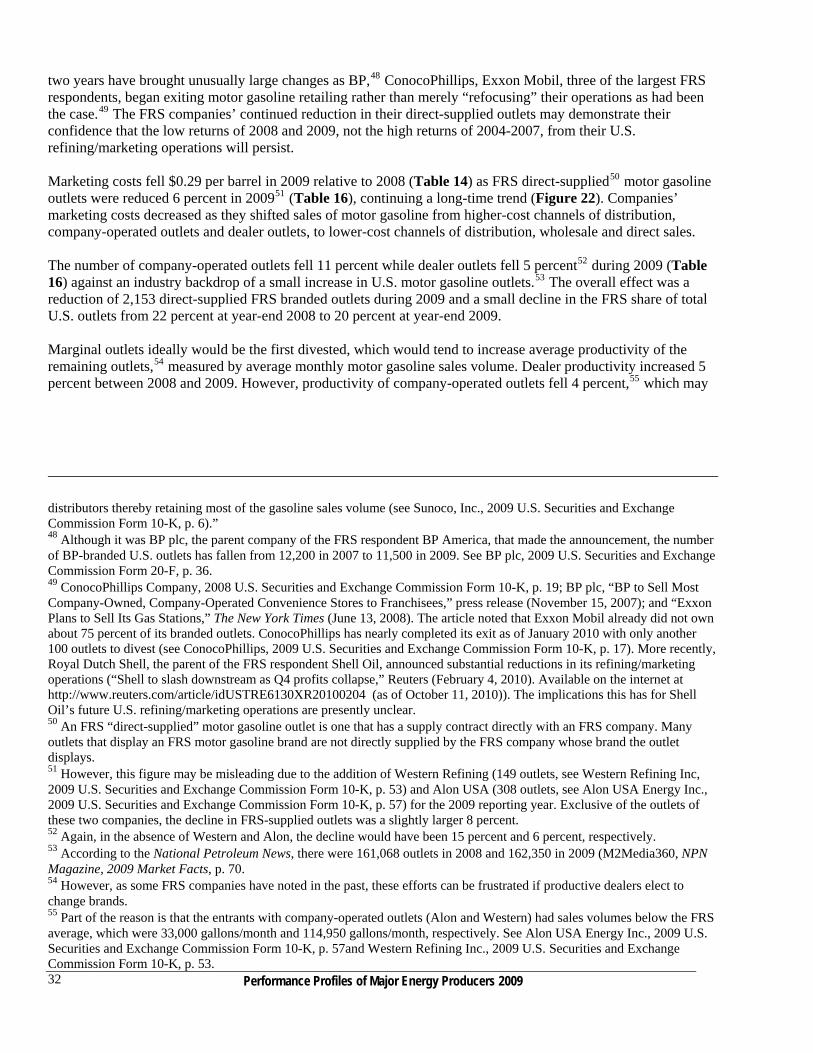
Performance Profiles of Major Energy Producers 2009 32
two years have brought unusually large changes as BP,48 ConocoPhillips, Exxon Mobil, three of the largest FRS respondents, began exiting motor gasoline retailing rather than merely “refocusing” their operations as had been the case.49 The FRS companies’ continued reduction in their direct-supplied outlets may demonstrate their confidence that the low returns of 2008 and 2009, not the high returns of 2004-2007, from their U.S. refining/marketing operations will persist. Marketing costs fell $0.29 per barrel in 2009 relative to 2008 (Table 14) as FRS direct-supplied50 motor gasoline outlets were reduced 6 percent in 200951 (Table 16), continuing a long-time trend (Figure 22). Companies’ marketing costs decreased as they shifted sales of motor gasoline from higher-cost channels of distribution, company-operated outlets and dealer outlets, to lower-cost channels of distribution, wholesale and direct sales. The number of company-operated outlets fell 11 percent while dealer outlets fell 5 percent52 during 2009 (Table 16) against an industry backdrop of a small increase in U.S. motor gasoline outlets.53 The overall effect was a reduction of 2,153 direct-supplied FRS branded outlets during 2009 and a small decline in the FRS share of total U.S. outlets from 22 percent at year-end 2008 to 20 percent at year-end 2009. Marginal outlets ideally would be the first divested, which would tend to increase average productivity of the remaining outlets,54 measured by average monthly motor gasoline sales volume. Dealer productivity increased 5 percent between 2008 and 2009. However, productivity of company-operated outlets fell 4 percent,55 which may
distributors thereby retaining most of the gasoline sales volume (see Sunoco, Inc., 2009 U.S. Securities and Exchange Commission Form 10-K, p. 6).” 48 Although it was BP plc, the parent company of the FRS respondent BP America, that made the announcement, the number of BP-branded U.S. outlets has fallen from 12,200 in 2007 to 11,500 in 2009. See BP plc, 2009 U.S. Securities and Exchange Commission Form 20-F, p. 36. 49 ConocoPhillips Company, 2008 U.S. Securities and Exchange Commission Form 10-K, p. 19; BP plc, “BP to Sell Most Company-Owned, Company-Operated Convenience Stores to Franchisees,” press release (November 15, 2007); and “Exxon Plans to Sell Its Gas Stations,” The New York Times (June 13, 2008). The article noted that Exxon Mobil already did not own about 75 percent of its branded outlets. ConocoPhillips has nearly completed its exit as of January 2010 with only another 100 outlets to divest (see ConocoPhillips, 2009 U.S. Securities and Exchange Commission Form 10-K, p. 17). More recently, Royal Dutch Shell, the parent of the FRS respondent Shell Oil, announced substantial reductions in its refining/marketing operations (“Shell to slash downstream as Q4 profits collapse,” Reuters (February 4, 2010). Available on the internet at http://www.reuters.com/article/idUSTRE6130XR20100204 (as of October 11, 2010)). The implications this has for Shell Oil’s future U.S. refining/marketing operations are presently unclear. 50 An FRS “direct-supplied” motor gasoline outlet is one that has a supply contract directly with an FRS company. Many outlets that display an FRS motor gasoline brand are not directly supplied by the FRS company whose brand the outlet displays. 51 However, this figure may be misleading due to the addition of Western Refining (149 outlets, see Western Refining Inc, 2009 U.S. Securities and Exchange Commission Form 10-K, p. 53) and Alon USA (308 outlets, see Alon USA Energy Inc., 2009 U.S. Securities and Exchange Commission Form 10-K, p. 57) for the 2009 reporting year. Exclusive of the outlets of these two companies, the decline in FRS-supplied outlets was a slightly larger 8 percent. 52 Again, in the absence of Western and Alon, the decline would have been 15 percent and 6 percent, respectively. 53 According to the National Petroleum News, there were 161,068 outlets in 2008 and 162,350 in 2009 (M2Media360, NPN Magazine, 2009 Market Facts, p. 70. 54 However, as some FRS companies have noted in the past, these efforts can be frustrated if productive dealers elect to change brands. 55 Part of the reason is that the entrants with company-operated outlets (Alon and Western) had sales volumes below the FRS average, which were 33,000 gallons/month and 114,950 gallons/month, respectively. See Alon USA Energy Inc., 2009 U.S. Securities and Exchange Commission Form 10-K, p. 57and Western Refining Inc., 2009 U.S. Securities and Exchange Commission Form 10-K, p. 53.
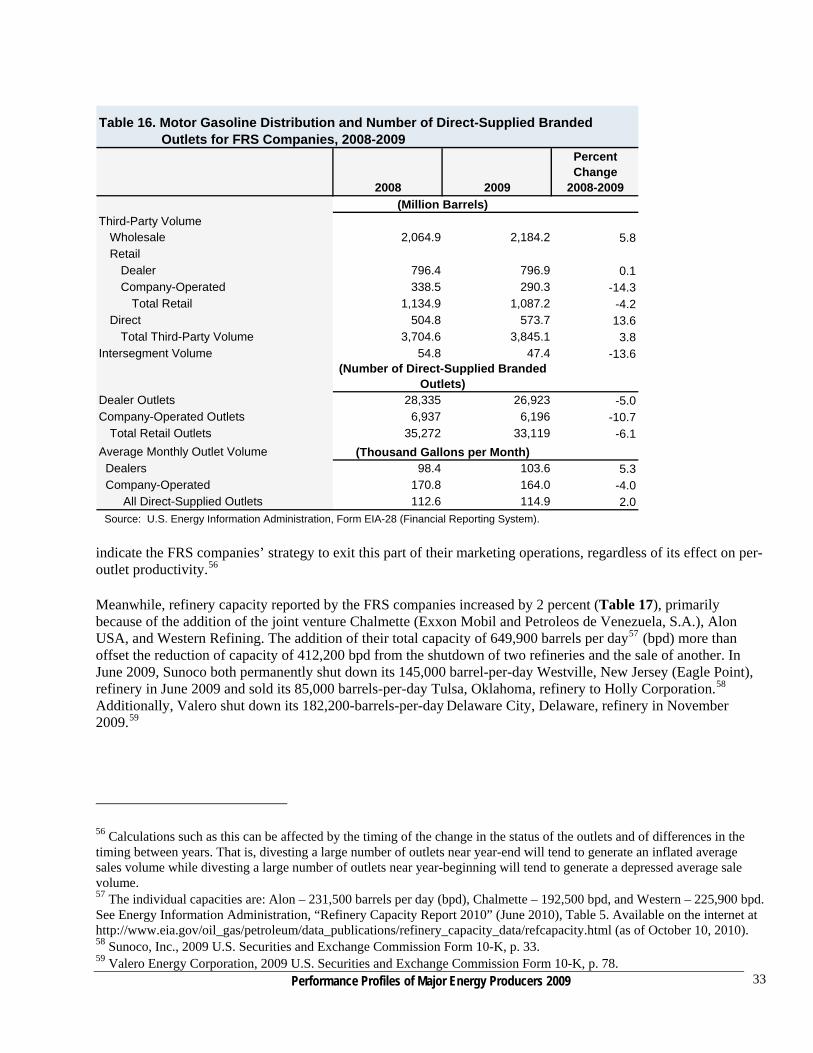
2008 2009
Percent Change
2008-2009
Third-Party VolumeWholesale 2,064.9 2,184.2 5.8Retail
Dealer 796.4 796.9 0.1Company-Operated 338.5 290.3 -14.3
Total Retail 1,134.9 1,087.2 -4.2Direct 504.8 573.7 13.6
Total Third-Party Volume 3,704.6 3,845.1 3.8Intersegment Volume 54.8 47.4 -13.6
Dealer Outlets 28,335 26,923 -5.0Company-Operated Outlets 6,937 6,196 -10.7
Total Retail Outlets 35,272 33,119 -6.1
Average Monthly Outlet Volume Dealers 98.4 103.6 5.3 Company-Operated 170.8 164.0 -4.0
All Direct-Supplied Outlets 112.6 114.9 2.0 Source: U.S. Energy Information Administration, Form EIA-28 (Financial Reporting System).
Table 16. Motor Gasoline Distribution and Number of Direct-Supplied Branded Outlets for FRS Companies, 2008-2009
(Million Barrels)
(Number of Direct-Supplied Branded Outlets)
(Thousand Gallons per Month)
indicate the FRS companies’ strategy to exit this part of their marketing operations, regardless of its effect on per-outlet productivity.56 Meanwhile, refinery capacity reported by the FRS companies increased by 2 percent (Table 17), primarily because of the addition of the joint venture Chalmette (Exxon Mobil and Petroleos de Venezuela, S.A.), Alon USA, and Western Refining. The addition of their total capacity of 649,900 barrels per day57 (bpd) more than offset the reduction of capacity of 412,200 bpd from the shutdown of two refineries and the sale of another. In June 2009, Sunoco both permanently shut down its 145,000 barrel-per-day Westville, New Jersey (Eagle Point), refinery in June 2009 and sold its 85,000 barrels-per-day Tulsa, Oklahoma, refinery to Holly Corporation.58 Additionally, Valero shut down its 182,200-barrels-per-day Delaware City, Delaware, refinery in November 2009.59
56 Calculations such as this can be affected by the timing of the change in the status of the outlets and of differences in the timing between years. That is, divesting a large number of outlets near year-end will tend to generate an inflated average sales volume while divesting a large number of outlets near year-beginning will tend to generate a depressed average sale volume. 57 The individual capacities are: Alon – 231,500 barrels per day (bpd), Chalmette – 192,500 bpd, and Western – 225,900 bpd. See Energy Information Administration, “Refinery Capacity Report 2010” (June 2010), Table 5. Available on the internet at http://www.eia.gov/oil_gas/petroleum/data_publications/refinery_capacity_data/refcapacity.html (as of October 10, 2010). 58 Sunoco, Inc., 2009 U.S. Securities and Exchange Commission Form 10-K, p. 33.
Performance Profiles of Major Energy Producers 2009
33
59 Valero Energy Corporation, 2009 U.S. Securities and Exchange Commission Form 10-K, p. 78.
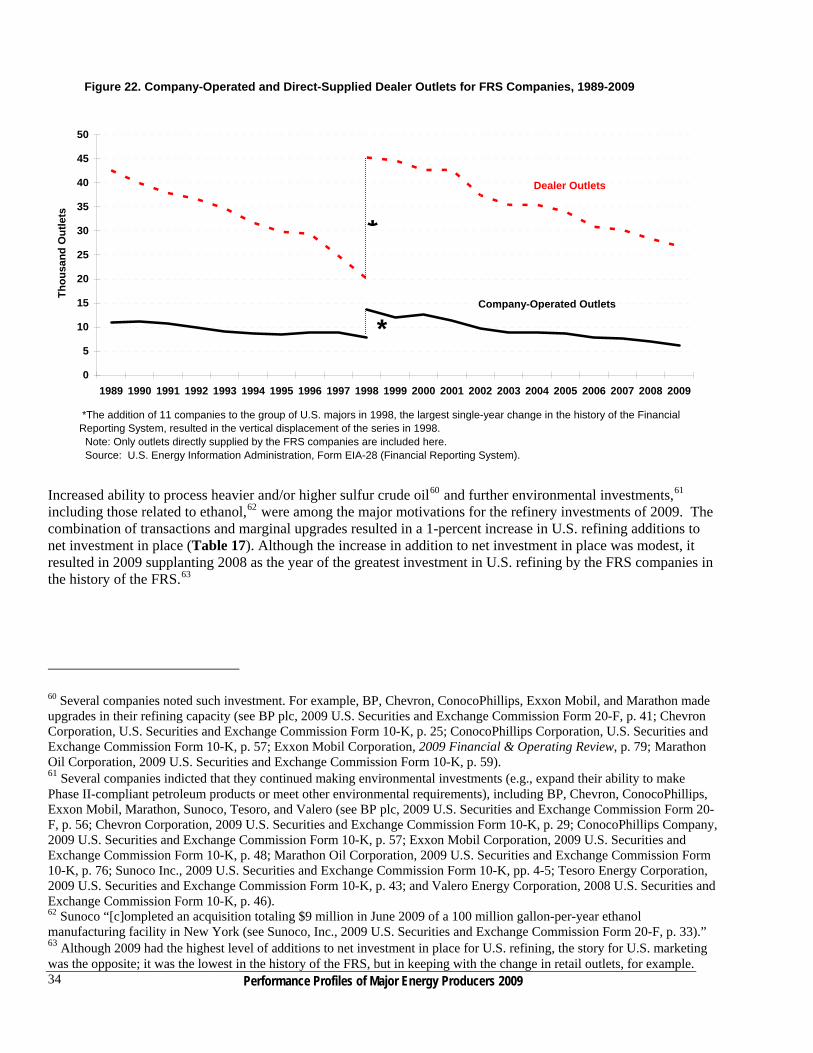
0
5
10
15
20
25
30
35
40
45
50
1989 1990 1991 1992 1993 1994 1995 1996 1997 1998 1999 2000 2001 2002 2003 2004 2005 2006 2007 2008 2009
Th
ou
san
d O
utl
ets
Figure 22. Company-Operated and Direct-Supplied Dealer Outlets for FRS Companies, 1989-2009
*The addition of 11 companies to the group of U.S. majors in 1998, the largest single-year change in the history of the Financial Reporting System, resulted in the vertical displacement of the series in 1998. Note: Only outlets directly supplied by the FRS companies are included here. Source: U.S. Energy Information Administration, Form EIA-28 (Financial Reporting System).
*
Company-Operated Outlets
Dealer Outlets
*
Increased ability to process heavier and/or higher sulfur crude oil60 and further environmental investments,61 including those related to ethanol,62 were among the major motivations for the refinery investments of 2009. The combination of transactions and marginal upgrades resulted in a 1-percent increase in U.S. refining additions to net investment in place (Table 17). Although the increase in addition to net investment in place was modest, it resulted in 2009 supplanting 2008 as the year of the greatest investment in U.S. refining by the FRS companies in the history of the FRS.63
60 Several companies noted such investment. For example, BP, Chevron, ConocoPhillips, Exxon Mobil, and Marathon made upgrades in their refining capacity (see BP plc, 2009 U.S. Securities and Exchange Commission Form 20-F, p. 41; Chevron Corporation, U.S. Securities and Exchange Commission Form 10-K, p. 25; ConocoPhillips Corporation, U.S. Securities and Exchange Commission Form 10-K, p. 57; Exxon Mobil Corporation, 2009 Financial & Operating Review, p. 79; Marathon Oil Corporation, 2009 U.S. Securities and Exchange Commission Form 10-K, p. 59). 61 Several companies indicted that they continued making environmental investments (e.g., expand their ability to make Phase II-compliant petroleum products or meet other environmental requirements), including BP, Chevron, ConocoPhillips, Exxon Mobil, Marathon, Sunoco, Tesoro, and Valero (see BP plc, 2009 U.S. Securities and Exchange Commission Form 20-F, p. 56; Chevron Corporation, 2009 U.S. Securities and Exchange Commission Form 10-K, p. 29; ConocoPhillips Company, 2009 U.S. Securities and Exchange Commission Form 10-K, p. 57; Exxon Mobil Corporation, 2009 U.S. Securities and Exchange Commission Form 10-K, p. 48; Marathon Oil Corporation, 2009 U.S. Securities and Exchange Commission Form 10-K, p. 76; Sunoco Inc., 2009 U.S. Securities and Exchange Commission Form 10-K, pp. 4-5; Tesoro Energy Corporation, 2009 U.S. Securities and Exchange Commission Form 10-K, p. 43; and Valero Energy Corporation, 2008 U.S. Securities and Exchange Commission Form 10-K, p. 46). 62 Sunoco “[c]ompleted an acquisition totaling $9 million in June 2009 of a 100 million gallon-per-year ethanol manufacturing facility in New York (see Sunoco, Inc., 2009 U.S. Securities and Exchange Commission Form 20-F, p. 33).”
Performance Profiles of Major Energy Producers 2009 34
63 Although 2009 had the highest level of additions to net investment in place for U.S. refining, the story for U.S. marketing was the opposite; it was the lowest in the history of the FRS, but in keeping with the change in retail outlets, for example.
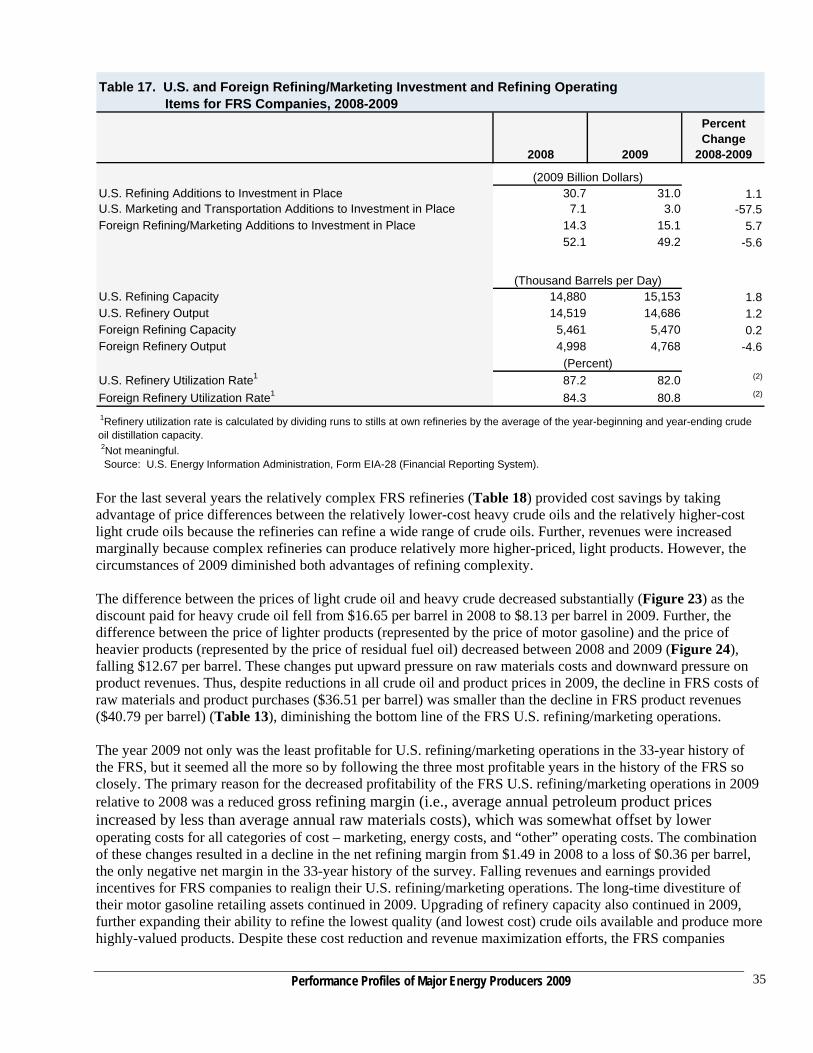
2008 2009
Percent Change
2008-2009
U.S. Refining Additions to Investment in Place 30.7 31.0 1.1U.S. Marketing and Transportation Additions to Investment in Place 7.1 3.0 -57.5Foreign Refining/Marketing Additions to Investment in Place 14.3 15.1 5.7
52.1 49.2 -5.6
U.S. Refining Capacity 14,880 15,153 1.8U.S. Refinery Output 14,519 14,686 1.2Foreign Refining Capacity 5,461 5,470 0.2Foreign Refinery Output 4,998 4,768 -4.6
U.S. Refinery Utilization Rate1 87.2 82.0 (2)
Foreign Refinery Utilization Rate1 84.3 80.8 (2)
1Refinery utilization rate is calculated by dividing runs to stills at own refineries by the average of the year-beginning and year-ending crude oil distillation capacity.
2Not meaningful. Source: U.S. Energy Information Administration, Form EIA-28 (Financial Reporting System).
Table 17. U.S. and Foreign Refining/Marketing Investment and Refining Operating Items for FRS Companies, 2008-2009
(2009 Billion Dollars)
(Thousand Barrels per Day)
(Percent)
For the last several years the relatively complex FRS refineries (Table 18) provided cost savings by taking advantage of price differences between the relatively lower-cost heavy crude oils and the relatively higher-cost light crude oils because the refineries can refine a wide range of crude oils. Further, revenues were increased marginally because complex refineries can produce relatively more higher-priced, light products. However, the circumstances of 2009 diminished both advantages of refining complexity. The difference between the prices of light crude oil and heavy crude decreased substantially (Figure 23) as the discount paid for heavy crude oil fell from $16.65 per barrel in 2008 to $8.13 per barrel in 2009. Further, the difference between the price of lighter products (represented by the price of motor gasoline) and the price of heavier products (represented by the price of residual fuel oil) decreased between 2008 and 2009 (Figure 24), falling $12.67 per barrel. These changes put upward pressure on raw materials costs and downward pressure on product revenues. Thus, despite reductions in all crude oil and product prices in 2009, the decline in FRS costs of raw materials and product purchases ($36.51 per barrel) was smaller than the decline in FRS product revenues ($40.79 per barrel) (Table 13), diminishing the bottom line of the FRS U.S. refining/marketing operations. The year 2009 not only was the least profitable for U.S. refining/marketing operations in the 33-year history of the FRS, but it seemed all the more so by following the three most profitable years in the history of the FRS so closely. The primary reason for the decreased profitability of the FRS U.S. refining/marketing operations in 2009 relative to 2008 was a reduced gross refining margin (i.e., average annual petroleum product prices increased by less than average annual raw materials costs), which was somewhat offset by lower operating costs for all categories of cost – marketing, energy costs, and “other” operating costs. The combination of these changes resulted in a decline in the net refining margin from $1.49 in 2008 to a loss of $0.36 per barrel, the only negative net margin in the 33-year history of the survey. Falling revenues and earnings provided incentives for FRS companies to realign their U.S. refining/marketing operations. The long-time divestiture of their motor gasoline retailing assets continued in 2009. Upgrading of refinery capacity also continued in 2009, further expanding their ability to refine the lowest quality (and lowest cost) crude oils available and produce more highly-valued products. Despite these cost reduction and revenue maximization efforts, the FRS companies
Performance Profiles of Major Energy Producers 2009
35

1974 1981 1993 1996 1997 1999 2000 2001 2002 2003 2004 2005 2006 2007 2008 2009
FRS Integrated Refinersa
Coking n.c. n.c. n.c. 13.0 12.6 12.9 13.9 14.1 15.8 15.4 15.7 15.4 15.4 15.9 16.0 16.3 Catalytic cracking 27.7 30.4 36.5 33.8 35.9 35.8 35.6 35.2 33.0 33.4 33.7 33.7 33.9 33.4 34.3 33.6 Catalytic reforming 17.6 22.4 25.8 24.9 23.4 22.3 22.4 22.2 21.8 21.8 21.8 21.4 21.7 21.9 21.0 21.5 Hydro cracking 5.6 5.7 9.6 9.6 9.6 10.9 11.0 10.9 10.7 10.4 10.7 10.5 11.0 11.4 11.1 12.1 Catalytic hydrotreating n.c. n.c. n.c. n.c. n.c. n.c. n.c. n.c. n.c. n.c. 79.5 82.3 85.8 88.0 87.7 87.0 Alkylation 4.8 5.3 7.7 6.8 7.5 7.4 7.4 7.2 7.1 7.2 7.3 7.3 7.5 7.1 7.2 7.0
FRS Non-Integrated Refinersb
Coking n.c. n.c. n.c. 11.0 12.7 12.0 12.1 12.4 12.0 13.5 14.7 14.3 14.4 14.4 14.2 12.5 Catalytic cracking n.c. n.c. n.c. 29.8 34.1 34.0 35.5 35.5 36.3 36.7 38.4 37.2 37.2 37.1 36.7 34.0 Catalytic reforming n.c. n.c. n.c. 18.9 21.5 22.5 21.9 21.7 21.4 21.1 21.8 20.4 20.1 20.6 21.2 20.1 Hydro cracking n.c. n.c. n.c. 6.3 7.8 8.6 8.6 8.4 7.8 8.5 8.7 8.1 8.3 8.4 8.5 8.4 Catalytic hydrotreating n.c. n.c. n.c. n.c. n.c. n.c. n.c. n.c. n.c. n.c. 71.4 73.3 74.3 74.2 76.9 73.5 Alkylation n.c. n.c. n.c. 6.0 6.8 6.0 6.3 6.3 6.4 6.4 6.9 6.6 6.6 6.6 6.8 6.6
n.c.: Information not collected.
a :FRS Integrated Refiners includes BP America, Chevron, ConocoPhillips, Deer Park (consolidated with Shell for FRS reporting), Exxon Mobil, Marathon, Shell Oil, and Total Holdings USA.
b: FRS Non-Integrated Refiners includes Alon (2009 only), Chalmette (2009 only), CITGO, Lyondell Chemical, Motiva, Sunoco, Tesoro, Valero, Western Refining (2009 only), and WRB (2008 and 2009). Sources: Oil and Gas Journal, "Worldwide Refinery Report," 1974, 1981, 1993, 1996, 1997, 1999, 2000, 2001, 2002, 2003, 2004, 2005, 2006, 2007, 2008, and 2009.
Downstream Capacity as a Percent of Crude Distillation Capacity
Table 18. U.S. Refinery Configurations for FRS Companies, Selected Years, 1974-2009 (Percent)
0
2
4
6
8
10
12
14
16
18
1985 1987 1989 1991 1993 1995 1997 1999 2001 2003 2005 2007 2009
Do
llars
(20
09)
per
Bar
rel
Note: Light crude oil tends to sell for a higher price per barrel than does heavy crude oil. Thus, the vertical distance of the line in the figure from the horizontal axis indicates the premium paid for light crude oil relative to heavy crude oil. The more expensive light crude oil is defined here as having an API gravity of 40.1 or greater, and heavy crude oil is defined as having an API gravity of 20 or less. Source: U.S. Energy Information Administration, Petroleum Marketing Monthly , DOE/EIA-0380, Tables 27 and 28 (2006 and earlier), and Tables 24 and 25 (2007, onward).
Figure 23. Price Difference Between Light Crude Oil and Heavy Crude Oil, 1985-2009
Performance Profiles of Major Energy Producers 2009 36
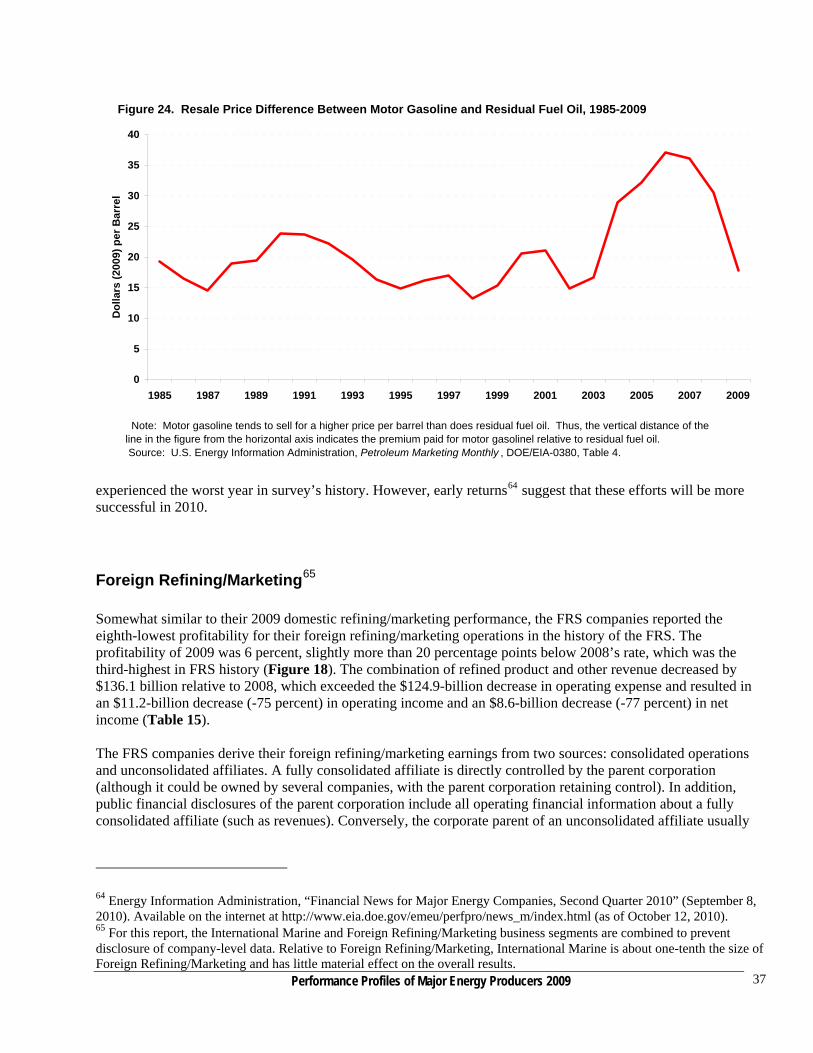
0
5
10
15
20
25
30
35
40
1985 1987 1989 1991 1993 1995 1997 1999 2001 2003 2005 2007 2009
Do
llars
(20
09)
per
Bar
rel
Figure 24. Resale Price Difference Between Motor Gasoline and Residual Fuel Oil, 1985-2009
Note: Motor gasoline tends to sell for a higher price per barrel than does residual fuel oil. Thus, the vertical distance of the line in the figure from the horizontal axis indicates the premium paid for motor gasolinel relative to residual fuel oil. Source: U.S. Energy Information Administration, Petroleum Marketing Monthly , DOE/EIA-0380, Table 4.
experienced the worst year in survey’s history. However, early returns64 suggest that these efforts will be more successful in 2010.
Foreign Refining/Marketing65 Somewhat similar to their 2009 domestic refining/marketing performance, the FRS companies reported the eighth-lowest profitability for their foreign refining/marketing operations in the history of the FRS. The profitability of 2009 was 6 percent, slightly more than 20 percentage points below 2008’s rate, which was the third-highest in FRS history (Figure 18). The combination of refined product and other revenue decreased by $136.1 billion relative to 2008, which exceeded the $124.9-billion decrease in operating expense and resulted in an $11.2-billion decrease (-75 percent) in operating income and an $8.6-billion decrease (-77 percent) in net income (Table 15). The FRS companies derive their foreign refining/marketing earnings from two sources: consolidated operations and unconsolidated affiliates. A fully consolidated affiliate is directly controlled by the parent corporation (although it could be owned by several companies, with the parent corporation retaining control). In addition, public financial disclosures of the parent corporation include all operating financial information about a fully consolidated affiliate (such as revenues). Conversely, the corporate parent of an unconsolidated affiliate usually
64 Energy Information Administration, “Financial News for Major Energy Companies, Second Quarter 2010” (September 8, 2010). Available on the internet at http://www.eia.doe.gov/emeu/perfpro/news_m/index.html (as of October 12, 2010).
Performance Profiles of Major Energy Producers 2009
37
65 For this report, the International Marine and Foreign Refining/Marketing business segments are combined to prevent disclosure of company-level data. Relative to Foreign Refining/Marketing, International Marine is about one-tenth the size of Foreign Refining/Marketing and has little material effect on the overall results.

owns 50 percent or less of the affiliate, and does not directly control the affiliate66 (a joint venture, for example, is usually an unconsolidated affiliate from the perspective of at least one of the partners). Essentially, the unconsolidated affiliate is more of a property or holding of the parent corporation than a company that the parent actually operates. The effect on financial operations of an unconsolidated affiliate can be seen only on the parent corporation’s income statement, on which the parent company reports its proportional share of the affiliate’s net income. Historically, approximately half of the FRS consolidated foreign refinery capacity is located in Europe, reaching 54 percent in 2009 (Table 19), with most of the remaining consolidated refinery capacity in Asia. Historically and at present the operations of the FRS companies’ unconsolidated foreign refining/marketing affiliates overwhelmingly are in Asia, with Chevron the primary owner of unconsolidated FRS Asian refinery capacity.
2008 2009 2008 2009Europe 51.1 54.2 9.0 8.6
Asia 24.1 25.5 76.5 77.6
Latin America 8.7 2.8 0.3 0.3
Canada 13.6 14.9 0.0 0.0
Africa and Middle East 2.4 2.6 14.2 13.5
Total 100.0 100.0 100.0 100.0
Table 19. Regional Distribution of Foreign Refinery Capacity for FRS Companies, 2008-2009 (Percent)
Unconsolidated AffiliatesConsolidated Operations
Sources: Company Annual Reports and filings of U.S. Securities and Exchange Commission Form 10-K.
Reduced net income in 2009, relative to 2008, from FRS foreign refining/marketing operations was because of decreased income from both consolidated and unconsolidated operations (Figure 25). Worldwide petroleum demand fell slightly in 2009, primarily due to lower North American and OECD Europe consumption (Figure 26), putting downward pressure on prices and revenues. Further, companies reported reduced revenues due to lower product sales, 67 leading to additional downward pressure on their revenues and bottom line. Additional reasons for reduced earnings from both FRS consolidated and FRS unconsolidated operations noted in public statements included foreign currency losses,68 an absence of trading gains,69 decreased refining and marketing margins,70 capital expenditures to produce clean fuels,71 lower sales, and lower refinery utilization rates72 (Table 16). However, the companies also undertook several actions aimed at improving future profitability – increasing ability to process lower-cost crude oil,73 and divestitures of refinery74 and other assets.75
66 The actual percentage of ownership necessary to convey control of an entity is open to debate and, for some purposes, can be as little as 10 percent. 67 Chevron Corporation, 2009 U.S. Securities and Exchange Commission Form 10-K, p. FS-8; and ConocoPhillips, 2009 U.S. Securities and Exchange Commission Form 10-K, p. 46. 68 Chevron Corporation, 2009 U.S. Securities and Exchange Commission Form 10-K, p. FS-8. 69 Chevron Corporation, 2009 U.S. Securities and Exchange Commission Form 10-K, p. FS-8. 70 Chevron Corporation, 2009 U.S. Securities and Exchange Commission Form 10-K, p. FS-8; ConocoPhillips Corporation, 2009 U.S. Securities and Exchange Commission Form 10-K, p. 46; and Exxon Mobil Corporation, 2009 U.S. Securities and Exchange Commission Form 10-K, p. 45.. 71 Chevron Corporation, 2009 U.S. Securities and Exchange Commission Form 10-K, p. 25. 72 ConocoPhillips Corporation, 2009 U.S. Securities and Exchange Commission Form 10-K, p. 46. 73 Chevron Corporation, 2009 Supplement to the Annual Report, p. 46; and ConocoPhillips Corporation, 2009 Fact Book, p. 49.
Performance Profiles of Major Energy Producers 2009 38
74 Chevron divested refinery capacity during 2009. Chevron sold its 16-percent interest in the Kenya Petroleum Refinery Ltd (Mombasa , 90,000-barrels-per-day) in July 2009 (Chevron Corporation, 2009 Supplement to the Annual Report, p. 46).

Performance Profiles of Major Energy Producers 2009
39
Consolidated Operations Much lower earnings from consolidated FRS foreign refining/marketing operations occurred within an industry environment of lower (Figure 26) European petroleum demand, which fell 4 percent (0.6 million barrels per day) compared with 2008 and 9 percent (1.0 million barrels per day) relative to the 2003-2007 average. Earnings from the FRS companies’ consolidated operations decreased (Figure 25) more than $7.1 billion (77 percent) between 2008 and 2009, providing $2.1 billion of net income. Historically, 2009 is in the lower half of all-time FRS consolidated results, the lowest level since 2002’s loss of $37 million, and one year after the second-highest76 FRS result ever. The FRS consolidated operations generated lower earnings due to lower prices received, lower margins, and reduced sales.77 However, they attempted to increase future profitability by adding cogeneration capacity,78 making refinery upgrades,79 and divesting non-core marketing outlets.80 Unconsolidated Operations During 2009, the FRS companies’ unconsolidated affiliates generated $0.5 billion of net income, which was 76 percent lower than 2008. Lower earnings occurred despite increased product demand in all of Asia/Pacific, both relative to 2008 and to the 2003-2007 average. However, changes in petroleum product consumption in Asia were varied (Figure 26). Consumption by the Asian Developing Countries rose 4 percent (0.8 million barrels per day) relative to 2008 and 14 percent (2.6 million barrels per day) relative to the 2003-2007 average. However, consumption in the developed Asian countries of Australia, Japan, and New Zealand collectively fell 8 percent (0.5 million barrels per day) relative to 2008 and 13 percent relative to the 2003-2007 average (0.8 million barrels per day). The higher petroleum consumption level in all of Asia/Pacific was insufficient to prevent a decline in FRS earnings from their unconsolidated foreign refining/marketing operations, which fell to $461 million -- the lowest level since 2002, the sixth-lowest in FRS history, and a mere 4 years removed from the all-time high of 2005. Company public disclosures included some reasons for the lower earnings generated by the Asian (and other unconsolidated) operations of the FRS companies, which included declines in foreign exchange rates,81 lower prices, and lower margins.82 Future revenue-enhancing efforts made during 2009 include increasing refinery
75 Chevron Corporation, 2009 Annual Report, p. 16. 76 Although 2008 was the second-highest result in the history of the FRS, it was slightly less than $91 million (1 percent) lower than the highest ever of 1979. 77 Exxon Mobil Corporation, 2009 U.S. Securities and Exchange Commission Form 10-K, p.49. 78 Exxon Mobil Corporation, 2009 Financial & Operating Review, p. 77. 79 Exxon Mobil Corporation, 2009 U.S. Securities and Exchange Commission Form 10-K, p. 48. 80 ConocoPhillips Corporation, 2009 U.S. Securities and Exchange Commission Form 10-K, p. 20; and ConocoPhillips Corporation, 2008 U.S. Securities and Exchange Commission Form 10-K, p. 21. 81 Chevron Corporation, 2009 U.S. Securities and Exchange Commission Form 10-K, p. FS-8. 82 Chevron Corporation, 2009 U.S. Securities and Exchange Commission Form 10-K, p. FS-8.
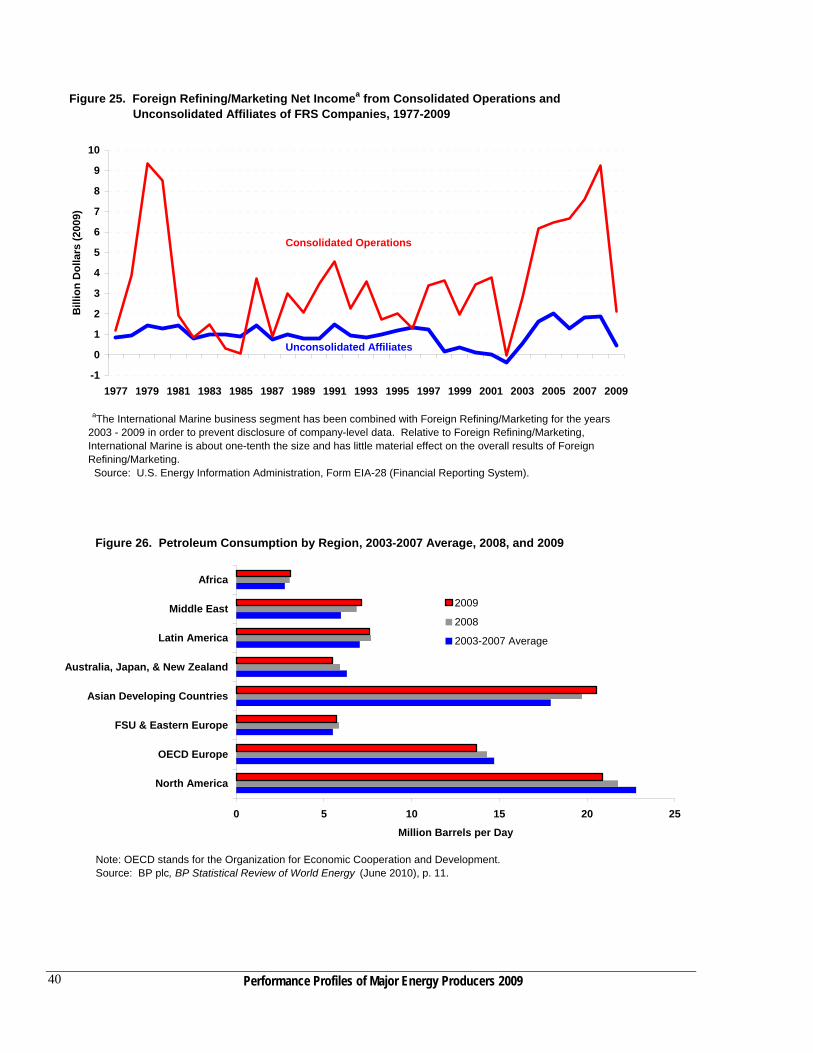
-1
0
1
2
3
4
5
6
7
8
9
10
1977 1979 1981 1983 1985 1987 1989 1991 1993 1995 1997 1999 2001 2003 2005 2007 2009
Bill
ion
Do
llars
(20
09)
Figure 25. Foreign Refining/Marketing Net Incomea from Consolidated Operations and Unconsolidated Affiliates of FRS Companies, 1977-2009
Consolidated Operations
Unconsolidated Affiliates
aThe International Marine business segment has been combined with Foreign Refining/Marketing for the years 2003 - 2009 in order to prevent disclosure of company-level data. Relative to Foreign Refining/Marketing, International Marine is about one-tenth the size and has little material effect on the overall results of Foreign Refining/Marketing. Source: U.S. Energy Information Administration, Form EIA-28 (Financial Reporting System).
0 5 10 15 20 25
North America
OECD Europe
FSU & Eastern Europe
Asian Developing Countries
Australia, Japan, & New Zealand
Latin America
Middle East
Africa
Million Barrels per Day
2009
2008
2003-2007 Average
Note: OECD stands for the Organization for Economic Cooperation and Development.Source: BP plc, BP Statistical Review of World Energy (June 2010), p. 11.
Figure 26. Petroleum Consumption by Region, 2003-2007 Average, 2008, and 2009
Performance Profiles of Major Energy Producers 2009 40

Performance Profiles of Major Energy Producers 2009
41
capability to refine lower-quality crude and produce ultra-low sulfur products,83 adding refinery and cogeneration capacity,84 revising refining upgrade schedules,85 and refocusing marketing operations.86 FRS companies’ foreign refining/marketing earnings decreased substantially in an industry setting of lower worldwide petroleum product consumption, particularly in Europe and the more developed Asia/Pacific countries of Japan, Australia, and New Zealand. Foreign exchange declines, lower product prices, margins, and sales all contributed to the much lower profitability of the FRS companies’ foreign refining/marketing operations in 2009. Thus, long-term strategies to maximize revenues and minimize costs remain important, if not more so. Cost-cutting measures, such as increasing cogeneration capacity87 and strategic divestment,88 likely will continue to occupy prominent positions in the companies’ ongoing strategic actions.
83 ConocoPhillips Corporation, 2009 U.S. Securities and Exchange Commission Form 10-K, p. 20. 84Exxon Mobil completed its Fujian, China refinery-expansion project, which tripled the refinery’s crude oil distillation capacity (Exxon Mobil Corporation, 2009 Financial & Operating Review, p. 77).” 85 ConocoPhillips Corporation, “ConocoPhillips Delays Wilhelmshaven Upgrade Project,” press release (November 17, 2009). 86 Chevron sold its marketing operations in several Latin American (Brazil, Chile, Haiti, and Peru) and African (Benin, Cameroon, Cote d’ Ivoire, Kenya, Nigeria, Republic of the Congo, Togo, and Uganda) countries during 2009. It additionally sold its marketing operations in India and Italy. See Chevron Corporation, 2009 Supplement to the Annual Report, pp. 45 and 47. 87 Exxon Mobil Corporation, 2009 Financial & Operating Review, p. 77. 88 Chevron sold its marketing operations in several Latin American (Brazil, Chile, Haiti, and Peru) and African (Benin, Cameroon, Cote d’ Ivoire, Kenya, Nigeria, Republic of the Congo, Togo, and Uganda) countries during 2009. It additionally sold its marketing operations in India and Italy. See Chevron Corporation, 2009 Supplement to the Annual Report, pp. 45 and 47.

Performance Profiles of Major Energy Producers 2009 42

Performance Profiles of Major Energy Producers 2009 43
About the Financial Reporting System Companies
Changes in the Financial Reporting System Companies for the 2009 Reporting Year For the 2009 reporting year, 30 major energy companies (Table 20) reported their financial89 and operating data to the U.S. Energy Information Administration’s (EIA) Financial Reporting System (FRS) on Form EIA-28. The number of companies (referred to as the FRS companies in this report) increased by three from 2008 with the addition of Alon USA, Chalmette, and Western Refining.
Alenco Hess CorporationAlon USA Hovensa LLCAnadarko Petroleum Corporation Lyondell Chemical CorporationApache Corporation Marathon Oil CorporationBP America, Inc. Motiva Enterprises, L.L.C.Chalmette Refining LLC Occidental Petroleum CorporationChesapeake Energy Corporation Shell Oil CompanyChevron Corporation Sunoco, Inc.CITGO Petroleum Corporation Tesoro Petroleum CorporationConocoPhillips The Williams Companies, Inc.Devon Energy Corporation Total Holdings USA, Inc.El Paso Corporation Valero Energy Corp.EOG Resources, Inc. Western Refining, Inc.EQT Corporation* WRB Refining LLCExxon Mobil Corporation XTO Energy, Inc.
Table 20. The FRS Companies in 2009
*: Equitable Resources, Inc. announced on February 4, 2009 that its name would become EQT Corporation effective February 9, 2009.Note: See "Historical Respondent Company List" on the Energy Finance page for the list of FRS respondents from 1974 forward. Six of the FRS companies are owned by foreign companies: Alenco -- owned by Encana; Alon USA -- owned by Alon; BP America—owned by BP plc; CITGO -- owned by Petroleos de Venezuela, S.A.; Shell Oil—owned by Royal Dutch Shell plc.; and Total Holdings USA—owned by Total S.A. Alon USA, which initially entered the U.S. refining industry with its August 2000 acquisition of the Big Spring, Texas, refinery of FRS respondent Fina, acquired three refineries (two that were operational) during 2006, more than doubling its refinery capacity, but leaving it just below the threshold for inclusion in the FRS. However, its July 2008 acquisition of FRS respondent Valero’s Krotz Springs, Louisiana, refinery increased its corporate capacity well beyond the threshold of 1 percent of U.S. crude oil distillation capacity for inclusion in the FRS.90 The company was subsequently added for the 2009 reporting year. Alon’s refinery capacity is concentrated on the west coast and the Gulf coast areas. Chalmette, a refinery joint venture between Exxon Mobil Corporation and Petroleos de Venezuela, S.A. (PdVSA, the state oil company of Venezuela) is a 192,500 barrels-per-day refinery in Chalmette, Louisiana. The joint venture began in 1998.91
89 The financial data are collected for the company’s fiscal year, which is identical to the calendar year for all included companies. 90 Oil and gas producers’ threshold for inclusion is 1 percent, or more, of either crude oil and natural gas liquids, or natural gas production. 91 The venture, which began in January 1998, was initially between Mobil Oil Corporation and PDV America, the U.S. affiliate of the state oil company of Venezuela, Petroleos de Venezuela, S.A. After Exxon and Mobil merged, the venture was continued with Exxon Mobil as the partner.

Performance Profiles of Major Energy Producers 2009 44
Western Refining Inc., entered the U.S. refining industry with its August 2003 acquisition of the 99,000 bpd El Paso, Texas, refinery of FRS respondent Chevron.92 Subsequently, Western acquired Giant Industries and its 101,250 bpd corporate capacity in May 2007. Western has since suspended refining operations at its Bloomfield, New Mexico, refinery effectively transforming it into a product terminal, in November 2009.93 More recently, Western suspended refining operations at its Yorktown, Virginia refinery due to poor refinery economics, also transforming it into a product terminal.94 All of Western’s remaining operating refinery capacity is in the Gulf Coast region. Although the composition of the FRS group of companies changes over time, the changes usually are incremental, as evident from the above discussion. A company is added to the survey when, through growth or acquisition, it meets the criteria classifying it as a major energy company. Typically, no more than two companies are added to the survey in any given year. The new companies usually are relatively small compared with the existing FRS group, so the effect on the aggregate totals is marginal. The year 1998 was an exception. Because of a change in the FRS criteria, 11 companies were added to the FRS group. Companies rarely exit unless through merger, in which case the assets of the exiting company are absorbed into the surviving company. Thus, despite occasional year-to-year changes in the FRS group composition, comparisons are still meaningful and informative.
The FRS Companies’ Importance in the U.S. Economy The FRS companies occupy a significant position in the U.S.95 economy. In 2009, operating revenues of the FRS companies totaled $1.297 trillion, which is equal to 13 percent of the $9.763 trillion in revenues of the Fortune 500 corporations.96,97 The reporting companies engage in a wide range of business activities, but their most important activities are in the energy sector. They derived about 94 percent, or $1,223 billion, of allocated operating revenues98 from energy lines of business and derived nearly all of these revenues from their core petroleum operations (Figure 27). A majority of these companies are multinational, with 40 percent of the majors’ net investment located abroad. Worldwide petroleum and natural gas market developments are of primary importance to these companies’ financial performance. In 2009 the FRS companies accounted for 43 percent of total U.S. crude oil and natural gas liquids (NGL) production,99 43 percent of natural gas production, 78 percent of U.S. refining capacity, and 0.3 percent of U.S.
92 Chevron was known as Chevron Texaco at the time of the transaction. 93 Western Refining Inc., Annual Report 2009, p. 3. 94 Western Refining, Inc., “Western Refining Announces Completion of Refining Operations Shutdown at Yorktown” (September 13, 2010). The press release is available on the internet at http://ir.westernrefining.com/phoenix.zhtml?c=194293&p=irol-newsArticle&ID=1470524&highlight= (as of September 14, 2010). 95 For the purposes of this report, the term “United States” includes the 50 states, the District of Columbia, Puerto Rico, and the U.S. Virgin Islands. 96 Unless otherwise indicated, all dollar values and percentage changes in this report are in constant 2009 dollars, adjusted using the Gross Domestic Product implicit price deflator. 97 The Fortune 500 is a list of the 500 largest U.S. corporations, ranked by revenues, published annually by Fortune magazine on their website at http://money.cnn.com/magazines/fortune/fortune500/2010/full_list/ (as of September 14, 2010). 98 The sum of allocated operating revenue ($1,297 billion) exceeds corporate operating revenue ($1,145 billion) because allocated revenues include revenues from sales within the company and between different lines of business, in addition to the revenue from sales by the company to third parties (i.e., those outside the company). However, revenues from intersegment sales are eliminated in calculating corporate operating revenue, which includes only sales by the company to third parties. 99 Note that U.S. totals include royalty production, while the FRS companies’ production levels do not. Thus, these calculations understate the FRS companies’ share of crude oil and NGL production and natural gas production.
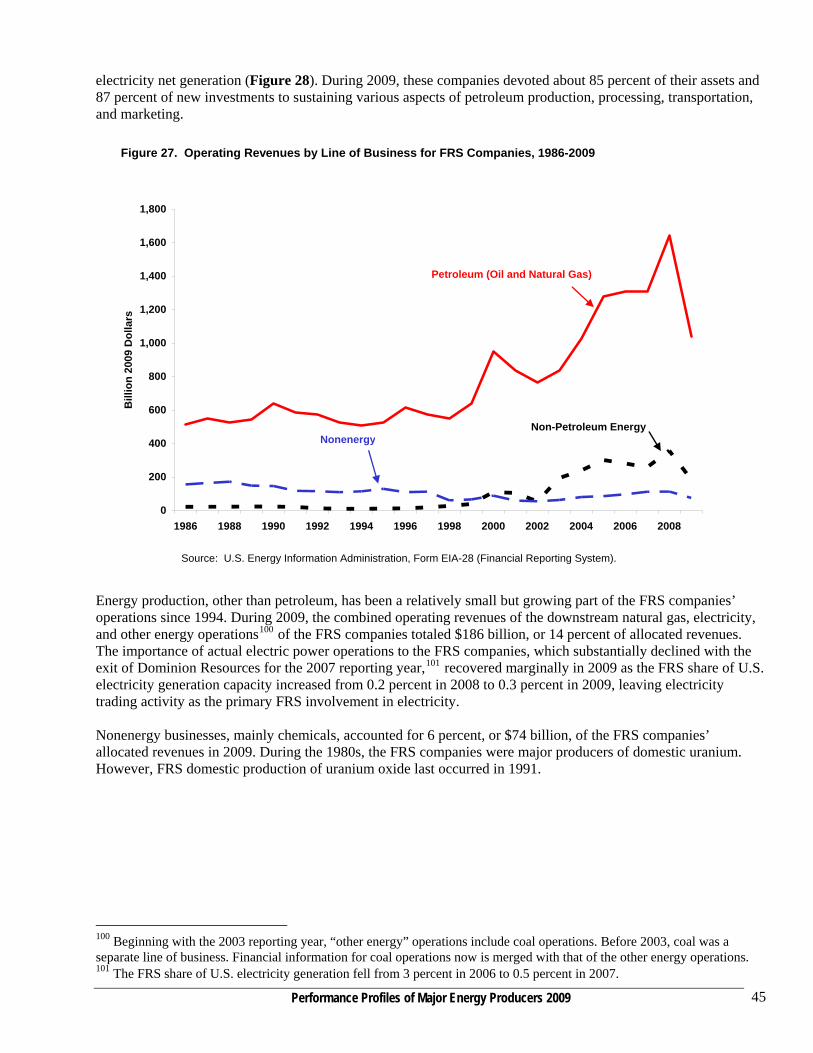
Performance Profiles of Major Energy Producers 2009 45
electricity net generation (Figure 28). During 2009, these companies devoted about 85 percent of their assets and 87 percent of new investments to sustaining various aspects of petroleum production, processing, transportation, and marketing.
0
200
400
600
800
1,000
1,200
1,400
1,600
1,800
1986 1988 1990 1992 1994 1996 1998 2000 2002 2004 2006 2008
Bill
ion
200
9 D
olla
rs
Source: U.S. Energy Information Administration, Form EIA-28 (Financial Reporting System).
Figure 27. Operating Revenues by Line of Business for FRS Companies, 1986-2009
Petroleum (Oil and Natural Gas)
Non-Petroleum EnergyNonenergy
Energy production, other than petroleum, has been a relatively small but growing part of the FRS companies’ operations since 1994. During 2009, the combined operating revenues of the downstream natural gas, electricity, and other energy operations100 of the FRS companies totaled $186 billion, or 14 percent of allocated revenues. The importance of actual electric power operations to the FRS companies, which substantially declined with the exit of Dominion Resources for the 2007 reporting year,101 recovered marginally in 2009 as the FRS share of U.S. electricity generation capacity increased from 0.2 percent in 2008 to 0.3 percent in 2009, leaving electricity trading activity as the primary FRS involvement in electricity. Nonenergy businesses, mainly chemicals, accounted for 6 percent, or $74 billion, of the FRS companies’ allocated revenues in 2009. During the 1980s, the FRS companies were major producers of domestic uranium. However, FRS domestic production of uranium oxide last occurred in 1991.
100 Beginning with the 2003 reporting year, “other energy” operations include coal operations. Before 2003, coal was a separate line of business. Financial information for coal operations now is merged with that of the other energy operations. 101 The FRS share of U.S. electricity generation fell from 3 percent in 2006 to 0.5 percent in 2007.

0
10
20
30
40
50
60
70
80
90
100
1986 1988 1990 1992 1994 1996 1998 2000 2002 2004 2006 2008
Per
cen
t o
f T
ota
l Un
ited
Sta
tes
Refinery Capacity
Crude Oil and NGL
Natural Gas
Coal
Uranium Oxide
Figure 28. Shares of U.S. Energy Productiona and Refinery Capacity for FRS Companies, 1986-2009
aOil and natural gas production for the FRS companies includes only the production that is owned by the FRS companies; it does not include any interests not owned by the FRS companies (e.g., royalty interests owned by others). Total production for the United States includes the interests of all owners. Note: The FRS companies last produced uranium in 1991 and coal production data was last collected in 2005. Sources: Table B1; Total industry uranium oxide production is from U.S. Energy Information Administration, Uranium Industry Annual 1992, DOE/EIA-0478(92) (Washington, DC, October 1993).
Electricity Generation
Performance Profiles of Major Energy Producers 2009 46

Performance Profiles of Major Energy Producers 2009 47
Overview of 2009 Petroleum and Natural Gas Markets
Crude oil, natural gas, and petroleum products prices all fell sharply in 2009 from the record high prices in all three categories for 2008. On an average annual basis, crude oil prices dropped 37 percent from 2008 (in constant 2009 dollars), and natural gas wellhead prices dropped 54 percent to $3.71 per thousand cubic feet (mcf) in 2009.
Within-year price movements, however, amend the story told by average annual prices: oil prices fell in the second half of 2008, and it was only because price increases in the first part of the year were so large that the average annual price reached a record high in 2008. From the relative low of December 2008, oil prices increased most months of 2009 to a level of $72.64 per barrel in December 2009, over twice the level of December 2008.
The prices of each of the major petroleum products dropped sharply from their record highs of 2008: gasoline by 32 percent, distillate by 43 percent, and jet fuel by 44 percent.
World oil demand decreased 1.7 percent, or 1.4 million barrels per day (mmbd), from the 2008 level to 84.3 mmbd in 2009.
Worldwide reserve additions replaced 102 percent of crude oil and natural gas liquids (NGL) production in 2009.
U.S. petroleum product demand dropped 3.7 percent in 2009 to 18.8 mmbd (Table 22), following 2008’s decline of 5.7 percent.
U.S. natural gas demand decreased 1.8 percent in 2009 to 22.8 trillion cubic feet, while domestic natural gas production increased 3.3 percent, following the 7.7 percent increase in 2008. U.S. natural gas reserves increased to their highest level since the U.S. Energy Information Administration began reporting them in 1977.
The market overview section provides a brief review of prices, demand, and supply for petroleum and natural gas markets to give an indication of the general market conditions in which FRS companies operated in 2009. The FRS companies’ financial results for 2009 were driven primarily by sharp drops in the annual average prices of crude oil, petroleum products and natural gas, coupled with declines in consumption of oil and natural gas. Crude oil prices (imported refiner acquisition cost) dropped 37 percent in 2009 from the all-time high of $93.62 per barrel in 2008 (in constant 2009 dollars),102 while natural gas wellhead prices decreased 54 percent to $3.71 per thousand cubic feet (mcf) in 2009.103 World oil consumption declined for the second straight year (1.7 percent in 2009, 0.6 percent in 2008), following twenty-four consecutive years of increases.104 The decline in
102 Unless otherwise indicated, all dollar values and percentage changes in this report are based in constant 2009 dollars, adjusted using the gross domestic product implicit price deflator. 103 U.S. Energy Information Administration, Monthly Energy Review, DOE/EIA-0035 (2010/10) (Washington, DC, September 2010), Tables 9.1, 9.11. 104 U.S. Energy Information Administration, International Petroleum Monthly, August 2010, Table 4.6, available on the Internet at http://www.eia.gov/ipm/ (as of September 30, 2010).
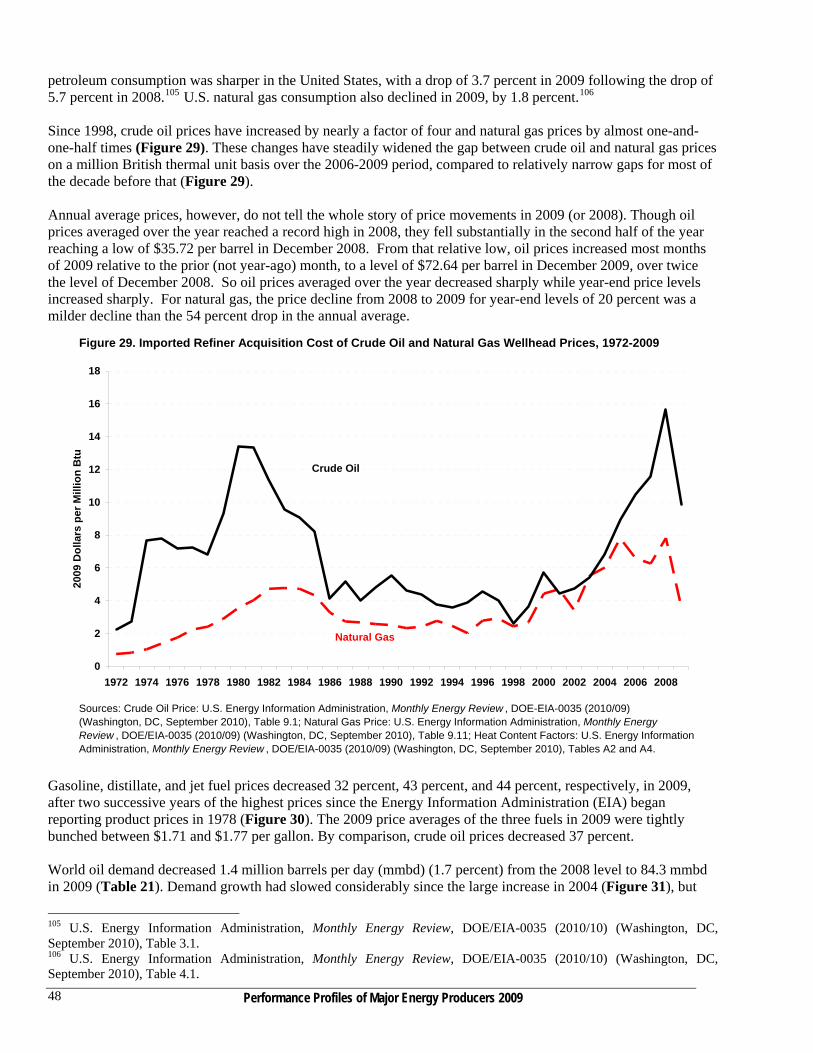
Performance Profiles of Major Energy Producers 2009 48
petroleum consumption was sharper in the United States, with a drop of 3.7 percent in 2009 following the drop of 5.7 percent in 2008.105 U.S. natural gas consumption also declined in 2009, by 1.8 percent.106 Since 1998, crude oil prices have increased by nearly a factor of four and natural gas prices by almost one-and-one-half times (Figure 29). These changes have steadily widened the gap between crude oil and natural gas prices on a million British thermal unit basis over the 2006-2009 period, compared to relatively narrow gaps for most of the decade before that (Figure 29). Annual average prices, however, do not tell the whole story of price movements in 2009 (or 2008). Though oil prices averaged over the year reached a record high in 2008, they fell substantially in the second half of the year reaching a low of $35.72 per barrel in December 2008. From that relative low, oil prices increased most months of 2009 relative to the prior (not year-ago) month, to a level of $72.64 per barrel in December 2009, over twice the level of December 2008. So oil prices averaged over the year decreased sharply while year-end price levels increased sharply. For natural gas, the price decline from 2008 to 2009 for year-end levels of 20 percent was a milder decline than the 54 percent drop in the annual average.
0
2
4
6
8
10
12
14
16
18
1972 1974 1976 1978 1980 1982 1984 1986 1988 1990 1992 1994 1996 1998 2000 2002 2004 2006 2008
2009
Do
llars
per
Mill
ion
Btu
Figure 29. Imported Refiner Acquisition Cost of Crude Oil and Natural Gas Wellhead Prices, 1972-2009
Sources: Crude Oil Price: U.S. Energy Information Administration, Monthly Energy Review , DOE-EIA-0035 (2010/09) (Washington, DC, September 2010), Table 9.1; Natural Gas Price: U.S. Energy Information Administration, Monthly Energy Review , DOE/EIA-0035 (2010/09) (Washington, DC, September 2010), Table 9.11; Heat Content Factors: U.S. Energy Information Administration, Monthly Energy Review , DOE/EIA-0035 (2010/09) (Washington, DC, September 2010), Tables A2 and A4.
Crude Oil
Natural Gas
Gasoline, distillate, and jet fuel prices decreased 32 percent, 43 percent, and 44 percent, respectively, in 2009, after two successive years of the highest prices since the Energy Information Administration (EIA) began reporting product prices in 1978 (Figure 30). The 2009 price averages of the three fuels in 2009 were tightly bunched between $1.71 and $1.77 per gallon. By comparison, crude oil prices decreased 37 percent. World oil demand decreased 1.4 million barrels per day (mmbd) (1.7 percent) from the 2008 level to 84.3 mmbd in 2009 (Table 21). Demand growth had slowed considerably since the large increase in 2004 (Figure 31), but
105 U.S. Energy Information Administration, Monthly Energy Review, DOE/EIA-0035 (2010/10) (Washington, DC, September 2010), Table 3.1. 106 U.S. Energy Information Administration, Monthly Energy Review, DOE/EIA-0035 (2010/10) (Washington, DC, September 2010), Table 4.1.

Performance Profiles of Major Energy Producers 2009 49
consecutive declines in 2008 and 2009 were the only decreases in world demand since 1983. Supply, which includes the production of crude oil, natural gas liquids (NGLs) and other liquids, and refinery processing gain, decreased 1.1 mmbd (1.3 percent) in 2009 to 84.4 mmbd. The decline in demand exceeded the decline in supply by enough to put demand just below supply. This led to a small increase in petroleum inventories of about 40,000 barrels per day in 2009. Worldwide reserve additions replaced 102 percent of crude oil and NGL production in 2009.107 The reserve replacement rate for non-Organization of the Petroleum Exporting Countries was 101 percent. Petroleum product demand (represented by petroleum product supplied) in the United States dropped 3.7 percent in 2009 to 18.8 mmbd (Table 22), following 2008’s decline of 5.7 percent. There had not been such large percentage declines in demand since 1981 and 1982. Consumption of gasoline increased slightly by 0.1 percent (8,000 barrels per day) in 2009, but consumption of all other major petroleum products (distillate fuel, jet fuel, and residual fuel) in 2009 declined substantially: 8.0 percent (314,000 barrels per day) for distillate, 9.5 percent (146,000 barrels per day) for jet fuel and 17.8 (111,000 barrels per day) for residual fuel (Figure 32). Domestic crude oil production increased 8.3 percent (410,000 barrels per day) in 2009 from 2008, while NGL production increased 7.1 percent (126,000 barrels per day). Net imports of petroleum decreased by 13.0 percent (1.4 mmbd) in 2009. The excess of petroleum product supply over demand led to an injection of 109,000 barrels per day into petroleum product inventories.
0
50
100
150
200
250
300
350
1978 1980 1982 1984 1986 1988 1990 1992 1994 1996 1998 2000 2002 2004 2006 2008
2009
Cen
ts p
er G
allo
n
Distillate
Jet Fuel
Gasoline
Figure 30. Refiner Prices of Petroleum Products for Resale, 1978-2009
Source: U.S. Energy Information Administration, Refiner Petroleum Product Prices by Sales Type, available on at http://www.eia.gov/dnav/pet/xls/pet_pri_refoth_dcu_nus_a.xls (as of December 7, 2010).
107 Calculated from reserves and production data in BP plc, BP Statistical Review of World Energy (June 2009), pp. 6, 8.

Performance Profiles of Major Energy Producers 2009 50
Q1 Q2 Q3 Q4 2008 2009Demand 83.6 84.0 84.5 85.2 85.8 84.3Supply 83.6 83.7 84.8 85.4 85.5 84.4Supply from Inventories 0.0 0.3 -0.2 -0.3 0.3 0.0
Note: Supply from Inventories includes statistical discrepancy. Source: U.S. Energy Information Administration, International Petroleum Monthly (August 2010), Table 2.1.
Table 21. World Petroleum Balance, 2008-2009 (Million Barrels per Day)
AnnualQuarterly 2009
Crude oil and NGL reserve additions in the United States in 2009 more than matched production with a combined reserve replacement rate of 194 percent.108 This happened in part due to a new Securities and Exchange Commission (SEC) rule in 2009 requiring an average of first-day-of-the-month prices throughout the year to determine reserves rather than year-end prices as had been the case in 2008 when year-end prices were low. The new SEC rule also changed the methodology for determining reserves and allowed the inclusion of certain non-conventional oil in reserves.
-2.0
-1.5
-1.0
-0.5
0.0
0.5
1.0
1.5
2.0
2.5
3.0
2000 2001 2002 2003 2004 2005 2006 2007 2008 2009
Mill
ion
Bar
rels
per
Day
Figure 31. World Oil Consumption, Change from Previous Year, 2000-2009
Source:U..S. Energy Information Administration, International Petroleum Monthly , September 2010, Table 4.6, available at http://www.eia.gov/ipm/ (as of September 29, 2010).
108 Reserve additions include revisions and adjustments, net sales and acquisitions, and total discoveries. U.S. Energy Information Administration, Summary: U.S. Crude Oil, Natural Gas, and Natural Gas Liquids Reserves, 2009 (November 2010), Table 4.

Performance Profiles of Major Energy Producers 2009 51
Q1 Q2 Q3 Q4 2008 2009Demand 20.0 19.8 18.9 19.3 19.5 18.8Crude Oil Production 5.1 5.1 4.7 4.9 5.0 5NGL Production 1.8 1.9 1.7 1.7 1.8 1Other Inputs 1.8 1.8 1.9 1.9 1.8 1Net Imports 11.2 11.3 10.8 11.2 11.1 9.7Supply from Inventories 0.1 -0.3 -0.2 -0.4 -0.2 -0.1
Note: Other Inputs includes adjustments and refinery processing gain. Source: Calculated from U.S. Energy Information Administration, Monthly Energy Review , DOE-EIA-0035 (2010/09) (Washington, DC, September 2010), Tables 3.1 and 3.2.
Table 22. U.S. Petroleum Balance, 2008-2009 (Million Barrels per Day)
Annual
Income Statement Items
Quarterly 2009
.4
.9
.9
U.S. refineries decreased output in 2009 by 264,000 barrels per day (1.4 percent) from 2008.109
But that decline in output was exceeded by a decrease in U.S. petroleum product demand in 2009, leading to the 13.0-percent drop in net imports of petroleum previously mentioned.
-500
-400
-300
-200
-100
0
100
2007 2008 2009
Th
ou
san
d B
arre
ls p
er D
ay
Gasoline
Distillate
Jet Fuel
Residual Fuel
Other Petroleum Products
Figure 32. U. S. Petroleum Product Consumption, Change from Previous Year, 2007-2009
Source: Calculated from U.S. Energy Information Administration, Petroleum Product Supplied Data, available at http:/www.eia.gov/dnav/pet/xls/pet_cons_psup_dc_nus_mbblpd_a.xls (as of December 7, 2010).
Natural gas demand in the United States decreased 1.8 percent in 2009 to 22.8 trillion cubic feet (Table 23). Domestic natural gas production increased 3.3 percent in 2009 over 2008, following the 7.7 percent increase in 2008. The increase in natural gas production caused natural gas imports to decrease by 11.2 percent. U.S. natural gas reserve additions more than matched production, with a reserve replacement rate for natural gas of 229
109 Calculated from U.S. Energy Information Administration, U.S. Refinery and Blender Net Production Data, available at www.eia.gov/dnav/pet/pet_pri_refoth_dcu_nus_a.htm (as of September 29, 2010).
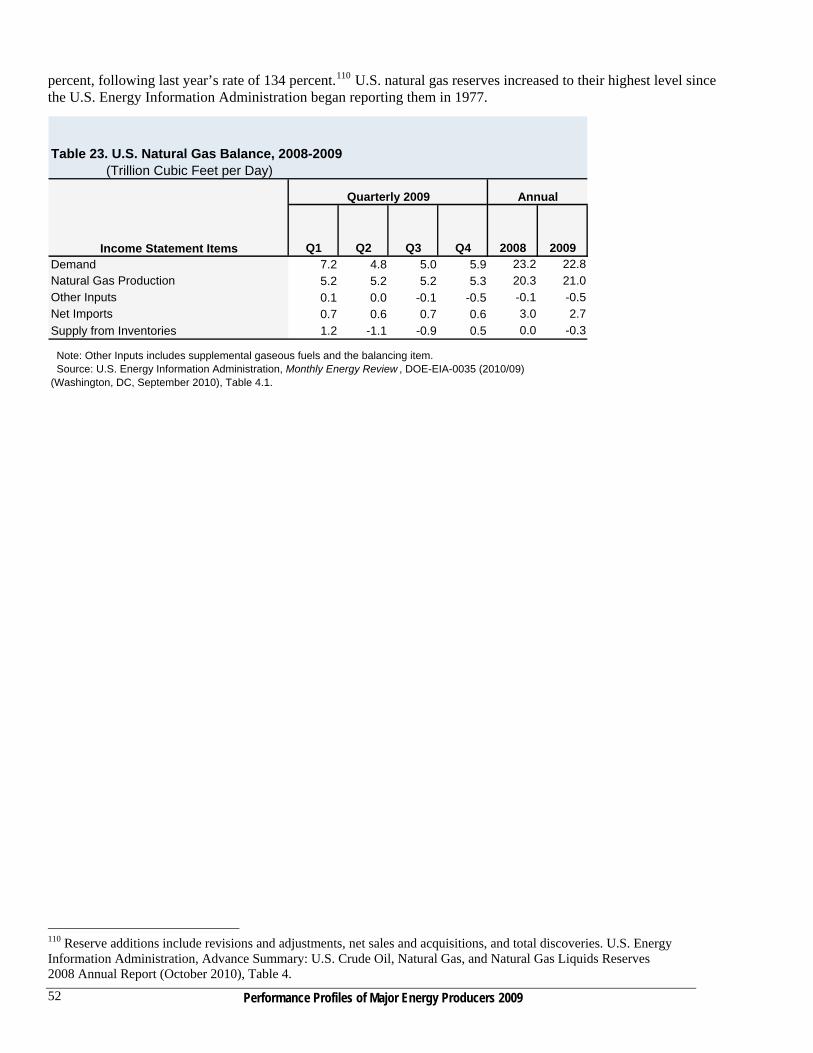
percent, following last year’s rate of 134 percent.110 U.S. natural gas reserves increased to their highest level since the U.S. Energy Information Administration began reporting them in 1977.
Q1 Q2 Q3 Q4 2008 2009Demand 7.2 4.8 5.0 5.9 23.2 22.8Natural Gas Production 5.2 5.2 5.2 5.3 20.3 21.0Other Inputs 0.1 0.0 -0.1 -0.5 -0.1 -0.5Net Imports 0.7 0.6 0.7 0.6 3.0 2.7
Supply from Inventories 1.2 -1.1 -0.9 0.5 0.0 -0.3
Note: Other Inputs includes supplemental gaseous fuels and the balancing item. Source: U.S. Energy Information Administration, Monthly Energy Review , DOE-EIA-0035 (2010/09) (Washington, DC, September 2010), Table 4.1.
Table 23. U.S. Natural Gas Balance, 2008-2009 (Trillion Cubic Feet per Day)
Annual
Income Statement Items
Quarterly 2009
110 Reserve additions include revisions and adjustments, net sales and acquisitions, and total discoveries. U.S. Energy Information Administration, Advance Summary: U.S. Crude Oil, Natural Gas, and Natural Gas Liquids Reserves 2008 Annual Report (October 2010), Table 4.
Performance Profiles of Major Energy Producers 2009 52

Acronyms API American Petroleum Institute boe barrels of oil equivalent Btu British thermal unit DD&A depreciation, depletion, and amortization DOE U.S. Department of Energy E&P exploration and production EIA Energy Information Administration FAS Financial Accounting Standard FRS Financial Reporting System FTP File Transfer Protocol GDP gross domestic product LNG liquefied natural gas mcf thousand cubic feet mmbd million barrels per day mmcf million cubic feet MTBE methyl tertiary butyl ether NGL natural gas liquids OECD Organization for Economic Cooperation and Development OPEC Organization of the Petroleum Exporting Countries P.L. Public Law PP&E property, plant, and equipment ROE return on equity ROI return on net investment in place
Performance Profiles of Major Energy Producers 2009 53

Performance Profiles of Major Energy Producers 2009 54
Performance Profiles of Major Energy Producers 2009
55
Brief Description of Financial Terms
For additional information, see the Glossary, available at
http://www.eia.gov/emeu/perfpro/form/eia28_instructions_2009.pdf. Additions to Investment in Place: See Capital Expenditure. Capital Expenditure: Also referred to as Additions to Investment in Place. Funds (including cash) used by a
company to acquire or upgrade physical assets such as property, industrial buildings, or equipment that are expected to provide benefits for more than just the current year. Additions to property, plant and equipment as well as additions to investments and advances to unconsolidated affiliates are classified as capital expenditures.
Cash Flow From Operations: The amount of cash a company generates from operations, defined as net income
after taxes plus depreciation and other noncash expenses. Current Expenditure: An expenditure that is expected to provide benefit only in the current year and is
classified as an expense in the income statement. Development Expenditures: Costs of developmental wells, facilities and support equipment used to access and
prepare oil and gas deposits for production. Exploration Expenditures: Costs of locating oil and gas deposits, including the costs of retaining and carrying
undeveloped property, geological and geophysical costs, and the costs of drilling and equipping exploratory wells.
Extensions and Discoveries: Reserve additions (see below) that result from the extension of previously
discovered reservoirs or the discovery of new fields or reservoirs. Finding Costs: The per-barrel costs of adding oil or gas proved reserves. Gross Refining Margin: The difference between the revenue from the sale of petroleum products (e.g., motor
gasoline) and the cost of the raw materials (e.g., crude oil) used to produce the products. Improved Recovery: Reserve additions (see below) resulting from the application of improved recovery
techniques. Lifting (Production) Costs: See Production Costs. Lines of Business: The FRS lines of business consist of petroleum, downstream natural gas (including NGL
processing and natural gas pipelines), electric power, nonenergy, and other energy (including coal, nuclear, renewable fuels, and nonconventional fuels). The petroleum line of business is further segmented into production (including oil and natural gas exploration, development, and production), refining/marketing, crude and petroleum product pipelines (for domestic petroleum), and international marine transport (for foreign petroleum).

Performance Profiles of Major Energy Producers 2009 56
Net Income: A company's total earnings, or profit. Net income is calculated by taking revenues less the cost of doing business, depreciation, interest, taxes and other expenses. This number is an important measure of how profitable the company is over a period of time.111
Net Investment In Place: The value of property, plant, and equipment net of depreciation, plus investments and
advances to unconsolidated affiliates. Net Refining Margin: The difference between the gross refining margin and the costs of producing and selling
the petroleum products (e.g., refining energy costs and selling costs). The net margin measures before-tax cash earnings from the production and sale of refined products. The net margin excludes peripheral activities such as non-petroleum product sales at convenience stores.
Production (Lifting) Costs: The per-barrel costs associated with the extraction of a mineral reserve from a
producing property. Production Expenditures: The costs of extracting oil and gas from oil and gas deposits. Profitability: The measure of a company’s or an industry’s net income relative to the equity or capital provided
by its investors. Profitability for the consolidated FRS companies can be measured by return on equity (ROE). Because stockholders’ equity is a corporate concept, the lines of business within the company use return on investment (ROI) as a measure of profitability. Net investment in place consists of the value of property, plant, and equipment net of depreciation, plus investments and advances to unconsolidated affiliates.
Regions: The FRS regions consist of U.S. Onshore, U.S. Offshore, Canada, Europe, Former Soviet Union, Africa,
Middle East, Other Eastern Hemisphere (primarily Asia Pacific), and Other Western Hemisphere (primarily South America).
Reserve Additions: The quantity of oil and gas reserves added each year as a result of exploration and
development activities. Reserve additions are reported in three categories: reserve revisions, improved recovery, and extensions and discoveries.
Reserve Replacement Ratio: The amount of oil and gas reserves added in a year divided by the amount of oil
and gas produced during that same year. Reserve Revisions: Changes (upward or downward) made to previous estimates as a result of new information
obtained from development drilling and production history or from changes in economic factors. Reserves-to-Production Ratio: The number of years that oil and gas reserves would last at the current
production rate.
Return on Equity (ROE): Net income as a percentage of shareholders’ equity. ROE measures performance (i.e, net income) relative to the value of stockholders' equity (retained earnings plus other equity) in the company.
Return on Investment (ROI): Net income divided by net investment in place for that segment. ROI measures
performance relative to the value of investments by the company in property, plant and equipment (PP&E) (long-term capital assets) for a particular business segment or project.
111 See the dictionary on Investopedia.com for additional information. Investopedia.com can be found at http://www.investopedia.com (as of October 20, 2010).

Performance Profiles of Major Energy Producers 2009
57
Special Items: Accounting changes, asset dispositions and write-downs, tax adjustments, and related items that affect net income but are not part of normal operations. Special items are items that are similar to, but do not necessarily qualify as, extraordinary or unusual items under U.S. generally accepted accounting principles. Excluding special items (which to great extent are not reoccurring) from annual net income is a standard practice to attempt to give a clearer picture of a company’s ongoing operations for any particular year.

Performance Profiles of Major Energy Producers 2009 58

