performance recovery plan guidelines
TRANSCRIPT

Recovery Plan Guidelines

2
© Department of Health, State of Western Australia (2019). Copyright to this material is vested in the State of Western Australia unless otherwise indicated. Apart from any fair dealing for the purposes of private study, research, criticism or review, as permitted under the provisions of the Copyright Act 1968, no part may be reproduced or re-used for any purposes whatsoever without written permission of the State of Western Australia. Important Disclaimer: All information and content in this Material is provided in good faith by the WA Department of Health, and is based on sources believed to be reliable and accurate at the time of development. The State of Western Australia, the WA Department of Health and their respective officers, employees and agents, do not accept legal liability or responsibility for the Material, or any consequences arising from its use. Owner: Department of Health, Western Australia
Contact: Information and System Performance Directorate
Approved by: Rob Anderson, A/Assistant Director General, Purchasing and System Performance
Approval Date: 19 June 2019
Current Version: 3.0
Links to: Performance Policy Framework and Performance Management Policy
https://ww2.health.wa.gov.au/About-us/Policy-frameworks/Performance
VERSION DATE AUTHOR COMMENTS
3.0 1 July 2019 Anthony Jones Approved by the A/Assistant Director General, Purchasing and System Performance

3
Contents
Acronyms ................................................................................................................................... 4
1 Introduction ......................................................................................................................... 5
2 Recovery plan ..................................................................................................................... 6
2.1 Remediation process .................................................................................................... 6
2.2 Aim and objectives ....................................................................................................... 7
2.3 Performance concerns and strategies ........................................................................ 8
2.3.1 Research literature reviews ...................................................................................... 8
2.3.2 Root cause analysis ................................................................................................. 8
2.3.3 Data analysis ............................................................................................................ 9
2.3.3.1 Data analysis tools ............................................................................................. 9
2.3.3.2 Descriptive measures ........................................................................................ 9
2.3.3.3 Correlation coefficients ...................................................................................... 9
2.3.3.4 Hypothesis testing ........................................................................................... 11
2.3.3.5 Parametric and non parametric tests ............................................................... 11
2.3.3.6 Predictive models ............................................................................................ 12
2.3.3.7 Comparative benchmarking ............................................................................. 12
2.4 Governance ................................................................................................................. 14
2.5 Communication plan .................................................................................................. 14
2.6 Implementation ........................................................................................................... 15
2.6.1 Structure and resources ......................................................................................... 15
2.6.2 Project plan ............................................................................................................ 15
2.6.3 Risk identification and mitigation strategies ............................................................ 16
2.6.4 Progress reporting and monitoring ......................................................................... 16
2.7 Transition plan ............................................................................................................ 17
2.8 Checklist ...................................................................................................................... 18
3 Conclusion ........................................................................................................................ 19
4 Glossary of terms ............................................................................................................. 20
Appendix 1 – Recovery Plan Template .................................................................................. 22

4
Acronyms CAHS Child and Adolescent Health Service
CE Chief Executive
DG Director General
ED Emergency Department
EMHS East Metropolitan Health Service
HSP Health Service Provider
HSPR Health Service Performance Report
HSS Health Support Services
NMHS North Metropolitan Health Service
PMP Performance Management Policy
RACI Responsible, Accountable, Consulted, Informed
SMHS South Metropolitan Health Service
WA Western Australia
WACHS WA Country Health Service
5
1 Introduction Policy Frameworks have been established in accordance with Sections 26 and 27 of the Health Services Act 2016 and are binding on Health Service Providers. The Performance Policy Framework has been developed to enable the Department of Health, led by the Director General as the System Manager, to undertake effective system performance management. The Performance Management Policy (PMP) is a mandatory policy in the Performance Policy Framework and includes performance reporting, monitoring, evaluation, management and intervention policy. The performance indicators, targets and thresholds which support the delivery of the Service Agreement operational targets are listed in the PMP and are reported in the Health Service Performance Report (HSPR). Performance review meetings are a key element in the PMP. Performance review meetings are held regularly between the Department, as the System Manager, and each Health Service Provider. The frequency of performance review meetings is dependent on Health Service Provider performance. The PMP has adopted a responsive regulation intervention model. The model is a collaborative approach that enables accountability through agreed mechanisms that are responsive when performance issues are identified. As outlined in the PMP, if performance concerns arise the System Manager determines whether a formal recovery plan is required. The System Manager also determines the timeframe in which the recovery plan is required. The PMP mandates that the recovery plan must be endorsed by the Health Service Provider Board prior to approval by the System Manager. In the current governance model, it is the role of the Health Service Provider to understand their operational and service delivery models and to remediate any performance concern that is identified by the System Manager. The Recovery Plan Guidelines assist Health Service Providers to develop a recovery plan, if required. The guidelines are a supporting document in the PMP and are not mandated.

6
2 Recovery plan 2.1 Remediation process
When a recovery plan is required to address a performance concern it is imperative that the drivers that led to the performance concern are clearly understood. Without this clear understanding, strategies that are identified may not address the performance concern.
As illustrated in Figure 1 below, the remediation of a performance concern not only requires a good understanding of the root causes and the identification of appropriate strategies but also requires appropriate governance structures and a comprehensive implementation plan to support the effective implementation of the solutions.
Figure 1: Performance concern remediation process
Investigate the root cause
of the performance
concern
Research, develop and
evalulate potential solutions
Establish the governance for solutions
to be implement
Develop a robust
recovery plan
Implement the recovery
plan
Evaluate the plan's
progress and adjust as required
Embed the solutions into
business as usual
Performance concern
remediated
Performance concern
remediation process
7
2.2 Aim and objectives
The aim of a recovery plan is to identify strategies that will be implemented to remediate the performance concern.
The recovery plan’s key objectives are to:
• Identify the root causes and primary drivers of the performance concern.
• Develop evidence-based strategies to address the root causes and primary drivers of the performance concern.
• Establish governance structures to oversee the implementation of the recovery plan strategies.
• Produce a communication plan so that all stakeholders are aware of the recovery plan and their roles, responsibilities and accountabilities.
• Ascertain the structures and resources required to implement the recovery plan.
• Build a detailed implementation plan that includes the strategies and actions, timeframes, personnel, and resources to implement the recovery plan.
• Detail the risk identification and assessment processes to monitor and mitigate implementation risks.
• Define the implementation progress formats, content and performance measures that will be monitored to assess the implementation progress and success.
• Determine the implementation progress reporting mechanisms and processes.
• Specify the frequency of implementation progress reporting and the performance measures that will be provided to the System Manager.
• Design and designate the structures, processes and controls that will be adopted to ensure the implemented strategies become embedded into business as usual.
A recovery plan enables stakeholders to understand how a performance concern will be remediated.

8
2.3 Performance concerns and strategies
Each performance concern is unique. The root causes and primary drivers that led to the performance concern may not be fully understood. In these circumstances, investigations are required.
Similarly, when the root causes and primary drivers of the performance concern are identified the strategies are often not self-evident. Robust investigation and research is required to identify evidence-based solutions to remediate the performance concern. For clinical service related performance concerns the WA Health Clinical Service Redesign Handbook is a resource available to all WA health system staff to assist in the review and redesign of clinical services.
2.3.1 Research literature reviews
A review of the research literature can provide insight into potential drivers of a performance concern. Similarly, a review can also identify potential evidence-based solutions.
The WA Health Libraries Network offers all staff access to a range of library services including literature searches. A list of the full range of library services is available via the WA Health Libraries Network information hub.
2.3.2 Root cause analysis
There are a large number of root cause methodologies that try to recognise the root cause of a fault or problem.1 The fishbone analysis in Figure 2 highlights one of several methodologies that could be applied to brainstorm and identify the potential root causes of a performance concern. Figure 2: Fishbone analysis
A root cause analysis could be utilised to investigate a performance concern. Once a suspected root cause is identified further more robust investigations such as data analysis is required.
Effect
Design/Facilities
Systems/Monitoring
Processes
People
Why
Cause

9
2.3.3 Data analysis
The role of data analysis is to transform, investigate, examine and model data to discover useful information.2 There is a very broad range of statistical and analytical techniques available. The key goal of data analysis in a recovery plan setting is to provide stakeholders with information that:
• offers insight into the root causes and primary drivers
• enables strategies to be identified
• assists progress to be monitored
• monitors and assesses the effectiveness of the strategies being implemented.
The analytical and statistical methodologies included in this document are by no means exhaustive. The methodologies are provided as suggestions that could prove useful for recovery plan related circumstances such as testing the veracity of a suspected root cause or investigating the effectiveness of a strategy.
Data analysis undertaken for the recovery plan should endeavour to apply the general scientific principle of Occam’s Razor3 in which the simplest method is adopted unless another more complex method provides greater insight.
2.3.3.1 Data analysis tools There is a plethora of data analysis applications and tools available. A wide range of applications and tools are used within the WA health system to undertake data analysis.
2.3.3.2 Descriptive measures The descriptive measures utilised in the recovery plan need to be appropriate for each stage of the performance concern remediation process. Typically, the descriptive measures in the recovery plan are likely to include counts, sums, percentages, rates, proportions and/or averages as well as correlations and confidence intervals.
2.3.3.3 Correlation coefficients Correlation coefficients are a group of statistical measures that establish a statistical relationship between two sets of variables. Correlation coefficients vary from -1 to 1 where -1 is a perfect negative correlation and 1 is a perfect positive correlation. An example of a positive correlation coefficient is the number of inpatient activities purchased and the number of inpatient activities provided.

10
Figure 3 demonstrates the different types of correlations that can exist between two variables. Figure 3: Example correlation coefficients
There are many types of correlation coefficients such as the Pearson Product-Moment Correlation Coefficient and the Spearman Rho Correlation Coefficient. The appropriate correlation coefficient to use depends on the type of data. It is also important that the underlying assumptions of the correlation coefficient employed are tested to ensure the results are reliable.5 Although correlations, in themselves, do not establish causal links between two sets of variables they do establish the existence of a relationship.4,5 The reason for the relationship between variables may be causal but equally it may be the result of an unknown factor that influences both variables.6 A correlation matrix is a table that provides correlation coefficients for all datasets within a group. A correlation matrix may be a useful tool to better understand the relationships between variables that could be directly or indirectly related to the performance concern.
Negative correlation No correlation Positive correlation

11
2.3.3.4 Hypothesis testing Hypothesis testing is a statistical procedure that is designed to test a claim.7 In the case of a recovery plan, hypothesis testing could be undertaken to verify a suspected root cause.
2.3.3.5 Parametric and non parametric tests Parametric and non parametric tests are a suite of statistical tests that enable a hypothesis to be tested.8 The appropriate application of a parametric test depends on the type and number of datasets being tested. Parametric tests have a larger number of assumptions than non parametric tests. If the assumptions are valid, the parametric test is more powerful.8 If key assumptions of a parametric test are not met the results can be misleading. In these instances the equivalent non parametric test should be considered. For a non parametric test to be valid several assumptions must also be met although they do not have the population distribution assumptions of the parametric tests.8 Figure 4 provides a schematic illustration of the application of parametric and non parametric tests using a simplified example. Figure 4: The application of parametric and non parametric testing
A statement of claim to be tested Hypothesis
There is a suspicion that inadequate x-ray services are the cause of longer stays in ED for triage 4 patients.
Root cause suspicion
Null hypothesis - there is no difference in the length of ED stays between triage 4 patients requiring x-ray services and not requiring x-ray services.
Hypothesis testing
Two sample t-test - upon investigation, it is established that the distribution assumptions of the two sample t-test are not valid.
Parametric test
Non parametric test
Mann-Whitney U test - assumptions are validated.
Both the parametric and non parametric tests determine the probability of recording the observed values on the basis that there is no difference between the two groups.
If the probability of recording the observed values is less than five percent it is concluded that the observed differences between the two patient groups is statistically significant. In this instance the null hypothesis, that there is no difference between the groups, is rejected and the alternative hypothesis, that there is a difference between the groups, is accepted.
Conclusion
Results
12
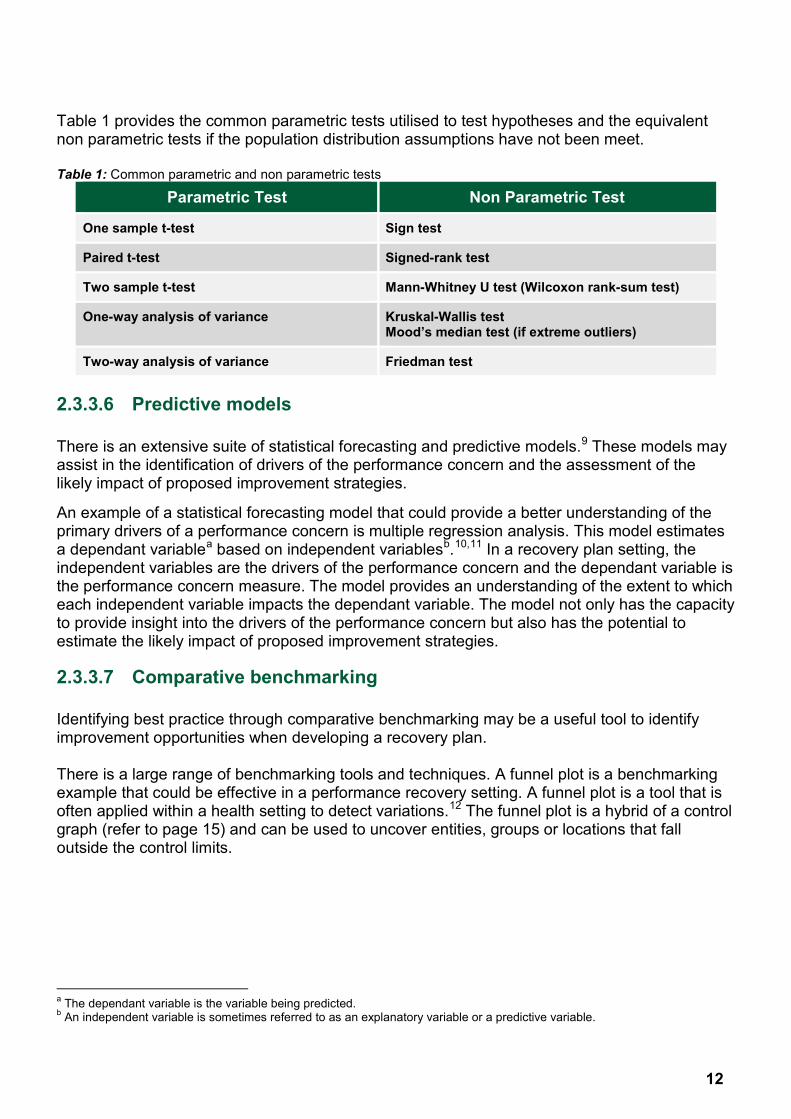
Table 1 provides the common parametric tests utilised to test hypotheses and the equivalent non parametric tests if the population distribution assumptions have not been meet. Table 1: Common parametric and non parametric tests
Parametric Test
Non Parametric Test
One sample t-test
Sign test
Paired t-test
Signed-rank test
Two sample t-test
Mann-Whitney U test (Wilcoxon rank-sum test)
One-way analysis of variance
Kruskal-Wallis test Mood’s median test (if extreme outliers)
Two-way analysis of variance
Friedman test
2.3.3.6 Predictive models There is an extensive suite of statistical forecasting and predictive models.9 These models may assist in the identification of drivers of the performance concern and the assessment of the likely impact of proposed improvement strategies.
An example of a statistical forecasting model that could provide a better understanding of the primary drivers of a performance concern is multiple regression analysis. This model estimates a dependant variablea based on independent variablesb.10,11 In a recovery plan setting, the independent variables are the drivers of the performance concern and the dependant variable is the performance concern measure. The model provides an understanding of the extent to which each independent variable impacts the dependant variable. The model not only has the capacity to provide insight into the drivers of the performance concern but also has the potential to estimate the likely impact of proposed improvement strategies.
2.3.3.7 Comparative benchmarking
Identifying best practice through comparative benchmarking may be a useful tool to identify improvement opportunities when developing a recovery plan. There is a large range of benchmarking tools and techniques. A funnel plot is a benchmarking example that could be effective in a performance recovery setting. A funnel plot is a tool that is often applied within a health setting to detect variations.12 The funnel plot is a hybrid of a control graph (refer to page 15) and can be used to uncover entities, groups or locations that fall outside the control limits.
a The dependant variable is the variable being predicted. b An independent variable is sometimes referred to as an explanatory variable or a predictive variable.
13
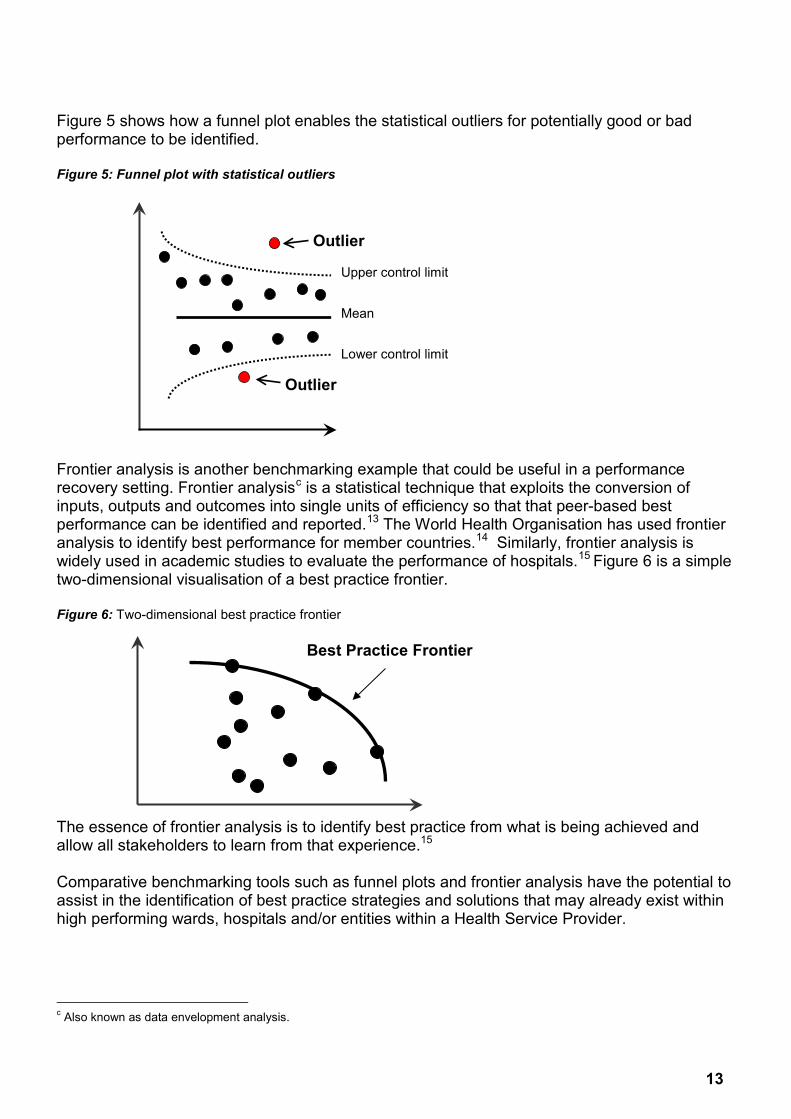
Figure 5 shows how a funnel plot enables the statistical outliers for potentially good or bad performance to be identified. Figure 5: Funnel plot with statistical outliers
Frontier analysis is another benchmarking example that could be useful in a performance recovery setting. Frontier analysisc is a statistical technique that exploits the conversion of inputs, outputs and outcomes into single units of efficiency so that that peer-based best performance can be identified and reported.13 The World Health Organisation has used frontier analysis to identify best performance for member countries.14 Similarly, frontier analysis is widely used in academic studies to evaluate the performance of hospitals.15 Figure 6 is a simple two-dimensional visualisation of a best practice frontier. Figure 6: Two-dimensional best practice frontier
The essence of frontier analysis is to identify best practice from what is being achieved and allow all stakeholders to learn from that experience.15 Comparative benchmarking tools such as funnel plots and frontier analysis have the potential to assist in the identification of best practice strategies and solutions that may already exist within high performing wards, hospitals and/or entities within a Health Service Provider.
c Also known as data envelopment analysis.
Best Practice Frontier
Outlier
Upper control limit
Lower control limit
Mean
Outlier

14
2.4 Governance
A governance structure and systems are essential to provide oversight to diagnosis, design, measure, analyse and develop solutions to support the successful implementation of a recovery plan. Figure 7 highlights four attributes that support good governance within a recovery plan setting.
Figure 7: Governance attributes
It is important that the recovery plan identifies the key governance roles, responsibilities, procedures and processes.
The required governance structure and systems will depend on the performance concern. For some performance concerns, an appropriate governance structure and systems may already exist. In other circumstances, the governance structure and systems may need to be established.
2.5 Communication plan
A communication plan is required to ensure all stakeholders are aware of the recovery plan and their roles, responsibilities and accountabilities. The communication plan should document the communication objectives, responsibilities, recipients/audiences, deliverables, delivery formats, methods and frequencies.
Governance attributes
Responsive
Transparent
Effective
Acountable

15
A RACI could also be considered as part of the communication plan. A RACI is a matrix that reduces confusion by defining:
• who is responsible for completing the task
• who is accountable for decisions and approvals
• who will be consulted
• who will be informed.
Table 2 provides an example of a simple RACI.
Table 2: RACI example Tasks Roles
Analyst Manager Director CE DG Analysis data R A C Develop report R A I I Publish report I I R I A Legend – Responsible (R), Accountable (A), Consulted (C), Informed (I)
2.6 Implementation
There is a broad spectrum of project management methodologies and tools that can be adopted to implement strategies and actions to achieve set goals. Project management expertise, tools and/or templates are available via the information hubs for the HSS Program Management Office, SMHS Program Management Office, CAHS Program Management Office, EMHS Program Management Office, NMHS Program Management Office and WACHS Planning and Evaluation Unit.
2.6.1 Structure and resources
The structures and resources that will be utilised to implement the recovery plan needs to be identified. Details on project teams and working groupings as well as their roles, responsibilities and implementation accountabilities need to be established and articulated in the recovery plan.
2.6.2 Project plan
A project plan enables stakeholders to understand why, how and when the recovery plan strategies will be implemented. Typically, a project plan should include the context, objectives, change drivers, strategies, timelines, resources, key dependencies and project milestones. A detailed project plan should also be included in the recovery plan so that the planned strategies and actions, the anticipated timeframes, allocated resources and personnel responsibilities are clear to all stakeholders.
16
2.6.3 Risk identification and mitigation strategies
The risk identification processes and assessments as well as the monitoring processes and mitigation strategies are key elements to the successful implementation of a recovery plan. It is critical that the recovery plan includes this information. The risk management practices adopted in the recovery plan should be consistent with the WA Health Risk Management Policy.
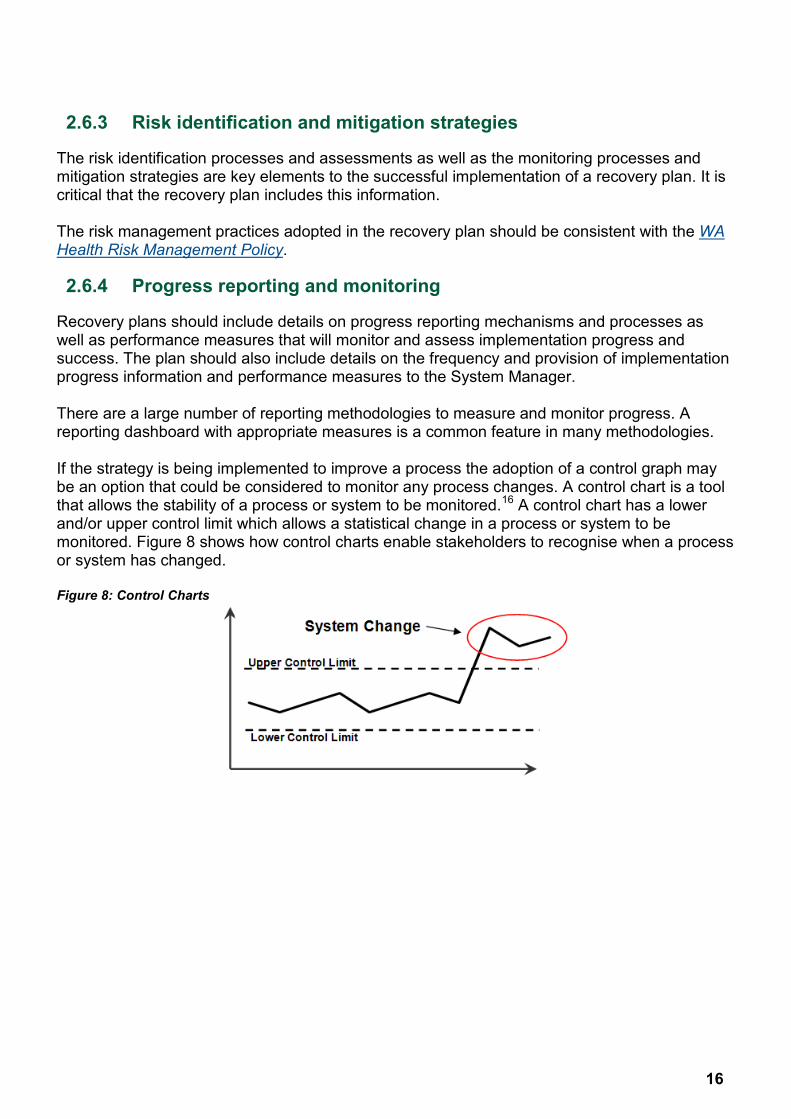
2.6.4 Progress reporting and monitoring
Recovery plans should include details on progress reporting mechanisms and processes as well as performance measures that will monitor and assess implementation progress and success. The plan should also include details on the frequency and provision of implementation progress information and performance measures to the System Manager. There are a large number of reporting methodologies to measure and monitor progress. A reporting dashboard with appropriate measures is a common feature in many methodologies. If the strategy is being implemented to improve a process the adoption of a control graph may be an option that could be considered to monitor any process changes. A control chart is a tool that allows the stability of a process or system to be monitored.16 A control chart has a lower and/or upper control limit which allows a statistical change in a process or system to be monitored. Figure 8 shows how control charts enable stakeholders to recognise when a process or system has changed. Figure 8: Control Charts

17
2.7 Transition plan
The inclusion of a transition plan in the recovery plan ensures the performance remediation strategies are embedded into business as usual. Without an effective transition plan, performance recovery may not be sustained.
As illustrated in Figure 9 the key transition stages are to plan, execute, monitor, adjust and maintain. These stages support the ongoing success of strategies beyond the recovery plan’s implementation.
Figure 9: Key Transition Stages
It is critical that the transition plan identifies and includes the structures, responsibilities, processes, risks and controls that will be adopted to ensure the implemented changes are operationalised into business as usual.
The transition plan should also identify all actions required to embed the changes as well as the resources, personnel and timeframes.
Plan
Implement
Monitor
Adjust
Maintain

18
2.8 Checklist
The checklist in Table 3 below can be utilised to ensure all key recovery plan components are considered.
Table 3: Recovery plan checklist Key components Checked
Overview and history of performance concern documented
Performance analysed
Root cause and primary drivers identified
Evidence-based strategies to address root causes and primary drivers developed
Governance structures identified and/or established
Communication plan that details roles, responsibilities and accountabilities produced
Structures and resources required to implement recovery plan strategies identified
Detailed implementation plan developed
Risk identification and assessment process established
Implementation progress reporting formats, content and performance measures defined
Implementation progress reporting mechanisms and processes determined
Frequency of performance measures and implementation progress reporting to System Manager specified
Structure, processes and controls to embed strategies into business as usual designed and designated
19
3 Conclusion Each performance concern is unique. The recovery plan provides stakeholders a clear understanding of the evidence-based strategies to be implemented to address the identified root causes and primary drivers of the performance concern. The recovery plan also details the governance, communication, risk mitigation, implementation and transition plans to support performance recovery.
The implementation of the plan is assessed and monitored via the performance review meetings and the agreed recovery plan reporting mechanisms. If the strategies are not improving performance, a review of the recovery plan may be required. The review should include a detailed examination of all aspects of the recovery plan to determine why recovery is not being realised.
It is important to recognise that the success of a recovery plan is the remediation of the performance concern and not the extent to which the recovery plan is implemented.
It also needs to be acknowledged that the success of the recovery plan is a measure of the Health Service Provider’s capacity and capability to address the performance concern.
As outlined in the Performance Management Policy, the System Manager has the discretion to escalate or de-escalate concerns to higher or lower levels of intervention based on an assessment of performance. A recovery plan that fails may result in an intervention level escalation.
The Recovery Plan Guidelines are a supporting document in the Performance Management Policy. They offer Health Service Providers a toolkit to develop recovery plans. The guidelines are not mandatory.
It is the Health Service Provider’s role and responsibility to determine if any of the guideline modules are relevant for the performance concern being addressed.

20
4 Glossary of terms Analysis is a process of dissecting complex themes into smaller parts in an effort to gain insight. Alternative hypothesis is a scientific term that describes the alternative statement to the null hypothesis. If the null hypothesis is rejected then the alternative hypothesis is accepted. Refer to the null hypothesis for further details. Benchmarking involves the collection of performance information to undertake comparisons of performance with similar functions, areas or organisations. Confidence interval is a statistical term which refers to a lower and upper estimate of an unknown population parameter. Control limit is a statistical term that refers to the upper and lower limit of a system that is considered stable. Correlation coefficients are a group of statistical measures to establish statistical relationships between population parameters. Correlation matrix is a table of correlation coefficients for a given number of population parameters. Dataset is a collection of related data records. Datasets provide the raw information required to measure performance. Descriptive measures quantitatively describe a dataset. Dependent variable is a statistical term to define the variable being predicted by one or more independent variables. Frontier analysis is a statistical technique that establishes peer-based best practice efficiencies. Frontier analysis is also known as data envelopment analysis. Hypothesis testing is a statistical procedure designed to accept or reject a claim. Independent variable is a statistical term to define the variable(s) that is predicting a dependant variable. Governance refers to the system by which entities or projects are directed and controlled. This encompasses the processes, procedures and systems that have been put into place to ensure the entity or project is managed appropriately.
Multiple regression analysis is a set of statistical models that estimate a dependant variable based on independent variables.
21
Non parametric tests are a group of statistical tests that can be used to test a hypothesis. These tests do not have population distribution assumptions. Null hypothesis is a scientific statement that there is no difference between groups or no observed treatment effect. Parametric tests are a group of statistical tests that can be used to test a hypothesis. These tests have population distribution assumptions. Performance management is the management and governance system that regulates and addresses poor performance. Root cause analysis is a group of methodologies designed to recognise the root cause of a problem or fault.

22
Appendix 1 – Recovery Plan Template The Recovery Plan Template is available, in a word document, to Health Service Providers upon request to: [email protected].
23
References 1 Department of Health. (2013). WA Health Clinical Service Redesign Handbook – A
Training Guide, Health System Improvement Unit, Department of Health, Perth. 2 WiseGEEK (webpage). Available from: http://www.wisegeek.com/what-is-data-
analysis.htm#slideshow 3 University of California Riverside (webpage). Available from:
http://math.ucr.edu/home/baez/physics/General/occam.html 4 Holland, P. W. (1986). ‘Statistics and Causal Inference’, Journal of the American Statistical
Association, Vol.81, No. 396, pp945-960. 5 Higgins, J. (2006). The Radical Statistician, 5th Edition. Jim Higgins Publishing, California,
USA. 6 WhatIs.com (webpage). Available from: http://whatis.techtarget.com/definition/correlation 7 Rumsey, D. (2010). Statistics Essentials for Dummies, John Wiley and Sons, Hoboken,
New Jersey, USA. 8 Dunn, O. J., Clark, V. A. (2006). Basic Statistics – A Primer for the Biomedical Sciences.
John Wiley and Sons, Hoboken, New Jersey, USA. 9 Abraham, B., Ledolter, J. (1983). Statistical Methods for Forecasting, John Wiley and
Sons, Hoboken, New Jersey, USA. 10 Simon, G. (2003). Multiple Regression Basics, Stern School of Business, New York
University, New York, USA. 11 Cohen, J., Cohen, P., West, S. G., Aiken, L. S. (2003). Applied Multiple
Regression/Correlation Analysis for Behavioral Sciences Third Edition, Lawrence Erlbaum Associates, Mahwah, New Jersey, USA.
12 Matthews, D. E., Farewell, V. T. (2015). Using and Understanding Medical Statistics – 5th
Edition, Karger, Basel, Switzerland. 13 Greene, W. (2003). ‘Distinguishing between Heterogeneity and Inefficiency: Stochastic
Frontier Analysis of the World Health Organization’s Panel Data on National Health Care Systems’, Stern School of Business, New York University, New York, USA.
14 Hurst, J. and Jee-Hughes, M. (2001). ‘Performance Measurement and Performance
Management in OECD Health Systems’, OECD Labour Market and Social Policy Occasional Papers, No. 47, OECD Publishing.

24
15 Knox Lovell, C. A. (2006). ‘Frontier Analysis in Health Care’, International Journal of
Healthcare Technology and Management, Vol.7, No. 1/2, pp5-14. 16 Xie, M., Goh, T. N., Kuralmani, V. (2002). Statistical Models and Control Charts for High
Quality Processes, Kluwer Academic Publishers, Norwell, Massachusetts, USA.

This document can be made available in alternative formats on request for a person with a disability.
© Department of Health 2019
Copyright to this material is vested in the State of Western Australia unless otherwise indicated. Apart from any fair dealing for the purposes of private study, research, criticism or review, as permitted under the provisions of the Copyright Act 1968, no part may be reproduced or re-used for any purposes whatsoever without written permission of the State of Western Australia.