performance report 2012 - donatelife.gov.au · pathway. in 2012, there was a 10% increase in...
TRANSCRIPT
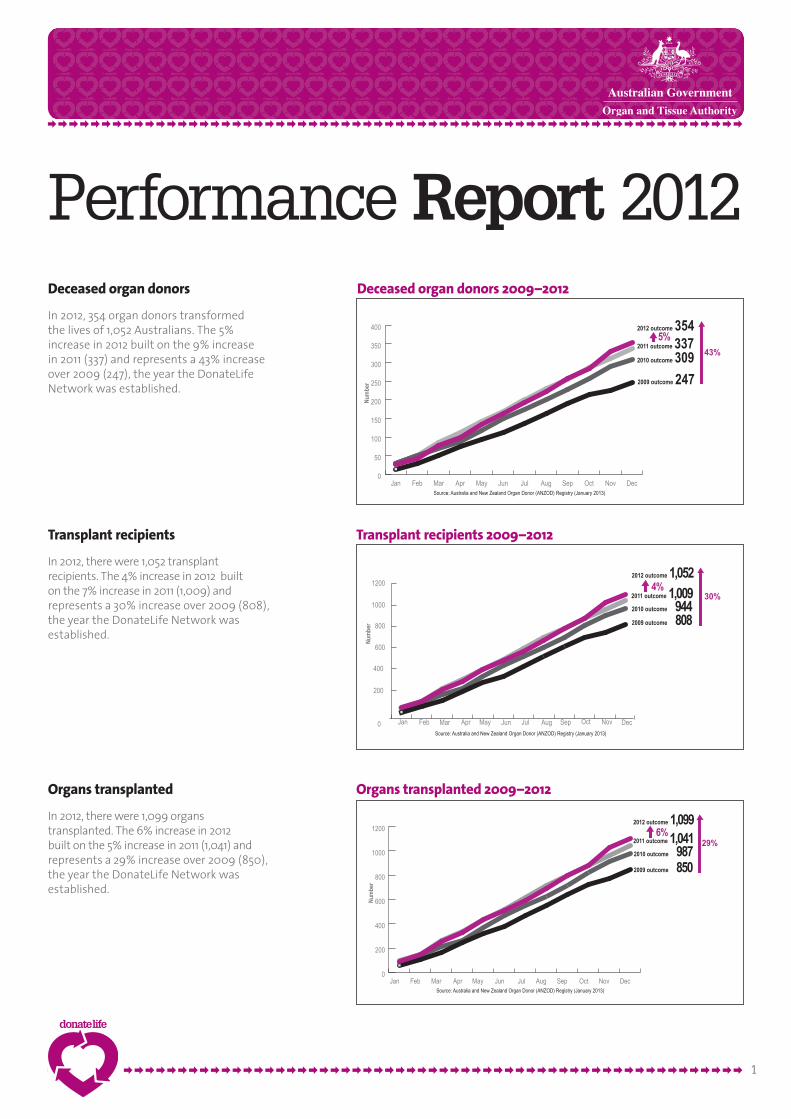
Deceased organ donors
In 2012, 354 organ donors transformed the lives of 1,052 Australians. The 5% increase in 2012 built on the 9% increase in 2011 (337) and represents a 43% increase over 2009 (247), the year the DonateLife Network was established.
Transplant recipients
In 2012, there were 1,052 transplant recipients. The 4% increase in 2012 built on the 7% increase in 2011 (1,009) and represents a 30% increase over 2009 (808), the year the DonateLife Network was established.
Organs transplanted
In 2012, there were 1,099 organs transplanted. The 6% increase in 2012 built on the 5% increase in 2011 (1,041) and represents a 29% increase over 2009 (850), the year the DonateLife Network was established.
2010 outcome 3092009 outcome 247
2011 outcome 3372012 outcome 354
0
50
100
150
200
250
300
350
400
DecNovOctSepAugJulJunMayAprMarFebJan
Deceased organ donors to end December 2011
Source: Australia and New Zealand Organ Donor (ANZOD) Registry (January 2013)
Num
ber
43%5%
2009 outcome 808
2011 outcome 1,0092012 outcome 1,052
0
200
400
600
800
1000
1200
Transplant recipients to end December 2011
Source: Australia and New Zealand Organ Donor (ANZOD) Registry (January 2013)
Num
ber
30%4%
DecNovOctSepAugJulJunMayAprMarFebJan
2010 outcome 944
2010 outcome 9872009 outcome 850
2011 outcome 1,0412012 outcome 1,099
0
200
400
600
800
1000
1200
DecNovOctSepAugJulJunMayAprMarFebJan
Organs transplanted to end December 2011
Source: Australia and New Zealand Organ Donor (ANZOD) Registry (January 2013)
Num
ber
29%6%
Deceased organ donors 2009–2012
Transplant recipients 2009–2012
Organs transplanted 2009–2012
Performance Report 2012
1
For more information visit www.donatelife.gov.auOrgan and Tissue AuthorityLevel 6, 221 London Circuit Canberra ACT 2600PO Box 295 Civic Square ACT 2608Telephone 02 6198 9800 Facsimile 02 6198 9801
Performance report 2012
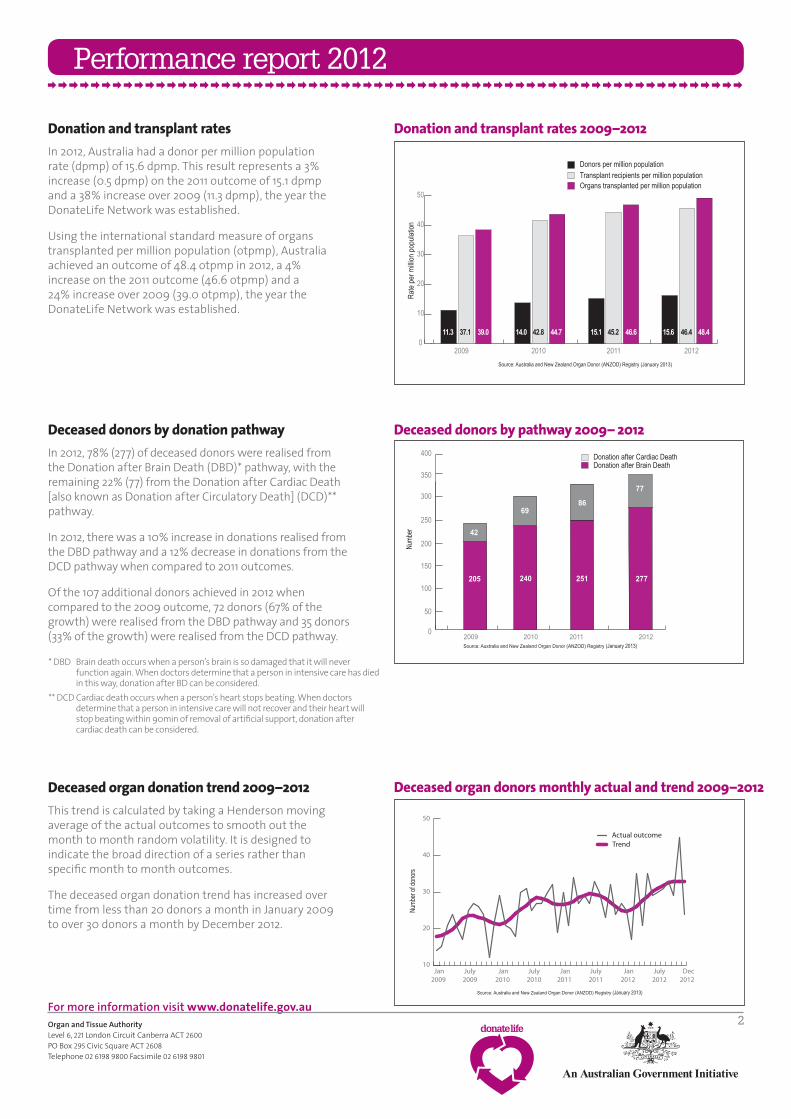
Donation and transplant rates In 2012, Australia had a donor per million population rate (dpmp) of 15.6 dpmp. This result represents a 3% increase (0.5 dpmp) on the 2011 outcome of 15.1 dpmp and a 38% increase over 2009 (11.3 dpmp), the year the DonateLife Network was established.
Using the international standard measure of organs transplanted per million population (otpmp), Australia achieved an outcome of 48.4 otpmp in 2012, a 4% increase on the 2011 outcome (46.6 otpmp) and a 24% increase over 2009 (39.0 otpmp), the year the DonateLife Network was established.
0
10
20
30
40
50Organs transplanted per million populationTransplant recipients per million populationDonors per million population
15.6 48.446.411.3 39.037.1 14.0 44.742.8 15.1 46.645.2
2009 2010 2011 2012
Rate
per m
illion
popu
lation
Source: Australia and New Zealand Organ Donor (ANZOD) Registry (January 2013)
Donation and transplant rates 2009–2012
2
Deceased donors by donation pathway In 2012, 78% (277) of deceased donors were realised from the Donation after Brain Death (DBD)* pathway, with the remaining 22% (77) from the Donation after Cardiac Death [also known as Donation after Circulatory Death] (DCD)** pathway.
In 2012, there was a 10% increase in donations realised from the DBD pathway and a 12% decrease in donations from the DCD pathway when compared to 2011 outcomes.
Of the 107 additional donors achieved in 2012 when compared to the 2009 outcome, 72 donors (67% of the growth) were realised from the DBD pathway and 35 donors (33% of the growth) were realised from the DCD pathway. 0
50
100
150
200
250
350
400
300
Source: Australia and New Zealand Organ Donor (ANZOD) Registry (January 2013)
Numb
er
Donation after Cardiac DeathDonation after Brain Death
2009 2010 2011 2012 2012
251 277
86
77
205 240
69
42
Deceased donors by pathway 2009– 2012
Deceased organ donation trend 2009–2012 This trend is calculated by taking a Henderson moving average of the actual outcomes to smooth out the month to month random volatility. It is designed to indicate the broad direction of a series rather than specific month to month outcomes.
The deceased organ donation trend has increased over time from less than 20 donors a month in January 2009 to over 30 donors a month by December 2012.
10
20
30
40
50
Actual outcomeTrend
Jan 2009
July 2009
Jan 2010
July 2010
Jan 2011
July 2011
Jan 2012
July 2012
Dec2012
Numb
er of
dono
rs
Source: Australia and New Zealand Organ Donor (ANZOD) Registry (January 2013)
Deceased organ donors monthly actual and trend 2009–2012
* DBD Brain death occurs when a person’s brain is so damaged that it will never function again. When doctors determine that a person in intensive care has died in this way, donation after BD can be considered.
** DCD Cardiac death occurs when a person’s heart stops beating. When doctors determine that a person in intensive care will not recover and their heart will stop beating within 90min of removal of artificial support, donation after cardiac death can be considered.

For more information visit www.donatelife.gov.auOrgan and Tissue AuthorityLevel 6, 221 London Circuit Canberra ACT 2600PO Box 295 Civic Square ACT 2608Telephone 02 6198 9800 Facsimile 02 6198 9801
Performance report 2012
3
Eye donors and corneal transplants Provisional outcomes from the Eye Bank Association of Australia and New Zealand, indicate that in 2012, 1,169 eye donors enabled 1,942 corneal transplants. This represents an 8% increase in eye donors and a 13% increase in corneal transplants over 2011 (1,083 donors and 1,716 transplants respectively).
The 2012 outcomes represent a 27% increase in eye donations and a 32% increase in corneal transplants over 2009 (922 donors and 1,467 transplants respectively).
500
1000
1500
2000
Source: Eye Bank Association of Australia and New Zealand (January 2013)
Numb
er
Corneal transplantsEye donors
2009 2010 2011 2012
1,716 1,9421,467
922 957
1,510
1,083 1,169
Eye donors and corneal transplants 2009– 2012
Organs transplanted from deceased donors Kidneys are the most predominant organ donated and transplanted. In 2012, 606 kidneys were transplanted from deceased organ donors. This was 6% higher than the outcome in 2011 (570), and 36% higher than in 2009 (446) the year the DonateLife Network was established.
In 2012 there were also four combined heart/lung transplants and one intestinal transplant. These transplants have not been represented graphically due to the relative numbers when compared with other types of organ transplants.
0
200
400
600
800
1000
1200
Pancreas (including islets)LungHeartLiverKidney
2009 2010 2011 2012Source: Australia and New Zealand Organ Donor (ANZOD) Registry (January 2013)
446
185
5911246
4635
42
120157
144
548
204
65
570
213
64
606
230
72
Organs transplanted from deceased donors 2009– 2012
International comparisonIt is not possible to draw direct comparisons between countries in terms of their progress in organ donation reform, as there are many differences between health care systems, population size, community attitudes and the relative starting points for national organ and tissue donation reform.
The key lesson to learn from leading countries is that reform of organ and tissue donation is an incremental process that takes time as national systems are developed and hospital based clinical practice is reformed.
0
5
10
15
20
25
30
35
40Im
pleme
ntatio
nYe
ar
Year
1
Year
2
Year
3
Year
4
Year
5
Year
6
Source: Australia and New Zealand Organ Donor (ANZOD) Registry, International Registry of Organ Donation and Transplantation IRODAT January 2013
Year
7
Year
8
Year
9
Year
10
Year
11
Year
12
Year
13
Year
14
Year
15
Year
16
Year
17
Year
18
Year
19
Year
20
Year
21
Country (date of first full year after implementation)dpm
p
Australia (2010)Portugal (2008)Spain (1991)UK (2009)Croatia (2001)
Full years following implementation
International comparison

For more information visit www.donatelife.gov.auOrgan and Tissue AuthorityLevel 6, 221 London Circuit Canberra ACT 2600PO Box 295 Civic Square ACT 2608Telephone 02 6198 9800 Facsimile 02 6198 9801
Performance report 2012
For more information visit www.donatelife.gov.au4
Australia’s potential donor populationNot everyone can be an organ donor as particular circumstances must prevail in order for a patient to be medically suitable for donation. Organ donation is only possible from a subset of end of life events that occur in intensive care units or hospital emergency departments. Potential donors need to be recognised as such, and if medically suitable, the family will be asked to confirm the wishes of their family member before donation can occur.
By way of example, in 2012 the Australian population was 22,683,600 with an estimated 150,400 deaths occurring. Of these, approximately 76,600 deaths occurred in hospitals with around 790 potential donors identified – around 1 % of the hospital deaths.
Requests to families for donation were made in around 710 cases, with approximately 410 families consenting to donation. In just over 50 cases where family consent was given, donation did not proceed for a variety of clinical reasons.
The resulting 354 deceased organ donors transformed the lives of 1,052 Australians in 2012.
Source:1. 30 June 2012 estimated resident population (ABS 3101.0- Australian Demographic
Statistics, Jun 2012. Released 18/12/2012)2. Estimated from ABS 3302.0 Deaths, Australia, 2011. Released 8/11/2012. 3. Estimated from AIHW Australian hospital statistics 2010-11 Released 30/4/2012.
Updated 16/5/20124. Estimated from DonateLife Audit, September 2012, AOTA5. ANZOD Monthly report on Deceased Organ donation in Australia December 2012
Australian population1
22,683,600
Australian deaths2
~150,400
Deaths in hospitals3
~76,600
Potential donors4
~790
Actual donors5
354
Transplant recipients5
1,052
Consented donors4
~410
Donation requests4
~710