performance specification 11 …€”quality assurance requirements for particulate matter...
TRANSCRIPT
Performance Specification 11 8/2/2017
1
While we have taken steps to ensure the accuracy of this Internet version of the document, it is not the
official version. The most recent edits to this method were published here:
https://www.gpo.gov/fdsys/pkg/FR-2016-08-30/pdf/2016-19642.pdf. To see a complete version
including any recent edits, visit: https://www.ecfr.gov/cgi-bin/ECFR?page=browse and search under
Title 40, Protection of Environment.
PERFORMANCE SPECIFICATION 11—SPECIFICATIONS AND TEST PROCEDURES FOR
PARTICULATE MATTER CONTINUOUS EMISSION MONITORING SYSTEMS AT STATIONARY
SOURCES
1.0 What Are the Purpose and Applicability of Performance Specification 11?
The purpose of Performance Specification 11 (PS-11) is to establish the initial installation and
performance procedures that are required for evaluating the acceptability of a particulate matter
(PM) continuous emission monitoring system (CEMS); it is not to evaluate the ongoing
performance of your PM CEMS over an extended period of time, nor to identify specific
calibration techniques and auxiliary procedures to assess CEMS performance. You will find
procedures for evaluating the ongoing performance of a PM CEMS in Procedure 2 of Appendix
F—Quality Assurance Requirements for Particulate Matter Continuous Emission Monitoring
Systems Used at Stationary Sources.
1.1 Under what conditions does PS-11 apply to my PM CEMS? The PS-11 applies to your PM
CEMS if you are required by any provision of Title 40 of the Code of Federal Regulations (CFR)
to install and operate PM CEMS.
1.2 When must I comply with PS-11? You must comply with PS-11 when directed by the
applicable rule that requires you to install and operate a PM CEMS.
1.3 What other monitoring must I perform? To report your PM emissions in units of the emission
standard, you may need to monitor additional parameters to correct the PM concentration
reported by your PM CEMS. Your CEMS may include the components listed in paragraphs (1)
through (3) of this section:
(1) A diluent monitor (i.e., O2, CO2, or other CEMS specified in the applicable regulation),
which must meet its own performance specifications (also found in this appendix),
(2) Auxiliary monitoring equipment to allow measurement, determination, or input of the flue
gas temperature, pressure, moisture content, and/or dry volume of stack effluent sampled, and
(3) An automatic sampling system. The performance of your PM CEMS and the establishment of
its correlation to manual reference method measurements must be determined in units of mass
concentration as measured by your PM CEMS (e.g., milligrams per actual cubic meter (mg/acm)
or milligrams per dry standard cubic meter (mg/dscm)).
2.0 What Are the Basic Requirements of PS-11?
Performance Specification 11 8/2/2017
2
The PS-11 requires you to perform initial installation and calibration procedures that confirm the
acceptability of your CEMS when it is installed and placed into operation. You must develop a
site-specific correlation of your PM CEMS response against manual gravimetric reference
method measurements (including those made using EPA Methods 5, 5I, or 17).
2.1 What types of PM CEMS technologies are covered? Several different types of PM CEMS
technologies (e.g., light scattering, Beta attenuation, etc.) can be designed with in-situ or
extractive sample gas handling systems. Each PM CEMS technology and sample gas handling
technology has certain site-specific advantages. You should select and install a PM CEMS that is
appropriate for the flue gas conditions at your source.
2.2 How is PS-11 different from other performance specifications? The PS-11 is based on a
technique of correlating PM CEMS responses relative to emission concentrations determined by
the reference method. This technique is called “the correlation.” This differs from CEMS used to
measure gaseous pollutants that have available calibration gases of known concentration.
Because the type and characteristics of PM vary from source to source, a single PM correlation,
applicable to all sources, is not possible.
2.3 How are the correlation data handled? You must carefully review your manual reference
method data and your PM CEMS responses to include only valid, high-quality data. For the
correlation, you must convert the manual reference method data to measurement conditions
(e.g., wet or dry basis) that are consistent with your PM CEMS. Then, you must correlate the
manual method and PM CEMS data in terms of the output as received from the monitor
(e.g., milliamps). At the appropriate PM CEMS response specified in section 13.2 of this
performance specification, you must calculate the confidence interval half range and tolerance
interval half range as a percentage of the applicable PM concentration emission limit and
compare the confidence interval and tolerance interval percentages with the performance criteria.
Also, you must calculate the correlation coefficient and compare the correlation coefficient with
the applicable performance criterion specified in section 13.2 of this performance specification.
Situations may arise where you will need two or more correlations. If you need multiple
correlations, you must collect sufficient data for each correlation, and each correlation must
satisfy the performance criteria specified in section 13.2 of this performance specification.
2.4 How do I design my PM CEMS correlation program? When planning your PM CEMS
correlation effort, you must address each of the items in paragraphs (1) through (7) of this
section to enhance the probability of success. You will find each of these elements further
described in this performance specification or in the applicable reference method procedure.
(1) What type of PM CEMS should I select? You should select a PM CEMS that is appropriate
for your source with technical consideration for potential factors such as interferences, site-
specific configurations, installation location, flue gas conditions, PM concentration range, and
other PM characteristics. You can find guidance on which technology is best suited for specific
situations in our report “Current Knowledge of Particulate Matter (PM) Continuous Emission
Monitoring” (PM CEMS Knowledge Document, see section 16.5).
Performance Specification 11 8/2/2017
3
(2) Where should I install my PM CEMS? Your PM CEMS must be installed in a location that
is most representative of PM emissions, as determined by the reference method, such that the
correlation between PM CEMS response and emissions determined by the reference method will
meet these performance specifications. Care must be taken in selecting a location and
measurement point to minimize problems due to flow disturbances, cyclonic flow, and varying
PM stratification.
(3) How should I record my CEMS data? You need to ensure that your PM CEMS and data
logger are set up to collect and record all normal emission levels and excursions. You must
ensure that your data logger and PM CEMS have been properly programmed to accept and
transfer status signals of valid monitor operation (e.g., flags for internal calibration, suspect data,
or maintenance periods).
(4) What CEMS data should I review? You must review drift data daily to document proper
operation. You must also ensure that any audit material is appropriate for the typical operating
range of your PM CEMS.
(5) How long should I operate my PM CEMS before conducting the initial correlation test? You
should allow sufficient time for your PM CEMS to operate for you to become familiar with your
PM CEMS.
(i) You should observe PM CEMS response over time during normal and varying process
conditions. This will ensure that your PM CEMS has been properly set up to operate at a range
that is compatible with the concentrations and characteristics of PM emissions for your source.
You should use this information to establish the range of operating conditions necessary to
determine the correlations of PM CEMS data to manual reference method measurements over a
wide operating range.
(ii) You must determine the types of process changes that will influence, on a definable and
repeatable basis, flue gas PM concentrations and the resulting PM CEMS responses. You may
find this period useful to make adjustments to your planned approach for operating your PM
CEMS at your source. For instance, you may change the measurement range or batch sampling
period to something other than those you initially planned to use.
(6) How do I conduct the initial correlation test? When conducting the initial correlation test of
your PM CEMS response to PM emissions determined by the reference method, you must pay
close attention to accuracy and details. Your PM CEMS must be operating properly. You must
perform the manual reference method testing accurately, with attention to eliminating site-
specific systemic errors. You must coordinate the timing of the manual reference method testing
with the sampling cycle of your PM CEMS. You must complete a minimum of 15 manual
reference method tests. You must perform the manual reference method testing over the full
range of PM CEMS responses that correspond to normal operating conditions for your source
and control device and will result in the widest range of emission concentrations.
(7) How should I perform the manual reference method testing? You must perform the manual
reference method testing in accordance with specific rule requirements, coordinated closely with
Performance Specification 11 8/2/2017
4
PM CEMS and process operations. It is highly recommended that you use paired trains for the
manual reference method testing. You must perform the manual reference method testing over a
suitable PM concentration range that corresponds to the full range of normal process and control
device operating conditions. Because the manual reference method testing for this correlation
test is not for compliance reporting purposes, you may conduct the reference method test runs for
less than the typical minimum test run duration of 1 hour.
(8) What do I do with the manual reference method data and PM CEMS data? You must
complete each of the activities in paragraphs (8)(i) through (v) of this section.
(i) Screen the manual reference method data for validity (e.g., isokinetics, leak checks), quality
assurance, and quality control (e.g., outlier identification).
(ii) Screen your PM CEMS data for validity (e.g., daily drift check requirements) and quality
assurance (e.g., flagged data).
(iii) Convert the manual reference method test data into measurement units (e.g., mg/acm)
consistent with the measurement conditions of your PM CEMS.
(iv) Calculate the correlation equation(s) as specified in section 12.3.
(v) Calculate the correlation coefficient, confidence interval half range, and tolerance interval
half range for the complete set of PM CEMS and reference method correlation data for
comparison with the correlation performance criteria specified in section 13.2.
2.5 What other procedures must I perform? Before conducting the initial correlation test, you
must successfully complete a 7-day drift test (See section 8.5).
3.0 What Special Definitions Apply to PS-11?
3.1 “Appropriate Measurement Range of your PM CEMS” means a measurement range that is
capable of recording readings over the complete range of your source's PM emission
concentrations during routine operations. The appropriate range is determined during the pretest
preparations as specified in section 8.4.
3.2 “Appropriate Data Range for PM CEMS Correlation” means the data range that reflects the
full range of your source's PM emission concentrations recorded by your PM CEMS during the
correlation test planning period or other normal operations as defined in the applicable
regulations.
3.3 “Batch Sampling” means that gas is sampled on an intermittent basis and concentrated on a
collection medium before intermittent analysis and follow-up reporting. Beta gauge PM CEMS
are an example of batch sampling devices.
3.4 “Confidence Interval Half Range (CI)” is a statistical term and means one-half of the width
of the 95 percent confidence interval around the predicted mean PM concentration (y value)
Performance Specification 11 8/2/2017
5
calculated at the PM CEMS response value (x value) where the confidence interval is narrowest.
Procedures for calculating CI are specified in section 12.3. The CI as a percent of the emission
limit value (CI%) is calculated at the appropriate PM CEMS response value and must satisfy the
criteria specified in section 13.2 (2).
3.5 “Continuous Emission Monitoring System (CEMS)” means all of the equipment required for
determination of PM mass concentration in units of the emission standard. The sample interface,
pollutant monitor, diluent monitor, other auxiliary data monitor(s), and data recorder are the
major subsystems of your CEMS.
3.6 “Correlation” means the primary mathematical relationship for correlating the output from
your PM CEMS to a PM concentration, as determined by the PM reference method. The
correlation is expressed in the measurement units that are consistent with the measurement
conditions (e.g., mg/dscm, mg/acm) of your PM CEMS.
3.7 “Correlation Coefficient (r)” means a quantitative measure of the association between your
PM CEMS outputs and the reference method measurements. Equations for calculating the r value
are provided in section 12.3(1)(iv) for linear correlations and in section 12.3(2)(iv) for
polynomial correlations.
3.8 “Cycle Time” means the time required to complete one sampling, measurement, and
reporting cycle. For a batch sampling PM CEMS, the cycle time would start when sample gas is
first extracted from the stack/duct and end when the measurement of that batch sample is
complete and a new result for that batch sample is produced on the data recorder.
3.9 “Data Recorder” means the portion of your CEMS that provides a permanent record of the
monitor output in terms of response and status (flags). The data recorder may also provide
automatic data reduction and CEMS control capabilities (see section 6.6).
3.10 “Diluent Monitor and Other Auxiliary Data Monitor(s) (if applicable)” means the portion of
your CEMS that provides the diluent gas concentration (such as O2 or CO2, as specified by the
applicable regulations), temperature, pressure, and/or moisture content, and generates an output
proportional to the diluent gas concentration or gas property.
3.11 “Drift Check” means a check of the difference between your PM CEMS output readings
and the established reference value of a reference standard or procedure after a stated period of
operation during which no unscheduled maintenance, repair, or adjustment took place. The
procedures used to determine drift are specific to the operating principles of your specific PM
CEMS. A drift check includes both a zero drift check and an upscale drift check.
3.12 “Exponential Correlation” means an exponential equation used to define the relationship
between your PM CEMS output and the reference method PM concentration, as indicated by
Equation 11-37.
Performance Specification 11 8/2/2017
6
3.13 “Flagged Data” means data marked by your CEMS indicating that the response value(s)
from one or more CEMS subsystems is suspect or invalid or that your PM CEMS is not in
source-measurement operating mode.
3.14 “Linear Correlation” means a first-order mathematical relationship between your PM
CEMS output and the reference method PM concentration that is linear in form, as indicated by
Equation 11-3.
3.15 “Logarithmic Correlation” means a first-order mathematical relationship between the
natural logarithm of your PM CEMS output and the reference method PM concentration that is
linear in form, as indicated by Equation 11-34.
3.16 “Low-Emitting Source” means a source that operated at no more than 50 percent of the
emission limit during the most recent performance test, and, based on the PM CEMS correlation,
the daily average emissions for the source, measured in the units of the applicable emission limit,
have not exceeded 50 percent of the emission limit for any day since the most recent
performance test.
3.17 “Paired Trains” means two reference method trains that are used to conduct simultaneous
measurements of PM concentrations. Guidance on the use of paired sampling trains can be found
in the PM CEMS Knowledge Document (see section 16.5).
3.18 “Polynomial Correlation” means a second-order equation used to define the relationship
between your PM CEMS output and reference method PM concentration, as indicated by
Equation 11-16.
3.19 “Power Correlation” means an equation used to define a power function relationship
between your PM CEMS output and the reference method concentration, as indicated by
Equation 11-42.
3.20 “Reference Method” means the method defined in the applicable regulations, but commonly
refers to those methods collectively known as EPA Methods 5, 5I, and 17 (for particulate
matter), found in Appendix A of 40 CFR 60. Only the front half and dry filter catch portions of
the reference method can be correlated to your PM CEMS output.
3.21 “Reference Standard” means a reference material or procedure that produces a known and
unchanging response when presented to the pollutant monitor portion of your CEMS. You must
use these standards to evaluate the overall operation of your PM CEMS, but not to develop a PM
CEMS correlation.
3.22 “Response Time” means the time interval between the start of a step change in the system
input and the time when the pollutant monitor output reaches 95 percent of the final value (see
sections 6.5 and 13.3 for procedures and acceptance criteria).
Performance Specification 11 8/2/2017
7
3.23 “Sample Interface” means the portion of your CEMS used for one or more of the following:
sample acquisition, sample delivery, sample conditioning, or protection of the monitor from the
effects of the stack effluent.
3.24 “Sample Volume Check” means a check of the difference between your PM CEMS sample
volume reading and the sample volume reference value.
3.25 “Tolerance Interval half range (TI)” means one-half of the width of the tolerance interval
with upper and lower limits, within which a specified percentage of the future data population is
contained with a given level of confidence, as defined by the respective tolerance interval half
range equations in section 12.3(1)(iii) for linear correlations and in section 12.3(2)(iii) for
polynomial correlations. The TI as a percent of the emission limit value (TI%) is calculated at
the appropriate PM CEMS response value specified in section 13.2(3).
3.26 “Upscale Check Value” means the expected response to a reference standard or procedure
used to check the upscale response of your PM CEMS.
3.27 “Upscale Drift (UD) Check” means a check of the difference between your PM CEMS
output reading and the upscale check value.
3.28 “Zero Check Value” means the expected response to a reference standard or procedure used
to check the response of your PM CEMS to particulate-free or low-particulate concentration
conditions.
3.29 “Zero Drift (ZD) Check” means a check of the difference between your PM CEMS output
reading and the zero check value.
3.30 “Zero Point Correlation Value” means a value added to PM CEMS correlation data to
represent low or near zero PM concentration data (see section 8.6 for rationale and procedures).
4.0 Are There Any Potential Interferences for My PM CEMS?
Yes, condensible water droplets or condensible acid gas aerosols (i.e., those with condensation
temperatures above those specified by the reference method) at the measurement location can be
interferences for your PM CEMS if the necessary precautions are not met.
4.1 Where are interferences likely to occur? Interferences may develop if your CEMS is installed
downstream of a wet air pollution control system or any other conditions that produce flue gases,
which, at your PM CEMS measurement point, normally or occasionally contain entrained water
droplets or condensible salts before release to the atmosphere.
4.2 How do I deal with interferences? We recommend that you use a PM CEMS that extracts and
heats representative samples of the flue gas for measurement to simulate results produced by the
reference method for conditions such as those described in section 4.1. Independent of your PM
CEMS measurement technology and extractive technique, you should have a configuration
simulating the reference method to ensure that:
Performance Specification 11 8/2/2017
8
(1) No formation of new PM or deposition of PM occurs in sample delivery from the stack or
duct; and
(2) No condensate accumulates in the sample flow measurement apparatus.
4.3 What PM CEMS measurement technologies should I use? You should use a PM CEMS
measurement technology that is free of interferences from any condensible constituent in the flue
gas.
5.0 What Do I Need To Know To Ensure the Safety of Persons Using PS-11?
People using the procedures required under PS-11 may be exposed to hazardous materials,
operations, site conditions, and equipment. This performance specification does not purport to
address all of the safety issues associated with its use. It is your responsibility to establish
appropriate safety and health practices and determine the applicable regulatory limitations before
performing these procedures. You must consult your CEMS user's manual and other reference
materials recommended by the reference method for specific precautions to be taken.
6.0 What Equipment and Supplies Do I Need?
Different types of PM CEMS use different operating principles. You should select an appropriate
PM CEMS based on your site-specific configurations, flue gas conditions, and PM
characteristics.
(1) Your PM CEMS must sample the stack effluent continuously or, for batch sampling PM
CEMS, intermittently.
(2) You must ensure that the averaging time, the number of measurements in an average, the
minimum data availability, and the averaging procedure for your CEMS conform with those
specified in the applicable emission regulation.
(3) Your PM CEMS must include, as a minimum, the equipment described in sections 6.1
through 6.7.
6.1 What equipment is needed for my PM CEMS's sample interface? Your PM CEMS's sample
interface must be capable of delivering a representative sample of the flue gas to your PM
CEMS. This subsystem may be required to heat the sample gas to avoid PM deposition or
moisture condensation, provide dilution air, perform other gas conditioning to prepare the sample
for analysis, or measure the sample volume or flow rate.
(1) If your PM CEMS is installed downstream of a wet air pollution control system such that the
flue gases normally or occasionally contain entrained water droplets, we recommend that you
select a sampling system that includes equipment to extract and heat a representative sample of
the flue gas for measurement so that the pollutant monitor portion of your CEMS measures only
dry PM. Heating should be sufficient to raise the temperature of the extracted flue gas above the
water condensation temperature and should be maintained at all times and at all points in the
Performance Specification 11 8/2/2017
9
sample line from where the flue gas is extracted, including the pollutant monitor and any sample
flow measurement devices.
(2) You must consider the measured conditions of the sample gas stream to ensure that manual
reference method test data are converted to units of PM concentration that are appropriate for the
correlation calculations. Additionally, you must identify what, if any, additional auxiliary data
from other monitoring and handling systems are necessary to convert your PM CEMS response
into the units of the PM standard.
(3) If your PM CEMS is an extractive type and your source's flue gas volumetric flow rate varies
by more than 10 percent from nominal, your PM CEMS should maintain an isokinetic sampling
rate (within 10 percent of true isokinetic). If your extractive-type PM CEMS does not maintain
an isokinetic sampling rate, you must use actual site-specific data or data from a similar
installation to prove to us, the State, and/or local enforcement agency that isokinetic sampling is
not necessary.
6.2 What type of equipment is needed for my PM CEMS? Your PM CEMS must be capable of
providing an electronic output that can be correlated to the PM concentration.
(1) Your PM CEMS must be able to perform zero and upscale drift checks. You may perform
these checks manually, but performing these checks automatically is preferred.
(2) We recommend that you select a PM CEMS that is capable of performing automatic
diagnostic checks and sending instrument status signals (flags) to the data recorder.
(3) If your PM CEMS is an extractive type that measures the sample volume and uses the
measured sample volume as part of calculating the output value, your PM CEMS must be able to
perform a check of the sample volume to verify the accuracy of the sample volume measuring
equipment. The sample volume check must be conducted daily and at the normal sampling rate
of your PM CEMS.
6.3 What is the appropriate measurement range for my PM CEMS? Initially, your PM CEMS
must be set up to measure over the expected range of your source's PM emission concentrations
during routine operations. You may change the measurement range to a more appropriate range
prior to correlation testing.
6.4 What if my PM CEMS does automatic range switching? Your PM CEMS may be equipped
to perform automatic range switching so that it is operating in a range most sensitive to the
detected concentrations. If your PM CEMS does automatic range switching, you must configure
the data recorder to handle the recording of data values in multiple ranges during range-
switching intervals.
6.5 What averaging time and sample intervals should be used? Your CEMS must sample the
stack effluent such that the averaging time, the number of measurements in an average, the
minimum sampling time, and the averaging procedure for reporting and determining compliance
conform with those specified in the applicable regulation. Your PM CEMS must be designed to
Performance Specification 11 8/2/2017
10
meet the specified response time and cycle time established in this performance specification
(see section 13.3).
6.6 What type of equipment is needed for my data recorder? Your CEMS data recorder must be
able to accept and record electronic signals from all the monitors associated with your PM
CEMS.
(1) Your data recorder must record the signals from your PM CEMS that can be correlated to PM
mass concentrations. If your PM CEMS uses multiple ranges, your data recorder must identify
what range the measurement was made in and provide range-adjusted results.
(2) Your data recorder must accept and record monitor status signals (flagged data).
(3) Your data recorder must accept signals from auxiliary data monitors, as appropriate.
6.7 What other equipment and supplies might I need? You may need other supporting equipment
as defined by the applicable reference method(s) (see section 7) or as specified by your CEMS
manufacturer.
7.0 What Reagents and Standards Do I Need?
You will need reference standards or procedures to perform the zero drift check, the upscale drift
check, and the sample volume check.
7.1 What is the reference standard value for the zero drift check? You must use a zero check
value that is no greater than 20 percent of the PM CEMS's response range. You must obtain
documentation on the zero check value from your PM CEMS manufacturer.
7.2 What is the reference standard value for the upscale drift check? You must use an upscale
check value that produces a response between 50 and 100 percent of the PM CEMS's response
range. For a PM CEMS that produces output over a range of 4 mA to 20 mA, the upscale check
value must produce a response in the range of 12 mA to 20 mA. You must obtain documentation
on the upscale check value from your PM CEMS manufacturer.
7.3 What is the reference standard value for the sample volume check? You must use a reference
standard value or procedure that produces a sample volume value equivalent to the normal
sampling rate. You must obtain documentation on the sample volume value from your PM
CEMS manufacturer.
8.0 What Performance Specification Test Procedure Do I Follow?
You must complete each of the activities in sections 8.1 through 8.8 for your performance
specification test.
8.1 How should I select and set up my equipment? You should select a PM CEMS that is
appropriate for your source, giving consideration to potential factors such as flue gas conditions,
Performance Specification 11 8/2/2017
11
interferences, site-specific configuration, installation location, PM concentration range, and other
PM characteristics. Your PM CEMS must meet the equipment specifications in sections 6.1 and
6.2.
(1) You should select a PM CEMS that is appropriate for the flue gas conditions at your source.
If your source's flue gas contains entrained water droplets, we recommend that your PM CEMS
include a sample delivery and conditioning system that is capable of extracting and heating a
representative sample.
(i) Your PM CEMS must maintain the sample at a temperature sufficient to prevent moisture
condensation in the sample line before analysis of PM.
(ii) If condensible PM is an issue, we recommend that you operate your PM CEMS to maintain
the sample gas temperature at the same temperature as the reference method filter.
(iii) Your PM CEMS must avoid condensation in the sample flow rate measurement lines.
(2) Some PM CEMS do not have a wide measurement range capability. Therefore, you must
select a PM CEMS that is capable of measuring the full range of PM concentrations expected
from your source from normal levels through the emission limit concentration.
(3) Some PM CEMS are sensitive to particle size changes, water droplets in the gas stream,
particle charge, stack gas velocity changes, or other factors. Therefore, you should select a PM
CEMS appropriate for the emission characteristics of your source.
(4) We recommend that you consult your PM CEMS vendor to obtain basic recommendations on
the instrument capabilities and setup configuration. You are ultimately responsible for setup and
operation of your PM CEMS.
8.2 Where do I install my PM CEMS? You must install your PM CEMS at an accessible location
downstream of all pollution control equipment. You must perform your PM CEMS concentration
measurements from a location considered representative or be able to provide data that can be
corrected to be representative of the total PM emissions as determined by the manual reference
method.
(1) You must select a measurement location that minimizes problems due to flow disturbances,
cyclonic flow, and varying PM stratification (refer to Method 1 for guidance).
(2) If you plan to achieve higher emissions for correlation test purposes by adjusting the
performance of the air pollution control device (per section 8.6(4)(i)), you must locate your PM
CEMS and reference method sampling points well downstream of the control device
(e.g., downstream of the induced draft fan), in order to minimize PM stratification that may be
created in these cases.
8.3 How do I select the reference method measurement location and traverse points? You must
follow EPA Method 1 for identifying manual reference method traverse points. Ideally, you
Performance Specification 11 8/2/2017
12
should perform your manual reference method measurements at locations that satisfy the
measurement site selection criteria specified in EPA Method 1 of at least eight duct diameters
downstream and at least two duct diameters upstream of any flow disturbance. Where necessary,
you may conduct testing at a location that is two diameters downstream and 0.5 diameters
upstream of flow disturbances. If your location does not meet the minimum downstream and
upstream requirements, you must obtain approval from us to test at your location.
8.4 What are my pretest preparation steps? You must install your CEMS and prepare the
reference method test site according to the specifications in sections 8.2 and 8.3.
(1) After completing the initial field installation, we recommend that you operate your PM
CEMS according to the manufacturer's instructions to familiarize yourself with its operation
before you begin correlation testing.
(i) During this initial period of operation, we recommend that you conduct daily checks (zero and
upscale drift and sample volume, as appropriate), and, when any check exceeds the daily
specification (see section 13.1), make adjustments and perform any necessary maintenance to
ensure reliable operation.
(2) When you are confident that your PM CEMS is operating properly, we recommend that you
operate your CEMS over a correlation test planning period of sufficient duration to identify the
full range of operating conditions and PM emissions to be used in your PM CEMS correlation
test.
(i) During the correlation test planning period, you should operate the process and air pollution
control equipment over the normal range of operating conditions, except when you attempt to
produce higher emissions.
(ii) Your data recorder should record PM CEMS response during the full range of routine
process operating conditions.
(iii) You should try to establish the relationships between operating conditions and PM CEMS
response, especially those conditions that produce the highest PM CEMS response over 15-
minute averaging periods, and the lowest PM CEMS response as well. The objective is to be able
to reproduce the conditions for purposes of the actual correlation testing discussed in section 8.6.
(3) You must set the response range of your PM CEMS such that the instrument measures the
full range of responses that correspond to the range of source operating conditions that you will
implement during correlation testing.
(4) We recommend that you perform preliminary reference method testing after the correlation
test planning period. During this preliminary testing, you should measure the PM emission
concentration corresponding to the highest PM CEMS response observed during the full range of
normal operation, when perturbing the control equipment, or as the result of PM spiking.
Performance Specification 11 8/2/2017
13
(5) Before performing correlation testing, you must perform a 7-day zero and upscale drift test
(see section 8.5).
(6) You must not change the response range of the monitor once the response range has been set
and the drift test successfully completed.
8.5 How do I perform the 7-day drift test? You must check the zero (or low-level value between
0 and 20 percent of the response range of the instrument) and upscale (between 50 and 100
percent of the instrument's response range) drift. You must perform this check at least once daily
over 7 consecutive days. Your PM CEMS must quantify and record the zero and upscale
measurements and the time of the measurements. If you make automatic or manual adjustments
to your PM CEMS zero and upscale settings, you must conduct the drift test immediately before
these adjustments, or conduct it in such a way that you can determine the amount of drift. You
will find the calculation procedures for drift in section 12.1 and the acceptance criteria for
allowable drift in section 13.1.
(1) What is the purpose of 7-day drift tests? The purpose of the 7-day drift test is to demonstrate
that your system is capable of operating in a stable manner and maintaining its calibration for at
least a 7-day period.
(2) How do I conduct the 7-day drift test? To conduct the 7-day drift test, you must determine the
magnitude of the drift once each day, at 24-hour intervals, for 7 consecutive days while your
source is operating normally.
(i) You must conduct the 7-day drift test at the two points specified in section 8.5. You may
perform the 7-day drift tests automatically or manually by introducing to your PM CEMS
suitable reference standards (these need not be certified) or by using other appropriate
procedures.
(ii) You must record your PM CEMS zero and upscale response and evaluate them against the
zero check value and upscale check value.
(3) When must I conduct the 7-day drift test? You must complete a valid 7-day drift test before
attempting the correlation test.
8.6 How do I conduct my PM CEMS correlation test? You must conduct the correlation test
according to the procedure given in paragraphs (1) through (5) of this section. If you need
multiple correlations, you must conduct testing and collect at least 15 sets of reference method
and PM CEMS data for calculating each separate correlation.
(1) You must use the reference method for PM (usually EPA Methods 5, 5I, or 17) that is
prescribed by the applicable regulations. You may need to perform other reference methods or
performance specifications (e.g., Method 3 for oxygen, Method 4 for moisture, etc.) depending
on the units in which your PM CEMS reports PM concentration.
Performance Specification 11 8/2/2017
14
(i) We recommend that you use paired reference method trains when collecting manual PM data
to identify and screen the reference method data for imprecision and bias. Procedures for
checking reference method data for bias and precision can be found in the PM CEMS
Knowledge Document (see section 16.5).
(ii) You may use test runs that are shorter than 60 minutes in duration (e.g., 20 or 30 minutes).
You may perform your PM CEMS correlation tests during new source performance standards
performance tests or other compliance tests subject to the Clean Air Act or other statutes, such as
the Resource Conservation and Recovery Act. In these cases, your reference method results
obtained during the PM CEMS correlation test may be used to determine compliance so long as
your source and the test conditions and procedures (e.g., reference method sample run durations)
are consistent with the applicable regulations and the reference method.
(iii) You must convert the reference method results to units consistent with the conditions of
your PM CEMS measurements. For example, if your PM CEMS measures and reports PM
emissions in the units of mass per actual volume of stack gas, you must convert your reference
method results to those units (e.g., mg/acm). If your PM CEMS extracts and heats the sample gas
to eliminate water droplets, then measures and reports PM emissions under those actual
conditions, you must convert your reference method results to those same conditions
(e.g., mg/acm at 160 °C).
(2) During each test run, you must coordinate process operations, reference method sampling,
and PM CEMS operations. For example, you must ensure that the process is operating at the
targeted conditions, both reference method trains are sampling simultaneously (if paired
sampling trains are being used), and your PM CEMS and data logger are operating properly.
(i) You must coordinate the start and stop times of each run between the reference method
sampling and PM CEMS operation. For a batch sampling PM CEMS, you must start the
reference method at the same time as your PM CEMS sampling.
(ii) You must note the times for port changes (and other periods when the reference method
sampling may be suspended) on the data sheets so that you can adjust your PM CEMS data
accordingly, if necessary.
(iii) You must properly align the time periods for your PM CEMS and your reference method
measurements to account for your PM CEMS response time.
(3) You must conduct a minimum of 15 valid runs each consisting of simultaneous PM CEMS
and reference method measurement sets.
(i) You may conduct more than 15 sets of CEMS and reference method measurements. If you
choose this option, you may reject certain test results so long as the total number of valid test
results you use to determine the correlation is greater than or equal to 15.
(ii) You must report all data, including the rejected data.
Performance Specification 11 8/2/2017
15
(iii) You may reject the results of up to five test runs without explanation.
(iv) If you reject the results of more than five test runs, the basis for rejecting the results of the
additional test runs must be explicitly stated in the reference method, this performance
specification, Procedure 2 of appendix F, or your quality assurance plan.
(4) Simultaneous PM CEMS and reference method measurements must be performed in a
manner to ensure that the range of data that will be used to establish the correlation for your PM
CEMS is maximized. You must first attempt to maximize your correlation range by following
the procedures described in paragraphs (4)(i) through (iv) of this section. If you cannot obtain the
three levels as described in paragraphs (i) through (iv), then you must use the procedure
described in section 8.6(5).
(i) You must attempt to obtain the three different levels of PM mass concentration by varying
process operating conditions, varying PM control device conditions, or by means of PM spiking.
(ii) The three PM concentration levels you use in the correlation tests must be distributed over
the complete operating range experienced by your source.
(iii) At least 20 percent of the minimum 15 measured data points you use should be contained in
each of the following levels:
• Level 1: From no PM (zero concentration) emissions to 50 percent of the maximum PM
concentration;
• Level 2: 25 to 75 percent of the maximum PM concentration; and
• Level 3: 50 to 100 percent of the maximum PM concentration.
(iv) Although the above levels overlap, you may only apply individual run data to one level.
(5) If you cannot obtain three distinct levels of PM concentration as described, you must perform
correlation testing over the maximum range of PM concentrations that is practical for your PM
CEMS. To ensure that the range of data used to establish the correlation for your PM CEMS is
maximized, you must follow one or more of the steps in paragraphs (5)(i) through (iv) of this
section.
(i) Zero point data for in-situ instruments should be obtained, to the extent possible, by removing
the instrument from the stack and monitoring ambient air on a test bench.
(ii) Zero point data for extractive instruments should be obtained by removing the extractive
probe from the stack and drawing in clean ambient air.
(iii) Zero point data also can be obtained by performing manual reference method measurements
when the flue gas is free of PM emissions or contains very low PM concentrations (e.g., when
Performance Specification 11 8/2/2017
16
your process is not operating, but the fans are operating or your source is combusting only
natural gas).
(iv) If none of the steps in paragraphs (5)(i) through (iii) of this section are possible, you must
estimate the monitor response when no PM is in the flue gas (e.g., 4 mA = 0 mg/acm).
8.7 What do I do with the initial correlation test data for my PM CEMS? You must calculate and
report the results of the correlation testing, including the correlation coefficient, confidence
interval, and tolerance interval for the PM CEMS response and reference method correlation data
that are use to establish the correlation, as specified in section 12. You must include all data
sheets, calculations, charts (records of PM CEMS responses), process data records including PM
control equipment operating parameters, and reference media certifications necessary to confirm
that your PM CEMS met the requirements of this performance specification. In addition, you
must:
(1) Determine the integrated (arithmetic average) PM CEMS output over each reference method
test period;
(2) Adjust your PM CEMS outputs and reference method test data to the same clock time
(considering response time of your PM CEMS);
(3) Confirm that the reference method results are consistent with your PM CEMS response in
terms of, where applicable, moisture, temperature, pressure, and diluent concentrations; and
(4) Determine whether any of the reference method test results do not meet the test method
criteria.
8.8 What is the limitation on the range of my PM CEMS correlation? Although the data you
collect during the correlation testing should be representative of the full range of normal
operating conditions at your source, you must conduct additional correlation testing if either of
the conditions specified in paragraphs (1) and (2) of this section occurs.
(1) If your source is a low-emitting source, as defined in section 3.16 of this specification, you
must conduct additional correlation testing if either of the events specified in paragraphs (1)(i) or
(ii) of this section occurs while your source is operating under normal conditions.
(i) Your source generates 24 consecutive hourly average PM CEMS responses that are greater
than 125 percent of the highest PM CEMS response (e.g., mA reading) used for the correlation
curve or are greater than the PM CEMS response that corresponds to 50 percent of the emission
limit, whichever is greater, or
(ii) The cumulative hourly average PM CEMS responses generated by your source are greater
than 125 percent of the highest PM CEMS response used for the correlation curve or are greater
than the PM CEMS response that corresponds to 50 percent of the emission limit, whichever is
greater, for more than 5 percent of your PM CEMS operating hours for the previous 30-day
period.
Performance Specification 11 8/2/2017
17
(2) If your source is not a low-emitting source, as defined in section 3.16 of this specification,
you must conduct additional correlation testing if either of the events specified in paragraph (i)
or (ii) of this section occurs while your source is operating under normal conditions.
(i) Your source generates 24 consecutive hourly average PM CEMS responses that are greater
than 125 percent of the highest PM CEMS response (e.g., mA reading) used for the correlation
curve, or
(ii) The cumulative hourly average PM CEMS responses generated by your source are greater
than 125 percent of the highest PM CEMS response used for the correlation curve for more than
5 percent of your PM CEMS operating hours for the previous 30-day period.
(3) If additional correlation testing is required, you must conduct at least three additional test
runs under the conditions that caused the higher PM CEMS response.
(i) You must complete the additional testing and use the resulting new data along with the
previous data to calculate a revised correlation equation within 60 days after the occurrence of
the event that requires additional testing, as specified in paragraphs 8.8(1) and (2).
(4) If your source generates consecutive PM CEMS hourly responses that are greater than 125
percent of the highest PM CEMS response used to develop the correlation curve for 24 hours or
for a cumulative period that amounts to more than 5 percent of the PM CEMS operating hours
for the previous 30-day period, you must report the reason for the higher PM CEMS responses.
9.0 What Quality Control Measures Are Required?
Quality control measures for PM CEMS are specified in 40 CFR 60, Appendix F, Procedure 2.
10.0 What Calibration and Standardization Procedures Must I Perform? [Reserved]
11.0 What Analytical Procedures Apply to This Procedure?
Specific analytical procedures are outlined in the applicable reference method(s).
12.0 What Calculations and Data Analyses Are Needed?
You must determine the primary relationship for correlating the output from your PM CEMS to a
PM concentration, typically in units of mg/acm or mg/dscm of flue gas, using the calculations
and data analysis process in sections 12.2 and 12.3. You develop the correlation by performing
an appropriate regression analysis between your PM CEMS response and your reference method
data.
12.1 How do I calculate upscale drift and zero drift? You must determine the difference in your
PM CEMS output readings from the established reference values (zero and upscale check values)
after a stated period of operation during which you performed no unscheduled maintenance,
repair or adjustment.
Performance Specification 11 8/2/2017
18
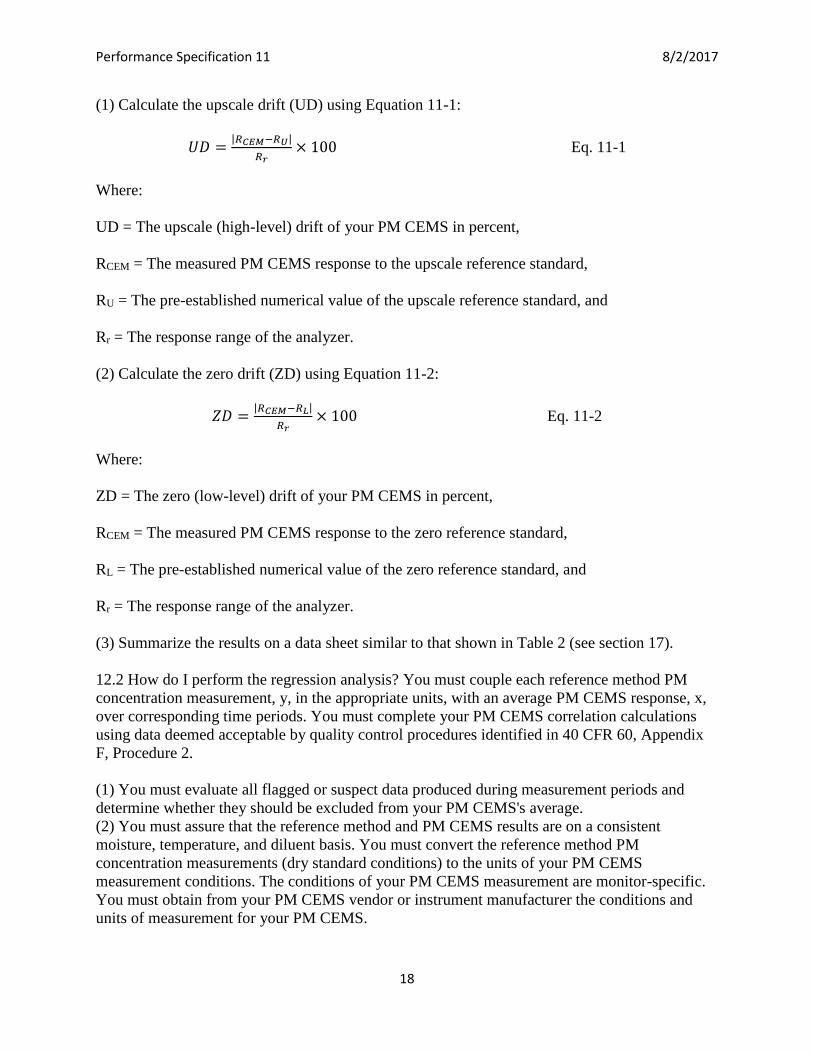
(1) Calculate the upscale drift (UD) using Equation 11-1:
𝑈𝐷 =|𝑅𝐶𝐸𝑀−𝑅𝑈|
𝑅𝑟× 100 Eq. 11-1
Where:
UD = The upscale (high-level) drift of your PM CEMS in percent,
RCEM = The measured PM CEMS response to the upscale reference standard,
RU = The pre-established numerical value of the upscale reference standard, and
Rr = The response range of the analyzer.
(2) Calculate the zero drift (ZD) using Equation 11-2:
𝑍𝐷 =|𝑅𝐶𝐸𝑀−𝑅𝐿|
𝑅𝑟× 100 Eq. 11-2
Where:
ZD = The zero (low-level) drift of your PM CEMS in percent,
RCEM = The measured PM CEMS response to the zero reference standard,
RL = The pre-established numerical value of the zero reference standard, and
Rr = The response range of the analyzer.
(3) Summarize the results on a data sheet similar to that shown in Table 2 (see section 17).
12.2 How do I perform the regression analysis? You must couple each reference method PM
concentration measurement, y, in the appropriate units, with an average PM CEMS response, x,
over corresponding time periods. You must complete your PM CEMS correlation calculations
using data deemed acceptable by quality control procedures identified in 40 CFR 60, Appendix
F, Procedure 2.
(1) You must evaluate all flagged or suspect data produced during measurement periods and
determine whether they should be excluded from your PM CEMS's average.
(2) You must assure that the reference method and PM CEMS results are on a consistent
moisture, temperature, and diluent basis. You must convert the reference method PM
concentration measurements (dry standard conditions) to the units of your PM CEMS
measurement conditions. The conditions of your PM CEMS measurement are monitor-specific.
You must obtain from your PM CEMS vendor or instrument manufacturer the conditions and
units of measurement for your PM CEMS.
Performance Specification 11 8/2/2017
19
(i) If your sample gas contains entrained water droplets and your PM CEMS is an extractive
system that measures at actual conditions (i.e., wet basis), you must use the measured moisture
content determined from the impinger analysis when converting your reference method PM data
to PM CEMS conditions; do not use the moisture content calculated from a psychrometric chart
based on saturated conditions.
12.3 How do I determine my PM CEMS correlation? To predict PM concentrations from PM
CEMS responses, you must use the calculation method of least squares presented in paragraphs
(1) through (5) of this section. When performing the calculations, each reference method PM
concentration measurement must be treated as a discrete data point; if using paired sampling
trains, do not average reference method data pairs for any test run.
This performance specification describes procedures for evaluating five types of correlation
models: linear, polynomial, logarithmic, exponential, and power. Procedures for selecting the
most appropriate correlation model are presented in section 12.4 of this specification.
(1) How do I evaluate a linear correlation for my correlation test data? To evaluate a linear
correlation, follow the procedures described in paragraphs (1)(i) through (iv) of this section.
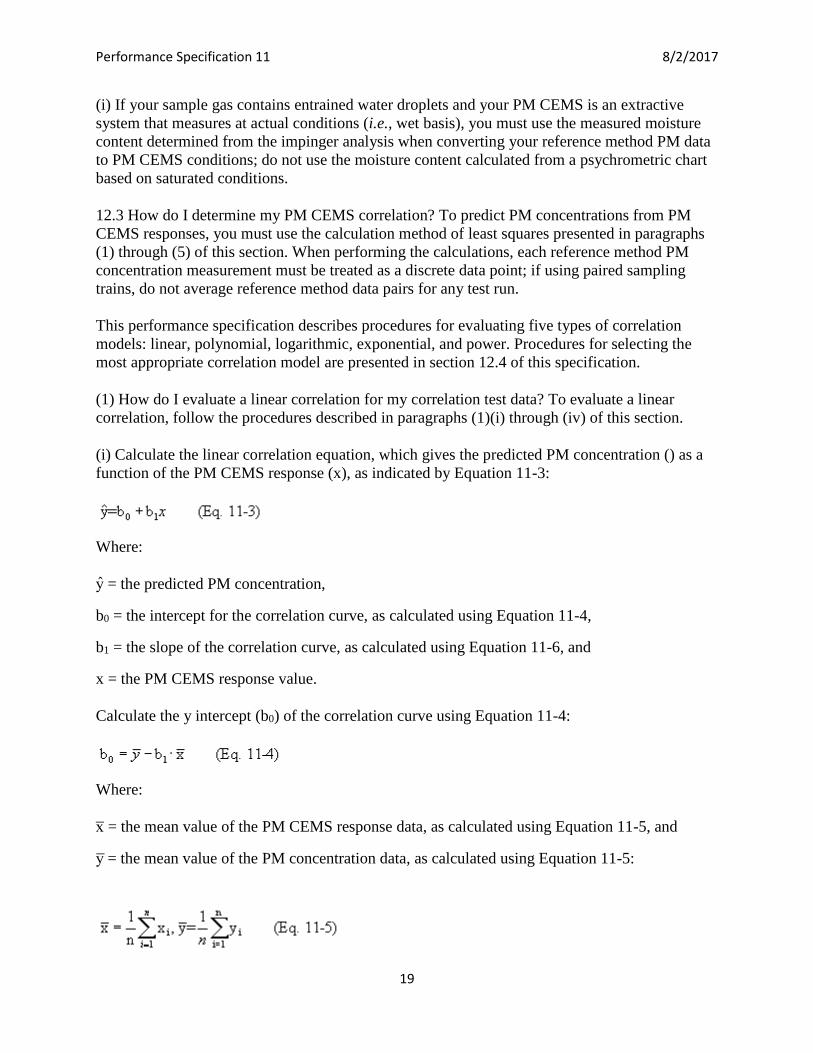
(i) Calculate the linear correlation equation, which gives the predicted PM concentration () as a
function of the PM CEMS response (x), as indicated by Equation 11-3:
Where:
y = the predicted PM concentration,
b0 = the intercept for the correlation curve, as calculated using Equation 11-4,
b1 = the slope of the correlation curve, as calculated using Equation 11-6, and
x = the PM CEMS response value.
Calculate the y intercept (b0) of the correlation curve using Equation 11-4:
Where:
x = the mean value of the PM CEMS response data, as calculated using Equation 11-5, and
y = the mean value of the PM concentration data, as calculated using Equation 11-5:
Performance Specification 11 8/2/2017
20
Where:
xi = the PM CEMS response value for run i,
yi = the PM concentration value for run i, and
n = the number of data points.
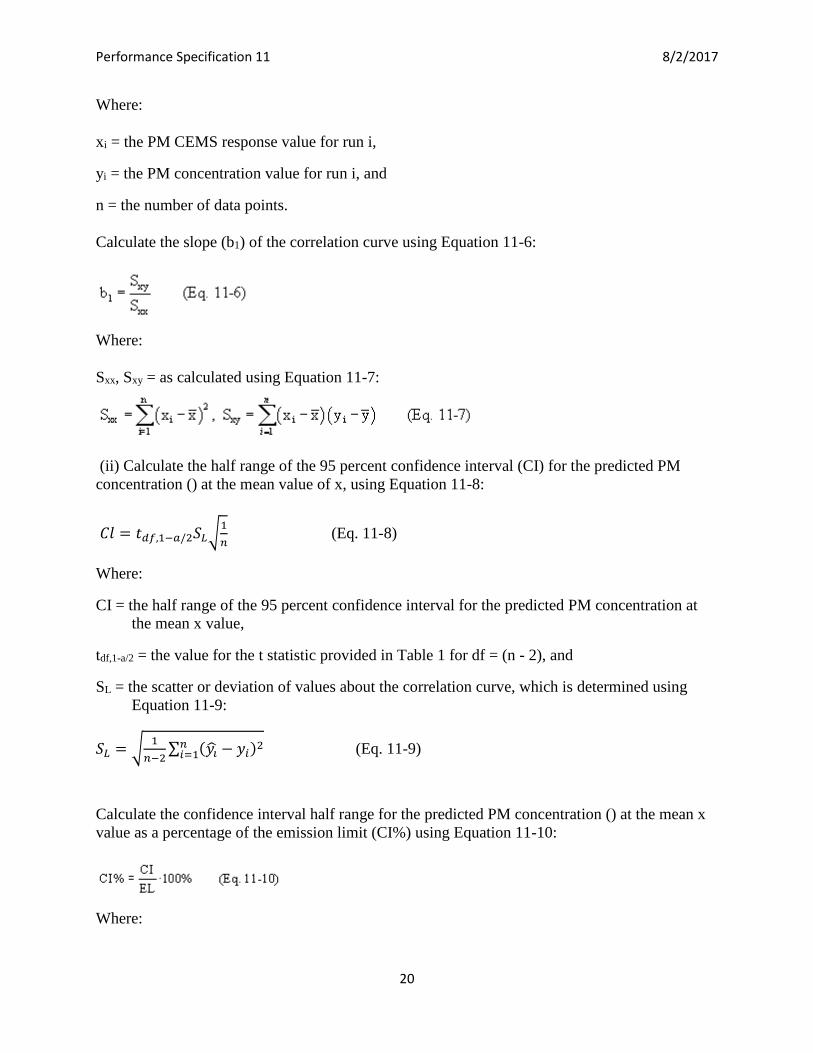
Calculate the slope (b1) of the correlation curve using Equation 11-6:
Where:
Sxx, Sxy = as calculated using Equation 11-7:
(ii) Calculate the half range of the 95 percent confidence interval (CI) for the predicted PM
concentration () at the mean value of x, using Equation 11-8:
𝐶𝑙 = 𝑡𝑑𝑓,1−𝑎/2𝑆𝐿√1
𝑛 (Eq. 11-8)
Where:
CI = the half range of the 95 percent confidence interval for the predicted PM concentration at
the mean x value,
tdf,1-a/2 = the value for the t statistic provided in Table 1 for df = (n - 2), and
SL = the scatter or deviation of values about the correlation curve, which is determined using
Equation 11-9:
𝑆𝐿 = √1
𝑛−2∑ (𝑦�� − 𝑦𝑖)2𝑛𝑖=1 (Eq. 11-9)
Calculate the confidence interval half range for the predicted PM concentration () at the mean x
value as a percentage of the emission limit (CI%) using Equation 11-10:
Where:
Performance Specification 11 8/2/2017
21
CI = the half range of the 95 percent confidence interval for the predicted PM concentration at
the mean x value, and
EL = PM emission limit, as described in section 13.2.
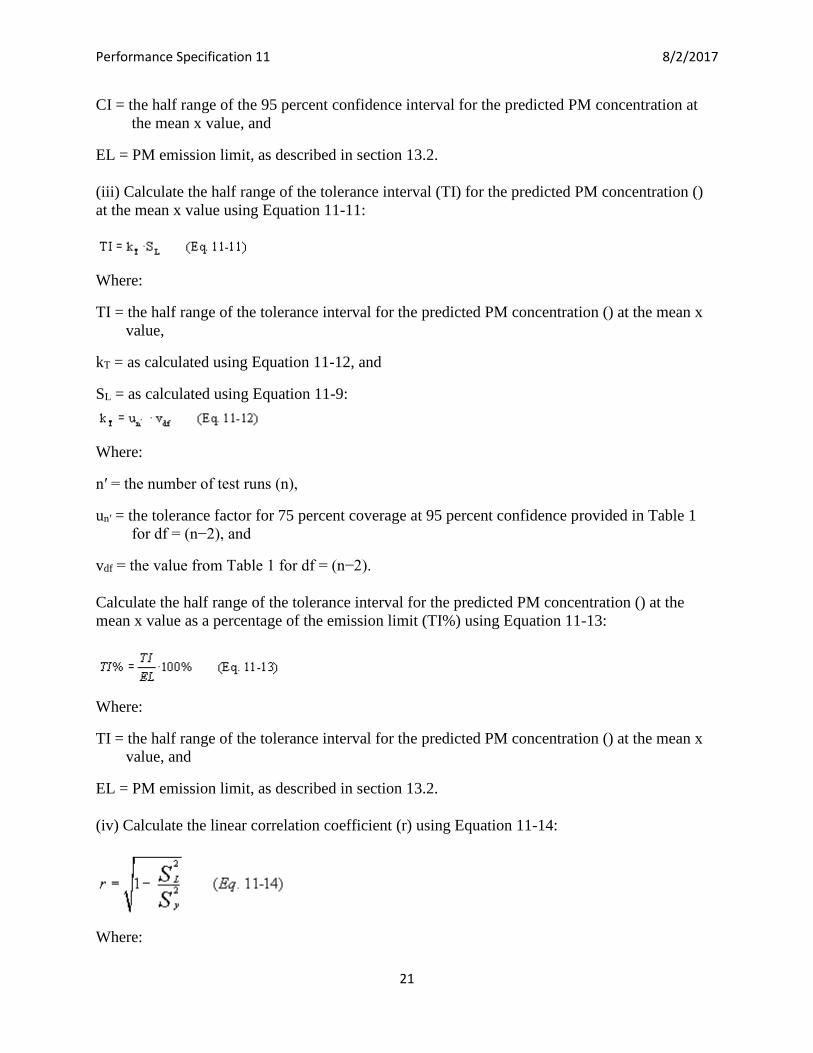
(iii) Calculate the half range of the tolerance interval (TI) for the predicted PM concentration ()
at the mean x value using Equation 11-11:
Where:
TI = the half range of the tolerance interval for the predicted PM concentration () at the mean x
value,
kT = as calculated using Equation 11-12, and
SL = as calculated using Equation 11-9:
Where:
n′ = the number of test runs (n),
un′ = the tolerance factor for 75 percent coverage at 95 percent confidence provided in Table 1
for df = (n−2), and
vdf = the value from Table 1 for df = (n−2).
Calculate the half range of the tolerance interval for the predicted PM concentration () at the
mean x value as a percentage of the emission limit (TI%) using Equation 11-13:
Where:
TI = the half range of the tolerance interval for the predicted PM concentration () at the mean x
value, and
EL = PM emission limit, as described in section 13.2.
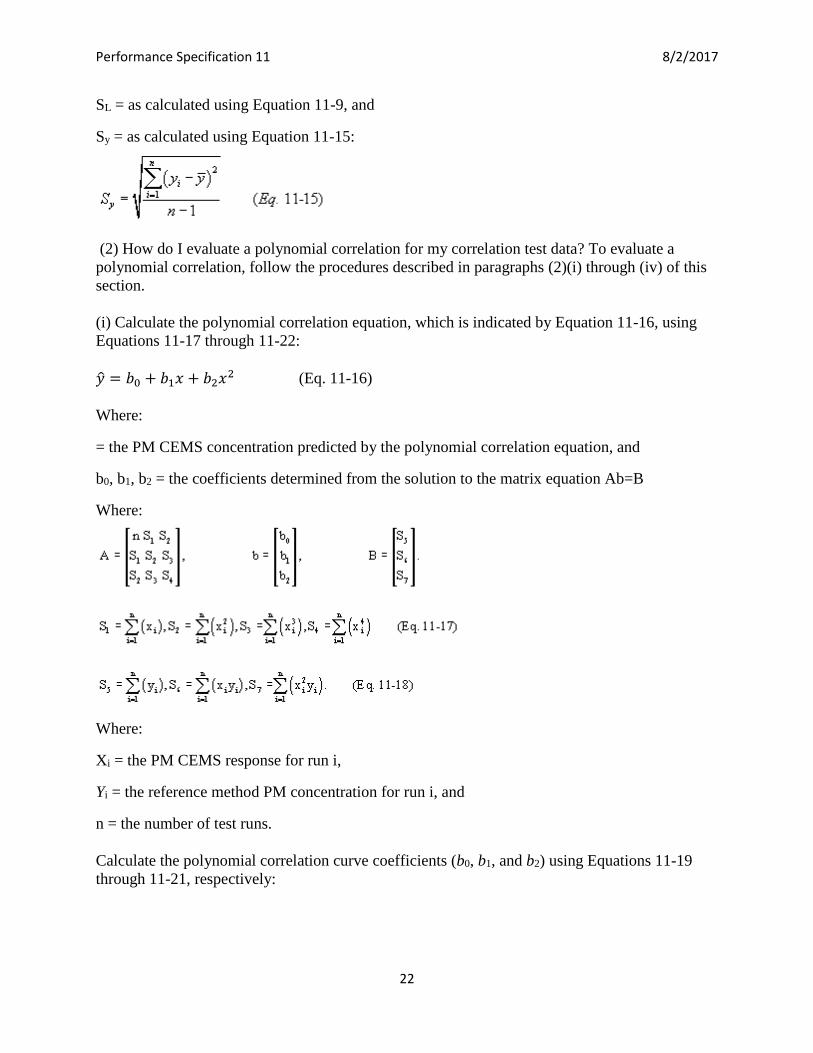
(iv) Calculate the linear correlation coefficient (r) using Equation 11-14:
Where:
Performance Specification 11 8/2/2017
22
SL = as calculated using Equation 11-9, and
Sy = as calculated using Equation 11-15:
(2) How do I evaluate a polynomial correlation for my correlation test data? To evaluate a
polynomial correlation, follow the procedures described in paragraphs (2)(i) through (iv) of this
section.
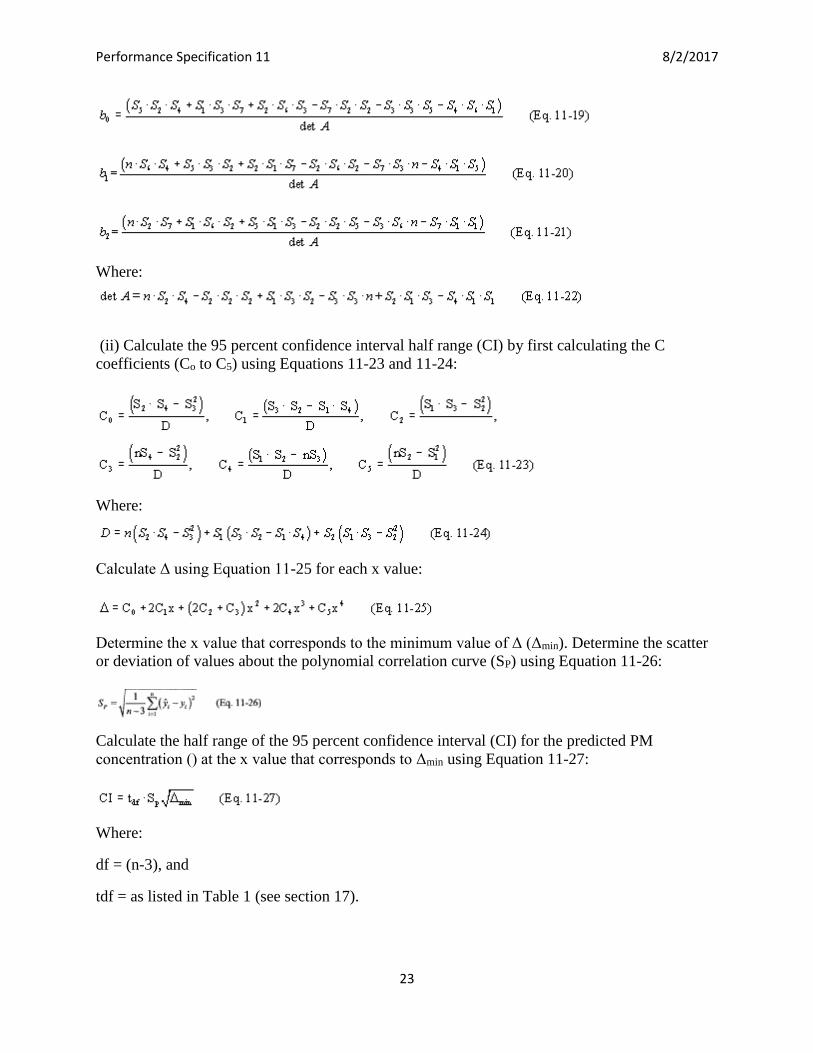
(i) Calculate the polynomial correlation equation, which is indicated by Equation 11-16, using
Equations 11-17 through 11-22:
�� = 𝑏0 + 𝑏1𝑥 + 𝑏2𝑥2 (Eq. 11-16)
Where:
= the PM CEMS concentration predicted by the polynomial correlation equation, and
b0, b1, b2 = the coefficients determined from the solution to the matrix equation Ab=B
Where:
Where:
Xi = the PM CEMS response for run i,
Yi = the reference method PM concentration for run i, and
n = the number of test runs.
Calculate the polynomial correlation curve coefficients (b0, b1, and b2) using Equations 11-19
through 11-21, respectively:
Performance Specification 11 8/2/2017
23
Where:
(ii) Calculate the 95 percent confidence interval half range (CI) by first calculating the C
coefficients (Co to C5) using Equations 11-23 and 11-24:
Where:
Calculate Δ using Equation 11-25 for each x value:
Determine the x value that corresponds to the minimum value of Δ (Δmin). Determine the scatter
or deviation of values about the polynomial correlation curve (SP) using Equation 11-26:
Calculate the half range of the 95 percent confidence interval (CI) for the predicted PM
concentration () at the x value that corresponds to Δmin using Equation 11-27:
Where:
df = (n-3), and
tdf = as listed in Table 1 (see section 17).
Performance Specification 11 8/2/2017
24
Calculate the half range of the 95 percent confidence interval for the predicted PM concentration
at the x value that corresponds to Δmin as a percentage of the emission limit (CI%) using
Equation 11-28:
Where:
CI = the half range of the 95 percent confidence interval for the predicted PM concentration at
the x value that corresponds to Δmin, and
EL = PM emission limit, as described in section 13.2.
(iii) Calculate the tolerance interval half range (TI) for the predicted PM concentration at the x
value that corresponds to Δmin, as indicated in Equation 11-29 for the polynomial correlation,
using Equations 11-30 and 11-31:
Where:
un′ = the value indicated in Table 1 for df = (n′-3), and
vdf = the value indicated in Table 1 for df = (n′—3).
Calculate the tolerance interval half range for the predicted PM concentration at the x value that
corresponds to Δmin as a percentage of the emission limit (TI%) using Equation 11-32:
Where:
TI = the tolerance interval half range for the predicted PM concentration at the x value that
corresponds to Δmin, and
EL = PM emission limit, as described in section 13.2.
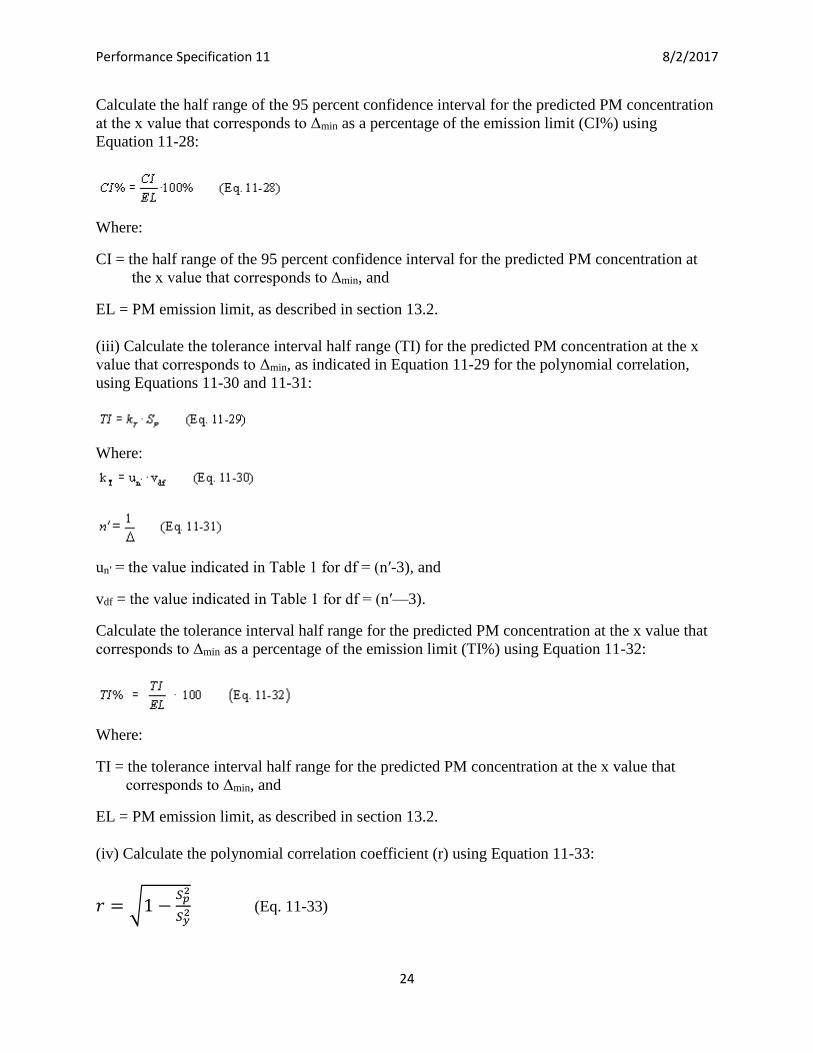
(iv) Calculate the polynomial correlation coefficient (r) using Equation 11-33:
𝑟 = √1 −𝑆𝑝2
𝑆𝑦2 (Eq. 11-33)
Performance Specification 11 8/2/2017
25
Where:
SP = as calculated using Equation 11-26, and
Sy = as calculated using Equation 11-15.
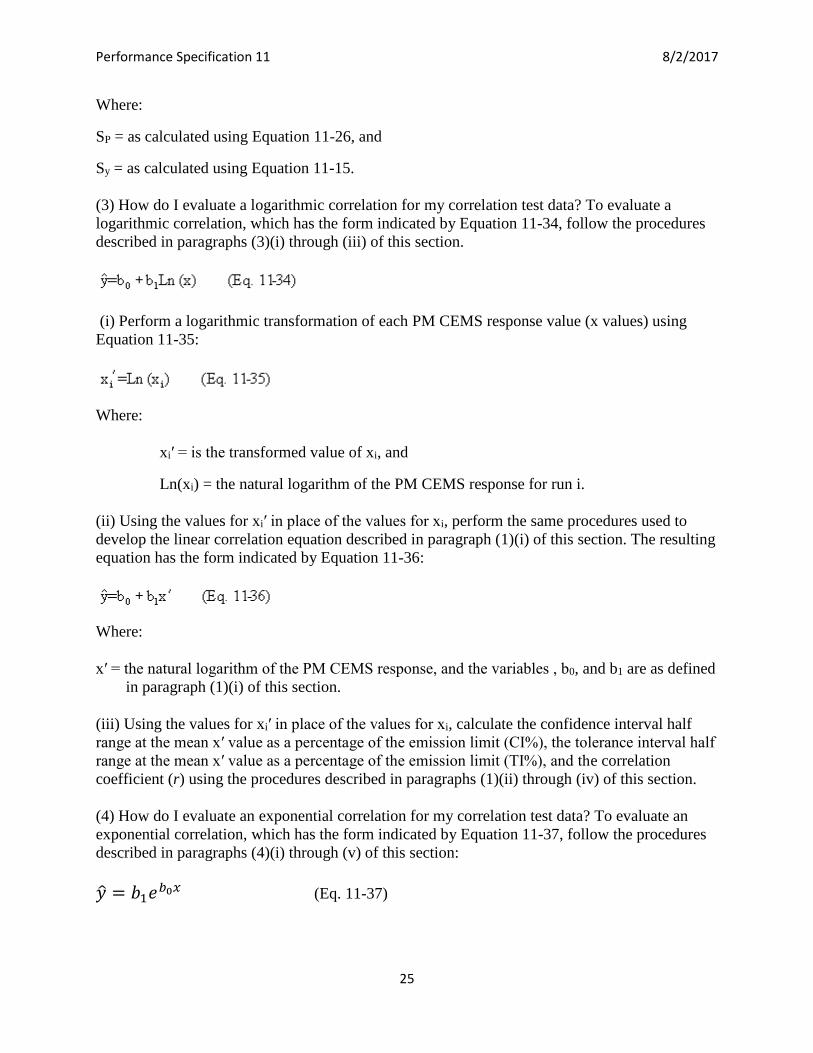
(3) How do I evaluate a logarithmic correlation for my correlation test data? To evaluate a
logarithmic correlation, which has the form indicated by Equation 11-34, follow the procedures
described in paragraphs (3)(i) through (iii) of this section.
(i) Perform a logarithmic transformation of each PM CEMS response value (x values) using
Equation 11-35:
Where:
xi′ = is the transformed value of xi, and
Ln(xi) = the natural logarithm of the PM CEMS response for run i.
(ii) Using the values for xi′ in place of the values for xi, perform the same procedures used to
develop the linear correlation equation described in paragraph (1)(i) of this section. The resulting
equation has the form indicated by Equation 11-36:
Where:
x′ = the natural logarithm of the PM CEMS response, and the variables , b0, and b1 are as defined
in paragraph (1)(i) of this section.
(iii) Using the values for xi′ in place of the values for xi, calculate the confidence interval half
range at the mean x′ value as a percentage of the emission limit (CI%), the tolerance interval half
range at the mean x′ value as a percentage of the emission limit (TI%), and the correlation
coefficient (r) using the procedures described in paragraphs (1)(ii) through (iv) of this section.
(4) How do I evaluate an exponential correlation for my correlation test data? To evaluate an
exponential correlation, which has the form indicated by Equation 11-37, follow the procedures
described in paragraphs (4)(i) through (v) of this section:
�� = 𝑏1𝑒𝑏0𝑥 (Eq. 11-37)
Performance Specification 11 8/2/2017
26
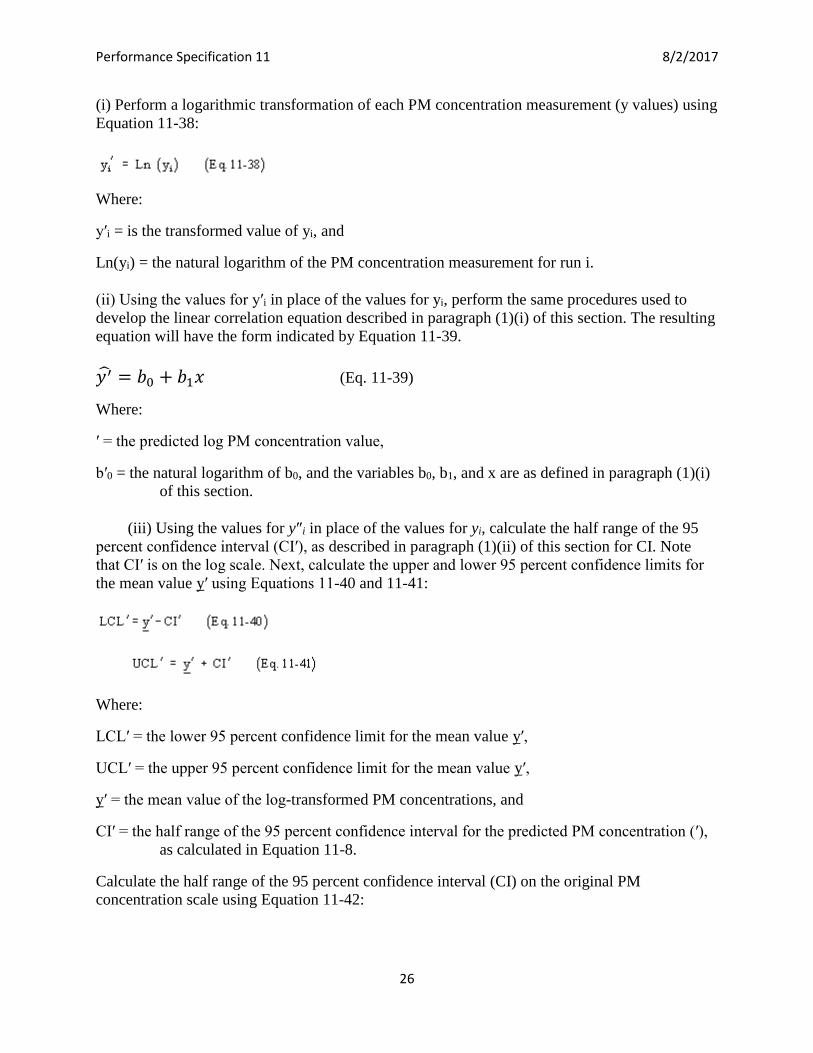
(i) Perform a logarithmic transformation of each PM concentration measurement (y values) using
Equation 11-38:
Where:
y′i = is the transformed value of yi, and
Ln(yi) = the natural logarithm of the PM concentration measurement for run i.
(ii) Using the values for y′i in place of the values for yi, perform the same procedures used to
develop the linear correlation equation described in paragraph (1)(i) of this section. The resulting
equation will have the form indicated by Equation 11-39.
𝑦 ′ = 𝑏0 + 𝑏1𝑥 (Eq. 11-39)
Where:
′ = the predicted log PM concentration value,
b′0 = the natural logarithm of b0, and the variables b0, b1, and x are as defined in paragraph (1)(i)
of this section.
(iii) Using the values for y″i in place of the values for yi, calculate the half range of the 95
percent confidence interval (CI′), as described in paragraph (1)(ii) of this section for CI. Note
that CI′ is on the log scale. Next, calculate the upper and lower 95 percent confidence limits for
the mean value y′ using Equations 11-40 and 11-41:
Where:
LCL′ = the lower 95 percent confidence limit for the mean value y′,
UCL′ = the upper 95 percent confidence limit for the mean value y′,
y′ = the mean value of the log-transformed PM concentrations, and
CI′ = the half range of the 95 percent confidence interval for the predicted PM concentration (′),
as calculated in Equation 11-8.
Calculate the half range of the 95 percent confidence interval (CI) on the original PM
concentration scale using Equation 11-42:

Performance Specification 11 8/2/2017
27
Where:
CI = the half range of the 95 percent confidence interval on the original PM concentration scale,
and UCL′ and LCL′ are as defined previously.
Calculate the half range of the 95 percent confidence interval for the predicted PM concentration
corresponding to the mean value of x as a percentage of the emission limit (CI%) using Equation
11-10.
(iv) Using the values for y′i in place of the values for yi, calculate the half range tolerance interval
(TI′), as described in paragraph (1)(iii) of this section for TI. Note that TI′ is on the log scale.
Next, calculate the half range tolerance limits for the mean value y′ using Equations 11-43 and
11-44:
Where:
LTL′ = the lower 95 percent tolerance limit for the mean value y′,
UTL′ = the upper 95 percent tolerance limit for the mean value y′,
y′, = the mean value of the log-transformed PM concentrations, and
TI′ = the half range of the 95 percent tolerance interval for the predicted PM concentration (′), as
calculated in Equation 11-11.
Calculate the half range tolerance interval (TI) on the original PM concentration scale using
Equation 11-45:
TI = the half range of the 95 percent tolerance interval on the original PM scale, and UTL′ and
LTL′ are as defined previously.
Calculate the tolerance interval half range for the predicted PM concentration corresponding to
the mean value of x as a percentage of the emission limit (TI%) using Equation 11-13.
(v) Using the values for y″i in place of the values for yi, calculate the correlation coefficient (r)
using the procedure described in paragraph (1)(iv) of this section.
Performance Specification 11 8/2/2017
28
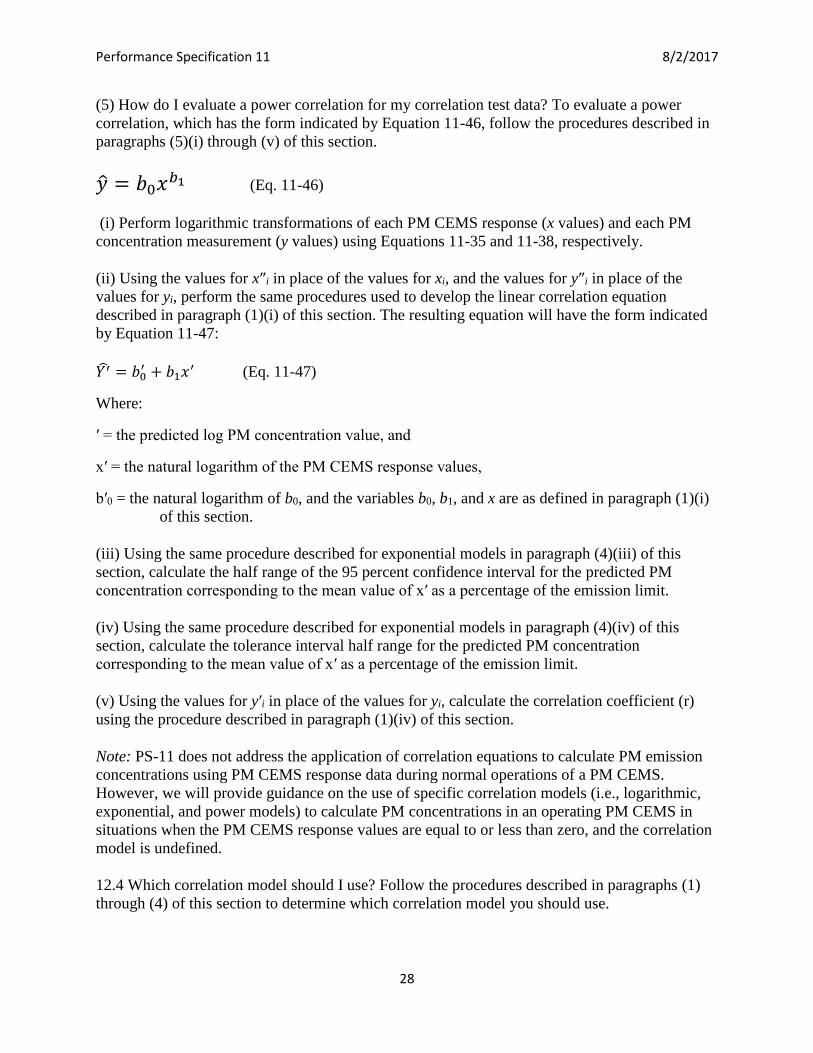
(5) How do I evaluate a power correlation for my correlation test data? To evaluate a power
correlation, which has the form indicated by Equation 11-46, follow the procedures described in
paragraphs (5)(i) through (v) of this section.
�� = 𝑏0𝑥𝑏1 (Eq. 11-46)
(i) Perform logarithmic transformations of each PM CEMS response (x values) and each PM
concentration measurement (y values) using Equations 11-35 and 11-38, respectively.
(ii) Using the values for x″i in place of the values for xi, and the values for y″i in place of the
values for yi, perform the same procedures used to develop the linear correlation equation
described in paragraph (1)(i) of this section. The resulting equation will have the form indicated
by Equation 11-47:
𝑌′ = 𝑏0′ + 𝑏1𝑥
′ (Eq. 11-47)
Where:
′ = the predicted log PM concentration value, and
x′ = the natural logarithm of the PM CEMS response values,
b′0 = the natural logarithm of b0, and the variables b0, b1, and x are as defined in paragraph (1)(i)
of this section.
(iii) Using the same procedure described for exponential models in paragraph (4)(iii) of this
section, calculate the half range of the 95 percent confidence interval for the predicted PM
concentration corresponding to the mean value of x′ as a percentage of the emission limit.
(iv) Using the same procedure described for exponential models in paragraph (4)(iv) of this
section, calculate the tolerance interval half range for the predicted PM concentration
corresponding to the mean value of x′ as a percentage of the emission limit.
(v) Using the values for y′i in place of the values for yi, calculate the correlation coefficient (r)
using the procedure described in paragraph (1)(iv) of this section.
Note: PS-11 does not address the application of correlation equations to calculate PM emission
concentrations using PM CEMS response data during normal operations of a PM CEMS.
However, we will provide guidance on the use of specific correlation models (i.e., logarithmic,
exponential, and power models) to calculate PM concentrations in an operating PM CEMS in
situations when the PM CEMS response values are equal to or less than zero, and the correlation
model is undefined.
12.4 Which correlation model should I use? Follow the procedures described in paragraphs (1)
through (4) of this section to determine which correlation model you should use.
Performance Specification 11 8/2/2017
29
(1) For each correlation model that you develop using the procedures described in section 12.3 of
this specification, compare the confidence interval half range percentage, tolerance interval half
range percentage, and correlation coefficient to the performance criteria specified in section 13.2
of this specification. You can use the linear, logarithmic, exponential, or power correlation
model if the model satisfies all of the performance criteria specified in section 13.2 of this
specification. However, to use the polynomial model you first must check that the polynomial
correlation curve satisfies the criteria for minimum and maximum values specified in paragraph
(3) of this section.
(2) If you develop more than one correlation curve that satisfy the performance criteria specified
in section 13.2 of this specification, you should use the correlation curve with the greatest
correlation coefficient. If the polynomial model has the greatest correlation coefficient, you first
must check that the polynomial correlation curve satisfies the criteria for minimum and
maximum values specified in paragraph (3) of this section.
(3) You can use the polynomial model that you develop using the procedures described in
section 12.3(2) if the model satisfies the performance criteria specified in section 13.2 of this
specification, and the minimum or maximum value of the polynomial correlation curve does not
occur within the expanded data range. The minimum or maximum value of the polynomial
correlation curve is the point where the slope of the curve equals zero. To determine if the
minimum or maximum value occurs within the expanded data range, follow the procedure
described in paragraphs (3)(i) through (iv) of this section.
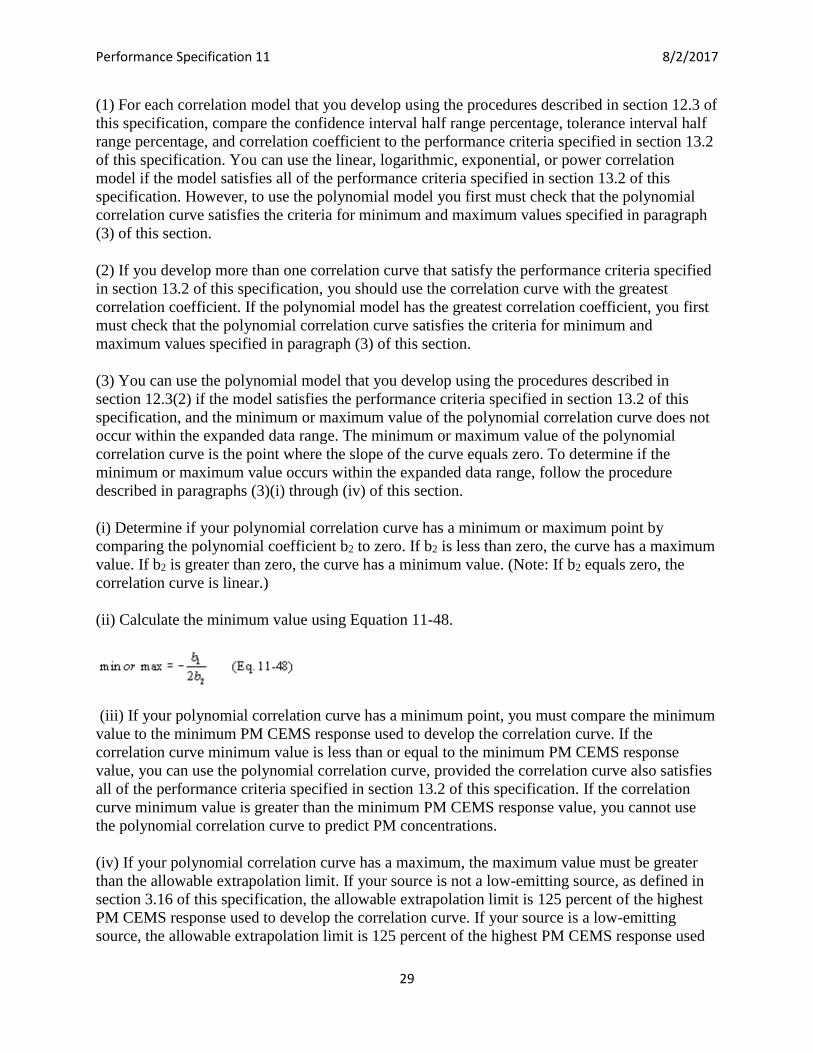
(i) Determine if your polynomial correlation curve has a minimum or maximum point by
comparing the polynomial coefficient b2 to zero. If b2 is less than zero, the curve has a maximum
value. If b2 is greater than zero, the curve has a minimum value. (Note: If b2 equals zero, the
correlation curve is linear.)
(ii) Calculate the minimum value using Equation 11-48.
(iii) If your polynomial correlation curve has a minimum point, you must compare the minimum
value to the minimum PM CEMS response used to develop the correlation curve. If the
correlation curve minimum value is less than or equal to the minimum PM CEMS response
value, you can use the polynomial correlation curve, provided the correlation curve also satisfies
all of the performance criteria specified in section 13.2 of this specification. If the correlation
curve minimum value is greater than the minimum PM CEMS response value, you cannot use
the polynomial correlation curve to predict PM concentrations.
(iv) If your polynomial correlation curve has a maximum, the maximum value must be greater
than the allowable extrapolation limit. If your source is not a low-emitting source, as defined in
section 3.16 of this specification, the allowable extrapolation limit is 125 percent of the highest
PM CEMS response used to develop the correlation curve. If your source is a low-emitting
source, the allowable extrapolation limit is 125 percent of the highest PM CEMS response used
Performance Specification 11 8/2/2017
30
to develop the correlation curve or the PM CEMS response that corresponds to 50 percent of the
emission limit, whichever is greater. If the polynomial correlation curve maximum value is
greater than the extrapolation limit, and the correlation curve satisfies all of the performance
criteria specified in section 13.2 of this specification, you can use the polynomial correlation
curve to predict PM concentrations. If the correlation curve maximum value is less than the
extrapolation limit, you cannot use the polynomial correlation curve to predict PM
concentrations.
(4) You may petition the Administrator for alternative solutions or sampling recommendations if
the correlation models described in section 12.3 of this specification do not satisfy the
performance criteria specified in section 13.2 of this specification.
13.0 What Are the Performance Criteria for My PM CEMS?
You must evaluate your PM CEMS based on the 7-day drift check, the accuracy of the
correlation, and the sampling periods and cycle/response time.
13.1 What is the 7-day drift check performance specification? Your daily PM CEMS internal
drift checks must demonstrate that the average daily drift of your PM CEMS does not deviate
from the value of the reference light, optical filter, Beta attenuation signal, or other technology-
suitable reference standard by more than 2 percent of the response range. If your CEMS includes
diluent and/or auxiliary monitors (for temperature, pressure, and/or moisture) that are employed
as a necessary part of this performance specification, you must determine the calibration drift
separately for each ancillary monitor in terms of its respective output (see the appropriate
performance specification for the diluent CEMS specification). None of the calibration drifts
may exceed their individual specification.
13.2 What performance criteria must my PM CEMS correlation satisfy? Your PM CEMS
correlation must meet each of the minimum specifications in paragraphs (1), (2), and (3) of this
section. Before confidence and tolerance interval half range percentage calculations are made,
you must convert the emission limit to the appropriate units of your PM CEMS measurement
conditions using the average of emissions gas property values (e.g., diluent concentration,
temperature, pressure, and moisture) measured during the correlation test.
(1) The correlation coefficient must satisfy the criterion specified in paragraph (1)(i) or (ii),
whichever applies.
(i) If your source is not a low-emitting source, as defined in section 3.16 of this specification, the
correlation coefficient (r) must be greater than or equal to 0.85.
(ii) If your source is a low-emitting source, as defined in section 3.16 of this specification, the
correlation coefficient (r) must be greater than or equal to 0.75.
(2) The confidence interval half range must satisfy the applicable criterion specified in paragraph
(2)(i), (ii), or (iii) of this section, based on the type of correlation model.
Performance Specification 11 8/2/2017
31
(i) For linear or logarithmic correlations, the 95 percent confidence interval half range at the
mean PM CEMS response value from the correlation test must be within 10 percent of the PM
emission limit value specified in the applicable regulation. Therefore, the CI% calculated using
Equation 11-10 must be less than or equal to 10 percent.
(ii) For polynomial correlations, the 95 percent confidence interval half range at the PM CEMS
response value from the correlation test that corresponds to the minimum value for Δ must be
within 10 percent of the PM emission limit value specified in the applicable regulation.
Therefore, the CI% calculated using Equation 11-28 must be less than or equal to 10 percent.
(iii) For exponential or power correlations, the 95 percent confidence interval half range at the
mean of the logarithm of the PM CEMS response values from the correlation test must be within
10 percent of the PM emission limit value specified in the applicable regulation. Therefore, the
CI% calculated using Equation 11-10 must be less than or equal to 10 percent.
(3) The tolerance interval half range must satisfy the applicable criterion specified in paragraph
(3)(i), (ii), or (iii) of this section, based on the type of correlation model.
(i) For linear or logarithmic correlations, the half range tolerance interval with 95 percent
confidence and 75 percent coverage at the mean PM CEMS response value from the correlation
test must be within 25 percent of the PM emission limit value specified in the applicable
regulation. Therefore, the TI% calculated using Equation 11-13 must be less than or equal to 25
percent.
(ii) For polynomial correlations, the half range tolerance interval with 95 percent confidence and
75 percent coverage at the PM CEMS response value from the correlation test that corresponds
to the minimum value for Δ must be within 25 percent of the PM emission limit value specified
in the applicable regulation. Therefore, the TI% calculated using Equation 11-32 must be less
than or equal to 25 percent.
(iii) For exponential or power correlations, the half range tolerance interval with 95 percent
confidence and 75 percent coverage at the mean of the logarithm of the PM CEMS response
values from the correlation test must be within 25 percent of the PM emission limit value
specified in the applicable regulation. Therefore, the TI% calculated using Equation 11-13 must
be less than or equal to 25 percent.
13.3 What are the sampling periods and cycle/response time? You must document and maintain
the response time and any changes in the response time following installation.
(1) If you have a batch sampling PM CEMS, you must evaluate the limits presented in
paragraphs (1)(i) and (ii) of this section.
(i) The response time of your PM CEMS, which is equivalent to the cycle time, must be no
longer than 15 minutes. In addition, the delay between the end of the sampling time and
reporting of the sample analysis must be no greater than 3 minutes. You must document any
changes in the response time following installation.
Performance Specification 11 8/2/2017
32
(ii) The sampling time of your PM CEMS must be no less than 30 percent of the cycle time. If
you have a batch sampling PM CEMS, sampling must be continuous except during pauses when
the collected pollutant on the capture media is being analyzed and the next capture medium starts
collecting a new sample.
13.4 What PM compliance monitoring must I do? You must report your CEMS measurements in
the units of the standard expressed in the regulations (e.g., mg/dscm @ 7 percent oxygen, pounds
per million Btu (lb/mmBtu), etc.). You may need to install auxiliary data monitoring equipment
to convert the units reported by your PM CEMS into units of the PM emission standard.
14.0 Pollution Prevention [Reserved]
15.0 Waste Management [Reserved]
16.0 Which References Are Relevant to This Performance Specification?
16.1 Technical Guidance Document: Compliance Assurance Monitoring. U.S. Environmental
Protection Agency Office of Air Quality Planning and Standards Emission Measurement Center.
August 1998.
16.2 40 CFR 60, Appendix B, “Performance Specification 2—Specifications and Test
Procedures for SO2, and NOX, Continuous Emission Monitoring Systems in Stationary Sources.”
16.3 40 CFR 60, Appendix B, “Performance Specification 1—Specification and Test Procedures
for Opacity Continuous Emission Monitoring Systems in Stationary Sources.”
16.4 40 CFR 60, Appendix A, “Method 1—Sample and Velocity Traverses for Stationary
Sources.”
16.5 “Current Knowledge of Particulate Matter (PM) Continuous Emission Monitoring.” EPA-
454/R-00-039. U.S. Environmental Protection Agency, Research Triangle Park, NC. September
2000.
16.6 40 CFR 266, Appendix IX, section 2, “Performance Specifications for Continuous Emission
Monitoring Systems.”
16.7 ISO 10155, “Stationary Source Emissions—Automated Monitoring of Mass Concentrations
of Particles: Performance Characteristics, Test Procedures, and Specifications.” American
National Standards Institute, New York City. 1995.
16.8 Snedecor, George W. and Cochran, William G. (1989), Statistical Methods, Eighth Edition,
Iowa State University Press.
16.9 Wallis, W. A. (1951) “Tolerance Intervals for Linear Regression,” in Second Berkeley
Symposium on Mathematical Statistics and Probability, ed. J. Neyman, Berkeley: University of
California Press, pp. 43-51.
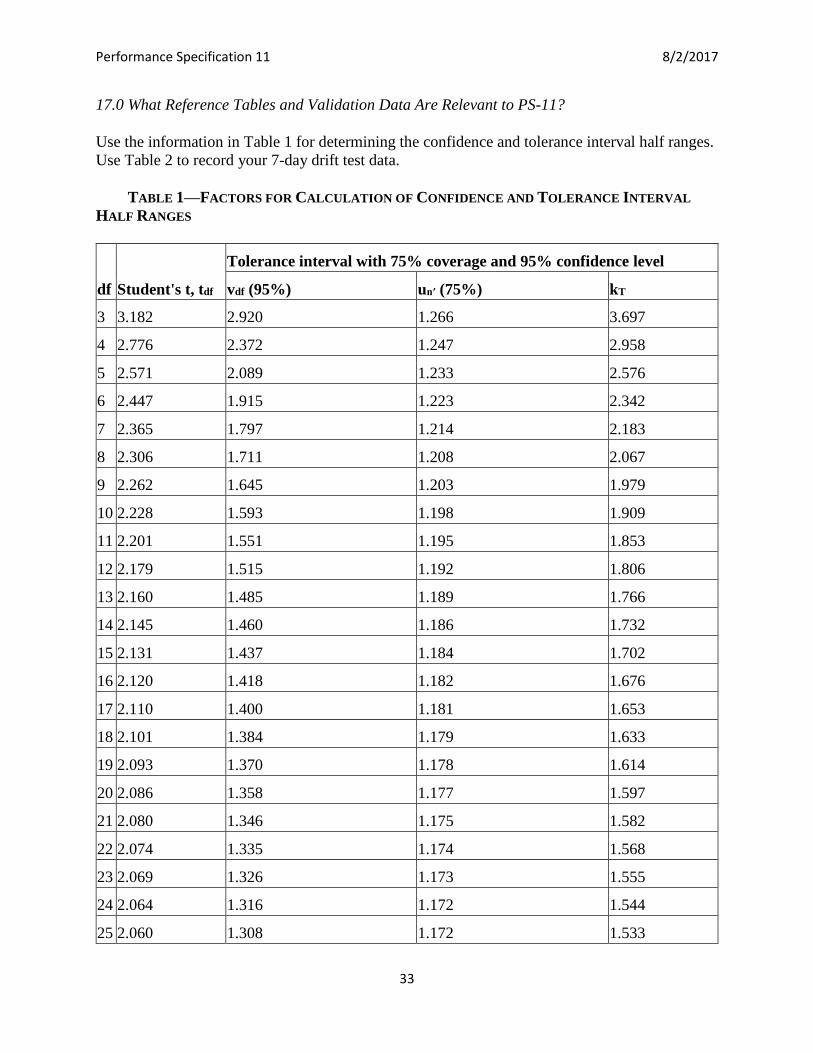
Performance Specification 11 8/2/2017
33
17.0 What Reference Tables and Validation Data Are Relevant to PS-11?
Use the information in Table 1 for determining the confidence and tolerance interval half ranges.
Use Table 2 to record your 7-day drift test data.
TABLE 1—FACTORS FOR CALCULATION OF CONFIDENCE AND TOLERANCE INTERVAL
HALF RANGES
df Student's t, tdf
Tolerance interval with 75% coverage and 95% confidence level
vdf (95%) un′ (75%) kT
3 3.182 2.920 1.266 3.697
4 2.776 2.372 1.247 2.958
5 2.571 2.089 1.233 2.576
6 2.447 1.915 1.223 2.342
7 2.365 1.797 1.214 2.183
8 2.306 1.711 1.208 2.067
9 2.262 1.645 1.203 1.979
10 2.228 1.593 1.198 1.909
11 2.201 1.551 1.195 1.853
12 2.179 1.515 1.192 1.806
13 2.160 1.485 1.189 1.766
14 2.145 1.460 1.186 1.732
15 2.131 1.437 1.184 1.702
16 2.120 1.418 1.182 1.676
17 2.110 1.400 1.181 1.653
18 2.101 1.384 1.179 1.633
19 2.093 1.370 1.178 1.614
20 2.086 1.358 1.177 1.597
21 2.080 1.346 1.175 1.582
22 2.074 1.335 1.174 1.568
23 2.069 1.326 1.173 1.555
24 2.064 1.316 1.172 1.544
25 2.060 1.308 1.172 1.533
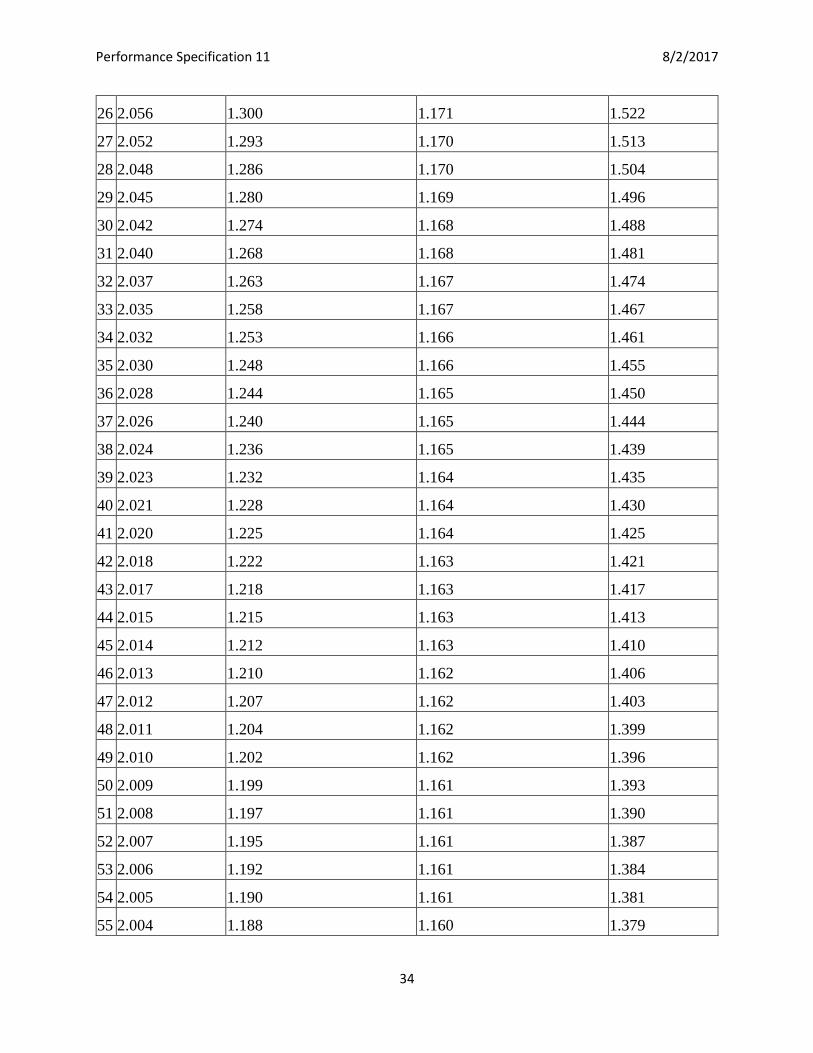
Performance Specification 11 8/2/2017
34
26 2.056 1.300 1.171 1.522
27 2.052 1.293 1.170 1.513
28 2.048 1.286 1.170 1.504
29 2.045 1.280 1.169 1.496
30 2.042 1.274 1.168 1.488
31 2.040 1.268 1.168 1.481
32 2.037 1.263 1.167 1.474
33 2.035 1.258 1.167 1.467
34 2.032 1.253 1.166 1.461
35 2.030 1.248 1.166 1.455
36 2.028 1.244 1.165 1.450
37 2.026 1.240 1.165 1.444
38 2.024 1.236 1.165 1.439
39 2.023 1.232 1.164 1.435
40 2.021 1.228 1.164 1.430
41 2.020 1.225 1.164 1.425
42 2.018 1.222 1.163 1.421
43 2.017 1.218 1.163 1.417
44 2.015 1.215 1.163 1.413
45 2.014 1.212 1.163 1.410
46 2.013 1.210 1.162 1.406
47 2.012 1.207 1.162 1.403
48 2.011 1.204 1.162 1.399
49 2.010 1.202 1.162 1.396
50 2.009 1.199 1.161 1.393
51 2.008 1.197 1.161 1.390
52 2.007 1.195 1.161 1.387
53 2.006 1.192 1.161 1.384
54 2.005 1.190 1.161 1.381
55 2.004 1.188 1.160 1.379
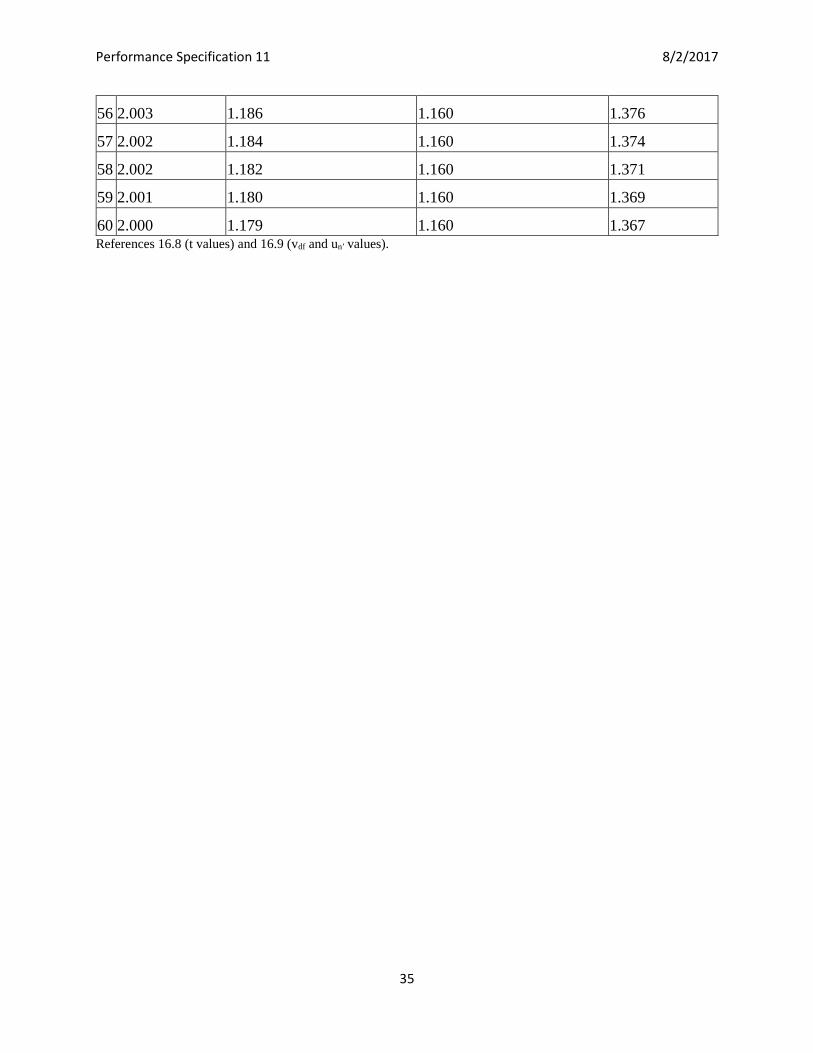
Performance Specification 11 8/2/2017
35
56 2.003 1.186 1.160 1.376
57 2.002 1.184 1.160 1.374
58 2.002 1.182 1.160 1.371
59 2.001 1.180 1.160 1.369
60 2.000 1.179 1.160 1.367 References 16.8 (t values) and 16.9 (vdf and un′ values).
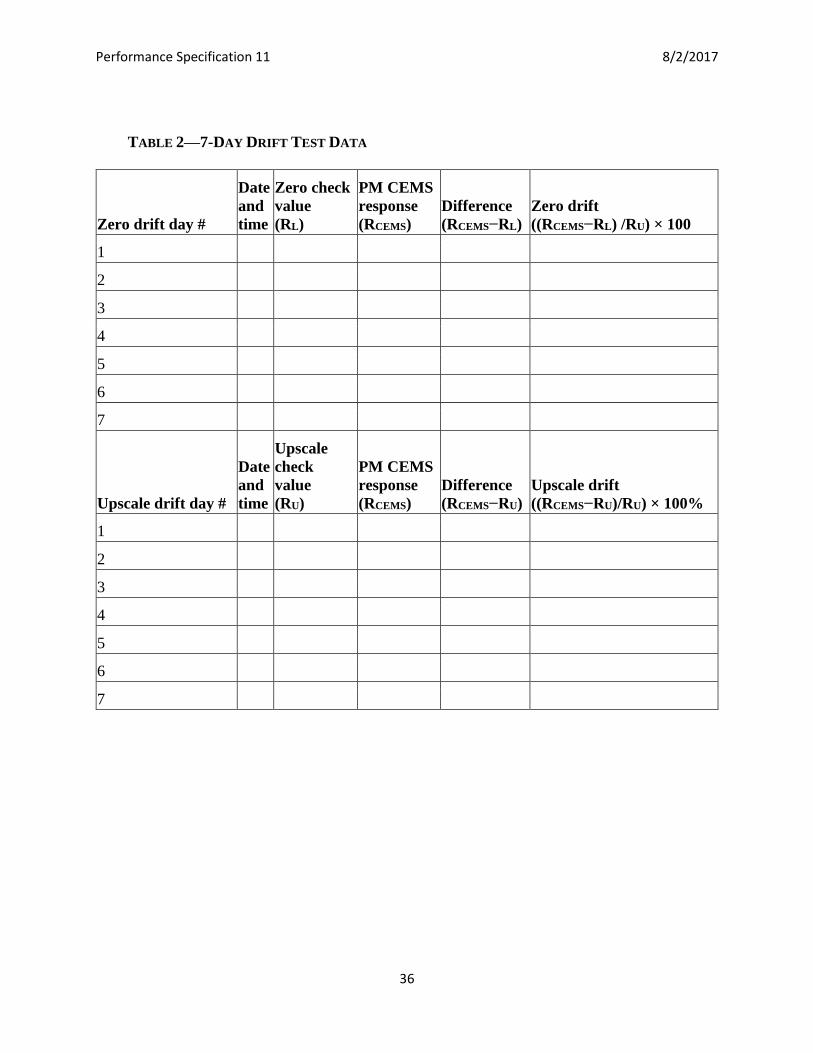
Performance Specification 11 8/2/2017
36
TABLE 2—7-DAY DRIFT TEST DATA
Zero drift day #
Date
and
time
Zero check
value
(RL)
PM CEMS
response
(RCEMS)
Difference
(RCEMS−RL)
Zero drift
((RCEMS−RL) /RU) × 100
1
2
3
4
5
6
7
Upscale drift day #
Date
and
time
Upscale
check
value
(RU)
PM CEMS
response
(RCEMS)
Difference
(RCEMS−RU)
Upscale drift
((RCEMS−RU)/RU) × 100%
1
2
3
4
5
6
7