periodic review of the 1995 water quality control plan for the san francisco bay/sacramento-san...
TRANSCRIPT

Periodic Review of the 1995 Water Quality Control Plan for the San Francisco Bay/Sacramento-San
Joaquin Delta Estuary
Comments of
The Bay Institute
on
Vernalis Flow ObjectiveFebruary-April 14 and May 16-June 30
March 21, 2005

0
5000
10000
15000
20000
25000
0
10000
20000
30000
40000
50000
Flo
w (
cfs)
05000
10000150002000025000
05000
1000015000200002500030000
WY 2004Dry
WY 2003Below Normal
WY 2002Dry
WY 2001Dry
O N D J F M A M J J A S
Unimpaired
Actual
0
10000
20000
30000
40000WY 2000
Above Normal
San Joaquin River flows at Vernalis are subject to
greatest alteration during
ecologically critical February-
June period

Actual Vernalis flows as % of unimpaired:
2004: 23.5%
2003: 17.7%
2002: 19.9%
2001: 31.2%
2000: 38.5%
0
5000
10000
15000
20000
25000
0
10000
20000
30000
40000
50000
Flo
w (
cfs)
05000
10000150002000025000
05000
1000015000200002500030000
WY 2004Dry
WY 2003Below Normal
WY 2002Dry
WY 2001Dry
O N D J F M A M J J A S
Unimpaired
Actual
0
10000
20000
30000
40000WY 2000
Above Normal

SJ flow at Vernalis as % of unimpaired and total Delta inflow
1930 1940 1950 1960 1970 1980 1990 2000
Pe
rce
nt
(%)
0
5
10
15
20
25
30
35 SJ Basin runoff as % of total runoff
SJ basin flow (Vernalis) as % of total Delta inflow
SJ unimpaired as % of total unimpaired:no signif change over time, 1930-2004 average = 22.8%
SJ actual (Vernalis) as % of actual total Delta inflow:Significant decline over time (p<0.05)1930-2004 av. = 12.6%1996-2004 av = 11.7%2002-2004 av = 7.2%
1930 1940 1950 1960 1970 1980 1990 2000
Pe
rce
nt
(%)
0
5
10
15
20
25
30
35 SJ Basin runoff as % of total runoff
SJ basin flow (Vernalis) as % of total Delta inflow
Relative contribution of San Joaquin Basin to Delta inflow has declined

SJ flow at Vernalis as % of unimpaired and total Delta inflow
1930 1940 1950 1960 1970 1980 1990 2000
Pe
rce
nt
(%)
0
5
10
15
20
25
30
35 SJ Basin runoff as % of total runoff
SJ basin flow (Vernalis) as % of total Delta inflow
SJ unimpaired as % of total unimpaired:no signif change over time, 1930-2004 average = 22.8%
SJ actual (Vernalis) as % of actual total Delta inflow:Significant decline over time (p<0.05)1930-2004 av. = 12.6%1996-2004 av = 11.7%2002-2004 av = 7.2%
1930 1940 1950 1960 1970 1980 1990 2000
Pe
rce
nt
(%)
0
5
10
15
20
25
30
35 SJ Basin runoff as % of total runoff
SJ basin flow (Vernalis) as % of total Delta inflow
2003: 6.4%2004: 6.2%
Relative contribution of San Joaquin Basin to Delta inflow has declined

San Joaquin Basin Fall-run Chinook SalmonStanislaus, Tuolumne, and Merced Rivers only
Esc
apem
ent
(# o
f fi
sh)
0
20000
40000
60000
80000NaturalHatchery1967-1991 averageDoubling goal
1950 1960 1970 1980 1990 2000
Ret
urn
Rat
io
"co
ho
rt r
epla
cem
ent
rate
"
0
2
4
6
8
10
12Return RatioReturn Ratio = 1(population stable)
RR > 1 population increaseRR < 1 population decline
San Joaquin Basin Chinook
salmon populations are below the 1967-
1991 average and declining
San Joaquin Basin Fall-run Chinook salmon

S a c r a m e n t o B a s i n W i n t e r - r u n C h i n o o k S a l m o n
1 9 5 0 1 9 6 0 1 9 7 0 1 9 8 0 1 9 9 0 2 0 0 0
Es
ca
pe
me
nt
(# o
f fi
sh)
0
2 0 0 0 0
4 0 0 0 0
6 0 0 0 0
8 0 0 0 0
1 0 0 0 0 0
1 2 0 0 0 0
S a c r a m e n t o B a s i n S p r i n g - r u n C h i n o o k S a l m o n
Es
ca
pe
men
t (#
of
fish
)
0
1 0 0 0 0
2 0 0 0 0
3 0 0 0 0
S a c r a m e n t o B a s i n F a l l - r u n C h i n o o k S a l m o n
1 9 5 0 1 9 6 0 1 9 7 0 1 9 8 0 1 9 9 0 2 0 0 0
Es
cap
em
ent
(# o
f fi
sh)
0
2 0 0 0 0 0
4 0 0 0 0 0
6 0 0 0 0 0
8 0 0 0 0 0 N a t u r a lH a t c h e r y1 9 6 7 - 1 9 9 1 a v e r a g eD o u b l i n g g o a l
Winter-run
Spring-run
Fall-run
Sacramento Basin Chinook Salmon
In contrast, Sacramento
Basin Chinook salmon
populations have stabilized
or increased
Favorable ocean conditions and
improvements in freshwater flow
and habitat

Vernalis Flow (March-June, average cfs)
0 10000 20000 30000R
etu
rn R
atio
0
2
4
6
8
10
12
Vernalis Flow (March-June, average cfs)
0 10000 20000 30000
Es
ca
pe
me
nt
(# o
f fi
sh
)
0
20000
40000
60000
80000Regression: Escapement = 6632 + 1.6(average spring flow, cfs)
n = 47, p<0.001, r2 = 0.475
2003 Return Ratio = 0.4Most juveniles emigrated in 2001
2004 Return Ratio = 0.5Most juveniles emigrated in 2002
San Joaquin Basin Chinook salmon population size is directly related to Vernalis
flows during the juvenile outmigration
Since 1995 WQCP implemented

Vernalis Flow (March-June, average cfs)
0 10000 20000 30000
Ret
urn
Rat
io
0
2
4
6
8
10
12
Vernalis Flow (March-June, average cfs)
0 10000 20000 30000
Es
ca
pe
me
nt
(# o
f fi
sh
)
0
20000
40000
60000
80000Regression: Escapement = 6632 + 1.6(average spring flow, cfs)
n = 47, p<0.001, r2 = 0.475
2003 Return Ratio = 0.4Most juveniles emigrated in 2001
2004 Return Ratio = 0.5Most juveniles emigrated in 2002
Since 1995 WQCP implemented
Population growth (return ratio) is also related to Vernalis flows during juvenile outmigration
1 -

Vernalis Flow (March-June, average cfs)
0 10000 20000 30000
Ret
urn
Rat
io
0
2
4
6
8
10
12
Vernalis Flow (March-June, average cfs)
0 10000 20000 30000
Es
ca
pe
me
nt
(# o
f fi
sh
)
0
20000
40000
60000
80000Regression: Escapement = 6632 + 1.6(average spring flow, cfs)
n = 47, p<0.001, r2 = 0.475
2003 Return Ratio = 0.4Most juveniles emigrated in 2001
2004 Return Ratio = 0.5Most juveniles emigrated in 2002
Since 1995 WQCP implemented
Population increase: 94% of years with flows >5000cfs
Population decrease: 60% of years with flows <5000 cfs
1 -

2D Graph 2
San Joaquin River flow:Export ratio(March-June)
0 1 2 3 5 10 15 20
Re
turn
Ra
tio
0
2
4
6
8
10
12
Ratio of Vernalis flows to Delta export rates also affects population growth (return ratio)
Since 1995 WQCP implemented
-1
2003 return ratio = 0.42004 return ratio = 0.5

2D Graph 2
San Joaquin River flow:Export ratio(March-June)
0 1 2 3 5 10 15 20
Re
turn
Ra
tio
0
2
4
6
8
10
12
Population increase: 95% of years with flow:export >1.0
Population decrease: 67% of years with flow:export <1.0
Since 1995 WQCP implemented
-1
2003 return ratio = 0.42004 return ratio = 0.5
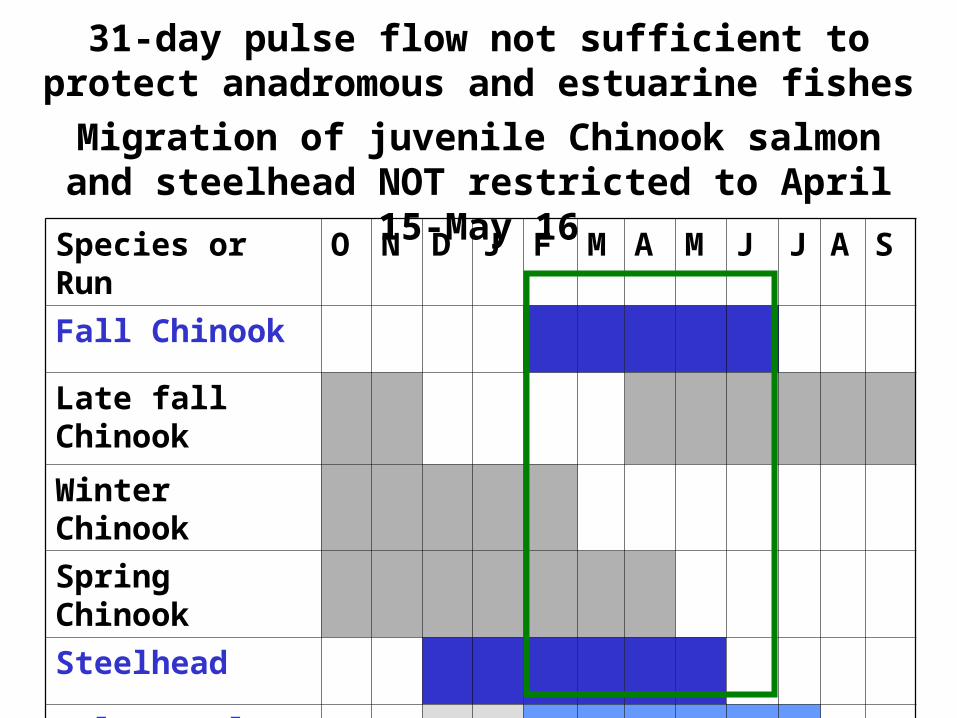
Species or Run O N D J F M A M J J A S
Fall Chinook
Late fall Chinook
Winter Chinook
Spring Chinook
Steelhead
Delta smelt
31-day pulse flow not sufficient to protect anadromous and estuarine fishes
Migration of juvenile Chinook salmon and steelhead NOT restricted to April 15-May 16

1970 1975 1980 1985 1990 1995 2000 2005
Ve
rna
lis
flo
w:E
xp
ort
ra
tio
0
1
2
3
101520
April 15-May 15 (VAMP) March 15-April 14 May 16-June 15
Flow:export ratio conditions before and after the 31-day pulse flow are poor and worsening
Restricted migration period reduces genetic and phenotypic diversity

Region % of Fishes That Are Native Species
1967-2001
mean (±1 standard error)
South Delta 0.3% (±0.4)
Central Delta 10% (±2)
North Delta 29% (±3)
West Delta 49% (±4)
Inadequate Vernalis flows degrade estuarine habitat in the south and central Delta
Prevalence of non-native species is a well-documented indicator of degraded habitat
CDFG Fall Midwater Trawl Survey

Freyer and Healey (2003)
Sampled: March-November 1992-1999
• Only 24% of species and 0.5% of fish in south Delta were native species
• Fish species composition in south Delta related to flow
• Native fishes associated with higher flows

Vernalis: <1800 cfsExports: >7500 cfsSJR:Export ratio: 1:4 (0.24)
Freshwater inflows to south Delta are important to many estuarine fishes

Abu
ndan
ce In
dex
0
10
20
30
40
50
60
70
1960 1970 1980 1990 20000
300
600
900
1200
1500
Summer Townet Survey(juvenile delta smelt)
Fall Midwater Trawl Survey(subadult & adult delta smelt)
Abu
ndan
ce In
dex
Delta smelt population
has declined to record low
levels

Recommendation
SWRCB should revise the Bay-Delta Plan to adopt more protective Vernalis flow objectives for the February-April 14 and May 16-June period.
Monthly Vernalis objectives should be based on criteria relating to hydrology, San Joaquin Basin contributions to Delta inflow, and fish and estuarine habitat needs.

Vernalis flows should be:
1. Based on annual and monthly hydrology2. Based on relative contribution of San Joaquin
Basin to Delta inflow (>20% of total minimum require Delta inflow in BN, D and C years; >10% of actual Delta inflow in W, AN, and BN years)
3. >5000 cfs for three consecutive months in W and AN years, >5000 cfs for two consecutive months in BN years
4. >1500 cfs in all months, all years5. <7000 cfs to allow installation of the Head of Old
River Barrier6. Linked to export rates to achieve March-June
Vernalis:export ratio >1.0

Month Water Year Type
W AN BN D C
Feb 3420 3420 2280 2280 1500
March 5000 5000 3420 2280 1500
April 1-14 7000 5000 5000 5000 2000
April 15-May 15
31-day flow objective as determined by VAMP experimental design
May 16-31 7000 5000 5000 3420 2000
June 5000 5000 3420 2280 1500
Proposed Vernalis flows (monthly average) February-April 14, May 16-June

0
5000
10000
15000
20000
25000
0
10000
20000
30000
40000
50000
Flo
w (
cfs)
05000
10000150002000025000
05000
1000015000200002500030000
WY 2004Dry
WY 2003Below Normal
WY 2002Dry
WY 2001Dry
O N D J F M A M J J A S
Unimpaired
Actual
0
10000
20000
30000
40000WY 2000
Above Normal
Proposed Vernalis flows
for Water Years 2000-2004

0
5000
10000
15000
20000
25000
0
10000
20000
30000
40000
50000
Flo
w (
cfs)
05000
10000150002000025000
05000
1000015000200002500030000
WY 2004Dry
WY 2003Below Normal
WY 2002Dry
WY 2001Dry
O N D J F M A M J J A S
Unimpaired
Actual
0
10000
20000
30000
40000WY 2000
Above Normal
2004: 108 TAF27% (v 24%) of unimpaired
2003: 357 TAF27% (v 18%)
2002: 204 TAF26% (v 20%)
2001: 54 TAF33% (v 31%)
2000: 0 TAF38% (v 38%)