persistent episodes of current account imbalances
TRANSCRIPT

Persistent Episodes of Current Account Imbalances: An Empirical
Analysis
Daniel Riera Crichton∗∗∗∗
Abstract
This paper empirically documents the important differences between persistent episodes of current account surplus and current account deficits in the last four decades. Motivated by a reversal of global imbalances in the last decades, results derived from this study show how persistent surplus episodes, associated to emerging markets in Asia and net exporters of natural resources, are driven by official capital flows, leave countries internationally more exposed and are less persistent than deficit episodes in developing economies. Positive imbalances seem to be prolonged by high investment or low domestic saving, slow output growth, improvements in the terms of trade and wide spreads between domestic and world interest rates. In contrast, high levels of international reserves and inflation increase the probability of a reversal. Opposite to the aftermath of persistent deficits, reversals from surplus episodes trigger massive inflows of private capital, significantly increasing output growth but surprisingly leaving the real effective exchange rate mainly unaltered. The paper is divided into three main sections. First, I analyze the economic performance of countries while running persistent imbalances. Second, I use a logit model to study the determinants of reversals at the end of these episodes. Finally, I examine the economic consequences of these reversals.
∗ I’m indebted to my dissertation advisor Michael Dooley for his guidance and support, also special thanks to Joshua Aizenman, Ricard Gil, Michael Hutchison, Thorsten Janus and Garima Vasishta for valuable comments and suggestions. Please find further data appendixes at the URL: abacus.bates.edu/~drieracr/MyWebpage.html. All errors are mine

- 2 -
Introduction
The persistent and growing negative external balances experienced by the US economy in
recent years have relived the debate on the sustainability of current account deficits, as
well as generated interest by many researchers and policy makers on what the
consequences are of such episodes. Moreover, another phenomenon has emerged in
recent years, large and persistent episodes of current account surpluses. The fact that this
is a relatively rare phenomenon has fostered discussion on their determinants, their
consequences and the factors that may drive them to an end. Nevertheless, thorough
empirical studies on the consequences of running these imbalances seem to be non-
existent. The main contribution of this paper is to fill this gap by providing an exhaustive
empirical analysis of the stylized facts surrounding both, positive and negative persistent
external imbalances in the last four decades.
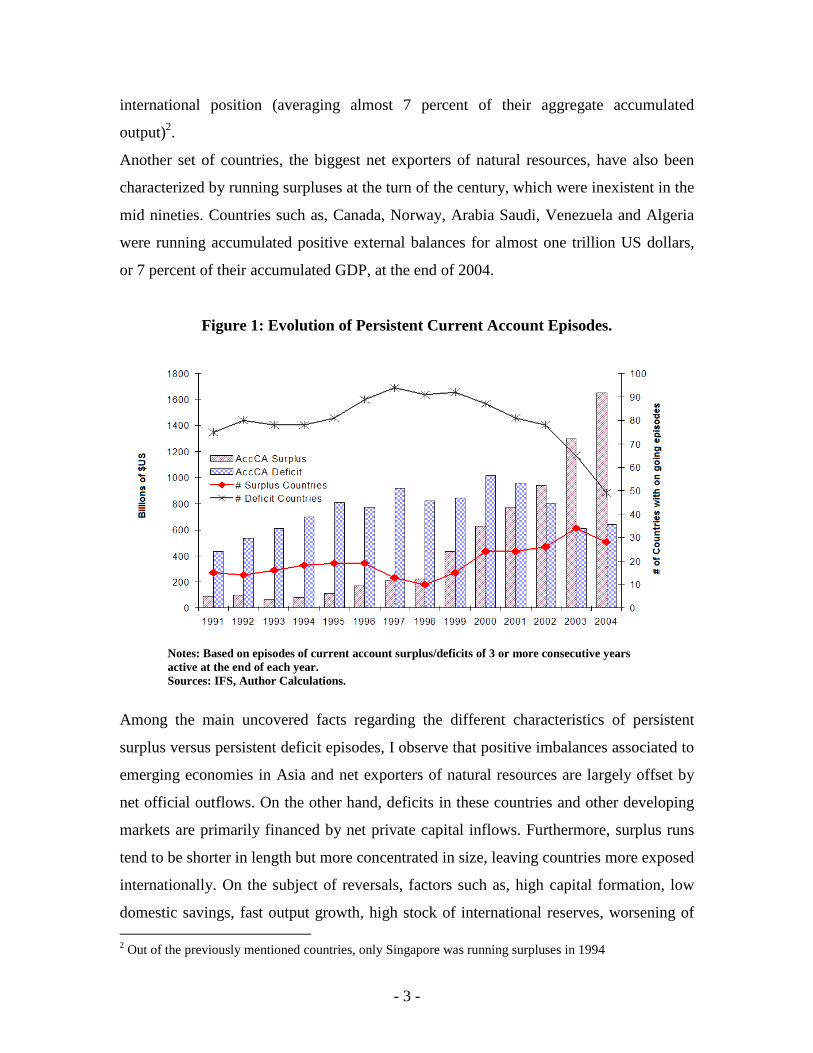
A key motivational aspect for this paper relies on the extraordinary evolution of
persistent episodes of current account surpluses1 in the last fifteen years. At the end of the
year 2004, approximately thirty developing countries were running persistent episodes of
positive current account balances for a cumulative volume of almost 1.7 trillion $US,
representing 20 times the volume accumulated by 1994, when only eighteen developing
countries were involved in persistent episodes (see Figure 1). Although this seems to be a
common trend across developing countries, the numbers are more dramatic when we
focus on East Asian economies. A significant share of the global imbalances literature
has paid attention to the two giants in the region, Japan and China (with accumulated
surpluses of 2 and 0.3 $US trillion respectively), as the natural counterparts of the
growing deficits in the United States. In spite of both countries large volume of
accumulated surplus, it only represents 2.55 percent of their total output.
A less acknowledged fact is that, in 2004, all the newly industrialized economies (NIE)
in South Asia; namely, Korea, Hong Kong, Singapore, Taiwan, Malaysia, Indonesia
Thailand and Philippines, were involved in surplus episodes with a much more exposed
1 Throughout the paper, we somewhat arbitrarily define a persistent current account episode as 3 or more consecutive years of either surplus or deficit balances. Changing the definition for a higher number of years does not change the main stylized facts derived in the paper
- 3 -
international position (averaging almost 7 percent of their aggregate accumulated
output)2.
Another set of countries, the biggest net exporters of natural resources, have also been
characterized by running surpluses at the turn of the century, which were inexistent in the
mid nineties. Countries such as, Canada, Norway, Arabia Saudi, Venezuela and Algeria
were running accumulated positive external balances for almost one trillion US dollars,
or 7 percent of their accumulated GDP, at the end of 2004.
Figure 1: Evolution of Persistent Current Account Episodes.
Notes: Based on episodes of current account surplus/deficits of 3 or more consecutive years active at the end of each year. Sources: IFS, Author Calculations.
Among the main uncovered facts regarding the different characteristics of persistent
surplus versus persistent deficit episodes, I observe that positive imbalances associated to
emerging economies in Asia and net exporters of natural resources are largely offset by
net official outflows. On the other hand, deficits in these countries and other developing
markets are primarily financed by net private capital inflows. Furthermore, surplus runs
tend to be shorter in length but more concentrated in size, leaving countries more exposed
internationally. On the subject of reversals, factors such as, high capital formation, low
domestic savings, fast output growth, high stock of international reserves, worsening of 2 Out of the previously mentioned countries, only Singapore was running surpluses in 1994
- 4 -
terms of trade and wide domestic versus world interest rate spreads have a symmetrically
opposite effect on the probability of reversals; helping sustain deficits and increasing the
changes of ending surplus episodes. Inflation seems to be a factor associated to the
ending of both types of persistent imbalances. Appreciation of real effective exchange
rates, even though a key element in prolonging deficits, seems to be fairly unrelated to
reversals from surplus episodes. Finally, reversals in both types of episodes are also
followed by substantial turnarounds in the positions of net private capital flows. Output
growth reacts immediately to surplus reversals with an average slowdown above 1
percent; meanwhile it takes two periods for output growth to accelerate after the end of
deficit episodes. Divergences also arise in the reaction of real effective exchange rates to
current account reversals. Whereas reversals from deficits are followed by significant real
depreciations, real exchange rates remain fairly impervious to reversals from surplus
episodes.
In section 1, I describe the economic characteristics of countries operating under
persistent current account episodes. We specifically center on the length distribution of
these, where the financial flows offsetting/financing them originate, and the economic
performance of countries undergoing persistent current account runs. Section 2 presents a
Conditional fixed-effects logistic regression to expose the main factors associated with
reversals at the end of the episodes. In section 3, I turn to a graphical analysis
surrounding the end-game for each run to analyze the reactions of output, net private
flows and real exchange rates to current account reversals after persistent episodes.
Section 4 concludes.

- 5 -
1. Economic Characteristics of Countries Running Persistent Current Accounts.
Current Account Dynamics: Evidence and Theory.
In this section, I consider the distribution of different extent of current account
imbalances. We divide the sample between industrialized (mainly OECD countries) and
developing countries (See Figure 2).
Figure 2: Length distribution of current account runs.
Notes: Each observation represents an episode of either current account surplus or deficit. Episodes may include any number of years Source: Author Calculations
Regarding these distributions, a series of significant regularities and asymmetric behavior
emerge:
First, in both sets of countries, most of the density of the distribution is concentrated
around 0. To this extent, 70 percent of the current account imbalances in developing
countries and 67 percent of those in industrial countries last 5 years or less.
Second, there is a significant difference in the mass of the distribution reserved for the
shortest runs (1 and 2 years) between developing and industrial countries (approximately
49 and 42 percent, respectively).

- 6 -
Third, short periods of positive current account balances seem to be the most frequent
occurrence. This fact is more prominent in the case of developing countries, where 30
percent of all observations are reserved for episodes of 1 or 2 years of current account
surpluses.
Fourth, in contrast to the length distribution in industrial countries, which proves to be
fairly symmetric around 0 (skewness equal to -.36), developing countries show a strong
left-skewed distribution indicating a long end of deficit episodes.
With respect to the theoretical standpoint, I divide the study of the current account
persistence distribution in two segments. The first section helps understand the dynamic
behavior of current account around the economy’s steady state equilibrium. In the second
segment, I use a long run approach to study the behavior of external balances when the
economy is distant from its steady state equilibrium and there are frictions impeding
immediate adjustments.
Going beyond traditional static models where the current account was merely a residual
only important for the determination of current output, I apply a dynamic-optimizing
approach to better understand the dynamics involved in the movements of the current
account. We start with a quick review of the basic identities defining the current account
balance. Using the gross national product (GNP) of an economy as the sum of its
consumption, investment, public expenditure, net exports and net interest earnings on
debt, and acknowledging that current account (CA) is defined as net exports plus net
interest earnings; we have that GNP ≡ Private Consumption + Investment + Public
Expenditure + Net Exports – World Interest * Net International Investment Position (IIP).
Defining Gross Domestic Savings (Sd) as GNP minus Private Consumption and Public
Expenditure, we have the following key identity:
KAIIPInvestmentSCA d ≡∆=−≡
where KA refers to capital account. This identity establishes a direct link between the
dynamics of the CA and the optimizing behavior of consumption (savings) and
- 7 -
investment. Using this key link and relying on auto-correlated productivity shocks, Razin
(1993) demonstrates that changes in CA depend on how consumption and investment
respond to different kinds of shocks. Under permanent productivity shocks, investment
increases and the permanent income hypothesis ensures that consumption soars in excess
of the surge in output creating a negative shock for the current account. In the case of a
non-permanent shock, investment would barely react and consumption smoothing
through asset accumulation would ensure a positive shock to the current account3.
By definition, in an economy with zero growth steady state, output, net exports, stock of
foreign assets, capital stock and consumption will not grow forcing CA=∆IIP=0. The
implication is that the current account balance around the steady state would be a
stationary mean-zero-variable with its dynamics dominated by the stochastic productivity
shocks mentioned above.
In order to better understand the persistence associated with the current account around a
zero-growth steady-state-equilibrium, I employ a simplified small open economy4 model,
where I consider investment, as well as, government expending exogenous and equal to
zero. A further simplification tool is the use of the linear-quadratic utility function,
commonly used in “Permanent Income” models. With output modeled as an
autoregressive variable around its equilibrium value:
11 *)(* ++ +−=− ttt YYYY εβ
The CA becomes:
ttt rYYrCA εβββ ),(*))(,( 1 Ψ+−Ψ= −
Where the first term represents the expected next period deviation of output from its
permanent level at period t-1, and the second is just the expectations adjustment at period
t. Most importantly, the first term in this equation shows that the current account has a
predictable component. Following Aizenman (2006), in the vicinity of the steady state we
can transform this equation in:
3 See Glick and Rogoff (1992) 4 See Obsfeld and Rogoff (1996)
- 8 -
ttt rcaca εββ ),(1 Ψ+≈ −
Where lower case represents the variable deflated by current output. In this study,
Aizenman also finds clear evidence of stationarity for the deflated current account
balance. Moreover, the estimated coefficient on the AR (1) process over a large set of
countries is close to ½, indicating a relatively fast reversion to mean and complementing
my first empirical result in the distribution of CA runs. The fact that developing countries
exhibit a significantly higher mean reversion than industrial countries also corroborates
my second empirical finding.
CA dynamics around steady-state equilibriums help us comprehend some of the
properties displayed by the length distributions of CA episodes. Nevertheless, two
important questions regarding the highly negative skewness and the excess of short
surplus runs in the developing countries distribution remain unanswered.
In order to explain these two issues, we need to deviate from the vicinity of steady-state
equilibriums. Following Taylor’s argumentation5, if we take a Solovian small open
economy with no exogenous growth6, low capital to labor ratio and frictions for the
installation of new capital, this economy will persistently borrow to invest and to smooth
consumption given its level of permanent income. Such economy is bounded by its long
run budget constraint:
0)(1)1( =+−
+−
∞→ itti
iBERLim
This constraint forces the expected present discounted value (by private agents with
information sets limited to t-1) of future holding of foreign assets to be zero. Under these
limitations, each country’s borrowing will be restricted by the private agent’s perception
of their ability to pay in the future (through the accumulation of net exports):
5 See Taylor (2002). 6 Deterministic growth would give us a similar result as long as we deflated the variables in question by current output.

- 9 -
∑∞
=+−
+−− −=
011
11 )(
itt
it NetExportsERB 7
According to this framework, developing countries with capital scarcity and difficulties
to quickly integrate capital formation will assume a debtor role during prolonged periods
of time as long as private agents continue to perceive the country as “solvent”. In order to
reinforce this theoretical conclusion, I examine the relationship between initial levels of
investment and the length of current account deficit episodes.
Figure 1 below displays the expected negative correlation between investment levels and
episode duration for developing countries. The fact that the ability to borrow depends on
private agents expectations renders the conversion process towards steady state
equilibrium unstable. If new information reduces the expected solvency of the country, its
ability to borrow will be greatly limited, possibly resulting in a premature end to its
current account run. The subsequent forced surplus will be a short period of adjustment
until investors regain confidence and start pouring capital in the country again.
7 This equation is derived from the fact that in steady state 10 −−≡== tt BBKACA see Trehan and
Walsh (1991) for the derivation.

- 10 -
Figure 1: Initial Investment Per Capita vs. CA Deficit Persistence in Developing
Countries and Emerging Markets in Latin America.
Notes: Investment per capita refers to Gross Capital Formation per inhabitant. The variable “Years” is the total amount of years per episode of current account deficit. The reported regressions are OLS with robust standard errors. Sources: Wdi, Author calculations

- 11 -
This development theory provides not only a framework to account for the “Deficit-
Skewned” distribution in developing countries, but also some insight to explain the
excess distribution mass captured by 1 and 2 year surplus (about 30 percent of the total
distribution). If surplus years are just the intermission between deficit episodes while
private agents adjust their expectations; hence, the average time span between CA
deficits in developing countries should be lower than that in industrial economies.
Besides, as shown in my empirical test, most of the surplus distribution should be
compressed in the 1 and 2 year episodes. In order to support this argument, Table 1
calculates the average time span between the end of a persistent episode of current
account deficit (surplus) and the next reversal back to CA deficits (surplus). In the table
below, we observe that, following our premise, it takes developing countries
approximately 2 years less than their industrial counterparts (on average) to go back to
CA deficits . The extreme case comes forth in Latin America with emerging economies
average time span of only 2.7 years.
Table 1: Time Span between CA Episodes.
Average Time between episodes (years)
Surplus Deficits
All countries 5.2 3.6
Industrial 6.2 5.3
Developing 4.9 3.4
South/East Asia (NIE) 7 4.3
Latin America 4.9 2.7
Natural Resource Countries 3.8 4.4
Manufactures Countries 5.1 5.6
Notes: See appendix for definitions of country subgroups. The condition to trigger the accounting of each time span is that the country ends an episode of 3 or more years of current account imbalance
Source: Author Calculations
- 12 -
Towards Persistent Current Account Surpluses
The theoretical framework mentioned above offers a simple scenario. In general, the CA
is stationary around steady state with its dynamics generated from persistent stochastic
shocks to the economy, affecting optimal inter-temporal income-saving decisions. In
particular, emergent economies run CA deficits as part of their “natural” development
strategies.
This view is clearly asymmetric, in the sense that, it is difficult to imagine countries with
high capital to labor ratio running persistent current account surpluses to meet their
steady state equilibriums8. This framework reserves a “residual” role for positive CA
imbalances, where we find these occurrences as a result of either the inability of a
country to borrow or its temporary excess of domestic savings due to temporary positive
or permanent negative shocks to the economy.
In the last 10 years, current account surpluses have played a more prominent role than our
theoretical framework had reserved for them. Table 2, proves this point by providing a
snapshot comparison between persistent episodes (3 or more years) of global imbalances
measured at the end of 1994 and those at the end of 2004. This table presents a series of
interesting facts on the evolution of global imbalances in the last decade.
In absolute terms, both, global persistent deficits and surpluses have increased their face
value by 3.2 and 4.2 fold, respectively since the end of 1994, reaching 5.5 and 5.2 trillion
US dollars by the end 2004, respectively.
In relative terms, at the end of 2004, the weight of imbalances in terms of GDP increased
by approximately .5 percentage points in the case of deficit episodes and .6 percentage
points in the case of persistent surpluses.
There has been a rapid convergence between the number of economies under episodes of
persistent negative external balances and economies under positive balances. To this
regard, there were 87 countries running deficits at the end of 1994, more than 3.3 times
the amount of economies running surpluses. In 2004, only 57 of these economies were
running deficits, only 50 percent more than the number of countries running surpluses.
8 The possible exception is Switzerland, the country with the highest investment ratio per capita in the world, which conveniently has been running CA surpluses for the last 20 years
- 13 -
Table 2: Persistent Episodes of CA Imbalances at the end of 1994 and 2004
2004 1994
AccCA
($US B)
Countries
With On
Going
Episodes
CA/GDP
(%)
Years/
Run
AccCA
($US B)
Countries
With On
Going
Episodes
CA/GDP
(%)
Years/
Run
All Countries Surplus 5226 38 3.12 8.2 1289 26 2.52 5.1
Deficits 5593 57 3.08 14 1728 87 2.61 10.4
Industrial Surplus 3538 11 3.06 12.6 1208 8 2.47 7.5
Deficits 4953 8 2.99 17.6 1030 9 2.03 9.3
Developing Surplus 1688 27 3.25 6.5 81 18 3.75 4
Deficits 640 49 4.06 13.4 698 78 4.52 10.5
South/East Asia Surplus 2967 9 2.93 9.7 952 2 2.63 10.5
Deficits 0 0 0 0 166 5 2.49 10
South/East Asia (NIE) Surplus 914 8 4.39 8.1 34 1 10.95 7
Deficits 0 0 0 0 166 5 2.49 10
Latin America Surplus 69 3 6.7 4 0 0 0 0
Deficits 326 10 3.38 20 229 14 4.82 13.8
Natural Resources Surplus 827 8 6.67 7.8 49 3 2.6 6
Deficits 589 2 3.7 24 646 7 4.57 10.9
Manufactures Surplus 2607 6 2.66 10 964 4 2.29 5.8
Deficits 50 1 0.78 5 97 1 1.23 4
Notes: South/East Asia (NIE) excludes Japan from the subgroup South/East Asia Sources: IFS, Author Calculations
The evolution of the previously mentioned episodes in industrial and developing
countries cannot be characterized in any other way than a complete reversal. Industrial
economies, which, at the end of 1994, displayed predominating surpluses, reversed their
position, multiplying the face value of deficits almost by 5 times. The economic weight
of these episodes also changed significantly with an increase of approximately half a
percentage point for surpluses and nearly a full percentage point of GDP for deficits.
Mainly, this increase can be attributed to the international position of the United States,
which, with 3.3 trillion dollars of external deficits accumulated in the last 10 years,
accounts for more than 60 percent of the total accumulated deficits from industrial
economies. On the other side of the fence, Japan, with 1.1 trillion dollars in accumulated
surplus since 1994, represents practically a third of the total accumulated surplus in these
economies.

- 14 -
The shift in developing countries is even more salient. Whereas the face value of
accumulated deficits in 2004 marginally decreased from 1994, the face value of
persistence surplus increased 20 fold for a grand total of almost 1.7 trillion dollars.
Emerging markets in South/East Asia represent an extreme example of this shifting
tendency in the sign of persistent CA imbalances. In 1994, about half of these economies
were running persistent deficits and only Singapore was running continuing surpluses.
Ten years later, all of these economies were involved in persistent current account
surpluses for a face value of almost 1 trillion dollars.
Another interesting subgroup of countries is composed by the top net exporters of natural
resources. These countries have also experienced an impressive change in their net
external positions in the last 10 years. Out of the seven countries engaged in deficits in
1994, only Australia, with a long history of deficits and South Africa, continued to run
negative balances in 2004. The remaining countries shifted to positive balances with
joined surpluses in excess of .8 trillion dollars, 17 times the face value of joined surpluses
in 1994. The change in size of these imbalances relative to aggregate output is also
remarkable with a net increase slightly above 4 percentage points.
Finally, Emerging markets in Latin America seem to break the trend and the region
remained a bastion of negative balances. Curiously enough, the only three Latin
American economies running surpluses in 2004 were Argentina, Venezuela and Chile.
While the former was coming out of its 2001 crisis, the latter belong to the group of top
natural resource exporters.
Supported by the facts exposed above, this paper highlights the fact that persistent surplus
episodes have adopted a prominent role in global imbalances in the last decade. This
important role may have its roots on export-led-growth (ELG) developing strategies and
new stabilization policies from countries exporting natural resources.
Depending on each of these different roots, CA surpluses originate from distinct
dynamics in the Investment-Saving decisions. Figure 3 below illustrates the evolution of
investment and domestic savings for the cases of East Asian economies and natural
resource exporters in the last 15 years.

- 15 -
Figure 3: Investment-Saving Dynamics in East Asia and Natural Resource
Countries
Sources: Wdi, Author calculations
East Asian Economies
0
5
10
15
20
25
30
35
40
45
50
1990 1991 1992 1993 1994 1995 1996 1997 1998 1999 2000 2001 2002 2003 2004
Inve
stm
ent/
Sav
ing
as %
of
GD
P...
......
.
-6
-4
-2
0
2
4
6
8
10
Rea
l GD
P G
row
th (
%)
Average Investment
Average Gross Domestic Saving
Average Real GDP Growth Rate
Natural Resource Exporters
0
5
10
15
20
25
30
35
40
45
50
1990 1991 1992 1993 1994 1995 1996 1997 1998 1999 2000 2001 2002 2003 2004
Inve
stm
ent/
Sav
ing
as %
of
GD
P...
......
.
0
1
2
3
4
5
6
Rea
l GD
P G
row
th (
%)
Average Investment
Average Gross Domestic Saving
Average Real GDP Growth Rate

- 16 -
As we can observe, ELG is distinguished by substantial export growth, followed by high
rates of real output growth and, depending on the absorption ability of the economy, high
rates of domestic savings. If domestic savings are not matched with high levels of
investment (as in the case of East Asia after the 1997 crisis); then, “savings gluts” will
emerge and the external balance will turn positive.
In the case of Natural Resource countries, the use of fiscal stabilization policies (FSP)
around export revenues will cause an increase in domestic savings when revenues are
high. Given stable investment ratios, this burst of domestic savings will create persistent
positive external imbalances linked to high export revenue periods.
Economic Characteristics of Persistent CA Episodes
A key factor to understand the economics behind CA episodes is the origin of the capital
flows financing/offsetting these imbalances. From a theoretical point of view, we have
seen there is an incentive for developing markets to become long term international
debtors as long as international private creditors believe that the former are solvent in
terms of future net exports. To the extent that this is a win-win situation for private agents
(higher development in exchange of higher yields associated with higher growth); the
opportunities for official intervention are scarce, with the exception of policies limiting
the adverse effects of massive capital inflows9. In this scenario, we would expect the
fraction of CA deficits financed by official capital inflows to be minor. In contrast, a
common characteristic of the two possible roots of CA surplus mentioned above (ELG
and FSP) is the need of substantial official intervention for these policies to work. As for
ELG, these strategies require a subdued undervalued exchange rate. The combination of
capital controls and foreign market interventions are the only effective way of ensuring
the degree of export growth necessary for the development strategy to work. In the case
of FSP, the official sector creates stabilization funds, denominated in foreign assets, to
help inter-temporally smooth fiscal balances or simply act as saving funds for future
9 see Williamson (1995)
- 17 -
generations10. Given that these funds work through the official sector accumulating
foreign assets, we should expect surplus episodes in these economies to be offset for the
most part by official outflows.
The empirical evidence of this paper seems to support the previous set of assumptions. In
particular, table 3 below shows that official sectors in developing countries use capital
outflows to offset more than 56 percent of total CA surpluses during persistent episodes,
almost 10 percent more than the average official share for the entire period.
Table 3: Share of Official Financing/Offsetting of Current Account Episodes
Total Percentage of CA
Financed/Offset by
Official Flows
All Period (%)
Total Percentage of CA
Financed/Offset by
Official Flows
During Episodes (%)
Excess Official
Intervention
During the Episodes (%)
All Episodes Surplus Deficits Surplus Deficits
All countries 40.6 32.8 45.8 -7.8 5.2
Industrial 38.4 20.9 49.7 -17.5 11.3
Developing 45.8 56.2 34.8 10.4 -11
South/East Asia (NIE) 50.4 60.1 28.2 9.7 -22.2
Latin America 34.6 38.4 31.6 3.8 -3
Natural Resource Countries 44.1 56.7 29.5 12.6 -14.6
Manufactures Countries 30 41 45.1 11 15.1
Sources: Author Calculations
The reverse is true for persistent episodes of current account deficits, where private
inflows finance more than 73 percent of total CA deficits, 11 percent more than the
average during the whole period. As predicted, these effects are reinforced by such cases
as South/East Asian emerging markets and Natural Resources countries, with an official
share differential between surplus and deficit episodes of 32 and 27 percent, respectively.
Latin American economies, traditionally involved in persistent deficits, have their
10 Countries like Canada, Norway, Venezuela, Kuwait, Oman or Russia have started stabilization funds denominated in foreign assets. See Ossowski & Barnett (2001) for a deeper analysis of these funds and policies.

- 18 -
external balances clearly dominated by net private flows. Interestingly, industrial
economies display the opposite results, with private flows in the driver’s seat of surplus
episodes and official flows financing almost half the total of CA deficits. This result may
be in part the consequence of European economies massive intervention to defend their
overvalued currencies.
International Reserve Assets
International Reserve (IR) accumulation by surplus countries has captured the attention
of many researchers in recent years. Indeed, international reserves are at the core of my
previous analysis of official capital flows11. Table 4 provides an insight into the manner
in which countries manage their foreign liquid assets during persistent runs of CA.
Table 4: International Reserves Assets during Current Account Episodes.
(1)
Average Reserves
During Episode as
% of GDP
(2)
Average Excess
Reserves During
Episode
(3)
% Change of
Reserve Position
During Episode
(4)
Average Change
Of Reserves Per Year
As Percent of GDP
Surplus Deficits Surplus Deficits Surplus Deficits Surplus Deficits
All countries 15.97 9.84 1.85 -1.06 113.77 187.89 1.14 0.01
Industrial 6.27 5.57 0.03 -0.17 54.03 -2.97 0.38 -0.16
Developing 18.86 10.53 2.38 -1.23 132.02 221.57 1.37 0.05
South/East Asia (NIE) 26.61 11.06 4.77 -3.35 111.37 41.01 1.24 0.17
Latin America 11.05 6.98 1.29 -0.79 81.5 56.5 1.39 0.02
Natural Resource Countries 12.38 7.8 0.71 -1.33 70.81 20.97 0.85 -0.19
Manufactures Countries 5.64 4.67 0.5 -1.1 82.94 -4.02 0.31 -0.11
Sources: Author Calculations
The data displayed in the first two columns of table 4 confirm that, on average, the
holdings of international reserves are significantly higher during surplus episodes.
Similarly, during these persistent episodes of CA surplus, the average IR position
consistently exceeds the average over the whole sample. South/East Asia is worth
11 Some degree of international liquidity is always desirable for developing economies. See Aizenman and Marion (2002), Aizenman and Riera-Crichton (2006), Obsfeld et al (2008).

- 19 -
mentioning here as the extreme case with average IR holdings of approximately 26.6
percent of aggregate output and average excess holdings of nearly 4.8 percent of GDP.
The last two columns in table 4 provide information about the evolution of IR during the
different CA episodes. Column 3 seems to indicate that, on average, developing countries
increase their IR positions significantly during deficit runs. This result can be misleading,
since concluded from table 2, on average, persistent deficit episodes last twice as long as
persistent positive external balances. To obtain a more accurate proxy for reserves
accumulation intensity during persistent episodes of current account imbalances, I deflate
the change in the country’s IR position by the length of the episode. The results are
presented in column 4 above, where the change in IR is measured as yearly increases in
terms of GDP. This intensity measure provides a more realistic view of the dynamics of
IR associated with CA episodes. The new measure indicates that surplus episodes in
developing countries are characterized by severe accumulations of IR (1.37 percent of
GDP per year during the episodes). In contrast, deficit episodes in those countries are
distinguished by minor increments in their IR position (.05 percentage points per year). In
this case, even though close to zero, the positive accumulation of reserves may be
puzzling. We believe that sterilizations of net private capital inflows may lead to limited,
but positive increments of IR. As anticipated, NR countries display a positive correlation
between reserve accumulation and current account that can be associated with the works
of stabilization funds. Industrial countries exhibit this positive correlation, as well. The
active utilization of IR by countries defending their overvalued currencies may explain
the significant .16 percent GDP annual loss of IR during deficit periods in those
countries.
Real Aggregate Output Growth
According to our basic theoretical premises, current account dynamics can be positively
associated with persistent but non-permanent output shocks. Besides, countries using
international borrowing against future net exports to converge to their steady state will
grow at faster rates during CA deficits. ELG strategies are less committed to a specific
international position. With high output growth as a result of the development strategy,

- 20 -
the final CA sign will depend on the ability of the country to offset increases in gross
domestic savings with higher rates of investment.
Table 5 below displays the results of economies output performance during persistent CA
episodes. Industrial countries, presumably operating around their steady state, show a
small but positive correlation between excess output growth and the sign of current
account imbalances during the episodes. Latin American economies, paladins of net
borrowing as a development strategy, exhibit output growth rates during deficit episodes
twice as large as those of surplus episodes. These countries are clearly affected by their
short surplus periods (see table 1), experiencing growth rates lower by more than 1
percentage point per year during these episodes.
Table 5: Real GDP Growth during Episodes of Persistent CA
Average Yearly Real GDP Growth
During Episodes (%)
Average Excess Yearly Real GDP Growth
Over whole sample (%)
Surplus Deficits Surplus Deficits
All countries 3.8 3.54 0.27 0.02
Industrial 2.66 2.73 0.07 -0.09
Developing 4.14 3.67 0.32 0.03
South/East Asia (NIE) 6.3 6.64 -0.69 0.53
Latin America 1.74 3.73 -1.02 0.45
Natural Resource Countries 3.57 3.07 0.16 -0.61
Manufactures Countries 3.71 3.76 0.55 0.01
Sources: Wdi, Author calculations
South/East Asian markets reveal a similar pattern. However, due to their high growth
rates during the entire period, the relative impact of different CA imbalances is
significantly smaller than in other emerging markets.

- 21 -
Inflation and Interest Rates
Both short-term domestic interest rates and price level inflation are important factors
determining the current account. Interest rates affect the attractiveness of investment
versus domestic savings. Moreover, both variables have a key role in the determination of
the real exchange rate; subsequently, in the attraction of foreign capital.
Table 6 below shows striking differences between Latin American and South/East Asian
economies. These divergences are better understood if we assume that persistent
surpluses in Latin America are probably associated with periods where these economies
are unable to borrow due to economic turmoil. High inflation and high interest rates are
related to these periods of economic trouble. In fact, the third column in table 6 offers a
measure of “pressure”, confirming a significant decrease in both variables rates during
the episode; hence, leading towards the next run of deficits with a more “healthy”
economy.
Table 6: Inflation and Short Term Interest Rates during Current Account Episodes
Inflation Interest Rates
Average
Rate
During
Episode
Excess
Rate
During
Episode
Average
Change
Per Year
Average
Rate
During
Episode
Excess
Rate
During
Episode
Average
Change
Per Year
All countries Surplus 11.49 1.63 -0.42 10.93 0.36 -0.68
Deficits 12.38 0.16 0.12 13.44 0.3 -0.08
Industrial Surplus 5.93 -0.11 -0.27 6.71 -0.78 -0.47
Deficits 10.01 1.48 0.06 10.58 0.94 0.29
Developing Surplus 13.15 2.14 -0.47 12.39 0.79 -0.74
Deficits 12.76 -0.09 0.13 13.98 0.16 -0.16
South/East Asia Surplus 4.68 -0.9 -0.14 5.83 -0.84 -0.61
Deficits 9.82 0.96 -0.26 9.33 0.74 0.07
South/East Asia (NIE) Surplus 4.76 -1.4 -0.05 5.96 -1.14 -0.57
Deficits 9.59 0.35 -0.16 9.27 0.43 -0.01
Latin America Surplus 30.72 8.98 -2.39 27.99 2.91 -1.13
Deficits 18.97 0.77 1.45 23.71 -0.5 0
Natural Resource Countries Surplus 19.36 4.99 -1.72 18.45 2.58 -0.54
Deficits 12.41 -1.29 1.5 12.34 -2.04 -0.51
Manufactures Countries Surplus 4.37 -1.56 -0.22 5.74 -1.6 -0.53
Deficits 9.35 2.07 -0.33 9.34 1.19 0.17
Sources: IFS, Wdi, Author calculations.

- 22 -
In contrast, South/East Asian economies under ELG strategies will need to control both
interest rates at low levels to promote investment and inflation to keep the real exchange
rate at low levels12.
2. What are the determinants behind reversals of persistent CA imbalances?
This section is framed around a conditional fixed-effects logistic model aimed at
identifying which variables affect the probability of ending a persistent current account
episode.
Conditional fixed-effects logistic regression
Our econometric model is based on a conditional fixed-effect logistic model. This
approach is used to cleanse my regression from possible correlations steaming from
common factors to each country.
logit{E(Y it|Xi)} = qi + X’ itβ
where Xit is a vector of time-varying covariates, β a vector of regression coefficients, Xi
the matrix Xi = (Xi1, . . .,XiJ )’ and qi the country-specific intercept that accounts for the
fact that the components of the vector Yi = (Yi1, . . . , YiJ )’are repeated measures on a
single country i. Yit represents the binary outcome variable on country i at time t:
=
)(0
1
episodeCAainbeingonlConditionaREVERSALNOIF
REVERSALCAIF
Yit
12 See for example Rajan (2005) in a recent talk about the Chinese CA surplus.

- 23 -
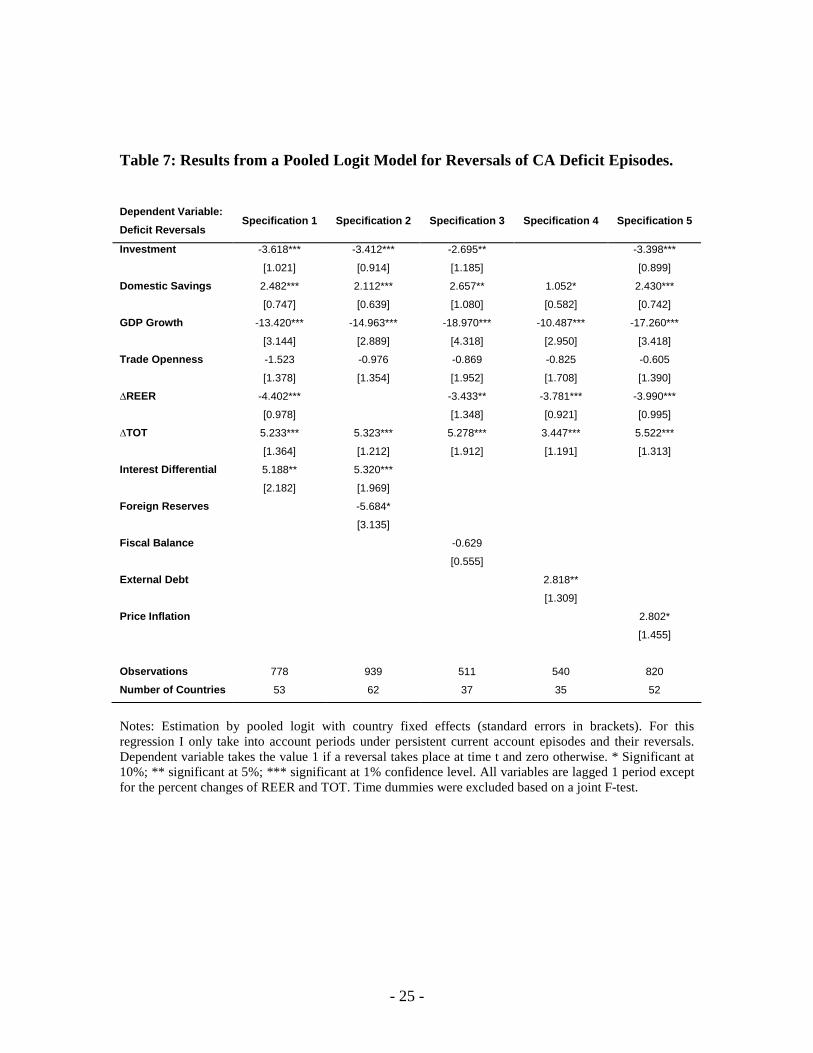
Tables 7 and 8 below show the results for deficit and surplus reversals, respectively.
High ratios of investment (Savings) over GDP improve (decline) the sustainability of
deficit episodes and increase (decrease) the probability of surplus reversals. This result
comes from the combination of several effects. The direct effect is definitional, with I =
Sd-CA, such that, increments in investment for a given level of domestic savings will
reduce the CA balance. For countries running deficits as part of their development
strategy, higher investment translates into larger output growth and greater future exports
helping the country be perceived as solvent. For countries following ELG strategies, high
levels of investment help absorb the output generated by fast export growth and, thus,
sustain deficits.
Even though, we theoretically uncovered the positive relationship between CA and non-
permanent output shocks around steady state equilibriums, high levels of output growth
seem to help preserve negative imbalances while increasing the probability of surplus
reversals. For net borrowers, high output growth represents proof of future solvency.
Natural resource countries may opt to reduce their accumulated foreign assets to mitigate
the negative effects of output slowdown creating a negative relationship between CA and
GDP growth rates.
Terms of trade are considered exogenous shocks, par excellence. Assuming slow
adjustment in the demand for imports, sudden improvement in terms of trade will
increase net exports13, the probabilities of a reversal from deficit episodes and will help
perpetuate surplus runs.
Increases in real exchange rate appreciation (REER) rates help sustain persistent external
deficits. More surprising is the coefficient for REER in levels. This coefficient, although
marginally significant, seems to indicate that low values of REER will also be associated
reversals from surplus episodes.
13 Running a fixed-effects panel regression on the effect of changes in the ToT on net exports as a percentage of GDP results in the following clear positive relationship:
)01.0(
*08.0 ToTExportsNet ∆=
with robust standard errors between brackets
- 24 -
Both logistic models show a symmetric reaction to changes in short-term international
interest rates spreads. Low (or negative) spreads rates will drive private savings abroad
increasing capital outflows; hence, enlarging CA balance. Accordingly, we observe a
positive correlation between relative interest rates and the probability of reversal for
negative external balances. Similarly, increments in relative interest rates will reduce the
probability of surplus reversals.
The stock of international reserve assets (IR) also seems associated to reversals of the
current account. High ratios of IR over GDP will signal solvency to foreign investors
helping prevent reversals from deficit positions. Conversely, excess holdings of reserves
may be a sign of excess pressure from net private inflows and may enhance the
probability of surplus reversals indicated by the positive coefficient in my regression.
Price inflation and its associated distortions seem to have the same negative effect on the
persistence of both surplus and deficit episodes enhancing the probability of reversals in
both cases.
From a private investor’s perspective, high ratios of external debt to GDP will act in
detriment to the perceived solvency of the country. Bearing this premise in mind, external
debt helps increase the probability of reversals during deficit episodes. The negative
coefficient in the surplus regression may be triggered by countries whose high levels of
debt force them into persistent periods of CA surplus given their inability to borrow
internationally.
Neither fiscal balances nor my measure of trade openness had significant coefficients
across any of the specifications I tried for both models.
- 25 -
Table 7: Results from a Pooled Logit Model for Reversals of CA Deficit Episodes.
Dependent Variable:
Deficit Reversals Specification 1 Specification 2 Specification 3 Specification 4 Specification 5
Investment -3.618*** -3.412*** -2.695** -3.398***
[1.021] [0.914] [1.185] [0.899]
Domestic Savings 2.482*** 2.112*** 2.657** 1.052* 2.430***
[0.747] [0.639] [1.080] [0.582] [0.742]
GDP Growth -13.420*** -14.963*** -18.970*** -10.487*** -17.260***
[3.144] [2.889] [4.318] [2.950] [3.418]
Trade Openness -1.523 -0.976 -0.869 -0.825 -0.605
[1.378] [1.354] [1.952] [1.708] [1.390]
∆REER -4.402*** -3.433** -3.781*** -3.990***
[0.978] [1.348] [0.921] [0.995]
∆TOT 5.233*** 5.323*** 5.278*** 3.447*** 5.522***
[1.364] [1.212] [1.912] [1.191] [1.313]
Interest Differential 5.188** 5.320***
[2.182] [1.969]
Foreign Reserves -5.684*
[3.135]
Fiscal Balance -0.629
[0.555]
External Debt 2.818**
[1.309]
Price Inflation 2.802*
[1.455]
Observations 778 939 511 540 820
Number of Countries 53 62 37 35 52
Notes: Estimation by pooled logit with country fixed effects (standard errors in brackets). For this regression I only take into account periods under persistent current account episodes and their reversals. Dependent variable takes the value 1 if a reversal takes place at time t and zero otherwise. * Significant at 10%; ** significant at 5%; *** significant at 1% confidence level. All variables are lagged 1 period except for the percent changes of REER and TOT. Time dummies were excluded based on a joint F-test.

- 26 -
Table 8: Results from a Pooled Logit Model for Reversals of CA Surplus Episodes.
Dependent Variable:
Surplus Reversals Specification 1 Specification 2 Specification 3 Specification 4
Investment 5.935*** 2.424** 5.845*
[1.887] [1.220] [3.260]
Domestic Savings -4.672*** -2.432*** -9.697***
[1.687] [0.670] [3.562]
GDP Growth 13.509* 13.033* 13.859*** 18.607
[7.289] [7.207] [4.334] [13.696]
∆TOT -10.663*** -7.573*** -9.443***
[2.696] [2.196] [3.665]
Trade Openness 0.767 -0.799 1.436 -8.557
[2.370] [2.159] [1.382] [5.804]
Interest Differential -7.832* -6.095* -5.354** -10.275*
[4.094] [3.682] [2.622] [5.878]
REER -2.427* -1.524 -5.093**
[1.251] [1.154] [2.290]
∆REER -0.019 -2.066
[2.255] [2.117]
Foreign Reserves 7.035* 6.891** 28.671***
[4.250] [3.123] [10.680]
Price Inflation 4.267**
[2.046]
External Debt -11.814*
[6.575]
Observations 333 350 486 105
Number of Countries 31 33 46 13
Notes: Estimation by pooled logit with country fixed effects (standard errors in brackets). For this regression I only take into account the periods under persistent current account episodes and their reversals. Dependent variable takes the value 1 if a reversal takes place at time t and zero otherwise. * Significant at 10%; ** significant at 5%; *** significant at 1% confidence level. All variables are lagged 1 period except the percent changes of REER and TOT. Time dummies were excluded based on a joint F-test.

- 27 -
3. The Aftermath of Persistent Current Account Episodes
Real Output Growth
Could a simple RBC open economy model predict the aftermath of current account
reversals for surplus and deficit episodes? As for the theoretical framework, I follow
Chari, Kehoe & McGrattan (2006) in designing a simple small open economy with
collateral constrains to borrowing where the country’s budget constrain is:
∑+
++−− +−+≤++tt ss
tttttttt sbsqskslskFsksbsc/
1111
1
)()()()1())(),(()()()( σ
Where st represents the history of events up to time t (the state of nature), and q is the
state contingent price of next period debt. The amount of borrowing is limited by a
collateral constraint and net exports are defined as:
)()()()1())(),(( 11 ttttt skscskslskF −−−+ −− σ
Net exports are also exactly equal to the net change in foreign assets defined as:
∑+
++−tt ss
ttt sbsqsb/
11
1
)()()(
Chari, Kehoe & McGrattan demonstrate that an abrupt rise in net exports in this economy
is analogous with an increase in government consumption for a closed economy14. From
this type of RBC models, it is a well known fact that increments in government
consumption rise labor and thus output15.
This simple model predicts output increases from deficit reversals and output falls from
surplus reversals.
Figure 4 sets up the evolution of average output growth rates during the end-game for
surplus and deficit episodes16. As we can observe, surplus episodes seem to follow the
rules exposed by our simple model with a drop in the average growth rates in excess of 1
percentage point. Similarly, deficit episodes also seem to observe these rules; however,
14 See Chari, Kehoe & McGrattan (2004) 15 See Aiyagari, Christiano & Eichembaum (1992) 16 A similar analysis has been done for the case of CA and REER in Dooley and Garber (2005)

- 28 -
after the reversal, it takes one more period for the output growth to soar. This delayed
pattern is followed by all subgroups in the sample.
Capital Flows
According to sudden stop literature, strong reversals in current account deficits are
normally accompanied by reversals in private capital inflows. This is clearly displayed in
the second graph in Figure 5, where, in the period previous to the reversal, net private
inflows accounted for 2.2 percent of GDP; whereas, in the next period, net private
outflows amounted to 2.7 percent of GDP, representing an average reversal of practically
5 percent of GDP. Less acknowledged is the behavior of private flows during surplus
reversals. Gathered from the first graph in Figure 5, net private flows in these cases react
symmetrically to deficit episodes with an average reversal from net outflows to net
inflows of almost 4.2 percent of GDP.
Figure 7: Percent of the Financing/Offsetting of the CA attributed to Official Flows
Notes: Y-axis represents the percentage of CA financed/offset by official flows, X-axis is the periods around CA episodes reversals for developing countries with 0 representing the first period after the reversal Sources: Author Calculations
0.2
0.3
0.4
0.5
0.6
0.7
0.8
-3 -2 -1 0 1 2 3
Deficits,ReversalsSurplus Reversals

- 29 -
Interestingly, the relative position between private and official flows is not symmetric
and, in both cases, private flows increase their influence in the determination of the CA
(see Figure 7). In the case of emerging market in South/East Asia, this fact is even more
noticeable with an approximate 25 percent drop in the official role of CA determination
Real Effective Exchange Rates
From Figure 5 and the reaction of net private flows to both surplus and deficit reversals,
we would expect strong real depreciations/appreciation accompanying such reversals.
Figure 6 displays the evolution of REER around the end-game. As predicted, deficit
reversals are matched with significant real depreciations (averaging 6 percent). This is
not the case for surplus episodes, where, we observe, on average, a small depreciation in
the real exchange rate. This depreciation is more salient for South/East Asian economies
averaging nearly 3 percent.

- 30 -
Figure 4: Output Growth Dynamics at the End-Game.
Notes: Averages in Bold. 0 represents the X-axis represents the periods around each country’s reversal with 0 being first period after the reversal Sources: Wdi, Author Calculations
End Game for Surplus Episodes: Developing Countries
3.054.73 4.76 3.67 3.55 3.69 4.04
-25
-20
-15
-10
-5
0
5
10
15
20
25
-4 -3 -2 -1 0 1 2 3 4
Rea
l G
DP
Gro
wth
(%
)
End Game for Deficit Episodes: Developing Countries
3.06 2.62 3.00 2.654.17 4.94 3.92
-25
-20
-15
-10
-5
0
5
10
15
20
25
-4 -3 -2 -1 0 1 2 3 4
Rea
l GD
P G
row
th (
%)

- 31 -
Figure 5: Net Private Capital Flows Dynamics at the End-Game.
Notes: Averages in Bold. 0 represents the X-axis represents the periods around each country’s reversal with 0 being first period after the reversal Sources: Wdi, Author Calculations
End Game for Deficit Episodes: Developing Countries
0.033 0.038 0.022-0.027
-0.001 0.020 0.029
-0.5
-0.4
-0.3
-0.2
-0.1
0
0.1
0.2
0.3
0.4
-4 -3 -2 -1 0 1 2 3 4
Net
Pri
vate
Flo
ws.
....
End Game for Surplus Episodes: Developing Countries
-0.035 -0.033 -0.0280.014 0.013 0.022 0.008
-0.5
-0.4
-0.3
-0.2
-0.1
0
0.1
0.2
0.3
0.4
-4 -3 -2 -1 0 1 2 3 4
Net
Pri
vate
Flo
ws.
....

- 32 -
Figure 6: REER Dynamics at the End-Game.
Notes: Averages in Bold. 0 represents the X-axis represents the periods around each country’s reversal with 0 being first period after the reversal. REER has been rebased so t-3=100 Sources: Wdi, Author Calculations
End Game for Deficit Episodes: Developing Countries
100.00 99.71 100.8494.78 94.29 92.53 89.85
0
20
40
60
80
100
120
140
160
180
-4 -3 -2 -1 0 1 2 3 4
RE
ER
..
End Game for Surplus Episodes: Developing Countries
100.00 99.66 101.18 100.34 99.67 99.45 101.58
0
20
40
60
80
100
120
140
160
180
-4 -3 -2 -1 0 1 2 3 4
RE
ER
..

- 33 -
4. Final Remarks
Economic theory demonstrates that persistent surplus can be associated with persistent
non-permanent positive shocks to output, or to long periods where developing economies
are unable to borrow given their perceived insolvency. This paper highlights export-led-
growth and fiscal stabilization policies as two other possible scenarios for persistent
positive external imbalances. To this end, my empirical results show that emerging
markets in Asia, following fast export growth development strategies, as well as top net
exporters of natural resources have been running persistent CA surpluses in the last
fifteen years.
Among the main characteristics of persistent CA episodes, I reveal that deficit episodes
are financed mainly by private net capital inflows; whereas, official flows have a more
prominent role in the determination of persistent surpluses. This role may be attributable
to official sectors by either, offsetting private inflows to maintain the desired level of
exchange rate17, or accumulating savings in foreign assets to create funds with the
purpose of stabilizing fiscal revenue from net exports. Fast increase in official reserves is
generally attributed to all surplus episodes; while, on average, industrial as well as natural
resource exporter countries experience a loss of these assets during deficit episodes.
In addition, I uncover significant differences in the characteristics of deficit and surplus
episodes across emerging markets in Latin America and those in Asia. In terms of output
performance, Latin American economies suffer a significant decrease in output growth
during surplus episodes. Conversely, in Asian economies, the negative effect is small
with a similar average output growth in both types of episodes. Moreover, while higher
inflation and interest rates are associated with surplus episodes in Latin America, in
Asian emerging markets, both variables are significantly lower in surplus than in deficit
episodes.
Regarding the determinants of current account reversals, I conclude that higher
investment, faster output growth, higher interest rates differentials, worsening in the
terms of trade, and finally, increase in international reserve holdings help sustain current
17 There is also a collateral story were official savings in foreign assets may serve as collateral for foreign investment; see Dooley, Folkerts-Landau & Garber (2003).

- 34 -
account deficits, while increasing the probability of reversal during episodes of current
account surplus. Interestingly, surplus episodes seem to be resilient to real appreciations,
whereas changes in the appreciation rates will significantly reduce the probability of
ending deficit episodes. Finally, higher inflation rates increase the probability of reversals
in both cases.
The end-games to surplus episodes also provide some interesting results. Firstly, whereas
output growth reacts negatively to surplus reversals, it takes 1 year, on average, to
increase output growth rates after the end of a deficit run. Secondly, the reverse of sudden
stops of net private flows for deficit episodes holds true for surplus reversals, where net
private outflows become net private inflows with an average shift over 4 percent of GDP.
Accordingly, real exchange rates, after deficit episodes end, rapidly depreciate. Surplus
episodes differ from their deficit counterparts in an unexpected small average
depreciation after the reversal.
References
Aiyagari, S. R., L. J. Christiano & M. Eichenbaum (1990), “The Output, Employment,
and Interest Rate Effects of Government Consumption”, NBER Working Paper
Series, No. 3330, April.
Aizenman, Joshua (2006), “International Reserves Management and the Current
Account”, Prepared for the 10th Annual Conference at the Central Bank of
Chile “Current Account and External Financing”, November 9-10.
Bussière, Matthieu, Marcel Fratzscher and Gernot J. Müller (2005), Productivity Shocks,
Budget Deficits And The Current Account”, European Central Bank, Working
Paper Series No. 509 / August.
Calvo, Guillermo A. (1998), “Capital Flows and Capital-Market Crises: The Simple
Economics of Sudden Stops”, Journal of Applied Economics, Vol. 1, No. 1,
November, pp. 35-54.
Chari, V. V., Patrick J. Kehoe & Ellen R. McGrattan (2005a), “Sudden Stops and Output
Drops”, Research Department Staff Report No. 353, Federal Reserve
Bank of Minneapolis, January.

- 35 -
_______________ (2005b), “Appendices: Business Cycle Accounting,” Research
Department Staff Report No. 362, Federal Reserve Bank of Minneapolis, April.
_______________ (2006), “Business Cycle Accounting”, Research Department Staff
Report No.328, Federal Reserve Bank of Minneapolis, February, Revised.
Chinn, Menzie & Eswar S. Prasad (2000), ”Medium-Term Determinants of Current
Accounts in Industrial and Developing Countries: An Empirical Exploration”,
NBER Working Paper Series, No. 7581, March.
Chinn, Menzie D. & Jaewoo Lee (2005), “Three Current Account Balances: A ‘Semi-
Structuralist’ Interpretation”, NBER Working Paper Series No. 11853, December.
Chinn, Menzie D. (2006), “Real Exchange Rates”, NBER Working Paper Series, No.
11853, February.
Davis, J., R. Ossowski, J. Daniel & S. Barnett (2001), “Stabilization and Savings Funds
for Nonrenewable Resources: Experience and Fiscal Policy Implications”, I.M.F.
Occasional Paper No. 205.
De Santis, Roberto A. & Melanie Lührmann (2006), “On The Determinants of External
Imbalances and Net International Portfolio Flows. A Global Perspective”,
European Central Bank, Working Paper Series No. 651 / July.
Dooley, M. P., D. Folkerts-Landau & P. Garber (2003),” An Essay on The Revived
Bretton Woods System”, NBER Working Paper Series, No. 9971, September.
_______________ (2004), “The US Current Account Deficit: Collateral for a Total
Return Swap”, Global Markets Research, Deutsche Bank, August.
Edwards, Sebastian (2005a), “Is the U.S. Current Account Deficit Sustainable? And if
not, How Costly is Adjustment Likely to Be?”, Brookings Papers on Economic
Activity, Vol. 2005(1), pp. 211–288.
_______________ (2005b) “Capital Controls, Sudden Stops and Current Account
Reversals,” NBER Working Paper Series, No. 11170, March.
_______________ (2006a), “Capital Controls, External Imbalances, Sudden Stops and
Contagion”, Paper presented at the University of California, Santa Cruz
Conference (SCCIE), September.
Feldstein, Martin (2006), “The 2006 Economic Report of The President: Comment on
Chapter One (The Year in Review) And Chapter Six (The Capital Account

- 36 -
Surplus)”, NBER Working Paper Series, No.12168, April.
Halikias, Ioannis (1996), “Long-Term Trends in the Saving-Investment Balance and
Persistent Current Account Surpluses in a Small Open Economy: The Case of The
Netherlands”, IMF Working Papers, WP/96/42, May.
Kent, Christopher & Paul Cashin (2003), “The Response of the Current Account to
Terms of Trade Shocks: Persistence Matters”, IMF Working Papers, WP 03/143,
July.
Leiderman, Leonardo & Assaf Razin (1991), “Determinants of External Imbalances: The
Role of Taxes, Government Spending and Productivity”, NBER Working Paper
Series, No. 3738, June.
Milesi-Ferretti, G. M. and A. Razin (1996) “Sustainability of Persistent Current Account
Deficits”, NBER Working Paper Series No. 5467, February.
_______________ (1997), “Sharp Reductions in Current Account Deficits: An Empirical
Analysis”, NBER Working Paper Series, No. 6310, December.
_______________ (1998), “Current Account Reversals and Currency Crises: Empirical
Regularities”, NBER Working Paper Series, No. 6620, June.
Obstfeld, M. and Kenneth Rogoff (1995), Foundations of International Macroeconomics,
The MIT press, Cambridge.
Rajan, G. Raghuram (2005), “Global Current Account Imbalances: Hard Landing or Soft
Landing”, Talk at the Crédit Suisse First Boston Conference, Hong Kong, March.
Razin, Assaf (1993), “The Dynamic-Optimizing Approach to The current Account:
Theory and Evidence”, NBER Working Paper Series, No. 4334, April.
_______________ (1998), “International Capital Flows: Sustainability, Sudden
Reversals, and Market Failures”, NBER Reporter Spring 1998
Taylor, M. Alan (2002), “ A Century of Current Account Dynamics”, NBER Working
Paper Series, No. 8927, May.
Williamson, John (1995), “The Management of Capital Inflows”, in Pensamiento
Iberoamericano, January-June issue.