pervasive computing and security lab
TRANSCRIPT

Enabling Transportation Safety Services
Using Mobile Devices
Jie Yang
Department of Computer Science
Florida State University
Oct. 17, 2017
CIS 5935 Introduction to Research
PerSec Pervasive Computing and Security Lab

Mobile devices
Smartphones, tablets, Google glasses, smart watches, wearable
devices…
Rich sensors
Wireless technologies
Background: Mobile Devices
…
…
2

Background: Driving Safety & Efficiency
1 billion highway vehicles
SAFETY 1.2 million traffic fatalities per year
ENERGY 30% of world Energy
EMISSIONS 25% of world CO2 Emissions
TRAFFIC 1.5 hours per day on a vehicle
3

What to Sense with Mobile/Wearable Devices?
Driver behaviors
Cell phone distraction
Drowsy driving
Drunk driving
…
Vehicle dynamics
Lane changing
Breaking, Acceleration
Making turns
…
Surroundings
Potholes
Nearby vehicles
Pedestrian crossing street
…
4

Sensing Enabled Safety Services
Reducing driver distraction
Cell phone use, eating…
Drowsy driving…
…
Pedestrian safety
Waling across street
Talking on the phone while walking
…
Driving safety assistant systems
Curve speed warning,
Dangerous location (obstacle) warning
Safe distance warning
Lane departure and change/merge warning
Forward collision warning
…
5

Gyroscope and Accelerometer: Driving Behavior
6 Slides: How’s My Driving: Sensing Driving Behaviors by Using Smartphones
Pathholes

7
Video: https://www.youtube.com/watch?v=Fk4xK1q5P3s
Cameras: Driving/Walking Safety
Video: https://www.youtube.com/watch?v=tAd_sSfhZTw

Case Study: Driver Phone User Detection
- Audio based approach
- Inertial sensors based detection
- Intervention
8
Source: Jie Yang, Simon Sidhom, Yingying Chen et al. "Detecting driver phone use leveraging car speakers." in
MobiCom 2011.
Yan Wang, Jie Yang, Yingying Chen et al. "Sensing Vehicle Dynamics for Determining Driver Phone Use." in
MobiSys 2013

Cell Phones Distract Drivers
Cell phone as a distraction in 2009 on U.S. roadways 18% of fatalities in distraction-related crashes involved reports
of a cell phone
995 fatalities
24,000 injuries
Source: “Distracted Driving 2009” National Highway Traffic Safety Administration Traffic Safety Facts, 2009
Talking on Hand-held Cell Visual — Eyes off road
Cognitive — Mind off driving
Texting on Hand-held Cell Manual — Hands off wheel
Visual — Eyes off road
Cognitive — Mind off driving
81% of drivers admit
to talking on
phone while driving
18% of drivers admit
to texting
while driving
9

Cell Phone Distraction: What’s Being Done?
Law
Several States ban handheld phone use
Technology
Hard blocking: radio jammer, blocking phone calls, texting, chat …
Soft interaction
Routing incoming calls to voicemail,
Delaying incoming text notifications
Automatic reply to callers
Automatic Reply: “I’m driving right
now; will get back with you!”
10

Current Apps that actively prevent cell phone use in vehicle
ONLY detect the phone is in vehicle or not!
What’s Being Done?
- Is a Cell Phone in a Moving Vehicle ?
GPS Handover Signal Strength Car’s speedometer
11

The Driver-Passenger Challenge
I am a passenger!
38% of automobile trips include
passengers !
Source: National highway traffic safety administration: Fatality analysis reporting system
12
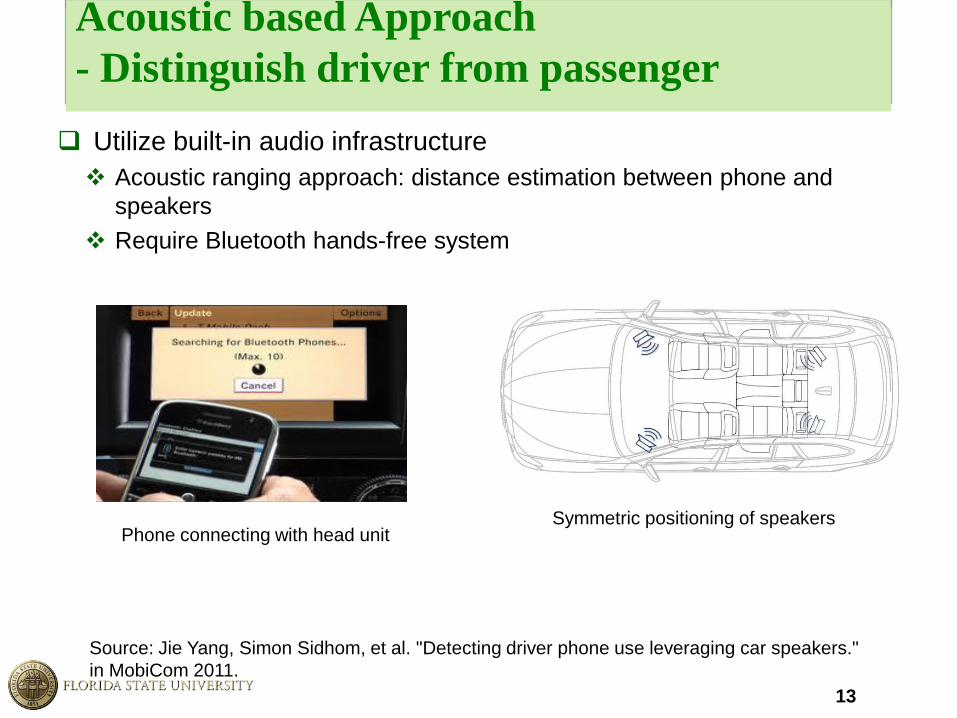
Acoustic based Approach
- Distinguish driver from passenger Utilize built-in audio infrastructure
Acoustic ranging approach: distance estimation between phone and
speakers
Require Bluetooth hands-free system
Symmetric positioning of speakers Phone connecting with head unit
Source: Jie Yang, Simon Sidhom, et al. "Detecting driver phone use leveraging car speakers."
in MobiCom 2011.
13

How Does It work?
Audio
Head Unit
∆t1 - ∆t > 0 => Closer to Left Speaker (S1 )
∆t1 - ∆t < 0 => Closer to Right Speaker (S2 )
∆t
∆t1 S1
Left
S2
Right
t1
t2
t’1 t’2
∆t2 - ∆t > 0 => Closer to Front Speaker (S1, S2)
∆t2 - ∆t < 0 => Closer to Back Speaker (S3, S4)
S3
Rear Right
S4
Rear Left
∆t2
- = ?
∆t
∆t1
14

Walkthrough of the detection system
Emit beep signal Record signal Filtering Signal
Detection
Relative
Ranging
∆t1 - ∆t
Location
Classification
Driver v.s.
non-Driver
15

Walkthrough of the detection system
Channel 1 Channel 2
∆t
Beep signal: two channels
High frequency beep Robust to noise:
engine, tire/road, conversation, music
Unobtrusiveness
Close to human’s hearing limit
Beep Length: 400 samples (i.e., 10 ms)
∆t: 10,000 samples
Emit beep signal Record signal Filtering Signal
Detection
Relative
Ranging
∆t1 - ∆t
Location
Classification
Driver v.s.
non-Driver
Beep signal design Consider two challenges:
Background noise and unobtrusiveness
Increasing frequency 22 kHz
0
engine, tire/road
1 kHz 300
Hz 3.4kHz
conversation
50
Hz 15kHz
Music Beep Frequency Range
16

Walkthrough of the detection system
Recorded signal
Signal distortion: Heavy multipath in-car
Background noise
Reduced microphone sensitivity
Emit beep signal Record signal Filtering Signal
Detection
Relative
Ranging
∆t1 - ∆t
Location
Classification
Driver v.s.
non-Driver
Where is the beep signal?
17

Walkthrough of the detection system
Signal after Filtering
Emit beep signal
Filter out background noise Noise mainly located below 15kHz
Beep signal frequency is above 15kHz
Emit beep signal Record signal Filtering Relative
Ranging
∆t1 - ∆t
Location
Classification
Driver v.s.
non-Driver
STFT Filter Moving window size m: 32 samples
Beep signal
Signal
Detection
18

Walkthrough of the detection system
Signal Detection
Threshold td:
Based on noise: μ + 3σ 99.7% confidence level of noise
Robust window W:
Reduce false detection
40 samples
Emit beep signal Record signal Filtering Signal
Detection
Relative
Ranging
∆t1 - ∆t
Location
Classification
Driver v.s.
non-Driver
Estimate noise mean and
standard deviation: (μ , σ)
Threshold td
Signal Detected
Robust window
W Change-point detection Identifying the first arriving beep
signal that deviates from the noise
19

Walkthrough of the detection system
∆t: Predefined fixed time interval
between two beep sounds
∆t1: Calculated time difference of
arrival based on signal detection
∆t1 - ∆t: Relative ranging -> cell phone to two speakers
Time difference ∆t1:
Measured by sample
counting
Emit beep signal Record signal Filtering Signal
Detection
Relative
Ranging
∆t1 - ∆t
Location
Classification
Driver v.s.
non-Driver ∆t1 - ∆t
∆t1 - ∆t
20

Walkthrough of the detection system
Emit beep signal Record signal Filtering Signal
Detection
Relative
Ranging
∆t1 - ∆t
∆t1 - ∆t > 0 => Left Seats (Driver Side)
∆t1 - ∆t < 0 => Right Seats
∆t2 - ∆t > 0 => Front Seats
∆t2 - ∆t < 0 => Rear Seats
With two-channel audio system:
With four-channel audio system: relative ranging from the 3rd or/and 4th channels: ∆t2
Location
Classification
Driver v.s.
non-Driver
Driver v.s.
non-Driver
Driver v.s. Passenger
Automobile trips:
83.5%: driver only or plus
one front passenger;
8.7%: a passenger behind
driver seat.
21

Testing positions
Different number of occupants
Different noise conditions Highway Driving
60MPH + music playing + w/o window opened
Phones at front seats only
Stationary
Varying background noise: idling engine + conversation
Experimental Scenarios
Driver’s
Control
Area
22

Phones and Cars
Phones
Cars
Android Developer Phone 2
•Bluetooth radio
•16-bit 44.1kHz sampling rate
•192 RAM
•528MHz MSM7200 processor
iPhone 3G
•Bluetooth radio
•16-bit 44.1kHz sampling rate
•256 RAM
•600 MHz Cortex A8processor
Honda Civic Si Coupe
•Bluetooth radio
•Two channel audio system
•two front and two rear speakers
•Interior dimension
Car I: 175 x 183 cm
Car II: 185x 203cm
Acura sedan
23
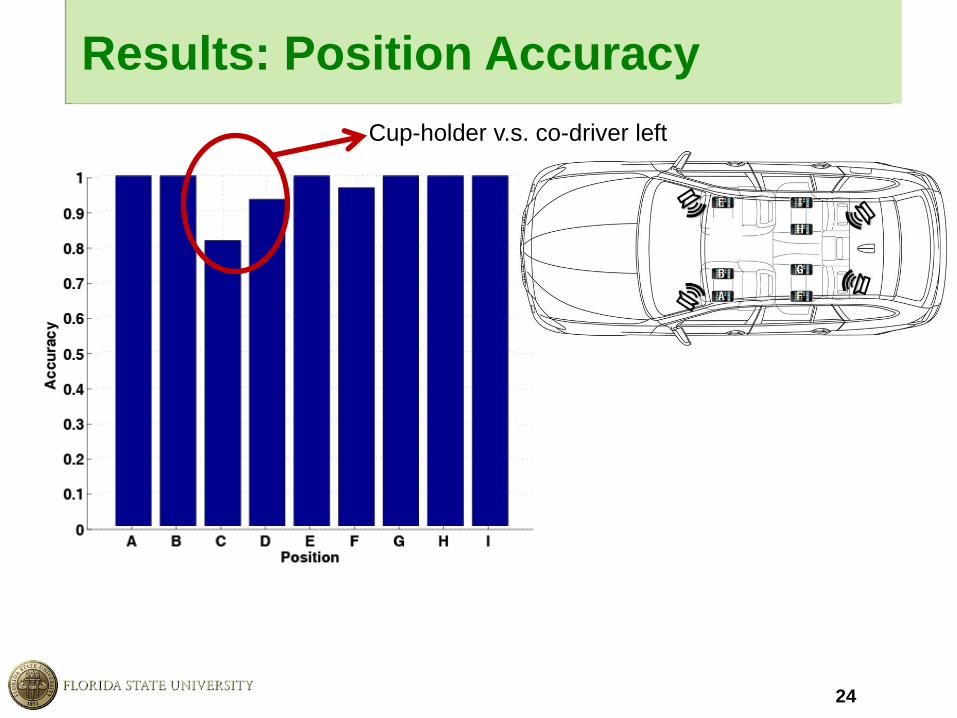
Results: Position Accuracy
Cup-holder v.s. co-driver left
24

Low-Infrastructure Approach
- Using Centripetal Acceleration
r
r
a
v
ω
v: tangential speed
a: centripetal acceleration
ω: angular speed
r: radius
a
v
ω
The centripetal acceleration varies depending on the
position in the car
Key Insight:
Source: Yan Wang, Jie Yang, et al. "Sensing Vehicle Dynamics for Determining Driver Phone Use."
in MobiSys 2013.
25

Obtaining Centripetal Acceleration from
Different References
Cigarette lighter adapter with accelerometer
Obtain vehicle's centripetal acceleration
OBDII port adapter
Obtain vehicle's speed
Second phone on the passenger side
26

Turn
#1
Turn
#3
Turn
#2
Leveraging Multiple Turns and Mixed
Turns
Accumulate a few turns – use simple majority voting
process to improve accuracy
Utilize mixed turns – left and right turns
- eliminate bias from reference point e.g., speed from OBDII is overestimated due to worn tires
Use normalized centripetal acceleration difference: independent of the
bias, turn size and driving speed
Turn
#1
Decision
Turn
#2
Decision
Turn
#3
Decision
Driver Driver Passenger
Majority vote: Driver
t
27

Experimental Setup
Different testing positions
Different driving environments
Parking Lots: 117 turns
Urban: 570 turns
Suburban: 430 turns
Hoboken, NJ
Urban City
Pontiac, MI
Suburban
28

Phones and Cars
Phones
Cars
iPhone 4
• 1GHz ARM A8 CPU
• 512M RAM
• iOS5.2
• 20 samples/s
HTC 3D
• 1.2GHz MSM8660 CPU
• 1G RAM
• Android 2.4
• 20 samples/s
Honda Accord (car A) Acura sedan (car B)
29

Opportunistically Using Dual Phones
High detection accuracy at
positions away from the
center of the vehicle
Robust in different driving
environments
30

Interventions
Hard block
Block phone calls, texting, chat…
Soft intervention
Routing incoming calls to voicemail,
Delaying incoming text notifications
Automatic reply to callers
Posting driving status on social medium networks
Automatic Reply: “I’m driving right
now; will get back with you!”
31

http://www.cs.fsu.edu/~jieyang/
DRIVE SAFELY
TALK & TEXT LATER
32