peter taylor, a quick review of past, recent and current
TRANSCRIPT

Slides prepared but Boston flight was cancelled!
Peter Taylor, A quick review of past, recent and current research activity -mostly on Atmospheric Boundary Layers.’ ESSE Chat, 31 Aug 2020

Recent journal articles (refereed, 2018-2020):
A126. Kai Melamed-Turkish, Peter A. Taylor, and John Liu. 2018. Upper Level Winds over Eastern North America - a Regional Jet
Stream Climatology. International Journal of Climatology. First published: 31 July 2018 https://doi.org/10.1002/joc.5693
A127 Alexander L*, Sills D, Taylor P.,2018, Initiation of Convective Storms at Low-Level Mesoscale Boundaries in Southwestern
Ontario. Weather and Forecasting, 33(4) 583-598.
A128 Hassan D*, Taylor P, Isaac G. 2018. Solid Snowfall Rate Estimation Using a C-Band Radar, Meteorological Applications. First
published: 23 Sept 2018, https://doi.org/10.1002/met.1737
A129 Miller, S.J., Gordon, M., Staebler, R.M. and Taylor, P.A., 2019, A Study of the Spatial Variation of Vehicle-Induced Turbulence
on Highways Using Measurements from a Mobile Platform, Boundary-Layer Meteorol.171: 1-29. https://doi.org/10.1007/s10546-
018-0416-9
A 130 Afsharian, S., & Taylor, P. A., 2019, On the potential impact of Lake Erie wind farms on water temperatures and mixed‐layer
depths: Some preliminary 1‐D modeling using COHERENS. Journal of Geophysical Research: Oceans, 124.
https://doi.org/10.1029/2018JC014577
A 131 Afsharian, Soudeh, Taylor, Peter & Momayez, Ladan. (2020). Investigating the potential impact of wind farms on Lake Erie.
Journal of Wind Engineering and Industrial Aerodynamics. 198. 104049. 10.1016/ jweia.2019.104049.
Most cited paper: Taylor, P.A. and P.J. LeB. Williams, 1975: Theoretical studies on the co-existence of competing species under
continuous flow conditions. Can. J. of Microbiology, 21, 90-98.
An unusual paper: Regal, J.A., A.P.M. Lockwood, J.R. Norfolk and P.A. Taylor, 1974: Urinary bladder volume and the
re-absorption of water from the urine of crabs. J. Exp. Biol., 60, 167-181.
COVID-19 notes, http://www.yorku.ca/pat/SIRmodel-PAT.pdf

On Environment and Climate Change Canada (ECCC) Radar Snowfall Rate Estimates
Peter Taylor1, Diar Hassan2 and George Isaac3
1CRESS, York University, Toronto, Canada, 2Wood PLC, Ottawa, Ontario, 3Weather Impacts Consulting Inc, Barrie, Ontario
Radar snowfall estimation and validation is complex due to the target's dielectric properties, sub-cloud snow variability, snowfall density ….., and ground measurement difficulties. However, Hassan et al. (2017, 2018) found that the ECCC Radar algorithm (Sekhon-Srivastava (1970)) underestimates snowfall (mm/h) by more than 50%.
We will try to make three points,1) The public ECCC web site underestimates snowfall
rate, and the S(Z) relationship should be changed.2) ECCC use Z = Ze + 6.5dB in winter on their public site,
but not internally! It is confusing and should stop.3) ECCC should make all radar data (including Doppler
and dual pol) readily available to researchers, teachers and other users.
CMOS 2020
3
https://bulletin.cmos.ca/a-note-on-eccc-radar-snowfall-estimates-and-radar-data/
Evaluation of Summer 2018 Quantitative Precipitation Estimations for the
CONtinental United States from Model, Satellite and Radar
Wensong, Weng1, Chongxing, Fan2 , Peter, Taylor1 ,Yongsheng, Chen1, Iain, Russell3
1CRESS, York University, Toronto, Canada, 2School of Atmospheric Sciences, Nanjing University, 3Pelmorex Media
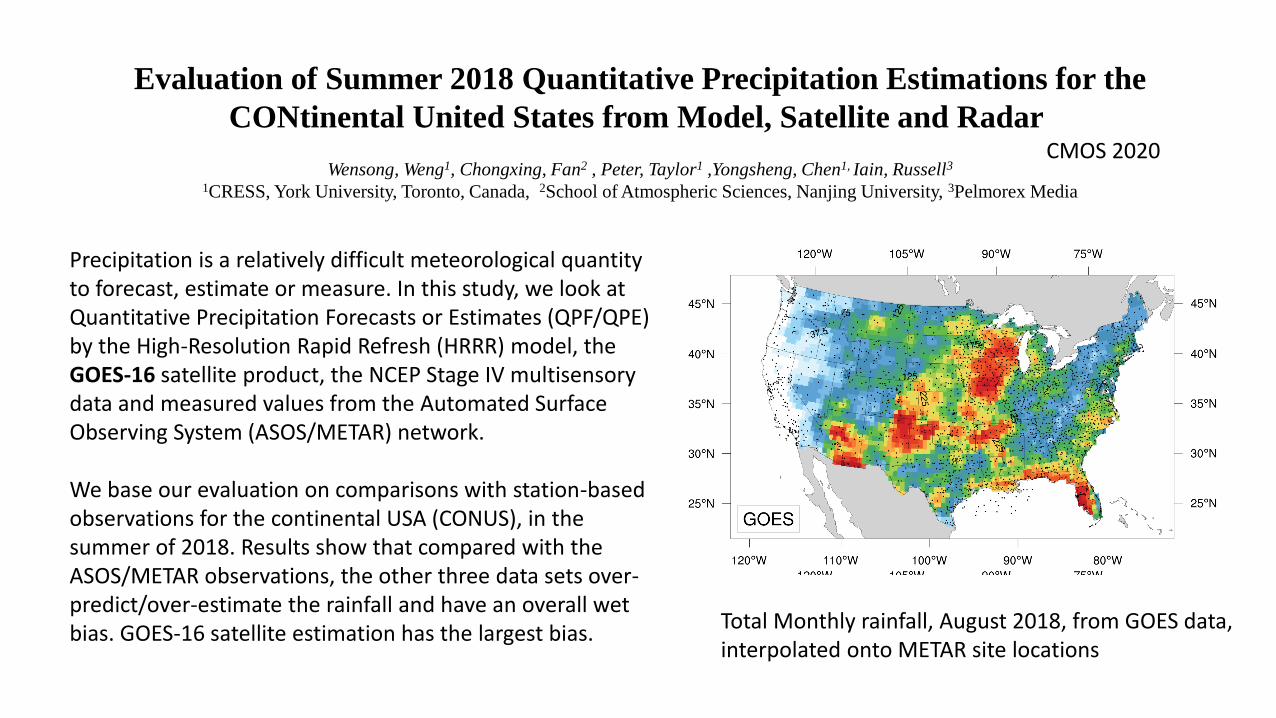
Precipitation is a relatively difficult meteorological quantity to forecast, estimate or measure. In this study, we look at Quantitative Precipitation Forecasts or Estimates (QPF/QPE) by the High-Resolution Rapid Refresh (HRRR) model, the GOES-16 satellite product, the NCEP Stage IV multisensory data and measured values from the Automated Surface Observing System (ASOS/METAR) network.
We base our evaluation on comparisons with station-based observations for the continental USA (CONUS), in the summer of 2018. Results show that compared with the ASOS/METAR observations, the other three data sets over-predict/over-estimate the rainfall and have an overall wet bias. GOES-16 satellite estimation has the largest bias.
CMOS 2020
Total Monthly rainfall, August 2018, from GOES data, interpolated onto METAR site locations


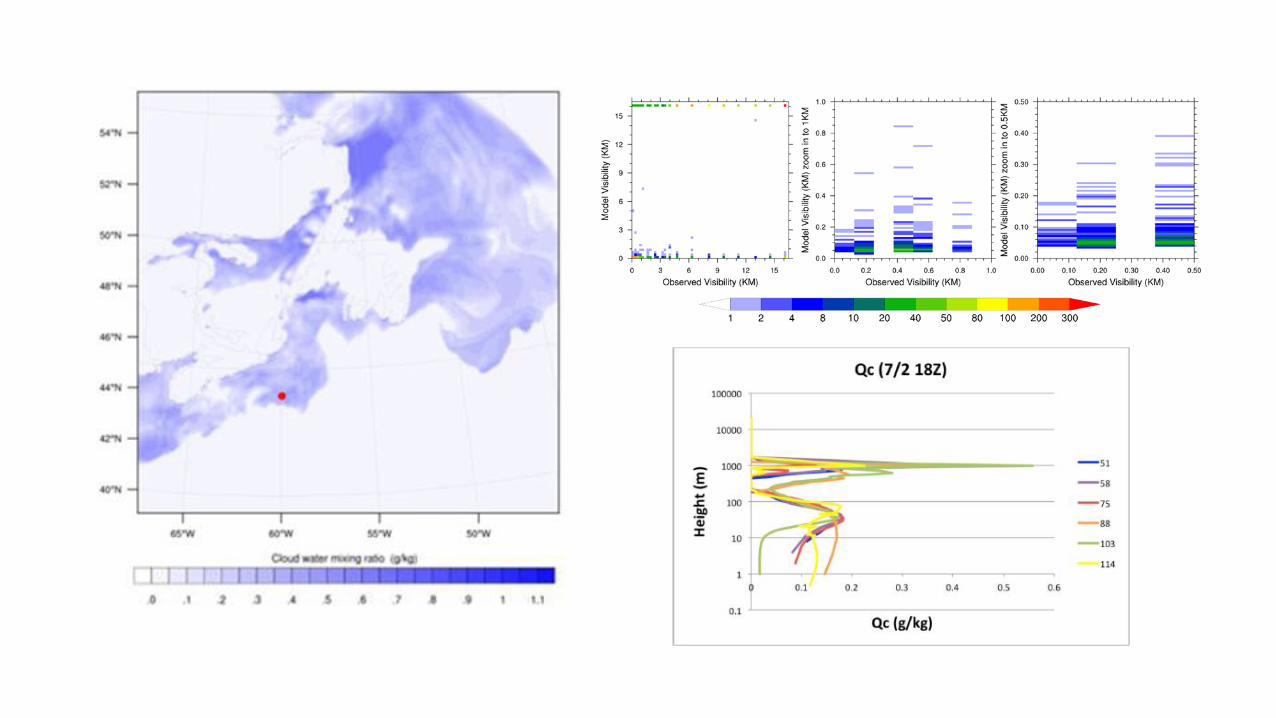
WRF Model Simulations of Marine Advection Fog over Sable Island
Zheqi Chen, Li Cheng, Peter Taylor, Yongsheng Chen
Sable Island Summer 2022 Fog
Experiment proposal: Draft 1aPeter Taylor, July 30, 2020
1986,7?

HCSTEAM - Team D: Green Energy in Ontario, Aug 10-28 with mentors Maria and Justine – who did most of
the work!Week 1
Day 2 Basics of energy, Joules, Watts, kW, MW, GW. kWh etc.
Generation sources – Explore IESO web site
(http://reports.ieso.ca/public/GenOutputCapability/PUB_GenO
utputCapability.xml).
Day 3 Basic use of excel. Importing data, generating plots.
Averages. Meteorological data, York weather station,
http://www.yorku.ca/pat/weatherStation/index.php
Download EMOS weather station data and work with it.
Day 4 Wind energy, u cubed, power curves. Wind farms ….
Day 5 Solar Energy, Irradiance, solar panels etc.