petition requesting the administrator object to the title ... · process, add a methanation process...
TRANSCRIPT

ENVIRONMENTAL LAW amp POLICY CENTER Protecting the Midwests Environment and Natural Heritage
June 18 2010
Lisa Jackson US EPA Administrator Ariel Rios Building 1200 Pennsylvania Ave N W Washington DC 20004
RE Petition Requesting that the Administrator Object To the Issuance of the Proposed Title V Operating Permit for the Cash Creek Generation Station
Dear Administrator Jackson
Please find enclosed a copy of the Environmental Law amp Policy Centers Petition regarding the Title V Operating Permit for the Cash Creek Generating Station in Henderson County Kentucky Also enclosed is a CD of exhibits Please do not hesitate to contact us with any questions
Sincerely
Meleah Geertsma Attorney Environmental Law amp Policy Center (312) 795-3713 mgeertsmaelpcorg
35 East Wacker Drive Suite 1300 Chicago Illinois 60601-2110 Phone (312) 673-6500 Fax (312) 795-3730 wwwelpcorg elpcinfoelpc org
Harry W Drucker - Chairperson Howard A Learner- Executive Director
Cc Art Hofmeister Region 4 John Lyons KDAQ James Morse KDAQ W Blaine Early III Stites amp Harbison PLLC Michael Mcinnis ERORA Group LLC
BEFORE THE ADMINISTRATOR
UNITED STATES ENVIRONMENTAL PROTECTION AGENCY
In the Matter of the Proposed Operating Permit for
CASH CREEK GENERATION LLC to operate the proposed source located at Kentucky State Highway 1078 Henderson County Kentucky
Proposed by the Commonwealth of Kentucky Environmental and Public Protection Cabinet
Permit No V-09-006 Source ID No 21-101-00134
PETITION REQUESTING THAT THE ADMINISTRATOR OBJECT TO THE ISSUANCE OF THE PROPOSED TITLE V OPERATING PERMIT
FOR THE CASH CREEK GENERATION STATION
Meleah Geertsma Faith E Bugel ENVIRONMENTAL LAW AND POLICY CENTER 35 East Wacker Drive Suite 1300 Chicago Illinois 60601 (312) 673-6500
Date June 18 2010
On behalf of
SIERRA CLUB
URSULINE SISTERS OF MOUNT SAINT JOSEPH
VALLEY WATCH
1
Pursuant to Clean Air Actsect 505(b)(2) and 40 CPRsect 708(d) Valley Watch the Ursuline
Sisters of Saint Joseph and Sierra Club (Petitioners) hereby petition the Administrator of the
United States Environmental Protection Agency (US EPA) to object to the proposed Title V
Operating Permit Permit No 09-006 for the source located at Kentucky State Highway 1078
Henderson County (Cash Creek Station) (Permit) issued by the Kentucky Division for Air
Quality (KDAQ or Agency) to Cash Creek Generation LLC (Cash Creek or
Applicant) 1 This 09-006 permit is a second and separate permit for the proposed new Cash
Creek facility previously permitted under No 07-017 Petitioners provided comments to the
Agency on the various draft and revised proposed permits leading up to the Permit A true and
accurate copy of each set of comments relevant to this Title V petition opportunity is attached2
This petition is filed within sixty days following the end of US EPAs 45-day review period as
required by Clean Air Actsect 505(b)(2)3 The Administrator must grant or deny this petition
within sixty days after it is filed
If the Administrator determines that this permit does not comply with the requirements of
the Clean Air Act (CAA) or 40 CFR Part 70 she must object to its issuance See 40 CFR sect
708(c)(l) (The Administrator will object to the issuance of any permit determined by the
Administrator not to be in compliance with applicable requirements or requirements of this
part) The Permit continues to fail to comply with the applicable CAA requirements andor the
requirements of 40 CFR Part 70 in a number of ways First the Permit was issued pursuant to a
faulty public notice and public comment period during which significant required permit
supporting materials were absent from the record Second the Permit is based on a significant
underestimation of flaring emissions and fails to contain proper BACT limits for the flare Third
the Applicant and KDAQ underestimated fugitive emissions from equipment leaks and failed to
include proper BACT limits for equipment leaks Together the flare and equipment leak errors
1 Exhibit I KDAQ Final Revised Proposed Air Quality Permit Pennit No V-09-006 March 5 2010 Unless otherwise noted references and citations to the Permit in the petition are to the Final Revised Proposed pennit from March 5 2010 2 Exhibit 2 Letter from James Gignac McGillivray Westerberg amp Bender to James Morse KDAQ Public Comments Cash Creek Generating Station Draft Pennit V -09-006 October 8 2009 (October 2009 Comments) Exhibit 3 Letter from Meleah Geertsma Environmental Law and Policy Center to James Morse KDAQ Public Comments Cash Creek Generating Station Draft Pennit V-09-006 December 14 2009 version January 14 2010 (January 14th Comments) (69 pages plus exhibits) Exhibit 4 Letter from Meleah Geertsma Environmental Law and Policy Center to James Morse KDAQ Public Comments Cash Creek Generating Station Draft Permit V -09-006 December 14 2009 version January 15 2010 (January 15th Comments) (3 pages)3 See Exhibit 5 EPA Region 4 Proposed Title V Permits Proposed Kentucky Permits (EPA Region IV Title V webpage) (listing petition deadline of June 18 2010)
2
led to the erroneous determinations that the facility is a minor source of VOCs and H2S Fourth
the errors in the flare and equipment leak analyses also resulted in improperly categorizing the
proposed facility as a minor source of hazardous air pollutants Fifth the Applicant and KDAQ
failed to ensure protection of the PM10 and PM25 NAAQS by failing to model worst-case
allowable emissions from material handling Sixth and finally the Applicant and KDAQ failed
to ensure protection of the ozone NAAQS by conducting an inappropriate qualitative assessment
of ozone impacts
For all of these reasons the Permit is not in compliance with the applicable requirements
and the Administrator must object
I BACKGROUND
KDAQ manages a combined program for the states Title V operating and Prevention of
Significant Deterioration (PSD) construction permits On May 4 2006 Cash Creek applied
for a PSDTitle V permit for a new 700 megawatt (MW) electric power generation facility
which would use Integrated Gasification Combined Cycle (IGCC) technology to bum synthetic
gas (syngas) produced from coal4 KDAQ proposed Permit V-07-017 to US EPA on November
30 2007 several of the present petitioners petitioned the Administrator to object to Permit V -07-
017 in January and February 2008 Cash Creek received a final Permit V-07-017 from KDAQ on
January 18 20085 On December 15 2009 the Administrator objected to Permit V-07-017
granting several of the issues in the 2008 petitions
Less than four months after KDAQ issued the final V-07-017 permit on May 7 2008
Cash Creek submitted an application for a significant revision to Permit V -07-0176 In its
significant revision permit application Cash Creek proposed to modify its coal gasification
process add a methanation process to convert the coal-derived syngas to substitute natural gas
and change the fuel used in the IGCC turbines from syngas to natural gas or substitute natural 7gas Cash Creeks proposed revisions were so significant that KDAQ ruled it would terminate
Permit V -07-017 and issue a new permit Permit V -09-006 in its place 8
4 Exhibit 6 KDAQ Draft Permit Statement of Basis Permit V-07-017 April30 2007 (April 2007 SOB) pl5 Exhibit 7 KDAQ Final Permit Statement of Basis Permit V-09-006 May 3 2010 (May 2010 SOB) pl 6d 7 d 8 d at 1-2
3
KDAQ published notice of a public hearing on draft Permit V -09-006 on September 9
2009 and held a public hearing on the draft permit on October 9 20099 EPA submitted written
comments highlighting several deficiencies in draft Permit V -09-006 on the day of the public
hearing 10 Petitioners also submitted timely public comments pointing out several flaws in the
draft Permit 11 After the public hearing KDAQ made significant changes to the draft permit and
published a second notice of public hearing on December 15 2009 a second public hearing was
held January 15 2010 Again Petitioners timely submitted public comments noting that KDAQ
failed to adequately address most of its earlier comments and raising additional issues with the
revisions to the draft permit 12 Nonetheless KDAQ terminated Permit V -07-017 and issued
Permit V-09-006 on May 5 2010
II STANDARDOFREVIEW
In reviewing a Title V petition the Administrator must object where petitioners
demonstrate that the permit is not in compliance with the requirements of [the Clean Air Act]
including the requirements of the applicable implementation plan See 42 USC sect 766ld(b)(2)
The Administrator explains in her August 2009 Order for the Trimble Generating Station that the
EPA will generally look to see whether the Petitioner has shown that the state did not comply
with its SIP-approved regulations governing PSD permitting or whether the states exercise of
discretion under such regulations was unreasonable or arbitrary 13 This inquiry includes
whether the permitting authority (1) follow[ed] the required procedures in the SIP (2) [made]
PSD determinations on reasonable grounds properly supported on the record and (3) describe[ d)
the determinations in enforceable terms 14
To guide her review the Administrator has looked to the standard of review applied by
the Environmental Appeals Board (EAB) in making parallel determinations under the federal
9 Id at l 10 Id 11 Exhibit 2 October 2009 Comments 12 Exhibit 3 January 14th Comments 13 Exhibit 8 In the Matter of Louisville Gas and Electric Company Trimble County Kentucky Title VPSD Air Quality Permit V -02-043 Revisions 2 and 3 Order Responding to Issues Raised in April 28 2008 and March 2 2006 Petitions and Denying in Part and Granting in Part Requests for Objection to Permit August 12 2009 (August 2009 Trimble Order) at 5 (citing In re East Kentucky Power Cooperative Inc (Hugh L Spurlock Generating Station) Petition No IB-2006-4 (Order on Petition) (August 30 2007) In re Pacific Coast Building Products Inc (Order on Petition) (December 10 1999) In re Roosevelt Regional Landfill Regional Disposal Company (Order on Petition) (May 4 1999)) 14 Id (citing 68 Fed Reg 9892 (March 3 2003) and 63 Fed Reg 13795 (March 23 1998))
4
PSD permit program 15 The EAB recently has reiterated the importance of BACT
determinations stating that they are one of the most critical elements in the PSD permitting
process and thus should be well documented in the record and any decision to eliminate a
control option should be adequately explained and justified In re Desert Rock Energy
Company LLC PSD Appeal Nos 08-03 08-04 08-05 amp 08-06 Slip Op at 50 (September 24
2009) (Desert Rock) The Board has remanded permits where the permitting authoritys
BACT analyses were incomplete or the rationale was unclear d Thus the Administrator
should review KDAQs BACT determinations with an eye to the completeness of the record and
underlying rationale If either of these aspects is inadequate as demonstrated by Petitioners the
Administrator must object Given the similar centrality of the air quality demonstration
Petitioners believe at least this level of inquiry is needed on air quality modeling issues as well
Ill KDAQ FAILED TO PROVIDE AN OPPORTUNITY FOR MEANINGFUL PUBLIC PARTICIPATION
a The Public Notice Lacked Required Information
The Administrator must object because the public notice failed to include the end
date[s] of the public comment period and US EPAs review period Under Kentuckys Title V
regulations the public notice shall include [t]he end date of the public comment period and
the end date of the US EPAs review period 401 KAR 52100 Section 5(6) and (7)
(emphasis added) A failure to comply with mandatory notice requirements is grounds for an
objection See Sierra Club v Johnson 436 F3d 1269 (II th Cir 2006) 16 The dictionary meaning
of the word date is a particular month day and year at which some event happened or will
happen 17 time stated in terms of the day month and year 18 or a specified day of a
month 19 Thus KDAQ is required to specify in the notice itself the day month and year on
which the public comment period and EPA review period will end
15 d at fnt 6 Petitioners note that they disagree with the importation of the EAB s clearly erroneous standard into the Title V process A preponderance of the evidence standard is more appropriate for reviewing state agency Title V determinations due to among other things the centrality of the US EPAs oversight function in Title V 16 See also Exhibit 8 August 2009 Trimble Order at 5 (the Administrators review includes whether the permitting agency has complied with the procedural requirements of the SIP) 17 Random House Dictionary Random House Inc 2010 American Heritage Dictionary of the English Language Fourth Ed Houghton Mifflin 2009
19d
5
However rather than include the required end date[s] in the notice KDAQ states
merely that written comments must be received within 30 days following the date of this
notice20 With respect to the US EPAs 45-day review period the notice includes a similar
statement and ironically references a US EPA website where the public can obtain more
information on the federal agencys review period21 The omission of the dates from the notices
violates the plain language of the regulations
In addition even if the public could ascertain the date of the notice independently from
the notice itself the omission of the end dates creates confusion about when the periods actually
close In Kentucky confusion has arisen in part due to a lack of clarity about how the agency
counts the 30-day period Prior to January 2010 and thus during the comment period for the
Permit KDAQ interpreted its regulations to include the date of notice in the required 30 day
period22 KDAQ subsequently modified its position after consulting with its attorneys and
clarified that the 30 days begins the day after publication23 The purpose of the explicit
requirement to include the end dates of the periods is to avoid such confusion Confusion as to
the end dates consumes the publics critical comment time in a manner that detracts from the
already limited opportunity to comment This lost time is especially problematic in a state such
as Kentucky which has repeatedly refused to extend the public comment period when requested
and in fact has read its regulations to prohibit extensions beyond the 30 day period24
For these reasons the Administrator must object and direct KDAQ to renotice the permit
including the end dates for the 30-day comment period and US EPAs review period in the
notice itself At minimum the Administrator should require KDAQ to comply with the notice
requirements in all future permit proceedings by including the end dates for the public and US
EPA review periods in the notices themselves as the Kentucky SIP explicitly requires
20 See eg Exhibit 9 KDAQ Air Quality Permit Notice Permit V-09-006 21 d US EPA has up to 45 days following issuance of the proposed permit to submit comments The status regarding EPAs 45-day review of this project and the deadline for submitting a citizen petition will be posted at the following website address httpwwwepagovregion4airpermits Kentuckyhtm shortly after the end of this 30-day comment period 22 See Exhibit 10 email from James Morse KDAQ to Faith Bugel ELPC Public Comment Period for KY Syngas January 6 2010 (Kentucky Syngas Email) It is Petitioners understanding that this interpretation was not in keeping with either that of US EPA or other states 23 See id 24 See Exhibit 11 Email from John Lyons Director DEP NRPPC to Meleah Geertsma ELPC June 192007 (stating in response to request for extension of a public comment period due to the newness of the technology that 40 1 KAR 52 I 00 Sections 2(2)(a) amp 2(2)(b ) are very prescriptive in that the comment period shall begin on the date the notice is published and shall end thirty (30) days after the publication date (emphasis added))
6
b KDAQ Omitted Several Categories of Required Permit Application Information and Supporting Materials During the Public Comment Period
The Administrator must object because KDAQ omitted numerous required analyses and
supporting materials from the record available for public review during the comment period
depriving the public of a meaningful opportunity for comment The Cash Creek application is a
thin document backed by insufficient supporting information where any supporting information
is provided at all As the text of the Title V regulations requires substantially more information
the Administrator must object
Under state and federal regulations a Title V application must include detailed emissions
information for all sources of emissions (including emission calculations) control technology
and compliance information and information that may be necessary to implement and enforce
other applicable requirements of the Act or of [Title V] or to determine the applicability of such
requirements 40 CPR 705(c) By failing to make necessary information available for review
during the title V public comment process KDAQ violated the Clean Air Acts implementing
regulations In the Matter of WE Energies Oak Creek Power Plant Permit No 241007690-PIO
Order Responding to Petitioners Request that the Administrator Object to Issuance of State
Operating Permit June 12 2009 at 24 (citing 40 CFR sect 707(h)(2)) see also In re RockGen
Energy Center 8 EAD 536 552-55 (EAB 1999) (failure to include startup shutdown and
malfunction plan in the permit and subject it to public comment)
The categories of required information that were shielded from public scrutiny during the
Cash Creek public comment period are numerous and serious They include but are not limited
to the following
(1) supporting information for numerous emission factors for among other things VOCs and H2S04 from the combustion turbine CO VOCs NOx PM and S02 from the aspirator and these same pollutants from the emergency generator
(2) estimates of fugitive emissions from valves leaks flanges and other similar sources in part relied on to escape PSD for VOCs and H2S
(3) the leak detection and repair (LDAR) plan relied on to control fugitive emissions as well as the estimated controlled emissions under that plan and supporting materials for those emissions estimates
(4) the basis for the assumed heat content of the natural gas burned in the combustion turbines
(5) emissions information and supporting materials necessary for the BACT
7
determinations where the Applicant and KDAQ failed to provide either the types of sources (final or draft permits test data vendor guarantees etc) reviewed in reaching their BACT analyses or the actual information that each of these sources provided
(6) a cost-effectiveness analysis to support rejection of lower sulfur coal in the BACT process
(7) a cost-effectiveness analysis to support rejection of dry cooling in the BACT process and
(8) a flare operation plan to control flaring emissions
In Petitioners January 2010 comments on the draft permit for the Cash Creek facility
Petitioners pointed out that the information listed above was missing entirely from the permitting
record and that this information must be submitted to KDAQ and made available to the public
before issuance of a proposed Title V permit
In its response to this comment KDAQ essentially acknowledged that this information is
needed to issue the Permit and included new analyses terms and conditions but maintained that
no further public comment period is warranted because no permit limits or conditions have
been relaxed25 KDAQs position- that the express requirements of 40 CFR 705 and 707(h)
can be disregarded- violates the Clean Air Acts implementing regulations Moreover KDAQ
fails to acknowledge that its violation of these requirements deprives the public of the
opportunity to comment on the sufficiency of the proposed Permits new analyses and additional
permit terms and conditions which themselves may (and as set forth below in fact do) continue
to fall short of CAA requirements For these reasons the Administrator should object and direct
KDAQ to make all necessary information available to the public and to hold an additional public
comment period prior to the issuance of a revised proposed Title V permit
IV THE POST HOC ANALYSES OF EMISSIONS FROM ACTIVE FLARING AND BACT FOR THE FLARE ARE IN ERROR
The Administrator must object because the Applicant and KDAQ relied on a faulty and
incomplete assessment of emissions from active flaring as well as a flawed BACT analysis and
inadequate BACT limits for the flare Errors in estimating emissions from the flare are
significant because the agency used the estimates to support its determination that the proposed
25 See eg Exhibit 12 KDAQ Comments and Response on the Draft Permit V-09-006 March 2010 (RTC) at B-9 to B-10
8
facility is a minor source of VOCs H2S and HAPs The flawed BACT limits in tum fail to
ensure the maximum reduction in pollution from the flare
a PTE Must Include Startup Shutdown and Malfunction Emissions Including Those From Active Flaring
The applicable Kentucky SIP provision states in relevant part as follows concerning
calculation of a sources PTE
Potential to emit or PTE means the maximum capacity of a stationary source to emit a pollutant under its physical and operational design and shall
(a) Include air pollution control equipment and restrictions on the hours of operation or on the type or amount of material combusted stored or processed if the limitation or its effect on emissions is federally enforceable and
(b) Not include secondary emissions
401 KAR 50010 Section 1(103) In short this provision requires first that PTE reflect the
maximum capacity to emit a pollutant As flares emit pollutants and contribute to this maximum
capacity their emissions must be included in PTE Nowhere does the definition make a blanket
exception for emissions during startup shutdown and malfunction (SSM) of the facility The
definition also requires that to the extent that the applicant or agency claims that maximum
capacity to emit is constrained in any way the constraint must be explicitly set forth in the
permit as a physical or operational limit- ie a specific limit on fuel hours of operation or
pollution control equipment operating parameters -that is practicably enforceable
Emissions from the use of flares furthermore must be included in PTE calculations
because flares are emissions units whose purpose is to control release of gases from process
units Determining if PSD applies to a particular pollutant first involves calculating whether the
project will result in a significant emissions increase This process entails adding together the
potential to emit of each emissions unit 401 KAR 51 0 17E Section 1 ( 4 )( a)(2) 26 The
Kentucky SIP defines emissions unit broadly to include any part of a stationary source that
emits or has the potential to emit a regulated NSR pollutant 401 KAR 51001 Section 1(66)
26 Actual-to-potential test for projects that involve only construction of new emissions units A significant emissions increase of a regulated NSR pollutant shall be projected to occur if the sum of the potential to emit from each new emissions unit following completion of the project equals or exceeds the significant amount for that pollutant (emphasis added)
9
are emissions units in that they actually emit regulated NSR pollutants Indeed the US
EPA Environmental Appeals Board (EAB) the agencys adjudicative body has specifically
recognized that flares are among the [ ] emissions units that will contribute to the increase in
pollutants counted towards triggering PSD or NNSR review See In re ConocoPhillips Co PSD
Appeal No 07-02 Order Denying Review in Part and Remanding in Part at 8-9 (EAB June 2
2008)27 Moreover flares emit pollutants while operating under their design to control emissions
from the larger facility eg during periods of facility SSM The PTE of a flare under the
significant emissions increase prong therefore means the maximum capacity of that flare to emit
a pollutant during active flaring It follows that all active flaring emissions must be included in
the significant emissions increase calculation
US EPA determinations and guidance interpreting the controlling federal regulatory
definition make clear that facility SSM emissions must be included in PTE calculations This
issue has been squarely addressed in a recent response to a Title V petition emphasizing that the
massive pollution from flares must be addressed in permitting The Administrator objected to
the permit in that case for its failure to fully take account of flaring emissions either by including
them in PTE or limiting them under federally enforceable permit In addition in
prior comments on a PSD permit US EPA has stated straightforwardly that [t]he regulations
do not provide exemptions for excluding startup emissions from a facilitys Potential to Emit
(PTE)29 The agency likewise has issued guidance to states stating as follows
The consensus is that for the purposes of determining PTE in the New Source Review (NSR) and Title V programs EPA has no policy that specifically requires exclusion of emergency (or malfunction) emissions Rather to determine PTE a source must estimate its emissions based on the worst case scenario taking into account startups shutdowns and malfunctions 30
27The EAB further bolstered the requirement to treat flares as emissions units by its remand of the permit at issue to the state agency for a proper PSD program review of the Best Available Control Technology (BACT) for flaring emissions See In re ConocoPhillips at 27-36 The EABs ruling requiring BACT for flares cannot be reconciled with KDAQs attempt to omit active flaring emissions from PTE 28 See Exhibit 13 In the Matter of BP Products North America Inc Whiting Business Unit Order Partially Denying and Partially Granting Petition for Objection to Permit October 16 2009 (BP Title V Order) at 5-7 29 Exhibit 14 US EPA Comments on the Draft Prevention of Significant Deterioration (PSD) Permit AP-5873 to Construct at Medicine Bow Fuel and Powers Industrial Gasification and Liquefaction Plant August 4 2008 30 See Exhibit 15 Letter from Steven C Riva US EPA to William OSullivan Division of Air Quality NJ Dept of Environmental Protection February 14 2006 (emphasis added)
10
conditions28
Without such a requirement the purpose of NSR - to protect air quality by requiring stringent
control of polluting facilities- would be significantly weakened Facilities moreover would
have little incentive to minimize SSM to the greatest extent possible in the design and operation
planning stages
With regards to limiting PTE courts have emphasized the need to ensure that any
constraints assumed on potential to emit are grounded in enforcement reality United States v
Louisiana Pacific Corp 682 F Supp 1122 (D Colo 1987)31 See also Weiler v Chatham
Forest Products 392 F Supp 532 535 (2nd Cir 2004)32 The Louisiana Pacific court described
PTE as the cornerstone of the entire PSD program and observed that allowing illusory and
unenforceable limits to curtain PTE would create a loophole that could effectively wipe out PSD
requirements entirely 682 F Supp at 1133 To include enforceable limits on PTE the permit
must create mandatory obligations (standards time periods methods) Specifically a permit
condition must ( 1) provide a clear explanation of how the actual limitation or requirement
applies to the facility and (2) make it possible for KDAQ US EPA and citizens to determine
whether the facility is complying with the condition See eg Sierra Club v Ga Power Co 365
F Supp 2d 1297 1308 (D Ga 2004) (citing Sierra Club v Public Serv Co 894 F Supp 1455
1460 (D Colo 1995)) The requirement that PTE calculations be made enforceable through
adequate permit limits was recently upheld by the Administrator in her objection to the Title V
permit for BPs Whiting facility Under the relevant Kentucky SIP provision caselaw and US
EPA guidance33 the only limits that render a design limitation on emissions enforceable for
purposes of PTE are specific restrictions on operation and design set forth in the permit
adherence to which can be verified by authorities Permit conditions requir[ing] monitoring
31 The specific holding of Louisiana Pacific- that limits on PTE must be federally enforceable- has been overruled by authority stating that the limits may also be enforceable as a practical matter See National Mining Assn v USEPA 59 F3d 1351 (DC Cir 2004) (holding that limits on PTE must be enforceable as a practical matter but need not necessarily be federally enforceable) However the basic principles concerning PTE articulated in Louisiana Pacific remain standing 32 In short then a proposed facility that is physically capable of emitting major levels of the relevant pollutants is to be considered a major emitting facility under the Act unless there are legally and practicably enforceable mechanisms in place to make certain that the emissions remain below the relevant levels 33401 KAR 52001(56) Louisiana Pacific supra and Weiler supra Exhibit 16 Terrell Hunt Associate Enforcement Counsel US EPA Air Enforcement Division and John Seitz Director US EPA Stationary Source Compliance Division Guidance on Limiting Potential to Emit in New Source Permitting (June 13 1989)
11
only and [not specifying] measures by which emissions will be limited to prevent their
exceeding the PSDNNSR significance levels do not constitute sufficient limits on PTE34
b KDAQ Failed to Estimate the Full Emissions From Active Flaring
During the public comment period Petitioners raised concerns with potential emissions
from active flaring which will occur when the facility goes through SSM35 Petitioners
specifically commented on underestimation of flaring emissions during startup and the complete
omission of flaring emissions during shutdown and malfunction KDAQ responded by putting
forth several arguments None of these arguments hold weight as set forth below
First KDAQ claims as a general matter that PTE excludes malfunctions citing to the
definitions of PTE and malfunction in the state SIP and concluding that Kentucky regulation
does not consider a malfunction as representative of normal operation36 This conclusion is in
error as it ignores the regulations unit-by-unit PTE summation process outlined above and is
contrary to US EPAs interpretations regarding PSD applicability While KDAQ cites to the
Administrators 2008 Title V Order for the Trimble County Generating Station37 the footnote it
cites is inapposite for several reasons First the argument set forth in the footnote also is contrary
to a direct reading of the unit-by-unit PTE summation process as it applies to flare emission
units The Trimble case did not involve a flare (an emission unit whose purpose is to operate
while the facility is going through SSM) so is not directly relevant to the particular issue in this
case ie whether emissions from this particular emission unit must be included in the PSD
applicability determination for a new source Second the definition of actual emissions relied
on in the footnote 401 KAR 51001 Section 1(2)(a) is not directly relevant to determining
potential emissions Moreover even if this definition of actual emissions were instructive as to
PTE the definition explicitly states that it does not include 1 Calculating if a significant
emissions increase has occurred 401 KAR 51 001 Section 1 (2)( d) which is the very question at
issue here For these reasons KDAQ erred in concluding that PTE excludes malfunctions as a
matter of regulatory interpretation
34 See Exhibit 13 BP Title V Order at 8-9 35 Exhibit 3 January 14h Comments at 9-14 36 Exhibit 12 RTC at B-30 37 d at B-30 (citing US EPA LGampE Trimble Order in Response to Petition No IV-2008-3 at 18 n 20)
12
KDAQ claims that shutdown (and therefore malfunction) emissions are included
in the PTE previously reported in the The theory backing KDAQs claim is that the
emission reductions from process equipment going offline during SSM will always outweigh
increased emissions from the flare during the same events KDAQ specifically concludes that
[t]here is no situation during a malfunction where emissions would be greater than that [sic]
which would occur during steady state operations39 However KDAQ fails to back its
statements with any quantitative analysis of different malfunctions that could occur and
underestimates flaring emissions during SSM by citing unsupported emission estimates for only
one limited shutdown scenario
The sole shutdown scenario presented in the Response to Comments is one where a
single gasifier shuts down while another starts up This shutdown scenario is not representative
of malfunctions but instead represents a planned shutdown KDAQ only provided an estimation
of shutdown emissions for this one very particular scenario citing reductions from process
equipment shutdown of for example 52 lbs of VOCs40 DAQ only estimated that emissions
generated from the flare from this process shutdown would be 04 lbs of VOCs Flaring
emissions under many scenarios not considered by DAQ can go far higher than 04lbs and in
fact can result in tons of emissions in one day System upsets and malfunctions could cause
flaring even without other equipment shutting down where gas mixes become non-optimal fuel
for the flare and where burps of short term flaring occur Furthermore the entire facility
could face an emergency causing complete shutdown In sum many other malfunctions could
occur and flare emissions during these events could significantly exceed emissions reported for
the single scenario of a planned shutdown For these reasons KDAQ erred in concluding that the
reported PTE includes all shutdown and malfunction emissions as a technical matter This
underestimation of flaring emissions is especially of concern given the slim margin by which the
facility avoided full PSD review for VOCs
38 d at B-31 39 Id at B-31 40 d at B-35
13
application38
c The Permit Lacks Enforceable Conditions to Ensure Low Levels of Flaring Emissions
On top of these failures to estimate flaring emissions the Permit does not contain many
specific terms and conditions necessary for ensuring compliance with its own requirements and
for maintaining consistency with the assumptions of the application and minor source
determinations It does not in other words contain enforceable limits on the flares PTE For
example the Permit is substandard compared with established flare minimization flare
monitoring flare recordkeeping quality assurance and control and other requirements of the
BAAQMD flare monitoring and control rules and combined rule of SCAQMD 1118 41 A
comparison of these requirements and the Permits shortcomings are as follows
First the Permit does not actually require flare minimization to ensure that the facility
does not exceed the (unenforceable) 36 tpy source-wide VOC limit or other requirements
Instead the Permit only contains generalized Good Engineering Practices requirements (Section
E) and requirements to take reasonable steps to minimize levels of emissions (not specifically
flaring) exceeding standards during an emergency (Section G) In addition there is no flare
minimization plan required for Cash Creek just a requirement for an operation plan consisting of
a description of what Cash Creek plans to do which the Applicant may submit to the agency
after startup of the facility 42 The Permit lacks any required process andor standards for
KDAQ s approval or disapproval of this plan In addition the Permit contains no provision for
public or US EPA review of and comment on the adequacy of the plan or process for revising
the plan as factors impacting flaring change
In contrast the BAAQMD rules require flare minimization allowing flaring only as
necessary in an emergency and as set forth in an approved Flare Minimization Plan (FMP)
The FMP must be submitted to BAAQMD for certification and submitted for public review and
comment and must be revised on a regular basis to account for factors that may impact flaring
over the life of the facility eg changes in process equipment inputs and flare condition This
FMP must include the following
Technical Data Description and technical information for each flare capable of receiving
41 Exhibit 17 BAAQMD Regulation 12 Rule 11 Flare Monitoring at Petroleum Refineries (BAAQMD Rule 11 Flares) Exhibit 18 BAAQMD Regulation 12 Rule 12 Flares at Petroleum Refineries (BAAQMD Rule 12 Flares) and Exhibit 19 SCAQMD Regulation 1118 Control of Emissions From Refinery Flares 42 Exhibit I Permit at 44-45 of I 0 I Cond 5
14
gases and upstream equipment and processes that send gas to the flare including Detailed process flow diagram accurately depicting all pipelines process units flare gas recovery systems water seals surge drums and knock-out pots compressors and other equipment that vent to each flare At a minimum the diagrams must include full and accurate as-built dimensions and design capacities of the flare gas recovery systems compressors water seals surge drums and knockout pots Full and accurate descriptions of the locations of all associated monitoring and control equipment
Nowhere does the Permit require such critical information for ensuring short- and long-term
compliance with the assumed low levels of flaring emissions or other supposed flare permit
limits
Nor does the Permit identify any specific flare monitoring requirements or detection
limits for flare gas composition or any specific detection limits for monitoring flow or any
specific quality assurance requirements The Permit also has few data reporting requirements
All of these requirements are needed to ensure compliance with the source-wide 36 tpy VOC
limit and other requirements to minimize startup shutdown and routine flaring emissions Such
an omission is in contrast to the many specific requirements in both the BAAQMD and
SCAQMD rules for monitoring procedures
BAAQMD data reporting provisions also require significantly more detailed reports for
ensuring compliance than does the Permit The BAAQMD reporting requirements include
Electronic Monthly Report to agency Volumetric flow for each day for month and hour Composition (if sampling total hydrocarbon as propane by volume methane by volume and H2S by volume and if any additional compounds the content by volume of each) (if vent gas composition monitored by a continuous analyzers average total hydrocarbon as propane by volume average methane by volume and total reduced sulfur by volume or H2S by volume flared for each hour and if additional compounds monitored average content by volume for each additional compound for each hour) Molecular weight If flow monitor measures molecular weight the average for each hour of the month Pilot and purge gas Type of gas used volumetric flow for each day and the month and means used to determine flow Downtime Flare monitoring system downtime periods including dates and times Archive Video monitoring The archive of images recorded for the month for video monitoring (and many details on how to do continuous video monitoring of flare) Daily reporting of methane non-methane SOx For each day and for the month provide calculated methane non-methane and sulfur dioxide emissions For the purposes of calculations only flare control efficiency of 98 percent shall be used for hydrocarbon
15
flares 93 percent for flexi-gas flares or if based on the composition analysis calculated lower heating value of vent gas is lt300 BTUSCF Flow Verification Report every six months for each flare included in the corresponding monthly report The report shall compare flow as measured by the flow monitoring equipment and a flow verification for the same period or periods of time Development implementation and maintenance of the written operation plan
Finally Cash Creeks supposed compliance Determination in Section D of the permit is
just a formula without actual measurement As set forth elsewhere in these comments Section D
contains an unenforceable circular equation that assumes without basis what startup emissions
will be per hour then multiples 1328 lbshour times the number of hours times an assumed high
destruction efficiency (995 percent) and does not measure shutdown at all For pilot gases
Section D also contains a formula without measurement of hourly emissions times the number of
hours per month The Permit provides no way to assure that 1328 lbslhour is met during startup
and no way to assure that 995 destruction efficiency is met
d The Flare Permit Measures Are Not BACT
In addition to underestimating flareemissions during facility SSM KDAQ failed to
include proper BACT limits for the flare KDAQ identifies the flare as an Emission Unit[ ]
Subject to BACT Analysis43 Nowhere however does it conduct the required top-down process
for determining BACT for the flare KDAQ instead lists the flare in the general category of
combustion equipment for which it only then lists combustion and post-combustion control
strategies and technologies none of which apply directly to the flare and flaring emissions44
KDAQ then lists the flare as an auxiliary combustion source for which it again provides no
discussion of control options apart from a general discussion of the inappropriateness of using
add-on controls on sources that are used on a limited basis45 KDAQ concludes its supposed
BACT flare analysis by stating only as follows
Review of recently permitted and proposed natural gas production plants and electric generating stations disclosed no instances where natural gas fired flares
43 Exhibit 20 KDAQ Proposed Permit Statement of Basis Permit V -09-006 March 1 2010 (March 2010 SOB) at 20-21 of 5 1 44 Id at 27 to 28 of 51 Table 4-3 see also id at 29 to 30 of 51 (discussing technical feasibility of control options for combustion sources) 45 d at 30 of 51
16
any form of add-on control technologies The applicant proposes proper design operation and maintenance and combustion of natural gas as BACT for the flare
The March Statement of Basis omits any discussion of what constitutes proper design operation
and maintenance of the flare In addition KDAQs BACT analysis only applies to the flare pilot
and flaring during facility startup47
This brief and vague treatment does not constitute a proper BACT determination First
KDAQ does not make a BACT determination for shutdown and malfunction contrary to the
requirement that BACT apply during all periods48 As described above KDAQ failed in the first
instance to assess malfunction emissions and so could not have assessed maximum reduction of
these emissions
Second KDAQ fails completely to explain what specific design operation and
maintenance measures are required at the flare and how these measures ensure the maximum
reduction in emissions achievable at the flare consistent with BACT requirements Terms and
conditions covering facility shutdown and malfunction emissions from flare that are in the Draft
Permit are not supported by a proper top-down BACT analysis The following terms and
conditions (arguably) apply to the flare during facility shutdown and malfunction
(1) operating limits requiring that [t]he process gases that are vented to the flare must be vented at a constant rate over a minimum of an eight (8) hour period to ensure that the vented pollutants do not exceed the rate that would have occurred from the processes during normal operations and [t]he maximum number of shutdown events shall not exceed 52 events (the same number of startup events perrnitted)49
(2) an emission limit on visible emissions that applies at all times (3) source-wide emission limits on VOCs and H2S04 ( 4) a vent monitoring requirement to measure and record the date and time of flaring events
and the volume of waste gas vented to the flare and (5) various recordkeeping provisions generally requiring a plan that includes root cause
analysis for emergency events and corrective action plus calculation of emissions on a monthly and annual basis50
at 41 of 51 47 d at 41 to 42 of 51 Tables 4-25 (BACT Selection for Flare Pilot) and 4-26 (BACT Selection for Flare during Start- -up) 48 See eg Exhibit 21 In the Matter of Louisville Gas and Electric Company Partial Order Responding to March 2 2006 Petition and Denying in Part and Granting in Part Request for Objection to Permit Revision 2 September 10 2008 at 10 see also Sierra Club v EPA 551 F3d 1019 (DC Cir 2008) (finding for the analogous MACT program that the EPAs the SSM exemption violates the CAAs requirement that some Section 112 standard apply continuously) 49 Exhibit I Permit at42 Cond l(c)(2) and (3) 50 d at 44-46
17
46 d
None of these limits is supported by a top-down BACT analysis that covers flares and indeed
nothing in the record suggests that most of these limits had any direct connection to BACT
KDAQ added the operating limits requiring venting to the flare at a constant rate and
limiting shutdown flaring to 52 events in response to Petitioners comments However KDAQ
appeared to pick these numbers at random as there is no supporting information in the record
There are no calculations or other information showing that the required venting rate will
actually keep flare emissions below emissions from process equipment that would have occurred
over the same period That KDAQ failed to estimate a whole range of malfunction flaring
emissions strongly suggests that the selected venting rate cannot keep emissions below those that
would have occurred from process equipment Nor is there any analysis showing that 52
shutdowns (or the 52 allowed startups for that matter) are the minimum number of shutdown
events consistent with BACT for the gasification plant operations
As for the remainder of the limits the emission limit on the visible emission limit is
included pursuant to 401 KAR 6301551 a general state limit on particulate matter emissions
from flares The VOC and H2S04 limits are included to avoid applicability of PSD for these two
pollutants and do not include emission rates for flaring during shutdown and malfunction The
monitoring and reporting requirements are included as CAM measures and pursuant to state Title
V requirements52 None of these measures have any connection to the require BACT analysis
and limits
The Applicant and KDAQ also have not demonstrated that imposing and complying with
an emission limit for periods of shutdown and malfunction is infeasible This showing is required
in order to justify the use of a work practice or operating standard in place of an emission limit
See 40 CFR 51166(b)(l2)53 Even if a work practice or operational standard is justified the
permit must include as part of that standard the emissions reduction achievable by
implementation of such design equipment work practice or operation and shall provide for
d at 43 Cond 2c 52 d at 44-45 Cond 4 and 5 (citing 40 CFR 643 647 and 649 as well as 401 KAR 52020 Section 26)) 53 If the reviewing authority determines that technological or economic limitations on the application of measurement methodology to a particular emissions unit would make the imposition of an emissions standard infeasible a design equipment work practice operational standard or combination thereof may be prescribed instead to satisfy the requirement for the application of best available control technology Such standard shall to the degree possible set forth the emissions reduction achievable by implementation of such design equipment work practice or operation and shall provide for compliance by means which achieve equivalent results 401 KAR 51 00 I Section l (25)( c)
18
51
compliance by means which achieve equivalent results d No such emissions reduction is
included in the Permits monitoring and recordkeeping requirements for the flare
Nor do the provisions outlining the requirements for a to-be-submitted flare operation
plan or the reporting requirements qualify as BACT54 KDAQ expanded on the elements of the
operation plan that are to be addressed and [ ] added specific criteria that will trigger a root cause
analysis in response to Petitioners comments regarding the inadequacy of the design and
operation plan 55 The agency based these additions on the New Source Performance Standards
(NSPS) for petroleum refineries 40 CFR 60 Subpart Ja56 recognizing that flare
minimization requirements at refineries are relevant to the flare at the proposed gasification
plant However BACT must start at the NSPS not end there if other sources provide relevant
examples of more stringent requirements See 40 CFR 51166(b)(l2) (In no event shall
application of best available control technology result in emissions of any pollutant which would
exceed the emissions allowed by any applicable standard under 40 CFR parts 60 and 61)
KDAQ ignored more stringent flare operation plan requirements under Bay Area Air Quality
Management District Regulation (BAAQMD) 12 Rule 12 for Flares at Petroleum Refineries as 7described above with respect to enforceability 5
V THE POST HOC ANALYSES OF FUGITIVE EMISSIONS FROM AND CO BACT FOR EQUIPMENT LEAKS ARE IN ERROR
The Administrator must object because the underlying emission estimates and BACT
analysis for fugitive equipment leaks are based on numerous unreasonable and unsupported
assumptions as well as omissions The Permit in tum does not contain enforceable terms and
conditions sufficient to ensure that actual emissions from equipment leaks will not significantly
exceed those assumed in the minor source determination These shortcomings are critical
because KDAQ relied on the faulty analysis to support its determinations that the facility is a
minor source of VOCs H2S and HAPs In addition KDAQ failed to adopt limits that represent
54 This substantive issue with the flare operation plan is separate from and in addition to the public participation violation resulting from a failure to provide the plan for public comment along with the draft permit as set forth above 55 Exhibit 12 RTC at B-58 56 d at B-58 57 Exhibit 18 BAAQMD Rule 12 Flares
19
BACT for CO from equipment leaks As the minor source determinations are in error and the
BACT analysis is flawed the Administrator must object
a KDAQ Relied on Post Hoc Estimations of Fugitive Emissions From Equipment Leaks and a BACT Analysis for Leaks Submitted After the Public Comment Period
In making its faulty determinations that the proposed facility is a minor source of VOCs
H2S and HAPs KDAQ relied in part on an after-the-fact and flawed analysis of fugitive
emissions from equipment leaks submitted by the Applicant Petitioners pointed out the total
omission of fugitive leak emissions from the permit application in their comments on the draft
permit58 In response KDAQ requested such an analysis from the Applicant who then submitted
an estimation of emissions and proposed CO BACT limits contained in a letter and
attachments59 These materials were not made available to the public as part of any additional
comment period Moreover the materials themselves provide no basis for several important
assumptions as set forth below
KDAQ adopted the analysis without any changes in issuing the final permit To the
Permit itself KDAQ added a new section for fugitive equipment leaks and several additions to
other sections of the Permit The fugitive equipment leaks section includes (a) a table listing an
approximate count of the equipment as of the date of permit issuance (b) operating
requirements to apply an LDAR program as BACT for CO as well as for compliance with the
source-wide limits on VOCs and H2S contained in Section D of the Permit (c) emission
limitations of 139 tpy of CO 12-month rolling average based on the LDAR program and the
Section D source-wide limits on VOCs and H2S and (d) monitoring requirements constituting
the LDAR program based on a Texas Commission on Environmental Quality (TCEQ)
program60 Section Din turn contains two equations for allegedly determining compliance with
the source-wide emission limits on VOCs and H2S To account for fugitive equipment leaks
KDAQ added components consisting of LDAR Emissions VOC lbmonth and LDAR
58 Exhibit 3 January 14th Comments at 8-9 59 Exhibit 22 Letter from Michael McInnis Manager Cash Creek Generation LLC to John Lyons Director Energy and Environment Cabinet Response to Sierra Club Comments Respecting Fugitive Process Emissions February 19 2010 (February 19th Fugitive Leak Letter) 60 Exhibit I Pennit at 60 to 64 of I 0 I Exhibit 22 February 19th Fugitive Leak Letter
20
Emissions H2S lbmonth to the equations61 The method for calculating the LDAR emissions in
lbmonth relies on the emission factors and control efficiencies assumed in the emission
calculations62
b The Post Hoc Estimation of Fugitive Emissions From Equipment Leaks Relies on Unsupported and Improper Assumptions Resulting in an Underestimation of Emissions
The Administrator must object because the estimation of fugitive emissions from
equipment leaks significantly underestimates emissions through use of improper and
unsupported assumptions Use of appropriate emissions factors assumptions and methods would
result in significant additional annual tons of fugitive VOC and H2S HAP emissions By failing
to require or provide an analysis of the full potential to emit from equipment leaks KDAQ
allowed the Applicant to improperly qualify as a minor source The omissions inaccuracies and
unreasonable assumptions are as follows
1 NSR applicability estimating Potential to Emit (PTE) and emission factors
The unit-by-unit process for calculating the projects PTE is set forth above in the section
regarding the flare Fugitive emissions like those from equipment leaks are to be included in the
NSR applicability determination for all sources listed in 40 CFR 51166(b )( 1)(iii) As the proposed
source is a combination of several of the listed sources fugitive emissions must be included in
determining whether the source triggers PSD
When estimating emissions for purposes of PSD US EPA emphasizes that [f]or each
emissions unit the estimate should be based on the most representative data available63 In
addition US EPA has provided several notes of caution with respect to the use of general
emission factors as well as guidance on the proper selection of emission factors where other
more appropriate sources are not available The Introduction to AP-42 states as follows on these
topics
If representative source-specific data cannot be obtained emissions information from equipment vendors particularly emission performance guarantees or actual
61 Exhibit 1 Permit at 85 of 101 62 d at 86 of 101 63 Exhibit 23 US EPA New Source Review Workshop Manual (Draft) October 1990 (NSR Manual) at C2
21
test data from similar equipment is a better source of information for permitting decisions than an AP-42 emission factor When such information is not available use of emission factors may be necessary as a last resort Whenever factors are used one should be aware of their limitations in accurately representing a particular facility
Where risks of either adverse environmental effects or adverse regulatory outcomes are high more sophisticated and more costly emission determination methods may be necessary
Care should be taken to assure that the subject source type and design controls and raw material input are those of the source(s) analyzed to produce the emission factor 64
EPA additionally has found that emissions factors have been inappropriately used in permitting
situations in ways that underestimate emissions 65 In particular as the Administrator has
explained it is improper to employ emission factors developed based on other industries or
sources without showing that such factors are appropriate for the particular source at issue66
Problems with inappropriate uses of emission factors in estimating PTE are perpetuated
and compounded by basing compliance demonstrations on the very same emission factors used
to estimate PTE Permits must require actual testing of emissions and development of a source-
specific emission factor from operations once a source is up and running Otherwise the
appropriateness of the general or industry-wide emission factor for that particular source can
never be verified
As set forth below the Applicant and KDAQ failed to provide an adequate basis for their
selected emission factors The chosen factors resulted in emission estimates significantly lower
than would have resulted from more appropriate factors Moreover the Permit does not require
actual testing of fugitive equipment leak emissions but instead allows the Applicant to
demonstrate compliance circularly using the assumed emission factors This scheme does not
ensure that the proposed plant will be a minor source of VOCs H2S andor HAPs
64 Exhibit 24 US EPA Introduction to AP-42 Volume I Fifth Ed January 1995 at 3-4 65 Exhibit 25 Evaluation Report EPA Can Improve Emissions Factors Development and Management Report No 2006-0017 March 22 2006 66 See eg Exhibit 13 BP Title V Order at II (objecting where agency failed to respond to comments on the inappropriateness of using emission factors developed for light crude in estimating emissions from processing heavy crude)
22
n The Applicant and KDAQ fail to justify dismissal of higher EPA refinery emissions factors and adoption of SOCMI without ethylene emission factors
The February 19th letter includes a statement that the applicant used SOCMI (Synthetic
Organic Chemical Manufacturing Industry) without ethylene emissions factors and that the
Applicant considered EPAs refinery emissions factors inappropriate The record provides no
indication that any effort was made to identify representative source-specific emission
information from similar facilities In addition no basis was provided for the reasoning behind
the dismissal of EPAs refinery emission factors The refinery emission factors are more
appropriate for gas streams at the proposed facility because the coal-gasification facility will
have process streams more like those at an oil refinery ie made up of hydrocarbons sulfur
compounds hydrogen metals steam and other such compounds If applied to the same
calculations the refinery emission factors would result in substantially higher emissions from the
proposed source since the refinery emission factors are an order of magnitude or more larger
than the chosen SOCMI factors
Moreover the Applicant and KDAQ do not demonstrate that the SOCMI without
ethylene factors are appropriate for the proposed facility They ignore the following statement in
the TCEQ source document (which they cite for the fugitive equipment leak analysis)
The SOCMI factors are generally for use in chemical plants including chemical processes that are located in a refinery SOCMI factors are divided into three different sets which are applied in different situations The original SOCMI ave rage factors were developed to represent fugitive emission rates from all chemical plants 67
The proposed Cash Creek facility is not a synthetic chemical plant nor does it contain a subset of
synthetic chemical plant processing as some oil refineries contain inside their overall fossil fuel
production facilities Furthermore US EPAs Protocol for Equipment Leak Emission Estimates
states
For example in most cases SOCMI emission factors and correlations are applicable for estimating equipment leak emissions from the polymer and resin manufacturing industry This is because in general these two industries have
67 Exhibit 26 TCEQ Air Permit Technical Guidance for Chemical Sources Equipment Leak Fugitives (Draft October 2000) at 4 of 55
23
comparable process design and comparable process operation they use the same types ofequipment and they tend to use similar feedstock 68
The coal gasification industry is not similar to polymer or resin manufacturing industries (which
for example make plastics glues fiberglass backing material fiber optics components and many
other physical materials not part of energy production industries) either in terms of types of
equipment or similar feedstock Rather as stated above coal gasification plants are more similar
to oil refineries with regards to these factors and thus gas streams
Finally the Applicant and KDAQ selected the SOCMI without ethylene factors without
providing an evaluation of the higher SOCMI average emissions factors The particular SOCMI
factors chosen by the applicant are conveniently the lowest possible emissions factors provided
by SOCMI (other than SOCMI factors for non-leakers) No mention was made in the February
191h letter or KDAQs Statement of Basis of the existence of other SOCMI emissions factors
(such as SOCMI average factors) which are also much higher than the SOCMI emission factors
without ethylene
In sum the Applicant and KDAQ have failed to establish that industry-wide synthetic
chemical plant emission factors are appropriate for use in estimating fugitive leak emissions for
the proposed coal gasification facility
iii Unsupported process stream compositions
Neither Cash Creek nor KDAQ provided any basis or technical background regarding the
percentages or types of different chemicals in each process stream used in fugitive equipment
leak emission calculations Some of the streams identified in the Applicants submission are
characterized with very low VOC content or very low percentages of other key pollutants Use
of higher percentages of non-methane hydrocarbons in these process streams would have
resulted in higher VOC fugitive leak emissions For example although the Applicant lists a
significantly larger number of fugitive components than the similar Kentucky NewGas (KNG)
facility Cash Creek estimates lower uncontrolled and controlled fugitive VOC emissions69 The
record does not explain or otherwise support this discrepancy Likewise no basis was provided
68 Exhibit 27 US EPA Protocol for Equipment Leak Emission Estimates November 1995 (EPA Leak Protocol) at 2-6 (emphasis added) 69 Compare Exhibit 22 February 19th Fugitive Leak Letter at 3-15 of 15 and Exhibit 28 Kentucky NewGas PDFfitle V Air Permit Application Tables C-24 to C-27
24
for the percentage of H2S and other key chemicals characterizing the process streams As set
forth above the coal-gasification facility is likely to have process streams similar to those at a
refinery which is inconsistent with the alleged process stream compositions identified by the
Applicant
Furthermore no basis was provided for limiting the chemicals identified in the process
streams to only certain chemicals identified The February 19th Cash Creek letter calculations
identify only H20 (water) C02 (carbon dioxide) H2S (hydrogen sulfide) COS (carbonyl
sulfide) H2 (hydrogen) CO (carbon monoxide) N2 (nitrogen) AR (argon) NH3 (ammonia)
CH4 (methane) C3H8 (propane) and CH30H (methanol) in the process streams that cause
fugitive emissions The application for the KNG facility identifies many additional compounds
present in process streams causing fugitive emissions including carbon disulfide (CS2) trace
quantities of various organic (ie benzene toluene naphthalene etc) metallic (ie mercury
chromium manganese etc) HAPs hexane (which is both a HAP and a VOC) hydrogen
chloride S02 RDS (Reduced Sulfur Compounds) and TRS (Total Reduced Sulfur) and also
hydrogen cyanide naphthalene phenol formaldehyde ethelbenzene and xylenes70 The KNG
Application also provides a discussion about where the process stream constituency was obtained
-- from manufacturer and test information No such information was provided for the proposed
Cash Creek facility rendering the gas stream composition unsupported
iv Omission of high-emission components
The fugitive leak estimates also are in error because they completely fail to account for
components where control of leaks is non-existent limited or delayed In determining the
control rate for the components the Applicant and KDAQ assumed exceedingly high levels of
control associated with a proposed leak detection and repair (LDAR) program The fugitive
leak emission estimates do not account for any non-accessible difficult-to-monitor or unsafe-to-
monitor components Rather the calculations assume control efficiencies ranging from 85
percent to 97 percent for all reported components with the exception of pumps in Selexol service
(heavy rich liquid) at the AGR (for which no control is assumed) In other words there are no
uncontrolled or lesser-controlled components other than the pumps in Selexol service By their
nature however non-accessible difficult-to-monitor and unsafe-to-monitor components will not
70 Exhibit 29 Kentucky NewGas PSDffitle V Air Permit Application at 3-19 to 3-20
25
be controlled at the same level as the reported components and in some cases should not be
considered controlled at all as control efficiency for leaking components is a direct result of the
monitoring and repair program Based on experience at other similar facilities the Cash Creek
facility will include some non-accessible difficult-to-monitor and unsafe-to-monitor
components No attempt was made to estimate and include the impact of such components on
fugitive leak emission estimates Due to omission of these components and the associated
emissions the fugitive equipment leak emissions numbers relied upon by KDAQ are
underestimates
In addition the Permit provides a process where delay of leak repair is allowed and
multiple leaks are allowed and no Permit limit is set which would limit the mass emissions from
delay of repair Moreover because of the permissive language in the permit provision the
Division Regional Office shall be notified and may require early unit shutdown 71 there is
essentially no limit on fugitive emissions from delay of repair of leaking components Such
potentially unlimited emissions are not accounted for in the fugitive leak calculations
v Inadequate permit conditions
The inadequacies and omissions in the fugitive leak emission calculations are perpetuated
and left uncorrected by the Permit itself which lacks enforceable terms to ensure that the
proposed facility actually is a minor source The gaps in the Permit include the following
Stream composition The permit provisions for fugitives do not address the gaps and uncertainties in the gas stream assumptions because no monitoring program or process sampling is required in order to confirm the low percentages of individual compounds in the gas and liquid process streams Emission factors and control efficiencies The Permit also lacks necessary limits and monitoring programs to confirm the emission factor and control efficiency assumptions used by the Applicant instead relying on calculations of emissions that circularly employ the very same factors to supposedly demonstrate compliance In other words the permit does not include any limits or monitoring program to ensure that mass emissions from leaks will not actually exceed those based on the SOCMI without ethylene factors In its evaluation of emission factor usage EPA not only identified problems with using inappropriate emissions factors in permit decisions but also identified more specific methods for developing data where industry-specific factors are unavailable For example EPAs Protocol for Equipment Leak Emission Estimates identified direct
71 Exhibit 1 Permit at 63 of 101 Cond 4(i)
26
measurement methods (bagging) for determining mass emissions 72 The Permit fails to require such bagging techniques to develop source-specific emission factors for use in ensuring that actual emissions stay below the levels assumed in the Applicants calculations Nor does the permit evaluate optical sensing techniques for comprehensively identifying leaks Unenforceable source-wide limits on VOCs and H2S As described above the Permit relies on two source-wide emission limits one for VOCs and one for H2S with equations as supposed compliance demonstrations The equations rely on the same assumptions used to estimate emissions in the first instance including the unsupported and non-source specific emission factors US EPA has clarified that such circular demonstrations are not enforceable limits on PTE 73
c KDAQ Omitted Numerous Control Options and Relied on a Faulty Cost-Effectiveness Analysis in Selecting CO BACT for Fugitive Equipment Leaks
In the supposed BACT analysis for CO from fugitive equipment leaks the Applicant and
KDAQ cut comers resulting in a failure to consider numerous control options for leaks and an
incomplete cost-effectiveness analysis
The CO BACT analysis is based on a survey of fugitive equipment leak control options
and emission rates either permitted or presented in permit applications for recent syngas
integrated gasification combined cycle (IGCC) and coal to liquids (CTL) projects in the
US74 This survey identified several general control options including (a) routing emissions
associated with pressure releases from PRVs to a control device (b) utilizing leakless
components (c) various LDAR programs (d) an audiovisualolfactory (AVO) monitoring
program for odorous compounds with intensive-directed maintenance (e) area monitors with
intensive-directed maintenance and (f) good work practices75 The Applicant and KDAQ
rejected use of 100 percent leakless components as economically and technically infeasible and
an AVO monitoring program as technically infeasible as a control option for CO (which is
odorless) After eliminating these two options the Applicant and KDAQ cited a single TCEQ
guidance document on equipment leak fugitives and selected a MACT Equivalent LDAR
72 See generally Exhibit 27 EPA Leak Protocol 73 Exhibit 13 BP Title V Order at 6-7 see also Exhibit 30 Letter from Pamela Blakley Chief Air Permits Section US EPA Region 5 to Matt Stuckey Chief Permits Branch Indiana Department of Environmental Management March 19 2010 (Blakley Letter) at 2 (stating with regards to a similar compliance equation that This condition is not a legally or practically enforceable prohibition on flaring emissions during periods of start-up shut-down and malfunction)74 Exhibit 22 February 19th Fugitive Leak Letter at 10 BACT Evaluation for Equipment Leak Components-Gasification Process 75 d at 3 of 5
27
with PRVs routed to control devices as BACT without citing any additional supporting
information other than Good Engineering Judgment (as the basis for the control effectiveness
for good work practices) This CO BACT analysis for fugitive leaks is flawed in several respects
as set forth below
First it unreasonably narrows the universe of sources to syngas IGCC and CTL
facilities completely overlooking chemical plants and refineries This omission is particularly
ironic given that the Applicant used emission factors developed from chemical plant data for its
emission calculations Chemical plants and refineries provide control options for fugitive
equipment leaks beyond those considered in the present analysis especially more stringent
LDAR programs A proper BACT analysis should consider technologies that are transferable
from other similar As control options used at chemical plants and refineries are
transferable to the present source the BACT analysis is incomplete
More stringent LDAR programs than the one adopted by Cash Creek are evidenced from
several sources First US EPA has been requiring enhanced LDAR at chemical plants and
refineries since the early 2000s77 These programs go beyond the LDAR program in the Permit
Second the Bay Area Air Quality Management District (BAAQMD) includes a l 00 ppm leak
standard for fugitives components for oil refineries and chemical plants in its Regulation 8
(Organic Compounds) Rule 18 (Equipment Leaks) Standard 8-18-302 (valves) and 8-18-304
(connectors) furthermore these regulations require that any leaks found be minimized in 24
hours and repaired in 7 days78 This is a regulation for existing equipment (not new facilities) so
BACT here must be at least if not more stringent Both the Cash Creek Permit and the
BAAQMD Permit use the same analyzer method (Method 21 of 40 CPR 60) and both are
measuring the same gases so the additional provisions in BAAQMD Rule 8-18 are feasible and
relevant The BAAQMD rule has additional quality control requirements for monitoring
including test methods for control efficiency not present in the Cash Creek Permit79
76 Exhibit 23 NSR Manual at B11 77 See Exhibit 31 Prepare to Clamp Down Tighter On Leaks Chemicalprocessingcom see also eg Exhibit 32 United States v INEOS ABS (USA) Corp 109-cv-00545-SAS Consent Decree (July 30 2009 SD Oh) (INEOS CD) and Exhibit 33 United States v Vertellus Agriculture amp Nutrition Specialties LLC 1 09-cv-01030-SEB-T AB Consent Decree (filed August 21 2009 SD Ind) (Vertellus CD) 78 Exhibit 34 BAAQMD Regulation 8 Rule 18 Equipment Leaks 79 The Cash Creek permit lists none for test requirements in Section B Fugitive Equipment Leaks see Exhibit 1 Permit at 61 of 101 Cond 3
28
76sources
BAAQMD Regulation 8 Rule 18 also includes other more stringent provisions in its
LDAR program compared to that required by the Cash Creek Permit For example the Cash
Creek Permit requires a first attempt at repair within 5 days for valves connectors pumps and
compressors but the BAAQMD has a specific repair time (not an attempted repair) Also the
BAAQMD program requires re-inspection within 24 hours of equipment repair or replacement
(Cash Creek permit requirement is 15 days for re-inspection) The BAAQMD rule bans liquid
leaks since they can cause high emissions (the Cash Creek permit only requires they be repaired)
it requires visual inspection every day (Cash Creek only weekly) it includes a 500 ppm leak
standard for Pressure Relief Devices pumps and compressors (with 15 day repair or 7 day
repair if an inspector finds the leak first) Cash Creek has a 2000 ppm standard for pump and
compressor leaks and apparently none for Pressure Relief Devices The BAAQMD rule has a
limit on mass emissions for major non-repairable leaks of 15 lbsday In addition the South
Coast Air Quality Management District LDAR standards monitoring and monitoring quality
control provisions similarly require more stringent controls than the Cash Creek permit80For
these reasons the BACT analysis failed to consider more effective LDAR programs even while
recognizing that the control effectiveness offered by LDAR programs depends on the
component monitored the leak detection threshold specified for the program the instrument
monitoring frequency for the program and the timeframe for repair requirements81
Second the cost-effectiveness analysis used to eliminate leakless components contains
several errors With regards to leakless components KDAQ concluded that
As shown in Table 4-4 none of the facilities surveyed used leakless technology Kentucky NewGas conducted a cost analysis showing that the control cost for all leakless components would exceed $20000 per ton of CO removed based on an uncontrolled CO emissions of 987 tonsyr with a component count of 13836 Comparison of Cash Creek Generation Station ( 4604 tonsyr and 19619 component count) with Kentucky NewGas shows that the cost per ton removed will be equal to or greater than $20000 per ton At a cost of $20000 per ton of CO removed this technology is considered infeasible 82
80 Exhibit 35 SCAQMD Rule 1173 Control of Volatile Organic Compound Leaks and Releases from Components at Petroleum Facilities and Chemical Plants 81 Exhibit 22 February 19th Fugitive Leak Letter at page 4 of 5 82 Exhibit 20 March 20 I 0 SOB at 31
29
These statements begin from the faulty premise that consideration of leakless components in the
BACT analysis consists only of a facility design employing entirely leakless components To the
contrary facilities in other contexts have considered and employed leakless andor certified low
leak components (Cash Creek omits the latter entirely from its BACT analysis) for a significant
portion of their total component count US EPA has required considerationuse of some leakless
andor certified low leak components in its consent decrees covering similar facilities 83 There is
no evidence that Cash Creek or KDAQ considered a control option consisting of less than all
leakless components
Using leakless andor certified low leak components for a targeted portion of the
components particularly for non-accessible or unsafedifficult-to-monitor components where
emissions may be significantly higher than at other components due to the lack oflimited control
from an LDAR program is completely ignored by Cash Creek and KDAQ Such an option
would address both the alleged safety concerns noted by Cash Creek as the components could be
required only at locations with lower risk Moreover such an option would significantly reduce
the cost of using leakless components assumed in the Kentucky NewGas application which
likewise was based solely on using allleakless components For these reasons the BACT
analysis is incomplete due to its exclusion of an available control option- use of targeted
leakless or certified low leak components
Additionally KDAQ and Cash Creek erred by failing to conduct an average cost-
effectiveness analysis before concluding that use of allleakless components is infeasible Cost
considerations in determining BACT are expressed in one of two ways average cost
effectiveness or incremental cost effectiveness Incremental cost effectiveness is an optional
consideration that must always be paired with average cost effectiveness84 The NSR Manual
warns that undue focus on incremental cost effectiveness can give an impression that the cost of
a control alternative is unreasonably high when in fact the total cost effectiveness in terms of
dollars per total ton removed is well within the normal range of acceptable BACT costs85
Incremental cost effectiveness is the difference in total annual costs between two contiguous
83 See Exhibit 32 INEOS CD Exhibit 33 Vertellus CD 84 Exhibit 23 NSR Manual at B41 (incremental cost effectiveness should be examined in combination with the total cost effectiveness in order to justify elimination of a control option) B43 (As a precaution differences in incremental cost among dominant alternatives cannot be used by itself to argue one dominant alternative is preferred to another) 85 d at B45 to B46
30
control options that are on the dominant control curve 86 The consideration of incremental cost
effectiveness is not to be used to reject an option merely because it costs more--even if it costs
twice as much-as the next dominant alternative87
Here Cash Creek and KDAQ rejected use of allleakless components as a control option
based solely on an estimate of incremental cost-effectiveness from the Kentucky NewGas
facility Beyond the fact neither Cash Creek nor KDAQ conducted any actual cost analysis for
Cash Creek DAQ failed to conduct a proper cost-effectiveness analysis because it failed to
calculate average cost effectiveness and instead relied wholly on incremental cost effectiveness
This incremental-cost-effectiveness-only approach is legally inadequate
VI THE NEW UNIT WILL BE A MAJOR SOURCE OF HAZARDOUS AIR POLLUTANTS
The Administrator must object because the Permit continues to lack appropriate case-by-
case MACT determinations for HAPs instead relying on an erroneous minor source
determination HAPs are regulated under Section 112 of the Clean Air Act 42 USC sect 7412
The purpose of the Clean Air Acts HAPs program is to force the stringent control of these
highly detrimental pollutants because they could cause or contribute to an increase in mortality
or an increase in serious irreversible[] or incapacitating reversible[] illness New Jersey v EPA
517 F3d 574577 (DC Cir 2008) (quoting legislative history of Section 112) Due to the
importance of controlling HAPs it is crucial that sources accurately identify HAP emissions If
as here a source feigns its way into the minor source category and thereby illegally circumvents
the requirement for stringent controls it defeats the purpose of the MACT program The above
sections on active flaring emissions and equipment leaks outline numerous ways in which the
Applicant and KDAQ underestimated HAP PTE The Administrator must object and require a
full reanalysis of whether the proposed facility will be a major source of HAPs
86d 87 d at B43
31
VII FAILURE TO ACCURATELY ESTIMATE SUFFICIENTLY CONTROL AND ADEQUATELY MODEL PM FROM MATERIAL HANDLING
The Administrator must object because the Applicant and KDAQ failed to ensure that the
proposed plant will not violate the PM10 and PM25 NAAQS due to a failure to estimate and
model the full material handling emissions allowed under the Permit 88 Among the applicable
requirements with which a Title V permit must ensure compliance are 42 USC sect 7475(a)(3)
401 5117 sec 8 401 KAR 52020 sec 1(3) (21) 401 KAR 53005 sec 1(3) and the NAAQS
Each of these provisions prohibits emissions that would cause andor contribute to a violation of
ambient air quality standards The Applicant and KDAQ conducted a preliminary analysis for
PMto and PM2s stopping short of the required full NAAQS and PSD increment modeling
However the Applicants PM 10 and PM25 impact analyses include numerous calculation and
modeling errors resulting in underestimated project emissions and thus ambient air quality
impacts The crux of the PM modeling errors is an overall failure to establish that the control
measures in the Permit will result in the level of control assumed in the emission calculations
whose results were then modeled for air quality impact purposes These errors are key with
respect to PM air quality impacts as material handling emissions can be the major contributor to
maximum PMto and PM25 impacts
Correcting the errors and omissions shows that a full NAAQS and PSD increment
modeling analysis should have been conducted for both PM 10 and PM25bull The Applicant and
KDAQ must go back and make the corrections gather the legally mandated preconstruction
monitoring data see 42 USC sect 7475(a)(7) and (e)(2) see also US v Louisiana-Pacific Corp
682 FSupp 1141 1146 (D Colo 1988) conduct full NAAQS and PSD increment modeling
and subject the revised modeling demonstration to public comment
a The Applicant and KDAQ relied on unreasonably high and unsupported control efficiencies for the paved and unpaved roads
As a general matter the permit record fails to link the assumed control efficiencies for
material handling operations (unpaved roads paved roads coal and slag piles) to the control
measures listed in the Permit Merely describing measures in narrative form does not support that
these measures together can achieve the specific control efficiency or efficiencies assumed for
88 KDAQ is required to ensure protection of the PM25 NAAQS independently from the PM10 NAAQS
32
purposes of calculating emissions and modeling air impacts KDAQ must list the control
efficiency associated with each measure and support the aggregate control efficiency as well
citing to sources for the control efficiencies It did not do so
Fugitive PM10 emissions from unpaved and paved roads as well as coal and slag piles
are underestimated significantly based on the unsupported assumption of 90 percent dust control
efficiency from various vague narrative mitigation measures 89 Petitioners in their comments
noted numerous shortcomings in the control efficiency assumptions and cited several sources on
dust emissions from unpaved roads paved roads and coal and slag piles that contradict the
assumed 90 percent control 90 Based on these sources Petitioners recalculated onsite unpaved
road dust fugitive PM10 emissions assuming 75 percent controls which is most likely an over-
estimation of achievable fugitive dust control on the Proposed Plants unpaved roads The
correction from 90 percent assumed control efficiency to a more realistic 75 percent control
increased the unpaved road dust fugitive PM10 emissions by a factor of 25 Petitioners also
recalculated onsite paved road dust fugitive PM10 emissions again using a more realistic 75
percent control with the same resulting factor of increase in paved road fugitive dust emissions
and coal and slag piles using a 60 percent control efficiency
In response to these comments KDAQ merely states (for example with respect to
unpaved roads) as follows
During arid time periods between qualifying rainfall events the average 90 percent control efficiency was determined using a combination of the following mitigating methods listed in Section B of the Permit Operating Limitations a( 1 ) a(4) and b 1 Wet suppression by source 2 Use of silt fences 3 Use of gravel and 4 Speed restrictions of 20 miles per hour91
89 Exhibit 36 Prevention of Significant Deterioration Title V Operating Permit amp Phase II Acid Rain Joint Application for Cash Creek Generating Station Henderson County KY December 2009 (December 2009 Application) at 5-28 90 Exhibit 3 January 14th Comments at 49-54 (citing Exhibit 37 US EPA Control of Open Fugitive Dust Sources EPA-4503-88-008 September 1988 Exhibit 38 Howard Hesketh and Frank Cross Fugitive Emissions and Controls Ann Arbor Science 1983 Exhibit 39 Excerpt from South Coast Air Quality Management District CEQA Air Quality Handbook April1993 Exhibit 40 Western Governors Association WRAP Fugitive Dust handbook November 15 2004 and Exhibit 41 US EPA Office of Air Quality Planning and Standards AP-42 Section 1321 Paved Roads_November 2006 (AP-42 for Paved Roads)) 91 Exhibit 12 RTC at B-20 to B-21 B-23 (paved road response regarding 90 percent control noting addition of chemical suppression as a mitigating control)
33
This response is wholly inadequate It does not cite any studies reports or analyses supporting
any individual or collective control efficiency from the listed measures Thus the worst-case
allowed emissions for unpaved roads paved roads and coal and slag piles are significantly
underestimated
In addition the Petitioners commented on the Applicants use of an inappropriate rainfall
correction factor for calculating 24-hour PM10 emission rates from unpaved roads paved roads
and storage piles The Applicant only calculated annual-average PM10 emissions and used an
emission reduction factor based on the number of days of rain per year This strategy is not
applicable to short-term emission rate calculations where rainfall during the averaging period
should not be considered For example it may not rain for many days in a row thus rainfall will
not be a mitigating factor when calculating 24-hour PM 10 emission rates during that dry period
In essence the Applicant inappropriately applied annual-average rainfall-reduced PM 10 emission
rate calculations to 24-hour PM 10 emissions The Applicant applied a correction factor of ((365-
125)365) to their 24-hour PM10 emissions where 125 is the number of days per year with
rainfall greater than or equal to 001 inch92 Removing this incorrect emission reduction to 24-
hour PM 10 emissions increases the calculated emission from all three sources by a significant
factor The Applicants use of this rainfall correction factor is contrary to the very document on
which it relied ie US EPAs AP-42 for Unpaved Roads AP-42 does not endorse the use of
this annual averaging equation for short term purposes and in fact says the opposite AP-42
says
The effect of routine watering to control emissions from unpaved roads is discussed below in Section 13223 Controls However all roads are subject to some natural mitigation because of rainfall and other precipitation The Equation 1 a and 1 b emission factors can be extrapolated to annual average uncontrolled conditions (but including natural mitigation) under the simplifying assumption that annual average emissions are inversely proportional to the number of days with measurable (more than 0254 mm [001 inch]) precipitation
Eext = E [(365- P)365]
Equation 2 provides an estimate that accounts for precipitation on an annual average basis for the purpose of inventorying emissions It should be noted that Equation 2 does not account for differences in the temporal distributions of the rain events the quantity of rain during any event or the potential for the rain to evaporate from the road surface
92 Exhibit 36 December 2009 Application at 5-26 to 5-28
34
It is emphasized that the simple assumption underlying Equation 2 and the more complex set ofassumptions underlying the use of the procedure which produces a finer temporal and spatial resolution have not been verified in any rigorous manner93
Thus the rainfall correction equation from AP-42 can only be used to provide a PM10 estimate
that accounts for precipitation on an annual average basis the equation cannot be used to
generate short-term averages of PM10 emissions much less to calculate an hourly or daily
maximum Here however Cash Creek did precisely that the PM10 emissions estimates for
unpaved roads paved roads and coal and slag piles include lbslhr and lbsday maxima that
inappropriately incorporates this AP-42 rainfall equation In sum Applicants daily and hourly
emission estimates must be recalculated without the use of any rainfall correction factor
b The Applicant and KDAQ relied on an unreasonably low and unsupported silt loading factor for paved roads
The PM emissions and modeling also are based on an unreasonably low and unsupported
silt loading factor that does not reflect conditions at the proposed facility Silt loading is a critical
assumption in estimating PM emissions from roads as the PM emissions vary directly with the
silt content Here the Applicant and KDAQ failed to link the specific facility roads and their
uses to the assumed silt loading factor As a result they failed to establish that the extremely low
04 gm2 assumed value reflects the worst-case silt conditions allowed under the Permit for
purposes of estimating PM emissions from paved roads and modeling the impact of these
emissions
The Applicant and KDAQ erred in the first instance by failing to obtain or even look for
site-specific silt data from similar sources AP-42 specifically states that the use of a tabulated
default value for silt loading results in only an order-of-magnitude estimate of the emission
factor for fugitive dust from truck traffic on paved roads and therefore highly recommends the
collection and use of site-specific silt loading data94 There is no evidence in the record that
either Cash Creek or KDAQ attempted to ascertain silt loading data from a similar existing
source Instead they relied on theoretical and unsupported statements about uses and conclude
without citing any evidence that these factors will help maintain the silt loading at low levels95
93 Exhibit 42 AP-42 Chapter 1322 Unpaved Roads at 1322-6 and 1322-7 (emphasis added) 94 Exhibit 41 AP-42 for Paved Roads at 1321-6 95 Exhibit 12 RTC at B-22
35
This approach is insufficient As US EPA states [a]ll emissions estimates must be from
similar sources equipped with similar control equipment and operating at similar processcontrol
equipment parameter rates96 There is no evidence in the record that the statements regarding
road usage equate to 04 gm2 based on other similar sources
Where a source cannot obtain site-specific data (assuming for arguments sake that Cash
Creek or KDAQ had made any effort to do so but had failed) AP-42 recommends the selection
of an appropriate mean value from a table listing silt loadings that were experimentally
determined for a variety of industrial roads The Applicant and KDAQ erred in several ways in
selecting a value from the AP-42 industrial paved road table as set forth below
The AP-42 values represent average values In permitting a source is required to estimate
the maximum Potential to Emit from the specific source and to model worst case emissions to
ensure protection of the NAAQS Given these requirements the use of average values for
material handling purposes here is inappropriate US EPA has voiced this caution with regards
to applicability stating that AP-42 emissions factors represent an average range of emissions
rates for a source category and are not precise enough for regulatory applicability
determination97 The Applicant and KDAQ did not adjust for this factor US EPA also cautions
that use of the table values for silt instead of site-specific values decreases the quality rating of
the paved road equation by 2 levels98 The Applicant and KDAQ failed entirely to account for
the reduction in quality rating of the equation due to use of the non-facility specific values
US EPA furthermore recommends using the maximum of the range of reported values
in this context99 Rather than heed this guidance KDAQ selected a silt value 04 gm2 that is at
the very low end of the reported range for the industry chosen from the industrial paved road silt
table (009 to 79 gm2) Nowhere does KDAQ explain why the worst-case silt conditions at the
proposed facility are more consistent with the low end of this range than with the average or the
high end The industrial roadway table provides a range of mean silt loading values from 74 to
292 gm2 100 At the very least given the requirement to estimate PTE and model worst case
Exhibit 43 US EPA Appendix D Preliminary Emissions Factors Program Improvement Option Paper 4 Providing Guidance Regarding the Use of Emissions Factors for Purposes Other than Emissions Inventories (EPA EF Option Paper 4) 97 d at 4-3 Table 41 98 Exhibit 41 AP-42 Paved Roads at 1321-6 99 See Exhibit 43 EPA EF Option Paper 4 at 4-11 Table 4-4 Future Uses of Emissions Factors 100 Exhibit 41 AP-42 Paved Roads at Table 1321-4
36
emissions the Applicant and KDAQ should have chosen a value representing the mean for the
industry chosen or 74 silt (increasing the PM emissions by almost seven times)
In selecting the allegedly-similar industry and value within that industrys reported range
the Applicant and KDAQ also failed to explain why the iron and steel industry is the most
analogous industry for the paved roads at the Cash Creek facility The Cash Creek facility will
handle significant amounts of coal This handling of a dry substance has the potential to impact
the silt values on the paved roads even where the paved roads themselves are limited to transport
of gasifier slag due to carryover from other operations (such as by wind) The choice of a very
low value from the iron and steel industry does not account for this additional factor impacting
silt at the Cash Creek facility
Finally the permit fails to contain terms and conditions that limit the silt on the paved
roads on a continuous basis to the 04 gm2 assumed in the calculations KDAQ is only requiring
weekly visual inspections of the paved roads which will do nothing to ensure that Cash Creek is
keeping the facilitys paved road silt loading to such a low number
c Remodeled PM Emissions Exceed the Significant Impact Levels Used by KDAQ to Avoid a Full Cumulative PM Air Impact Assessment
Petitioners remodeled the PM10 and PM25 impacts based on the corrections to material
handling estimates noted above and described in their comments 101 This modeling shows
exceedances of the PM significant impacts levels (SILs) used by KDAQ as a screening
threshold As such KDAQ and the Applicant should be required to go back and remodel the PM
impacts using correct emission estimates reflecting worst-case allowable emissions under the
Permits terms and conditions collect the required onsite preconstruction monitoring data and
include all required sources in full NAAQS and PSD increment ambient air quality analyses
101 Exhibit 3 January 14th Comments at 49-62 Exhibit 44 modeling file titled met Exhibit 45 modeling file title pm10 and Exhibit 46 modeling file titled pm25
37
d The Permit contains unenforceably vague terms and conditions for material handling that do not equate to the control efficiencies assumed in the emission estimates and modeling
The material handling measures listed in the Permit are unenforceably vague and
therefore do not constitute proper limitations on potential to emit from material handling sources
sufficient to assume an exceedingly high assumed percent control As put forth above to be
enforceable a permit must create mandatory obligations that provide a clear explanation of how
the actual limitation or requirement applies to the facility and make it possible for KDAQ US
EPA and citizens to determine whether the facility is complying with the condition US EPA
has made clear that vague andor ambiguous permit language is not enforceable
Many Title V permits contain ambiguous phrases such as if necessary For
example If necessary the permittee shall maintain monthly records The phrase if
necessary should be removed altogether the permit should specify exactly what is
necessary In this example the permit should either precisely explain the situation that
would necessitate monthly records or simply require monthly records at all times
Ambiguous language hampers the source in its duty to independently assure compliance 10 and leaves 1ega1reqmrements open to mterpretatton 2
Particular sources of vagueness in the present Permit include failures to
specify the frequency with which wet suppression must be applied specify the atmospheric and operational conditions under which wet suppression must be applied specify how to determine when to use chemical suppression alone wet suppression alone or chemical suppression in combination with wet suppression describe in enforceable terms how to determine when a measure is applicable describe in enforceable terms how a chemical is deemed suitable describe in enforceable terms what other surfaces are encompassed by that term describe in enforceable terms how to determine whether to apply water sprays or other measures describe in enforceable terms what other measures must be used to suppress dust emissions during handling and describe in enforceable terms what constitutes a clean condition and prompt removal 103
102 Exhibit 47 Letter from Bharat Mathur EPA Region 5 to Robert F Hodanbosi Ohio EPA November 21 2001 103 See Exhibit I Permit at 75-76 (listing operation limitations for paved and unpaved roads as well as coal and slap storage piles)
38
The Permit terms and conditions as written are not enforceable nor do they ensure the
exceptionally high control efficiencies assumed in the PM modeling For these reasons the
Administrator must object
VIII THE OZONE ANALYSIS FAILS TO DEMONSTRATE THAT THE PROPOSED FACILITY WILL NOT CAUSE OR CONTRIBUTE TO VIOLATIONS OF THE OZONE NAAQS
The Administrator must object because the Applicant and KDAQ have failed to show
that the proposed source will not cause or contribute to violations of ozone air quality standards
Even under KDAQs incomplete assessment of emissions the proposed Cash Creek facility will
emit large amounts of NOx (179 tpy) and VOC (29 tpy) These ozone precursors react under
sunlight to form ozone a harmful pollutant that attacks the respiratory system The inappropriate
qualitative assessment of ozone impacts relied on by KDAQ is insufficient to ensure protection
of the ozone NAAQS Based on regulatory requirements and due to serious concerns about
ozone levels in nearby areas the Applicant must conduct individual source modeling of ozone
impacts It must then submit these analyses to KDAQ for the agencys and the publics
assessment
a The Applicant Failed to Conduct and KDAQ Failed to Require Actual Ozone Modeling
The ozone analysis is insufficient because it relies on a dated unapproved non-site-
specific qualitative method instead of the required source-specific modeling In order to assess
impacts to air quality the Clean Air Act requires applicants and agencies to use modeling See 42
USC 7475(e)(3)(D) (requiring the Administrator to promulgate regulations specifying each air
quality model or models to be used for purposes (emphasis added) of the PSD program
specifically the ambient air quality demonstration) 104 Kentucky regulations echo this
requirement 401 KAR 51 017 Section 10 (Air Quality Models ( 1) Estimates of ambient
concentrations shall be based on the applicable air quality models data bases and other
104 See also Exhibit 23 NSR Manual at C24 (Dispersion models are the primary tools used in the air quality analysis These models estimate the ambient concentrations that will result from the PSD applicants proposed emissions in combination with emissions from existing sources The estimated total concentrations are used to demonstrate compliance with any applicable NAAQS or PSD increments The applicant should consult with the permitting agency to determine the particular requirements for the modeling analysis to assure acceptability of any air quality modeling technique(s) used to perform the air quality analysis contained in the PSD application)
39
requirements specified in 40 CFR Part 51 Appendix W Guideline on Air Quality Models
(2003) Appendix A) Modeling must be conducted for each pollutant that the proposed source
would emit in significant amounts 401 KAR 51017 Section ll(l)(a)l US EPA regulations
describe the importance and baseline requirements of modeling as follows
the impacts of new sources that do not yet exist can only be determined through modeling
In all cases the model applied to a given situation should be the one that provides the most accurate representation of atmospheric transport dispersion and chemical transformations in the area of interest
to ensure consistency deviations from this guide should be carefully documented and fully supported and consistency is not [to be] promoted at the expense of model and data base accuracy
40 CPR Part 51 Appendix W Subsections lb to le States and applicants are not to undertake
their own independent adjustments of modeling approaches but must seek federal approval of
deviations from federal regulatory guidelines 42 USC sect 7475(e)(3)(D) 105 In sum modeling
(a) is imperative for new sources (b) must be accurate up-to-date and site-specific to the
greatest degree possible and (c) must fully justify any deviations from the federal guidance and
receive federal approval of any alternative modeling approach
Neither the Applicant nor KDAQ conducted any source-specific individual source
modeling to demonstrate compliance with ozone ambient air quality standards 106 The Applicant
cites Subsection 521c entitled Estimating the Impact of Individual Sources as support for its
105 Any model or models designated under such regulations may be adjusted upon a determination after notice and opportunity for public hearing by the Administrator that such adjustment is necessary to take into account unique terrain or meteorological characteristics of an area potentially affected by emissions from a source applying for a permit required under this part See also 401 KAR 51017 Section 10 (2) If an air quality model specified in 40 CFR Part 51 Appendix W is inappropriate the model may be modified or another model substituted (a) The use of a modified or substitute model shall be
1 Subject to notice and opportunity for public comment under 401 KAR 52 100 and 2 Made on a case-by-case basis and receive written approval from the US EPA (emphasis added) Appendix
W at 322 (giving Regional Offices responsibility for determining the acceptability of alternative models and proscribing specific criteria for approval by the Regional Administrator) 106 Exhibit 48 December 2009 SOB at 46 (The ozone air quality ambient impact analysis is qualitative in nature Estimates of increases in ozone formation were determined by scaling NOX emissions from the facility using data from modeling sensitivity studies conducted by Georgia Environmental Protection Department (EPD) in support of their 8-hr ozone SIP development) and Exhibit 49 December 2009 Application Appendix A at A4 (CCGS has performed a qualitative analysis of ozone impacts from the CCGS based upon actual regional ozone modeling performed by Georgia EPD)
40
use of a qualitative analysis using unmodified 3-year-old regional modeling from another state
Choice ofmethods used to assess the impact ofan individual source depends on the nature ofthe source and its emissions Thus model users should consult with the Regional Office to determine the most suitable approach on a case-by-case basis (subsection 322) 107
This citation is misleading and does not provide support for the approach taken by the Applicant
and KDAQ Nowhere does Subsection 521c exempt a source from the requirement to conduct
modeling for ozone instead the quoted passage must be read in context to mean that a case-by-
case approach should be taken for individual source modeling methods for ozone impacts
following the process outlined in Subsection 322 See Appendix W at 521 (entitled Models
for Ozone and citing Section 322) A qualitative adaptation of modeling done years ago by
another state for different purposes is not alternative modeling for an individual source
Nor is there any evidence in the record that the Applicant and KDAQ received the
required regional approval for their approach As noted above such approval would include a
case-by-case analysis of the appropriateness of the approach following a process proscribed by
US EPA regulations See Appendix W at Subsection 322 108 The only mention of Region IV
approval in the record is a reference in Appendix A to a letter to the Georgia EPD dated
December 2000109 which states
Although ozone impact modeling is not normally required for single sources information on the current ozone levels in the area should be cited to provide qualitative assurance that the increased [emissions] from facility operation will not cause or contribute to violations of the ozone national ambient air quality standards
Reliance on this statement is inappropriate First the regulations require Regional approval on a
case-by-case basis It is therefore improper to rely on a determination for another facility in
107 Exhibit 49 December 2009 Application Appendix A at A2 108 Notably the lack of an approved model does not mean that the applicants preferred modeling approach gets the green light Rather an alternative model may be used only if i The model has received a scientific peer review ii The model can be demonstrated to be applicable to the problem on a theoretical basis iii The data bases which are necessary to perform the analysis are available and adequate iv Appropriate performance evaluations of the model have shown that the model is not biased toward underestimates and v A protocol on methods and procedures to be followed has been established Appendix W Subsection 322(e) The record does not demonstrate that these criteria have been met 109 Exhibit 49 December 2009 Application Appendix A at A2 to A3 (citing Letter dated December 13 2000 from US EPA Region IV to Mr Ron Methier Georgia EPD) Exhibit 48 December 2009 SOB at 46 (making no mention of regional approval)
41
another state that occurred many years ago Second the statement is nine years old and hence as
taken up below is extremely dated with respect to modeling capabilities
KDAQ responded to this comment with the following
The Division does not concur Actual ozone modeling is not required or technically feasible In the absence ofa regulatory model for near field ozone impacts the Division deemed the analytical procedure conducted by the applicant applicable for demonstration purposes in accordance with 40 CFR Part 51 Appendix W at Subsection 322 As stated in section 521 ofAppendix W the choice ofmethod to assess the impact ofan individual source depends on the nature of the source and its emissions In addition 40 CFR 5 I Appendix Sat subsection III C states that the determination as to whether a source would cause or contribute to a violation ofa NAAQS should be made as of the new sources start-up date Further the Division does not agree that reliance on the statement as referenced in December 2009 SOB at 46 is not applicable in the absence of the promulgation ofa regulatory model for single source ozone impacts 110
This statement does not sufficiently address Petitioners comments so as to justify the ozone
modeling failures First it affirms that KDAQ did not follow the correct procedure for receiving
federal agency approval Second KDAQ ignores that the method chosen by the applicant must
be an individual source modeling method per the regulations Third it omits any support for its
claim that actual ozone modeling is technically feasible relying only on the assertion that
modeling is not required because there is no regulatory model for near field ozone impacts As
discussed below actual ozone modeling is technically feasible Fourth the statement implicitly
claims that the choice of the qualitative method was appropriate based on the nature of the source
and the sources emissions but provides no actual supporting information demonstrating how the
approach is appropriate 111 As set forth below several factors weigh against using the Georgia-
qualitative adaptation method
b The Qualitative Ozone Analysis Is Inadequate to Demonstrate Protection of the Ozone NAAQS
Moreover even if the qualitative approach could be termed modeling it is not suitable as
it does not provide[ ] the most accurate representation of atmospheric transport dispersion and
110 Exhibit 12 RTC at B-106 111 Nor does the Statement of Basis see Exhibit 20 March 2010 SOB at 47
42
chemical transformations in the area of interest Appendix W Subsection 1e The Applicant and
KDAQ made little to no effort to demonstrate that ozone modeling for Georgia is appropriate for
Kentucky based on similarities in atmospheric transport dispersion and chemical
transformations in the region surrounding the Proposed Plant As US EPA has noted the
diversity of the nations topography and climate and variations in source configurations and
operating characteristics counsel against using the same recipe for modeling impacts from a
source in one area as that used in another See Appendix W Subsection lc Here significant
differences exist between Kentucky and Georgia (both in terms of the topographyclimate and
source characteristics) that render the Georgia data inappropriate for use in this case
The qualitative impact analysis submitted by Cash Creek is inappropriate or at best
inadequate since it is based on the Georgia ozone modeling results that are
1 Not valid in Kentucky due to large differences in emissions of ozone precursors (NOx and VOC) terrain land use wind and other atmospheric conditions that affect ozone formation Precursor emissions are different in terms of both source types and quantity Recent VISTAS inventories show that NOx and VOC emissions from onroad mobile sources in Georgia are much larger (twice for NOx and more than 180 for VOC) than those in Kentucky 112 Kentucky has about 33 more NOx emissions from utility than Georgia 113
2 Based on reductions in non-power plant anthropogenic emissions (eg urban vehicular emissions) rendering the results not applicable to an elevated point source such as Cash Creek
3 Based on reductions in NOx reductions at existing power plants again rendering the results inapplicable to a new power plant such as Cash Creek
4 Focused on ozone impacts in large cities such as Atlanta while the Cash Creek facility will impact mostly rural areas
KDAQ responded to these comments by stating as follows
The Division does not concur In the absence ofa regulatory model for single source ozone impacts the Division deemed the analytical procedure conducted by the applicant applicable for demonstration purposes in accordance with Appendix W at Subsection 322 Further the qualitative procedure is conservative due to the urban areas modeled and the higher ratio ofcumulative NOx to VOC emitted in Kentucky in comparison to Georgia (12 vs 29) as determined by comparison of U S EPA emissions data found at the following websites
112 See Exhibit 50 Maureen Mullen 2003 VISTAS 2002 Draft Onroad Mobile Inventory 113 See Exhibit 51 Edward Sabo 2003 2002 Southeast Emissions Inventory Development
43
httpwwwepagovairemissionsnoxhtm httpwwwepagovairemissionsvochtm ftpftp epagovEmislnventory2002finalneilbiogenic_sector _data
Again the agencys response is inadequate KDAQ continues to rely on a conclusory and
unsupported statement that the agency made its determination in accordance with Subsection
322 KDAQ also fails to address Petitioners comments about differences in terrain land use
atmospheric conditions and relative source contribution and does not compare the significance
of these impacts to the significance of the cited conservative factors Finally the conclusion
drawn by KDAQ about deriving the relative ozone impact from the NOx to VOC ratio has been
discredited 114 The ratio could just as well go in the opposite direction and the only way to
know for sure is to run the actual models For these reasons KDAQ has not demonstrated that
the qualitative approach provides the most accurate representation of atmospheric transport
dispersion and chemical transformations in the area of interest
In addition ozone precursors emitted by proposed power plants in Kentucky have been
shown to cause significantly large ozone increases In a December 2001 modeling study by
Kentucky Natural Resources and Environmental Protection Cabinet the photochemical model
CMAQ was used by the US EPA to show that new power plants in Kentucky can generate 8-
hour ozone increases up to 11 ppb 115 These large ozone increases were found to occur in the
western part of the state close to where new power plants are proposed 116 This cumulative
study also shows that Henderson County has the second largest daily total of NOx emissions
(1486 tpd) from new power plants
Furthermore ozone monitoring data in Henderson County have exceeded the 2008
AAQS of0075 ppm Ozone measurements from the US EPA AirData website show that the 4th
maxima are 0074 ppm for 2008 0083 pphm for 2007 0074 ppm for 2006 and 0077 ppm for
2005 117 Thus the 3-year averages of these 4th 8-hour maxima 0077 ppm for 2008-2006 and
0078 ppm for 2007-2005 These 3-year averages are higher than the average of 0076 ppm
reported in the November 2009 Cash Creak ozone analysis As a result of high ozone
114 Exhibit 52 Letter from Richard D Scheffe Senior Science Advisor US EPA OAQPS to Abigail Dillen July 28 2006 (stamped August 3 2006) 115 See Exhibit 53 Kentucky NREPC A Cumulative Assessment of the Environmental impacts Caused by Kentucky Electric Generating Units 2001 116 d at 31 117 Data is available at httpwwwepagovairdatamonsumhtmlst-KY-Kcntucky
44
measurements Henderson County has been proposed in March 2009 by KDAQ as in non-
attainment with the 2008 AAQS of 0075 ppm 118 Thus Henderson County has an ozone
problem that will get worse since Cash Creek and other planned facilities will increase ozone
concentrations Moreover US EPA has recently proposed to lower the 2008 8-hour ozone
standard of 0075 ppm to between 006 and 007 ppm
KDAQ responded to this comment by citing the stay of the 0075 ppm ozone NAAQS
and concluding that Henderson County cannot be considered non-attainment for ozone KDAQ
misses a significant point of Petitioners comment to highlight the ozone problem in Henderson
County as it informs the need for more stringent and individualized quantitative analysis of
ozone impacts KDAQ once more fails to show that its approved approach ensures protection of
the ozone NAAQS
Moreover since issuance of the Georgia letter in 2000 significant advances have been
made in the available modeling processes for ozone impacts from individual sources
Photochemical Models such as CMAQ are available and appropriate for such analyses in that (a)
they have been peer reviewed (b) they are applicable to individual source ozone modeling on a
theoretical basis (c) the necessary databases are available and adequate (d) performance
evaluations show they are not biased toward underestimates and (e) a protocol on methods and
procedures to be followed has been established Appendix W Subsection 322(e) With readily
available modeling databases such as the KY NREPC cumulative study and more recent
modeling studies (eg the Kentucky ozone SIP and VISTAS regional modeling) it is fairly fast
and inexpensive to perform such modeling analyses Further in recent years several
enhancements such as the use of fine grid resolution ( 4 km or less) and plume-in-grid treatment
have made photochemical models like CAMx and CMAQ more suitable for predicting ozone
impacts from large NOx plumes from power plants These models have recently been applied to
large point sources such as power plants in Kansas Missouri Oklahoma and Texas as
summarized in a presentation by US EPA staff 119 Recently AMI Environmental has utilized
the CAMx model with a 2-km grid to assess the ozone impacts of the proposed White Stallion on
118 See Exhibit 54 Letter from LK Peters Secretary of Kentucky Energy and Environment Cabinet to AS Meiburg Acting Regional Administrator EPA Region 4 March 12 2009 119 Exhibit 55 Snyder Erik and Bret Anderson 2005 Single Source OzonePM25 in Regional Scale Modeling and Alternate Methods
45
ozone air quality in Houston 120 An individual source analysis using these models would provide
a significantly more accurate estimation of ozone impacts in the project area than does the
qualitative analysis based on dated and out-of-state information Single source modeling is
especially important given the ozone problems in Henderson County and the ozone NAAQS
revision described above
KDAQ responded to these comments with the following statements
The Division does not concur In the absence ofa regulatory model for single source ozone impacts the Division deemed the analytical procedure conducted by the applicant applicable for demonstration purposes in accordance with Appendix W at Subsection 322 Furthermore without the existence of regional ozone inventories for use in a regulatory single source model for ozone an ozone NAAQS modeling analysis for PSD purposes is inappropriate and technically infeasible
KDAQs statement about the absence of a regulatory model does not address Petitioners
comments about the feasibility of conducting ozone modeling The examples cited by Petitioners
show that such modeling is feasible In addition Petitioners cited several sources of inventory
information that KDAQ can use for the required ozone modeling For these reasons the
Applicant and KDAQ have not ensured protection of the ozone NAAQS
IX CONCLUSION
For the above reasons the Permit fails to comply with all applicable requirements and
the Administrator must object Petitioners have demonstrated that the Permit was issued
pursuant to numerous procedural and substantive errors The Administrator must direct KDAQ
to correct its errors by revising or revoking the Permit To this end the Administrator should
include in her order specific terms and conditions necessary to remedy the inadequacies
described in this petition See 40 CPR sect 708(c)(2) (Any EPA objection under paragraph
(c)(l) of this section shall include a description of the terms and conditions that the permit
must include to respond to the objections (emphasis added))
120 See Exhibit 56 Khanh Tran Photochemical Modeling ofOzone Impacts of the Proposed White Stallion Energy Center Report prepared for Environmental Integrity Project Austin Texas October 2009
46
DATED June 18 2010
Respectfully submitted
Meleah A Geertsma Faith E Bugel ENVIRONMENTAL LAW amp POLICY CENTER
35 East Wacker Drive Suite 1300 Chicago Illinois 6060 I 312-673-6500 Fax 312-795-3730
On behalf of URSULINE SISTERS OF MOUNT SAINT JOSEPH SIERRA CLUB VALLEY WATCH
47
BEFORE THE ADMINISTRATOR UNITED STATES ENVIRONMENTAL PROTECTION AGENCY
In the Matter of the Final Operating Permit for
CASH CREEK GENERATION LLC to operate the proposed source located at Permit No V-09-006 Kentucky State Highway 1078 Henderson Source ID No 21-101-00134 County Kentucky
Proposed by the Commonwealth of Kentucky Environmental and Public Protection Cabinet
CERTIFICATE OF SERVICE
I make this statement under oath and based on personal knowledge On this day June 18th 2010 I caused to be served upon the following persons a copy of ELPCs Petition to the United States Environmental Protection Agency in the matter of the Final Revised Title V Operating Permit for the proposed Cash Creek Generation Station located at Kentucky State Highway 1078 Henderson County Kentucky via electronic mail and US Post
Lisa Jackson US EPA Administrator Ariel Rios Building 1200 Pennsylvania Ave NW Washington DC 20460
Art Hofmeister US EPA Region 4 Sam Nunn Atlanta Federal Center 61 Forsyth Street SW Atlanta GA 30303-8960
John Lyons Director James Morse Permit Review Department for Environmental Protection Division of Air Quality 200 Fair Oaks Lane First Floor Frankfort KY 40601
Signed and sworn before me This 18th day ofJune 2010
W Blaine Early III Laura D Keller Anne Gorham Stites amp Harbison PLLC 250 West Main Street Suite 2300 Lexington KY 40507-1758 (859) 226-2300
Michael Mcinnis The ERORA Group LLC 4350 Brownsboro Road Suite 110 Louisville KY 40207 (502) 357-9901
Mele Geertsma Environmental Law amp Policy Center
KAY TAMILLOW OFFICIAL SEAL
Notary Public State of Illinois My Commission Explres
November 09 2013
43
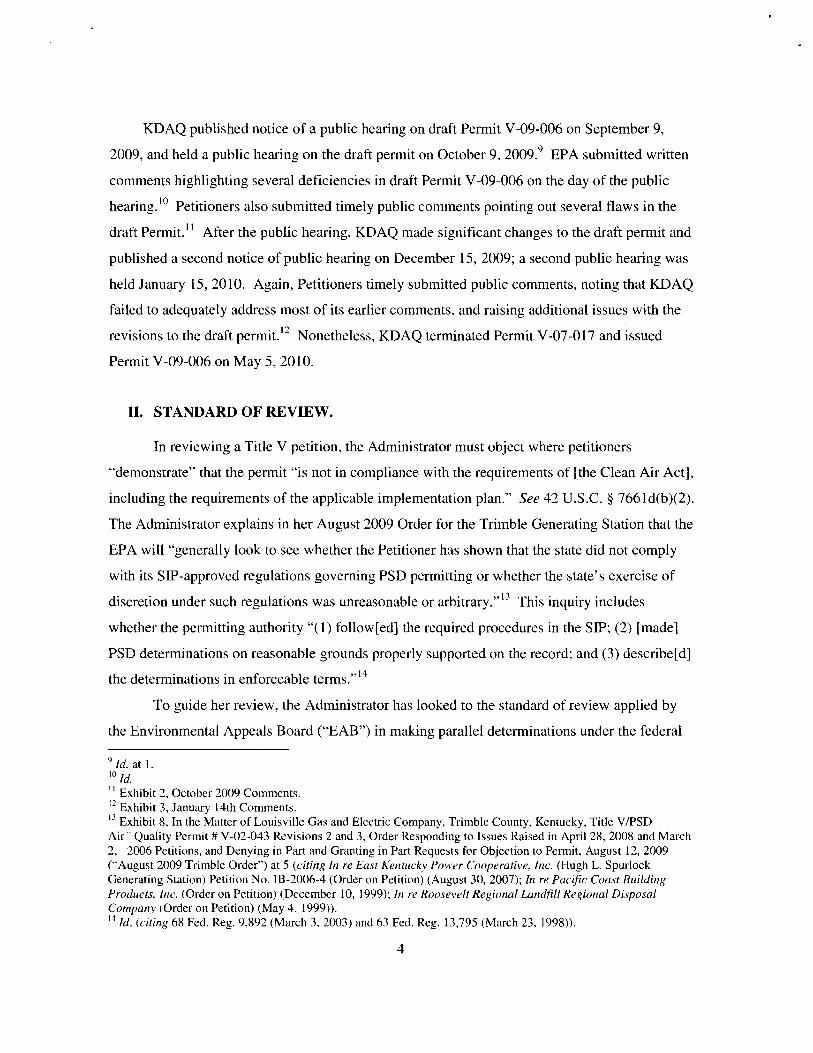
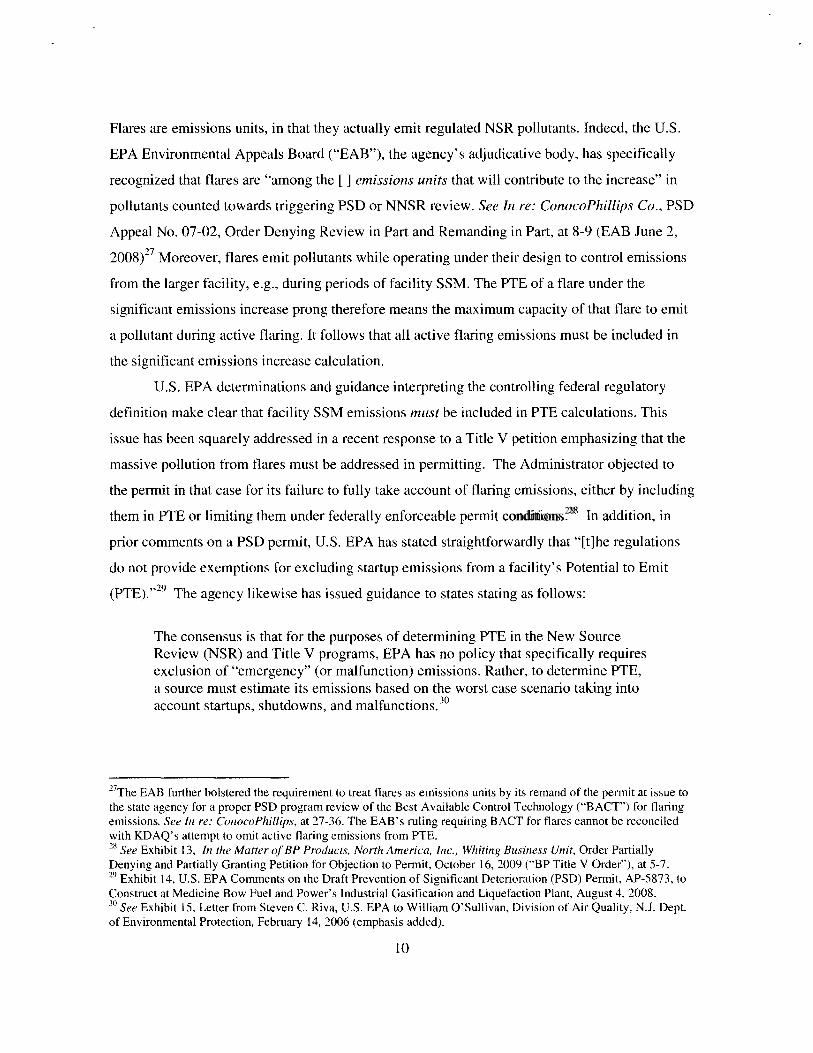
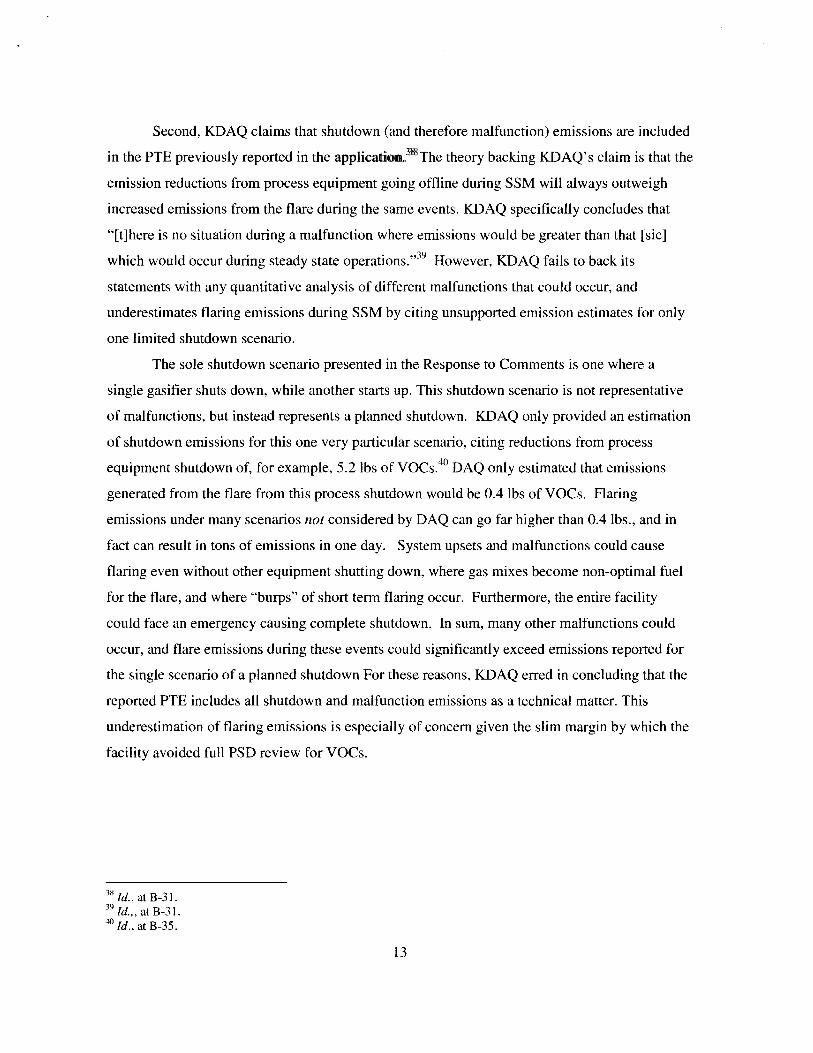