petroleum fuels winter outlook
TRANSCRIPT

Petroleum Fuels Winter Outlook2018-2019 New York State Winter Fuels Outlook Meeting
October 31, 2018Matthew MilfordNYSERDA

2
Contents
• NOAA Weather Forecast
• Winter Fuels Outlook for 2018-19 Winter Season
• Crude Oil
• Home Heating Oil and Distillate Fuels
• Propane

3
NOAA Weather Forecast

4
• Greater than 33% chance of above normal temperatures for Western and Downstate NY. Greater than 40% chance of above normal temperatures for Northern and Eastern NY.
• NOAA U.S. Winter Outlook Temperature Probability for Dec. –Jan. –Feb. released Oct. 18

5
• Equal chances of drier than normal, normal, or wetter than normal precipitation for all of NYS for the upcoming winter season.
• NOAA U.S. Winter Precipitation Outlook Probability for Dec. –Jan. –Feb. released Oct. 18

6
NOAA Winter Weather Outlook 2018-2019November 2018 November-January 2018-19

7
NOAA Winter Weather Outlook 2018-2019NOAA Outlook New York heating degree-days forecast (October – April):
• 1.1% warmer than normal (1981-2010) winter
• 1.7% warmer than last season.
New York HDD Forecast (10/18/18)
Month Forecast HDD
Normal (1981-2010)
Forecast Departure %
Last Year
(2017-2018)
Forecast Departure %
Oct 418 397 21 5% 235 183 78%
Nov 667 679 -12 -2% 716 -49 -7%Dec 1006 1038 -32 -3% 1129 -123 -11%Jan 1181 1207 -26 -2% 1236 -55 -4%Feb 1007 1021 -14 -1% 854 153 18%Mar 888 892 -4 0% 911 -23 -3%Apr 518 516 2 0% 702 -184 -26%
Total 5685 5750 -65 -1% 5783 -98 -2%

8
NOAA Winter Weather Outlook 2018-2019NOAA Outlook New York heating degree-days forecast:
• 1.1% warmer than normal (1981-2010) winter
• 1.7% warmer than last season.
Source: NOAA National Climate Data Center

9
New York State Heating Degree-Days• For the week ending
October 27, NYS cumulative HDD’s since October 1 total 348 HDD and are 12 HDD or 3.6% above the normal level and 155 HDD’s or 80.3% above last year’s level.
• The 348 HDD’s represent about 6.1% of the total normal heating season.

10
Winter Fuels Outlook for 2018-19 Winter Season

11
Winter Fuels Outlook for 2018-19• EIA expects higher heating fuel prices this winter for heating oil and
electricity in the Northeast. EIA expects propane prices to be about the same and natural gas prices to decrease slightly compared to last year.
• Based on the HDD forecast by NOAA, NYSERDA is projecting fewer heating degree-days than last year (1.7%) (Oct. – Apr.).
• Based on EIA and NOAA data, NYSERDA projects higher average household heating fuel expenditures in New York for heating oil and electricity, and lower average household heating fuel expenditures for propane and natural gas compared to last year.

12
Fuel Expenditure Variance ExampleColder or warmer (+/- 10% HDD) than forecast winters can swing expected fuel expenditures by as much as 16% or as little as 5% depending on the fuel

13
New York State Fuel Price ForecastFuel prices are forecast to be:
• Higher for heating oil
• The same for propane
• Lower for natural gas.
Source: EIA/NYSERDA
14
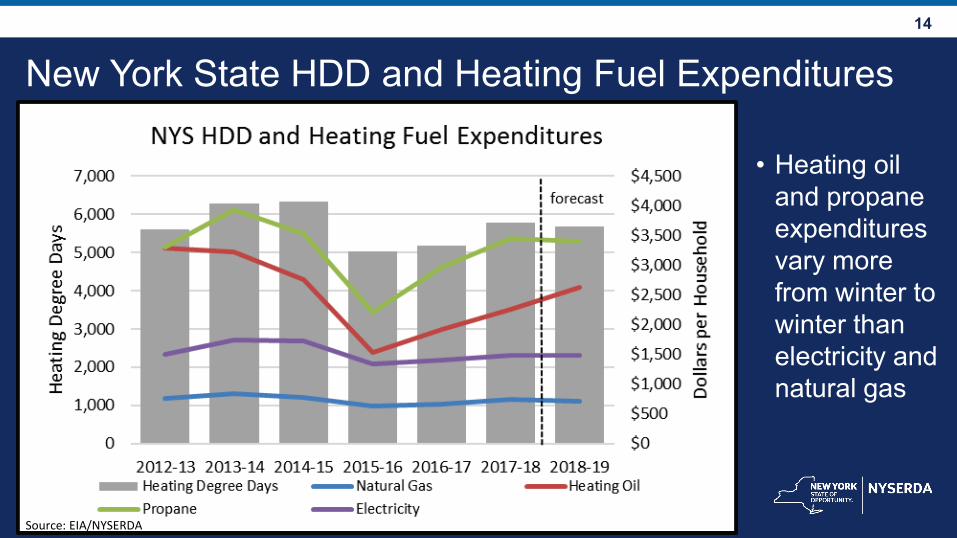
New York State HDD and Heating Fuel Expenditures
• Heating oil and propane expenditures vary more from winter to winter than electricity and natural gas
Source: EIA/NYSERDA

15
2017 New York Percentages:
59.4% Natural Gas20.5% Heating Oil
4.0% Propane11.9% Electricity
1.7% Wood2.5% Other
Source: American Community Survey

16
New York State Household Heating FuelNew York State Household Heating Fuel 2017 % 2010 % Change % Change
Total Occupied Housing Units 7,304,332 100% 7,196,427 100% 107,905 1%
Natural Gas 4,339,349 59% 3,961,085 55% 378,264 10%
Bottled Tank or LP Gas 294,973 4% 227,607 3% 67,366 30%
Electricity 867,925 12% 676,262 9% 191,663 28%
Fuel oil or Kerosene 1,496,843 20% 2,068,004 29% -571,161 -28%
Coal or Coke 17,881 0% 19,949 0% -2,068 -10%
Wood 122,088 2% 143,242 2% -21,154 -15%
Solar Energy 5,988 0% 1,823 0% 4,165 228%
Other 77,386 1% 61,664 1% 15,722 25%
No Fuel Used 81,899 1% 36,791 1% 45,108 123%
Source: American Community Survey
• Natural Gas up 378k homes (+10%) over 7 years
• Heating Oil down 571k homes (-28%) over 7 years
Source: American Community Survey

17
New York State Household Heating FuelYear Fuel Oil or Kerosene
Households% of NYS
Households1980 3,290,683 51.9%1990 2,629,172 39.6%2000 2,336,714 33.1%2005 2,429,348 34.1%2006 2,373,350 33.5%2007 2,347,031 33.1%2008 2,281,188 32.0%2009 2,165,896 30.1%2010 2,068,004 28.7%2011 1,979,067 27.5%2012 1,901,118 26.3%2013 1,802,442 25.0%2014 1,752,656 24.1%2015 1,649,860 22.8%2016 1,540,787 21.4%2017 1,496,843 20.5%
Source: American Community Survey

18
New York State Winter Fuels Outlook, October 2018New York Winter Heating Oil and Propane Fuel Summary
Household Actual Forecast
Heating Oil Avg. 13-17 17-18 18-19 % Change
Consumption (gals) 714 697 687 -1.4Avg. Price ($/gal) 3.28 3.24 3.82 17.8Expenditures ($) 2,342 2,259 2,624 16.2
Propane
Consumption (gals) 1,074 1,049 1,032 -1.6Avg. Price ($/gal) 3.00 3.30 3.30 0.0Expenditures ($) 3,219 3,455 3,400 -1.6
Note: Individual household volumes, and so, expenditures will vary.
Note: Heating Oil data reflect New York prices and adjusted consumption to New York Averages.
Note: Propane data reflect New York prices and adjusted consumption to Btu equivalent heating oil.
Forecasts reflect updated NOAA projections.
Source: EIA Short-Term Energy Outlook, October 2018, NOAA, NYSERDA

19
New York State Winter Fuels Outlook, October 2019New York Winter Natural Gas & Electric Fuel Summary
Note: Individual household volumes, and so, expenditures will vary.
Note: Natural Gas consumption is adjusted to New York Averages while Electricity consumption is based on Northeast Averages.
Note: Prices reflect New Yorkaverage prices.
Forecasts reflect updated NOAA projections.
Source: EIA Short-Term Energy Outlook, October 2018, NOAA, NYSERDA
Household Actual Forecast
Natural Gas Avg. 13-17 17-18 18-19 % Change
Consumption (mcf) 67.0 66.2 64.8 -2.0Avg. Price ($/mcf) 10.96 11.29 10.91 -3.4Expenditures ($) 735 747 707 -5.3
Electricity
Consumption (kwh) 8,381 8,345 8,161 -2.2Avg. Price ($/kwh) 0.184 0.178 0.183 2.4Expenditures ($) 1,541 1,488 1,490 0.1

20
Estimated Average Heating Expenditures
Fuel Type % Change Last Year
% Change 5-Year Avg.
Natural Gas -5.3% -3.7%
Heating Oil 16.2% 12.0%
Propane -1.6% 5.6%
Electric 0.1% -3.3%

21
New York State Retail Heating Fuel SurveysCurrent Prices: Heating Oil - $3.40, Kerosene - $3.75, Propane - $2.97
• Year over year change:
• Heating Oil: +23.3%
• Kerosene: +18.4%
• Propane: +11.4%

22
Crude Oil

23
U.S. Crude Oil Prices• WTI crude oil
prices have increased over the previous year
• Current weekly average WTI crude oil price for week of Oct. 19 is $70.24/bbl (36% higher than year-ago price)

24
Factors Affecting U.S. Crude Oil Prices and Inventories• Increasing uncertainty due to geopolitical considerations: Iran Sanctions,
Venezuela production declines, Saudi Arabia, and other OPEC countries, economic tariffs
• Tightening of global crude oil supplies and reduced worldwide spare production capacity
• Higher worldwide economic growth leading to demand growth for crude oil
• Other monetary factors such as value of US Dollar, U.S. equities
• U.S. crude oil production and export increases

25
World Production and Consumption Balance
Source: EIA/NYSERDA

26
World Production and Consumption Balance
Source: EIA/NYSERDA

27
Widening Brent-WTI Price Spread• Spread at its
largest since 2015 – currently around $10 per barrel
• Not as large as 2011-2014
• Unlikely to be sufficient enough to change how East Coast refiners source crude oil.
Brent price greater than WTI
Brent price less than WTI
Source: EIA/NYSERDA

28
U.S. Crude Oil Exports• U.S. crude oil export
ban lifted in December 2015
• Explosive growth -current 4-week average is 2.1 million barrels per day
• Capacity to grow depends on new pipeline infrastructure and export facilities along U.S. Gulf Coast.

29
U.S. Crude Oil Production• U.S. crude oil production
over 11 million barrels per day.
As of August 2018,U.S. is largest crude oil producer in the world
• U.S. crude oil production has increased by 1.8 million barrels per day (19.3%) since last year.
• Infrastructure capacity limiting growth (pipeline takeaway capacity and export capacity)

30
U.S. Crude Oil Stocks• Current level 423
million barrels
• 35 million barrels below last year (7.6%)
• 7 million barrels above the 5-year average (1.8%)
• Peak 536 million barrels in March 2017

31
Heating Oil

32
Northeast Heating Oil Market• U.S. home heating oil consumption is highly concentrated in the
Northeast.
• More than four-fifths of all homes in the United States that use heating oil are located in the Northeast (source: U.S. Census Bureau, 2017 American Community Survey).
• 21% of homes in the Northeast use oil as their main heating fuel, down from 27% seven years ago as an increasing number of homes switch to using natural gas and electricity for space heating.

33
Winter 2018-19 takeaways – Heating oil • Brent crude oil spot prices are expected to average $79 per barrel (bbl) this
winter $15/bbl (36 cents/gal) higher than last winter Still expected to remain lower than 2010-14 levels when the average price of
Brent crude oil exceed $100/bbl. Prices are highly uncertain heading into the winter season.
• Higher heating oil prices due to higher crude oil prices and higher distillate fuel margins (price difference between wholesale distillate fuel and crude oil). 38 cents/gal heating oil wholesale margin (5 cents/gal higher than last year) Strong demand for distillate U.S. distillate exports

34
Winter 2018-19 takeaways – Heating oil • Distillate stocks in the Mid-Atlantic totaled 22.5 million barrels on October 19, 3.6 million
barrels (14%) below the same time last year and 7.3 million barrels (25%) below the 5-year average. Distillate inventories have remained below the 5-year average since March.
• Distillate inventories have been falling heading into winter due to recent refinery maintenance combined with strong domestic and international demand. Lack of incentive to build stocks due to the backwardation of the market
• Mid-Atlantic ultra-low sulfur distillate inventories are 12% below last year’s level and 19% below the 5-year average.
• Unless severely cold temperatures in the Northeast coincide with severely cold temperatures in Europe, distillate supplies should be able to meet demand but localized supply issues and upward pressure on distillate prices are possible.

35

36

37
Northeast Sulfur & Bioheat Requirements
Source: New England Fuel Institute (NEFI) June 2018
2018 Changes to the Heating Oil Market:
•New England States moved to ULS July 1, 2018
•Most of NYS (Downstate) requires 5% Bioheat

38
Mid-Atlantic Ultra-low Sulfur (ULS) % of Total Distillate StocksNew York State moved to ULS for heating oil in 2012
New England States moved to ULS July 1, 2018
More than 85% of total distillate stocks have been ULS over the past three years.
Source: EIA/NYSERDA

39

40
Mid-Atlantic Distillate Stocks
• For the week ending October 19, total Mid-Atlantic distillate stocks are 14.0% below last year’s level and 24.7% below the 5-year average.
• Ultra-low sulfur distillate stocks are 11.9% below last year’s level and 19.4% below the 5-year average.

41
Heating Oil Challenges and Concerns• No overall issues with current supply and industry expects to be able
to meet demand.
• Inventories on the lower side due to high demand, exports, and economics.
• Truck driver shortages – across all industries and nationwide.
Compliance with Hours of Service (HOS) rules and potential for waivers during prolonged cold periods to meet demand.
• “Interruptibles” put additional strain on supply especially for prolonged timeframes during extended cold periods.

42
Heating Oil Challenges and Concerns, Cont’d. • Irving Oil refinery explosion in St. John, Canada in early October
320,000 barrels per day, more than half of refined products are exported to the Northeast U.S. (Major source for NY and New England)
Refinery was undergoing maintenance so short-term impact limited, the explosion affected a unit required to produce distillate so affect on diesel production likely stronger than gasoline.
Limited information available on full restoration of refinery operations.• New Bioheat requirements – 5% bioheat requirement in Downstate NY
Nassau, Suffolk, and Westchester counties B5 - July 1, 2018 New York City B5 - October 1, 2017 (B20 by 2034) Approximately 70% of heating oil market in New York State.

43
On the Horizon – IMO 2020• What is IMO 2020 – International Maritime Organization rules goes into effect globally
January 1, 2020. States that marine fuel will have a maximum sulfur content of 0.5% compared to 3.5% today unless scrubbers are installed. 5,000 ppm sulfur content limit compared to 35,000 ppm sulfur content limit March 1, 2020 ban on carrying high sulfur residual bunker fuel
• What are options for compliance – Install scrubbers aboard vessel – high upfront cost, customized to vessel, recoup long-term Low-sulfur bunker fuel Marine diesel (new fuel)
• Who does this affect – all global maritime shipping. U.S. was already in an Emissions Control Area (ECA) of 200 miles buffer around U.S. shoreline requiring 0.1% sulfur content as of January 2015.
• Why does this matter to NYS Heating Oil Industry – higher demand and thus potential higher price for distillate fuel (heating oil) heading into next winter

44
Propane

45
Winter 2018-19 takeaways – Propane• U.S. propane production is forecast to be 14% higher this winter compared
with last winter
• Total propane consumption is expected to be about the same as last winter and net exports 19% higher.
• U.S. propane inventories on October 19 were 4.4 million barrels (5.6%) higher than year-ago levels, and 3.9 million barrels (4.5%) below the five-year average
• Mid-Atlantic propane inventories were 26.0% higher than the year-ago level and 44.3% above the five-year average.

46
Winter 2018-19 takeaways – Propane• Increasing Mid-Atlantic propane inventories coincide with increasing propane
exports out of the Mid-Atlantic from strong global demand for propane.
• Mariner East Pipeline – Marcus Hook export terminal
Interruptions in service in Mariner East 1 pipeline (70,000 bbl/d)
Delays in completing Mariner East 2 pipeline (275,000 bbl/d)
Led to larger-than-normal inventory builds
• With increased production from shale formations and improved pipeline and rail delivery networks for propane, this should contribute to more robust propane supply chains than previous years.

47

48

49

50
51

52
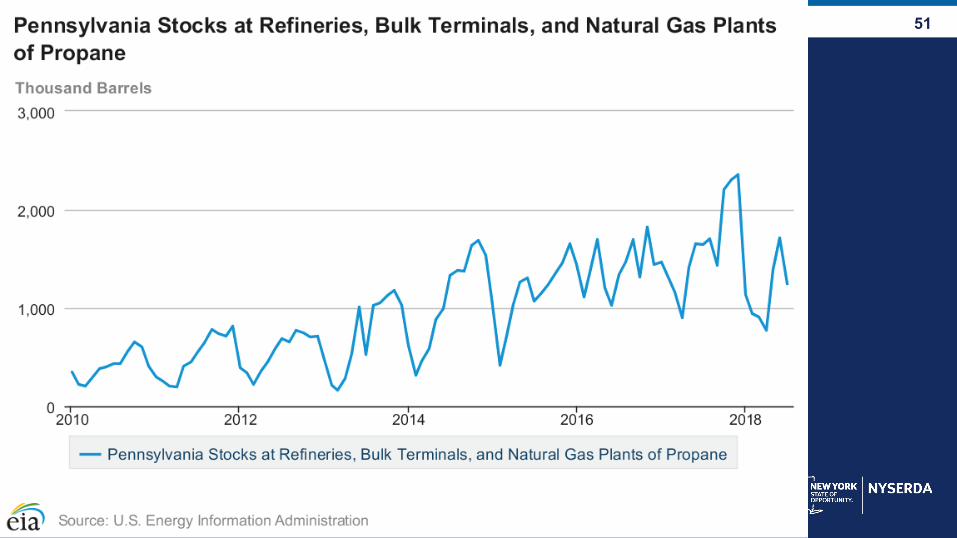
• Mid-Atlantic propane stocks are above both the 5-year average and last year’s level heading into the winter season.
• Sea-3 terminal in Newington, NH remains operational and is the only remaining open marine propane terminal in New England. A shipment of propane was received in August.
Regional Propane Stocks

53
Propane Production
• Since 2010, East Coast propane production has increased by 1,092% while the U.S. propane production has increased by 148%.
• Increased propane production primarily due to increased natural gas production.
Source: EIA Source: EIA
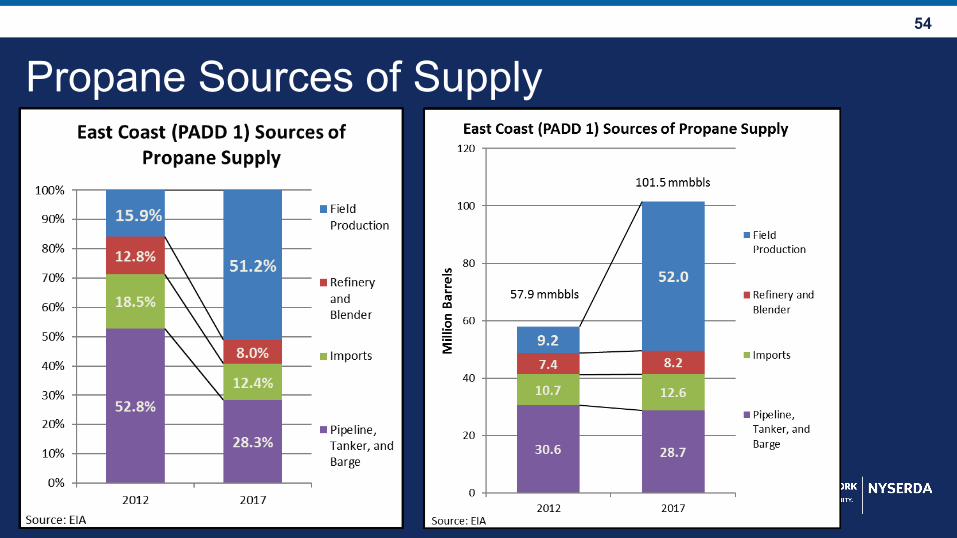
54
Propane Sources of Supply
