petroleum system definitions source / reservoir / trap / seal timing! migration petroleum systems...
TRANSCRIPT
Petroleum System• Definitions• Source / Reservoir / Trap / Seal• Timing!• Migration• Petroleum Systems Model
Basin & Petroleum Systems Modeling

Basin & Petroleum Systems Modeling• Petroleum System – Definitions
• What is a Petroleum System?
„A Petroleum System is defined as a natural system that encompasses a pod of active source rock and all related oil and gas which includes all of the geologic elements and processes that are essential if a hydrocarbon accumulation is to exist.“
Magoon and Dow, 1994

Petroleum
A mineral oil occurring in subsurface rocks and at the surface which is a naturally occurring mixture of hydrocarbon and non-hydrocarbon compounds. It may occur in the gaseous, liquid, or solid state depending on the nature of these compounds and the existent conditions of temperature and pressure. Common synonyms are hydrocarbons and oil and gas.
SystemA regularly interacting or interdependent group of items forming a unified whole whose organization forms a network for distributing something, for example; telephone, highway, blood, or petroleum.
Basin & Petroleum Systems Modeling• Petroleum System – Definitions
(after Magoon and Dow, 1994)

Geographic ExtentThe area over which the petroleum system occurs, defined by a line that circumscribes the pod of active source rock as well as all the discovered petroleum shows, seeps, and accumulations that originated from that pod. The geographic extent is mapped at the critical moment. Also the known extent.
Burial History ChartA burial history curve or geohistory diagram constructed to show the time over which hydrocarbon generation occurs. Depicts the essential elements and the critical moment for the petroleum system.
Events ChartA chart for a petroleum system showing when the essential elements and processes took place as well as the preservation time and critical moment of the system.
Basin & Petroleum Systems Modeling• Petroleum System – Definitions
(after Magoon and Dow, 1994)

Basin & Petroleum Systems Modeling
Deer Boar Petroleum System@ 250 Ma -> Critical Moment:
• generation started• traps exist• migration possible
Pod of ActiveSource Rock
Reservoirs
A-A’ Cross Section
• Petroleum System – Definitions
(from Magoon and Dow, 1994)
Geograpic Extent

Basin & Petroleum Systems ModelingBurial Chart
Events Chart
Deer Boar Petroleum System@ 250 Ma -> Critical Moment:
• generation started• traps exist• migration possible
• Petroleum System – Definitions
(from Magoon and Dow, 1994)
Combined with Events Chart

Source RockA rock unit containing sufficient organic matter of suitable chemical composition to biogenically or thermally generate and expel petroleum.
Pod of Active Source RockA contiguous volume of source rock that is generating and expelling petroleum at the critical moment and is the provenance for a series of genetically related petroleum shows, seeps, and accumulations in a petroleum system. A pod of mature source rock may be active, inactive or spent.
Reservoir RockA subsurface volume of rock that has sufficient porosity and permeability to permit the migration and accumulation of petroleum under adequate trap conditions.
Basin & Petroleum Systems Modeling• Petroleum System – Source / Reservoir / Trap / Seal
(after Magoon and Dow, 1994)
SealA shale or other impervious rock that acts as a barrier to the passage of petroleum migrating in the sub-surface; it overlies the reservoir rock to form a trap or conduit. Also known as roof rock and cap rock.
Overburden RockThe sedimentary rock above which compresses and consolidates the material below. In a petroleum system the overburden rock overlies the source rock and contributes to its thermal maturation because of higher temperatures at greater depths.
Basin & Petroleum Systems Modeling• Petroleum System – Source / Reservoir / Trap / Seal
(after Magoon and Dow, 1994)

• Petroleum System – Exercise
Basin & Petroleum Systems Modeling
Follow the below listed instructions to analyze the Paris Basin petroleum system
1. Draw a line (map) around the pod of active source rock (green-colored pencil).2. Draw a line (map) around the geographic extent of the petroleum system (red-
colored pencil).3. Draw a line (map) of cross-section on the map (brown-colored pencil) that
would best show the relation of the pod of active source rock to the petroleum migration paths and accumulations.
4. Draw an asterisk on the map (brown-colored pencil) where a burial history chart would best show the onset and end of petroleum generation and the critical moment.
5. Draw a few arrows (green-colored pencil) to indicate the directions of oil and gas migration.
PARIS BASIN – Petroleum System Analysis

• Pod of active source rock
• Geographic extent
• Cross section location
• Burial history chart location
• Petroleum migration
• Petroleum System – Exercise
Basin & Petroleum Systems Modeling
Use the following symbols to analyze theParis Basin Petroleum System

• Petroleum System – Exercise
Basin & Petroleum Systems Modeling
Paris Basin, from Tissot & Welte, 1978

• Petroleum System – Exercise
Basin & Petroleum Systems Modeling
Paris Basin, from Tissot & Welte, 1978
Critical MomentThe time that best depicts the generation – migration – accumulation of hydrocarbons in a petroleum system. A map and a cross section drawn at the critical moment best shows the geographic and stratigraphic extent of the System.The four elements Source Rock, Reservoir Rock, Seal Rock and a sufficient Amount of Overburden have to be in place before the Critical Moment.
Basin & Petroleum Systems Modeling
Petroleum System AgeThe time over which the process of generation-migration accumulation of hydrocarbons in the system takes place on the events chart.
Preservation TimeThe time after generation-migration-accumulation of petroleum takes place and encompasses any changes to the petroleum accumulations up to present day.
• Petroleum System – Timing!
(after Magoon and Dow, 1994)

2 Processes are essential for a working Petroleum System
• Generation – Migration – Accumulation(driven by temperature)
• Trap Formation!(structural evolution or stratigraphic framework)
Basin & Petroleum Systems Modeling• Petroleum System – Petroleum System Elements
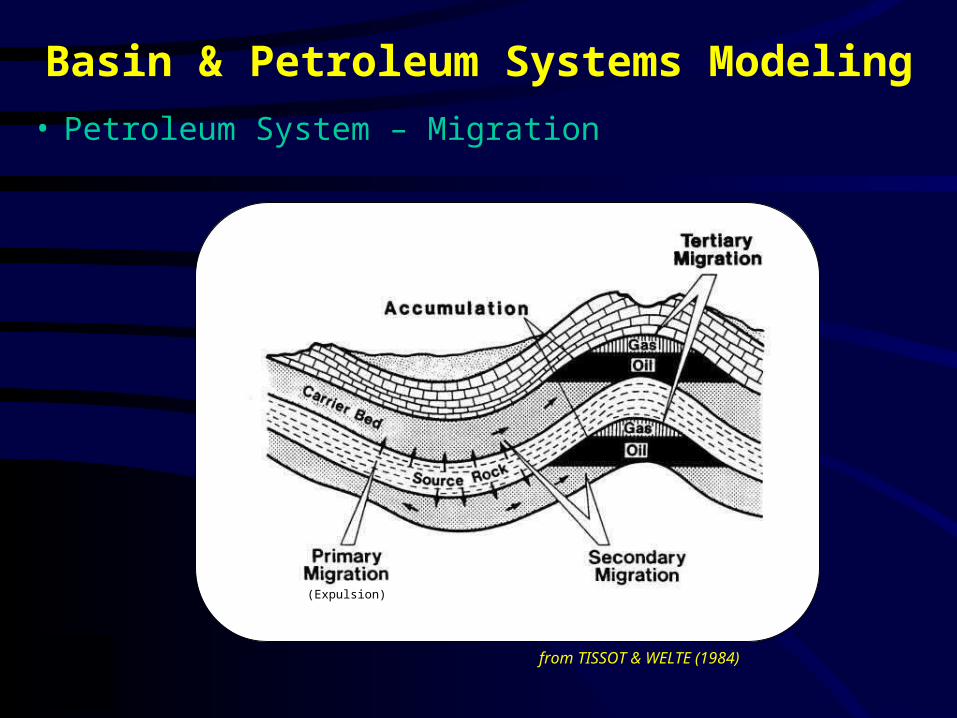
from TISSOT & WELTE (1984)
Basin & Petroleum Systems Modeling• Petroleum System – Migration
(Expulsion)

Migration is the process, whereby hydrocarbons move from source rocks to traps.Migration is divided into four categories:
• Primary migration – The process of loss of hydrocarbons from the source rock (also Expulsion).
• Secondary migration – Migration from source to reservoir rock in trap configuration along a carrier system. Including the migration within the reservoir rock itself.
• Tertiary migration – Migration to the surface, either from the reservoir or source rock (dismigration).
• Re-migration – Migration from one reservoir system position through an intervening section into another reservoir position (trap) in the same or a different reservoir.
Basin & Petroleum Systems Modeling• Petroleum System – Migration

Why do hydrocarbons migrate?Fluids migrate along a pressure gradient pressure driven
Density contrasts between hydrocarbons and water buoyancy driven
Diffusion due to concentration differences chemical gradient driven
Hydrocarbons migrate as a separate phase from the higher potential to a lower potential on the direct way topography driven
How do hydrocarbons migrate?
Basin & Petroleum Systems Modeling• Petroleum System – Migration
Generated HC Masses from Source
Topography driven
buoyancy driven
from
Han
tsch
el &
Kau
era
uf
(2009)
cpwwp phguu )( Overpressure Buoyancy Capillary Pressure

Migration Mechanism Migration Rate
Hydrodynamic (pressure driven) 10-3 to 1000 m/a
Compaction (drainage!) 10-5 to 1 m/a
Buoyancy Meters per day (gas)
Diffusion 1 to 10 m / Ma
Petroleum Migration Rates
Basin & Petroleum Systems Modeling• Petroleum System – Migration
Fluid velocity [m/a]
1 10 102 103 1040.110-210-410-510-610-7 10-3
Buoyancy GAS
Hydrodynamic?
? Compactionally driven flow
Diffusion

for a distance of 500m and a pressure gradient of 5MPa/km ( Darcy Law )
• Petroleum System – Migration
Basin & Petroleum Systems Modeling
0.01 0.1 1.0 10.0 100.0 1000.0
gas oil
Viscosity [mPa s]
Perm
eabi
lity
[mD
]
104
103
102
101
10-1
10-2
10-3
10-4
10-5
100
1 day
1000 yearsSilt@ 20% porosity
1 year
Sand @ 20% porosity
Petroleum Migration Rates
pgradk
dx
dpk
A
Qv

The following main driving mechanisms can be distinguished
Pressure Gradient DrivenSediment Compaction - overpressure (grad u), compaction driven fluid movement,
permeabilityCapillary imbibition - capillary pressure differences between fine and coarse grained layers (leads to downward expulsion)
- capillary fluid flow depends on fluid components involved, relative permeability
Buoyancy DrivenFluid composition density contrast between hydrocarbons and waterTemperature Temperature increase leads to increasing buoyancy
- primary effect - the density contrast between water an HC’s increase
- secondary effect - cracking to lighter HC’s
Pressure Pressure increase leads to decreasing buoyancy- primary effect - the density contrast between water an
HC’s decrease- secondary effect - dissolving of lighter HC’s into the
liquid phase
Chemical potential concentration differences (diffusion)
Basin & Petroleum Systems Modeling• Petroleum System – Migration

• Petroleum System – Migration
Basin & Petroleum Systems Modeling
Sediment Compaction
Bu
rial D
ep
th
Pressure
LithostaticPressure
HydrostaticPressure
PorePressure
Fluidflow
Compaction
Zo
ne
of
Ove
rpre
ssu
re
hP
u σ
lP : Effective Overburden Pressure (MPa)
u : Excess Pore Pressure (MPa)
lP
hP
: Lithostatic Pressure (MPa)
: Hydrostatic Pressure (MPa)
eP
normal / hydrostaticpressure
overpressure
• Petroleum System – Migration
Basin & Petroleum Systems Modeling
Sediment Compaction
pgradk
dx
dpk
A
Qv
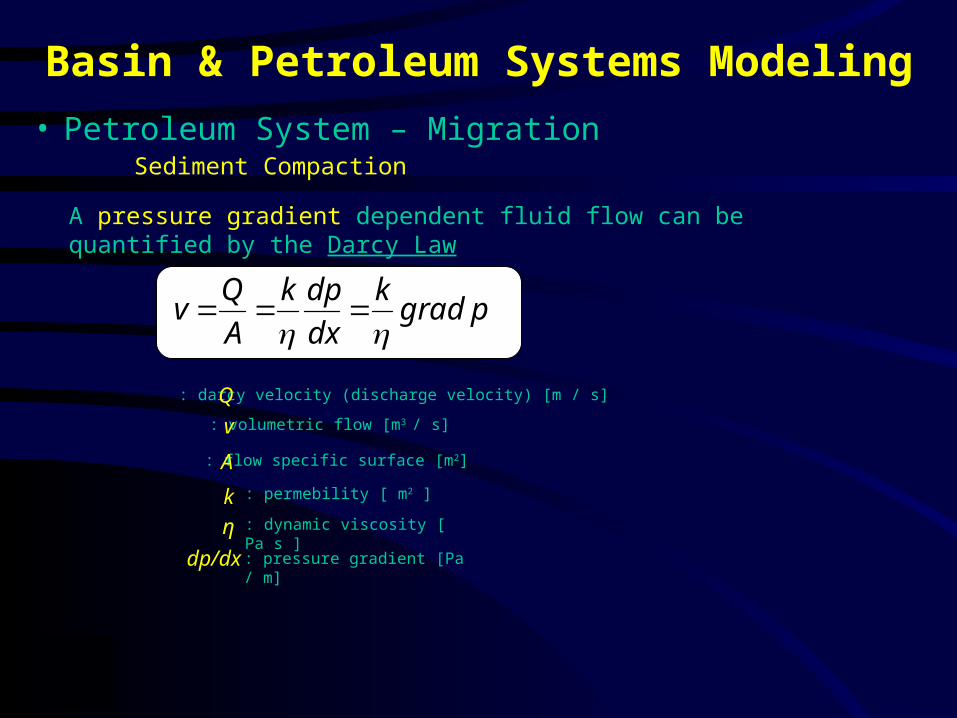
A pressure gradient dependent fluid flow can be quantified by the Darcy Law
: volumetric flow [m3 / s]
: permebility [ m2 ]
: darcy velocity (discharge velocity) [m / s]
: flow specific surface [m2]
: pressure gradient [Pa / m]
Q
v
η
dp/dx
: dynamic viscosity [ Pa s ]
k
A

• Petroleum System – Migration
Basin & Petroleum Systems Modeling
Sediment Compaction
Permeabilities Po
rosi
ty-E
ffe
ctiv
e S
tre
ss F
un
ctio
n
ke 101)(
gzk wlez
))(1(00
01)1(
)(
Po
rosi
ty-D
ep
th F
un
ctio
n
z

When a drop of one immiscible fluid is immersed in another and comes to rest on a solid surface. The shape of the resulting interface is governed by the balance of adhesive and cohesive forces.
SOLID SURFACE
OilWater
The surface area at the fluid-fluid contact is minimized by the interaction of these forces:
cohesive forces at the fluid-fluid interfaceadhesive forces at the solid-fluid interface
• Petroleum System – Migration
Basin & Petroleum Systems Modeling
Example:
Capillary Imbibition

Capillary pressure is the difference in pressure across the interface between two immiscible fluids, and thus defined as:
Pc = Pnw - Pw
Pw = wetting phasePnw non-wetting phase
In oil-water systems, water is typically the wetting phase, while for gas-oil systems, oil is typically the wetting phase. When adhesion > cohesion, adhesive forces draw the fluid up the tube until they are balanced by the weight of the fluid column. When cohesion > adhesion, cohesive forces drag fluid down the tube until they are balanced by the weight of the head difference forcing fluid upwards.
• Petroleum System – Migration
Basin & Petroleum Systems Modeling

• Petroleum System – Migration
Basin & Petroleum Systems Modeling
Capillary Imbibition

drainage
imbibition
• Petroleum System – Migration
Basin & Petroleum Systems Modeling
Oil phase
As HC migrate into a water-wet rock- They first enter the pores with the largest pore throats (capillaries) leaving the wetting
phase in the pores with the smaller throats (insufficient pressure).- Can also leave the wetting phase in irregular nooks and crannies.- As the hydrocarbon column rises, Pc rises (buoyancy) and forces hydrocarbons into
pores with smaller and smaller throats

• Petroleum System – Migration
Basin & Petroleum Systems Modeling
Sediment Compaction
cpwwp Phguu )(
The petroleum potential
: Excess Pore Pressure (Overpressure)
: Petroleum Density
: Petroleum Potntial
: Water Density
: Capillary Pressure
up
uw
g
Pc
: acceleration due to gravity
ρp
ρw
: column height h

5000m
4500m
3000m
4000m
3500m
2500m
2000m
3000m
2000m
5000m
4500m
4000m
2500m
BA C
A
A’
Basin & Petroleum Systems Modeling
Hydrocarbons migrate as a separate phase from the higher potential to a lower potential on the direct way, usually from the deepest to the shallowest part of the basin, depending on the drainage area.
1) Identify the drainage area for trap A, B & C2) Draw the hydrocarbon flow
lines towards each trap
1500
2000
2500
3000
3500
4000
4500
5000
A A’
• Petroleum System – Exercise

5000m
4500m
3000m
4000m
3500m
2500m
2000m
3000m
2000m
5000m
4500m
4000m
2500m
BA C
Basin & Petroleum Systems Modeling• Petroleum System – Migration - Exercise

Basin & Petroleum Systems Modeling
BA C
• Petroleum System – Migration - Solution

Basin & Petroleum Systems Modeling• Petroleum System – Migration
There are a variety of modelling methods in computerized Basin Modelling, out of which three basic concepts can be indentified:
• Darcy Flow – Based on equations of flow through porous media
• Flow Path – Geometrical surface analysis (buoyancy driven migration)
• Invasion Percolation – Flow controlled by capillary forces only
• A combination of methods – A combination of different methods needs the introduction of threshold values to enable the program to decide when a specific method is used, advantages of each method can be combined in a time effective and accurate simulation of the migration and accumulation processes
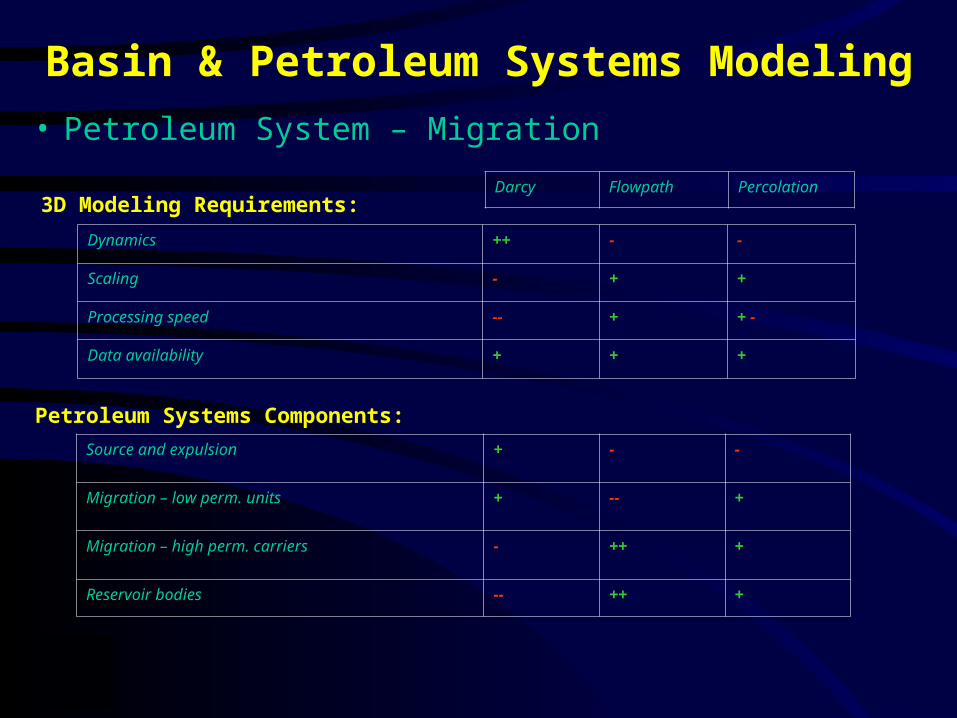
Dynamics ++ - -
Scaling - + +
Processing speed -- + + -
Data availability + + +
Source and expulsion + - -
Migration – low perm. units + -- +
Migration – high perm. carriers - ++ +
Reservoir bodies -- ++ +
Petroleum Systems Components:
3D Modeling Requirements:
Basin & Petroleum Systems Modeling• Petroleum System – Migration
Darcy Flowpath Percolation

Basin & Petroleum Systems Modeling• Petroleum Systems Model
„A Petroleum Systems Model is a digital data model of an entire petroleum system in which the interrelated processes and their results can be simulated in order to understand and predict them.“
„The model is dynamic and provides a complete record through geologic time.“
from Magoon and Dow, 1994

Key Questions and Tasks of Petroleum Systems ModelingPetroleum Generation
Have hydrocarbons been generated?Resource assessment studies and initial charge risking. There are basins in which no oil and gas have been generated!
Where were hydrocarbons generated?If hydrocarbons were generated, we can define their locations quite accurately.
When were hydrocarbons generated?There are many clear examples of where basins/plays/prospects have failed due to timing problems. For example, when oil and gas was generated early and the structures were created much later:
Petroleum Migration & AccumulationCould they have migrated to the prospect?Modeling of the dynamic process of generation, expulsion and migration makes it possible to determine if the oil and gas charge could reach the trap.
What are the properties of the hydrocarbons?Modeling of the phase behaviour of the hydrocarbons during migration, accumulation and loss makes it possible to determine oil vs. gas probabilities and even predict properties such as API gravities and GORs.
Basin & Petroleum Systems Modeling• Petroleum Systems Model

source
carrier
Trap Riskfor example:- Prospect geometry- Reservoir quality (por/perm)- Seal quality
Charge Risk for example:- Source rock quality- Source rock maturity- Generated petroleum
Timing and Migration Risk!- relates the charge to the trap ... migration!- takes dependencies and processes into account!- takes dynamics into account!
sealcarrier/
reservoir
This is what Petroleum Systems Modeling technology does!
• Petroleum Systems Model
Definition: Charge is the volume of hydrocarbons available for entrapment
Basin & Petroleum Systems Modeling