pfiopertvofw~ - united states, 1978–2003 publicatio};sbra
TRANSCRIPT

----
PFiOPERTVOFW~ -PUBLICATIO};SBRA~H EDITORIALLIBRARY
,“ ,m
.~1##
Changing MortaliW Patterns, Health Services Utilization, and Health Care Expenditures: United States, 1978–2003
The projected effect of changes in mortality
patterns on the future population size
and population age distribution is examined.
An assumption of declining mortality
trends implies an increased aging of the
population. The potential effects of an
aging population on health care use and
expenditures are examined.
Analyticaland EpidemiologicalStudies Series 3, No. 23
DHHS Publication No. (PHS) 83–1407
U.S. Department of Health and Human
Services
Public Health Service
National Center for Health Statistics
Hyattsville, Md.
September 1983

Copyright Information
The National Center for Health Statlatlcs has obtained permission
from the copyright holders to reproduce cerlaln quoted material In this
report Further reproduction of this material IS prohibited without
specific permission of the copyright holders, All other material contained
In the report IS in the publlc domain and may be used and reprinted
w(thout special permlsslon; citation as to source, however, is
appreciated.
Suggested Citation
Nat(onal Center for Health Statistics, D. P. Rtce, H. M. Rosenberg,
L. R. CurtIn, and T. A. Hodgson: Changing Mortal!ty Patterns, Health
Services Utllizatlon, and Health Care Expenditures, United States,
1978–2003. Vita/ and Hea/th .SYatlstics. Series 3-No, 23. DHHS
Pub, No, (PHS) 83–1407, Public Health Serwce. Washington.
U.S. Government Printing Off Ice, Sept. 1983.
Library of Congress Cataloging in Publication Data
Main entry under title:
Changing mortallty patterns, health serwces utlllzatlon, and health
care expenditures.
(DHHS publrcatlon : no. (PHS) 83–1407) (Mtal and health statistics.
Series 3, Analytical studies; no. 23)
Supt. of Dots. no : HE 20.6209:3/23
1. Medical care—United States— Utllizat(on. 2. Mortallty-United
States. 3. Medical Care, Cost of—United States. 4. Umted
States—Population. 5. United States— Statlstlcs, Medical. 6. Untted
States— Statlstlcs, Vital. 1. Rice, Dorothy P Il. Series. Ill. Series:
Vital and health statistics. Series 3, Analytical studies ; no. 23,
[DNLM: 1. Demography —Trends— Un!ted States. 2. Health serwces—
Trends—United States. 3. Health services- Utlllzatlon-United
States. 4. L}fe expectancy. 5. Mo~al(ty—Trends—United States,
6. Expenditures, Health—Trends—United States, W2 A N148vc no. 23]
RA410.7. C45 1983 362.1 ‘0973 83–6001 37
ISBN 0–8406–0277–4

National Center for Health Statistics Division of Vital Statistics
Manning Feinleib, M.D., Dr. P.H., Director John E. Patterson, Director
Robert A. Israel, Deputy Director Alice M. Hetzel, Deputy Director
Jacob J. Feldman, Ph. D., Associate Director for Analysis Harry M. Rosenberg, Ph. D., ChieJ klortali~ Statistics
and Epidemiology Branch
Garrie J, Losee, Associate Director for Data Processing Joseph D. Farrell, ChieJ Computer Applications Stafl
and Services Mabel G. Smith, ChieX Statistical Resources Branch
Alvan O. Zarate, Ph.D., Assistant Director for International Statistics
E, Earl Bryant, Associate Director for Interview and Examination Statistics
Robert L. Quave, Acting Associate Director for Management
Gail F. Fisher, Ph. D., Acting Associate Director for Program Planning, Evaluation, and Coordination
Monroe G. Sirken, Ph.D., Associate Director for Research
and Methodology
Peter L. Hr.uley, Associate Director for Vital and Health Care Statistics
Alice Haywood, Information Oficer
Office of Analysis and Epidemiology Program
Jacob J. Feldman, Ph. D., Associate Director .-
Division of Analysis
Joel C. Kleinman, Ph. D., Director
Thomas A. Hodgson, Ph. D., ChieJ Health Economics
Analysis Branch
John C. Clark, Ph.D., ChieJ Analytical Coordination Branch
r Office of Vital and Health Care Statistics Program
L-Peter L. Hurley, Associate Director
~
Foreword
This report is an outgrowth of a paper entitled “Projection and analysis of health status trends” presented by Dorothy P. Rice at the 1978 meeting of the American Public Health Association.
The purpose of this report is to examine in detail how two alternative mortality assumptions, projected to the year 2003, affect estimates of health care utilization and expenditures in the future. The first is that mortality levels by age, as of 1976, remain constant. The second is that recent declining trends, as experienced from 1966 to 1976, are sustained. These illustrative projections of mortality are based on historic trends and patterns, and they represent limits of what may be reasonably expected to occur in future years. It is unlikely that either projection will be realized. The future course, at least as it relates to demographic patterns, will probably lie somewhere within the bounds set by these projections. How-ever, they do serve to illuminate the relationships among demographic trends, the use of health care, and medical care expenditures.
Significant long-term effects on the age distribution of the population will occur even if age-specific mortality rates re-
main constant between 1978 and 2003. More dramatic demographic changes will be evident if mortality declines at the rate experienced during the pericid 1966–76. In turn, these demographic changes will have a significant effect on the use of health services and expenditures for health care. These projections do not anticipate future trends in other factors that influence utilization of health services, such as changes in therapies. They do reveal, however, tha~ whatever else hap pens, the projected changes in the size and age distribution of the population alone would produce substantial increases in the number of people with chronic health problems and their above-average use of medical care.
Special thanks are extended to Bruce Sobus, Office of the Actuary, Social Security Administration, for providing life tables and population projections; to Professor Herbert Klarman, New York University, for reviewing and commenting on the content of the repom and to Dr. Jacob Feldman for valuable conceptual contributions to the paper.
Manning Feinleib Director
.. Ill
Contents
Foreword . . . . . . . . . . . ..!...... . . . . . . . . . . . . . . . . . . . . . . . . . . . . . . . . . . . . . . . . . . . . . . . . . . . . . . . . . . . . . . . . . . . . . . . . . . . . .
Chapter 1, Introduction, . . . . . . . . . . . . . . . . . . . . . . . . . . . . . . . . . . . . . . . . . . . . . . . . . . . . . . . . . . . . . . . . . . . . . . . . . . . . . . . . . .
Chapter2, Projection model . . . . . . . . . . . . . . . . . . . . . . . . . . . . . . . . . . . . . . . . . . . . . . . . . . . . . . . . . . . . . . . . . . . . . . . . . . . . . . . . Demographic projections . . . . . . . . . . . . . . . . . . . . . . . . . . . . . . . . . . . . . . . . . . . . . . . . . . . . . . . . . . . . . . . . . . . . . . . . . Health sector projections . . . . . . . . . . . . . . . . . . . . . . . . . . . . . . . . . . . . . . . . . . . . . . . . . . . . . . . . . . . . . . . . . . . . . . . . .
Figure
1. Schematic ofthe projection model for population, health services utilization, and health expenditures . . . .
Chapter3, Mortalityprojections . . . . . . . . . . . . . . . . . . . . . . . . . . . . . . . . . . . . . . . . . . . . . . . . . . . . . . . . . . . . . . . . . . . . . . . . . . . . Death rates . . . . . . . . . . . . . . . . . . . . . . . . . . . . . . . . . . . . . . . . . . . . . . . . . . . . . . . . . . . . . . . . . . . . . . . . . . . . . . . . . . . . Life expectancy . . . . . . . . . . . . . . . . . . . . . . . . . . . . . . . . . . . . . . . . . . . . . . . . . . . . . . . . . . . . . . . . . . . . . . . . . . . . . . . .
Figures
2. Life ex~ectancy: United States, 1953-2003. . . . . . . . . . . . . . . . . . . . . . . . . . . . . . . . . . . . . . . . . . . . . . . . . . . . . 3. Llfeexpectancy atbirthby sex: selected countries . . . . . . . . . . . . . . . . . . . . . . . . . . . . . . . . . . . . . . . . . . . . . . . .
Tables
1. Death rates andpercent change inrates, byage:United States, 1953adprojections for1978and2003 . . . 2. Life expectancyby sex: United States, 1953 and projections for1978and 2003 . . . . . . . . . . . . . . . . . . . . . .
Chapter4, Populationprojections . . . . . . . . . . . . . . . . . . . . . . . . . . . . . . . . . . . . . . . . . . . . . . . . . . . . . . . . . . . . . . . . . . . . . . . . . . . Description . . . . . . . . . . . . . . . . . . . . . . . . . . . . . . . . . . . . . . . . . . . . . . . . . . . . . . . . . . . . . . . . . . . . . . . . . . . . . . . . . . . . Procedure . . . . . . . . . . . . . . . . . . . . . . . . . . . . . . . . . . . . . . . . . . . . . . . . . . . . . . . . . . . . . . . . . . . . . . . . . . . . . . . . . . . . .
Figures
4. Populationsize: United States, 1953 and projections for 1978 and2003. . . . . . . . . . . . . . . . . . . . . . . . . . . . . 5. Projectedpercentincrease inpopulation by age: United States, 1953-78 and 1978–2003 . . . . . . . . . . . . . . 6. Projected percent increase inolder population byage:United States, 1953-78ad 1978-2003 . . . . . . . . .
Tables
3. Population size adpercent increase, byage:United States, 1953and projections for1978and2003 . . . . 4. Percent distribution of thepopulation byage:United States, 1953and projections for1978and2003 . . . .
Chapter5. Health sectorprojections . . . . . . . . . . . . . . . . . . . . . . . . . . . . . . . . . . . . . . . . . . . . . . . . . . . . . . . . . . . . . . . . . . . . . . . . . Limitation ofactivity . . . . . . . . . . . . . . . . . . . . . . . . . . . . . . . . . . . . . . . . . . . . . . . . . . . . . . . . . . . . . . . . . . . . . . . . . . . .
Utilization ofhealth services . . . . . . . . . . . . . . . . . . . . . . . . . . . . . . . . . . . . . . . . . . . . . . . . . . . . . . . . . . . . . . . . . . . . . . Health care expenditures . . . . . . . . . . . . . . . . . . . . . . . . . . . . . . . . . . . . . . . . . . . . . . . . . . . . . . . . . . . . . . . . . . . . . . . . . Other studies . . . . . . . . . . . . . . . . . . . . . . . . . . . . . . . . . . . . . . . . . . . . . . . . . . . . . . . . . . . . . . . . . . . . . . . . . . . . . . . . . . .
Figures
7. Projectednumberofpersonswithlimitation ofactivityduetochronicconditions andpercentdistributionby
age: United States, 1978 and2003 . . . . . . . . . . . . . . . . . . . . . . . . . . . . . . . . . . . . . . . . . . .’. . . . . . . . . . . . . . . . .
... 111
1
3 3
3
3
5 5
6
6 7
9 9
10 10 12
10 11 12
13
13
14 14
15 17 18
14
v
I
8. Projected number ofphysician visits andpercent distribution byage:United States, l978and2OO3 . . . . .9. Projected days ofcarein non-Federal shofi-stay hospitals andpercent distribution byage: United States,
1978 and 2003 . . . . . . . . . . . . . . . . . . . . . . . . . . . . . . . . . . . . . . . . . . . . . . . . . . . . . . . . . . . . . . . . . . . . . . . . . . . . .
10. Projected number ofresidents innursing homes and percent distribution byage: United States, 1978and2003 . . . . . . . . . . . . . . . . . . . . . . . . . . . . . . . . . . . . . . . . . . . . . . . . . . . . . . . . . . . . . . . . . . . . . . . . . . . . . . . . . . . . . .
11. Projected expenditures forphysician visits, hospitalcare, andnursing home care, and percent distributionby age: United States, 1978 and2003. . . . . . . . . . . . . . . . . . . . . . . . . . . . . . . . . . . . . . . . . . . . . . . . . . . . . . . . . .
Tables
5. Number of persons with limitation of activity from chronic conditions per l,OOOpopulation, numberofpersons with limitation ofactivity andpercent increase, andpercent distribution ofpersons with limitation
ofactivity by mortality assumption and age: United States, 1978 and 2003 projections . . . . . . . . . . . . . . . .6. Number ofphysician visits perl,OOO population, number ofphysician visits andpercent increase, andper
cent distribution ofphysician visits by mortality assumption and age: United States, 1978 and 2003 pro
jections . . . . . . . . . . . . . . . . . . . . . . . . . . . . . . . . . . . . . . . . . . . . . . . . . . . . . . . . . . . . . . . . . . . . . . . . . . . . . . . . . . . .7. Number ofdaysofcare in non-Federal short-stay hospitals per 1,000 population, numbers ofdays and
percent increase, and percent distribution of days of care by mortality assumption and age: United States,1978 and 2003 projections . . . . . . . . . . . . . . . . . . . . . . . . . . . . . . . . . . . . . . . . . . . . . . . . . . . . . . . . . . . . . . . . . . .
8. Number ofnursing home residents per l,OOOpopulation, number ofnursing home residents and percent
increase, and percent distribution of nursing home residents by mortality assumption and age: UnitedStates, 1978 and 2003 projections . . . . . . . . . . . . . . . . . . . . . . . . . . . . . . . . . . . . . . . . . . . . . . . . . . . . . . . . . . . . .
9. Health services utilization andpercent increase, by mortality assumption and type ofcare: United States,
1978 and 2003 projections . . . . . . . . . . . . . . . . . . . . . . . . . . . . . . . . . . . . . . . . . . . . . . . . . . . . . . . . . . . . . . . . , . .10. Expenditures inconstant dollars forphysician visits, percent increase, mdpercent distribution bymortality
assumption andage: United States, 1978 and 2003 projections. . . . . . . . . . . . . . . . . . . . . . . . . . . . . . . . . . . . .11. Expenditures inconstant dollars for non-Federal short-stay hospital care, percent increase, and percent
distribution by mortality assumption and age: United States, 1978 and2003 projections . . . . . . . . . . . . . . .12. Expenditures inconstant dollars for nursing home care, percent increase, and percent distribution bymor
tality assumption andage: United States, 1978and 2003 projections. . . . . . . . . . . . . . . . . . . . . . . . . . . . . . . .13. Percapitaexpenditures forhealth services andpercentincrease, by mortality assumption andtype ofcare:
United States, 1978 and 2003 projections . . . . . . . . . . . . . . . . . . . . . . . . . . . . . . . . . . . . . . . . . . . . . . . . . . . . . .14. Aggregate andpercapitanationalhealth expenditures, bytype ofexpenditure: United States, 1981,1985,
and 1990projections . . . . . . . . . . . . . . . . . . . . . . . . . . . . . . . . . . . . . . . . . . . . . . . . . . . . . . . . . . . . . . . . . . . .....
Chapter6. Discussion . . . . . . . . . . . . . . . . . . . . . . . . . . . . . . . . . . . . . . . . . . . . . . . . . . . . . . . . . . . . . . . . . . . . . . . . . . . . . . . . . . . . .Healthcare needs . . . . . . . . . . . . . . . . . . . . . . . . . . . . . . . . . . . . . . . . . . . . . . . . . . . . . . . . . . . . . . . . . . . . . . . . . . . . . . .Alternative services . . . . . . . . . . . . . . . . . . . . . . . . . . . . . . . . . . . . . . . . . . . . . . . . . . . . . . . . . . . . . . . . . . . . . . . . . . ...Otherconcerns . . . . . . . . . . . . . . . . . . . . . . . . . . . . . . . . . . . . . . . . . . . . . . . . . . . . . . . . . . . . . . . . . . . . . . . . . . . . . . . . .
Chapter7. Conclusion . . . . . . . . . . . . . . . . . . . . . . . . . . . . . . . . . . . . . . . . . . . . . . . . . . . . . . . . . . . . . . . . . . . . . . . . . . . . . .......
References . . . . . . . . . . . . . . . . . . . . . . . . . . . . . . . . . . . . . . . . . . . . . . . . . . . . . . . . . . . . . . . . . . . . . . . . . . . . . . . . . . . . . . . . . . . . . . . .
Appendix . . . . . . . . . . . . . . . . . . . . . . . . . . . . . . . . . . . . . . . . . . . . . . . . . . . . . . . . . . . . . . . . . . . . . . . . . . . . . . . . . . . . . . . . . . . . . . . . .
15
16
16
17
19
19
20
20
21
21
21
22
22
22
23 23 24
24
25
26
27
Symbols
. . . Data not available
,,, Categow not applicable
Quantity zero
0.0 Quantity more than zero but less than
0.05
z Quantity more than zero but less than
500 where numbers are rounded to
thousands
* Figure does not meet standards of
reliability or precision
# Figure suppressed to comply with
confidentiality requirements
vii
Changing Mortality Patterns, Health Services Utilization, and Health Care Expenditures by Dorothy P. Rice, former Director, National Center for
Health Statistics; Harry M. Rosenberg, Ph. D., Division of
Vital Statistics; Lester R. Curtin, Ph. D., Office of Research
and Methodology and Thomas A. Hodgson, Ph. D., Division
of Analysis
Chapter 1 Introduction
The future demographic composition of population in the Nation, State, or local area is of great concern to health planners, policy analysts, and individual institutions planning to serve their communities. In particular, the future size and age distribution has implications for the use of health services and related expenditures. This report provides projections of future population size and age distributions for the country as a whole and examines their possible effects on health care use and expenditures.
Predicting demographic change is, by its nature, an uncertain exercise. Much depends on whether past trends continue or whether future developments, both expected and. unexpected, alter the components of population change that are the basis for population projections. Each of the three components of population change-births, migration, and deaths— respond to external or environmental factors. For births, some evidence of an association with economic conditions exists; for migration, unpredictable international events can often exert an impact and for deaths, changes in personal habits such as diet, exercise, and smoking may ultimately affect mortality trends. Therefore, the results of projection processes should be used with caution.
Nevertheless, projections of the size and composition of the population, of health services use, and of health expenditures can be made and used to advantage. Although it is not possible to predict exactly what will happen, it is usually feasible to establish a range within which fiture developments are most likely to occur. ~
The complexity of the projection process and the range of uncertainty are directly related to the number of variables under consideration. Population projection usually involves the three demographic variables births, migration, and deaths. Health sector models, however, incorporate additional health-related variables for which varying assumptions about fiture developments must be made. These may include utilization patterns, health manpower availabilities, and financial re-sources. This report is primarily concerned with demographic effects and, in particular, with the tiect of changes in mortality patterns. Other variables-both demographic and health sector
variables-are held constant in order to focus on the possible consequences of mortality change.
Marked reductions in mortality would have only a small effect on the total size of the U.S. population during the next quarter of a century. However, such reductions could have a substantial impact on the age distribution of the population— the proportionate shares of the population that are comprised of youth, the working age population, and the elderly. The projections in this report, even assuming no change in agespecillc patterns of mortality, imply a future population with a relatively older age structure than exists at present. If recent reductions in age-specific death rates persist into the fhture, the population will be even older.
The demographic effects of two alternative assumptions of future mortality patterns on total population size and on selected features of the health sector are examined. The first is that mortality levels by age, as of 1976, remain constant. The second is that recent declining trends, as experienced from 1966 to 1976, are sustained.
The 1966–76 period was one of marked mortality decline in the United States. This trend has been essentially sustained through 1978.1 Thus, by assuming that the rate of improvement during that 10-year period is maintained, an upper limit to the size and relative age of the population-as determined solely by mortality change-can be set. Because some mortality improvement is to be expected, the constant mortality assumption would set the lower limit. The actual mortality pat-tern will probably differ from either assumption, although it will most likely lie between the high and low limits. The purpose of this report is to examine the range of possible consequences for the health sector of en increasingly older American population.
The discussion of the projection process and the examination of the impact of the alternative mortality assumptions on future health care utilization and expenditures to the year 2003 are supplemented by tables and charts. Both the logic and the calculations of the projection process are explained. In chapter 2, an overall view of the projection model and the relationships among its components are provided. In chapter 3,
1

a detailed description of the alternative mortality assumptions for each of four factors: (1) the population with limitation of is presented. In chapter 4, the projected populations deter- activity, (2) aggregate utilization of health care services, mined by the alternative mortality assumptions are discussed. (3) amgate health care expenditures, and (4) per capita health In chapter 5, these demographic projections are used as inputs care utilization and expenditures. In chapter 6, the possible to a health sector model. For that model, constant health sector impact of these projections on future health care concerns is parameters are assumed. This results in two sets of projections discussed.
Chapter 2 Projection model
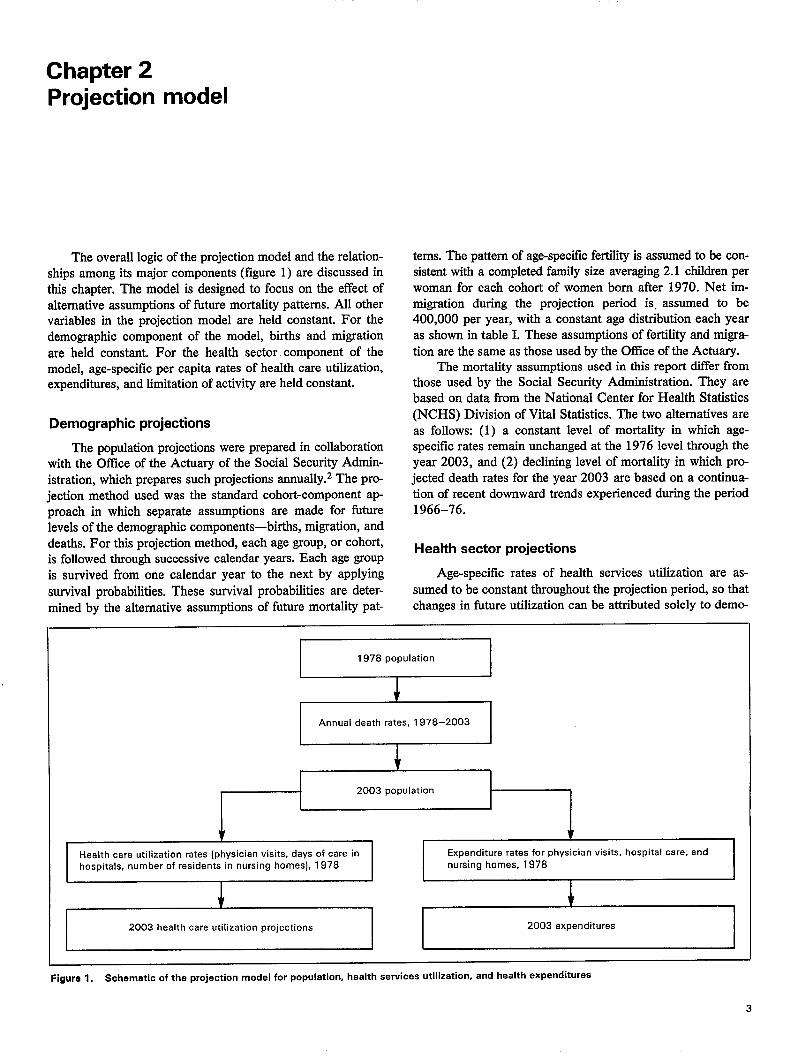
The overall logic of the projection model and the relation-ships among its major components (figure 1) are discussed in this chapter. The model is designed to focus on the effect of alternative assumptions of future mortality patterns. All other variables in the projection model are held constant. For the demographic component of the model, births and migration are held constant. For the health sector component of the model, age-specific per capita rates of health care utilization, expenditures, and limitation of activity are held constant.
Demographic projections
The population projections were prepared in collaboration with the OffIce of the Actuary of the Social Security Administration, which prepares such projections annually.2 The projection method used was the standard cohort-component ap preach in which separate assumptions are made for future levels of the demographic components—births, migration, and deaths. For this projection method, each age group, or cohort, is followed through successive calendar years. Each age group is survived from one calendar year to the next by applying survival probabilities. These survival probabilities are deter-mined by the alternative assumptions of fiture mortality pat-
terns. The pattern of age-specific fertility is assumed to be consistent with a completed family size averaging 2.1 children per woman for each cohort of women born after 1970. Net immigration during the projection period is, assumed to be 400,000 per year, with a constant age distribution each year as shown in table I. These assumptions of fertility and migration are the same as those used by the OffIce of the Actuary.
The mortality assumptions used in this report differ from those used by the Social Security Administration. They are based on data from the National Center for Health Statistics (NCHS) Division of Vital Statistics. The two alternatives are as follows: (1) a constant level of mortality in which age-specii5c rates remain unchanged at the 1976 level through the year 2003, and (2) declining level of mortality in which pr~ jetted death rates for the year 2003 are based on a continuation of recent downward trends experienced during the period 1966–76.
Health sector projections
Age-specific rates of health services utilization are assumed to be constant throughout the projection period, so that changes in future utilization can be attributed solely to demo-
1978 population
i
Annual death rates, 1978-2003
Health care utilization ratea (physician visits, days of care in Expenditure rates for physicisn visits, hospital care, and
hospitals, number of residents in nursing homes), 1978 nursing homes, 1978
J I
2003 health care utilization projections 2003 expenditures
Figure 1. Schematic of the projection model for population, health services utilization, and health expenditures
3
graphic factors. These rates are based on data from NCHS sources, including the National Health Interview Survey, the National Hospital Discharge Survey, and the National Survey of Nursing Homes. Future utilization is derived by applying these age-specific rates to the population projections.
Medical care prices are also assumed to remain constant throughout the projection period. The Health Care Financing Administration (HCFA) amually estimates personal health care expenditures by type of expenditure for three age groups,3 and HCFA provided figures for 1978. Adjusting these figures by increases in utilization because of population growth alone
results in projected total expenditures for hospital care, physician visits, and nursing home care in 2003. For projected health care utilization, projected expenditure patterns by age reflect only population change because medical care prices are held constant throughout the projection period. [
Under the assumptions of constant prices and age-specific patterns of health care utilization, the projected total expenditure figures show the differential effects between the assumptions of no change in mortality and continued and substantial decline in mortality.
4
Chapter3 Mortality projections
The procedures used to project death rates for the alter-native mortality assumptions and to derive survival rates are described in this chapter. Projections of death rates are made separately for men and women by 5-year age groups. These, in turn, are the basis for calculating life table survival rates.
Dqath rates
Description
Age-specific mortality rates are projected to the year 2003 from the base year 1976, the most recent year for which final data were available. While table 1 shows age-specific death rates for broad age groups in the total population, the projection methodology employed 5-year age-specific rates for men and women separately, as shown in table II.
Between 1953 and 1978, the U.S. death rate declined from 9.6 to 9.1 deaths per 1,000 population or by 5.2 percent (table 1). The highest reductions-52 percent-occurred among those under 20 years of age. Less dramatic reductions in mortality were experienced by people above that age, but every age group showed a decline. Even the elderly population 85 years of age and over showed important improvements in health status, as measured by their death rates, which declined by almost 20 percent.
From 1978 to 2003, the population will grow relatively older as greater numbers of people move into the advanced age groups. This will happen even under the assumption of constant mortality, when the risk of death at each age remains unchanged. As the larger number of people move into the advanced ages, they give increased weight to the age groups that have higher death rates. Therefore, the death rate for each broad age group, and for all age groups combined, can show an increase, despite the assumption of constant mortality.
Under the alternative mortality assumption, which is an extrapolation of the experience during 1966–76, age-specific death rates would continue to decline at a steady rate through 2003. The projected age-specific death rates for 2003 under the declining mortality assumption indicate substantial reductions for each age group in contrast to constant death rates under the other mortality assumption. Separate projections were made for men and women by 5-year age groups (table II).
The greater part of the decline in mortality between 1953 and 1978 occurred during the latter part of that period. The death rate for the total population declined by less than 1 per-cent between 1957 and 1966, whereas it decreased by more than 5 percent between 1967 and 1976. If this more rapid re
duction continues, then a projected decrease of 11 percent in the death rate for all ages combined can be expected between 1978 and 2003 (table 1).
A comparison of projected changes in m~rtality for 1953– 78 with those for 1978–2003 indicates more rapid reductions in future mortality than those experienced in the recent historic past and unprecedented low levels of mortality for the Nation by 2003. Whether the assumption of continuing declining mortality is likely to be realized is not known. However, it is indicative of possible improvements in mortality that might be experienced during the projection period. By contrast, the constant mortality assumption represents the most conservative projection of possible changes in aggregate mortality levels because it is highly unlikely that ag~specific mortality in 2003 would be greater than corresponding mortality levels in 1978.
Procedure
For the constant mortality assumption, the set of age-sex-specific death rates for 1976, as published in Vital Statistics of the United States, Volume II, Mortality, 4 is assumed to prevail for each of the years during the projection period 1978-2003. For example, the death rate for men 65–69 years of age in 1976 was 3,586.9 deaths per 100,000 population (table II). This death rate is used for each year through 2003. The same is true of the death rates for each of the other age-sex groups in the population. The projected death rate for the total population is a weighted average of the death rates for men and women. For any age group, this is obtained by using the following equation
rmpm + rfpf~.+n= Pm+Py
where r{~+fl = death rate for total population in specified age group,
r~ = death rate for male population in specified age group,
pm = male population in specified age group,
~= death rate for female population in specified age group, and
p~ = female population in specified age group.
For the declining mortality assumption, the set of age-sex-specific death rates is assumed to decrease at a uniform rate during the projection period 1978-2003, based on the average
5

�
annual rate of decrease experienced during 1966–76. Again, taking men 65–69 years of age as an example, the death rate for 1976 was 3,586.9 per 100,000 population. This figure represents a reduction of 14 percent during the period 1966– 76, or an average annual reduction of 1.5 percent. The projection assumes that this average annual reduction will continue every year through 2003. Compounding the annual rate of decline of 1.5 percent through 2003 would result in an overall reduction of 33.5 percent. A 33.5 percent reduction for men 65-69 years of age from the rate of 3,586.9 in 1976 would be a rate of 2,384.5 in 2003. This extrapolation pr~ cedure is repeated for each 5-year age group for men and women separately to project the age-specific death rates for 2003 under the declining mortality assumption (table II).
Because the 1978 final mortality data were unavailable at the time initial calculations were made, the death rates used in this report for 1978 were estimates. A comparison of projected and final death rates for 1978, shown in table III, indicates a close correspondence between the two sets of figures.
Life expectancy
Description
Lfe expectancy is the average number of years that a group of newborn infants would live if they were to experience throughout life the age-specific death rates prevailing in the calendar year of their births. For 1976, the expectation of life at birth in this country was 72.8 years (figure 2). For 1978, estimated life expectancy was 73.3 years for the total population 69.4 years for men and 77.3 years for women (table 2). Corresponding final life expectancy figures were 73.3 years,
85
80
75
f m
,*.8. + 5! c 70 �=.. m.89s*”~**
.- •**.mm.~~’9m**
% <
65
60
0 111111111111111111111
69.5 years, and 77.2 years, respectively. Although the greatest gains in life expectancy occurred in the first half of this century, life expectancy has increased considerably in recent years. In fact, by 1978 life expectancy was 4.5 years higher than it was a quarter of a century ago. The tempo of improvement has accelerated as well. During the period 1957-67, 1 year was added to the number of years that a child born in the United States could expect to live; during 1968–78, the gain was more than 3 years.
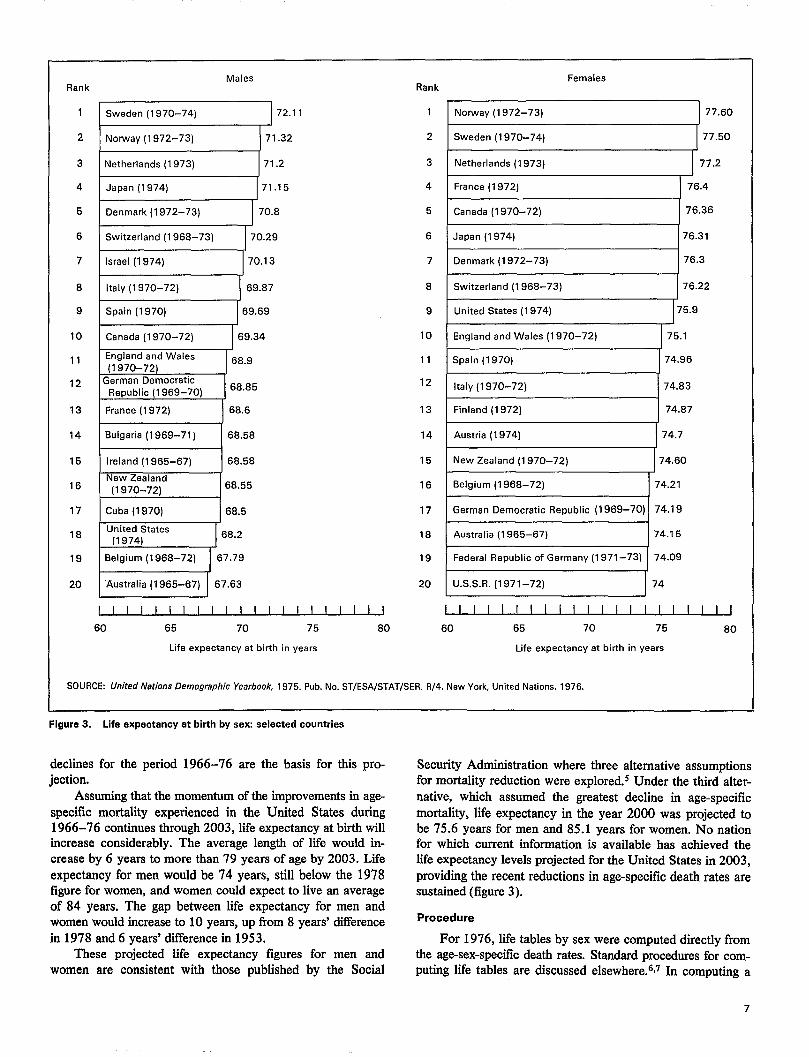
Considerable room remains for improving life expectancy in this country. Compared with other industrialized nations, the United States ranked 18th in 1974 for men and 9th for women (figure 3). The difference in life expectancy between men in the United States and men in Sweden, the first ranked nation, was almost 4 years.
Projected death rates for 2003 can be used to determine the projected life expectancy in that year. Because age-specific death rates remain constant under the constant mortality assumption, probabilities of dying in an age interval also remain constant. Accordingly, life expectancy in 2003 would remain unchanged. This reinforces the concept of the constant mortality assumption as the “lower limit” of future mortality
changes, because some increase in life expectancy by 2003 can be expected based on the observed historic pattern in the United States.
Declining age-specific death rates imply increases in life expectancy. The projected increase in life expectancy shown in table 2 results from the projected reductions in age-specific death rates under the declining mortality assumption. The projected increase during 1978–2003 is greater than the ob served increase during 1953–78 because the sharp mortality
Femala
Tota I
Mate
11111111111111111
1950 1960 1970 1980 1990 2000 2010
Year
Figure 2. Life expectancy United States, 1963-2003
6
1
2
3
4
5
6
7
8
9
10
11
12
13
14
15
16
17
18
19
20
Males Females Rank
1 Sweden (1 970-74)
2 Norway (1 972-73)
3 Netherlands (1 973)
4 Japan (1 974)
5 Denmark (1 972-73)
6 Switzerland (1 968-73)
Rank
72.11
71.32
71.2
71.15
70.8
70.29
70.13
69.87
69.69
Norway (1 972-73)
Sweden (1 970-74)
Netherlands (1 973)
France (1 972)
Canada (1 970-72)
Japan (1 974)
Denmark (1 972-73)
Switzerland (1 968-73)
United States (1 974)
England and Wales (1 970-72)
Spain (1 970)
Italy (1 970-72)
Finland (1 972)
Austria (1 974)
New Zealand (1 970-72)
Belgium (1 968-72)
German Democratic Republic
Australia (1 965–67)
Federal Republic of Germany
U.S.S.R. (1 971-72)
77.60
77.50
77.2
76.4
76.36
76.31
76.3
76.22
75.9
75.1
74.96
74.83
74.87
74.7
74.60
74.21
(1 969-70) 74.19
74.15
(1 971-73)
7 Israel (1 974)
8 Italy (1 970-72)
9 Spain (1 970)
10 Canada (1 970-72)
11 England and Wales (1 970-72)
12 German Democratic Republic (1 969-70)
13 France (1 972)
14 Bulgaria (1 969-71)
15 Ireland (1 965-67)
New Zealand 16 (1 970-72)
17 Cuba (1 970)
United States18
(1974)
19 8elgium (1 968-72)
20 Australia (1 965-67)
69.34
68.9
68.85
68.6
68,58
68.58
68.55
68.5
68.2
I I I I I I I I I I I I I I I I I I I
60 65 70 75
Life expectancy at birth in years
RJ4. New York, United Nationa, 1976.
I I I I I I I I I I I I I I I I I I I I 60 65 70 75 80
Life expectancy at birth in years
SOURCE: United Nations Demographic Yearbook, 1975. Pub. No. ST/ESA/STAT/SER.
Figure 3. Life expectancy at birth by aex selacted countries
declines for the period 1966–76 are the basis for thk projection.
Assuming that the momentim of the improvements in age-specific mortality experienced in the United States during 1966-76 continues through 2003, life expectancy at birth will increase considerably. The average length of life would in-crease by 6 years to more than 79 years of age by 2003. Life expectancy for men would be 74 years, still below the 1978 figure for women, and women could expect to live an average of 84 years. The gap between life expectancy for men and women would increase to 10 years, up from 8 years’ difference in 1978 and 6 years’ difference in 1953.
These projected life expectancy figures for men and women are consistent with those published by the Social
Security Adrninistration where three alternative assumptions for mortality reduction were explored.s Under the third alter-native, which assumed the greatest decline in age-specific mortality, life expectancy in the year 2000 was projected to be 75.6 years for men and 85.1 years for women. No nation for which current information is available has achieved the life expectancy levels projected for the United States in 2003, providing the recent reductions in age-specific death rates are sustained (figure 3).
Procedure
For 1976, life tables by sex were computed directly from the age-sex-specific death rates. Standard procedures for computing life tables are discussed elsewhere.G,7In computing a
7
80

life table, age-specific death rates are initially converted into probabilities of dying. Probabilities of dying are then used to compute all other life table functions, including life expectancy and age-specific survival probabilities. The survival probabilities are used in the projection rdgorithm to obtain population estimates for men and women separately for each year during the projection period 1976–2003.
Calculation of probabilities of dying is most easily done when death rates by 5-year age intervals are first interpolated to provide estimated death rates for single years of age. A variety of interpolation procedures can be used. Life”tables used in this report were constructed by the Social Security Administration, which used a Whittaker-Henderson type B graduation to estimate death rates for single years of ages Given death rates by single years of age, the probability of dying betwen ages x and x + 1 is estimated by the equation
4.= 1 +m;Jz
where qx = probability of dying in age interval (x,x+1) mx = estimated death rate for age x.
For projecting population, the relevant information is the complement of qx or the probability of survival, denoted by
P.= 1 – 9.. Thus, P. is the probability that a person x years of age will survive to x + 1 years of age.
Because age-specific death rates remain unchanged under
the constant mortality assumption, survival probabilities for each year 1977–2003 are the same as those for 1976, thus for men 65 years of age in 1976, the probability of surviving to 66 years of age in 1977 is 1 – 0.03052 = 0.96948. The probability that men 65 years of age in 2003 will survive to 66 years of age in 2004 remains 0.96948.
Under the declining mortality assumption, age-specific death rates projected to 2003 are interpolated to single year of age death rates and then converted into single year of age survival probabilities. Linear interpolation of single year survival probabilities between 1976 and 2003 was used to obtain survival probabilities for each year 1977–2002. For example, the survival probability for men 65 years of age is 0.96948 in 1976 and 0.98024 in 2003. To estimate the survival probability for an intervening year, say 1985, the following linear interpolation is employed:
(1985 – 1976)( Rate2m~ – Ratelg7JRatelgg5 = Ratelg76 + 2003 – 1976
9(0.98024 – 0.96948) = 0.96948 + 27
= 0.97307
Thus, the estimated survival probability for men 65 years of age in 1985 is 0.97307. Other interpolation methods could be used, but they would not result in survival probabilities that differ substantially from those used.
8
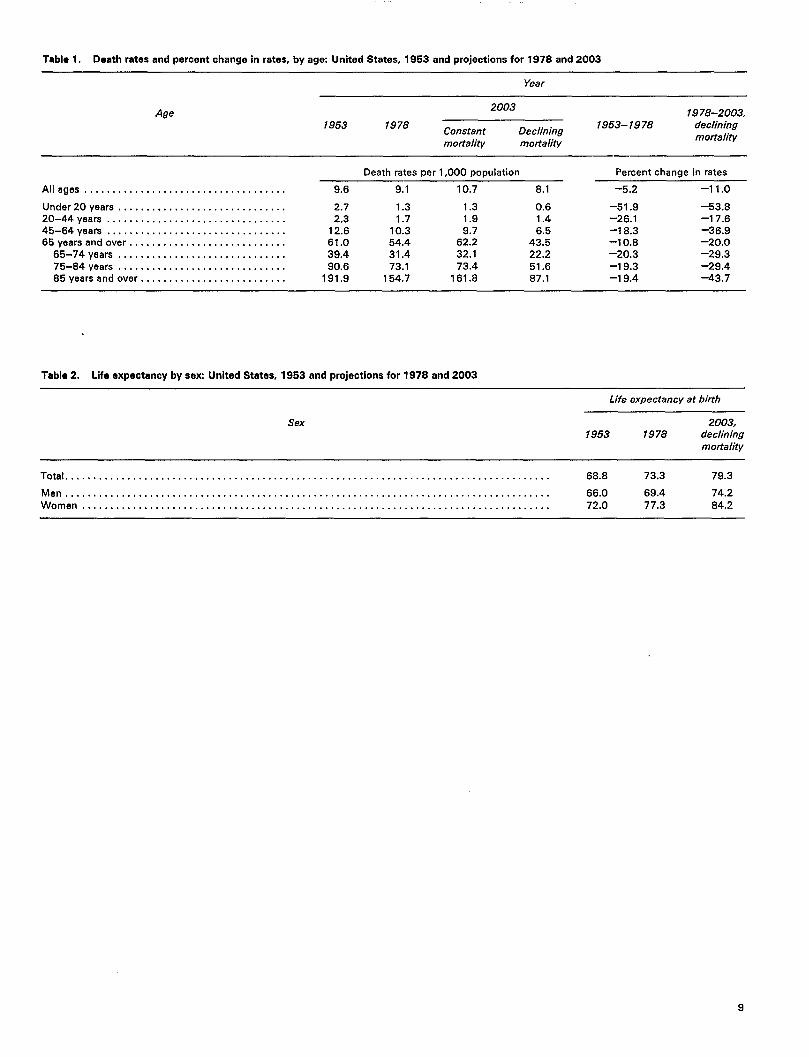
Table 1. Deeth retes and percent change in rates, by egc United Statea, 1953 and projections for 1978 and 2003
Year
Age
Ail ages, ,, . . . . . . . . . . . . . . . . . . . . . . . . . . . . . . . . .
Under 20 years . . . . . . . . . . . . . . . . . . . . . . . . . . . . . . 20-44 years . . . . . . . . . . . . . . . . . . . . . . . . . . . . . . . . 45-64 years . . . . . . . . . . . . . . . . . . . . . . . . . . . . . . . . 65 years and over . . . . . . . . . . . . . . . . . . . . . . . . . . . .
66-74 years................,.. . . . . . . . . . . . 75-84 years . . . . . . . . . . . . . . . . . . . . . . . . . . . . . . 85yeara end over . . . . . . . . . . . . . . . . . . . . . . . . . .
2003 1978-2003,
1953 1978 constant Declining
mortality mortality
1953–1978 declining mortality
Death rates per 1,000 population Percent change in rates
9.6 9.1 10.7 8.1 -5.2 -11.0
2.7 1.3 1.3 0.6 -51.9 -53.8
2.3 1.7 1.9 1.4 -26.1 -17.6 12.6 10.3 9.7 6.5 -18.3 -36.9 61.0 54.4 62.2 43.5 -10.8 –20.0
39.4 31.4 32.1 22.2 –20.3 –29.3
90.6 73.1 73.4 51.6 -19.3 -29.4 191.9 154.7 161.8 87.1 -19.4 -43.7
Table2. Ufeexpectancy bysex United States, 1953and projections forl978and2OO3
Life expectancy at birth
Sex 2003, 1953 1978 declining
mortality
Total ., . .,, . ., . . . . . . . . . . . . . . . . . . . . . . . . . . . . . . . . . . . . . . . . . . . . . . . . . . . . . . . . . . . . . . . . . . . . . . . . . . . . . 68.8 73,3 79.3
Men . . . . . . . . . . . . . . . . . . . . . . . . . . . . . . . . . . . . . . . . . . . . . . . . . . . . . . . . . . . . . . . . . . . . . . . . . . . . . . . . . . . . . . 66.0 69.4 74.2
Women, . . . . . . . . . . . . . . . . . . . . . . . . . . . . . . . . . . . . . . . . . . . . . . . . . . . . . . . . . . . . . . . . . . . . . . . . . . . . . . . . . . 72.0 77.3 84.2
9
~.y+:+................:.:.........................................................:.:.::::........................:.:.................::::.:.:+:+:.......................................
...............
...............
...............
.............................................
.:.:.:0
..............................
...............
...............
Chapter 4 Population projections
Description
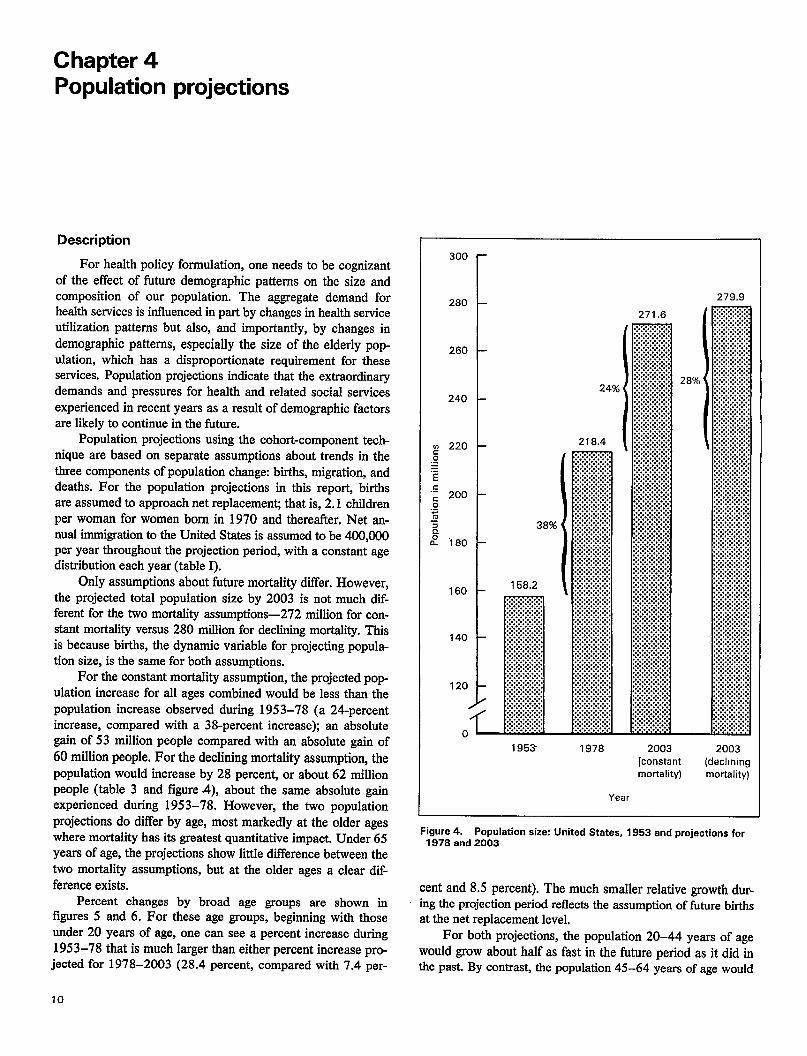
For health policy formulation, one needs to be cognizant of the effect of future demographic patterns on the size and composition of our population. The aggregate demand for health services is influenced in part by changes in health service utilization patterns but also, and importantly, by changes in demographic patterns, especially the size of the elderly pop ulation, which has a disproportionate requirement for these services. Population projections indicate that the extraordinary demands and pressures for health and related social services experienced in recent years as a result of demographic factors are likely to continue in the future.
Population projections using the cohofi-component technique are based on separate assumptions about trends in the three components of population change births, migration, and deaths. For the population projections in this repo~ births are assumed to approach net replacement that is, 2.1 children per woman for women born in 1970 and thereafter. Net annual immigration to the United States is assumed to be 400@O0 per year throughout the projection period, with a constant age distribution each year (table I).
Only assumptions about future mortality differ. However, the projected total population size by 2003 is not much different for the two mortality assumptions-272 million for cOnstant mortality versus 280 million for declining mortality. This is because births, the dynamic variable for projecting population size, is the same for both assumptions.
For the constant mortality assumption, the projected population increase for all ages combined would be less than the population increase observed during 1953–78 (a 24-percent increase, compared with a 38-percent increase); an absolute gain of 53 million people compared with an absolute gain of 60 million people. For the declining mortality assumption, the population would increase by 28 percent or about 62 million people (table 3 and figure .4), about the same absolute gain experienced during 1953–78. However, the two population projections do differ by age, most markedly at the older ages where mortality has its greatest quantitative impact. Under 65 yearsof age,the projections show little difference between the two mortality assumptions, but at the older ages a clear difference exists.
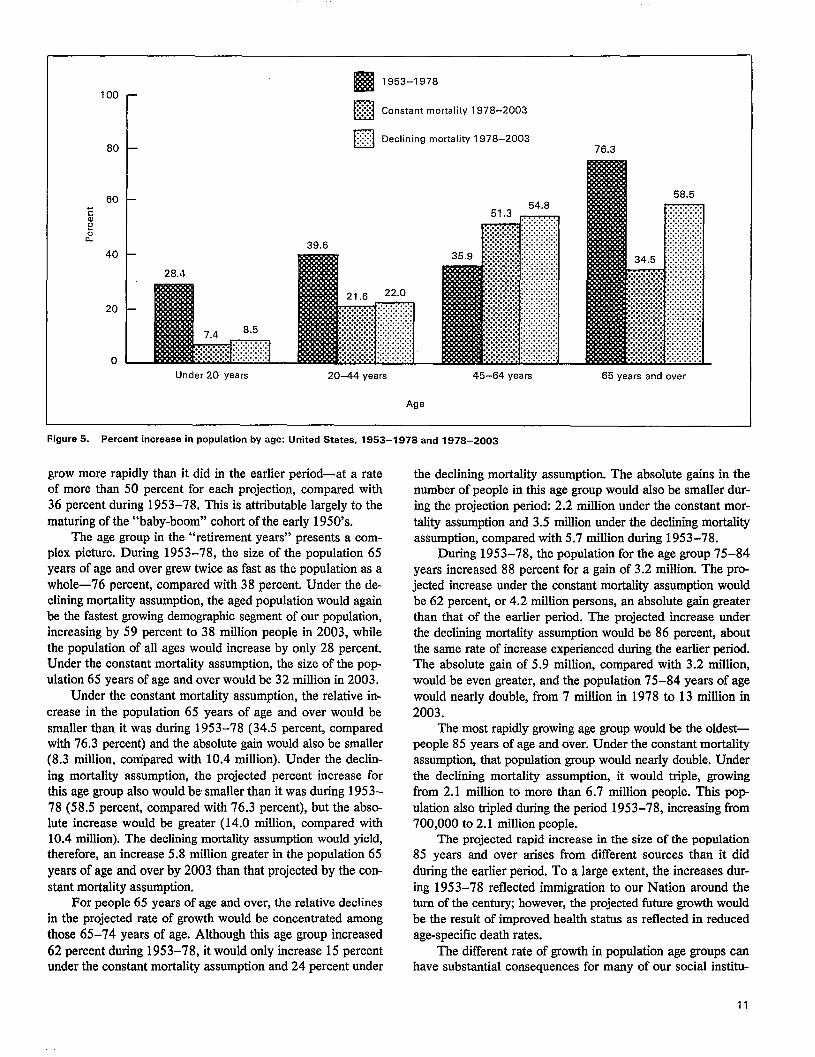
Percent changes by broad age groups are shown in figures 5 and 6. For these age groups, beginning with those under 20 years of age, one can see a percent increase during 1953–78 that is much larger than either percent increase pr~ jetted for 1978–2003 (28.4 percent, compared with 7.4 per-
300
280
260
240
w 220c .-o = E
“: 200 .-0
5 3
!3 L “180
160
140
120
//
o
279.9
271.6
28%24% (
218.4
38%
.:::::::::::::::::.:+:.:158,2 ..:0:,..:.:.:.:.:.:.:.:.
.::::::::::::::::
.+:+:.:.7..:.:.:.:.:.:.:.:.:.:::::::::::::::::~$~:
.:.:.:.:.:.:.:.:.............:.:.:.:.:.:.:.:.:.:.:.::.:.:.:.:.:.:.:.:.:.........:.:.:.:.:.:.:.:.
:.:.:.:.:.:.:.:O ..
. . . . . . . . . . . . . . .. .
. . . . . . . . . . . . . . .. ........ . :::::::::::::::: :.:.:.:.:.:.:.:.a... . . . . . . . . . . . . . .
1953 1978 2003 2003(constant (decllmng
mortality) mortality)
Year
Figure 4. Population size: United Statea, 1953 and projections for 1978 and 2003
cent and 8.5 percent). The much smaller relative growth during the projection period reflects the assumption of fiture births at the net replacement level.
For both projections, the population 20–44 years of age would grow about half as fast in the future period as it did in the past. By contras~ the population 45–64 years of age would
��1953-1978IEiI!il
100 � �~ Constant mortality 1978-2003
Declining mortality 1978-2003 80 E3 76.3
60 [
39.6
20
7.4 8’5
0 L .. . . . ..
. . . .. . . .. .. . . .. .. . . .. .. . . .. .. . . .
..
...
.
.. .. ...
.
.. .. ...
.
.. .. ...
.
.. .. .. .
.
.. .. ...
.
... .. ...
.
.. . .
20-44 years 45-64 years 65 years and overUnder20 yeara
Age
Figure 5. Percent increase inpopulation byage: United States, 1953-1978
grow more rapidly than it did in the earlier period-at a rate of more than 50 percent for each projection, compared with 36 percent during 1953–78. This is attributable largely to the maturing of the “baby-boom” cohort of the early 1950’s.
The age group in the “retirement years” presents a complex picture. During 1953–78, the size of the population 65 years of age and over grew twice as fast as the population as a whole—76 percent, compared with 38 percent, Under the declining mortality assumption, the aged population would again be the fastest growing demographic segment of our population, increasing by 59 percent to 38 million people in 2003, while the population of all ages would increase by only 28 percent. Under the constant mortality assumption, the size of the population 65 years of age and over would be 32 million in 2003.
Under the constant mortality assumption, the relative in-crease in the population 65 years of age and over would be smaller than it was during 1953–78 (34.5 percent, compared with 76.3 percent) and the absolute gain would also be smaller (8.3 million, compared with 10.4 million). Under the declining mortality assumption, the projected percent increase for this age group also would be smaller than it was during 1953– 78 (58.5 percent, compared with 76.3 percent), but the absolute increase would be greater (14.0 million, compared with 10.4 million). The declining mortality assumption would yield, therefore, an increase 5.8 million greater in the population 65 years of age and over by 2003 than that projected by the constant mortality assumption.
For people 65 years of age and over, the relative declines in the projected rate of growth would be concentrated among those 65-74 years of age, Although this age group increased 62 percent during 1953-78, it would only increase 15 percent under the constant mortality assumption and 24 percent under
and1978–2003
.,. . . . ... ..-. . . . . . .. me aecmung mortanty assumpuon. 1ne amsomte gains m me number of people in this age group would also be smaller during the projection period: 2.2 million under the constant mortality assumption and 3.5 million under the declining mortality assumption, compared with 5.7 million during 1953–78.
During 1953–78, the population for the age group 75–84 years increased 88 percent for a gain of 3.2 million. The projected increase under the constant mortality assumption would be 62 percent, or 4.2 million persons, an absolute gain greater than that of the earlier period. The projected increase under the declining mortality assumption would be 86 percent, about the same rate of increase experienced during the earlier period. The absolute gain of 5.9 million, compared with 3.2 million, would be even greater, and the population 75-84 years of age would nearly double, from 7 million in 1978 to 13 million in 2003.
The most rapidly growing age group would be the oldest— people 85 years of age and over. Under the constant mortality assumption, that population group would nearly double. Under the declining mortality assumption, it would triple, growing from 2.1 million to more than 6.7 million people. This pop ulation also tripled during the period 1953–78, increasing from 700,000 to 2.1 million people.
The projected rapid increase in the size of the population 85 years and over arises from different sources than it did during the earlier period. To a large extent, the increases during 1953–78 reflected immigration to our Nation around the turn of the centu~, however, the projected future growth would be the result of improved health status as reflected in reduced age-specific death rates.
The different rate of growth in population age groups can have substantial consequences for many of our social institu-
11

220 213.2
200
180
El 1953-1978
160
�. . .
~. Constant mortality 1978-2003
. . . 140 ::::::: Declining mortality 1978–2003 .......El
120 Eal :
2 100
80 76.3
61.6
60
40
20
0 65 years and over 65-74 years
Figure 6. Projected percent increase in older. population by age United
tions, particularly in terms of dependency. The most slowly growing age group will be people under 20 years of age, and their proportionate share of the total population will diminish measurably (table 4). In 1953, they accounted for more than one-third of the population; by 2003, their share may have declined to slightly more than one-fourth of the population.
The group that will show the greatest increases will be the aged (table 4). People 65 years of age and over, who accounted for 9 percent of the population in 1953 and 11 percent of the population in 1978, would represent 12 percent of the population in 2003 under the constant mortality assumption and 14 percent of the population under the declining mortality assumption. The proportion of the population 75 years of age and over, which was 2.7 percent in 1953 and 4.2 percent in 1978, would grow to 5.5 percent under the constant mortality assumption and to 7.0 percent under the declining mortality assumption.
Procedure The population projection begins with the estimated pop
ulation for 1976,9 which is then projected by age and sex
75-84 years 85 years and over
Age
States, 1953-1978 and 1978-2003
through year-t~year adjustments that account for births, deaths, and net surviving immigrants. For each year, the projected population at age O years is derived by applying the survival probability at age O to the estimated number of new births and then adding net surviving immigrants for that age. The sex distribution of new births is assumed to remain constant at 105 males per 100 females. The projected population at age x years for ages 1 year and over is derived from the previous year’s population at age x – 1 years by applying the projected survival probabilities and then adding the net number of surviving immigrants for each age and sex.
For example, under the constant mortality assumption, the survival probabilities for 1976 are assumed to apply for each year 1976–2003. When the survival probability of 0.96948 is applied to the estimated 795,000 men 65 years of age in 1976, there results 770,737 survivors to 66 years of age in 1977. A constant number of net surviving immigrants is added to get the estimated population 66 years of age in 1977. Projecting the population under the declining mortality assumption is procedurally identical except that a different set of survival probabilities is used.
12
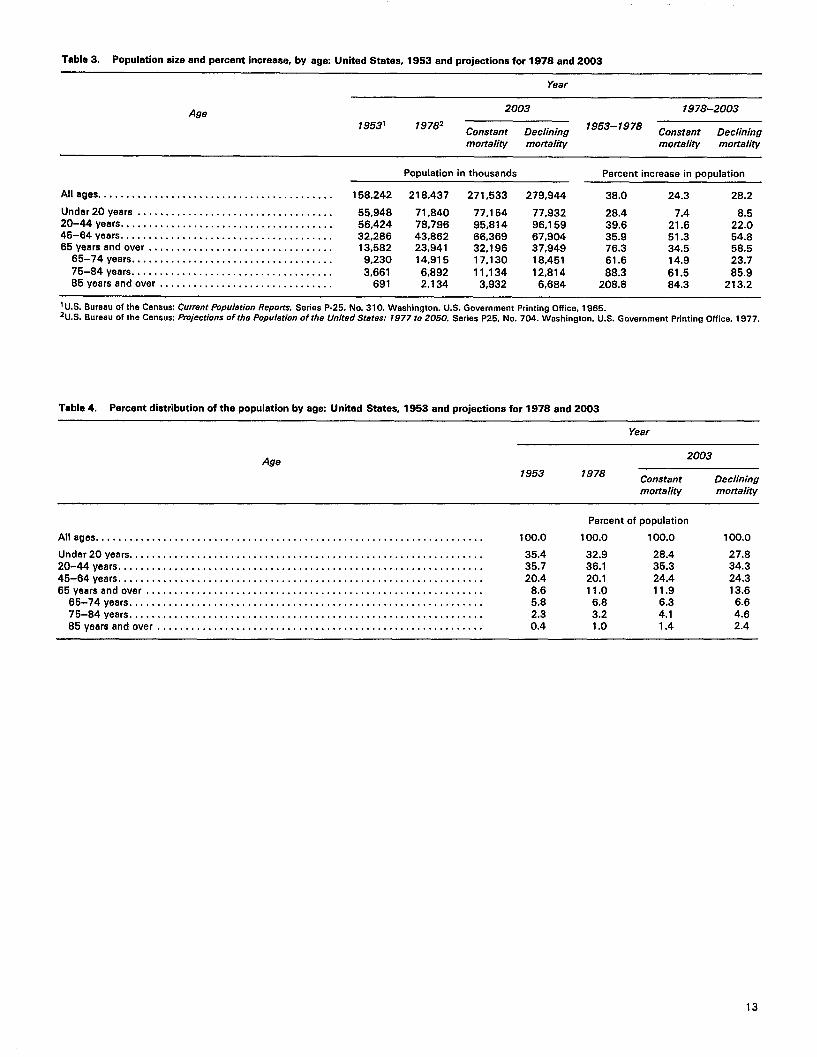
Table 3. Population size and percant increaae, by age United Statas, 1953 and projections for 1978 and 2003
Year
2003 1978-2003Age
19531 19782 1953-1978Constant Declining Constant Declining mortality mortality mortality mortelity
Population in thouaanda Percent increase in population
All agas . . . . . . . . . . . . . . . . . . . . . . . . . . . . . . . . . . . . . . . . . . 158,242 218,437 271,533 279,944 38.0 24.3 28.2
Undar20 years . . . . . . . . . . . . . . . . . . . . . . . . . . . . . . . . . . . 55,948 71,840 77,154 77,932 28.4 7.4 8.5 20-44 yaars ., ..,,,,. . . . . . . . . . . . . . . . . . . . . . . . . . . . . . 56,424 78,796 95,814 86,159 39.6 21.6 22.0 46-64 years . . . . . . . . . . . . . . . . . . . . . . . . . . . . . . . . . . . . . . 32,286 43,862 66.369 67,904 35.9 51.3 54.8 65years andovar . . . . . . . . . . . . . . . . . . . . . . . . . . . . . . . . . 13,582 23,841 32,196 37,949 76.3 34.5 58.5
65-74 yaars. . . . . . . . . . . . . . . . . . . . . . . . . . . . . . . . . . . . 9,230 14,915 17,130 18,451 61.6 14.9 23.7 75-84 years . . . . . . . . . . . . . . . . . . . . . . . . . . . . . . . . . . . . 3,661 6,892 11,134 12,814 88,3 61.5 85.9 85years andovw, . . . . . . . . . . . . . . . . . . . . . . . . . . . . . . 691 2,134 3,932 6,684 208.8 84.3 213.2
‘U.S. Bureeuof the Censux Currerrt r%pu/atiorr Repcms,Series P-25, No,310. Washington. U.S. Government Printing Office, 1965.2U.S. Bureau of the Censux Projections of the Population of the United Statas: 1977 t02050. Saries P25, No. 704. Washington. U.S. Government Printing Office, 1977.
Tabla 4. Parcent distribution ~fthepopulation by age United Stataa, 1953 andprojactions for1978and 2003
Year
2003Age
1953 1978 Constant Declining mortality mortality
Percent of population
All agea . . . . . . . . . . . . . . . . . . . . . . . . . . . . . . . . . . . . . . . . . . . . . . . . . . . . . . . . . . . . . . . . . . . . . 100.0 100.0 100.0 100.0
Undar20 years . . . . . . . . . . . . . . . . . . . . . . . . . . . . . . . . . . . . . . . . . . . . . . . . . . . . . . . . . . . . . . . 35.4 32.9 28.4 27.8 20-44 years ,,, ,,, ..,,, . . . . . . . . . . . . . . . . . . . . . . . . . . . . . . . . . . . . . . . . . . . . . . . . . . . . . . 35.7 36.1 35.3 34.3 45-64 years . . . . . . . . . . . . . . . . . . . . . . . . . . . . . . . . . . . . . . . . . . . . . . . . . . . . . . . . . . . . . . . . . 20.4 20.1 24.4 24.3 65 years and over, . . . . . . . . . . . . . . . . . . . . . . . . . . . . . . . . . . . . . . . . . . . . . . . . . . . . . . . . . . . 8.6 11.0 11.9 13.6
65-74 yaars ,,, ,, . . . . . . . . . . . . . . . . . . . . . . . . . . . . . . . . . . . . . . . . . . . . . . . . . . . . . . . . . . 5.8 6.6 6.3 6.6 75-84 years . . . . . . . . . . . . . . . . . . . . . . . . . . . . . . . . . . . . . . . . . . . . . . . . . . . . . . . . . . . . . . . 2.3 3.2 4.1 4.6 85yaars and over.,.,..,,,.....,.. . . . . . . . . . . . . . . . . . . . . . . . . . . . . . . . . . . . . . . . . . 0.4 1.0 1.4 2.4
13

Chapter 5 Health sector projections
The focus of this report is on projections of future population size and age distributions. Future trends in other factors that affect utilization of health care services and expenditures for those services are not addressed. Changes in level of morbidity and mortality, in therapies, and in the availability and costs of care will contribute to utilization levels and pat-terns in 2003, just as change in population will. Some of these factors may increase utilization, while others may decrease i~ however, the projected population changes alone will have a significant impact on utilization and consequently on expenditures. Because older people as a group tend to have more health problems than younger people, the impact of an aging population would be greater than the projected growth might suggest. This impact is examined as it relates to people with limitation of activity resulting from chronic conditions, the utilization of health care services, and health care expenditures. Two other studies that project health care expenditures under less restrictive assumptions than are used for this report are also briefly discussed.
Limitation of activity
Description
Limitation of activity resulting from chronic conditions is a measure of health status regularly reported in the National Health Interview Survey. If the current rates of activity limitation are applied to the projected populations for 2003, the number of activity-limited people will rise from 31 million in 1978 to approximately 42–46 million in 2003, an increase of 36 to 47 percent (table 5 and figure 7). Population increase will be only 24 percent to 28 percent (table 3). The difference between the rates of growth in population and in the activity-Iimited population, 12 to 19 percent, is a measure of the effect of the aging population.
No matter which mortality assumption is used, the age distribution of people with lirnhation of activity will not change much between 1978 and 2003; however, the percent increase by age will be larger at the older ages and will be even larger if mortality rates decline. For example, among people under 20 years of age, the increase would be 7 to 9 percent, but for those 65 years of age and over, the increase would be 38 per-cent if mortality rates remain constant and 64 percent if mortality rates delcine.
Although constant age-specific rates are assumed for the number of people limited in activity per 1,000 population, an aging population would result in an increase in the overall rate
•1 Under 20 years
�~~ 20-44 years
�/..O. W. 45–64 years
50,000 Ml
65 years and over
45,811
42,492 I 6.3%
m40,000
31,212
m
10,000
0 1978 2003 2003
(constant (declmmg mortality) mortality)
Year
Figure 7. Projected number of persons with limitation of activity due to chronic conditions and percent distribution by age: United States, 1978 and 2003
of from 9 to 15 percent. Compared with a rate of 143 limited people per 1,000 population in 1978, the corresponding rates in 2003 would be 156 per 1,000 population under the constant mortality assumption and 164 per 1,000 under the declining mortality assumption.
14
I
��� �
Procedure
Theprocedure for projecting the number of people with limitation of activity can be illustrated by using people under 20 years of age from table 5. In the base period, there were 37,2 people with limitation of activity per 1,000 population in this age group, Multiplying this figure by the projected population in 2003 of 77,2 million people, under the constant mortality assumption, gives a projected number with limitation of activity of almost 2.9 million people. The same procedure is followed to project the number of people with limitation of activity for other age groups and under the declining mortality assumption.
The application of this procedure for other age groups using the rate of activity and projected population in this re-port may not produce exactly the number of people with limitation of activity projected in table 5. This occurs because the calculations are based on a larger number of age groups than shown. For example, for people 65 years of age and over, rates and numbers for 65 to 74 years of age and 75 years of age and over are employed. The effect of using age-specific rates of activity limitation for people 65 years of age and over is to produce a projected number of people with limitation of activity in 2003 somewhat larger than would be estimated from the average rate shown for people 65 years of age and over.
Utilization of health services
Description
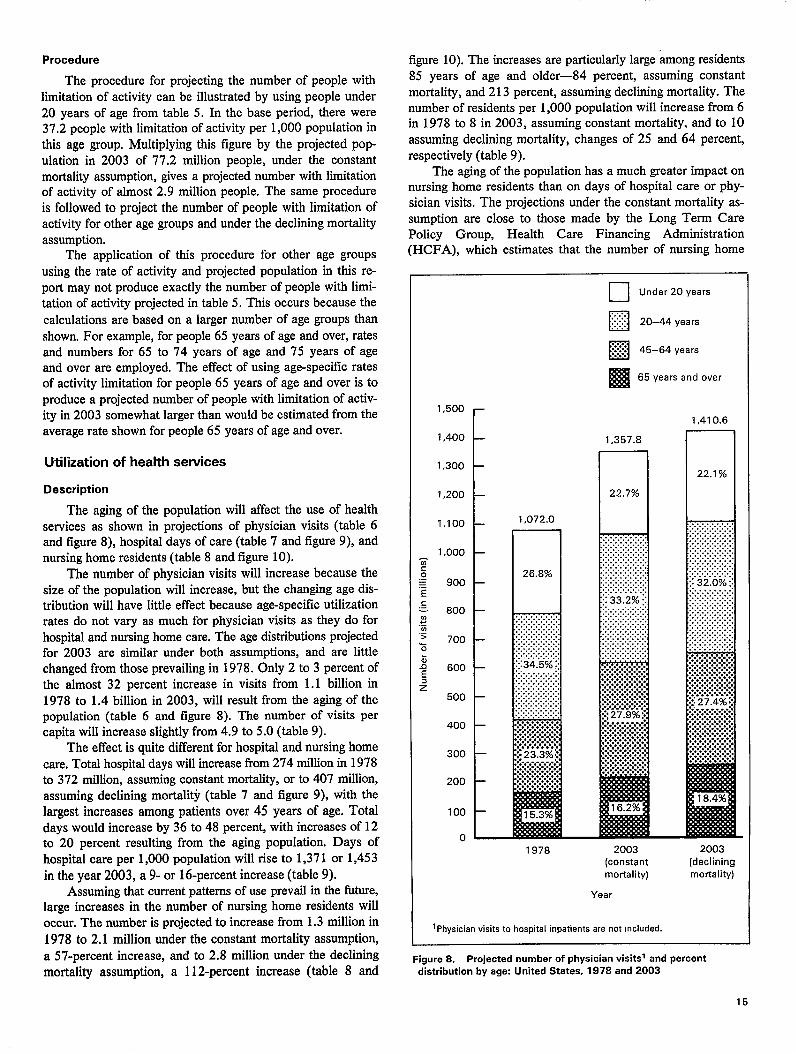
The aging of the population will affect the use of health services as shown in projections of physician visits (table 6 and figure 8), hospital days of care (table 7 and figure 9), and nursing home residents (table 8 and figure 10).
The number of physician visits will increase because the size of the population will increase, but the changing age distribution will have little effect because age-specific utilization rates do not vary as much for physician visits as they do for hospital and nursing home care. The age distributions projected for 2003 are similar under both assumptions, and are little changed from those prevailing in 1978. Only 2 to 3 percent of the almost 32 percent increase in visits from 1.1 billion in 1978 to 1.4 billion in 2003, will result from the aging of the population (table 6 and figure 8). The number of visits per capita will increase slightly from 4.9 to 5.0 (table 9).
The effect is quite different for hospital and nursing home care. Total hospital days will increase from 274 million in 1978 to 372 million, assuming constant mortality, or to 407 million, assuming declining mortality (table 7 and figure 9), with the largest increases among patients over 45 years of age. Total days would increase by 36 to 48 percent, with increases of 12 to 20 percent resulting from the aging population. Days of hospital care per 1,000 population will rise to 1,371 or 1,453 in the year 2003, a 9- or 16-percent increase (table 9).
Assuming that current patterns of use prevail in the fiture, large increases in the number of nursing home residents will occur. The number is projected to increase from 1.3 million in 1978 to 2.1 million under the constant mortality assumption, a 57-percent increase, and to 2.8 million under the declining mortality assumption, a 112-percent increase (table 8 and
figure 10). The increases are particularly large “&nongresidents 85 years of age and older—84 percent, assuming constant mortality, and 213 percent, assuming declining mortality. The number of residents per 1,000 population will increase from 6 in 1978 to 8 in 2003, assuming constant mortality, and to 10 assuming declining mortality, changes of 25 and 64 percent, respectively (table 9).
The aging of the population has a much greater impact on nursing home residents than on days of hospital care or physician visits. The projections under the constant mortality assumption are close to those made by the Long Term Care Policy Group, Health Care Financing Administration (HCFA), which estimates that the number of nursing home
n Under 20 years
~;~ 20-44 years
�~ 45-64 years
� 65 years and over
1,500 r 1,410.6
1,400 1.357.8
1,30022.1 %
1,200 22.7%1 n 1,100 1,072.0
1,000 g o 26.8% = 900= E c = 800 1In ................ e ................................~ ................> 700 ........................ E ..
.............................. ................
& . . 600 :34.5%::
e .......................... . . . . . . . . $ ........................
500 ........................................
......................................................... . . . . . . .400 ................:.:.:.:.:.:.:.:. . . . . . . . . ................:.”.”.”.”.”+
300 :-m%{ :.:.:.:.:.:.:.:. . . . . . . . .................
200 ................................
100
()~ 1978 2003
(constant (declining mortality) mortality)
Year
1Physician visits to hospital inpatients are not included.
Figure 8. Projected number of physician visitsl and percant
distribution by age: Unitad States; 1978 and 2003
15

� u Under 20 years
. . ........ ~::::: 20-44 years
45–64 years�~.j
I!a65 years and over 406.8
7.4% 372.0 n
8.0% n
274.1
m
1978 2003 2003
(constant (declining mortality) mortality)
Yeal
Figure 9. Projected days of care in non-Federal short-stay hospitals and percent distribution by age United States, 1978 and 2003
residents will increase to almost 2 million people by the year 2000.10 However, the HCFA study projects that it will take until the year 2030 before the number of nursing home residents will approach 3 million people, a figure reached by 2003 under the declining morality assumption.
Similar trends in medical care use have also been pro jetted by Louise Russell. 1] Assuming constant age and sex-specific rates of use and looking forward to the year 2050, Russell projects that the aging population will push per capita use of hospitals and nursing homes steadily higher, although physician visits will be largely unaffected by the change in age structure.
Procedure
The procedure for projecting the number of physician visits, hospital days, and nursing home residents is analogous to that described for people with limitation of activity. The
u Under 65 years
. . . ::::::: 65-74 years.......El
. . . ~~ 75-84 years a
85 yea rs and over El
2,804.4
7.8% n
2.072.6
1 0.4%
;..:... .. ... . .. ... . .. .... ..H1:::::1 2.0%
1,322.2
1978 2003 2003
(constant (declining mortality) mortality)
Year
Figure 10. Projected number of residents in nursing homas and percent distribution by age: United Statea, 1978 and 2003
number per 1,000 people in the base period is multiplied by the projected population in 2003, For example, people under 20 years of age experience 4,000 physician visits per 1,000 people. Multiplying this by the projected population of 77.2 million people, assuming constant mortality, gives a projected number of physician visits of 308.6 million (table 6). The projections for hospital care and nursing home residents are calculated in a similar manner.
As was the case for people with limitation of activity, the application of thk procedure to the data in this report may not reproduce exactly the projected values in table 6–8 because the calculations are based on a larger number of age groups than shown. For example, the effect of using age-specific rates per 1,000 persons for people 65 years of age and over is to produce a projected number in 2003 somewhat different than would be estimated from the average rate shown for people 65 years of age and over.
16
......
Because the methodology employed to derive projected values assumes constant age-specific rates, it is the aging of the population that would result in the increases in the overall rates noted and shown in table 9 for physician visits, hospital
days, and nursing home residents,
Health care expenditures
Description
Figures for 1978 were obtained from HCFA, which annually estimates personal health care expenditures by type of expenditure for three age groups. Dividing these health ex
penditures by the population figures in table 3 gives age-specific expenditures per capita for physician visits (table 10), hospital care (table 11), and nursing home residents (table 12).
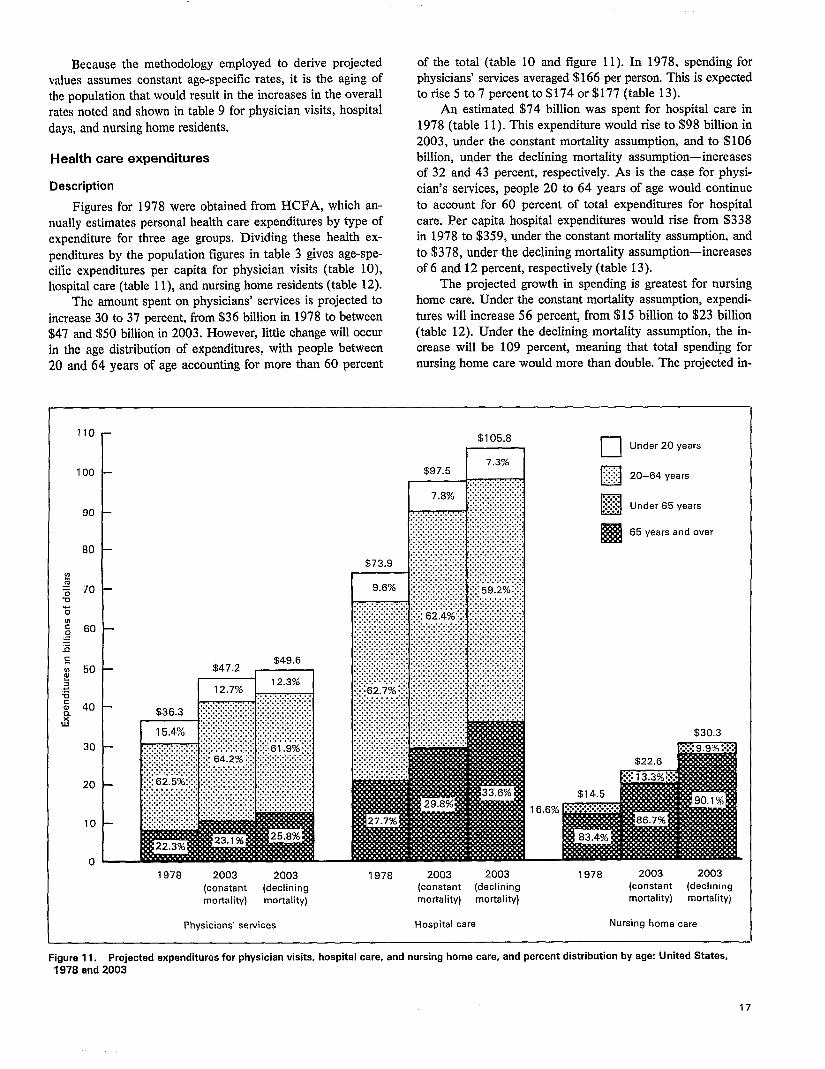
The amount spent on physicians’ services is projected to
increase 30 to 37 percent, from $36 billion in 1978 to between $47 and $50 billion in 2003. However, little change will occur in the age distribution of expenditures, with people between
20 and 64 years of age accounting for more than 60 percent
11o-
100
90
80
!?$ 70u‘5
: 60=-.6c.-IJ 50 5 . : g 40
d
30
20
10
o—
of the total (table 10 and figure 11). In 1978, spending for physicians’ services averaged $166 per person. This is expected to rise 5 to 7 percent to $174 or $177 (table 13).
An estimated $74 billion was spent for hospital care in 1978 (table 11). This expenditure would rise to $98 billion in 2003, under the constant mortality assumption, and to $106 billion, under the declining mortality assumption-increases of 32 and 43 percent, respectively. As is the case for physi
cian’s services, people 20 to 64 years of age would continue to account for 60 percent of total expenditures for hospital care. Per capita hospital expenditures would rise from $338 in 1978 to $359, under the constant mortality assumption, and
to $378, under the declining mortality assumption—increases of 6 and 12 percent, respectively (table 13).
The projected growth in spending is greatest for nursing home care. Under the constant mortality assumption, expendi
tures will increase 56 percent, from $15 billion to $23 billion (table 12). Under the declining mortality assumption, the in-crease will be 109 percent, meaning that total spend@g for nursing home care would more than double. The projected in-
$105.8
I I m Under 20 years
:<?: 20-64 years. . . .•1.
:.:.:.: .:j$: Under 65 yesrs n
65 years and over IES
$30.3
16.6%
1978 2003 2003 1978 2003 2003 1978 2003 2003
(constant (declining (constsnt (declining (constant (declining
mortality) mortality) mortality) mortality) mortality) mortality)
Physicians” services Hospital care Nursing home care
Figure 11. Projected expenditures for physician visits, hospital care, and nursing home care, and percent distribution by age: United Statas, 1978 and 2003

crease in per capita expenditures is from $66 in 1978 to $83 (26 percent), assuming constant mortality, or to $108 (63 percent), assuming declining mortality (table 13).
Procedure
If per capita utilization and medical care prices are assumed to remain constant between 1978 and 2003, or, in other words, expenditures per capita are the same in 2003 as in 1978, expenditures are projected for 2003 by multiplying expenditures per capita in the base period by the projected population in table 3. For example, per capita expenditures for physicians’ services are $77 among people under 20 years of age. When this amount is multiplied by the projected population of 71.8 million people under 20 years of age, assuming constant mortality, total expenditures for this age group are $6 billion, as shown in table 10. Assuming constant prices, the projected increases in expenditures parallel increases in utilization, although not exactly, because unit charges for medical care vary somewhat by age. As with the amount of medical care, the proportional increase in expenditures is higher at older ages.
Other studies
To assess the effect of projected changes in the size and age distribution of the population for this report, age-specific per capita utilization of health services and medical care prices were assumed to remain constant between 1978 and 2003, even though this is not expected to be the case. This was a useful device for isolating the impact of alternative mortality rates on health care use and expenditures. However, changes will undoubtedly occur in other parameters that tiect utilization and expenditures. Now that the potential impact of a growing and aging population has been examined, it will be instructive to briefly discuss two other studies that project national health expenditures based on less restrictive premises.
In 1980, the Nation spent $247 billion for health. 12This included expenditures for hospital care, physicians’ services, nursing home care, dentists’ services, other professional services, drugs and drug sundries, eyeglasses and appliances, research, construction, Government public health activities, and pre-payment and administration. Taking into account projected increases in real income and health insurance coverage, changes in the number of providers, and certain financial characteristics of the health care system, as well as population growth, a 1975 study projected total national health expenditures for all types of health services for the year 2000.13 According to that projection, expenditures will be close to $1,000 billion in the year 2000 (about $400 billion in 1975 prices).
The Health Care Financing Administration recently projected national health expenditures for 1990.14 This study assumed that current trends and relationships would continue in the future—specifically that the historical trends during the period 1965–1979 would continue for per capita use of medical care, that medical care prices would have the same ~elationship to the Consumer Price Index for all items as they did during that period, and that the population, health manpower, the Consumer Price Index, and the gross national product would grow according to projections of the Social Security Administration, the Bureau of Health Manpower, and the Office of Management and Budget, respectively.
This study projected that health expenditures will grow rapidly between 1981 and 1990, totaling $821 billion in 1990, almost three times the 1981 level (table 14). Per capita expenditures were projected to increase by a factor of 2.7, from $1,216 in 1981 to $3,309 in 1990. As a result of this rapid growth, national health expenditures will increase as a proportion of gross national product from 9.7 percent in 1981 to 10.8 percent in 1990. Projected aggregate and per capita amounts of national health expenditures by type of expenditure are shown in table 14 for calendar years 1981, 1985, and 1990.
18

Table 5. Number of persons with limitation of activity from chronic conditions per 1,000 population, number of parsons with limitation of activity �nd parcent incraasa, and percent distribution of persons with limitation of activity by mortality assumption and age United States, 1978 and 2003 projections
Persons with limitation of activity
Mortality assumption end age Number Increese,
per 1,000 1978 2003 1978–2003
1978 2003 population
Constant mortality Number in thousands Percent distribution
Alleges . . . . . . . . . . . . . . . . . . . . . . . . . . . . . . . . . . . . . . . . . . 143.3 31,212 42,492 36.1 100.0 100.0
Under 20 years . . . . . . . . . . . . . . . . . . . . . . . . . . . . . . . . . . . 37.2 2,672 2,870 7.4 8.6 6.8
20-44 years . . . . . . . . . . . . . . . . . . . . . . . . . . . . . . . . . . . . . . 88.7 6,989 8,499 21.6 22.4 20.0
45-64 years , ..,,...!.. . . . . . . . . . . . . . . . . . . . . . . . . . . . 242.9 10,654 16,121 51.3 34.1 37.9
65 years and over . . . . . . . . . . . . . . . . . . . . . . . . . . . . . . . . . 458.7 10,897 15,002 37.7 34.9 35.3
Declining mortality
Alleges . . . . . . . . . . . . . . . . . . . . . . . . . . . . . . . . . . . . . . . . . . 143.3 31,212 45,811 46.8 100.0 100.0 Under 20 years . . . . . . . . . . . . . . . . . . . . . . . . . . . . . . . . . . . 37.2 2,672 2,899 8.5 8.6 6.3 20-44 years . . . . . . . . . . . . . . . . . . . . . . . . . . . . . . . . . . . . . . 88.7 6,989 8,529 22.0 22.4 18.6
45-64 years. . . . . . . . . . . . . . . . . . . . . . . . . . . . . . . . . . . . . . 242.9 10,654 16,494 54.8 34.1 36.0
65 years and over . . . . . . . . . . . . . . . . . . . . . . . . . . . . . . . . . 453.7 10,897 17,889 64.2 34.9 39.0
Tabla 6. Number of physician viaits par 1,000 population, numbar of physician viaits and percant increase, end parcent distribution of physician visit$by mortality assumption and age United States, 1978 and 2003 projections
Physician visits
Mortality assumption and age Number Increase,
per 1,000 1978 2003 1978 20031978-2003
population
Percent Constant mortality Number in millions Percent distribution
Alleges. ,,, .,...,.............,., . . . . . . . . . . . . . . . 4,900 1,072.0 1,357.8 26.7 100.0 100.0
Under 20 years. . . . . . . . . . . . . . . . . . . . . . . . . . . . . . . . . . . 4,000 287.4 308.6 7.4 26.8 22.7 20-44 years . . . . . . . . . . . . . . . . . . . . . . . . . . . . . . . . . . . . . 4,700 370.3 450.3 21.6 34.5 33.2 45-64 years . . . . . . . . . . . . . . . . . . . . . . . . . . . . . . . . . . . . . 5,700 250.0 378.3 51.3 23.3 27.9 65vaars and over . . . . . . . . . . . . . . . . . . . . . . . . . . . . . . . . 6.800 164.3 220.6 34.3 15.3 16.2
Declining mortality
All agas. . . . . . . . . . . . . . . . . . . . . . . . . . . . . . . . . . . . . . . . . 4,900 1,072.0 1,410.6 31.6 100.0 100.0 Under 20years, . . . . . . . . . . . . . . . . . . . . . . . . . . . . . . . . . . 4,000 287.4 311.7 8.5 26.8 22.1 20-44 years. ,, . ., ., . . . . . . . . . . . . . . . . . . . . . . . . . . . . . 4,700 370.3 451.9 22.0 34.5 32.0 45-64 yaars . . . . . . . . . . . . . . . . . . . . . . . . . . . . . . . . . . . . . 5,700 250.0 387.1 54.8 23.3 27.4 65 years and over . . . . . . . . . . . . . . . . . . . . . . . . . . . . . . . . 6,800 164.3 259.9 68.2 15.3 18.4
19

Table 7. Number of days of care in non-Faderal short-stay hospitals par 1,000 population, numbers of days and percant increase, and parcent distribution ofdaysof care bymotialiW assumption and age United States, 1978 and2003 projections
Days of care
Mortality assumption and age
Constant mortality
Alleges . . . . . . . . . . . . . . . . . . . . . . . . . . . . . . . . . . . . . . . . . . .
Under 20 years . . . . . . . . . . . . . . . . . . . . . . . . . . . . . . . . . . . . . 20-44 years . . . . . . . . . . . . . . . . . . . . . . . . . . . . . . . . . . . . . . . . 45-64 years . . . . . . . . . . . . . . . . . . . . . . . . . . . . . . . . . . . . . . . . 65 years and over . . . . . . . . . . . . . . . . . . . . . . . . . . . . . . . . . . .
Declining mortality
Alleges . . . . . . . . . . . . . . . . . . . . . . . . . . . . . . . . . . . . . . . . . . .
Under 20 years . . . . . . . . . . . . . . . . . . . . . . . . . . . . . . . . . . . . . 20-44 yeara . . . . . . . . . . . . . . . . . . . . . . . . . . . . . . . . . . . . . . . . 45-64 years . . . . . . . . . . . . . . . . . . . . . . . . . . . . . . . . . . . . . . . . 65 years and over . . . . . . . . . . . . . . . . . . . . . . . . . . . . . . . . . . .
Number Increase,
per 1,000 1978 2003 1978-2003
1978 2003 population
Percent Number in millions Percent distribution
1,255.0 274.1 372.0 35.8 100.0 100.0 386.4 27.8 29.8 7.4 10.1 8,0 896.8 70.7 85.9 21.6 25.6 23.1
1,716.8 75.3 113.9 51.3 27.5 30.6 4,163.7 100.3 142.4 42.0 36.6 38,3
1,255.0 274.1 406.8 48.4 100.0 100.0 386.4 27.8 30.1 8.5 10.1 896.8 70.7 86.2 22.0 25.8 21.2
1,716.8 75.3 116.6 54.8 27.5 28.7 4,163.7 100.3 173.9 73.3 36.6 42.7
Table 8. Number of nursing home residents per 1,000 population, number of nursing home residents and percant increase, and parcant distribution of nursing home residents by mortality assumption and age United States, 1978 and 2003 projections
Nursing home residents
Mortality assumption and age Number per 1,000 1978 2003
hrcrease, 1978 2003
1978-2003population
Number in Percent Constant mortality millions Percentl distribution
Alleges . . . . . . . . . . . . . . . . . . . . . . . . . . . . . . . . . . . . . . . . . . . . . 6.1 1.3 2.1 56.8 100.0 100.0
Under 65 years . . . . . . . . . . . . . . . . . . . . . . . . . . . . . . . . . . . . . . . 0.9 0.2 0.2 23.1 13.2 10.4 65-74 yaars . . . . . . . . . . . . . . . . . . . . . . . . . . . . . . . . . . . . . . . . . 14.5 0.2 0.2 74.9 16.4 12.0 75-84 years . . . . . . . . . . . . . . . . . . . . . . . . . . . . . . . . . . . . . . . . . 68.0 0.5 0.8 61.5 35.4 36.5 85yesrs andovar . . . . . . . . . . . . . . . . . . . . . . . . . . . . . . . . . . . . . 216.6 0.5 0.9 84.3 35.0 41.1
Declining mortality
Alleges . . . . . . . . . . . . . . . . . . . . . . . . . . . . . . . . . . . . . . . . . . . . . 6.1 1.3 2.8 112.1 100.0 100.0
Under 65 years . . . . . . . . . . . . . . . . . . . . . . . . . . . . . . . . . . . . . . . 0.9 0.2 0.2 24.4 13.2 7,8 65-74 years . . . . . . . . . . . . . . . . . . . . . . . . . . . . . . . . . . . . . . . . . 14.5 0.2 0.3 23.7 16.4 9.5 75-84 years . . . . . . . . . . . . . . . . . . . . . . . . . . . . . . . . . . . . . . . . . 68.0 0.5 0.9 85.9 35.4 31.1 85 years and over. . . . . . . . . . . . . . . . . . . . . . . . . . . . . . . . . . . . . 216.6 0.5 1.4 213.2 35.6 61.6
lPercent distributions by age and percent increases in nursing home residents sre cakulstedfrom whole numbsrs rsther than from numbers in millions,
20
7.4

Tabla 9. Health services utilization and percent increase, bymortality assumption andtype of care: United States, 1978 and2003 projections
Year
Mortality assumption and type of care 1978 2003
Increase, 1978-2003
Number per 1,000 Constant mortality population Percent
Physician visits. , . ., .,.....,. . . . . . . . . . . . . . . . . . . . . . . . . . . . . . . . . . . . . . . . . . . . . . . . . . . . . . . . . . . . . 4,908 5,001 1.9
Hospital days . . . . . . . . . . . . . . . . . . . . . . . . . . . . . . . . . . . . . . . . . . . . . . . . . . . . . . . . . . . . . . . . . . . . . . . . . . . 1,255 1,371 9.2
Nursing home residents . . . . . . . . . . . . . . . . . . . . . . . . . . . . . . . . . . . . . . . . . . . . . . . . . . . . . . . . . . . . . . . . . . 6 8 24.6
Declining mortality
Physician visits. ,, . ., . ., ..,...,. . . . . . . . . . . . . . . . . . . . . . . . . . . . . . . . . . . . . . . . . . . . . . . . . . . . . . . . . . 4,908 5,039 2.7 Hospital days...,...,..,...,.. . . . . . . . . . . . . . . . . . . . . . . . . . . . . . . . . . . . . . . . . . . . . . . . . . . . . . . . . . . 1,255 1,453 15.8
Nursing home residents . . . . . . . . . . . . . . . . . . . . . . . . . . . . . . . . . . . . . . . . . . . . . . . . . . . . . . . . . . . . . . . . . . 6 10 63.9
Table IO. Expenditures inconstant dollars for physician visits, parcent increase, andpercent distribution bymotiali~ assumption andag~ United Statea, 1978 and2003projectione
Expenditures for physician visits
Mortality assumption and aga Per Increase,
capita 1978 2003 1978-2003
1978 2003 amount
Percent Constant mortality Amount in billions Percent distribution
Alleges . . . . . . . . . . . . . . . . . . . . . . . . . . . . . . . . . . . . . . . . . . . . . . $166 $36.3 $47.2 30.0 100.0 100.0
Under 20 years...........,..,.. . . . . . . . . . . . . . . . . . . . . . . . 77 5.6 6.0 7.1 15.4 12.7 20-64 years, . . . . . . . . . . . . . . . . . . . . . . . . . . . . . . . . . . . . . . . . . 185 22.7 30.3 33.5 62.5 64.2 65 years and over, . . . . . . . . . . . . . . . . . . . . . . . . . . . . . . . . . . . . . 337 8.1 10.9 34.6 22.3 23.1
Declining mortality
Alleges . . . . . . . . . . . . . . . . . . . . . . . . . . . . . . . . . . . . . . . . . . . . . . 166 36.3 49.6 36.6 100.0 100.0
Under 20 years . . . . . . . . . . . . . . . . . . . . . . . . . . . . . . . . . . . . . . . . 77 5.6 6.1 8.9 15.4 12.3 20-64 years . . . . . . . . . . . . . . . . . . . . . . . . . . . . . . . . . . . . . . . . . . 185 22.7 30.7 35.2 62.5 61.9 65yeara and over . . . . . . . . . . . . . . . . . . . . . . . . . . . . . . . . . . . . . . 337 8.1 12.8 58.0 22.3 25.8
Table 11. Expenditures in constant dollars for non-Federal short-stay hospital care, percent increase, and percent distribution by mortality assumption and age United Statas, 1978 and 2003 projections
Expenditures for hospital care
Mortality assumption and age Per Increase,
capita 1978 2003 7978–2003
1978 2003 amount
Percent Constant mortality Amount in billions Percent distribution
Alleges . . . . . . . . . . . . . . . . . . . . . . . . . . . . . . . . . . . . . . . . . . . . . . $338 $73.9 $97.5 31.9 100.0 100.0
Under 20 years . . . . . . . . . . . . . . . . . . . . . . . . . . . . . . . . . . . . . . . . 99 7.1 7.6 7.0 9.6 7.8
20-64 years . . . . . . . . . . . . . . . . . . . . . . . . . . . . . . . . . . . . . . . . . . 377 46.3 60.8 31.3 62.7 62.4 65yesrs and over . . . . . . . . . . . . . . . . . . . . . . . . . . . . . . . . . . . . . . 855 20.5 29.1 42.0 27.7 29.8
Oeclining mortality
Alleges . . . . . . . . . . . . . . . . . . . . . . . . . . . . . . . . . . . . . . . . . . . . . . 388 73.9 105.8 43.2 100.0 100.0 lJnder20 years . . . . . . . . . . . . . . . . . . . . . . . . . . . . . . . . . . . . . . . . 99 7.1 7.7 8.5 9.6 7.3 20-64 years . . . . . . . . . . . . . . . . . . . . . . . . . . . . . . . . . . . . . . . . . . 377 46.3 62.6 35.2 62.7 59.2 65 years and over . . . . . . . . . . . . . . . . . . . . . . . . . . . . . . . . . . . . . . 855 20.5 35.5 73.2 27.7 33.6
21
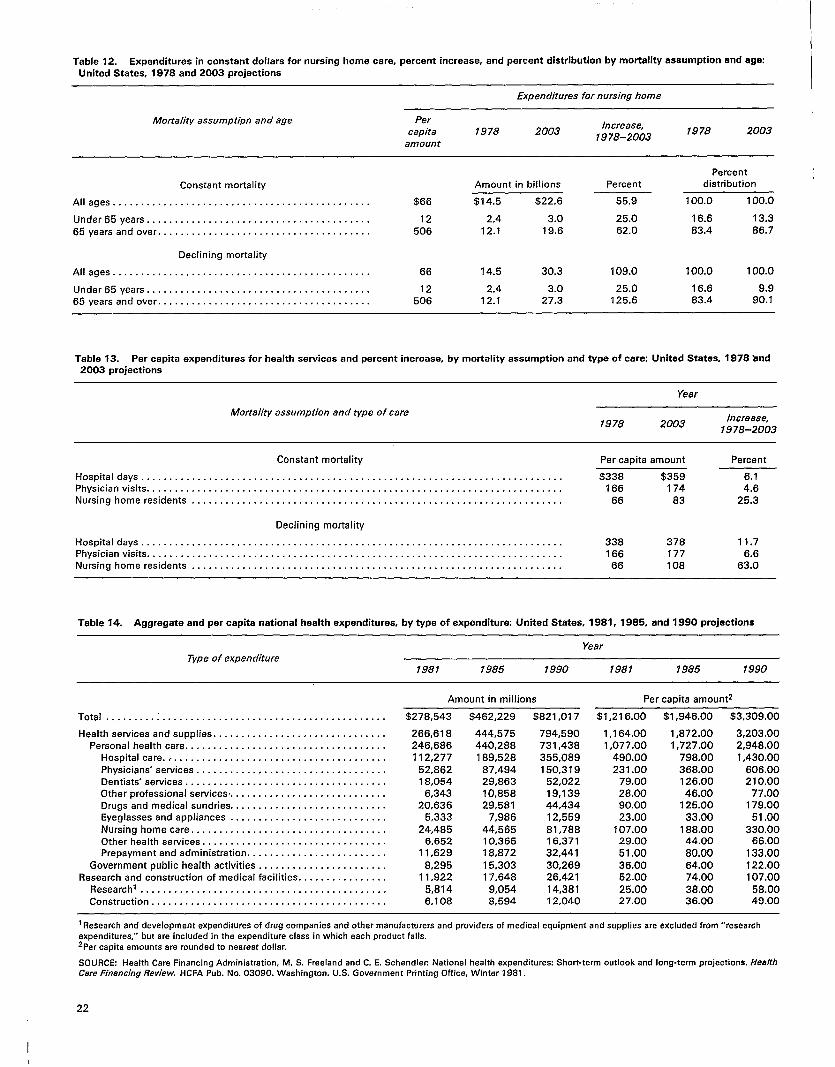
.
I Table 12. Expenditures in constent dollars for nursing home care, percent increase, and percent distribution by mortality assumption and age
United States, 1978 and 2003 projections I
Expenditures for nursing home
Mortality assumption and age Per Increase,
capita 1978 2003 1978-2003
1978 2003
amount
Percent
Constant mortality Amount in billions Percent distribution
Alleges . . . . . . . . . . . . . . . . . . . . . . . . . . . . . . . . . . . . . . . . . . . . . . $66 $14.5 $22.6 55.9 100,0 100.0
Under 65 years. . . . . . . . . . . . . . . . . . . . . . . . . . . . . . . . . . . . . . . . 12 2,4 3.0 25.0 16.6 13.3
65 years and over . . . . . . . . . . . . . . . . . . . . . . . . . . . . . . . . . . . . . . 506 12.1 19.6 62.0 83.4 86.7
Declining mortality
Alleges . . . . . . . . . . . . . . . . . . . . . . . . . . . . . . . . . . . . . . . . . . . . . 66 14.5 30.3 109.0 100.0 100.0
Under 65 years . . . . . . . . . . . . . . . . . . . . . . . . . . . . . . . . . . . . . . . . 12 2.4 3.0 25.0 16.6 9.9
65 years and over . . . . . . . . . . . . . . . . . . . . . . . . . . . . . . . . . . . . . . 506 12.1 27.3 125.6 83.4 90.1
Table 13. Percapita expenditures forhealth sewices and percent increase, bymortality assumption andtype of care: United States, 1978~nd 2003 projections
Year
Mortality assumption and type of care 1978 2003
Incraase, 1978-2003
Constant mortality Per capita amount Percent
Hospital days . . . . . . . . . . . . . . . . . . . . . . . . . . . . . . . . . . . . . . . . . . . . . . . . . . . . . . . . . . . . . . . . . . . . . . . . . . . $338 $359 6.1 Physician visits. . . . . . . . . . . . . . . . . . . . . . . . . . . . . . . . . . . . . . . . . . . . . . . . . . . . . . . . . . . . . . . . . . . . . . . . . . 166 174 4.6 Nursing home residents..,..,.,.. . . . . . . . . . . . . . . . . . . . . . . . . . . . . . . . . . . . . . . . . . . . . . . . . . . . . . . . . 66 83 25,3
Declining mortality
Hospital days . . . . . . . . . . . . . . . . . . . . . . . . . . . . . . . . . . . . . . . . . . . . . . . . . . . . . . . . . . . . . . . . . . . . . . . . . . . 338 378 11.7 Physician visits . . . . . . . . . . . . . . . . . . . . . . . . . . . . . . . . . . . . . . . . . . . . . . . . . . . . . . . . . . . . . . . . . . . . . . . . . . 166 177 6.6 Nursing home residents . . . . . . . . . . . . . . . . . . . . . . . . . . . . . . . . . . . . . . . . . . . . . . . . . . . . . . . . . . . . . . . . . . 66 108 63.0
Table 14. Aggregate andpercapita national health expenditures, by~pe of expenditure United States, 1981, 1985, and1990projactions
Year
Type of expenditure 1981 1985 1990 1981 1985 1990
Amount in millions Per capita amountz
Total . . . . . . . . . . . . . . . . . . . . . . . . . . . . . . . . . . . . . . . . . . . . . . . . . . $278,543 $462,229 $821,017 $1,216.00 $1,946.00 $3,309.00
Health sewices and supplies . . . . . . . . . . . . . . . . . . . . . . . . . . . . . . . 266,618 444,575 794,590 1,164.00 1,672.00 3,203.00 Personal health care . . . . . . . . . . . . . . . . . . . . . . . . . . . . . . . . . . . . 246,686 440,288 731,438 1,077.00 1,727.00 2,948.00
Hospital care . . . . . . . . . . . . . . . . . . . . . . . . . . . . . . . . . . . . . . . 112,277 189,528 365,089 490.00 798.00 1,430,00
Physicians’ services . . . . . . . . . . . . . . . . . . . . . . . . . . . . . . . . . . 52,862 87,494 150,319 231.00 368.00 606,00 Dentists’ services . . . . . . . . . . . . . . . . . . . . . . . . . . . . . . . . . . . . 18,054 29,863 52,022 79.00 126.00 210.00 Other professional services .. . . . . . . . . . . . . . . . . . . . . . . . . . . . 6,343 10,858 19,139 28.00 46.00 77.00
Drugs and medical sundries . . . . . . . . . . . . . . . . . . . . . . . . . . . . 20,636 29,581 44,434 90.00 125.00 179.00 Eyeglasses and appliances . . . . . . . . . . . . . . . . . . . . . . . . . . . . 5,333 7,986 12,559 23.00 33.00 51.00
Nursing home care . . . . . . . . . . . . . . . . . . . . . . . . . . . . . . . . . . . 24,485 44,565 81,788 107.00 188.00 330.00 Other health sewices . . . . . . . . . . . . . . . . . . . . . . . . . . . . . . . . . 6,652 10,365 16,371 29.00 44.00 66.00 Prepayment and administration.. . . . . . . . . . . . . . . . . . . . . . . . 11,629 18,872 32,441 51.00 80.00 133.00
Government public health activities . . . . . . . . . . . . . . . . . . . . . . . 8,295 15,303 30,269 36.00 64.00 122.00 Research and construction of medical facilities. . . . . . . . . . . . . . . . 11,922 17,648 26,421 52.00 74.00 107.00
ResearchI . . . . . . . . . . . . . . . . . . . . . . . . . . . . . . . . . . . . . . . . . . . . 5,814 9,054 14,381 25.00 38.00 58.00 Construction . . . . . . . . . . . . . . . . . . . . . . . . . . . . . . . . . . . . . . . . . . 6,108 8,594 12,040 27.00 36.00 49.00
qResearch and development expenditures of drug companiss and other manufacturers and providers of medical equipment and supplies are excluded from “reseerchexpenditures,” but are included in the expenditure class in which each product falls.Zper ~spita amounts are roundad to nearest dollar.
SOURCE Health Cars Finerrcing Administration, M. S. Freeland and C. E. Schendlec Netional health expenditures: Short-term outlook and long-term projections. HeelthCare Firrarwing Review. HCFA Pub. No. 03090. Washington. U.S. Government Printing Office, Winter 1981.
22

Chapter 6 Discussion
Reductions in mortality levels can no longer greatly affect the rate of population growt~ however, such reductions can have significant long-term effects on the age composition of the population as shown by the projections in this report under two differing mortality assumptions.
Under the constant mortality assumption, the population under 20 years of age is projected to increase by about 7 per-cent during 1978–2003, compared with 28 percent during 1953– 1978. The population 20–44 years of age would grow about half as fast in the future period as it did in the past. In contrast, the population 45–64 years of age would grow at a rate greater than 50 percent, compared with 36 percent during 1953-1978.
The population 65 years of age and over will also grow rapidly. During 1953–78, this age group grew twice as fast as the population as a whole 76 percent, compared with 38 per-cent, If the declining mortality assumption is realized, the aged population will again be the fastest growing demographic segment of the population, increasing 59 percent by the year 2003, whi[e the population of all ages increases only 28 percent.
The most rapidly growing age group would be the oldest— people 85 years of age and over. A tripling in the size of this age group would occur if the declining mortality assumption is realized—from 2 million to more than 6 million people.
This projected rapid increase in the size of the population 85 years of age and over would arise from different sources than in the past. The tripling during 1953–78 reflected the impact of immigration patterns to our Nation around the turn of the century. In contrast, future growth would result from improved health status and greater longevity.
The differential growth of the population by age can have important consequences for many social institutions, particularly in terms of dependency. Because the most slowly growing age group will be those under 20 years of age, their proportionate share of the total population will diminish measurably. In 1953, they accounted for more than one-t.hkd of the population by 2003, their share may decline to slightly more than one-fourth of the population. If the declining mortality assumption is realized, the group that will gain primarily will be the aged, increasing from less than 9 percent of the total population in 1953 to almost 14 percent in 2003.
As the number of elderly persons grows in relation to the working population, the use of public funds to finance services for the elderly may be constrained. Because the aged will be the most rapidly growing age group, the burden on the working population to provide necessary support for this group will increase.
Health care needs
An aging population raises issues relating to the availability of future health care services. Will the supply of physicians, hospital beds, and nursing home beds in 2003 be sufficient to meet the needs of the projected elderly population?
Physicians
The supply of physicians should be more than adequate to handle the projected number of visits. Under the declining mortality assumption, visits will increase by 32 percent be-tween 1978 and 2003. The Graduate Medical Education National Advisory Committee projects an increase of almost 40 percent in the number of active physicians by 1990.15 Even without any additional increase in physician supply between 1990 and 2003, the number per 100,000 population would increase from about 184 physicians in 1978 to 200 in 2003. The Nation may have an excess supply of physicians by the year 2003, but whether it wilI have adequate numbers specially trained in geriatric medicine is another issue. Dr. Robert Kane and colleagues, who looked at fiture requirements for geriatric manpower, concluded that about 8,000 geriatricians would be needed by 2030.16
Hospitals
The number of hospital days projected for 2003, under the constant mortality assumption, would require an average of 4.4 beds per 1,000 population if occupancy rates averaged 85 percent. A report by the Institute of Medicine concluded “current utilization patterns probably exaggerate current needs.” 17 It noted that Health Maintenance Organizations “have experienced hospital utilization rates 30 to 50 percent below those of the conventional fee-for-service arrangements;’ which indicate a potential for reducing hospital utilization rates. If there were a 20-percent reduction in days of care projected for 2003, 3.5 beds per 1,000 population would be sufllcient for the projected population at 85 percent occupancy.
Although there are some trends toward lower per capita use of hospitals, such as declining average lengths of stay and tightening of hospital admissions, the effect of these on utilization rates over the long run is uncertain. Many factors interact to determine supply and demand, including the possibility that supply creates demand. A careful watch should be kept on the need for and supply of hospital beds.
Nursing homes
Currently, nursing homes are experiencing an average annual occupancy rate of almost 90 percent, with a ratio of
23
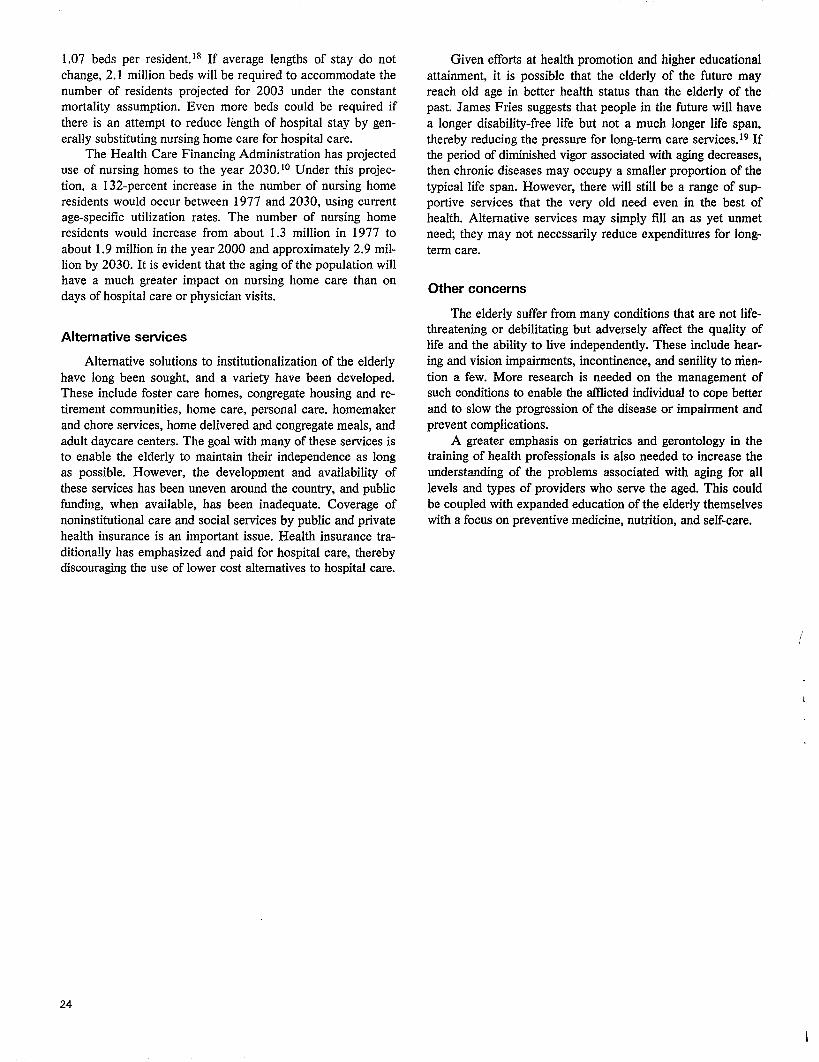
1.07 beds per resident. 18 If average lengths of stay do not change, 2.1 million beds will be required to accommodate the number of residents projected for 2003 under the constant mortality assumption. Even more beds could be required if there is an attempt to reduce length of hospital stay by generally substituting nursing home care for hospital care.
The Health Care Financing Administration has projected use of nursing homes to the year 2030.’0 Under this projection, a 132-percent increase in the number of nursing home residents would occur between 1977 and 2030, using current age-specific utilization rates. The number of nursing home residents would increase from about 1.3 million in 1977 to about 1.9 million in the year 2000 and approximately 2.9 mil-lion by 2030. It is evident that the aging of the population will have a much greater impact on nursing home care than on days of hospital care or physician visits.
Alternative services
Alternative solutions to institutionalization of the elderly have long been sought, and a variety have been developed. These include foster care homes, congregate housing and retirement communities, home care, personal care, homemaker and chore services, home delivered and congregate meals, and adult daycare centers. The goal with many of these services is to enable the elderly to maintain their independence as long as possible. However, the development and availability of these services has been uneven around the country, and public funding, when available, has been inadequate. Coverage of noninstitutional care and social services by public and private health insurance is an important issue. Health insurance traditionally has emphasized and paid for hospital care, thereby discouraging the use of lower cost alternatives to hospital care.
Given effor%sat health promotion and higher educational attainment, it is possible that the elderly of the future may reach old age in better health status than the elderly of the past. James Fries suggests that people in the future will have a longer disability-free life but not a much longer life span, thereby reducing the pressure for long-term care services. 19If the period of diminished vigor associated with aging decreases, then chronic diseases may occupy a smaller proportion of the typical life span. However, there will still be a range of supportive services that the very old need even in the best of health. Alternative services may simply fill an as yet unmet neecl they may not necessarily reduce expenditures for long-term care.
Other concerns
The elderly suffer from many conditions that are not life-threatening or debilitating but adversely affect the quality of life and the ability to live independently. These include hearing and vision impairments, incontinence, and senility to mention a few. More research is needed on the management of such conditions to enable the afflicted individual to cope better and to slow the progression of the disease or impairment and prevent complications.
A greater emphasis on geriatrics and gerontology in the training of health professionals is also needed to increase the understanding of the problems associated with aging for all levels and types of providers who serve the aged. This could be coupled with expanded education of the elderly themselves with a focus on preventive medicine, nutrition, and self-care.
24

!
~ Chapter 7 Conclusion
1
I
The longer the period of projection, the more difficult it is to reasonably predict the changes and the effect of changes in patterns of medical treatment, Government regulations, insurance coverage, education, income, and other important parameters. This report has purposely been restricted to changes in the size and age of the population, although other forces will have an impact on health care use and expenditures.
It is not known whether the momentum of sharp reductions in mortality levels experienced during the recent past will continue, However, because there is so much uncertainty over factors associated with trends in major causes of death, no other effective substitute exists for projecting the future health status of the United States than to extrapolate past trends.
The projections in this report emphasize the changing age distribution of the population in which the proportion of elderly in the population will grow rapidly whether mortality rates remain unchanged or continue to decline. If the constant mor
tality assumption is taken as a “minimum impact” projection, some increases would still occur in the number of people with limitation of activity, the number of hospital days, the number of nursing home residents, and corresponding costs. Under the declining mortality assumption there would be an even greater level of disability and dependence, and the costs associated with providing health care for an increasingly elderly population would be correspondingly higher.
The implications of the aging of the population in the years ahead for social institutions, including the health care delive~ system, should be considered in policy planning. Although no one can say with any degree of certainty what the i%ture will bring, the U.S. population will grow more elderly and the need for health care facilities may well increase. These projections indicate a need to continue activities aimed toward providing health care for the elderly.
25
References
lNational Center for Health Statistics: Final mortality statistics,
1978. Monthly Vital Statistics Report. Vol. 29-No. 6 Supp. 2. DHHS Pub. No. (PHS) 80-1120. Public Health Service. Hyattsville, Md., Sept. 15.1980.
@ffIce of the Actuary: United States population projections for
OASDHI cost estimates. Actuarial Study No. 77. HEW Pub. No.
(SSA) 78-11523. Social Security Administration. Washington. U.S. Government Printing Oflice, June 1978,
3R. M. Gibson, M. S. Mueller, and C. R. Fishec Age differences in
health care spending, fiscal year 1976. Social Secur. Bull. 40(8}3-14, Aug. 1977.
4National Center for Health Statistic Vital Statistics of the United
States, 1976, Vol. II—Mortality. DHEW Pub. No. (PHS) 80-1101. Public Health Service. Washington. U.S. Government Printing Of
fice, 1980.
50ff1ce of the Actuary: United States population projections for
OASDHI cost estimates. Actuarial Study No. 82. SSA Pub. No. 11–1 1529. Social Security Administration. Washington. U.S. Government Printing OffIce, June 1980,
%J.S. Bureau of the Census, H. S. Shryock, J. S. Siegel, et al.: The Methods and Materials of Demograph~t Washington. U.S. Gover
nmentPrinting Oftlce, 1973.
7M. Spiegelman: Introduction to Demography. Cambridge, Mass.
Harvard University Press, 1968.
8M. D. Miller EIements of Graduation. Chicago. Society of Actu
aries, 1946,
‘U.S. Bureau of the Census: Estimates of the population of the United States by age, sex, and race 1970– 1977. Current Population Re-ports, Population Estimates and Projections. Series P-25, No. 721. Washington. U.S. Government Printing Office, Apr. 1978.
10Health Care Financing Administration: Long Term Care: Back-
ground and Future Directions. DHHS Pub. No. (HCFA) 81-20047.
Washington. U.S. Government Printing Otlice, 1981.
26
I IL. B. Russell: An aging population and the use of medical care.
Med. Care 19(6):633-643, June 1981.
12Heakh Care Financing Administration, R. M. Gibson and D. R. Waldo National health expenditures, 1980. Health Care Financing Review. HCFA Pub. No. 03123. Washington. U.S. Government Printing Office, Sept. 1981.
13S. J. Mushkin, M. Smelker, D. Wyss, et al.: Cost of disease and illness in the United States in the year 2000. Pub. Health Rep. 93(5):493-588, Sept.-Ott. 1978.
14Health Care Financing Administration, M. S. Freeland and C. E. Schendlen National health expenditures: Shofi-term outlook and long-term projections. Health Care Financing Review. HCFA Pub. No. 03090. Washington. U.S. Government Printing OfYice, Winter 1981.
IsBureau of Health Manpowe~ Supply and distribution of physicians
and physician extenders. GMENAC St&Papers. DHEW Pub. No. (HRA) 78-11. Health Resources Administration. Washington, U.S.
Government Printing Oflice, 1978.
ISR. Kane, D. Solomon, J. Beck, et a].: The future need for geriatric
manpower in the United States, N. Eng/. J. Med. 302(24): 1327-
1332, 1980.
171nstitute of Medicine: Controlling the Supply of HospitaI Beds. Washington. National Academy of Sciences, Oct. 1976.
‘*National Center for Health Statistics, J. F. Nostrand, A. Zappolo,
E. Hing, et al.: The national nursing home survey, 1977 summary for the United States. Vital and Health Statistics. Series 13-No. 43. DHEW Pub. No. (PHS) 79–1 794. Public Health Service. Washing-ton. U.S. Government Printing Otlice, July 1979.
19J Fries, M. D.: Aging, natural death, and the compression of morbid;ty. N. Engl. J Med 303(3):130-135, July 17, 1980.

Appendix
Detailed projections of population by age, race, and sex were prepared by the Office of the Actuary, Social Security Administration, using alternative assumptions of fhture mortality developed by the National Center for Health Statistics. Assumptions about future fertility and fhture net immigration in this report are the same as those used by the OffIce of the
Contents
List of appendix tables
Actuary. Age-sex specific death rates were used to generate life tables, also reflected in the population projections in this report. Detailed demographic information, which serves as the basis for projections and estimates in this report, is provided in tables I–V.
I. Assumed annual netsurviving immigrants, byage andsex United States . . . . . . . . . . . . . . . . . . . . . . . . . . . . . . . . . . . . . . . . 2811. Death rates by age and sex United States, 1966, 1976, and projections for 2003 . . . . . . . . . . . . . . . . . . . . . . . . . . . . . . . . . 28111,Final and projected death rates and percent difference, by age: United States, 1978 . . . . . . . . . . . . . . . . . . . . . . . . . . . . . . . 28IV, Lifetables bysex United States, 1976 andprojections for2003 . . . . . . . . . . . . . . . . . . . . . . . . . . . . . . . . . . . . . . . . . . . . . . . 29V, Population by age, sex, and mortality assumptiorx United States, 1978 and 2003 projections . . . . . . . . . . . . . . . . . . . . . . . 35
27
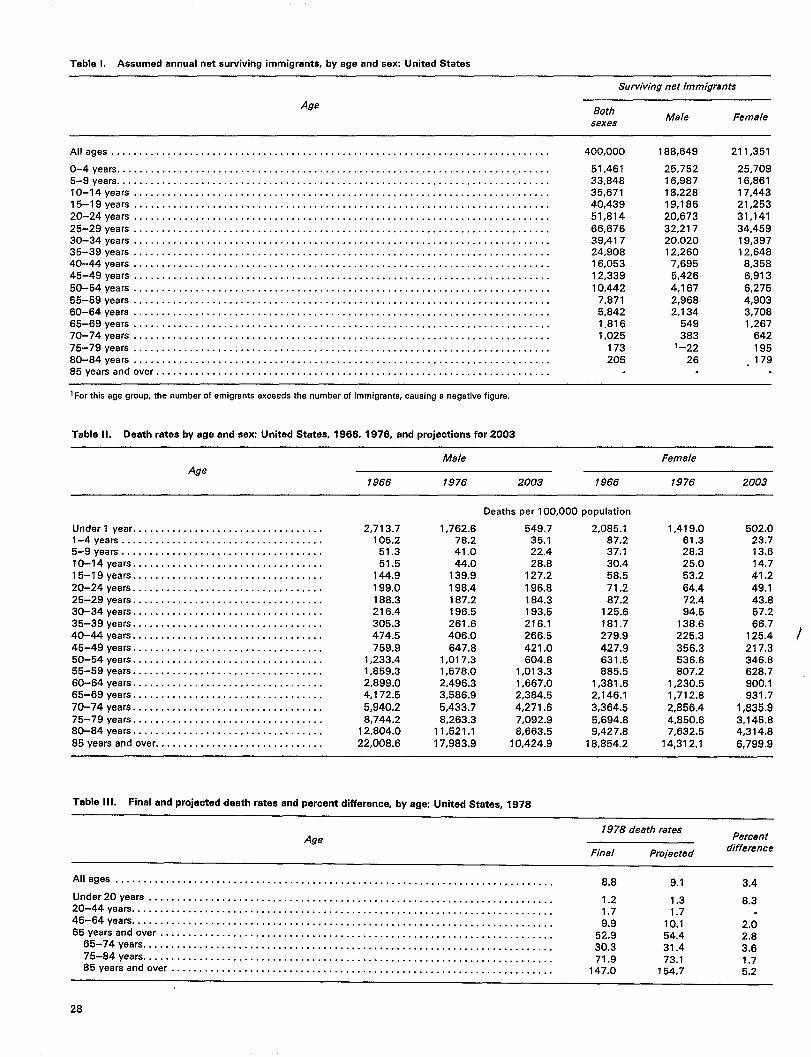
Table 1. Assumed annual net eurviving immigrants, by age and aex United States
Surviving net immigrants
Age Both
Male Female sexes
Alleges . . . . . . . . . . . . . . . . . . . . . . . . . . . . . . . . . . . . . . . . . . . . . . . . . . . . . . . . . . . . . . . . . . . . . . . . . . . . . . 400,000
O-4 years . . . . . . . . . . . . . . . . . . . . . . . . . . . . . . . . . . . . . . . . . . . . . . . . . . . . . . . . . . . . . . . . . . . . . . . . . . . . . 51,461 5-9 years . . . . . . . . . . . . . . . . . . . . . . . . . . . . . . . . . . . . . . . . . . . . . . . . . . . . . . . . . . . . . . . . . . . . . . . . . . . . . 33,848 10-14 years . . . . . . . . . . . . . . . . . . . . . . . . . . . . . . . . . . . . . . . . . . . . . . . . . . . . . . . . . . . . . . . . . . . . . . . . . , 35,671 15-19 yeara . . . . . . . . . . . . . . . . . . . . . . . . . . . . . . . . . . . . . . . . . . . . . . . . . . . . . . . . . . . . . . . . . . . . . . . . . . 40,439
20-24 years . . . . . . . . . . . . . . . . . . . . . . . . . . . . . . . . . . . . . . . . . . . . . . . . . . . . . . . . . . . . . . . . . . . . . . . . . . 51,814 25-29 years . . . . .. c. . . . . . . . . . . . . . . . . . . . . . . . . . . . . . . . . . . . . . . . . . . . . . . . . . . . . . . . . . . . . . . . . . . 66,676 30-34 years . . . . . . . . . . . . . . . . . . . . . . . . . . . . . . . . . . . . . . . . . . . . . . . . . . . . . . . . . . . . . . . . . . . . . . . . . . 39,417 35-39 years . . . . . . . . . . . . . . . . . . . . . . . . . . . . . . . . . . . . . . . . . . . . . . . . . . . . . . . . . . . . . . . . . . . . . . . . . . 24,908 40-44 years . . . . . . . . . . . . . . . . . . . . . . . . . . . . . . . . . . . . . . . . . . . . . . . . . . . . . . . . . . . . . . . . . . . . . . . . . . 16,053 45-49 years . . . . . . . . . . . . . . . . . . . . . . . . . . . . . . . . . . . . . . . . . . . . . . . . . . . . . . . . . . . . . . . . . . . . . . . . . . 12,339
50-54 years . . . . . . . . . . . . . . . . . . . . . . . . . . . . . . . . . . . . . . . . . . . . . . . . . . . . . . . . . . . . . . . . . . . . . . . . . . 10,442 55-59 years . . . . . . . . . . . . . . . . . . . . . . . . . . . . . . . . . . . . . . . . . . . . . . . . . . . . . . . . . . . . . . . . . . . . . . . . . . 7,871 60-64 years . . . . . . . . . . . . . . . . . . . . . . . . . . . . . . . . . . . . . . . . . . . . . . . . . . . . . . . . . . . . . . . . . . . . . . . . . . 5,842 65-69 years . . . . . . . . . . . . . . . . . . . . . . . . . . . . . . . . . . . . . . . . . . . . . . . . . . . . . . . . . . . . . . . . . . . . . . . . . . 1.816 70-74 years . . . . . . . . . . . . . . . . . . . . . . . . . . . . . . . . . . . . . . . . . . . . . . . . . . . . . . . . . . . . . . . . . . . . . . . . . . 1,025
75-79 years . . . . . . . . . . . . . . . . . . . . . . . . . . . . . . . . . . . . . . . . . . . . . . . . . . . . . . . . . . . . . . . . . . . . . . . . . . 173 80-84 years . . . . . . . . . . . . . . . . . . . . . . . . . . . . . . . . . . . . . . . . . . . . . . . . . . . . . . . . . . . . . . . . . . . . . . . . . . 205 85 years and over . . . . . . . . . . . . . . . . . . . . . . . . . . . . . . . . . . . . . . . . . . . . . . . . . . . . . . . . . . . . . . . . . . . . . .
1For this age group, the number of emigrants exceeds the number of immigrants, cauaing a negative figure.
Table Il. Death rates by age and sex United States, 1966, 1976, and projections for 2003
Age
Under l year . . . . . . . . . . . . . . . . . . . . . . . . . . . . . . . . . . l-4 yeara . . . . . . . . . . . . . . . . . . . . . . . . . . . . . . . . . . . . 5-9years . . . . . . . . . . ..4...... . . . . . . . . . . . . . . . . . 10-14 years . . . . . . . . . . . . . . . . . . . . . . . . . . . . . . . . . . 15-19 years . . . . . . . . . . . . . . . . . . . . . . . . . . . . . . . . . .
20-24 years . . . . . . . . . . . . . . . . . . . . . . . . . .+....... 25-29 years . . . . . . . . . . . . . . . . . . . . . . . . . . . . . . . . . . 30-34 years . . . . . . . . . . . . . . . . . . . , . . . . . . . . . . ...+ 35-39 years . . . . . . . . . . . . . . . . . . . . . . . . . . . . . . . . . . 40-44 yesrs . . . . . . . . . . . . . . . . . . . . . . . . . . . . . . . . . .
45-49 yeara . . . . . . . . . . . . . . . . . . . . . . . . . . . . . . . . . . 50-54 years . . . . . . . . . . . . . . . . . . . . . . . . . . . . . . . . . . 55-59 yeara . . . . . . . . . . . . . . . . . . . . . . . . . . . . . . . . . . 60-64 years . . . . . . . . . . . . . . . . . . . . . . . . . . . . . . . . . . 65-69 years . . . . . . . . . . . . . . . . . . . . . . . . . . . . . . . . . .
70-74 years . . . . . . . . . . . . . . . . . . . . . . . . . . . . . . . . . . 75-79 yeara . . . . . . . . . . . . . . . . . . . . . . . . . . . . . . . . . . 60-84 years . . . . . . . . . . . . . . . . . . . . . . . . . . . . . . . . . .
85 years and over . . . . . . . . . . . . . . . . . . . . . . . . . . . . . .
Male
7966 1976 2003 1966
Deaths per 100,000 population
2,713.7 1,762.6 105.2 78.2
51.3 41.0 51.5 44.0
144.9 139,9
199.0 198.4 188.3 187.2 216.4 196.5 305.3 261.6 474.5 406.0 759.9 647.8
1,233.4 1,017.3 1,859.3 1,578.0 2,899.0 2,496.3 4,172.5 3,586.9
5,940,2 5,433.7 8,744.2 8,263.3
12,804.0 11,521.1 22,008.6 17,983.9
549.7 2,085.1 35.1 87.2 22.4 37.1 28.8 30.4
127.2 58.5
196.8 71.2 184.3 87.2 193.5 125.6 216.1 181.7 266.5 279.9
421.0 427.9 604.8 631.5
1,013.3 885.5 1,667.0 1,381.6 2,384.5 2,146.1 4,271.6 3,364.5 7,092.9 5,694.8 8,663.5 9,427.8
10,424.9 18,854.2
188,649 211,351
25,752 25,709 16,987 16,861 18,228 17,443 19,186 21,253 20,673 31,141
32,217 34,469 20,020 19,397 12,260 12,648
7,695 8,358
5,426 6,913 4,167 6,275 2,968 4,903 2,134 3,708
549 1,267 383 642
1-22 195 26 .179
Female
1976 2003
1,419.0 502.0 61.3 23.7 28.3 13.6 25.0 14.7 53.2 41.2
64.4 49.1 72.4 43.8 94.5 57.2
138.6 66.7 225.3 125.4 / 356.3 217.3 536.8 346.8 807.2 828.7
1,230.5 900.1 1,712.8 931.7
2,856.4 1,835.9 4,850.6 3,145.8 7,632.5 4,314.8
14,312.1 6,799.9
Table Ill. Final and projected death rates and percent difference, by age United States, 1978
1978 death rates Age Percent
Final Projected difference
AH ages . . . . . . . . ,0...... . . . . . . . . . . . . . . . . . . . . . . . . . . . . . . . . . . . . . . . . . . . . . . . . . . . . . . . . . . . . . . 8.8 9.1 3.4
Under 20years . . . . . . . . . . . . . . . . . . . . . . . . . . . . . . . . . . . . . . . . . . . . . . . . . . . . . . . . . . . . . . . . . . . . . . . . 1.2 1.3 8.3 20-44 years . . . . . . . . . . . . . . . . . . . . . . . . . . . . . . . . . . . . . . . . . . . . . . . . . . . . . . . . . . . . . . . . . . . . . . . . . . . 1,7 1.7 45-64 yaars . . . . . . . . . . . . . . . . . . . . . . . . . . . . . . . . . . . . . . . . . . . . . . . . . . . . . . . . . . . . . . . . . . . . . . . . . . . 9.9 10.1 2.0 65 years and over . . . . . . . . . . . . . . . . . . . . . . . . . . . . . . . . . . . . . . . . . . . . . . . . . . . . . . . . . . . . . . . . . . . . . . 52.9 54.4 2.8
65-74 years . . . . . . . . . . . . . . . . . . . . . . . . . . . . . . . . . . . . . . . . . . . . . . . . . . . . . . . . . . . . . . . . . . . . . . . . . 30.3 31.4 3.6 75-84 years . . . . . . . . . . . . . . . . . . . . . . . . . . . . . . . . . . . . . . . . . . . . . . . . . . . . . . . . . . . . . . . . . . . . . . . . . 71.9 73,1 1.7 65 years And over . . . . . . . . . . . . . . . . . . . . . . . . . . . . . . . . . . . . . . . . . . . . . . . . . . . . . . . . . . . . . . . . . . . . 147.0 154.7 5.2
28
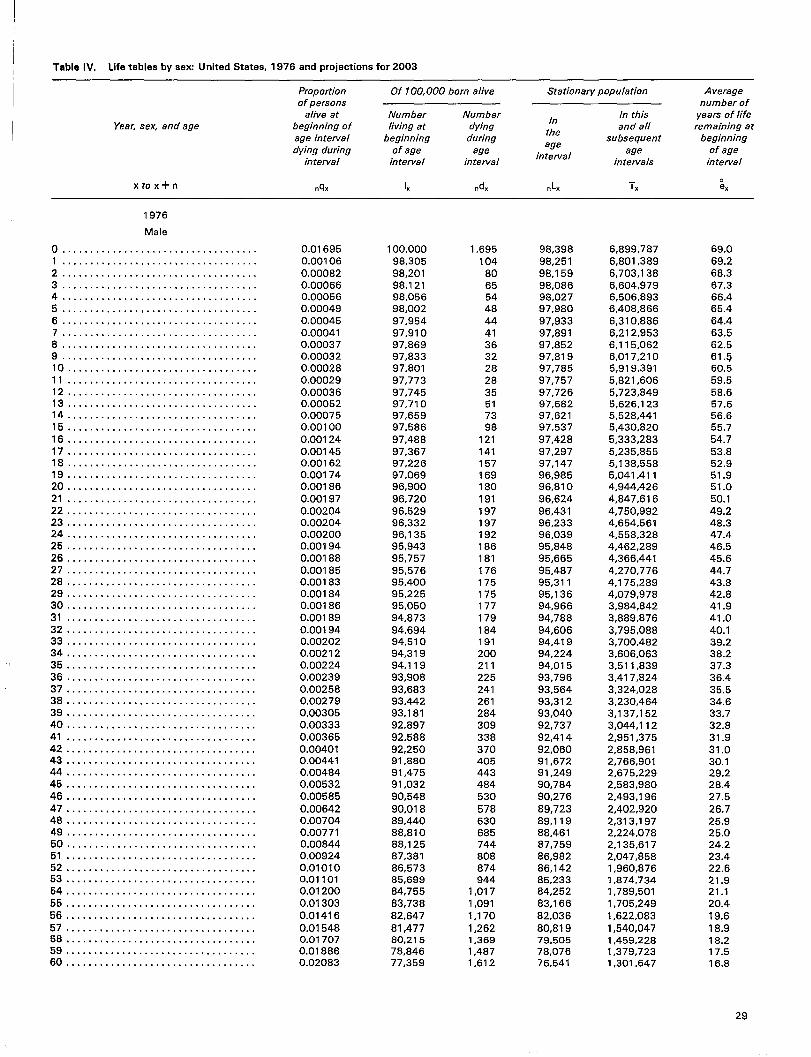
1234
56789101112131415
16171819202122232425
~
Table IV. Life tablea by sex United States, 1976 and projections for 2003
Proportion Of 100,000 born alive Stationary population Average of persons number of
alive at Number Number In
In this years of life Year, sex, and age beginning of living at dying
the and all remaining at
age interval beginning during subsequent beginning age
dying during of age age interval
age of age interval interval in tewal intervals interval
* xtox+n Klx lx n.d nxL T, e.
1976
Male
o . . . . . . . . . . . . . . . . . . . . . . . . . . . . . . . . . . . 0.01695 100,000 1,695 98,398 6,899,787 69.0
. ...!.... . . . . . . . . . . . . . . . . . . !. ...,.. 0.00106 98,305 104 98,251 6,801,389 69.2
. . . . . . . . . . . . . . . . . . . . . . . . . . . . . . . . . . . 0.00082 98,201 80 98,159 6,703,138 68.3
. . . . . . . . . . . . . . . . . . . . . . . . . . . . . . . . . . . 0.00066 98,121 65 98,086 6,604,979 67.3
. . . . . . . . . . . . . . . . . . !. ...,,.. ... . . . . . 0.00056 98,056 54 98,027 6,506,893 66.4
. . . . . . . . . . . . . . . . . . . . . . . . . . . . . . . . . . . 0.00049 98,002 48 97,980 6,408,886 65.4
. . . . . . . . . . . . . . . . . . . . . . . . . . . . . . . . . . . 0.00045 97,954 44 97,933 6,310,886 64.4
. . . . . . . . . . . . . . . . . . . . . . . . . . . . . . . . . . . 0.00041 97,910 41 97,891 6,212,953 63.5
. . . . . . . . . . . . . . . . . . . . . . . . . . . . . . . . . . . 0.00037 97,869 36 97,852 6,115,062 62.5
. . . . . . . . . . . . . . . . . . . . . . . . . . . . . . . . . . . 0.00032 97,833 32 97,819 6,017,210 61.5 . . . . . . . . . . . . . . . . . . . . . . . . . . . . . . . . . . 0.00028 97,801 28 97,785 5,919,391 60.5 . . . . . . . . . . . . . . . . . . . . . . . . . . . . . . . . . . 0.00029 97,773 28 97,757 5,821,606 59.5 . . . . . . . . . . . . . . . . . . . . . . . . . . . . . . . . . . 0.00036 97,745 35 97,726 5,723,849 58.6 . . . . . . . . . . . . . . . . . . . . . . . . . . . . . . . . . . 0.00052 97,710 51 97,682 5,626,123 57.6 . . . . . . . . . . . . . . . . . . . . . . . . . . . . . . . . . . 0.00075 97,659 73 97,621 5,528,441 56.6 ..,,.,.,,.,,...,,....,!..,..,,. . . . 0.00100 97,586 98 97,537 5,430,820 55.7 . . . . . . . . . . . . . . . . . . . . . . . . . . . . . . . . . . 0.00124 97,488 121 97,428 5,333,283 54.7 . . . . . . . . . . . . . . . . . . . . . . . . . . . . . . . . . . 0.00145 97,367 141 97,297 5,235,855 53.8 . . . . . . . . . . . . . . . . . . . . . . . . . . . . . . . . . . 0.00162 97,226 157 97,147 5,138,558 52.9 . . . . . . . . . . . . . . . . . . . . . . . . . . . . . . . . . . 0.00174 97,069 169 96,985 5,041,411 51.9 . . . . . . . . . . . . . . . . . . . . . . . . . . . . . . . . . . 0.00186 96,900 180 96,810 4,944,426 51.0 . . . . . . . . . . . . . . . . . . . . . . . . . . . . . . . . . . 0.00197 96,720 191 96,624 4,847,616 50.1 . . . . . . . . . . . . . . . . . . . . . . . . . . . . . . . . . . 0.00204 96,529 197 96,431 4,750,992 49.2 . . . . . . . . . . . . . . . . . . . . . . . . . . . . . . . . . . 0.00204 96,332 197 86,233 4,654,561 48.3 ... ..,.. . . . . . . . . . . . . . . . . . . . . . . . . . . 0.00200 96,135 192 96,038 4,558,328 47.4 . . . . . . . . . . . . . . . . . . . . . . . . . . . . . . . . . . 0.00194 95,943 186 95,848 4,462,289 46.5
26, , ., . . . . . . . . . . . . . . . . . . . . . . . . . . . . . . 0.00188 95,757 181 95,665 4,366,441 45.6 27 . . . . . . . . . . . . . . . . . . . . . . . . . . . . . . . . . . 0.00185 95,576 176 95,487 4,270,776 44.7 28 . . . . . . . . . . . . . . . . . . . . . . . . . . . . . . . . . . 0.00183 95,400 175 95,311 4,175,289 43.8 29 . . . . . . . . . . . . . . . . . . . . . . . . . . . . . . . . . . 0,00184 95,225 175 95,136 4,079,978 42.8 30 . . . . . . . . . . . . . . . . . . . . . . . . . . . . . . . . . . 0.00186 95,050 177 94,966 3,984,842 41.9 31 . . . . . . . . . . . . . . . . . . . . . . . . . . . . . . . . . . 0,00189 94,873 179 94,788 3,889,876 41.0 32 . . . . . . . . . . . . . . . . . . . . . . . . . . . . . . . . . . 0.00194 94,694 184 94,606 3,795,088 40.1 33 . . . . . . . . . . . . . . . . . . . . . . . . . . . . . . . . . . 0.00202 94,510 191 94,419 3,700,482 39.2 34 . . . . . . . . . . . . . . . . . . . . . . . . . . . . . . . . . . 0.00212 94,319 200 94,224 3.606,063 38.2
., 35 . . . . . . . . . . . . . . . . . . . . . . . . . . . . . . . . . . 0.00224 94,119 211 94,015 3,511,839 37.3 36 . . . . . . . . . . . . . . . . . . . . . . . . . . . . . . . . . . 0.00239 93,908 225 93,796 3,417,824 36.4 37 . . . . . . . . . . . . . . . . . . . . . . . . . . . . . . . . . . 0.00258 93,683 241 93,564 3,324,028 35.5 38 . . . . . . . . . . . . . . . . . . . . . . . . . . . . . . . . . . 0.00279 93,442 261 93,312 3,230,464 34.6 39 . . . . . . . . . . . . . . . . . . . . . . . . . . . . . . . . . . 0.00305 93,181 284 93,040 3,137,152 33.7 40 . . . . . . . . . . . . . . . . . . . . . . . . . . . . . . . . . . 0.00333 92,897 92,737 3,044,112 32.8 41 . . . . . . . . . . . . . . . . . . . . . . . . . . . . . . . . . . 0.00365 92,588 338 92,414 2,951,375 31.9 42 . . . . . . . . . . . . . . . . . . . . . . . . . . . . . . . . . . 0.00401 92,250 370 92,060 2,858,961 31.0 43 . . . . . . . . . . . . . . . . . . . . . . . . . . . . . . . . . . 0.00441 91,880 405 91,672 2,766,901 30.1 44 . . . . . . . . . . . . . . . . . . . . . . . . . . . . . . . . . . 0.00484 81,475 443 91,249 2,675,229 29.2 45 . . . . . . . . . . . . . . . . . . . . . . . . . . . . . . . . . . 0.00532 91,032 484 80,784 2,583,980 28.4 46 ... ,,, , . . . . . . . . . . . . . . . . . . . . . . . . . . , 0.00585 90,548 530 90,276 2,493,196 27.5 47 . . . . . . . . . . . . . . . . . . . . . . . . . . . . . . . . . . 0.00642 90,018 578 89,723 2,402,920 26.7 48 . . . . . . . . . . . . . . . . . . . . . . . . . . . . . . . . . . 0.00704 89,440 630 89,119 2,313,197 25.9 49 . . . . . . . . . . . . . . . . . . . . . . . . . . . . . . . . . . 0.00771 88,810 88,461 2,224,078 25.0 50 . . . . . . . . . . . . . . . . . . . . . . . . . . . . . . . . . . 0.00844 88,125 744 87,759 2,135,617 24.2 61 ... .,.., . . . . . . . . . . . . . . . . . . . . . . . . . . 0.00924 87,381 808 86,982 2,047,858 23.4 52 . . . . . . . . . . . . . . . . . . . . . . . . . . . . . . . . . . 0.01070 86,573 874 86,142 1,960,876 22.6 53 . . . . . . . . . . . . . . . . . . . . . . . . . . . . . . . . . . 0.01101 85,699 944 85,233 1,874,734 21.9 54. . . . . . . . . . . . . . . . . . . . . . . . . . . . . . . . . . 0.01200 84,755 1,017 84,252 1,789,501 21.1 65 . . . . . . . . . . . . . . . . . . . . . . . . . . . . . . . . . . 0.01303 83,738 1,091 83,166 1,705,249 20.4 56 . . . . . . . . . . . . . . . . . . . . . . . . . . . . . . . . . . 0.01416 82,647 1,170 82,036 1,622,083 19.6 57 . . . . . . . . . . . . . . . . . . . . . . . . . . . . . . . . . . 0.01 !548 81,477 1,262 80,819 1,540,047 18.9 58 . . . . . . . . . . . . . . . . . . . . . . . . . . . . . . . . . . 0.01707 80,215 1,369 79,505 1,459,228 18.2 59 . . . . . . . . . . . . . . . . . . . . . . . . . . . . . . . . . . 0.01886 78,846 1,487 78,076 1,379,723 17.5 60 . . . . . . . . . . . . . . . . . . . . . . . . . . . . . . . . . . 0.02083 77,359 1.612 76,541 1,301,647 16.8
29

Table IV. Life tables by sex United States, 1976 and projections for 2003—Con.
Proportion Of? 00,000 born alive Stationary population Average of persons number of
alive at Number Number In
In this years of life Year, sex, and age beginning of living at dying
the and all remaining at
age interval beginning during subsequent beginning dying during of age age
age interval
age of age
xto x-!-n
1976—Con.
Male—Con.
Femala
o . . . . . . . . . . . . . . . . . . . . . . . . . . . . . . . . . . . 1 ................................... 2 . . . . . . . . . . . . . . . . . . . . . . . . . . . . . . . . . . .
interval intewal interval intervals interval
nqx lx .xd n%L T. &
0.02288 75,747 1,733 74,868 1,225,106 16.2 0.02489 74,014 1,842 73,081 1,150,238 15.5 0.02678 72,172 1,933 71,194 1,077,157 14.9 0.02863 70,239 2,011 69,221 1,005,963 14.3 0.03052 68,228 2,082 67,157 936,742 13.7 0.03261 66,146 2,157 65,038 869,585 13.1 0.03504 63,989 2,242 62,838 804,547 12.6 0.03795 61,747 2,343 60,546 741,709 12.0 0.04130 59,404 2,454 58,147 681,163 11.5 0.04492 56,950 2,558 55,593 623,016 10.9 0.04874 54,392 2,651 52,989 567,423 10.4 0.05294 51,741 2,739 50,294 514:434 9.9 0.05756 49,002 2,821 47,514 464,140 9.5 0.06262 46,181 2,892 44,657 416,626 9.0 0.06809 43,289 2,947 41,751 371,969 8.6 0.07391 40,342 2,982 38,787 330,218 8.2 0.06005 37,360 2,990 35,800 291,431 7,8 0.08644 34,370 2,971 32,820 255,631 7.4 0.09302 31,399 2,921 29,874 222,811 7.1 0.09964 28,478 2,837 27,138 192,937 6.8 0.10608 25,641 2,720 24,358 165,799 6.5 0.11195 22,921 2,566 21,717 141,441 6.2 0.11662 20,355 2,374 19,246 119,724 5.9 0.11912 17,981 2,142 16,988 100,478 5.6 1.00000 15,839 15,839 83,490 83,490 5.3
0.01369 100,000 1,369 98,681 7,665,372 76.7 0.00081 98,631 80 98,585 7,566,691 76.7 0.00065 98,551 64 98,514 7,468,106 75.8 0.00053 98,487 52 98,455 7,369,592 74.8 0.00044 98,435 43 98,408 7,271,137 73.9 0.00037 98,392 36 98,375 7,172,729 72.9 0.00032 98,356 31 98,342 7,074,354 71.9 0.00028 98,325 27 98,313 6,976,012 70.9 0.00024 98,298 24 98,287 6,877,699 70.0 0.00022 98,274 22 98,264 6,779,412 69.0 0.00020 98,252 20 98,241 6,681,148 68.0 0.00020 98,232 20 98,222 6,582,907 67.0 0.00023 98,212 22 98,200 6,484,685 66.0 0.00028 98,190 27 98,175 6,386,485 65.0 0.00034 98,163 34 98,145 6,288,310 64.1 0.00042 98,129 41 98,108 6,190,165 63.1 0.00049 98,088 49 98,064 6,092,057 62.1 0.00055 98,039 54 98,012 5,993,993 61.1 0.00059 97,985 58 97,956 5,895,981 60.2 0.00060 97,927 59 97,897 5,798,025 59.2 0.00062 97,868 60 97,838 5,700,128 58.2 0.00064 97,808 62 97,776 5,602,290 57.3 0.00065 97,746 64 97,714 5,504,514 56.3 0.00066 97,682 65 97,649 5,406,800 55.4 0.00067 97,617 66 97,584 5,309,151 54.4 0.00068 97,551 67 97,519 5,211,567 53.4 0.00070 97,484 68 97,451 5,114,048 52.5 0.00072 97,416 70 97,382 5,016,597 51.5 0.00075 97,346 73 97,311 4,919,215 50.5 0.00079 97,273 76 97,236 4,821,904 49.6 0.00083 97,197 81 97,159 4,724,668 48.6 0.00089 97,116 86 97,076 4,627,509 47.6 0.00094 97.030 92 96,987 4,530,433 46.7
30

Table IV. Life tables by sex United States, 1976 and projections for 2003—Con.
Proportion Of 100,000 born alive Stationary population Average of persons number of
alive at Number Number In
In this years of life Yeac sex, and age beginning of living at dying
the and all remaining at
age interval beginning during subsequent beginning dying during of age age
age age of age
intervalinterval interval interval intervals interval
0 xtox+n n% lx nxd nxL Tx e.
1976—Con.
Female—Con.
33 . . . . . . . . . . . . . . . . . . . . . . . . . . . . . . . . . . 0.00101 96,938 97 96,893 4,433,446 45.7 34 . . . . . . . . . . . . . . . . . . . . . . . . . . . . . . . . . . 0.00107 96,841 104 96,792 4,336,553 44.8 35 . . . . . . . . . . . . . . . . . . . . . . . . . . . . . . . . . . 0.00115 96,737 112 96,680 4,239,761 43.8 36 . . . . . . . . . . . . . . . . . . . . . . . . . . . . . . . . . . 0.00125 96,625 121 96,564 4,143,081 42.9 37 . . . . . . . . . . . . . . . . . . . . . . . . . . . . . . . . . . 0.00136 96,504 131 96,438 4,046,517 41.9 38 . . . . . . . . . . . . . . . . . . . . . . . . . . . . . . ,,. . 0.00150 96,373 144 96,300 3,950,079 41.0 39 . . . . . . . . . . . . . . . . . . . . . . . . . . . . . . . . . , 0.00166 96,229 159 96,149 3,853,779 40.0 40 . . . . . . . . . . . . . . . . . . . . . . . . . . . . . . . . . . 0.00183 96,070 176 95,976 3,757,630 39.1 41 . . . . . . . . . . . . . . . . . . . . ! . . . . . . . . . . . . . 0.00202 95,894 194 95,791 3,661,654 38.2 42 . . . . . . . . . . . . . . . . . . . . . . . . . . . . . . . . . . 0.00223 95,700 213 95,588 3,565,863 37.3
. . . . . . . . . . . . . . . . . . . . . . . . . . . . . . . . . . 0.00245 95,487 234 95,364 3,470,275 36.3 :: . .,.,,.,,,, ,, .,,,..,,, . . . . . . . . . . . . 0.00270 95,253 257 95,119 3,374,911 35.4 45 . . . . . . . . . . . . . . . . . . . . . . . . . . . . . . . . . . 0.00296 94,996 281 94,849 3,279,792 34.5 46 . . . . . . . . . . . . . . . . . . . . . . . . . . . . . . . . . . 0.00325 94,715 308 94,555 3,184,943 33.6 47 . . . . . . . . . .. s. . . . . . . . . . . . . . . . . . . . . . 0.00355 94,407 335 94,233 3,090,388 32.7 48 . . . . . . . . . . . . . . . . . . . . . . . . . . . . . . . . . . 0.00386 94,072 363 93,885 2,996,155 31.8 49 . . . . . . . . . . . . . . . . . . . . . . . . . . . . . . . . . . 0.00418 93,709 392 93,507 2,902,270 31.0 50 . . . . . . . . . . . . . . . . . . . . . . . . . . . . . . . . . . 0.00454 93,317 423 93,101 2,808,763 30.1 51 . . . . . . . . . . . . . . . . . . . . . . . . . . . . . . . . . . 0.00492 92,894 457 92,660 2,715,662 29.2 62 . . . . . . . . . . . . . . . . . . . . . . . . . . . . . . . . . . 0.00534 92,437 493 92,186 2,623,002 28.4 53 . . . . . . . . . . . . . . . . . . . . . . . . . . . . . . . . . . 0.00578 91,944 532 91,673 2,530,816 27.5 54 . . . . . . . . . . . . . . . . . . . . . . . . . . . . . . . . . . 0.00627 91,412 573 91,121 2,439,143 26.7 55 . . . . . . . . . . . . . . . . . . . . . . . . . . . . . . . . . . 0.00677 90,839 615 90,513 2,348,022 25.8 56 . . . . . . . . . . . . . . . . . . . . . . . . . . . . . . . . . . 0.00732 90,224 661 89,875 2,257,509 25.0 57 . . . . . . . . . . . . . . . . . . . . . . . . . . . . . . . . . . 0.00796 89,563 713 89,188 2,167,634 24.2 58 . . . . . . . . . . . . . . . . . . . . . . . . . . . . . . . . . . 0.00871 88,850 774 88,444 2,078,446 23.4 59 . . . . . . . . . . . . . . . . . . . . . . . . . . . . . . . . . . 0.00955 88,076 842 87,636 1,990,002 22.6 60 . . . . . . . . . . . . . . . . . . . . . . . . . . . . . . . . . . 0.01051 87,234 917 86,801 1,902,366 21.8 61 . . . . . . . . . . . . . . . . . . . . . . . . . . . . . . . . . . 0.01150 86,317 993 85,847 1,815,565 21.0 62 . . . . . . . . . . . . . . . . . . . . . . . . . . . . . . . . . . 0.01241 85,324 1,059 84.820 1,729,718 20.3 63 . . . . . . . . . . . . . . . . . . . . . . . . . . . . . . . ,,. 0.01316 84,265 1,109 83,737 1,644,888 19.5
0.01385 83,156 1,151 82,606 1,561,161 18.8 ::::::::::::::::::::::::::::::::::: 0.01454 82,005 1,192 81,412 1,478,555 18.0 66 . . . . . . . . . . . . . . . . . . . . . . . . . . . . . . . . . . 0.01543 80,813 1,247 80,191 1,397,143 17.3 67 . . . . . . . . . . . . . . . . . . . . . . . . . . . . . . . . . . 0.01665 79,666 1,325 78,906 1,316,952 16.6 68. s. . . . . . . . . . . . . . . . . . . . . . . . . . . . . . . . 0.01834 78,241 1,435 77,526 1,238,046 15.8 69 . . . . . . . . . . . . . . . . . . . . . . . . . . . . . . . . . . 0.02044 76,806 1,570 76,024 1,160,520 15.1 70 . . . . . . . . . . . . . . . . . . . . . . . . . . . . . . . . . . 0.02272 75,236 1,709 74,327 1,084,496 14.4 71 . . . . . . . . . . . . . . . . . . . . . . . . . . . . . . . . . . 0.02516 73,527 1,850 72,548 1,010,169 13.7 72 ..,.,...,...,..........,..,.. . . . . . 0.02797 71,677 2,005 70,621 937,621 13.1 73 . . . . . . . . . . . . . . . . . . . . . . . . . . . . . . . . . . 0.03124 69,672 2,177 68,529 867,000 12.4 74 . . . . . . . . . . . . . . . . . . . . . . . . . . . . . . . . . . 0.03492 67,495 2,357 66,263 798,471 11.8 75 . . . . . . . . . . . . . . . . . . . . . . . . . . . . . . . . . . 0.03895 65,138 2,537 63,852 732,208 11.2 76, . . . . . . . . . . . . . .. . . . . . . . . . . . . . . . . . . . 0.04324 62,601 2,707 61,231 668,356 10.7 77 . . . . . . . . . . . . . . . . . . . . . . . . . . . . . . . . . . 0.04776 59,894 2,860 58,446 607,125 10.1 78 . . . . . . . . . . . . . . . . . . . . . . . . . . . . . . . . . . 0.05249 57,034 2,994 55,520 548,679 9.6 79 . . . . . . . . . . . . . . . . . . . . . . . . . . . . . . . . . . 0.05746 54,040 3,105 52,470 493,159 9.1 80 . . . . . . . . . . . . . . . . . . . . . . . . . . . . . . . . . . 0.06271 50,935 3,194 49,315 440,689 8.7 81 . . . . . . . . . . . . . . . . . . . . . . . . . . . . . . . . . . 0.06829 47,741 3,260 46,088 391,374 8.2 82 . . . . . . . . . . . . . . . . . . . . . . . . . . . . . . . . . . 0.07428 44,481 3,304 42,806 345,286 7.8 83 . . . . . . . . . . . . . . . . . . . . . . . . . . . . . . . . . . 0.08076 41,177 3,326 39,491 302.480 7.3 64 . . . . . . . . . . . . . . . . . . . . . . . . . . . . . . . . . . 0.08782 37,851 3,324 36,166 262,989 6.9 85 ..,,..,............,..,....,...,.. 1.00000 34,527 34,527 226,823 226,823 6.6
2003
Male
o . . . . . . . . . . . . . . . . . . . . . . . . . . . . . . . . . . . 0.00547 100,000 547 99,508 7,421,747 74.22 1 , ..,,,,,,.. . . . . . . . . . . . . . . . . . . . . . . . . 0.00057 99,453 57 99,425 7,322,240 73.63 2 . . . . . . . . . . . . . . . . . . . . . . . . . . . . . . . . . . . 0.00035 99,396 34 99,378 7,222,815 72.67 3 ! .!.,..,,.. . . . . . . . . . . . . . . . . . . . . . . . . 0.00027 99,362 27 99,348 7,123,437 71.69
31
1
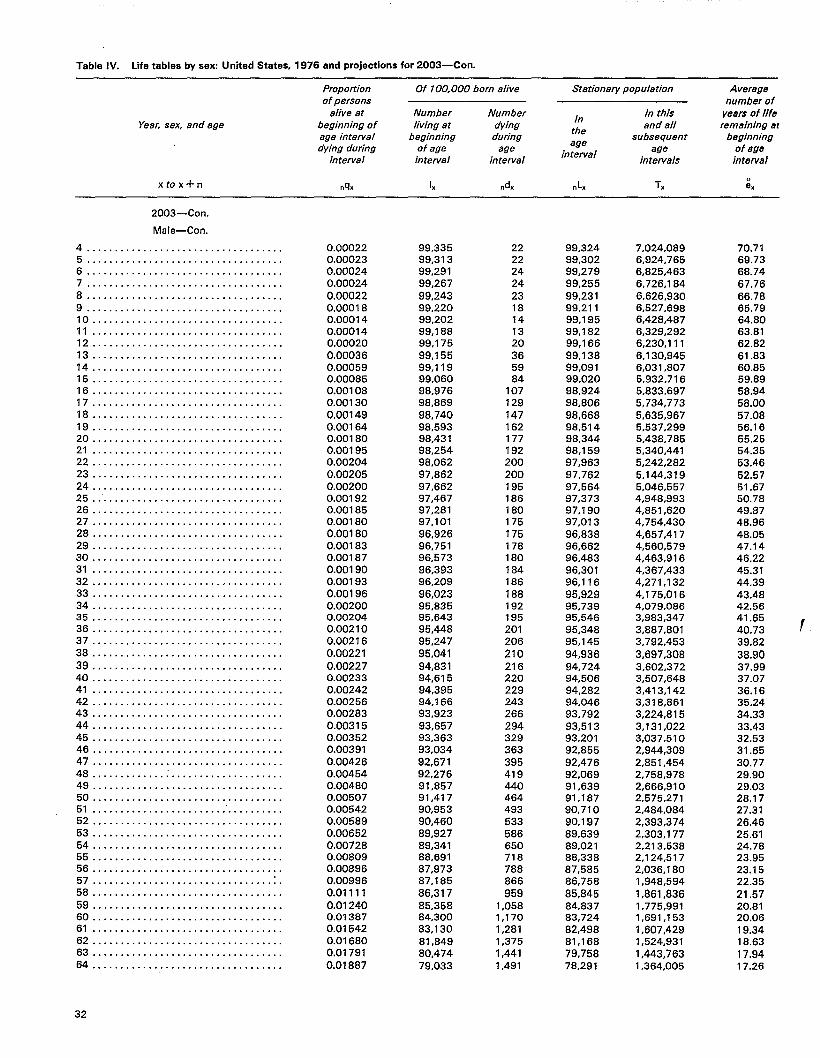
Table IV. Life tables by sex United States, 1976 and projections for 2003—Con.
Proponion Of 100,000 born alive Stationary population Average of persons number of
alive at Number Number In
In this years of life Year. sex, and age beginning of living at dying
the and all remaining al
age interval beginning during subsequent beginning dying during of age age
age interval
age of age
xtox-tn
2003—Con.
Male—Con.
4 . . . . . . . . . . . . . . . . . . . . . . . . . . . . . . . . . . . 5 . . . . . . . . . . . . . . . . . . . . . . . . . . . . . . . . . . . 6 . . . . . . . . . . . . . . . . . . . . . . . . . . . . . . . . . . . 7 . . . . . . . . . . . . . . . . . . . . . . . . . . . . . . . . . . . 8 . . . . . . . . . . . . . . . . . . . . . . . . . . . . . . . . . . . 9 . . . . . . . . . . . . . . . . . . . . . . . . . . . . . . . . . . . lo . . . . . . . . . . . . . . . . . . . . . . . . . . . . . . . . . . 11 . . . . . . . . . . . . . . . . . 4. . . . . . . . . . . . . . . . 12 . . . . . . . . . . . . . . . . . . . . . . . . . . . . . . . . . . 13 . . . . . . . . . . . . . . . . . . . . . . . . . . . . . . . ,., 14 . . . . . . . . . . . . . . . . . . . . . . . . . . . . . . . . . . 15 . . . . . . . . . . . . . . . . . . . . . . . . . . . . . . . . . . 16 . . . . . . . . . . . . . . . . . . . . . . . . . . . . . . . . . . 17 . . . . . . . . . . . . . . . . . . . . . . . . . . . . . . . . . . 18 . . . . . . . . . . . . . . . . . . . . . . . . . . . . . . . . . . 19 . . . . . . . . . . . . . . . . . . . . . . . . . . . . . . . . . . 20 . . . . . . . . . . . . . . . . . . . . . . . . . . . . . . . . . . 21 . . . . . . . . . . . . . . . . . . . . . . . . . . . . . . . . . . 22 . . . . . . . . . . . . . . . . . . . . . . . . . . . . . . . . . . 23 . . . . . . . . . . . . . . . . . . . . . . . . . . . . . . . . . . 24 . . . . . . . . . . . . . . . . . . . . . . . . . . . . . . . .,. 25 . . . . . . . . . . . . . . . . . . . . . . . . . . . . . . . . . . 26 . . . . . . . . . . . . . . . . . . . . . . . . . . . . . . . . . . 27. . . . . . . . . . . . . . . . . . . . . . . . . . . . . . . . . . 28 . . . . . . . . . . . . . . . . . . . . . . . . . . . . . . . . . . 29 . . . . . . . . . . . . . . . . . . . . . . . . . . . . . . . . . . 30 . . . . . . . . . . . . . . . . . . . . . . . . . . . . . . . . . . 31 . . . . . . . . . . . . . . . . . . . . . . . . . . . . . . . . . . 32 . . . . . . . . . . . . . . . . . . . . . . . . . . . . . . . . . . 33 . . . . . . . . . . . . . . . . . . . . . . . . . . . . . . . . . . 34 . . . . . . . . . . . . . . . . . . . . . . . . . . . . . . . . . . 35 . . . . . . . . . . . . . . . . . . . . . . . . . . . . . . . . . . 36 . . . . . . . . . . . . . . . . . . . . . . . . . . . . . . . . . . 37 . . . . . . . . . . . . . . . . . . . . . . . . . . . . . . . .4. 38 . . . . . . . . . . . . . . . . . . . . . . . . . . . . . . . . . . 39, . . . . . . . . . . . . . . . . . . . . . . . . . . . . . . . . . 40 . . . . . . . . . . . . . . . . . . . . . . . . . . . . . . . . . . 41 . . . . . . . . . . . . . . . . . . . . . . . . . . . . . . . . . . 42 . . . . . . . . . . . . . . . . . . . . . . . . . . . . . . . . . . 43 . . . . . . . . . . . . . . . . . . . . . . . . . . . . . . . . . . 44 . . . . . . . . . . . . . . . . . . . . . . . . . . . . . . . . . . 45 . . . . . . . . . . . . . . . . . . . . . . . . . . . . . . . . . . 46 . . . . . . . . . . . . . . . . . . . . . . . . . . . . . . . . . . 47 . . . . . . . . . . . . . . . . . . . . . . . . . . . . . . . . . . 48 . . . . . . . . . . . . . . . . . . . . . . . . . . . . . . . . . . 49 . . . . . . . . . . . . . . . . . . . . . . . . . . . . . . . . . . 50 . . . . . . . . . . . . . . . . . . . . . . . . . . . . . . . . .. 51 . . . . . . . . . . . . . . . . . . . . . ...’..... . . . . . 52 . . . . . . . . . . . . . . . . . . . . . . . . . . . . . . . . . . 53 . . . . . . . . . . . . . . . . . . . . . . . . . . . . . . . . . . 54 . . . . . . . . . . . . . . . . . . . . . . . . . . . . . . . . . . 55 . . . . . . . . . . . . . . . . . . . . . . . . . . . . . . . . . . 56 . . . . . . . . . . . . . . . . . . . . . . . . . . . . . . . . . . 57 . . . . . . . . . . . . . . . . . . . . . . . . . . . . . . . .:. 58 . . . . . . . . . . . . . . . . . . . . . . . . . . . . . . . . . . 59 . . . . . . . . . . . . . . . . . . . . . . . . . . . . . . . . . . 60 . . . . . . . . . . . . . . . . . . . . . . . . . . . . . . . . . . 61 . . . . . . . . . . . . . . . . . . . . . . . . . . . . . . . . . . 62 . . . . . . . . . . . . . . . . . . . . . . . . . . . . . . . . . . 63 . . . . . . . . . . . . . . . . . . . . . . . . . . . . . . . . . . 64 . . . . . . . . . . . . . . . . . . . . . . . . . . . . . . . . . .
intervel interval intervel intervals interval
d nxL T. :xAlx lx n%
0.00022 99,335 22 99,324 7,024.089 70.71 0.00023 99,313 22 99,302 6,924,765 69.73 0.00024 99,291 24 99,279 6,825,463 68.74 0.00024 99,267 24 99,255 6,726,184 67.76 0.00022 99,243 23 99,231 6,626,930 66.78 0.00018 99,220 18 99,211 6,527,698 65.79 0.00014 99,202 14 99,195 6,428,487 64.80 0.00014 99,188 13 99,182 6,329,292 63.81 0.00020 99,175 20 99,166 6,230,111 62.82 0.00036 99,155 36 99,138 6,130,945 61.83 0.00059 99,119 59 99,091 6,037.807 60.85 0.00085 99,060 84 99,020 5,932,716 59.89 0.00108 98,976 107 98,924 5,833,697 58.94 0.00130 98,869 129 98,806 5,734,773 58.00 0.00149 98,740 147 98,668 5,635,967 57.08 0.00164 98,593 162 98,514 5,537,299 56.16 0.00180 98,431 177 98,344 5,438,785 55.25 0.00195 98,254 192 98,159 5,340,441 54.35 0.00204 98,062 200 97,963 5,242,282 53.46 0.00205 97,862 200 97,762 5,144,319 52,57 0.00200 97,662 195 97,564 5,046,557 51.67 0.00192 97,467 186 97,373 4,948,993 50.78 0.00185 97,281 180 97,190 4,851,620 49.87 0.00180 97,101 175 97,013 4,754,430 48.96 0.00180 96,926 175 96,838 4,657.417 48.05 0.00183 96,751 178 96,662 4,560,579 47.14 0.00187 96,573 180 96,483 4,463,916 46.22 0.00190 96,393 184 96,301 4,367,433 45.31 0.00193 96,209 186 96,116 4,271,132 44.39 0.00196 96,023 188 95,929 4,175,016 43.48 0.00200 95,835 192 95,739 4,079,086 42.56 0.00204 95,643 195 95,546 3,983,347 41.65 0.00210 95,448 201 95,348 3,887,801 40.73 0.00216 95,247 206 95,145 3,792,453 39.82 0.00221 95,041 210 94,936 3,697,308 36.90 0.00227 94,831 216 94,724 3,602,372 37.99 0.00233 94,615 220 94,506 3,507,648 37.07 0.00242 94,395 229 94,282 3,413,142 36.16 0.00256 94,166 243 94,046 3,318,861 35.24 0.00283 93,923 266 93,792 3,224,815 34.33 0.00315 93,657 294 93,513 3,131,022 33.43 0.00352 93,363 329 93,201 3,037,510 32.53 0.00391 93,034 363 92,855 2,944,309 31.65 0.00426 92,671 395 92,476 2,851,454 30.77 0.00454 92,276 419 92,069 2,758,978 29.90 0.00480 91,857 440 91,639 2,666,910 29.03 0.00507 91,417 464 91,187 2,575,271 28.17 0.00542 90,953 493 90,710 2,484,084 27.31 0.00589 90,460 533 90,197 2,393,374 26,46 0.00652 89,927 586 89,639 2,303,177 25.61 0.00728 89,341 650 89,021 2,213,538 24.78 0.00809 88,691 718 88,338 2,124,517 23.95 0.00896 87,973 788 87,585 2,036,180 23.15 0.00996 87,185 866 86,758 1,948,594 22.35 0.01111 86,317 959 85,845 1,861,836 21.57 0.01240 85,358 1,058 84,837 1,775,991 20.81 0.01387 84,300 1,170 83,724 1,691,153 20.06 0.01542 83,130 1,281 82,498 1,607,429 19.34 0.01680 81,849 1,375 81,168 1,524,931 18.63 0.01791 80,474 1,441 79,758 1,443,763 17.94 0.01887 79,033 1,491 78,291 1,364,005 17.26
32
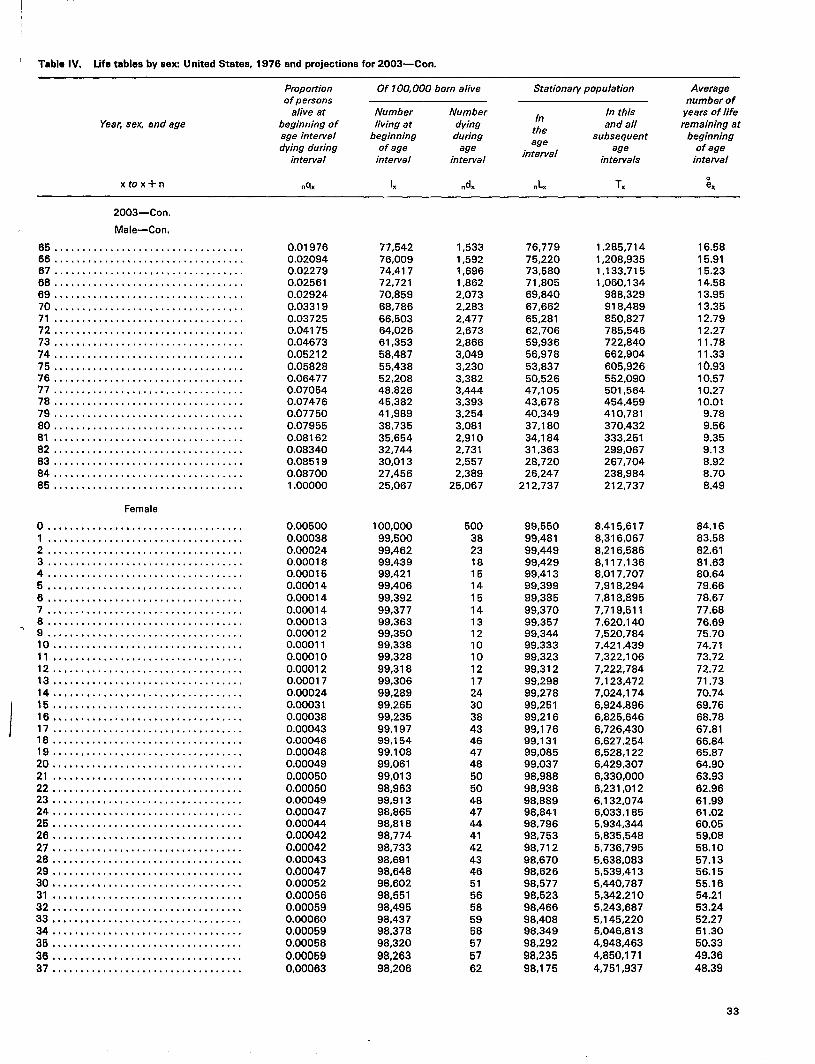
Table IV. Life tables by sex United States, 1976 and projections for 2003—Con.
Propotiion Of 100,000 born alive Stationary population Average of persons number of
alive at Number Number In
In this years of life Year, sex, and age beginning of living at dying
the and all remaining at
age interval beginning during subsequent beginning dying during of age age
age age of age
interval
1
I
xtox+n
2003—Con,
Male—Con,
65 . . . . . . . . . . . . . . . . . . . . . . . . . . . . . . . . . . 66 . . . . . . . . . . . . . . . . . . . . . . . . . . . . . . . . . . 67 . . . . . . . . . . . . . . . . . . . . . . . . . . . . . . . . . . 66 ,., ,., ,., . . . . . . . . . . . . . . . . . . . . . . . . . 69 . . . . . . . . . . . . . . . . . . . . . . . . . . . . . . . . . . 70 . . . . . . . . . . . . . . . . . . . . . . . . . . . . . . . . . . 71 . . . . . . . . . . . . . . . . . . . . . . . . . . . . . . . . . . 72 . . . . . . . . . . . . . . . . . . . . . . . . . . . . . . . . . . 73 . . . . . 8. . . . 8. . . 8. . . . . . . . . . . . . . . . . . . 74 . . . . . . . . . . . . . . . . . . . . . . . . . . . . . . . .,. 76 . . . . . . . . . . . . . . . . . . . . . . . . . . . . . . . . . . 76 . . . . . . . . . ., $..,,.. . . . . . . . . . . . . . . . . 77 . . . . . . . . . . . . . . . . . . . . . . . . . . . . . . . . . . 78 . . . . . . . . . . . . . . . . . . . . . . . . . . . . . . . . . . 79 . . . . . . . . . . . . . . . . . . . . . . . . . . . . . . . . . . 80...! . . . . . . . . . . . . . . . . . . . . . . . . . . . . . . 81 . . . . . . . . . . . . . . . . . . . . . . . . . . . . . . . . . . 82 . . . . . . . . . . . . . . . . . . . . . . . . . . . . . . . . . . 83 , . .,,.,!... . . . . . . . . . . . . . . . . . . . . . . . 84,. . . . . . . . . . . . . . . . . . . . . . . . . . . . . . . . . 86 . . . . . . . . . . . . . . . . . . . . . . . . . . . . . . . . . .
Female
o . . . . . . . . . . . . . . . . . . . . . . . . . . . . . . . . . . . 1 ................................... 2 . . . . . . . . . . . . . . . . . . . . . . . . . . . . . . . . . . . 3 . . . . . . . . . . . . . . . . . . . . . . . . . . . . . . . . . . . 4 . . . . . . . . . . . . . . . . . . . . . . . . . . . . . . . . . . . 5 . . . . . . . . . . . . . . ...!.... . . . . . . . . . . . $, 6 . . . . . . . . . . . ! . .,..,,.., . . . . . . . . . . . . . 7 . . . . . . . . . . . . . . . . . . . . . . . . . . . . . . . . . . . 8 . . . . . . . . . . . . . . . . . . . . . . . . . . . . . . . . . . . 9 . . . . . . . . . . . . . . . . . . . . . . . . . . . . . . . . . . . 10 .,, . . . . . . . . . . . . . . . . . . . . . . . . . . . . . . . 11 . . . . . . . . . . . . . . . . . . . . . . . . . . . . . . . . . . 12 . . . . . . . . . . . . . . . . . . . . . . . . . . . . . . . . . . 13 ,,, ,,, ,,, ,, . .,.,,,.,,. . . . . . . . . . . . . 14 . . . . . . . . . . . . . . . . . . . . . . . . . . . . . . . . . . 15 ,, ..,!,,,.. . . . . . . . . . . . . . . . . . . . . . . . 16 ,, .,,,,,.., . . . . . . . . . . . . . . . . . . . . . . . 17 . . . . . . . . . . . . . . . . . . . . . . . . . . . . . . . . . . 18 . . . . . . . . . . . . . . . . . . . . . . . . . . . . . . . . . . 19,. ,.. ,.O,.. . . . . . . . . . . . . . . . . . . . . . . . 20 .,,,.,...,...,,.,..,,..,...,..,.. , 21 ,,, ,, .,,.,. . . . . . . . . . . . . . . . . . . . . . . . 22,,.., . . . . . . . . . . . . . . . . . . . . . . . . . . . . . 23 ... .,, . . . . . . . . . . . . . . . . . . . . . . . . . . . . 24 . . . . . . . . . . . . . . . . . . . . . . . . . . . . . . . . . . 25 . . . . . . . . . . . . .,...,!,,, . . . . . . . . . . . . 26 . . . . . . . . . . . . . . . . . . . . . . . . . . . . . . . . . . 27 .................................. 26 . . . . . . . . . . . . . . . . . . . . . . . . . . . . . . . . . .
.,, . . . . . ... ..,.. . . . . . . . . . . . . . . . . . . % , .,,,,,.,,, . . . . . . . . . . . . . . . . . . . . . . . 31 . . . . . . . . . . . . . . . . . . . . . . . . . . . . . . . . . . 32 . .,,.,..,,, .,, ,. .,..,, . . . . . . . . . . . . 33, . . . . . . . . . . . . . . . . . . . . . . . . . . . . . . . . . 34 . . . . . . . . . . . . . . . . . . . . . . . . . . . . . . . . . . 36 ,.,.,,,.,... ............,,,,,,,... 36 .................................. 37 ..................................
intewal interval interval intarvals in tarval
0
dnqx lx n% n.L TX ex
0.01976 77,542 1,533 76,779 1,285,714 16.58 0.02094 76,009 1,592 75,220 1,208,935 15.91 0.02279 74,417 1,696 73,580 1,133,715 15.23 0.02561 72,721 1,862 71,805 1,060,134 14.58 0.02924 70,859 2,073 69,840 986,329 13.95 0.03319 68,766 2,283 67,662 918,489 13.35 0.03725 66,503 2,477 65,281 850,827 12.79 0.04175 64,026 2,673 62,706 785,546 12.27 0.04673 61,353 2,866 59,936 722,840 11.76 0.05212 58,487 3,049 56,978 662,904 11.33 0.05828 55,438 3,230 53,837 605,926 1().93 0.06477 52,208 3,382 50,526 552,090 10,57 0.07054 48,826 3,444 47,105 501,564 10.27 0.07476 45,382 3,393 43,678 454,459 10.01 0.07750 41,989 3,254 40,349 410,781 9.78 0.07955 38,735 3,081 37,180 370,432 9.56 0.08162 35,654 2,910 34,184 333,251 9.35 0.08340 32,744 2,731 31,363 299,067 9.13 0.08519 30,013 2,557 28,720 267,704 8.92 0.08700 27,456 2,389 26,247 238,984 8.70 1.00000 25,067 25,067 212,737 212,737 8.49
0.00500 100,000 500 99,550 8,415,617 84.16 0.00038 99,500 38 99,481 8,316,067 83.56 0.00024 99,462 23 99,449 8,216,586 82.61 0.00018 99,439 18 99,429 8,117,136 81.63 0.00015 99,421 15 99,413 8,017,707 80.64 0.00014 99,406 14 99,399 7,918,294 79.66 0.00014 99,392 15 99,385 7,818,895 78.67 0.00014 99,377 14 99,370 7,719,511 77.68 0.00013 99,363 13 99,357 7,620,140 76.69 0.00012 99,350 12 99,344 7,520,784 75.70 0.00011 99,338 10 99,333 7,421,439 74.71 0.00010 99,328 10 99,323 7,322,106 73.72 0.00012 99,318 12 99,312 7,222,784 72.72 0.00017 99,306 17 99,298 7,123,472 71.73 0.00024 99,289 24 99,278 7,024,174 70.74 0.00031 99,265 30 99,251 6,924,896 69.76 0.00038 99,235 38 99,216 6,825,646 68.78 0.00043 99,197 43 99,176 6,726,430 67.81 0.00046 99,154 46 99,131 6,627,254 66.84 0.00046 99,108 47 99,085 6,528,122 65.87 0.00049 99,061 48 99,037 6,429,307 64.90 0.00050 99,013 50 98,988 6,330,000 63.93 0.00050 98,963 50 98,938 6,231,012 62.96 0.00049 98,913 48 98,889 6,132,074 61.99 0.00047 98,865 47 98,841 6,033,185 61.02 0.00044 98,818 44 98,796 5,934,344 60.05 0.00042 96,774 41 98,753 5,835,548 59,08 0.00042 98,733 42 98,712 5,736,795 58.10 0.00043 98,691 43 98,670 5,638,083 57.13 0.00047 98,648 46 98,626 5,539,413 56.15 0.00052 96,602 51 98,577 5,440,767 55.16 0.00056 98,551 56 98,523 5,342,210 54.21 0.00059 98,495 58 98,466 5,243,687 53.24 0.00060 98,437 59 98,408 5,145,220 52.27 0.00059 98,378 56 98,349 5,046,613 51.30 0.00058 98,320 57 98,292 4,946,463 50.33 0.00059 98,263 57 98,235 4,850,171 49.36 0.00063 98.206 62 98,175 4,751,937 48.39
33

Table IV. Life tables by sex United States, 1976 and projections for 2003—Con.
Propotiion Of 100,000 born alive Stationary population Average of persons number of
alive at Number Number In
In this years of life Yeafi sex, and age beginning of living at dying
tha and all remaining a.’
age interval beginning during subsequent beginning dying during of age age
aga intarval
age of age
xtox+n
2003—Con.
Female—Con.
38 . . . . . . . . . . . . . . . . . . . . . . . . . . . . . . . . . . 39 . . . . . . . . . . . . . . . . . . . . . . . . . . . . . . . . . . 40 . . . . . . . . . . . . . . . . . . . . . . . . . . . . . . . . . . 41 . . . . . . . . . . . . . . . . . . . . . . . . . . . . . . . . . . 42 . . . . . . . . . . . . . . . . . . . . . . . . . . . . . . . . . . 43 . . . . . . . . . . . . . . . . . . . . . . . . . . . . . . . . . . 44 . . . . . . . . . . . . . . . . . . . . . . . . . . . . . . . . . . 45. . . . . . . . . . . . . . . . . . . . . . . . . . . . . . . . . . 46 . . . . . . . . . . . . . . . . . . . . . . . . . . . . . . . . . . 47 . . . . . . . . . . . . . . . . . . . . . . . . . . . . . . . . . . 48 . . . . . . . . . . . . . . . . . . . . . . . . . . . . . . . . . . 49 . . . . . . . . . . . . . . . . . . . . . . . . . . . . . . . . . . 50 . . . . . . . . . . . . . . . . . . . . . . . . . . . . . . . . . . 51 . . . . . . . . . . . . . . . . . . . . . . . . . . . . . . . . . . 52 . . . . . . . . . . . . . . . . . . . . . . . . . . . . . . . . . . 53 . . . . . . . . . . . . . . . . . . . . . . . . . . . . . . . . . . 54 . . . . . . . . . . . . . . . . . . . . . . . . . . . . . . . . . . 55 . . . . . . . . . . . . . . . . . . . . . . . . . . . . . . . . . . 56 . . . . . . . . . . . . . . . . . . . . . . . . . . . . . . . . . . 57 . . . . . . . . . . . . . . . . . . . . . . . . . . . . . . . . . . 58 . . . . . . . . . . . . . . . . . . . . . . . . . . . . . . . . . . 59 . . . . . . . . . . . . . . . . . . . . . . . . . . . . . . . . . . 60 . . . . . . . . . . . . . . . . . . . . . . . . . . . . . . . . . . 61 . . . . . . . . . . . . . . . . . . . . . . . . . . . . . . . . . . 62 . . . . . . . . . . . . . . . . . . . . . . . . . . . . . . . . . . 63 . . . . . . . . . . . . . . . . . . . . . . . . . . . . . . . . . . 64 . . . . . . . . . . . . . . . . . . . . . . . . . . . . . . . . . . 65 . . . . . . . . . . . . . . . . . . . . . . . . . . . . . . . . . . 66 . . . . . . . . . . . . . . . . . . . . . . . . . . . . . . . . . . 67 . . . . . . . . . . . . . . . . . . . . . . . . . . . . . . . . . . 68 . . . . . . . . . . . . . . . . . . . . . . . . . . . . . . . . . . 69 . . . . . . . . . . . . . . . . . . . . . . . . . . . . . . . . . . 70 . . . . . . . . . . . . . . . . . . . . . . . . . . . . . . . . . . 71 . . . . . . . . . . . . . . . . . . . . . . . . . . . . . . . . . . 72 . . . . . . . . . . . . . . . . . . . . . . . . . . . . . . . . . . 73 . . . . . . . . . . . . . . . . . . . . . . . . . . . . . . . . . . 74 . . . . . . . . . . . . . . . . . . . . . . . . . . . . . . . . . . 75 . . . . . . . . . . . . . . . . . . . . . . . . . . . . . . . . . . 76 . . . . . . . . . . . . . . . . . . . . . . . . . . . . . . . . . . 77 : . . . . . . . . . . . . . . . . . . . . . . . . . . . . . . . . . 78 . . . . . . . . . . . . . . . . . . . . . . . . . . . . . . . . . . 79 . . . . . . . . . . . . . . . . . . . . . . . . . . . . . . . . . . 80 . . . . . . . . . . . . . . . . . . . . . . . . . . . . . . . . . . 81 . . . . . . . . . . . . . . . . . . . . . . . . . . . . . . . . . . 82 . . . . . . . . . . . . . . . . . . . . . . . . . . . . . . . . . . 83 . . . . . . . . . . . . . . . . . . . . . . . . . . . . . . . . . . 84 . . . . . . . . . . . . . . . . . . . . . . . . . . . . . . . . . . 85 . . . . . . . . . . . . . . . . . . . . . . . . . . . . . . . . ,.
intewal intarval intewal intervals interval
n% lx nxd .xL Tx
0.00071 98,144 70 98,110 4,653,762 47.42 0.00083 98,074 81 98,035 4,555,652 46.45 0.00096 87,993 94 97,947 4,457,618 45.49 0.00110 97,899 107 97,847 4,359,670 44.53 0,00125 97,782 122 97,732 4,261,824 43.58 0.00140 97,670 137 97,603 4,164,091 42.63 0.00157 97,533 153 97,458 4,066,488 41.69 0.00176 97,380 171 97,296 3,969,030 40.76 0.00198 97,209 192 97,114 3,871,734 39.83 0.00278 97,017 212 96,912 3,774,619 38.91 0.00237 96,805 230 96,691 3,677,707 37.99 0.00256 96,575 247 96,453 3,581,016 37.08 0.00275 96,328 265 96,197 3,484,563 36.17 0.00298 96,063 287 95,922 3,388,366 35.27 0.00333 95,776 316 95,620 3,292,444 34.38 0.00382 95,458 365 95,280 3,196,824 33.49 0.00442 95,093 420 94,888 3,101,544 32.62 0.00504 94,673 477 94,439 3,006,656 31.76 0.00565 94,196 532 93,934 2,912,217 30.92 0.00627 93,664 588 93,376 2,818,283 30.09 0.00690 93,076 642 92,760 2,724,908 29.28 0.00751 92,434 694 92,092 2,632,149 28.48 0.00825 91,740 757 91,366 2,540,057 27.69 0.00897 90,983 817 90,578 2,448,691 26.91 0.00937 90,166 844 89,745 2,358,112 26.15 0.00930 89,322 830 88,904 2,268,368 25.40 0.00893 88,492 791 88,093 2,179,463 24.63 0.00842 87,701 739 87,328 2,091,371 23.85 0.00817 86,862 710 86,607 2,004,042 23.04 0.00851 86,252 734 85,890 1,917,435 22.23 0.00972 85,518 832 85,112 1,831,545 21.42 0.01161 84,686 983 84,208 1,746,432 20.62 0.01373 83,703 1,149 83,142 1,662,224 19.86 , 0.01585 82,554 1,308 81,913 1,579,063 19,13 0.01814 81,245 1,473 80,523 1,497,170 18.43 0.02056 79,772 1,640 78,966 1,416,647 17.76 0.02309 78,132 1,804 77,244 1,337,681 17.12 0.02586 76,328 1,974 75,355 1,260,438 16.51 0.02874 74,354 2,137 73,298 1,185,083 15.94 0.03143 72,217 2,270 71,091 1,111,784 15.40 0.03375 69,947 2,361 68,773 1,040,693 14.88 0.03579 67,586 2,419 66,381 971,920 14,38 0,03782 65,167 2,465 63,939 905,539 13.90 0.04002 62,702 2,509 61,451 84T ,601 13.42 0.04230 60,193 2,547 58,922 780,150 12.96 0.04472 57,646 2,578 56,360 721,227 12.51 0.04731 55,068 2,605 53,767 664,868 12.07 1.00000 52,463 52,463 611,100 611,100 11.65
34
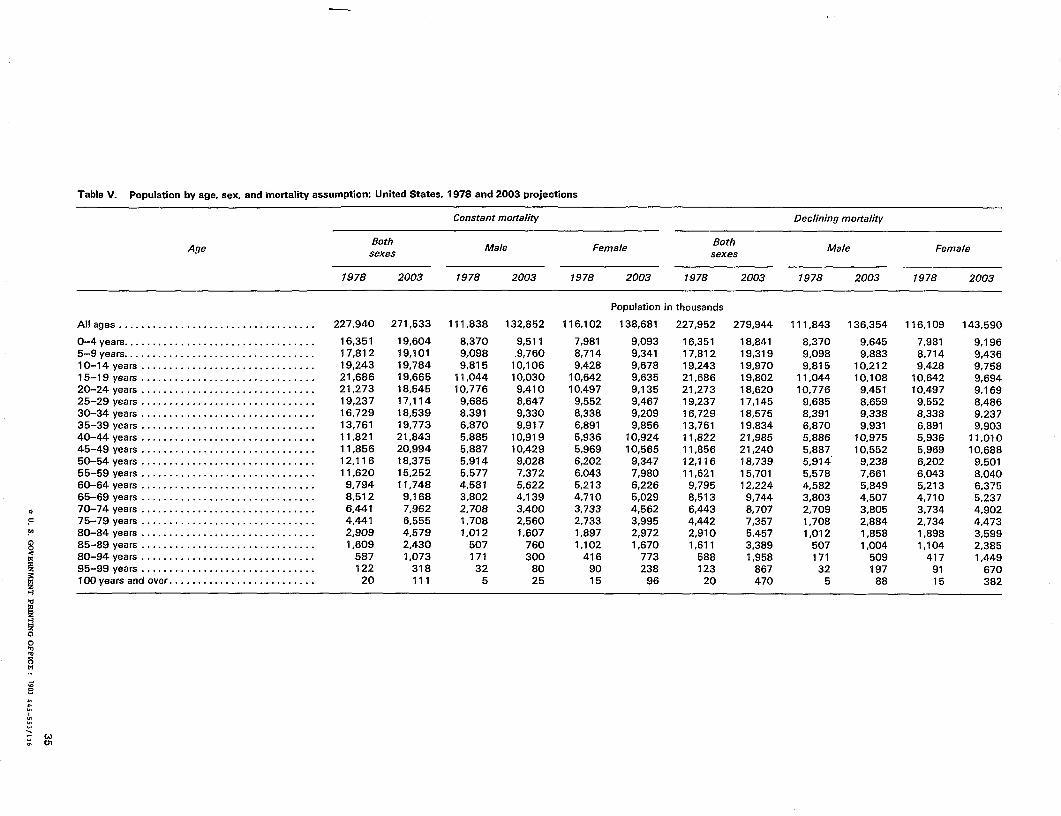
Table V. Population by age, sex, and ‘mortality assumption United Statea, 1978 and 2003 projections
Age
Alleges . . . . . . . . . . . . . . . . . . . . . . . . . . . . . . . . . . .
0-4years . . . . . . . . . . . . . . . . . . . . . . . . . . . . . . . . . . 5-9 yeara . . . . . . . . . . . . . . . . . . . . . . . . . . . . . . . . . . 10-14 years . . . . . . . . . . . . . . . . . . . . . . . . . . . . . . . 15-19 yaars . . . . . . . . . . . . . . . . . . . . . . . . . . . . . . . 20-24 years . . . . . . . . . . . . . . . . . . . . . . . . . . . . . . . 25-29 years . . . . . . . . . . . . . . . . . . . . . . . . . . . . . . . 30-34 years . . . . . . . . . . . . . . . . . . . . . . . . . . . . . . . 35-39 years . . . . . . . . . . . . . . . . . . . . . . . . . . . . . . . 40-44 years . . . . . . . . . . . . . . . . . . . . . . . . . . . . . . . 45-49 years . . . . . . . . . . . . . . . . . . . . . . . . . . . . . . . 50-54 years . . . . . . . . . . . . . . . . . . . . . . . . . . . . . . . 55-59 years . . . . . . . . . . . . . . . . . . . . . . . . . . . . . . . 60-64 years . . . . . . . . . . . . . . . . . . . . . . . . . . . . . . . 65-69 years . . . . . . . . . . . . . . . . . . . . . . . . . . . . . . . 70-74 years . . . . . . . . . . . . . . . . . . . . . . . . . . . . . . . 75-79 years . . . . . . . . . . . . . . . . . . . . . . . . . . . . . . . 80-84 years . . . . . . . . . . . . . . . . . . . . . . . . . . . . . . . 85-89 years . . . . . . . . . . . . . . . . . . . . . . . . . . . . . . . 80-94 years . . . . . . . . . . . . . . . . . . . . . . . . . . . . . . . 95-99 years . . . . . . . . . . . . . . . . . . . . . . . . . . . . . . . 100years and over . . . . . . . . . . . . . . . . . . . . . . . . . .
Constant mortality Declining mortality
Both BothMale Female Male Female
sexes sexes
1978 2003 1978 2003 1978 2003 1978 2003 1978 2003 1978 2003
Population in thousands
227,940 271,533 111,838 132,852 116,102 138,681 227,952 279,944 111,843 136,354 116,109 143,590
16,351 19,604 8,370 9,511 7,981 9,093 16,351 18,841 8,370 9,645 7,981 9,196 17,812 19,101 9,098 .9,760 8,714 9,341 17,812 19,319 9,098 9,883 8,714 9,436 19,243 19,784 9,815 10,106 9,428 9,678 19,243 19,970 9,815 10,212 9,428 9,758 21,686 19,665 11,044 10,030 10,642 9,635 21,686 19,802 11,044 10,108 10,642 9,694 21,273 18,545 10,776 9,410 10,497 9,135 21,273 18,620 10,776 9,451 10,497 9,169 19,237 17,114 9,685 8,647 9,552 9,467 19,237 17,145 9,685 8,659 9,552 8,486 16,729 18,539 8,391 9,330 8,338 9,209 16,729 18,575 8,391 9,338 8,338 9,237 13,761 19,773 6,870 9,917 6,891 9,856 13,761 19,834 6,870 9,931 6,891 9,903 11,821 21,843 5,885 10,919 5,936 10,924 11,822 21,985 5,886 10,975 5,936 11,010 11,856 20,994 5,887 10,429 5,969 10,565 11,856 21,240 5,887 10,552 5,969 10,688 12,116 18,375 5,914 9,028 6,202 9,347 12,116 18,739 5,914” 9,238 6,202 9,501 11,620 15,252 5,577 7,372 6,043 7,980 11,621 15.701 5,578 7,661 6,043 8,040
9,794 11,748 4,581 5,622 5,213 6,226 9,795 12,224 4,582 5,849 5,213 6,375 8,512 9,168 3,802 4,139 4,710 5,029 8,513 9,744 3,803 4,507 4,710 5,237 6,441 7,962 2,708 3,400 3,733 4,562 6,443 8,707 2,709 3,805 3.734 4,902 4,441 6,555 1,708 2,560 2,733 3,995 4,442 7,357 1,708 2,884 2,734 4,473 2,909 4,579 1,012 1,607 1,897 2,972 2,910 5,457 1,012 1,858 1,898 3,599 1,609 2,430 507 760 1,102 1.670 1,611 3,389 507 1.004 1,104 2,385
587 1,073 171 300 416 773 588 1,958 171 509 417 1.449 122 318 32 80 90 238 123 867 32 197 91 670 20 111 5 25 15 96 20 470 5 88 15 382
..

I
~ Vital and Health Statistics series descriptions
i
SERIES 1.
SERIES 2.
SERIES 3.
SERIES 4.
SERIES 10.
SERIES 11.
SERIES 12.i
SERIES 13.
Programs and Collection Procedures—Reports describing
the general programs of the National Center for Health Sta
tistics and Its offices and dwtslons and the data collection
methods used. They also include definitions and other mate-
rial necessary for understanding the data.
Data Evaluation and Methods Research—Studies of new
statistical methodology including expert mental tests of new
survey methods, studies of vital statistics collection methods,
new analytical techniques, objective evaluations of reliabil
ity of collected data, and contributions to statistical theory.
Analytical and Epidemiological Studies—Reports present
ing analytical or Interpretwe studies based on wtal and
health statcstlcs, carrying the analysls further than the expos
itory types of reports In the other series.
Documents and Committee Reports-Final reports of ma
jor committees concerned with vital and health statistics
and documents such as recommended model vital registra
tion laws and revised birth and death certificate.
Data From the National Health interview Survey-Statistics
on illness, accidental injuries, disability, use of hospital,
medical, dental, and other services, and other health-related
topics, all based on data collected in the continuing national
household interwew survey.
Data From the National Health Examination Survey and
the National Health and Nutrition Examination Survey—
Data from direct examination, testing, and measurement of
national samples of the civillan nonlnstltutrona lized popu
lation provide the basis for (1) estimates of the medically
defined prevalence of specific diseases in the United States
and the distributions of the population with respect to physical, physiological, and psychological characteristics
and(2) analysis of relationships among the various measure
ments without reference to an expllclt finite universe of
persons.
Data From the Institutionalized Population Surveys— Dis
contlnuedln 1975. Reponsfrom these surveys are included
m Series 13.
Data on Health Resources Utilization—Statistics on the
utilization of health manpower and facilities providing long-
term care, ambulatory care, hospital care, and family planning
services.
SERIES 14 Data on Health Resources: Manpower and Facilities—
Statistics on the numbers, geographic distribution, and char
acteristics of health resources including physicians, dentists,
nurses, other health occupations, hospitals, nursing homes,
and outpatient facilities.
SERIES 15 Data From Special Surveys-Statistics on health and health-
related topics collected in special surveys that are not a part
of the continuing data systems of the National Center for
Health Statistics.
SERIES 20 Data on MortaliW-Various stet]stics on mortality other
than as included in regular annual or monthly reports. Spe
cial analyses by cause of death, age, and other demographic
variables; geographic and time series analyses; and statis
tics on characteristics of deaths not available from the vital
records based on sample surveys of those records.
SERIES 21 Data on Natality, Marriage, and Divorce—Various statis
tics on natallty, marriage, and divorce other than as included
In regular annual or monthly reports. Spec!al analyses by
demographic variables; geographic and time series anal
yses; studies of fertility: and statistics on charactermtics of
b!rths not available from the vital records based on sample
surveys of those records.
SERIES 22 Data From the National Monthly and Natality Surveys—
Discontinued in 1975. Reports from these sample surveys
based on vital records are Included in Series 20 and 21,
respectively.
SERIES 23 Data From the National Survey of Family Growth-Statls
tlcs on fertility, family formation and dissolution, fam!ly plan
ning, and related maternal and infant health topics derived
froma perlodicsuweyofa nationwide probability sample of
ever-married women 15–44 yeara of age.
For a Iiat of titles of reports pub18ahed In these series, write to:
Sc]entlfic and Technical Information Branch
National Center for Health Statwtlcs
Public Health Service
Hyattsville, Md. 20782
301–436–NCHS