pharmaceutical solutions with ultraperformance lc...©2007 waters corporation evaluation form we...
TRANSCRIPT

©2007 Waters Corporation
Pharmaceutical Solutions Pharmaceutical Solutions With UltraPerformance LCWith UltraPerformance LC®®

©2007 Waters Corporation
Evaluation Form
We Appreciate your Opinion
Please complete Evaluation FormQualify for drawing to win a $25 AMEX gift card (drawn at end of this session – must be present to win)
AND
Qualify to win a “Gold Package” registration to Inform 2007 ($1,595 value; one winner per day; winner to be notified post-Pittcon)
Thank You!

©2007 Waters Corporation 3
Requirements for High Requirements for High Resolution SeparationsResolution Separations
Liquid Chromatography and LC/MS are key in the pharmaceutical business developmentLC and LC/MS is used in the areas of high throughput screening, impurity profiling, metabolite ID, bioanalysis, quality control and product releaseThese activities are critical to the development of new drug productsIn these analysis there is a need for rapid, high resolution separations to ensure:-—The detection of all of the analytes in the sample—High throughput for productivity—Maximization of sensitivity
©2007 Waters Corporation 4
Analytical ChallengesAnalytical Challenges
Simple rapid development of analysis
High resolution separations to ensure the full characterization of samples
Easy simple transfer from HPLC to UPLC®
Fast sensitive detectors
Robust analysis

©2007 Waters Corporation 5
Improving ChromatographyImproving ChromatographyBenefits ofBenefits of UPLCUPLC®®
Analyte detection in LC and LC/MS depends upon a high quality LC separation
OptionsOptions— LC resolution can be improved by increasing column length
or reducing particle size
— Column efficient increases with the square root of the column length, but is inversely proportional to particle size
— Small particles give increased performance with reduced analysis time
— Increased column length results in longer analysis times
The best choice is to use smaller particles and The best choice is to use smaller particles and shorter columns. With the exception of chiral.shorter columns. With the exception of chiral.

©2007 Waters Corporation 6
ACQUITY Ultra Performance LCACQUITY Ultra Performance LC®®
UPLCUPLC®®
UPLC (Ultra Performance LC) leverages the theories and principles of HPLC with sub 2μm particles
Generates ultra high resolution chromatograms
Improved Chromatographic efficiency results in more sensitive analysis
Requires a LC system with very low system volumes
Give rise to fast analysis for increased throughput, sensitivity and peak capacity

©2007 Waters Corporation 7
Smaller ParticlesSmaller Particlesthe enabler of productivitythe enabler of productivity
6
Optimum combination of
speed, resolution and sensitivity
2
4
68
10
12
14
16
18
20
22
24
26
28
30
0 0.5 1 1.5 2 2.5 3 3.5 4
Linear Velocity u (mm/sec)
H (µ
m)
5 µm Particle
HETP
Existing HPLCTechnology
5
Rs = N4 ( α -1
α ) kk+1( )
RetentivitySelectivitySystemEfficiency
Rs = N4N4 ( α -1
α ) kk+1( )
RetentivitySelectivitySystemEfficiency
Efficiency is the key to easier method development faster analysis and more sensitive detection

©2007 Waters Corporation 8
Minutes2.00 4.00 6.00 8.00 10.00 12.00 14.00 16.00 18.00
UPLCUPLC®® Method OptionsMethod Optionsincreased resolution or same resolution fasterincreased resolution or same resolution faster
2.1 x 150 mm, 5 µmRs (2,3) = 4.29
12 3
HPLC
20.00
0.26
Abs
orba
nce
at 2
70 n
m
0.00
Minutes0.40 0.80 1.20 1.60 2.00 2.50
2.1 x 50 mm, 1.7 µmRs (2,3) = 4.281
23
8X Speed3.4X SensitivitySame Resolution
0.26
Abs
orba
nce
at 2
70 n
m
0.00
UPLC
Faster, More Sensitive Methods
Minutes0.50 1.00 1.50 2.00 2.50 3.00 3.50 4.00
3
2.1 x 100 mm, 1.7 µmRs (2,3) = 6.38
1
2
4.5X Speed2X Sensitivity1.5X Resolution
4.50
0.26
Abs
orba
nce
at 2
70 n
m
0.00
UPLC
Faster, More Sensitive, Higher Resolution Methods

©2007 Waters Corporation 9
Transfer of a LC MethodTransfer of a LC MethodHPLC to UPLCHPLC to UPLC®®
Transferring of a method from HPLC to UPLC®
involves a few simple steps:-—Scaling of the column geometry
—Scaling of the flow rate to match the new particle size
—Selection of method required, same efficiency, maximum efficiency, fastest analysis
This can be done manually or with the ACQUITY UPLC® Calculator
Giving simple easy method transfer

©2007 Waters Corporation 10
HPLC Separation of SimvastatinHPLC Separation of Simvastatin
O
OO
OOH
CH3 CH3 CH3
CH3
CH3H
Channel: W2996 238.0nm-1.2; Processed Channel: W2996 PDA 238.0 nm at 1.2; Injection: 3; Date Acquired: 10/5/2006 10:12:29 AM EDT; Result Id: 1318; Processing Method: Simvastatin BEH 4_6 x 250
9.28
1
AU
0.00
0.02
0.04
0.06
0.08
0.10
0.12
0.14
0.16
0.18
0.20
0.22
Minutes2.00 4.00 6.00 8.00 10.00 12.00 14.00 16.00 18.00 20.00
Efficiency = 12112

©2007 Waters Corporation 11
Transfer of Method to UPLCTransfer of Method to UPLC®®

©2007 Waters Corporation 12
ACQIUTY UPLCACQIUTY UPLC®®
rapid simple method transferrapid simple method transfer
Sim
vast
atin
- 1.
412
AU
0.00
0.07
0.14
0.21
Minutes0.00 0.50 1.00 1.50
Sim
vast
atin
- 1.
921
AU
0.00
0.07
0.14
0.21
Minutes0.00 0.50 1.00 1.50 2.00 2.50
Sim
vast
atin
- 0.
234
AU
0.00
0.03
0.06
0.09
Minutes0.00 0.50 1.00 1.50
Efficiency = 17685
Maximum EfficiencyMaximum Efficiency Equal EfficiencyEqual Efficiency Fastest AnalysisFastest Analysis
Efficiency = 12874 Efficiency = 977

©2007 Waters Corporation 13
Impurity ProfilingImpurity ProfilingRanitidine Ranitidine
Ranitidine HCl, Zantac®
Ranitidine is in a class of drugs called histamine receptor antagonists. Ranitidine works by decreasing the amount of acid the stomach produces
Aim of this study was to develop a MS compatible UPLC method for the analysis of the impurities in ranitidine
Compare performance to that of traditional HPLC

©2007 Waters Corporation 14
CH3NH
O
ONH
N SCH3
CH3
N+O-
O
S - oxide [M+H] = 331.1440 (C)
N+
O
O-
O
NH
NH
N
S
CH3 CH3
CH3
Ranitidine [M+H] = 315.1491 (active)
R - ethanamine [M+H] = 215.1218 (F)
O NH2
N
S
CH3 CH3
O
N+
O
O-
O
NH
N
S
CH3 CH3
R-nitroacetamide [M+H] = 301.1174 (E)
CH3
NH
ONH
N S
CH3 CH3
N+O-
O
O
N - oxide [M+H] = 331.1440
CH3
OH
N
NH
S
N
R - one oxime [M+H] = 160.0544 (A)
CH3
NH
NH
S
CH3N
CH3
O
N+
O-
O
CH3
NH
NH
S
CH3N
CH3
O
N+
O-
Oadduct [M+H] = 641.2903 (J)
N,N bis [M+H] = 498.2208
O
NH
N
S
CH3 CH3
N+ O
-
O
2
RanitidineRanitidineknown impuritiesknown impurities

©2007 Waters Corporation 15
HPLC ChromatogramHPLC ChromatogramRanitidine ImpuritiesRanitidine Impurities
AU
-0.010
0.000
0.010
0.020
0.030
0.040
0.050
0.060
0.070
0.080
Minutes0.00 2.00 4.00 6.00 8.00 10.00 12.00 14.00 16.00 18.00 20.00 22.00 24.00 26.00 28.00 30.00
A
B
C
DE
F
G - Active
H
I
J
*K
AU
-0.010
0.000
0.010
0.020
0.030
0.040
0.050
0.060
0.070
0.080
Minutes0.00 2.00 4.00 6.00 8.00 10.00 12.00 14.00 16.00 18.00 20.00 22.00 24.00 26.00 28.00 30.00
A
B
C
DE
F
G - Active
H
I
J
*K

©2007 Waters Corporation 16
Method DevelopmentMethod Developmentreversedreversed--phase column selectivity chartphase column selectivity chart
(ln [k] acenaphthene)
SunFire ™ C18
YMC-Pack™ PolymerC18™
Hypersil® CPS Cyano
YMC-Pack™ CN
Waters Spherisorb® S5 P
Hypersil® BDS PhenylNova-Pak® Phenyl
YMC-Pack™Phenyl
Hypersil® PhenylInertsil® Ph-3
YMC-Pack™ Pro C4™
YMCbasic™
Symmetry® C8YMC-Pack™ Pro C8™
Nova-Pak®C8
XTerra® MS C18 Symmetry® C18
YMC-Pack™Pro C18™
Inertsil® ODS-3
YMC-Pack™ ODS-A™
Nova-Pak®C18
YMC J'sphere™ODS–L80 Nucleosil® C18
Waters Spherisorb® ODS2
Waters Spherisorb® ODS1Resolve® C18
µBondapak™ C18
YMC-Pack™ ODS–AQ™YMC J'sphere™ ODS–H80
YMC J'sphere™ ODS–M80
Inertsil® CN-3
Waters Spherisorb® S5CN
Nova-Pak® CN HP
SymmetryShield™ RP8
SymmetryShield™ RP18XTerra® RP8
XTerra® RP18
-0.6-0.3
0
0.3
0.60.9
1.2
1.51.8
2.12.42.7
33.3
3.6
-1.5 -0.5 0.5 1.5 2.5 3.5
(ln [α
] am
itrip
tylin
e/ac
enap
hthe
ne)
XTerra® MS C8Luna ®C18 (2)
ACQUITY UPLC™BEH C18
XTerra ®Phenyl Luna ™
Phenyl Hexyl
ChromolithTM RP-18 Atlantis® dC18
Zorbax® XDB C18ACT Ace® C18
Zorbax® SB C18
SunFire ™ C8
Luna®C8 (2)
ACQUITY UPLC™Shield RP18
ACQUITY UPLC™BEH C8
ACQUITY UPLC™
BEH Phenyl

©2007 Waters Corporation 17
Choosing The Best Column for SeparationChoosing The Best Column for SeparationACQUITY UPLCACQUITY UPLC®® ColumnsColumns
ACQUITY UPLC® BEH C18
ACQUITY UPLC ® BEH C8
ACQUITY UPLC ® BEH Shield RP18
ACQUITY UPLC™ BEH Phenyl
USP L11
USP L1
USP L7
USP L1
Revisions are currently under way to formally include 1.7μm particles in the USP listings

©2007 Waters Corporation 18
ACQUITY UPLCACQUITY UPLC®® Column ManagerColumn Manager
Thermostatted from 10 - 90°C
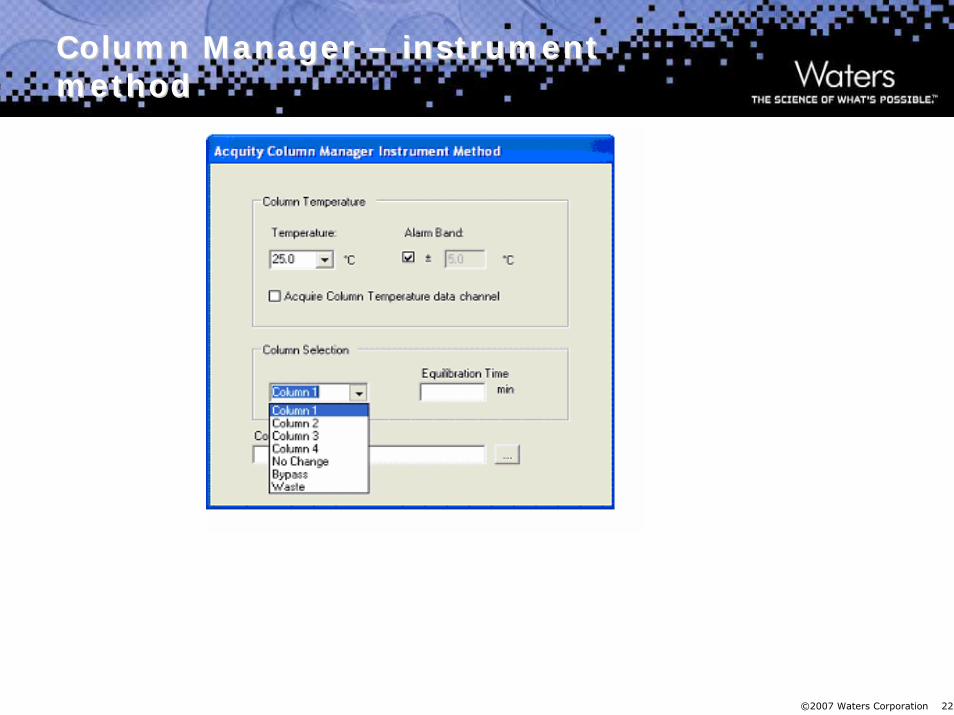
Automated switching among four columns and a bypass channel
eCord™ Information Management for each column
Accepts column sizes from 2.1x 30mm to 4.6 x 150mm
Passive pre-column solvent heating and post-column cooling

©2007 Waters Corporation 19
ACQUITY UPLCACQUITY UPLC®® System with column System with column manager and SQD,TUV and ELSDmanager and SQD,TUV and ELSD

©2007 Waters Corporation 20
ACQUITYACQUITY®® Column ManagerColumn ManagerFour 2.1 x 50mm columns installedFour 2.1 x 50mm columns installed
©2007 Waters Corporation 21
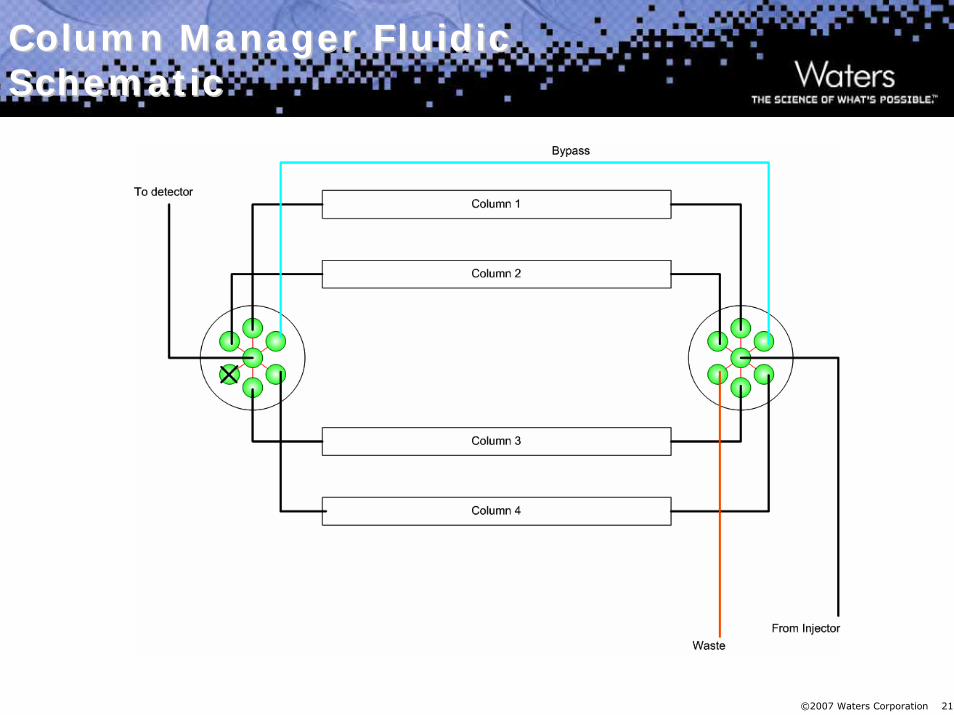
Column Manager Fluidic Column Manager Fluidic SchematicSchematic
©2007 Waters Corporation 22
Column Manager Column Manager –– instrument instrument methodmethod

©2007 Waters Corporation 23
AU
0.00
0.02
0.04
AU
0.00
0.02
0.04
AU
0.00
0.02
0.04
AU
0.00
0.02
0.04
Minutes0.50 1.00 1.50 2.00 2.50 3.00 3.50 4.00 4.50 5.00
BEH™ Phenyl
BEH™ C18
BEH™ Shield
BEH™ C8
A FE
CD
B
API
H I
J
C
C
CI
I, J
I
F, API
D
D
D
B
Column Chemistry ComparisonsColumn Chemistry ComparisonsUPLCUPLC®® 55--95% scouting gradients95% scouting gradients

©2007 Waters Corporation 24
AU
0.00
0.05
0.10
0.15
0.20
0.25
AU
-0.20
-0.10
0.00
0.10
0.20
Minutes0.50 1.00 1.50 2.00 2.50 3.00 3.50 4.00 4.50 5.00
pH 9 20mM ammonium bicarbonate
pH 520mM ammonium acetate
pH As a LC ParameterpH As a LC Parametercomparisonscomparisons

©2007 Waters Corporation 25
AU
0.000
0.010
0.020
0.030
0.040
0.050
0.060
AU
0.00
0.02
0.04
0.06
AU
0.00
0.02
0.04
0.06
Minutes
1.00 2.00 3.00 4.00 5.00 6.00 7.00
Temp = 400C
Temp = 300C
Temp = 500C
I + JBC
BC
BC
I J
I J
Effect of TemperatureEffect of TemperatureSelectivitySelectivity
Temperature Rs for (B + C) Rs for (I + J)
30 0C 1.80 0
40 0C 3.52 ~1
50 0C 5.33 1.54

©2007 Waters Corporation 26
Importance of Sampling RateImportance of Sampling Rate
Must ensure enough points are collected across a peak to adequately define the peak shape.
Peak detection algorithms require a minimum number of points across a peak to distinguish it from baseline noise and correctly determine peak lift off and touch down.
A peak which does not have enough data points will be difficult to integrate and therefore have irreproducible peak areas and heights.

©2007 Waters Corporation 27
AU
0.000
0.002
0.004
0.006
0.008
0.010
0.012
0.014
0.016
0.018
0.020
0.022
0.024
0.026
0.028
0.030
0.032
0.034
Minutes0.565 0.570 0.575 0.580 0.585 0.590 0.595 0.600 0.605 0.610 0.615 0.620 0.625 0.630
Effect of Sampling Rate on Peak Effect of Sampling Rate on Peak ShapeShape
1 pt/s2 pts/s5 pts/s10 pts/s20 pts/s40 pts/s

©2007 Waters Corporation 28
Optimizing Data CollectionRatesOptimizing Data CollectionRates
Data Rate
Points Across Peak
Peak Area %RSD
Peak Height %RSD
5 Hz 9 4.33 7.77
10 Hz 14 1.50 1.37
20 Hz 26 1.20 1.00
40 Hz 52 0.72 0.71
80 Hz 104 0.49 0.49
The data rate must be optimized to yields greater than 15 points across the peak to achieve reproducibility requirements while having the least impact on noise
5 Hz
40 Hz

©2007 Waters Corporation 29
Effect of Sampling Rate on Effect of Sampling Rate on ReproducibilityReproducibility
Sampling Sampling RateRate
Points Points Across Across PeakPeak
Peak Peak Area Area %RSD%RSD
Peak Peak Height Height %RSD%RSD
1 pt/s 2 2.436 15.515
2 pts/s 4 1.790 13.455
5 pts/s 7 0.971 3.962
10 pts/s 13 1.129 1.015
20 pts/s 25 0.603 1.156
40 pts/s 49 0.284 1.127

©2007 Waters Corporation 30
MS with UPLCMS with UPLC®®
The use of MS increases peak specificity, SIR, MRM
In the majority of cases MS can increase sensitivity
The spectral pattern can be used to confirm the identity of analytes
MS spectra can be used to help withpeak tracking in method development.
Like other detectors the MS must be able collect data at a fast enough toensure the peak shape is maintained

©2007 Waters Corporation 31
Time0.10 0.20 0.30 0.40 0.50 0.60 0.70 0.80 0.90 1.00 1.10 1.20 1.30 1.40 1.50 1.60 1.70 1.80 1.90 2.00
%
0
100acq11mix6 1: Scan ES+
BPI1.31e8
1.05
0.74
0.58
0.24
0.680.64
1.00
1.22
1.26
1.41
Peak at 1.41 min 1.5 sec at baseline10000da/sec 23 scans across peak
Terfe
nadi
ne
Oxy
buty
nin
Trim
ipra
min
e
Dip
henh
ydra
min
e
Pro
pran
olol
Lido
cain
eD
oxyl
amin
e
Caf
fein
e
Eph
edrin
e
ACQUITYACQUITY®® SQD Maintaining Peak FidelitySQD Maintaining Peak FidelityHigh Scan Rate MSHigh Scan Rate MS
1.400 22275731.401 26256891.403 32623071.404 47053201.405 66985011.406 84895641.407 94074641.408 105724101.410 127896701.411 150318611.412 165974851.413 169260881.414 161593141.415 129845721.417 101603621.418 86540481.419 85601261.420 69053511.421 55428281.422 45199571.424 41617671.425 32353271.426 2770925
150-650 50ms scan time

©2007 Waters Corporation 32
Pos/Neg SwitchingPos/Neg Switching5,000 da/sec Vs.10,000 da/sec5,000 da/sec Vs.10,000 da/sec
10000am u 20isd cont
Tim e0.20 0.40 0.60 0.80 1.00 1.20 1.40 1.60 1.80 2.00 2.20
%
0
100
0.20 0.40 0.60 0.80 1.00 1.20 1.40 1.60 1.80 2.00 2.20
%
0
100analgesics23 1: Scan ES+
BPI5.40e7
1.36
1.20
1.050.84
0.050.21 0.68
0.94
1.751.601.78
analgesics26 1: Scan ES+ BPI
3.47e71.36
1.20
1.060.95
0.85
0.790.04 0.08 0.401.981.731.541.47 1.89
2.02 2.132.19 2.33
100-1100 dapos neg sw itching 5000da/sec 100m s ISD5 poin ts across peak at 1.06 m in
100-1100 da pos neg sw itching 10000da/sec 20m s ISD13 ponts across peak at 1.06 m in
1.038 22049281.048 58626561.059 146688001.069 83345921.079 3900160
1.032 13208961.036 11488641.040 14314881.045 78520321.049 183490561.053 200591361.057 181145601.061 192512001.065 153640961.069 102236161.073 101939201.077 59299841.081 3297280

©2007 Waters Corporation 33
Inte
nsity
0
1x10⁷
2x10⁷
3x10⁷
4x10⁷
5x10⁷
AU
0.00
0.05
0.10
0.15
0.20
0.25
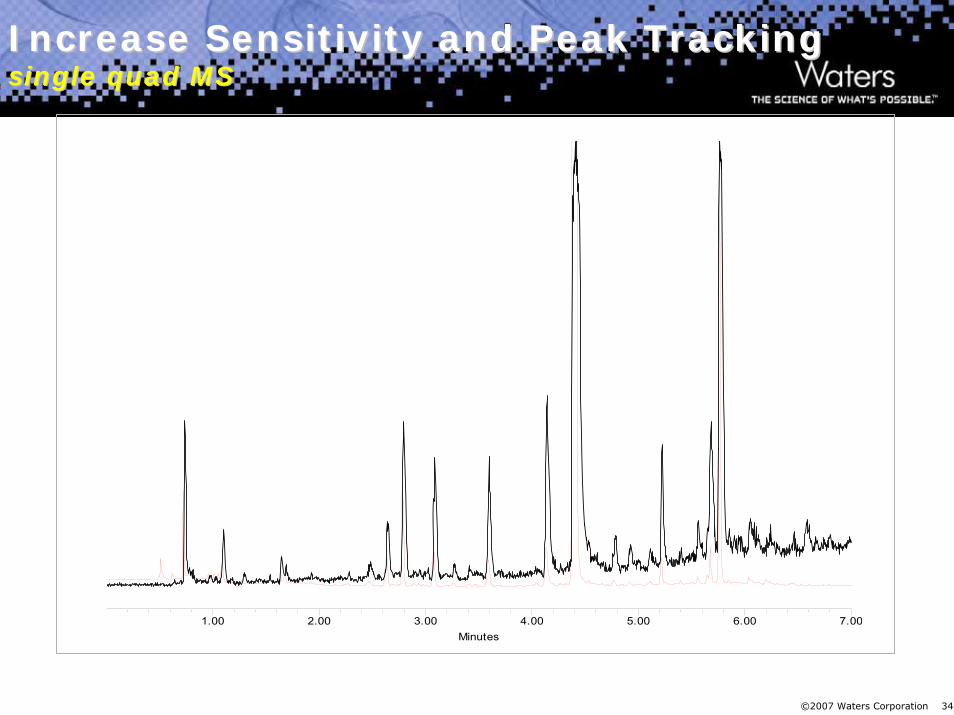
Minutes1.00 2.00 3.00 4.00 5.00 6.00 7.00
ES+ MS TIC
PDA-UV (230nm)
Increase Sensitivity and Peak TrackingIncrease Sensitivity and Peak Trackingsingle quad MSsingle quad MS
©2007 Waters Corporation 34
Minutes1.00 2.00 3.00 4.00 5.00 6.00 7.00
Increase Sensitivity and Peak TrackingIncrease Sensitivity and Peak Trackingsingle quad MSsingle quad MS

©2007 Waters Corporation 35
Spectrum IndexSpectrum IndexSpectrum Index Plot
SampleName BEH C18 pH9 20mM C18drylab; Vial 1:F,1; Injection 1; Date Acquired 5/11/2005 4:28:37 PM
m/z200.00
600.00
159.94 0.74
0.739m/z
200.00
600.00
290.02 1.10
1.105m/z
200.00
600.00
329.19 1.65
1.651m/z
200.00
600.00
387.072.65
2.645m/z
200.00
600.00
331.11 2.80
2.796m/z
200.00
600.00
155.96 3.09
3.091m/z
200.00
600.00
256.08
300.05 3.60
3.599m/z
200.00
600.00
215.14 4.15
4.144m/z
200.00
600.00
315.17 4.41
4.409m/z
200.00
600.00
170.93
215.97
241.24
272.15286.17
4.79
4.788m/z
200.00
600.00
329.19 5.22
5.223m/z
200.00
600.00
314.76 5.56
5.564m/z
200.00
600.00
297.16 5.68
5.684
Inte
nsity
0
1x10⁷
2x10⁷
3x10⁷
4x10⁷
5x10⁷
6x10⁷
Minutes1.00 2.00 3.00 4.00 5.00 6.00 7.00
0.73
9
1.10
5
1.65
1 2.64
52.
796
3.09
1
3.59
9
4.14
4
4.40
9
4.78
8
5.22
3
5.56
45.
684
5.76
9
6.58
1
Inte
nsity
0
1x10⁷
2x10⁷
3x10⁷
4x10⁷
5x10⁷
6x10⁷
Minutes1.00 2.00 3.00 4.00 5.00 6.00 7.00
Known Impurities that could be verifieda. 5,6-dihydro-3-methylamino-2H-1,4-thiazin-
2-one oxime (S,D) [M+H] = 160.0544
b. N-[2-[[[5-[(dimethylamino)methyl]-2-furanyl]thio]ethyl]-N’-methyl -2-nitro-2,2-ethenediamine-N-oxide (D) [M+H] = 331.1440; 315.1491
c. N-[2-[[[5-[(dimethylamino)methyl]-2-furanyl]sulphinyl]ethyl]-N’-methyl -2-nitro-1,1-ethenediamine (D) [M+H] = 331.1440
d. N-[2-[[[5-[(dimethylamino)methyl]-2-furanyl]methyl]thio]ethyl]-2-nitroacetamide (D) [M+H] = 302.1174
e. 5-[[(2-aminoethyl)thio]methyl]-N,N-dimethyl-2-furanmethanamine (S,D) [M+H] = 215.1218
f. Ranitidine formaldehyde adduct (C27H44N8O6S2) (D) [M+H] = 641.2903
g. N,N’bis[2-[[[5-[(dimethylamino)methyl]-2-furanyl]methyl]thio]ethyl]-2-nitro-1,1-ethenediamine (S) [M+H] = 498.2208
As it can be seen, there are also many un-identified peaks that need further characterization using either exact mass Tof data, MS/MS data, and/or NMR data

©2007 Waters Corporation 36
Final MethodFinal MethodRanitidine Impurity ProfileRanitidine Impurity Profile
AU
0.000
0.005
0.010
0.015
0.020
0.025
0.030
0.035
0.040
0.045
0.050
Minutes0.50 1.00 1.50 2.00 2.50 3.00 3.50 4.00 4.50 5.00 5.50 6.00
d
a
f
e
gb c
m
j k lh
n
i
o
RanitidineConditionsColumn: ACQUITY UPLC BEH C18Dimensions: 50 x 2.1, 1.7um Mobile Phase A: 20mM Ammonium BicarbonateMobile Phase B: MethanolWeak Wash : 95:5 Water: MeOH 1200uLStrong Wash : 50:50 Water: MeOH 300uLFlow Rate: 0.7 mL/minGradient: Time Profile
(min) %A %B 0.0 99.0 1.01.0 99.0 1.02.0 85.0 15.06.0 30.0 70.0
Injection Volume: 1.0 µLTemperature: 30oCDetection: UV @ 245 nm

©2007 Waters Corporation 37
Nominal MassHPLC
ResolutionUPLC
Resolution Fold Difference
160
176 1.90 3.14 1.7
231 0.83 1.16 1.4
290 0.62 1.16 1.9
300 1.50 1.05 0.7
329 2.72 5.96 2.2
272 0.84 13.03 15.5
231 0.83 1.56 1.9
387 0.50 2.90 5.8
156 2.22 7.72 3.5
331 3.15 4.16 1.3
287 0.50 4.40 8.8
256,300 2.09 3.17 1.5
215 2.27 11.51 5.1
(active) 315 3.05 5.50 1.8
286 0.24 7.87 32.8
284 1.39 3.34 2.4
329 3.49 8.77 2.5
314,628 1.04 5.68 5.5
452 0.30 3.50 11.7
297 2.72 1.13 0.4
*321, 641 2.55 2.88 1.1
Average 5.2
Resolution BenefitsResolution BenefitsHPLC vs. UPLCHPLC vs. UPLC®®

©2007 Waters Corporation 38
Nominal Mass HPLC - UV S/N UPLC -UV S/N Fold Difference
160 48.0 511.9 10.7
176 6.9 27.1 3.9
231 2.5 42.3 16.9
290 13.1 110.4 8.4
300 1.6 29.4 18.2
329 19.6 59.6 3.0
272 19.6 40.6 2.1
231 12.0 23.5 1.9
387 62.1 185.6 3.0
156 74.2 209.0 2.8
331 172.3 600.6 3.5
287 4.5 18.3 4.1
256,300 85.7 157.8 1.8
215 165.6 221.8 1.3
(active) 315 13081.3 20278.9 1.6
286 13.6 30.1 2.2
284 17.7 23.8 1.3
329 82.6 154.9 1.9
314,628 8.3 39.3 4.8
452 5.4 26.6 4.9
297 110.9 185.2 1.7
*321, 641 1127.8 2451.2 2.2
Average 4.6
Sensitivity BenefitsSensitivity BenefitsHPLC vs. UPLCHPLC vs. UPLC®®

©2007 Waters Corporation 39
Drug Substance AnalysisDrug Substance AnalysisBudesonide Impurity ProfileBudesonide Impurity Profile
Budesonide , Pulmicort
Budesonide is in a class of drugs called corticosteroids. Budesonide works in the intestines to reduce inflammation, tissue damage, and diarrhoea.
Initial HPLC methodology generated required a 30 minute analysis time
Aim of this study was to develop a UPLC®(MS) method for the analysis of the impurities in budesonide
Compare performance to that of traditional HPLC

©2007 Waters Corporation 40
Structure of Budesonide and Structure of Budesonide and known related substancesknown related substances
(*) Denotes epimeric form
OHCH3
OH
O
OH
OH
CH3
O
H H
HImpurity A[M+H] = 377.1964
OCH3
O
O
O
OH
CH3
CH3
O
H H
H
H
Impurity D[M+H] = 429.2277
OCH3
O
O
OH
OH
CH3
CH3
O
H H
H
H
Budesonide[M+H] = 431.2434
* CH3
HO
CH3
O
O
OH
OH
CH3
O
H H
H
Impurity F[M+H] = 403.2120
*
OCH3
O
O
OH
OH
CH3
CH3
O
H
H
H
Impurity E[M+H] = 429.2277
*
H
H
O OHCH3
O
O
OHCH3
CH3
O
H
H
Impurity C[M+H] = 431.2433
*
OCH3
O
O CH3
OH
OH
CH3
O
H H
H
H
Impurity B[M+H] = 403.2120
*
OCH3
O
O
OH
OH
CH3
CH3
O
H H
H
H
Impurity G[M+H] = 433.2512
*

©2007 Waters Corporation 41
Column ScoutColumn ScoutBudesonideBudesonide
ACQUITY TUV ChA - ACQUITY TUV ChA 240nm
AU
0.00
0.20
0.40
0.60
ACQUITY TUV ChA - ACQUITY TUV ChA 240nm
AU
0.00
0.20
0.40
ACQUITY TUV ChA - ACQUITY TUV ChA 240nm
AU
0.00
0.20
0.40
0.60
0.80
ACQUITY TUV ChA - ACQUITY TUV ChA 240nm
AU
0.00
0.20
0.40
0.60
Minutes0.00 1.00 2.00 3.00 4.00 5.00 6.00 7.00 8.00 9.00 10.00
BEH Phenyl
BEH C18
BEH Shield
HSS C18

©2007 Waters Corporation 42
ACQUITY TUV ChA - ACQUITY TUV ChA 240nm
AU
0.000
0.005
0.010
0.015
ACQUITY TUV ChA - ACQUITY TUV ChA 240nm
AU
0.000
0.005
0.010
0.015
ACQUITY TUV ChA - ACQUITY TUV ChA 240nm
AU
0.000
0.005
0.010
0.015
ACQUITY TUV ChA - ACQUITY TUV ChA 240nm
AU
0.000
0.005
0.010
0.015
Minutes0.00 1.00 2.00 3.00 4.00 5.00 6.00 7.00 8.00 9.00 10.00
BEH Phenyl
BEH C18
BEH Shield
HSS C18
Column Scout Column Scout Budesonide(zoomed view)Budesonide(zoomed view)

©2007 Waters Corporation 43
Temperature ScoutTemperature Scoutreduced analysis timereduced analysis time
240.0nm - PDA Spectrum - PDA Spectrum (230-350)nmAU
0.000
0.005
0.010
0.015
0.020
240.0nm - PDA Spectrum - PDA Spectrum (230-350)nm
AU
0.000
0.005
0.010
0.015
0.020
240.0nm - PDA Spectrum - PDA Spectrum (230-350)nm
AU
0.000
0.005
0.010
0.015
0.020
Minutes0.00 1.00 2.00 3.00 4.00 5.00 6.00 7.00 8.00 9.00 10.00
300C
400C
600C
Resolution between epimers lostResolution between epimers lost

©2007 Waters Corporation 44
Budesonide Final MethodBudesonide Final MethodAU
0.000
0.007
0.014
0.021
0.028
Minutes0.00 1.10 2.20 3.30 4.40 5.50 6.60 7.70 8.80 9.90
0.00
0.70
1.40
0.00 3.00 6.00
R-epimer
S-epimer
6
7
4
3
2
1
5
Name Retention Time
Resolution SymmetryFactor
Signal/Noise EPPlates
R— epimer 5.073 N/A 1.05 10262 17011
S— epimer 5.476 2.46 1.02 6646 17390
EP HPLC method requirements met.

©2007 Waters Corporation 45
LC/MS Trace ComparisonsLC/MS Trace Comparisons4 lots of budesonide4 lots of budesonide
spectrum
Time0.50 1.00 1.50 2.00 2.50 3.00 3.50 4.00 4.50 5.00 5.50 6.00 6.50 7.00 7.50 8.00 8.50 9.00
%
0
0.50 1.00 1.50 2.00 2.50 3.00 3.50 4.00 4.50 5.00 5.50 6.00 6.50 7.00 7.50 8.00 8.50 9.00
%
0
0.50 1.00 1.50 2.00 2.50 3.00 3.50 4.00 4.50 5.00 5.50 6.00 6.50 7.00 7.50 8.00 8.50 9.00
%
0
0.50 1.00 1.50 2.00 2.50 3.00 3.50 4.00 4.50 5.00 5.50 6.00 6.50 7.00 7.50 8.00 8.50 9.00
%
1
Budesonide Impurity 3 Sm (SG, 10x1) 1: Scan ES+ BPI
1.29e7x10
5.11
4.923.892.37
0.41 2.170.72 1.861.443.103.012.72 4.794.31 8.307.73 8.58 8.90
Budesonide Impurity 4 Sm (SG, 10x1) 1: Scan ES+ BPI
4.16e7x10
5.12
4.90 7.19 7.75
Budesonide Impurity 5 Sm (SG, 10x1) 1: Scan ES+ BPI
4.32e7x10 5.12
4.913.882.760.50 2.93
Budesonide Impurity 6 Sm (SG, 10x1) 1: Scan ES+ BPI
4.61e7x10
5.12
3.080.72 7.21
6.887.77
Supplier B
Supplier A
Supplier C
Supplier D

©2007 Waters Corporation 46
EP Related Substances TestEP Related Substances Test
European Pharmacopoeia Related Substances Test
Specification
Supplier A Supplier B Supplier C Supplier C
Individual Impurities(x < 2.5µg/mL ∑ of epimers areas)
Fail Fail Pass Fail
Total Impurities(x < 7.5µg/mL ∑ of epimers areas)
Fail Fail Pass Fail
R—epimer/S—epimer Ratio(S—epimer is 40.0% to 51%
∑ of epimers areas)
59.24%/40.76%
50.49%/49.51
51.38%/48.62
58.66%/41.34
Purity 98.24% 97.99% 99.52% 98.07%

©2007 Waters Corporation 47
Individual Impurities Individual Impurities Specified Impurity Spectra of 429Specified Impurity Spectra of 429
OCH3
O
O
O
OH
CH3
CH3
O
H H
H
H
Impurity D[M+H] = 429.2277
OCH3
O
O
OH
OH
CH3
CH3
O
H
H
H
Impurity E[M+H] = 429.2277
*
OR
Could be..

©2007 Waters Corporation 48
Individual Impurities that failed for Spectrum EPIndividual Impurities that failed for Spectrum EPSpectra of Unknown/ Unspecified [M+H] = 435Spectra of Unknown/ Unspecified [M+H] = 435
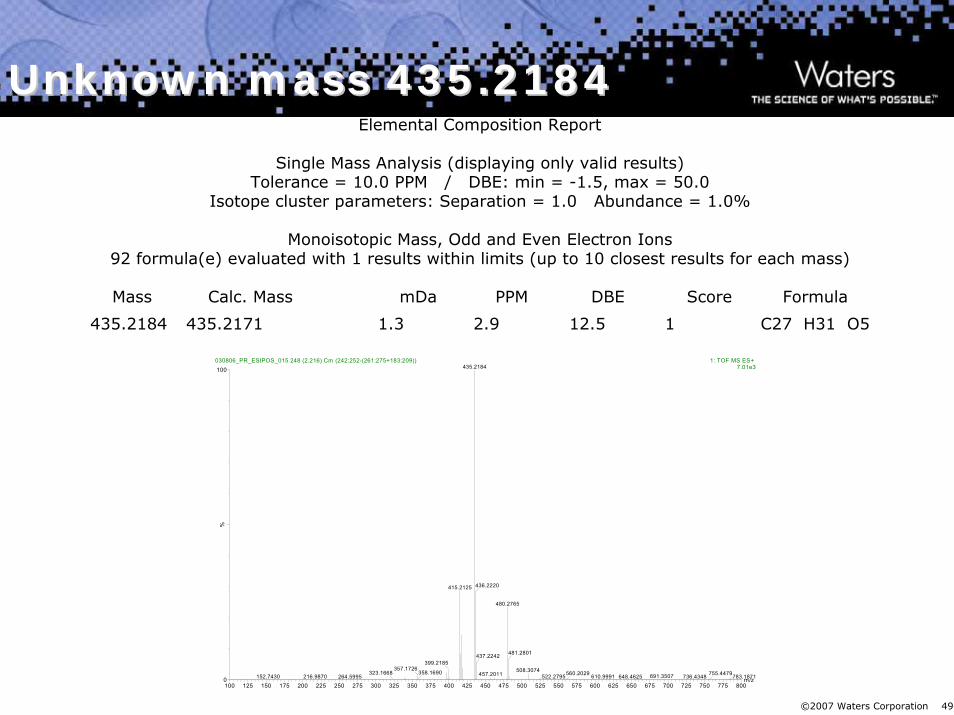
©2007 Waters Corporation 49
Unknown mass 435.2184Unknown mass 435.2184
m/z100 125 150 175 200 225 250 275 300 325 350 375 400 425 450 475 500 525 550 575 600 625 650 675 700 725 750 775 800
%
0
100030806_PR_ESIPOS_015 248 (2.216) Cm (242:252-(261:275+183:209)) 1: TOF MS ES+
7.01e3435.2184
415.2125
399.2185357.1726
323.1668152.7430 216.9870 264.5995
358.1690
436.2220
480.2765
437.2242
457.2011
481.2801
508.3074691.3507522.2795 610.9991560.2029 648.4625 736.4348 755.4479783.1871
Elemental Composition Report
Single Mass Analysis (displaying only valid results)Tolerance = 10.0 PPM / DBE: min = -1.5, max = 50.0
Isotope cluster parameters: Separation = 1.0 Abundance = 1.0%
Monoisotopic Mass, Odd and Even Electron Ions92 formula(e) evaluated with 1 results within limits (up to 10 closest results for each mass)
Mass Calc. Mass mDa PPM DBE Score Formula
435.2184 435.2171 1.3 2.9 12.5 1 C27 H31 O5

©2007 Waters Corporation 50
Simvastatin Forced DegradationSimvastatin Forced Degradation
Simvastatin was degraded by five different methods:
—Acid Hydrolysis (Hydrochloric Acid)
—Base Hydrolysis (Sodium Hydroxide)
—Peroxide Oxidation (Hydrogen Peroxide)
—Temperature (Dry)
—Photo Degradation (Samples not yet run)Conditions for each method were modified to achieve approximately 10-20% degradation of the Simvastatin
UPLC analysis was carried out using a 7 minute gradient from 10mM Ammonium Acetate/25% Acetonitrile to 10mM Ammonium Acetate/90% Acetonitrile with Photodiode Array and Mass Spectrometric detection

©2007 Waters Corporation 51
Simvastation StandardSimvastation StandardBefore DegradationBefore Degradation
AU
0.00
0.20
0.40
0.60
0.80
1.00
1.20
Minutes3.00 3.50 4.00 4.50 5.00 5.50 6.00 6.50 7.00
AU
-0.015
-0.010
-0.005
0.000
Minutes3.00 3.50 4.00 4.50 5.00 5.50 6.00 6.50 7.00
PDA at 238nm
Simvastatin
Expanded ScaleAcetonitrileImpurity
Simvastatin
Simvastatin StandardBefore Degradation

©2007 Waters Corporation 52
Inte
nsi
ty
2.0x10⁶
4.0x10⁶
6.0x10⁶
8.0x10⁶
1.0x10⁷
Minutes3.00 3.50 4.00 4.50 5.00 5.50 6.00 6.50 7.00
Inte
nsi
ty
0.0
5.0x10⁷
1.0x10⁸
1.5x10⁸
Minutes3.00 3.50 4.00 4.50 5.00 5.50 6.00 6.50 7.00
Acid Hydrolysis of SimvastatinAcid Hydrolysis of Simvastatin
TIC Plot
Expanded Scale
Simvastatin
Simvastatin
60 Minute Acid HydrolysisOf Simvastatin
SimvastatinAcid
SimvastatinAcid

©2007 Waters Corporation 53
Inte
nsi
ty
2.0x10⁶
4.0x10⁶
6.0x10⁶
8.0x10⁶
1.0x10⁷
Minutes3.00 3.50 4.00 4.50 5.00 5.50 6.00 6.50 7.00
Inte
nsi
ty
0.0
5.0x10⁷
1.0x10⁸
Minutes3.00 3.50 4.00 4.50 5.00 5.50 6.00 6.50 7.00
Base Hydrolysis of SimvastatinBase Hydrolysis of Simvastatin
TIC Plot
Expanded Scale
Simvastatin
Simvastatin
45 Minute Base HydrolysisOf Simvastatin
SimvastatinAcid
SimvastatinAcid
©2007 Waters Corporation 54
Peroxide Oxidation of SimvastatinPeroxide Oxidation of Simvastatin
Final conditions for Peroxide Degradation were determined to be 7.5% Hydrogen Peroxide for 45 minutes at 55° C
Degradation was carried out at a Simvastatin concentration of 1.0mg/ml
After 45 minutes of degradation, the standard solution was diluted 1 to 10 with Diluting Solution (~10mM Acetic Acid/80% Acetonitrile)
Degraded Simvastatin was injected at a concentration of 0.1mg/ml

©2007 Waters Corporation 55
Inte
nsi
ty
5.0x10⁶
1.0x10⁷
1.5x10⁷
Minutes1.00 1.50 2.00 2.50 3.00 3.50 4.00 4.50 5.00 5.50 6.00 6.50 7.00
Inte
nsi
ty
0.0
5.0x10⁷
1.0x10⁸
Minutes1.00 1.50 2.00 2.50 3.00 3.50 4.00 4.50 5.00 5.50 6.00 6.50 7.00
Peroxide Oxidation of SimvastatinPeroxide Oxidation of Simvastatin
TIC Plot
Expanded Scale
Simvastatin
Simvastatin
45 Minute Peroxide OxidationOf Simvastatin

©2007 Waters Corporation 56
Inte
nsi
ty
0.0
5.0x10⁶
1.0x10⁷
1.5x10⁷
2.0x10⁷
Minutes1.00 1.50 2.00 2.50 3.00 3.50 4.00 4.50 5.00 5.50 6.00 6.50 7.00
Inte
nsi
ty
0.0
5.0x10⁷
1.0x10⁸
Minutes1.00 1.50 2.00 2.50 3.00 3.50 4.00 4.50 5.00 5.50 6.00 6.50 7.00
Temperature DegradationTemperature Degradationof Simvastatinof Simvastatin
TIC Plot
Expanded Scale
Simvastatin
Simvastatin
60 Minute TemperatureDegradation Of Simvastatin

©2007 Waters Corporation 57
ConclusionConclusion
UPLC® provides increased performance over traditional HPLC, speed, sensitivity, resolution
HPLC methods can be easily transferred to UPLC® using the ACQUITY® calculator
The extra efficiency of the ACQUITY UPLC® system requires a faster data capture rate detector 20-40Hz for reproducible quantitative analysis
Using the ACQUITY UPLC ® system with the column manager and the range of ACQUITY® BEH column chemistries method scouting can be rapidly accomplished using pH, temperature and stationary phases
Method development can be accomplished faster allowing better decisions to be made faster, improving productivity and quality
©2007 Waters Corporation 58
AcknowledgementsAcknowledgements
Mike Jones
Paul Rainville
Peter Alden

©2007 Waters Corporation 59
Inform 2007Where is it located and how do I registerInform 2007Inform 2007Where is it located and how do I registerWhere is it located and how do I register
Waters premier Laboratory Informatics symposium where users can network with colleagues, share experiences, and gain valuable insights into how to best deploy and use Waters Informatics suite of solutions
—May 7-10, 2007
—Miami Marriott Biscayne Bay
Three-day event with optional tutorials
—Monday: (2) ½ Day Tutorial Session—Tuesday – Thursday: Symposium
Download the agenda and register at:
—Waters booth - 3641
—www.inform2007.com
Fill out a seminar evaluation form and
enter the raffle to win a Gold
Package registration* for
Inform 2007 which includes all tutorials and workshops - a
$1595 value
One drawing daily. Winner will be
notified.
* Prize covers conference registration only