pharmacokinetics and differential regulation of...
TRANSCRIPT

Pharmacokinetics and Differential Regulation of Cytochrome P450 Enzymes in
Type 1 Allergic Mice
Tadatoshi Tanino, Akira Komada, Koji Ueda, Toru Bando, Yukie Nojiri
Yukari Ueda and Eiichi Sakurai
Faculty of Pharmaceutical Sciences, Tokushima Bunri University, 180 Bouji Nishihama,
Yamashiro-cho, Tokushima, Tokushima 770-8514, Japan
This article has not been copyedited and formatted. The final version may differ from this version.DMD Fast Forward. Published on September 30, 2016 as DOI: 10.1124/dmd.116.072462
at ASPE
T Journals on June 20, 2018
dmd.aspetjournals.org
Dow
nloaded from

DMD#72462
1
Running title: Pharmacokinetics and CYP inhibition in type 1 allergic mice
Corresponding Author:
Eiichi Sakurai, Ph.D.
Professor, Laboratory of Pharmaceutics, Faculty of Pharmaceutical Sciences,
Tokushima Bunri University
180 Bouji Nishihama, Yamashiro-cho, Tokushima, Tokushima 770-8514, Japan.
Phone +81-88-602-8468, FAX +81-88-655-3051-
E-mail: [email protected]
Number of Text pages: 42
1 table
7 figures
References: 54
Number of Words:
Abstracts: 237 words
Introduction: 676 words
Discussion: 1363 words
This article has not been copyedited and formatted. The final version may differ from this version.DMD Fast Forward. Published on September 30, 2016 as DOI: 10.1124/dmd.116.072462
at ASPE
T Journals on June 20, 2018
dmd.aspetjournals.org
Dow
nloaded from

DMD#72462
2
Abbreviations:
APAP, acetaminophen; αGP, alpha 1-acidic glycoprotein; BF, bufuralol; Carboxy-PTIO,
(2-[4[carboxyphenyl]-4,4,5,5-tetramethylimidazoline-1-oxyl-3-oxide]; CHZ,
chlorzoxazone; CYP, cytochrome P450; fu, unbound fraction; 1’-OH-BF,
1-hydroxybufuralol; 6-OH-CHZ, 6-hydroxychlorzoxazone; 1’-OH-MDZ,
1’-hydroxymidazolam; 4-OH-TB, 4-hydroxytolbutamide; IMP, imipramine; IgE,
immunoglobulin E; IL, interleukin; IS, internal standard; MDZ, midazolam; NO, nitric
oxide; NOC7, 1-hydroxy-2-oxo-3-(N-methyl-3-aminopropyl)-3-methyl-1-triazene;
OVA, ovalbumin; PH, phenacetin; PS7, 7 days after primary sensitization; SS7, 7 days
after secondary sensitization; Th, T helper; TNF-α, tumor necrosis factor-α; TB,
tolbutamide.
This article has not been copyedited and formatted. The final version may differ from this version.DMD Fast Forward. Published on September 30, 2016 as DOI: 10.1124/dmd.116.072462
at ASPE
T Journals on June 20, 2018
dmd.aspetjournals.org
Dow
nloaded from

DMD#72462
3
Abstract
Type 1 allergic diseases are characterized by elevated production of specific
immunoglobulin E (IgE) for each antigen and have become a significant health problem
worldwide. This study investigated the effect of IgE-mediated allergy on drug
pharmacokinetics. To further understand differential suppression of hepatic cytochrome
P450 (CYP) activity, we examined the inhibitory effect of nitric oxide (NO), a marker
of allergic conditions. Seven days after primary or secondary sensitization (PS7 and SS7,
respectively), hepatic CYP1A2, CYP2C, CYP2E1 and CYP3A activities were
decreased to 45%-75% of the corresponding control, however, CYP2D activity was not
downregulated. PS7 and SS7 did not change the expression levels of five CYP proteins.
Disappearance of CYP1A2 and CYP2D substrates from the plasma was not
significantly different between allergic mice and control mice. In contrast, area under
the curve of a CYP1A2-mediated metabolite in PS7 and SS7 mice was reduced by 50%
of control values. Total clearances of a CYP2E1 substrate in PS7 and SS7 mice were
significantly decreased to 70% and 50% of the control without altering plasma protein
binding, respectively. Hepatic amounts of CYP1A2 and CYP2E1 substrates were
enhanced by allergic induction, being responsible for each downregulated activity. NO
This article has not been copyedited and formatted. The final version may differ from this version.DMD Fast Forward. Published on September 30, 2016 as DOI: 10.1124/dmd.116.072462
at ASPE
T Journals on June 20, 2018
dmd.aspetjournals.org
Dow
nloaded from

DMD#72462
4
scavenger treatment completely improved the downregulated CYP activities. Therefore,
our data suggest that the onset of IgE-mediated allergy alters the pharmacokinetics of
major CYP-metabolic capacity-limited drugs except for CYP2D drugs. NO is highly
expected to participate in regulatory mechanisms of the four CYP isoforms.
This article has not been copyedited and formatted. The final version may differ from this version.DMD Fast Forward. Published on September 30, 2016 as DOI: 10.1124/dmd.116.072462
at ASPE
T Journals on June 20, 2018
dmd.aspetjournals.org
Dow
nloaded from

DMD#72462
5
Introduction
In many diseases, immunological responses and viruses are capable of
downregulating the levels of cytochrome P450 (CYP) isozymes (Cheng and Morgan,
2001; Morgan, 2001). In the development of adjuvant-induced arthritis in rats, the
production of proinflammatory cytokines downregulates mRNA levels, protein levels
and activities of CYP2B1/2, CYP2C11, CYP2E1 and 3A1/2, even under acute
inflammatory conditions (Sanada et al., 2011; Projean et al., 2005). Directly injected
interleukin (IL)-1β, IL-6, tumor necrosis factor (TNF)-α and interferon-gamma are
thought to act through mechanisms regarded as the downregulation of CYP gene
expression, which leads to suppression of CYP content and activity (cytokine-dependent
pathway) (Sujita et al., 1990; Ghezzi et al., 1986; Abdel-Razzak et al., 1993).
Excessive nitric oxide (NO) has been speculated to interact with the heme iron of
CYP and to be responsible for depressed functioning of hepatic drug metabolism.
(Hodgson and Renton, 1995; Monshouwer et al., 1996). NO has been considered as a
marker of inflammatory conditions in humans. During the development of
adjuvant-induced arthritis, nitric oxides (NOx) plasma levels from 24 h to 7 days after a
single treatment were significantly higher in treated rats than in control rats, and peak
This article has not been copyedited and formatted. The final version may differ from this version.DMD Fast Forward. Published on September 30, 2016 as DOI: 10.1124/dmd.116.072462
at ASPE
T Journals on June 20, 2018
dmd.aspetjournals.org
Dow
nloaded from

DMD#72462
6
NOx levels occurred at 72 h post-treatment; however, Projean et al. (2005) did not focus
on the inhibitory effects of NO on downregulated rat CYP activities. When testosterone
is used as a CYP substrate, the inhibitory effect of NO is more pronounced in rat
CYP2C11 than in rat CYP3A2 (Minamiyama et al., 1997). Since some CYP isoforms
simultaneously participate in testosterone metabolism, it remains unsettled whether NO
differentially regulates the microsomal CYP2C11 and CYP3A2 activities. Another
investigation showed that human CYP1A1 (aryl hydrocarbon hydroxylase activity) was
more sensitive to the inhibitory effect of NO than human CYP1A2
(7-ethoxyresorufin-O-dealkylase dealkylation) (Stadler et al., 1994). The findings may
offer a possible mechanistic explanation of differential CYP regulation to us. However,
it remains unclear whether the cytokine-dependent pathway or NO is the prevalent
suppressor of hepatic CYP activity with irreversible and/or reversible inhibition.
Therefore, initiation, culmination and resolution of immunological responses and
species of radical gas will play more important roles in the mechanistic understanding
of drug-disease interactions, but not drug-drug interactions.
Type I allergic diseases such as atopic dermatitis, asthma and allergic rhinitis, are a
significant health problem, and are characterized by elevated production of the specific
immunoglobulin E (IgE) for each antigen (Platts-Mills, 2001). Approximately 20% of
This article has not been copyedited and formatted. The final version may differ from this version.DMD Fast Forward. Published on September 30, 2016 as DOI: 10.1124/dmd.116.072462
at ASPE
T Journals on June 20, 2018
dmd.aspetjournals.org
Dow
nloaded from

DMD#72462
7
the world’s population suffers from some kind of allergic disorder and its incidences
continues to rise (Warner et al., 2006). Allergic disorders are associated with an
imbalance in the expression of T helper (Th) 1 cells and Th2 cytokines towards Th2
cytokines. IL-4 is called B-cell-stimulating factor-1, and regulates the differentiation of
naïve Th0 cells to develop a Th2 phenotype. Th2 cytokines (IL-4, IL-5 and IL-13)
stimulate mast cells and eosinophils and increase allergen-specific IgE production,
whereas Th1 cytokines (IL-12, 2, 1β and interferon-gamma) suppress IgE production
(Broide, 2001). Subsequently, activated mast cells release proinflammatory cytokines
and inflammatory mediators including histamine, leukotrienes, serotonin and
prostaglandins (Zhu et al., 1999; Stassen et al., 2001). IL-4 markedly increases human
CYP2E1 mRNA levels in primary culture (Abdel-Razzak et al., 1993), although IL-1β,
IL-6 and TNF-α suppress the expression of rat CYP2E1 mRNA (Hakkola et al., 2003).
Concerning chemical mediators, histamine is a mixed-type inhibitor of CYP1A1 in both
rat liver microsomes and supersomes, and induces a significant nicotinamide adenine
dinucleotide phosphate oxidation catalyzed by CYP2E1 supersomes (Davila-Borja et al.,
2007). Osada et al (1994) showed that NO could participate in anaphylaxis (a type 1
allergic reaction) in the mouse; however, an attempt was not made to estimate regulated
CYP functions. Little information is available in the literature on major CYP activities
This article has not been copyedited and formatted. The final version may differ from this version.DMD Fast Forward. Published on September 30, 2016 as DOI: 10.1124/dmd.116.072462
at ASPE
T Journals on June 20, 2018
dmd.aspetjournals.org
Dow
nloaded from

DMD#72462
8
and drug pharmacokinetics in type 1 allergic diseases. Therefore, we investigated
hepatic CYP metabolism and drug pharmacokinetics in type 1 allergic mice induced by
ovalbumin (OVA) emulsified with aluminum and inactive Bordetella pertussis. To
further propose a possible key factor in drug-allergic disease interactions, we examined
the inhibitory effect of NO, a marker of allergic conditions on the activities of major
CYP isoforms.
Materials and Methods
Materials. Imipramine (IMP), chlorzoxazone (CHZ), Bordetella pertussis
inactive bacterial suspension, chloramphenicol and acetaminophen (APAP) were
purchased from Nacalai Tesque Co. (Kyoto, Japan). Aluminum hydroxide gel
(alhydrogelⓇ) was obtained from InvivoGen (San Diego, CA, USA). Amitriptyline,
chicken egg albumin (OVA), 2-acetamidophenol, chlorpropamide, diazepam,
midazolam (MDZ), propranolol and tolubutamide (TB) were obtained from Wako Pure
Chemicals (Osaka, Japan). Phenacetin (PH) was obtained from Sigma-Aldrich (St Louis,
MO, USA). 1’-Hydroxy MDZ (1’-OH-MDZ) was obtained from Alsachim SAS
(IIIkirch, France). Bufuralol (BF), 6-hydroxy CHZ (6-OH-CHZ), 4-hydroxy TB
(4-OH-TB) and 1’-hydroxy BF (1’-OH-BF) were purchased from Toronto Research
This article has not been copyedited and formatted. The final version may differ from this version.DMD Fast Forward. Published on September 30, 2016 as DOI: 10.1124/dmd.116.072462
at ASPE
T Journals on June 20, 2018
dmd.aspetjournals.org
Dow
nloaded from

DMD#72462
9
Chemicals Inc. (North York, ON, Canada).
1-Hydroxy-2-oxo-3-(N-methyl-3-aminopropyl)-3-methyl-1-triazene (NOC7) and
carboxy-PTIO (2-[4[carboxyphenyl]-4,4,5,5-tetramethylimidazoline-1-oxyl-3-oxide]
were obtained from Dojin Co. (Kumamoto, Japan). β-Nicotinamide adenine
dinucleotide 2’-phosphate reduced tetrasodium (β-NADP+), glucose-6-phosphate
dehydrogenase (G-6-PDH) and glucose-6-phosphate (G-6-P) were obtained from
Oriental Yeast Co. Ltd. (Tokyo, Japan). All other chemicals used were of analytical
grade and commercially available.
Animals and Treatments. Female ICR mice (Japan SLC Co., Shizuoka, Japan),
weighing 15−20 g, were housed under standard conditions (light/dark cycle of 12 h;
room temperature of 23±1˚C) and provided with food and water ad libitum. For the
establishment of IgE-mediated allergic animals, the mice were sensitized by
intraperitoneal (i.p.) injection of a mixture containing 5 μg OVA, 2 mg aluminum
hydroxide gel and Bordetella pertussis, inactive bacterial suspension (2×10⁹ cells) on
day 0 according to the methods described by Pauwels et al (1979) and Lebrec et al
(1996). On day 7 after the primary sensitization (PS7), mice were sacrificed. On day 8
after the primary sensitization, the mice were challenged with 2.5 μg OVA (250 μg/ml
of saline) by intravenous (i.v.) injection. At 7 days after the secondary sensitization
This article has not been copyedited and formatted. The final version may differ from this version.DMD Fast Forward. Published on September 30, 2016 as DOI: 10.1124/dmd.116.072462
at ASPE
T Journals on June 20, 2018
dmd.aspetjournals.org
Dow
nloaded from

DMD#72462
10
(SS7), the mice were sacrificed. Control mice were given single i.p. and i.v. injections
of saline. All animal experiments were conducted in accordance with the Tokushima
Bunri University Faculty of Pharmaceutical Sciences’ Committee for the care and use of
laboratory animals.
Mice were given carboxy-PTIO (0.5 mg/kg, i.p.) 30 min before the primary
sensitization. Subsequently, carboxy-PTIO (0.5 mg/kg, i.p.) was injected to
saline-treated mice (control) and the immunized mice once a day. The carboxy-PTIO
dosage was determined by the in vivo data reported by Hirano et al (2015).
For drug disposition experiments, each bolus dose (5 mg/kg) of PH, CHZ and IMP
was administered by tail vein injection to each group of control and allergic mice. Each
of PH, CHZ and IMP was injected in different mice. The dosages used were determined
by the pharmacokinetic data reported by Yoo et al. (1996) and Henderson et al (2014).
At the appropriate times, the mice were sacrificed by decapitation, and blood was
collected in heparinized tubes. Plasma was separated by centrifugation at 3000 rpm for
10 min. The liver was excised, washed, and homogenized with ice-cold 50 mM
Tris-HCl (pH 7.4).
Assay of Total Plasma IgE and Serum NO Levels. Total plasma IgE levels
were measured by enzyme-linked immunosorbent assay (ELISA) using a commercially
This article has not been copyedited and formatted. The final version may differ from this version.DMD Fast Forward. Published on September 30, 2016 as DOI: 10.1124/dmd.116.072462
at ASPE
T Journals on June 20, 2018
dmd.aspetjournals.org
Dow
nloaded from

DMD#72462
11
available mouse IgE ELISA Kit (Shibayagi, Gunma, Japan) according to the
manufacturer’s instructions. The absorbance was measured at 450 nm using a
microplate reader.
Serum concentrations of NO2- were determined using a Nitrate/Nitrite Colorimetric
Assay kit (Cayman Chemcal Company., An Arbor, MI) according to the manufacturer’s
instructions. Briefly, blood was treated with negligible amount of EDTA, and was
centrifuged at 10000 rpm for 10 min. The supernatants were placed into an
ultrafiltration device (Millipore Co., Bedford, MA), and were centrifuged at 13,000 rpm
for 20 min. Aliquots (40 μl) of filtrates were incubated with nitrate reductase to reduce
any nitrates to nitrites. After incubation, sample were treated with Griess reagent and
absorbance was measured at 540 nm.
Assay of CHZ, PH, APAP and IMP in Plasma and Liver. Plasma and/or
liver homogenates were mixed with acetonitrile including internal standards (ISs)
(chloramphenicol for CHZ, 2-acetoamidephenol for PH and APAP, and amitriptyline for
IMP) available in a high-performance liquid chromatography (HPLC) assay. Sodium
hydroxide 0.1 N was added to the mixture including IMP. CHZ was extracted in diethyl
ether (Baek et al., 2006), and PH, APAP and IMP were transferred to ethyl acetate
(Masubuchi and Horie, 2003; Narimatsu et al., 1999), and then centrifuged at 3000 rpm
This article has not been copyedited and formatted. The final version may differ from this version.DMD Fast Forward. Published on September 30, 2016 as DOI: 10.1124/dmd.116.072462
at ASPE
T Journals on June 20, 2018
dmd.aspetjournals.org
Dow
nloaded from

DMD#72462
12
for 10 min. After the organic layers were evaporated, the residues were reconstituted in
mobile phases used for HPLC assay, and loaded onto each HPLC column.
In Vivo Plasma Protein Binding. Plasma protein binding was determined by
ultrafiltration using the Centrifugal Filter Units (Millipore Co., Billerica, MA, USA).
The unbound fraction (fu) of CHZ was determined as a ratio of the drug concentration
in the ultrafiltrate to the total drug concentration in the plasma 10 min after i.v. injection
of CHZ. Further treatment for HPLC analysis was described in the above CHZ assay in
plasma. The amount of CHZ adsorbed onto the filter membranes was less than 0.1%.
Enzyme Assay. Livers from individual mice were homogenized with a Teflon
homogenizer in three volumes (v/w) of 1.15% KCl (Sanada et al., 2011), and liver
homogenates were centrifuged at 9000×g for 20 min. The supernatants were further
centrifuged at 104,000×g for 60 min, and the microsomal pellet suspended in the
homogenizing solution was recentrifuged at 104,000×g for 60 min. The amount of
microsomal protein was determined using a BCA protein assay kit (Thermo Fisher
Scientific Inc., Rockford, IL, USA).
CYP isozyme-specific activities were determined by measuring the formation of
APAP, 4-OH-TB, 1’-OH-BF, 6-OH-CHZ and 1’-OH-MDZ from PH (CYP1A2
substrate), TB (CYP2C substrate), BF (CYP2D substrate), CHZ (CYP2E1 substrate)
This article has not been copyedited and formatted. The final version may differ from this version.DMD Fast Forward. Published on September 30, 2016 as DOI: 10.1124/dmd.116.072462
at ASPE
T Journals on June 20, 2018
dmd.aspetjournals.org
Dow
nloaded from

DMD#72462
13
and MDZ (CYP3A substrate) (Masubuchi and Horie, 2003; Choi et al., 2014; Horie et
al., 2002; Chittur and Tracy, 1997; Fujita et al., 2008). The incubation mixtures (400 μl)
contained liver microsomal protein (final protein concentration, 0.1 mg/ml for MDZ
metabolism, 0.4 mg/ml for BF metabolism, 0.5 mg/ml for CHZ and TB metabolism, and
1 mg/ml for PH metabolism), an NADPH-generating system (0.2 mM NADP+, 28.6
mM MgCl2, 11.4 mM G-6-P and 20 units/ml G-6-PDH) and CYP substrate (10 μM PH,
800 μM TB, 2 μM BF, 20 μM CHZ or 10 μM MDZ). All enzymatic reactions were
initiated by the addition of the NADPH-generating system and were allowed to proceed
at 37˚C for different times (4, 5 and 30 min). Further treatment for HPLC analysis of
APAP and 6-OH-CHZ was as described in the above assay in plasma and liver.
Concerning TB, BF and MDZ metabolism, each reaction was stopped with ice-cold
acetonitrile including chlorpropamide, propranolol and diazepam available as ISs in an
HPLC assay, respectively. Sodium hydroxide 0.1N was added to the mixture including
weakly basic BF. Subsequently, 4-OH-TB, 1’-OH-BF and 1’-OH-MDZ were extracted
in diethyl ether (Choi et al., 2014), chloroform (Hefnawy et al., 2007) and ethyl acetate
(Fujita et al., 2008), respectively, and then centrifuged at 3000 rpm for 10 min. After
evaporating the organic layers, the residues were reconstituted in each mobile phase
used for HPLC analysis and loaded onto HPLC columns. The CYP activities were
This article has not been copyedited and formatted. The final version may differ from this version.DMD Fast Forward. Published on September 30, 2016 as DOI: 10.1124/dmd.116.072462
at ASPE
T Journals on June 20, 2018
dmd.aspetjournals.org
Dow
nloaded from

DMD#72462
14
expressed as metabolic formation rates of CYP isoform-specific substrates. Our
preliminary study confirmed that the incubation time, the substrate concentration and
the amount of microsomes were determined to be in the linear range for the metabolite
formation rate.
To examine the direct inhibition of NO on the microsomal CYP activities, the
experiments were performed according to the method reported by Minamiyama et al
(1997). NOC7, a well-known NO donor, dissolved in 0.1 N NaOH was added to the
microsomal incubation mixture. After 30 min of incubations at 37˚C in the absence and
presence of 1 mM NOC7, CYP activities were determined by the rates of APAP
formation and hydroxylation of CHZ, TB, MDZ and BF. The same volume of vehicle
(final concentration, 0.025% NaOH) was added as the reference.
Immunoblotting. Liver microsomal proteins (5 μg for CYP3A and 10 μg for
the other CYPs) were subjected to the 7.5% sodium dodecyl sulfate-polyacrylamide gel
electrophoresis, transferred electrophoretically to Immobilon-P transfer membranes
(Millipore, Bedford, MA, USA), and blocked with Blocking One (Nacalai Tesque). The
membrane was incubated with mouse monoclonal ant-mouse CYP1A2 (ab22717,
1:2000 dilution; Abcam, Cambridge, UK), rabbit monoclonal anti-human CYP2C19
(ab137015, 1:2000 dilution; Abcam), rabbit monoclonal anti-human CYP2D6
This article has not been copyedited and formatted. The final version may differ from this version.DMD Fast Forward. Published on September 30, 2016 as DOI: 10.1124/dmd.116.072462
at ASPE
T Journals on June 20, 2018
dmd.aspetjournals.org
Dow
nloaded from
DMD#72462
15
(ab137426, 1:2000 dilution; Abcam), rabbit polyclonal anti-rat CYP2E1 (ab28146,
1:2000 dilution; Abcam) and rabbit polyclonal anti-human CYP3A4 (ab176310, 1:2000
dilution; Abcam). Horseradish peroxidase-conjugated anti-mouse IgG (NA931V,
1:20000 dilution; GE Healthcare, Little Chalfont, Buckinghamshire, UK) and
anti-rabbit IgG (NA934, 1:20000 dilution; GE Healthcare) secondary antibodies were
used for CYP1A2 and the other CYPs, respectively. The enhanced chemiluminescence
method was used to visualize the protein bands. The levels were expressed as
percentages with the control set as 100%.
HPLC Assays. HPLC analysis was performed on a system equipped with a
Shimadzu SPD-10A, a UV detector, a Shimadzu LC-10A pump and a Shimadzu C-R4A
chromatopac integrator. IMP and the other compounds (substrate and metabolites) were
separated using a Mightysil RP-18 column (particle size 5 μm, 4.6 × 150 mm, Kanto
Kagaku, Tokyo, Japan) and a COSMOSIL 5C8-AR-II column (particle size 5 μm, 4.6 ×
150 mm, Nacalai Tesque Co., Kyoto, Japan), respectively.
PH and APAP were determined by the method of Masubuchi et al. (2003) with
some modifications. Briefly, PH and APAP were monitored by UV detection at 245 nm.
A mobile phase of methanol and 1.5% acetic acid at a ratio of 10:90 (v/v) was used at a
flow rate of 1 ml/min.
This article has not been copyedited and formatted. The final version may differ from this version.DMD Fast Forward. Published on September 30, 2016 as DOI: 10.1124/dmd.116.072462
at ASPE
T Journals on June 20, 2018
dmd.aspetjournals.org
Dow
nloaded from

DMD#72462
16
BF and 1’-OH-BF were determined as reported by Barth et al. (2011) and
Mankowski et al. (1999) with slight modifications. Briefly, BF and 1’-OH-BF were
monitored by UV detection at 248 nm. A mobile phase of methanol and 10 mM
phosphate buffer (pH 3) at a ratio of 40:60 (v/v) was used at a flow rate of 0.8 ml/min.
For IMP, the mobile phase of methanol and 20 mM phosphate buffer (pH 5.9) at a
ratio of 55:45 (v/v) was used at a flow rate of 1 ml/min. IMP was monitored by UV
detection at 254 nm.
4-OH-TB was determined by a minor modification of the method described by
Choi et al. (2014). Briefly, TB and 4-OH-TB were monitored by UV detection at 230
nm. A mobile phase of acetonitrile and 10% sodium acetate (pH 4.3) at a ratio of 32:68
(v/v) was used at a flow rate of 1 ml/min.
6-OH-CHZ was determined as reported by Baek et al. (2006) with slight
modifications. Briefly, a mobile phase consisting of acetonitrile and 0.1 M ammonium
acetate at a ratio of 30:70 (v/v) was delivered at a flow rate of 0.8 ml/min. CHZ and
6-OH-CHZ were monitored by UV detection at 283 nm.
MDZ and 1’-OH-MDZ were determined by the method described by Fujita et al.
(2008).
Pharmacokinetic Data Analysis. Plasma concentration data were analyzed by
This article has not been copyedited and formatted. The final version may differ from this version.DMD Fast Forward. Published on September 30, 2016 as DOI: 10.1124/dmd.116.072462
at ASPE
T Journals on June 20, 2018
dmd.aspetjournals.org
Dow
nloaded from

DMD#72462
17
noncompartmetal analysis using WinNonlin version 2.1 (Pharsight, Mount View, CA,
USA). The area under the plasma concentration-time curve from time zero to infinity
(AUC0-∞) was calculated according to the linear trapezoidal method. The elimination
half-life (T1/2) was calculated using the equation: T1/2 = 0.693/λ, where λ (elimination
rate constant) was estimated from the terminal slope of the plasma concentration versus
time curve. The total body clearance (CLtot) was determined from Dose/AUC0-∞. The
volume of distribution associated with the terminal phase (Vd) was calculated as
CLtot/λ.
The IMP plasma concentration data were fitted to a two-compartment model. The
kinetic parameters A, α, B and β were calculated using the nonlinear least squares
regression program, MULTI (Yamaoka et al, 1981).
Statistical Analysis. Statistical analysis was performed using a one-way
analysis of variance test, and significance was assessed by employing Tukey’s post-hoc
test.
Results
Plasma Total IgE and Serum NO Levels. Type I allergic diseases, such as
atopic dermatitis and asthma, are characterized by the elevated production of an
This article has not been copyedited and formatted. The final version may differ from this version.DMD Fast Forward. Published on September 30, 2016 as DOI: 10.1124/dmd.116.072462
at ASPE
T Journals on June 20, 2018
dmd.aspetjournals.org
Dow
nloaded from

DMD#72462
18
antigen-specific IgE (Platts-Mills, 2001). As shown in Fig. 1A, an enhanced plasma
total IgE concentration was observed at 3 days after the primary sensitization. Plasma
total-IgE levels at 7 days after primary (PS7) or secondary sensitization (SS7) were
significantly elevated to 6357±1740 and 7799±2893 ng/ml, respectively, showing
60-fold higher concentrations compared with the IgE values in the control mice. Plasma
total IgE level in the SS7 mice did not differ from that in the PS7 mice. In our studies,
the PS7 and SS7 mice were used as type 1 allergic mice.
Serum concentrations of nitrate plus nitrite (NOx) were used as an indicator of host
NO production (Fig. 1B). Mice at 5 days after primary sensitization (PS5) showed a
higher level of NOx compared with the corresponding control mice (p<0.01). Compared
with the PS5, the PS7 and SS7 produced significantly higher NOx concentrations.
However, the PS7 mice were similar in serum NOx concentration to the SS7 mice.
Hepatic Microsomal CYP Isoform Activities. The activities of CYP1A2, 2C,
2D, 2E1 and 3A enzymes were assessed in hepatic microsomes by using PH, TB, BF,
CHZ and MDZ as specific substrates, respectively (Fig. 2). Except for the CYP1A2
activity, the activities of the four CYP isoforms were not significantly different when
PS7 and SS7 mice were compared. The relative metabolic CYP1A2 activity (PH
O-deethylation, APAP formation) in the PS7 mice was greatly decreased to 75.6±4.8%,
This article has not been copyedited and formatted. The final version may differ from this version.DMD Fast Forward. Published on September 30, 2016 as DOI: 10.1124/dmd.116.072462
at ASPE
T Journals on June 20, 2018
dmd.aspetjournals.org
Dow
nloaded from

DMD#72462
19
and the decreased level was restored back to 48.6±6.8% inhibition in the SS7 mice.
The relative CYP2C activity (TB 4-hydroxylation) was dramatically decreased to 70.2
±9.3% and 73.7±6.3% by the PS7 and SS7, respectively. The decline in CYP2E1
activity (CHZ 6-hydroxylation) was 58.2±10.9% and 56.3±8.3% in the PS7 and SS7
mice, respectively. CYP3A activity (MDZ 1’-hydroxylation) was decreased by 52.0±
6.7% and 46.6±12.5% by the PS7 and SS7, respectively. In contrast, the CYP2D
activity (BF 1’-hydroxylation) was slightly decreased to 17.1±10.5% in PS7 mice, and
was not altered by the SS7. Even at 5 days after the primary sensitization (PS5),
CYP1A2, CYP2C and CYP3A activities significantly decreased. CYP 2D and
CYP2E1-dependent activities were not altered (data not shown).
Western Blot Analysis of CYP Isoforms. The expression levels of microsomal
CYP1A2, CYP2C, CYP2D, CYP2E1 and CYP3A proteins were investigated by
Western blot analysis (Fig. 3). The PS7 slightly reduced the protein levels of CYP2C
and CYP2E1 isoforms, resulting in an insignificant difference between the PS7 and
control mice. In the SS7 mice, protein levels of five CYP enzymes were similar to those
in the control and PS7 mice.
Pharmacokinetics of PH, APAP, IMP and CHZ. The plasma concentration
profiles and pharmacokinetic parameters of PH, APAP, CHZ and IMP in PS7 and SS7
This article has not been copyedited and formatted. The final version may differ from this version.DMD Fast Forward. Published on September 30, 2016 as DOI: 10.1124/dmd.116.072462
at ASPE
T Journals on June 20, 2018
dmd.aspetjournals.org
Dow
nloaded from
DMD#72462
20
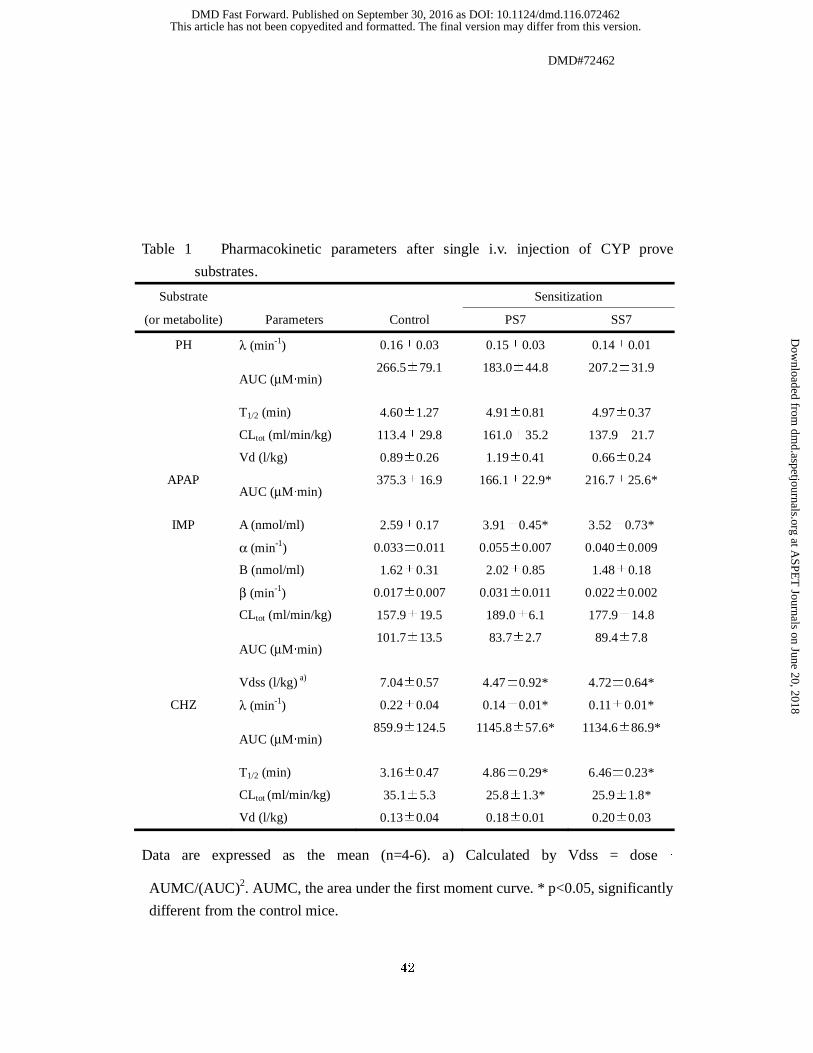
mice are shown in Fig. 4 and Table 1, respectively. The plasma levels of PH and IMP in
the two allergic mice were similar to those of control mice (Figs. 4A and 4C), resulting
in insignificant difference in CLtot. The PS7 and SS7 did not alter the Vd and AUC
values of PH. Concerning a CYP1A2-dependent PH metabolite, the plasma
concentration-time profiles of APAP were significantly different between allergic and
control mice (Fig. 4B). The PS7 and SS7 mice gave approximately 50% reduction in
AUC value, compared with the control mice.
Plasma CHZ concentrations over the experimental periods were significantly higher
in the PS7 and SS7 mice than in the control mice (Fig. 4D). The pharmacokinetic
parameters calculated for PS7 mice were similar to those calculated for SS7 mice. CLtot
values in the allergic mice were lower than that in the control mice, and the highest
AUC values were obtained in the PS7 and SS7 mice. PS7 and the SS7 did not change
the Vd value of CHZ, unlike that of IMP (about 40% reduction).
In Vivo Protein Binding of CHZ. The plasma binding of acidic CHZ was not
significantly altered in PS7 and SS7 mice, with an average fu of 97.0±0.9% and 96.8±
1.2%, respectively, compared with that of 96.7±0.9% in the control mice. These data
would imply an unchanged CHZ distribution in the type 1 allergic mice. Our protein
binding data obtained in the control mice were close to the in vivo data reported by Gao
This article has not been copyedited and formatted. The final version may differ from this version.DMD Fast Forward. Published on September 30, 2016 as DOI: 10.1124/dmd.116.072462
at ASPE
T Journals on June 20, 2018
dmd.aspetjournals.org
Dow
nloaded from

DMD#72462
21
et al (2013).
Hepatic PH and CHZ Concentrations. The time courses of hepatic PH and
CHZ concentrations following intravenous injection of PH and CHZ are shown in Fig. 5.
In PS7 and SS7 mice, high hepatic concentrations of parental PH were observed at the
initial 5 min after the injection (Fig. 5A). Hepatic PH levels were not different between
the PS7 and SS7 mice. In the control mice, hepatic PH was not detected over the
experimental periods. A CYP1A2-dependent metabolite (APAP) was under the
detectable limit in liver of the allergic and control mice.
Hepatic CHZ concentrations in the PS7 and SS7 mice were significantly higher
than those in the control mice (Fig. 5B). Comparison of hepatic levels in the PS7 mice
with those in the PS7 mice showed no significant difference over the experimental
periods.
Inhibitory activity of NO on Activities of Hepatic CYP Isoforms. Figure 6
shows the effect of NO production on the activities of hepatic CYP isoforms. NOC7
(NO donor) pretreatment dramatically suppressed the catalytic activity of CYP2E1 and
3A isozymes with inhibition of 88.4±3.4% and 96.9±1.8%, respectively. The degree
of inhibition of PH O-deethylation (CYP1A2 activity) and TB 4-hydroxylation (CYP2C
activity) was 50.0±4.6% and 30.6±3.4%, respectively. However, NO production did
This article has not been copyedited and formatted. The final version may differ from this version.DMD Fast Forward. Published on September 30, 2016 as DOI: 10.1124/dmd.116.072462
at ASPE
T Journals on June 20, 2018
dmd.aspetjournals.org
Dow
nloaded from

DMD#72462
22
not downregulate CYP-2D-dependent BF 1’-hydroxylation activity.
To further characterize participation of NO in the downregulated CYP activity, the
PS7 and SS7 mice were continuously treated with carboxy-PTIO, a NO scavenger (Fig.
7). In the PS7 mice with carboxy-PTIO treatment, CYP2C, CYP2E1 and CYP3A
activities were rescued back to individual CYP levels in the control mice with saline or
carboxy-PTIO. CYP1A2 activity was significantly enhanced by the carboxy-PTIO
treatment, however, the carboxy-PTIO reduced the CYP1A2 activity in the
saline-injected mice (control). CYP1A2 activity was not significant difference between
the PS7 and control mice treated with carboxy-PTIO. We could not clarify the reasons
why carboxy-PTIO downregulated only CYP1A2 activity in the saline-injected mice.
Concerning the SS7 mice, continuous carboxyl-PTIO treatment (> 12 days)
significantly decreased body weights of mice (data not shown).
Discussion
OVA is a protein with good antigenicity and carrier activity; however, the addition
of some adjuvants is necessary to reinforce immunogenicity when establishing an
animal model. Aluminum adjuvants are the first choice as immune adjuvants, and can
be used to induce humoral immune reactions and stimulate Th2 cells to generate a high
This article has not been copyedited and formatted. The final version may differ from this version.DMD Fast Forward. Published on September 30, 2016 as DOI: 10.1124/dmd.116.072462
at ASPE
T Journals on June 20, 2018
dmd.aspetjournals.org
Dow
nloaded from

DMD#72462
23
levels of antibodies. When aluminum adjuvants are used in allergic diseases, Al(OH)3
dosage forms (powder, gel and solution) and methods provide different findings in
different experiments (Xi et al., 2014). According to the method reported by Behrendt
(1987), we have established herein type 1 allergic mice by treatment with a mixture of
OVA, aluminum hydroxide gel and inactive Bordetella pertussis.
IL-4 regulates differentiation of naïve Th0 cells to develop a Th2 phenotype, and is
an essential cytokine for IgE responses in both mice and humans (Coffman et al., 1988;
Romagnani, 1990). A protein toxin of Bordetella pertussis has a potent adjuvant
capacity and the ability to upregulate IgE production in mice (Mu and Sewell, 1993).
Treatment with Bordetella pertussis and OVA produces the highest IL-4 concentration.
The mice given Bordetella pertussis and OVA show a strong relationship between IL-4
and IgE responses. The secretion of IL-5, which activates eosinophil granulocytes from
Th2 cells is not enhanced by a protein exotoxin produced by Bordetella pertussis (Mu et
al., 1993). Serum total IgE and OVA-specific IgE levels are 5-fold and 3-fold higher in
the mice immunized with Bordetella pertussis and OVA, respectively, than in mice at 3
days after injecting only OVA (Mu and Sewell, 1993). At 7 days, total IgE and specific
IgE levels are dramatically increased. In our study, the plasma total IgE levels at 3 days
after primary immunization were approximately 4-fold higher than those after the
This article has not been copyedited and formatted. The final version may differ from this version.DMD Fast Forward. Published on September 30, 2016 as DOI: 10.1124/dmd.116.072462
at ASPE
T Journals on June 20, 2018
dmd.aspetjournals.org
Dow
nloaded from

DMD#72462
24
injection of vehicle (Fig. 1). PS7 (day 7 of primary treatment) mice had a drastic
increase in total plasma IgE levels, similar to the data published by Mu and Sewell
(1993). At 7 days after secondary sensitization (SS7), the high IgE levels were observed
(Fig.1). Therefore, we considered PS7 and SS7 mice to be a type 1 allergic disease
animal model.
In this study, PS7 and SS7 significantly decreased microsomal CYP1A2, CYP2C,
CYP2E1 and CYP3A activities with a variation of 50%−70% inhibition except for
CYP2D activity (Fig. 2). We preliminarily found that PS7 and SS7 negligibly reduced
hepatic CYP2E1 mRNA levels (data not shown). Abdel-Razzak et al. (1993) reported
that IL-4 increased human CYP2E1 mRNA levels to 5-fold, but did not significantly
affect human CYP1A2-mediated ethoxyresorufin-O-deethylase and CYP3A4-mediated
nifedipine oxidation activities, completely differing from our metabolic activities in
type 1 allergic mice. IL-1β, IL-6, TNF-α and interferon-gamma are well-known to
uniformly downregulate human CYP1A2, 3A and 2C activities and their expression
(Abdel-Razzak et al., 1993). The protein and mRNA expression of rat CYP2D and
CYP2E1 are suppressed by IL-1 (Kurokohchi et al., 2001; Hakkola et al., 2003). At
least, the PS7 did not significantly downregulate the protein levels of CYP2D and 2E1
(Fig. 3). Compared with the proinflammatory cytokines, IgE-mediated allergy may have
This article has not been copyedited and formatted. The final version may differ from this version.DMD Fast Forward. Published on September 30, 2016 as DOI: 10.1124/dmd.116.072462
at ASPE
T Journals on June 20, 2018
dmd.aspetjournals.org
Dow
nloaded from

DMD#72462
25
considerably more complex CYP regulation patterns. Some mediators of the other Th2
cytokines, chemical mediators and reactive nitrogen species may antagonize or
counteract the effects of cytokines on CYP expression.
Immune-mediated diseases may change protein binding and blood flow rates,
possibility leading to altered drug pharmacokinetics. We focused on the characteristic
alteration of CYP1A2, CYP2D and CYP2E1 activities, and selected the CYP substrates
used most often as in vivo probes. We studied the pharmacokinetics of metabolic
capacity-limited drugs (CHZ and IMP) and a hepatic blood flow-limited drug (PH).
IgE-mediated allergy restricted the disposition of CYP2E1-metabolizing CHZ from
plasma (Fig. 4D). To understand the source of this altered disposition, in vivo protein
binding and hepatic CHZ levels were examined. It is known that acidic CHZ is mainly
bound to albumin (Rockich and Blouin, 1999). PS7 and the SS7 mice displayed no
change in plasma protein binding and the high hepatic amounts of parent CHZ (Fig. 5B),
strongly indicating the responsibility of downregulated CYP2E1 metabolism with the in
vitro activity data. Unlike metabolic capacity–limited CHZ, the disappearance of
hepatic blood-flow-limited PH (acidic CYP1A2 substrate) from plasma was not altered
by PS7 and SS7 (Fig. 4A). Simultaneously, we monitored acidic APAP, a
CYP1A2-specific metabolite in plasma, resulting in the low AUC values in the allergic
This article has not been copyedited and formatted. The final version may differ from this version.DMD Fast Forward. Published on September 30, 2016 as DOI: 10.1124/dmd.116.072462
at ASPE
T Journals on June 20, 2018
dmd.aspetjournals.org
Dow
nloaded from

DMD#72462
26
mice (Table 1). Hepatic APAP was below the detectable limit; however, high hepatic
concentrations of parent PH were detected in allergic mice (Fig. 5A). These results
indicated that the reduced AUC values of APAP would reflect CYP1A2-dependent
metabolic capacity. Though we suspected an alteration of hepatic blood-flow rate and
hepatic uptake in the IgE-mediated allergy with the unchanged Vd, the constant CLtot
and the high hepatic amounts of blood flow-limited PH, hepatic blood-flow rate and
hepatic uptake did not appear to be restricted by PS7 and SS7. Mouse CYP2D unlike
human CYP2D, has a limited substrate specificity and efficiently metabolizes IMP to
2-hydroxy IMP (Masubuchi et al, 1997). IMP is a weakly basic and metabolic
capacity-limited drug. In this study, the extent to which IMP is bound to alpha 1-acidic
glycoprotein (αGP) remains unclear. Reportedly, transgenic mice with elevated αGP
show no significant alterations in CLtot and AUC values of IMP; however, there are
significant decreases in the serum unbound fraction (fu), Vd and T1/2 (Yoo et al., 1996).
The altered pharmacokinetics were in good agreement with the changes in our
pharmacokinetic parameters. The published findings, together with our data on CYP2D
activity, allowed us to predict unchanged IMP pharmacokinetics. Practically, PS7 and
SS7 did not alter the metabolic capacity-limited IMP pharmacokinetics (Fig. 4C and
Table 1). Yoo et al (1996) also showed that serum IMP concentrations at the initial times
This article has not been copyedited and formatted. The final version may differ from this version.DMD Fast Forward. Published on September 30, 2016 as DOI: 10.1124/dmd.116.072462
at ASPE
T Journals on June 20, 2018
dmd.aspetjournals.org
Dow
nloaded from

DMD#72462
27
were higher in transgenic mice than in control mice. Similarly, our data showed high
plasma IMP concentrations at initial times in PS7 and the SS7 mice (Fig. 4C). In liver,
we found that CYP2D-metabolized 2-hydroxy IMP and parent IMP were not
quantitatively different between allergic mice and control mice (data not shown).
Consequently, weak basic and metabolic capacity-limited IMP pharmacokinetics
depended on the metabolic capability of the CYP2D enzyme in the allergic mice.
NO inhibits the proliferation of Th1 and their production of IL-2 and
interferon-gamma (Abrahamsohn and Coffman, 1995; Stemberg and Mabbott, 1996),
although Th2 is not affected by NO (Taylor-Robinson et al., 1994). It can participate in
the type 1 allergic reaction (anaphylaxis) (Osada et al., 1994). Patients with bronchial
asthma and allergic rhinitis show an increased level of NO in exhaled air (Alving et al.,
1993; Kharitonov et al., 1997). We also confirmed that the PS7 and SS7 enhanced
serum NO concentrations (Fig. 1B). Minamiyama et al (1997) demonstrated that NO
could interact with microsomal CYP in two ways: NO reversibly binds to the heme
moiety of CYP, forming iron-nitrosyl complexes, and it irreversibly inactivates CYP
through the thiol modification pathway. They also demonstrated that NO did not
change the molecular size of rat microsomal CYP3A and 2C11. We confirmed that PS7
and SS7 insignificantly decreased the protein expression of microsomal CYP1A2, 2C,
This article has not been copyedited and formatted. The final version may differ from this version.DMD Fast Forward. Published on September 30, 2016 as DOI: 10.1124/dmd.116.072462
at ASPE
T Journals on June 20, 2018
dmd.aspetjournals.org
Dow
nloaded from

DMD#72462
28
2D, 2E1 and 3A enzymes (Fig. 3); however, the microsomal CYP activities were
greatly reduced (Fig. 2). These results may suggest posttranslational regulation of
hepatic CYP enzymes such as the inhibitory effect of NO. In this study, NO production
inhibited the microsomal CYP activities in order of CYP3A, CYP2E1, CYP1A2 and
CYP2C, and did not affect the functional regulation of the CYP2D enzyme (Fig. 6).
These results were considerably similar to the inhibitory patterns of all five CYP
enzymes shown in Fig. 2. Our in vivo study with carboxy-PTIO strongly characterized
the participation of NO in the differentially downregulated CYP activities (Fig. 7). We
need to clarify the existence of hepatic CYP complexed with NO in type 1 allergic
mice and to clear the reason for the insensitivity of CYP2D enzyme to NO.
In conclusion, our data suggest that the onset of IgE-mediated allergic diseases
would alter pharmacokinetics of the CYP1A2-, CYP2C-, CYP2E1- and
CYP3A-metabolic capacity-limited drugs. NO-CYP interaction is greatly expected to
participate in the regulatory mechanisms of major CYP enzymes. Our study would
provide a first step of useful information to investigate the main mechanism of
drug-disease interactions.
This article has not been copyedited and formatted. The final version may differ from this version.DMD Fast Forward. Published on September 30, 2016 as DOI: 10.1124/dmd.116.072462
at ASPE
T Journals on June 20, 2018
dmd.aspetjournals.org
Dow
nloaded from

DMD#72462
29
Authorship Contributions
Participated in research design: Tanino, Sakurai
Conducted experiments: Tanino, Komada, Ueda K, Bando, Nojiri, Ueda Y
Performed data analysis: Tanino, Komada, Ueda K, Bando, Nojiri, Ueda Y
Conflict of Interest
The author(s) declare(s) that they have no conflicts of interest to disclose.
This article has not been copyedited and formatted. The final version may differ from this version.DMD Fast Forward. Published on September 30, 2016 as DOI: 10.1124/dmd.116.072462
at ASPE
T Journals on June 20, 2018
dmd.aspetjournals.org
Dow
nloaded from

DMD#72462
30
References
Abdel-Razzak Z, Loyer P, Fautrel A, Gautier JC, Corcos L, Turlin B, Beaune P, and
Guillouzo A (1993) Cytokines down-regulated expression of major cytochrome
P-450 enzymes in adult human hepatocytes in primary culture. Mol Pharmacol
44: 707-715.
Abrahamsohn IS, and Coffman RL (1995) Cytokine and nitric oxide regulation of the
immunosuppression in trypanosoma cruzinfection. J Immunol 155:3955-3963.
Alving KE, Weitzberg E, and Lundberg JM (1993) Increased amount of nitric oxide in
exhaled air of asthmatics. Eur Respir J 6:1268-1370.
Baek HW, Bae SK, Lee MG, and Sohn YT (2006) Pharmacokinetics of chlorzoxazone
in rats with diabetes: induction of CYP2e1 on 6-hydroxychlorzoxazone formation.
J Pharm Sci 95:2452-2462.
Barth T, Simoes RA, Pupo MT, Okano LT, and Bonato PS (2011) Stereoselective liquid
chromatographic determination of 1’-oxobufuralol and 1’-hydrobufuralol in rat
liver microsomal fraction using hollw-fiber liquid-phase microextraction for
sample preparation. J Sep Sci 34:3578-3586.
Behrendt H (1987) Time-course of IgE binding to rat peritoneal cells after sensitization
with alum-adsorbed ovalbumin and Bordetella pertussis. Int Arch Allergy Appl
This article has not been copyedited and formatted. The final version may differ from this version.DMD Fast Forward. Published on September 30, 2016 as DOI: 10.1124/dmd.116.072462
at ASPE
T Journals on June 20, 2018
dmd.aspetjournals.org
Dow
nloaded from

DMD#72462
31
Immunol 82:283-288.
Broide DH (2001) Molecular and cellular mechanisms of allergic disease. J Allergy Clin
Immunol 108:S65-71.
Cheng PY, and Morgan ET (2001) Hepatic cytochrome P450 regulation in disease states.
Curr Drug Metab 2:165-183.
Chittur SV, and Tracy TS (1997) Rapid and sensitive high-performance liquid
chromatographic assay for 6-hydroxychlorzoxazone and chlorzoxazone in liver
microsomes. J Chromatogr B Biomed Sci Appl 693:479-483.
Choi MR, Kwon MH, Cho YY, Choi HD, Kim YC, and Kang HE (2014)
Pharmacokinetics of tolbutamide and its metabolite 4-hydroxytolbutamide in
poloxamer 407-induced hyperlipidemic rats. Biopharm Drug Dispos 35:264-274.
Coffman RL, Seymour BWP, Lebman DA, Hiraki DD, Christiansen JA, Shrader B,
Cherwinski HM, Savelkoul HFJ, Finkelman FD, Bond MW, and Mosmann TR
(1988) The role of helper T cell products in mouse B cell differentiation and
isotype regulation. Immunol Rev 102:5-28.
Davila-Borja VM, Belmont JA, Espinosa JJ, Moreno-Sanchez R, Albores A, and
Montero RD (2007) Induction of CYP1A1 and 2E1 in rat liver by histamine:
binding and kinetic studies. Arch Toxicol 81:697-709.
This article has not been copyedited and formatted. The final version may differ from this version.DMD Fast Forward. Published on September 30, 2016 as DOI: 10.1124/dmd.116.072462
at ASPE
T Journals on June 20, 2018
dmd.aspetjournals.org
Dow
nloaded from

DMD#72462
32
Fujita T, Kawase A, Niwa T, Tomohiro N, Masuda M, Matsuda H, and Iwaki M (2008)
Comparative evaluation of 12 immature citrus fruit extracts for the inhibition of
cytochrome P450 isoform activities. Biol Pharm Bull 31:925-930.
Gao N, Zou D, and Qiao HL (2013) Concentration-dependent inhibitory effect of
baicalin on the plasma protein binding and metabolism of chlorzoxazone,
CYP2E1 probe substrate, in rats in vitro and in vivo. PLoS One 8:1-9.
Ghezzi P, Saccardo B, and Bianchi M (1986) Recombinant tumor necrosis factor
depresses cytochrome P450-dependent microsomal drug metabolism in mice.
Biochem Biophys Res Commun 136:316-321.
Hakkola J, Hu Y, and Ingelman-Sundberg M (2003) Mechanism of down-regulation of
CYP2E1 expressed by inflammatory cytokines in rat hepatoma cells. J Pharmacol
Exp Ther 304:1048-1054.
Hefnawy MM, Sultan MA, and Al-Shehri MM (2007) HPLC separation technique for
analysis of bufuralol enantiomers in plasma and pharmaceutical formulations
using a vancomycin chiral stationary phase and UV detection. J Chromatogr B
856:328-336.
Henderson CJ, McLaughlin LA, Finn RD, Ronseaux S, Kapelyukh Y, and Wolf CR
(2014) A role for cytochrome b5 in the in vivo disposition of anticancer and
This article has not been copyedited and formatted. The final version may differ from this version.DMD Fast Forward. Published on September 30, 2016 as DOI: 10.1124/dmd.116.072462
at ASPE
T Journals on June 20, 2018
dmd.aspetjournals.org
Dow
nloaded from

DMD#72462
33
cytochrome P450 probe drugs in mice. Drug Metab Dispos 42:70-77.
Hodgson PD and Renton KW (1995) The role of nitric oxide generation in
interferon-evoked cytochrome P450 down-regulation. Int J Immunopharmacol
17:995-1000.
Horie T, Chow T, Imaoka S, and Funae Y (2002) Catalytic specificity of CYP2d
isoforms in rat and human. Drug Metab Dispos 30:970-976.
Kharitonov SA, Rajakulasingam K, O’Connor B, Durham SR, and Barnes PJ (1997)
Nasal nitric oxide is increased inpatients with asthma and allergic rhinitis and may
be modulated by nasal glucocorticoids. J Allergy Clin Immunol 99:58-64.
Kim YS, Kwon KS, Kim DK, Choi IL, and Lee HK (2004) Inhibition of murine allergic
airway disease by Bordetella pertussis. Immunology 112:624-630.
Kurokohchi K, Yoneyama H, Nishioka M, and Ichikawa Y (2001) Inhibitory effect of
rifampicin on the depressive action of interleukin-1 on cytochrome P450-linked
monooxygenase system. Metabolism 50:231-236.
Lebrec H, Sarlo K, and Burleson GR (1996) Effect of influenza virus infection on
ovalbumin-specific IgE responses to inhaled antigen in the rat. J Toxicol Environ
Health 49:619-630.
Liu Y, Lu X, Yu HJ, Hua XY, Cui YH, Huang SK, and Liu Z (2010) The expression of
This article has not been copyedited and formatted. The final version may differ from this version.DMD Fast Forward. Published on September 30, 2016 as DOI: 10.1124/dmd.116.072462
at ASPE
T Journals on June 20, 2018
dmd.aspetjournals.org
Dow
nloaded from

DMD#72462
34
osteopontin and its association with Clara cell 10 kDa protein in allergic rhinitis.
Clin Exp Allergy 40:1632-1641.
Mankowski DC (1999) The role of CYP2c19 in the metabolism of (+/-) bufuralol, the
prototypic substrate of CYP2d6. Drug Metab Dispos 27:1024-1028.
Masubuchi Y, Iwasa T, Hosokawa S, Suzuki T, Horie T, Imaoka S, Funae Y, and
Narimatsu S (1997) Selective deficiency of debrisoquine 4-hydroxylase activity in
mouse liver microsomes. J Pharmacol Exp Ther 282:1435-1441.
Masubuchi Y, and Horie T (2003) Resistance to indomethacin-induced down-regulation
of hepatic cytochrome P450 enzymes in the mice with non-functional toll-like
receptor 4. J Hepatol 39:349-356.
Minamiyama Y, Takemura S, Imaoka S, Funae Y, Tanimoto Y, and Inoue M (1997)
Irreversible inhibition of cytochrome P450 by nitric oxide. J Pharmacol Exp Ther
283:1479-1485.
Monshouwer M, Witkamp RF, Nijmeijer SM, Van Amsterdam JG, and Van Miert AS
(1996) Suppression of cytochrome P450- and UDP glucuronosyl
transferase-dependent enzyme activities by proinflammatory cytokines and
possible role of nitric oxide in primary cultures of pig hepatocytes. Toxicol Appl
Pharmacol 137:237-244.
This article has not been copyedited and formatted. The final version may differ from this version.DMD Fast Forward. Published on September 30, 2016 as DOI: 10.1124/dmd.116.072462
at ASPE
T Journals on June 20, 2018
dmd.aspetjournals.org
Dow
nloaded from

DMD#72462
35
Morgan ET (2001) Regulation of cytochrome P450 by inflammatory mediators: why
and how ? Drug Metab Dispos 29:207-212.
Mu HH, and Sewell WA (1993) Enhancement of interleukin-4 production by pertussis
toxin. Infect Immun 61:2834-2840.
Mu HH, Penny R, and Swell WA (1993) Interleukin-5 is necessary for eosinophilia
induced by cyclophosphamide in immunized mice. Immunology 79:452-458.
Narimatsu S, Yamamoto S, Kato R, Masubuchi Y, and Horie T (1999) Contribution of
Flavin-containing monooxygenase and cytochrome P450 to imipramine
N-oxidation in rat hepatic microsomes. Biol Pharm Bull 22:567-571.
Oh HA, Kim HM, and Jeong HJ (2011) Beneficial effects of cheliidonic acid on a
model of allergic rhinitis. Int Immunopharmacol 11:39-45.
Osada S, Ichiki H, Oku H, Ishiguro K, Kunitomo M, Semma M (1994) Participation of
nitric oxide in mouse anaphylactic hypotension. Eur J Pharmacol 252:347-350.
Pauwels R, Bazin H, Platteau B, and Van Der Straeten M (1979) The influence of
different adjuvants on the production of IgD and IgE antibody. Ann Immunol
130c:49-58 .
Platts-Mills TA (2001) The role of immunoglobulin E in allergy and asthma. Am J
Respir Crit Care Med 164(Suppl. 1):S1-S5.
This article has not been copyedited and formatted. The final version may differ from this version.DMD Fast Forward. Published on September 30, 2016 as DOI: 10.1124/dmd.116.072462
at ASPE
T Journals on June 20, 2018
dmd.aspetjournals.org
Dow
nloaded from

DMD#72462
36
Projean D, Dautrey S, Vu HK, Groblewski T, Brazier JL, and Ducharme J (2005)
Selective downregulation of hepatic cytochrome P450 expression and activity in a
rat model of inflammatory pain. Pharm Res 22:62-70.
Rockich K and Blouin R (1999) Effect of the acute-phase response on the
pharmacokinetics of chlorzoxazone and cytochrome P-450 2E1 in vitro activity in
rats. Drug Metab Dispos 27:1074-1077.
Romagnani S (1990) Regulation and deregulation of human IgE synthesis. Immunol
Today 11:316-321.
Sanada H, Sekimoto M, Kamoshita A, and Degawa M (2011) Changes in expression of
hepatic cytochrome P450 subfamily enzymes during development of
adjuvant-induced arthritis in rats. J Toxicol Sci 36:181-190.
Stadler J, Trockfeld J, Schmalix WA, Brill T, Siewert JR, Greim H, and Doehmer J
(1994) Inhibition of cytochromes P4501A by nitric oxide. Proc Natl Acad Sci
91:3559-3563.
Stassen M, Muller C, Arnold M, Hultne L, Klein-Hessling S, Neudorfl C, Reineke T,
Serfling E, and Schmitt E (2001) IL-9 and IL-13 production by activated mast
cells is strongly enhanced in the presence of lipopolysaccharide: NF-kappa B is
decisively involved in the expression of IL-9. J Immunol 166:4391-4398.
This article has not been copyedited and formatted. The final version may differ from this version.DMD Fast Forward. Published on September 30, 2016 as DOI: 10.1124/dmd.116.072462
at ASPE
T Journals on June 20, 2018
dmd.aspetjournals.org
Dow
nloaded from

DMD#72462
37
Stemberg JM, and Mabbott NA (1996) Nitric oxide-mediated suppression of T cell
responses during trypanosome brucei infection: soluble trypanosome products and
interferon-f are synergistic inducers of nitric oxide synthase. Eur J Immunol
26:539-543.
Sujita K, Okuno F, Tanaka Y, Hirano Y, Imnamoto Y, Eto S, and Arai M (1990) Effect of
interleukin-1 on the levels of cytochrome P450 involving interleukin-1 receptor
on the isolated hepatocytes of rat. Biochem Biophys Res Commun 168:1217-1222.
Taylor-Robinson AW, Liew FY, Sevem A, Xu D, McSortey SJ, Garside P, Padron J, and
Phillps RS (1994) Regulation of the immune response by nitric oxide
differentially produced by T helper type 1 and T helper type 2 cells. Eur J
Immunol 24:980-984.
Tumes DJ, Cormie J, Calvert MG, Stewart K, Nassenstein C, Braun A, Foster PS, and
Dent LA (2007) Strain-dependent resistance to allergen-induced lung
pathophysiology in mice correlates with rate of apoptosis of lung-derived
eosinophils. J Leuko Biol 81:1362-1373.
Warner JO, Kaliner MA, Crisci CD, Del Giacco S, Frew AJ, Liu GH, Maspero J, Moon
HB, Nakagawa T, Potter PC, Rosenwasser LJ, Singh AB, Valovirta E, and
Cauwenberge P (2006) Allergy practice worldwide: a reported by the World
This article has not been copyedited and formatted. The final version may differ from this version.DMD Fast Forward. Published on September 30, 2016 as DOI: 10.1124/dmd.116.072462
at ASPE
T Journals on June 20, 2018
dmd.aspetjournals.org
Dow
nloaded from

DMD#72462
38
Allergy organization specialty and training council. Int Arch Allergy Immunol
139:166-174.
Xi L, Fan E, Zhao Y, Li Y, Zhang Y, and Zhang L (2014) Role of aluminum adjuvant in
producing an allergic rhinitis animal model. Genet Mol Res 13:5173-5181.
Yamaki K, Alam AH, Hossain MA, Taneda S, Yanagisawa R, Takano H, and Yoshino S
(2005) Effect of rolipram, a phosphodiesterase IV inhibitor, on allergic footpad
swelling using various adjuvants in mice. Scand J Immunol 62:378-384.
Yamaoka K, Tanigawara T, Nakagawa T, and Uno T (1981) A pharmacokinetic analysis
program (multi) for microcomputer. J Pharmacobio-Dyn 4:879-885.
Yoo SD, Holladay JW, Fincher TK, Baumann H, and Dewey MJ (1996) Altered
disposition and antidepressant activity of imipramine in transgenic mice with
elevated alpha1-1acid glycoprotein. J Pharm Exp Ther 276:918-922.
Zhu Z, Homer RJ, Wang Z, Chen Q, Geba GP, Wang J, Zhang Y, and Elias JA (1999)
Pulmonary expression of interleukin-13 causes inflammation, mucus
hypersecretion, subepithelial fibrosis, physiologic abnormalities, and eotaxin
production. J Clin Invest 103:779-788.
This article has not been copyedited and formatted. The final version may differ from this version.DMD Fast Forward. Published on September 30, 2016 as DOI: 10.1124/dmd.116.072462
at ASPE
T Journals on June 20, 2018
dmd.aspetjournals.org
Dow
nloaded from

DMD#72462
39
Legends of Figures
Figure 1. Total plasma IgE and serum NO levels in type 1 allergic mice. A) ○,
control mice; ●, sensitized mice. Each point represents the mean±S.D. of
10-15 mice. *p<0.01 compared with control mice. B) At 5 and 7 days after the
primary sensitization (PS5 and PS7, respectively), mice were sacrificed. On
day 8 after the primary sensitization, mice received the secondary sensitization
of ovalbumin. The mice were sacrificed at 7 days after the secondary
sensitization (SS7). Each point represents the mean±S.D. of 10 mice. *p<0.01
compared with individual control mice. **p<0.05 compared with PS5 mice.
Figure 2. Changes in hepatic CYP isozyme activities in IgE-mediated allergic mice.
□, control mice for PS7 and SS7; ■, sensitized mice (PS7 and SS7 mice).
Data are expressed as the mean±S.D. of 4-6 mice. *p<0.01 compared with
each control mice. **p<0.01 compared with PS7 mice. A) APAP formed from
10 μM PH after a 5-min incubation with microsomes (1 mg/ml); B) 4-OH-TB
formed from 800 μM TB after a 30-min incubation with microsomes (0.5
mg/ml); C) 1’-OH-BF formed from 2 μM BF after a 5 min-incubation with
This article has not been copyedited and formatted. The final version may differ from this version.DMD Fast Forward. Published on September 30, 2016 as DOI: 10.1124/dmd.116.072462
at ASPE
T Journals on June 20, 2018
dmd.aspetjournals.org
Dow
nloaded from

DMD#72462
40
microsomes (0.4 mg/ml); D) 6-OH-CHZ formed from 20 μM CHZ after a
5-min incubation with microsomes (0.5 mg/ml); E) 1’-OH-MDZ formed from
10 μM MDZ after a 4-min incubation with microsomes (0.1 mg/ml).
Figure 3. Hepatic protein expression of CYP1A2, 2C, 2D, 2E1 and 3A in primary
sensitized mice. The protein expression is expressed in terms of percentage of
the control mice (Cont.) on day 7 after i.p. injection of saline, with the control
set to 100%. All samples were loaded in triplicate.
Figure 4. Plasma concentration-time profiles of PH, APAP, IMP and CHZ after single
intravenous injection. CYP probe substrates were intravenously injected at
each dose of 5 mg/kg. A) PH (CYP1A2 substrate); B) APAP (CYP1A2
metabolite); C) IMP (CYP2D substrate); D) CHZ (CYP2E1 substrate). ○,
mice 7 days after i.p. injection of saline (control); ●, PS7 mice; ■, SS7 mice.
Data are expressed as the mean±S.D. (n=4-6).
Figure 5. Hepatic PH and CHZ concentrations after intravenous injection. A)
parent PH; B) parent CHZ. Control: mice 7 days after i.p. injection of saline.
This article has not been copyedited and formatted. The final version may differ from this version.DMD Fast Forward. Published on September 30, 2016 as DOI: 10.1124/dmd.116.072462
at ASPE
T Journals on June 20, 2018
dmd.aspetjournals.org
Dow
nloaded from

DMD#72462
41
Data are expressed as the mean±S.D. (n=4-6). *p<0.01, significantly different
from control mice. ND, not detectable.
Figure 6. Inhibitory effect of NO on the activities of hepatic CYP isozymes. Hepatic
microsomes were preincubated with 1 mM NOC7 or vehicle for 30 min at 37˚
C. Data are expressed as means±S.D. (n=3) of the percentage of CYP isozyme
activities in the absence of NOC7. *p<0.01, significantly different from the
vehicle.
Figure 7. Changes in microsomal hepatic CYP activities in type 1 allergic mice
treated with carboxy-PTIO. □, mice without carboxy-PTIO treatment; ■,
mice with carboxyl-PTIO treatment. Control: 7 days after i.p. injection of
saline. Data are expressed as the mean±S.D. (n=4). *p<0.01, significantly
different from PS7 mice without carboxy-PTIO treatment.
This article has not been copyedited and formatted. The final version may differ from this version.DMD Fast Forward. Published on September 30, 2016 as DOI: 10.1124/dmd.116.072462
at ASPE
T Journals on June 20, 2018
dmd.aspetjournals.org
Dow
nloaded from
DMD#72462
42
Table 1 Pharmacokinetic parameters after single i.v. injection of CYP prove
substrates.
Substrate Sensitization
(or metabolite) Parameters Control PS7 SS7
PH λ (min-1) 0.16±0.03 0.15±0.03 0.14±0.01
AUC (μM‧min)
266.5±79.1 183.0±44.8 207.2±31.9
T1/2 (min) 4.60±1.27 4.91±0.81 4.97±0.37
CLtot (ml/min/kg) 113.4±29.8 161.0±35.2 137.9±21.7
Vd (l/kg) 0.89±0.26 1.19±0.41 0.66±0.24
APAP AUC (μM‧min)
375.3±16.9 166.1±22.9* 216.7±25.6*
IMP A (nmol/ml) 2.59±0.17 3.91±0.45* 3.52±0.73*
α (min-1) 0.033±0.011 0.055±0.007 0.040±0.009
B (nmol/ml) 1.62±0.31 2.02±0.85 1.48±0.18
β (min-1) 0.017±0.007 0.031±0.011 0.022±0.002
CLtot (ml/min/kg) 157.9±19.5 189.0±6.1 177.9±14.8
AUC (μM‧min)
101.7±13.5 83.7±2.7 89.4±7.8
Vdss (l/kg) a) 7.04±0.57 4.47±0.92* 4.72±0.64*
CHZ λ (min-1) 0.22±0.04 0.14±0.01* 0.11±0.01*
AUC (μM‧min)
859.9±124.5 1145.8±57.6* 1134.6±86.9*
T1/2 (min) 3.16±0.47 4.86±0.29* 6.46±0.23*
CLtot (ml/min/kg) 35.1±5.3 25.8±1.3* 25.9±1.8*
Vd (l/kg) 0.13±0.04 0.18±0.01 0.20±0.03
Data are expressed as the mean (n=4-6). a) Calculated by Vdss = dose ‧
AUMC/(AUC)2. AUMC, the area under the first moment curve. * p<0.05, significantly
different from the control mice.
This article has not been copyedited and formatted. The final version may differ from this version.DMD Fast Forward. Published on September 30, 2016 as DOI: 10.1124/dmd.116.072462
at ASPE
T Journals on June 20, 2018
dmd.aspetjournals.org
Dow
nloaded from

This article has not been copyedited and formatted. The final version may differ from this version.DMD Fast Forward. Published on September 30, 2016 as DOI: 10.1124/dmd.116.072462
at ASPE
T Journals on June 20, 2018
dmd.aspetjournals.org
Dow
nloaded from

This article has not been copyedited and formatted. The final version may differ from this version.DMD Fast Forward. Published on September 30, 2016 as DOI: 10.1124/dmd.116.072462
at ASPE
T Journals on June 20, 2018
dmd.aspetjournals.org
Dow
nloaded from

This article has not been copyedited and formatted. The final version may differ from this version.DMD Fast Forward. Published on September 30, 2016 as DOI: 10.1124/dmd.116.072462
at ASPE
T Journals on June 20, 2018
dmd.aspetjournals.org
Dow
nloaded from

This article has not been copyedited and formatted. The final version may differ from this version.DMD Fast Forward. Published on September 30, 2016 as DOI: 10.1124/dmd.116.072462
at ASPE
T Journals on June 20, 2018
dmd.aspetjournals.org
Dow
nloaded from

This article has not been copyedited and formatted. The final version may differ from this version.DMD Fast Forward. Published on September 30, 2016 as DOI: 10.1124/dmd.116.072462
at ASPE
T Journals on June 20, 2018
dmd.aspetjournals.org
Dow
nloaded from

This article has not been copyedited and formatted. The final version may differ from this version.DMD Fast Forward. Published on September 30, 2016 as DOI: 10.1124/dmd.116.072462
at ASPE
T Journals on June 20, 2018
dmd.aspetjournals.org
Dow
nloaded from

This article has not been copyedited and formatted. The final version may differ from this version.DMD Fast Forward. Published on September 30, 2016 as DOI: 10.1124/dmd.116.072462
at ASPE
T Journals on June 20, 2018
dmd.aspetjournals.org
Dow
nloaded from