phase 2: evaluation of alternative technologies for pathogens · phase 2: evaluation of alternative...
TRANSCRIPT
Phase 2: Evaluation of Alternative Technologies for Pathogens Project OPEN Science Team for Pathogens
Science Team Members Responsible for Pathogen Measurements Dr. Mark D. Sobsey, Dr. Otto (Chip) D. Simmons, III Dr. Shabnam Qureshi Christina Likirdopulos Lynn Worley-Davis This project is part of an overall research, development and demonstration effort to identify environmentally superior technologies for the treatment and management of swine waste. The project is being conducted for Smithfield Foods, Inc., Premium Standards Farms Inc. and the Attorney General of the State of North Carolina through agreements between these entities known as the “Smithfield Agreement” and the “Premium Standard Farms Agreement.” This report is a continuation of the previous year’s report for evaluation of additional technologies using the same experimental design and methods as previously described.
The agreement defines “Environmentally Superior Technology or Technologies” as any technology, or combination of technologies that (1) is permittable by the appropriate governmental authority; (2) is determined to be technically, operationally, and economically feasible for an identified category or categories of farms [to be described in a technology determination]; and (3) meets the following performance standards:
1. Eliminates the discharge of animal waste to surface waters and groundwater through direct discharge, seepage, or runoff; 2. Substantially eliminates atmospheric emission of ammonia; 3. Substantially eliminates the emission of odor that is detectable beyond the boundaries of the parcel or tract of land on which the swine farm is located; 4. Substantially eliminates the release of disease-transmitting vectors and airborne pathogens; and 5. Substantially eliminates nutrient and heavy metal contamination of soil and groundwater.
This project addressed issues related to “pathogens” in the agreement. Therefore, this project was intended to address pathogens in item 1 above (Eliminate the discharge of animal waste pathogens to surface waters and groundwater through direct discharge, seepage, or runoff) and 4 above (substantially eliminate the release of disease-transmitting vectors and airborne pathogens). Because it was not possible to consistently sample surface and ground water on or near the swine farms having the alternative technologies and the surrogate farms having current technologies, it was not possible to directly address water quality impacts of interest in item 1 above. Therefore, as an approach to determining potential impacts on surface and ground water quality, we measured the concentrations of pathogens and fecal indicator microbes in solid and liquid waste residuals intended to be applied to land on the farm, as well as the levels of these organisms in soils where these waste residuals had been applied. Our reasoning was that we had previously shown microbial impacts on surface and ground water quality where treated swine waste solids and liquids had been land applied. It is well known from numerous studies that lower levels of pathogens in treated fecal wastes applied to land equate to lower risks of pathogen contamination of surface and ground waters. This project was part of a larger project, referred to as Project OPEN, that also addressed item 2, the emission of atmospheric ammonia, and item 3, and the emission of odor. The general and specific objectives of the pathogen project were to determine the levels of pathogens, indicators of pathogens, and related microbial contaminants of health concern (endotoxins) of swine manure origin in: (1) the untreated manure, (2) the treated solid and liquid manure residuals, (3) air, (4) land, (5) nearby water, and (6) vectors (flies) on farms with alternative swine manure treatment and management systems. Particular emphasis was on quantifying the extent to which alternative treatment systems reduced pathogens and related microbes of swine manure origin,
the transport, survival and fates of these pathogens and other microbes on the farm, and the extent, if any, to which these pathogens and related microbes traveled off the farms to contaminate air, water and land. This project attempted to identify environmentally superior technologies by determining which technologies were the most effective at reducing the presence and concentrations of waste-associated bacteria and viruses in swine feces, wastes, treated waste residuals and various environmental media potentially impacted by swine wastes and their residuals, including air, vectors, water, soil and vegetation. The results from this study provide data and interpretations on the concentrations of pathogens and pathogen indicators in relevant media (feces, barn flush, wastewater, waste solids, and in vectors (flies) and various environmental media (such as water, soil, vegetation and air). The study results document and allow for comparisons of the efficacies of the various alternative swine waste treatment and management technologies to reduce pathogens in swine wastes and prevent or contain their environmental release such that the technologies can be judged as environmentally superior. The basis for determining what constitutes an environmentally superior technology are: (1) the extent to which pathogens are reduced in the waste streams and residuals produced in the technology for treatment and management of swine wastes and (2) the extent to which they are environmentally superior in reducing and containing pathogens such that they are not transmitted by air, vectors and by routes construed as discharge, seepage or runoff. In all cases, each of the candidate or alternative technologies proposed as possibly environmentally superior was compared in their performance and environmental impacts to the standard or so-called surrogate technology now employed for swine waste treatment and management in North Carolina. Therefore, the project was intended to be responsive to the terms of the agreement as they relate to pathogens in swine wastes. This report presents the findings of pathogen studies for several of the candidate swine waste treatment and management technologies.
Contents page Constructed Wetlands – Howard Farm: solid separation followed by treatment via constructed wetlands 3 ISSUES – Vestal farm: mesophilic digester; aerobic digester; with water reuse 15 ISSUES – Harrells farm: permeable covered lagoon with an aerobic digester and evaporation system 25 ISSUES – Carrolls Farm: aerobic digester (IESS) with an aerobic blanket system 36 Sequencing Batch Reactor: AHA Hunt farm: sequencing batch reactor system 48 Koger/van Kempen gasifier: a small-scale gasifier built at the Lake Wheeler Road Field Laboratory and linked with the Grinnells belt system (previous report) 58 Super Soils composting unit: a solids composting unit built at the Hickory Grove site and linked with the Super Soils technology (Goshen Ridge farm; previous report) 68 Antimicrobial resistance occurrence and patterns in E.Coli and Salmonella isolated from Phase 1 and 2 technologies and surrogate farm sites 80 Overall evaluation of Phase 2 technologies 91
Phase 2 OPEN Technology Evaluations - Pathogens 2
11. Evaluation of Howard Farm (Constructed Wetlands) Technology for Pathogens
Project OPEN Science Team for Pathogens
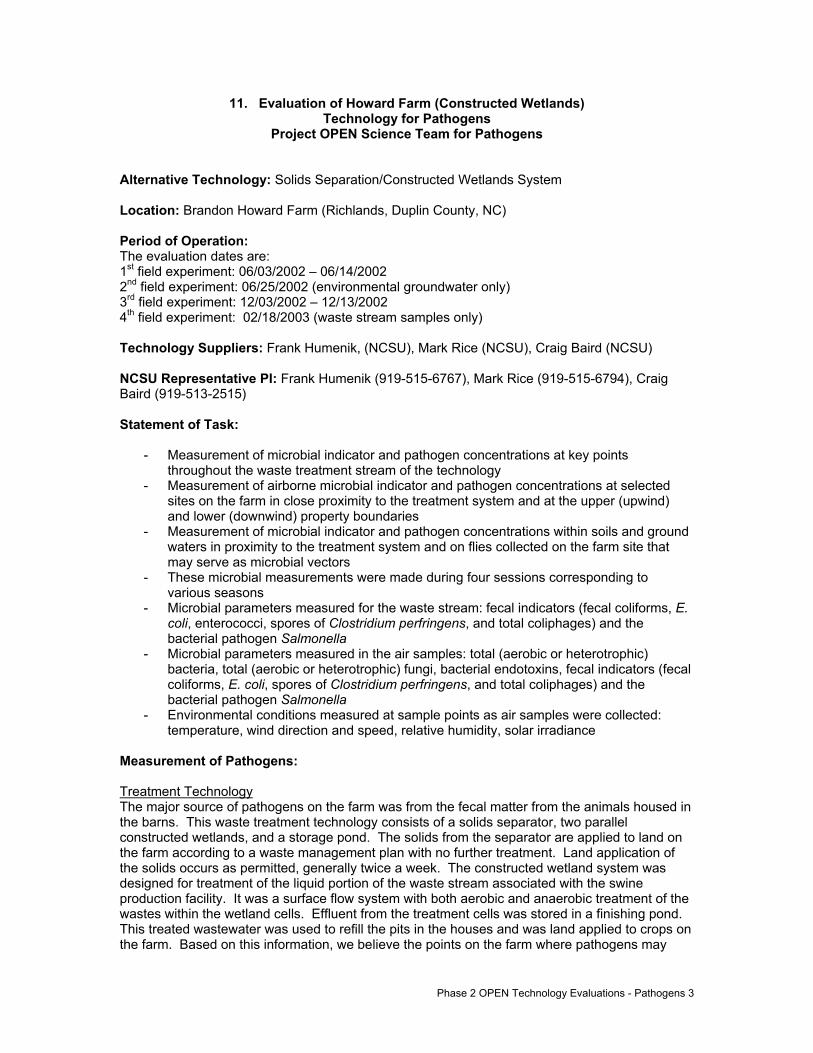
Alternative Technology: Solids Separation/Constructed Wetlands System Location: Brandon Howard Farm (Richlands, Duplin County, NC) Period of Operation: The evaluation dates are: 1st field experiment: 06/03/2002 – 06/14/2002 2nd field experiment: 06/25/2002 (environmental groundwater only) 3rd field experiment: 12/03/2002 – 12/13/2002 4th field experiment: 02/18/2003 (waste stream samples only) Technology Suppliers: Frank Humenik, (NCSU), Mark Rice (NCSU), Craig Baird (NCSU) NCSU Representative PI: Frank Humenik (919-515-6767), Mark Rice (919-515-6794), Craig Baird (919-513-2515) Statement of Task:
- Measurement of microbial indicator and pathogen concentrations at key points throughout the waste treatment stream of the technology
- Measurement of airborne microbial indicator and pathogen concentrations at selected sites on the farm in close proximity to the treatment system and at the upper (upwind) and lower (downwind) property boundaries
- Measurement of microbial indicator and pathogen concentrations within soils and ground waters in proximity to the treatment system and on flies collected on the farm site that may serve as microbial vectors
- These microbial measurements were made during four sessions corresponding to various seasons
- Microbial parameters measured for the waste stream: fecal indicators (fecal coliforms, E. coli, enterococci, spores of Clostridium perfringens, and total coliphages) and the bacterial pathogen Salmonella
- Microbial parameters measured in the air samples: total (aerobic or heterotrophic) bacteria, total (aerobic or heterotrophic) fungi, bacterial endotoxins, fecal indicators (fecal coliforms, E. coli, spores of Clostridium perfringens, and total coliphages) and the bacterial pathogen Salmonella
- Environmental conditions measured at sample points as air samples were collected: temperature, wind direction and speed, relative humidity, solar irradiance
Measurement of Pathogens: Treatment Technology The major source of pathogens on the farm was from the fecal matter from the animals housed in the barns. This waste treatment technology consists of a solids separator, two parallel constructed wetlands, and a storage pond. The solids from the separator are applied to land on the farm according to a waste management plan with no further treatment. Land application of the solids occurs as permitted, generally twice a week. The constructed wetland system was designed for treatment of the liquid portion of the waste stream associated with the swine production facility. It was a surface flow system with both aerobic and anaerobic treatment of the wastes within the wetland cells. Effluent from the treatment cells was stored in a finishing pond. This treated wastewater was used to refill the pits in the houses and was land applied to crops on the farm. Based on this information, we believe the points on the farm where pathogens may
Phase 2 OPEN Technology Evaluations - Pathogens 3
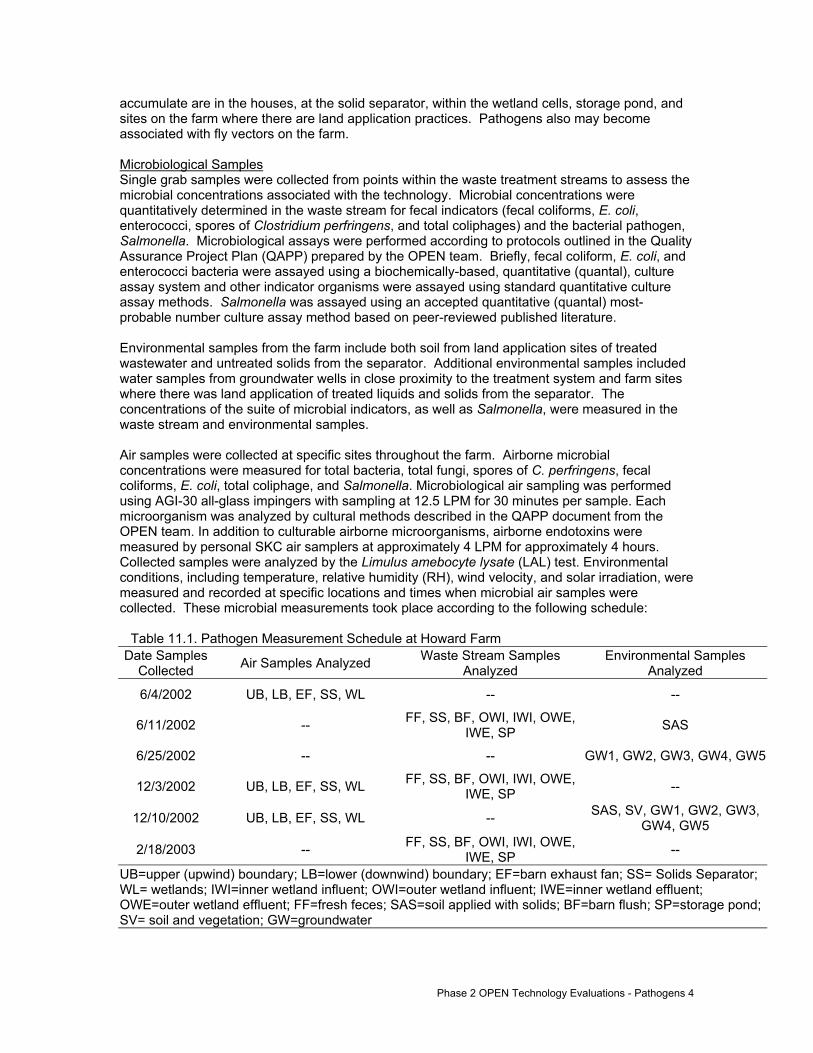
accumulate are in the houses, at the solid separator, within the wetland cells, storage pond, and sites on the farm where there are land application practices. Pathogens also may become associated with fly vectors on the farm. Microbiological Samples Single grab samples were collected from points within the waste treatment streams to assess the microbial concentrations associated with the technology. Microbial concentrations were quantitatively determined in the waste stream for fecal indicators (fecal coliforms, E. coli, enterococci, spores of Clostridium perfringens, and total coliphages) and the bacterial pathogen, Salmonella. Microbiological assays were performed according to protocols outlined in the Quality Assurance Project Plan (QAPP) prepared by the OPEN team. Briefly, fecal coliform, E. coli, and enterococci bacteria were assayed using a biochemically-based, quantitative (quantal), culture assay system and other indicator organisms were assayed using standard quantitative culture assay methods. Salmonella was assayed using an accepted quantitative (quantal) most-probable number culture assay method based on peer-reviewed published literature. Environmental samples from the farm include both soil from land application sites of treated wastewater and untreated solids from the separator. Additional environmental samples included water samples from groundwater wells in close proximity to the treatment system and farm sites where there was land application of treated liquids and solids from the separator. The concentrations of the suite of microbial indicators, as well as Salmonella, were measured in the waste stream and environmental samples. Air samples were collected at specific sites throughout the farm. Airborne microbial concentrations were measured for total bacteria, total fungi, spores of C. perfringens, fecal coliforms, E. coli, total coliphage, and Salmonella. Microbiological air sampling was performed using AGI-30 all-glass impingers with sampling at 12.5 LPM for 30 minutes per sample. Each microorganism was analyzed by cultural methods described in the QAPP document from the OPEN team. In addition to culturable airborne microorganisms, airborne endotoxins were measured by personal SKC air samplers at approximately 4 LPM for approximately 4 hours. Collected samples were analyzed by the Limulus amebocyte lysate (LAL) test. Environmental conditions, including temperature, relative humidity (RH), wind velocity, and solar irradiation, were measured and recorded at specific locations and times when microbial air samples were collected. These microbial measurements took place according to the following schedule: Table 11.1. Pathogen Measurement Schedule at Howard Farm Date Samples
Collected Air Samples Analyzed Waste Stream Samples Analyzed
Environmental Samples Analyzed
6/4/2002 UB, LB, EF, SS, WL -- --
6/11/2002 -- FF, SS, BF, OWI, IWI, OWE, IWE, SP SAS
6/25/2002 -- -- GW1, GW2, GW3, GW4, GW5
12/3/2002 UB, LB, EF, SS, WL FF, SS, BF, OWI, IWI, OWE, IWE, SP --
12/10/2002 UB, LB, EF, SS, WL -- SAS, SV, GW1, GW2, GW3, GW4, GW5
2/18/2003 -- FF, SS, BF, OWI, IWI, OWE, IWE, SP --
UB=upper (upwind) boundary; LB=lower (downwind) boundary; EF=barn exhaust fan; SS= Solids Separator; WL= wetlands; IWI=inner wetland influent; OWI=outer wetland influent; IWE=inner wetland effluent; OWE=outer wetland effluent; FF=fresh feces; SAS=soil applied with solids; BF=barn flush; SP=storage pond; SV= soil and vegetation; GW=groundwater
Phase 2 OPEN Technology Evaluations - Pathogens 4

Figure 11.1. Microbial Waste Stream Measurements Taken at the Howard farm
Solid Sep
Finishing Pond
Inner Cell
Ou
In
In OutOut
Results: Waste Stream Samples Table 11.2. Microbial “Sou
Howard Farm
Site Date
9/10/2002Surrogate 1 1/7/200310/1/20021/28/20035/13/2003
Surrogate 2
7/28/20036/11/200212/3/2002
Howard Farm (Constructed
Wetlands) 2/18/2003 Concentrations of microbiasurrogate farms and of the microbial “source strength”where the animals are housmicrobial indicators and Saof the two surrogate sites. several seasons, with the m
4
ter Cell
rce Strength" in Fresh Swine Feces for the Surrogate Fa
Fecal Coliform (cfu/g)
E. coli (cfu/g)
Enterococci (cfu/g)
Cl. perfringens (cfu/g)
1.4E+07 1.0E+07 3.6E+05 7.9E+04 8.1E+05 1.7E+05 1.6E+05 4.5E+01 2.9E+05 1.2E+05 5.5E+05 2.3E+02 1.5E+06 2.4E+05 3.0E+05 5.4E+05 2.4E+06 3.8E+05 5.3E+05 4.5E+03 3.9E+06 2.9E+06 2.9E+05 3.5E+06 1.7E+06 1.7E+06 4.0E+05 4.9E+04 8.8E+05 4.1E+05 4.5E+04 4.9E+05 2.6E+06 2.0E+06 1.0E+05 <1.8E+02
l indicators and Salmonella were measured in the waste constructed wetlands technology. With each of the farm was measured directly in fresh fecal samples taken fromed (Table 11.2). For this alternative technology, the conlmonella were similar in the fresh feces collected from baFor each of these farms, the data represents sample colicrobial concentrations similar for each.
Phase 2 OPEN Technology Evaluati
Hog Houses
rms
C
2< 13112
<1
stres, th thecenrns
lect
ons
BF
SS
OWI
IWI
OWE IWESP
and the
oliphage (pfu/g)
Salmonella (cfu/g)
.5E+07 4.6E+01 4.5E+04 < 3.0E+01 .8E+03 < 3.0E-01 .7E+05 2.1E-01 .8E+04 3.6E-01 .8E+06 1.1E+02 .1E+04 <3.0E-01 4.5E+03 4.6E+01 .8E+04 <3.0E-01
am of two e barns trations of to those ion during
- Pathogens 5

Table 11.3. Log10 Microbial Reductions in the Liquid Waste Stream Achieved by the Surrogate Farms and at the Howard Farm with the Constructed Wetlands Treatment Technology
Site Date Fecal Coliform E. coli Enterococci Cl.
perfringens Coliphage Salmonella
9/10/2002 2.0 2.1 2.0 1.3 2.0 1.4 Surrogate 1 1/7/2003 1.5 1.5 1.1 0.4 1.1 2.4 10/1/2002 1.5 1.6 0.9 1.3 0.7 > 0.2 1/28/2003 0.7 0.7 0.3 -0.3 0.7 -0.8 Surrogate 2 5/13/2003 1.6 1.2 0.9 1.4 1.0 0.3 6/11/2002 < 0.9 3.8 0.2 4.6 3.3 3.2 12/3/2002 4.0 4.3 3.0 3.6 2.7 2.3
Howard Farm (Constructed
Wetlands) 2/18/2003 4.8 > 5.8 4.1 4.0 2.4 > 3.2 * Negative Log10 Reduction values correspond to increases in microbial concentrations within the treatment systems In order to determine the efficacy of pathogen reduction by the treatment systems of the surrogate sites and of the constructed wetlands technology, the overall log10 microbial reductions were computed for each of the treatment systems (Table 11.3). Reductions were computed using the barn flush for each farm as the influent to the treatment system, the lagoon liquid microbial concentrations for the surrogate farms and the storage pond liquid for the constructed wetlands system as the final treated material. Microbial concentrations in the barn flush were used because these give a more representative estimate of the microbial concentrations of the influent to the treatment system than the microbial concentrations in fresh fecal matter. The barn flush represents a greater portion of the animals in the house and provides a more homogenous mixture of microbes. These computed reductions also account for any microbial degradation that may occur within the houses before the waste material enters the actual treatment system. From Table 11.3, the microbial reductions for separated swine waste liquid by the wetlands treatment system were statistically greater than those for the lagoon liquid as the treated waste stream of the surrogate sites (Mann-Whitney U Test, p=0.0001). For two of the microbes tested (Cl. perfringens and Salmonella), surrogate farm 2 actually shows an increase in the microbe levels in the lagoon liquid when compared to concentrations in the barn flush. This can possibly be explained by differences in the animals in the farm over time that may have shed different concentrations of these microbes. Also, there may be some degradation and loss of viability of the microbes in the stored waste in the houses before the accumulated wastes from the houses are flushed to the treatment system. Table 11.4. Log10 Microbial Reductions in the Total Waste Stream Achieved by the Surrogate
Farms and at the Howard Farm with the Constructed Wetlands Treatment Technology
Site Date Fecal Coliform E. coli Enterococci Cl. perfringens Coliphage Salmonella
9/10/2002 2.0 2.1 2.0 1.3 2.0 1.4 Surrogate 1 1/7/2003 1.5 1.5 1.1 0.4 1.1 2.4 10/1/2002 1.5 1.6 0.9 1.3 0.7 > 0.2 1/28/2003 0.7 0.7 0.3 -0.3 0.7 -0.8 Surrogate 2 5/13/2003 1.6 1.2 0.9 1.4 1.0 0.3 6/11/2002 < 0.3 2.6 -0.1 3.5 2.4 2.5 12/3/2002 3.2 3.5 2.1 2.7 2.1 1.5
Howard Farm (Constructed
Wetlands) 2/18/2003 3.8 > 4.6 3.1 3.0 1.9 > 2.8 * Negative Log10 Reduction values correspond to apparent increases in microbial concentrations within the treatment
systems; more specifically, higher concentrations in waste residual samples after treatment than in the initial barn flush material.
For the constructed wetlands system, it should be noted that the wetlands technology was designed to treat only the liquid portion of the waste stream and that the solids from the solids
Phase 2 OPEN Technology Evaluations - Pathogens 6
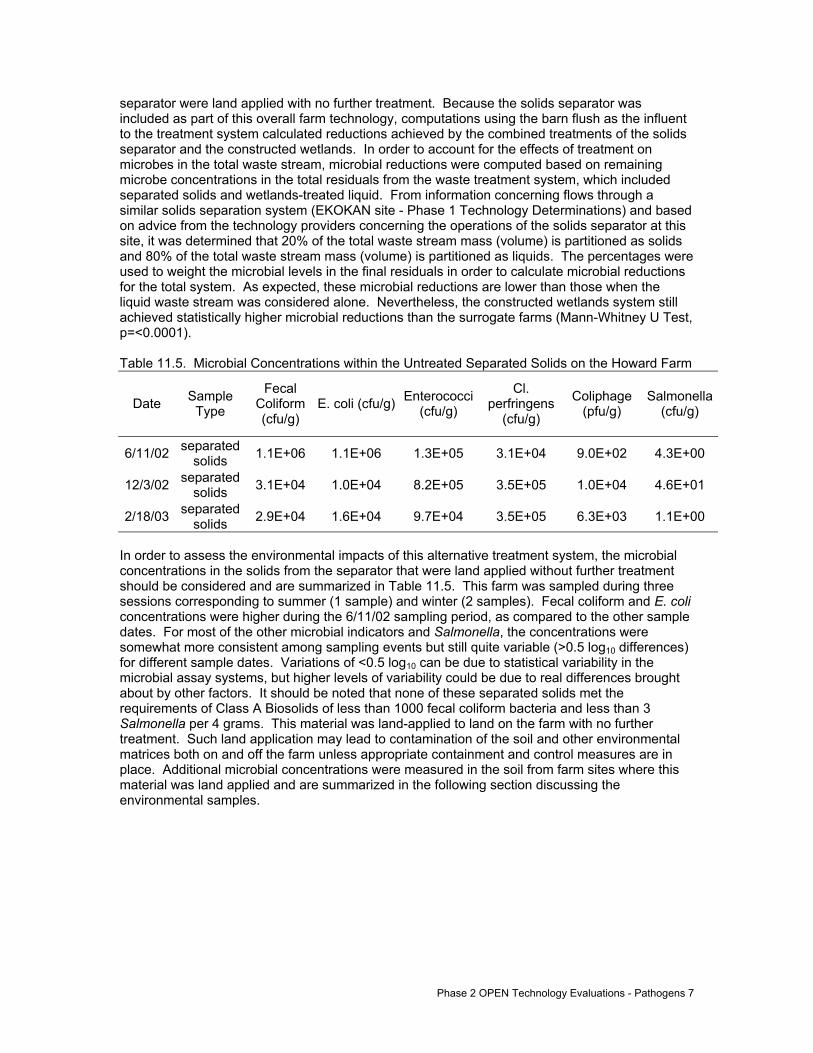
separator were land applied with no further treatment. Because the solids separator was included as part of this overall farm technology, computations using the barn flush as the influent to the treatment system calculated reductions achieved by the combined treatments of the solids separator and the constructed wetlands. In order to account for the effects of treatment on microbes in the total waste stream, microbial reductions were computed based on remaining microbe concentrations in the total residuals from the waste treatment system, which included separated solids and wetlands-treated liquid. From information concerning flows through a similar solids separation system (EKOKAN site - Phase 1 Technology Determinations) and based on advice from the technology providers concerning the operations of the solids separator at this site, it was determined that 20% of the total waste stream mass (volume) is partitioned as solids and 80% of the total waste stream mass (volume) is partitioned as liquids. The percentages were used to weight the microbial levels in the final residuals in order to calculate microbial reductions for the total system. As expected, these microbial reductions are lower than those when the liquid waste stream was considered alone. Nevertheless, the constructed wetlands system still achieved statistically higher microbial reductions than the surrogate farms (Mann-Whitney U Test, p=<0.0001). Table 11.5. Microbial Concentrations within the Untreated Separated Solids on the Howard Farm
Date Sample Type
Fecal Coliform (cfu/g)
E. coli (cfu/g) Enterococci (cfu/g)
Cl. perfringens
(cfu/g)
Coliphage (pfu/g)
Salmonella (cfu/g)
6/11/02 separated solids 1.1E+06 1.1E+06 1.3E+05 3.1E+04 9.0E+02 4.3E+00
12/3/02 separated solids 3.1E+04 1.0E+04 8.2E+05 3.5E+05 1.0E+04 4.6E+01
2/18/03 separated solids 2.9E+04 1.6E+04 9.7E+04 3.5E+05 6.3E+03 1.1E+00
In order to assess the environmental impacts of this alternative treatment system, the microbial concentrations in the solids from the separator that were land applied without further treatment should be considered and are summarized in Table 11.5. This farm was sampled during three sessions corresponding to summer (1 sample) and winter (2 samples). Fecal coliform and E. coli concentrations were higher during the 6/11/02 sampling period, as compared to the other sample dates. For most of the other microbial indicators and Salmonella, the concentrations were somewhat more consistent among sampling events but still quite variable (>0.5 log10 differences) for different sample dates. Variations of <0.5 log10 can be due to statistical variability in the microbial assay systems, but higher levels of variability could be due to real differences brought about by other factors. It should be noted that none of these separated solids met the requirements of Class A Biosolids of less than 1000 fecal coliform bacteria and less than 3 Salmonella per 4 grams. This material was land-applied to land on the farm with no further treatment. Such land application may lead to contamination of the soil and other environmental matrices both on and off the farm unless appropriate containment and control measures are in place. Additional microbial concentrations were measured in the soil from farm sites where this material was land applied and are summarized in the following section discussing the environmental samples.
Phase 2 OPEN Technology Evaluations - Pathogens 7
Environmental Samples Table 11.6. Measured Microbial Concentrations from Environmental Soils of Land Application
Sites on the Howard Farm
Farm Date Sample (waste
residual)
Fecal Coliform (cfu/g)
E. coli (cfu/g)
Entero- cocci (cfu/g)
Cl. perf. (cfu/g)
Coli- phage (pfu/g)
Sal- monella (cfu/g)
1/28/03 Soil (liquid) > 2.3E+04 5.2E+02 > 2.2E+04 2.2E+04 4.4E+03 1.5E-01
Soil (liquid) 2.3E+06 9.5E+02 4.9E+03 4.7E+04 1.0E+04 < 3.0E-
02
Surro- gate
Farm 2 7/28/03 background
soil 1.6E+06 <9.5E+02 2.7E+04 2.2E+04 2.2E+02 <3.0E-02
6/11/02 Soil (solid) 3.3E+04 3.3E+04 3.3E+05 < 1.8E+01 < 4.5E-01 9.3E-02
Soil (solid) 1.0E+04 7.0E+02 6.0E+04 3.5E+01 4.1E+03 3.6E-03
Howard Farm (Con-
structed Wetlands)
12/10/02
Soil (liquid) 9.5E+03 2.6E+02 5.3E+04 2.4E+02 8.7E+02 9.2E-03
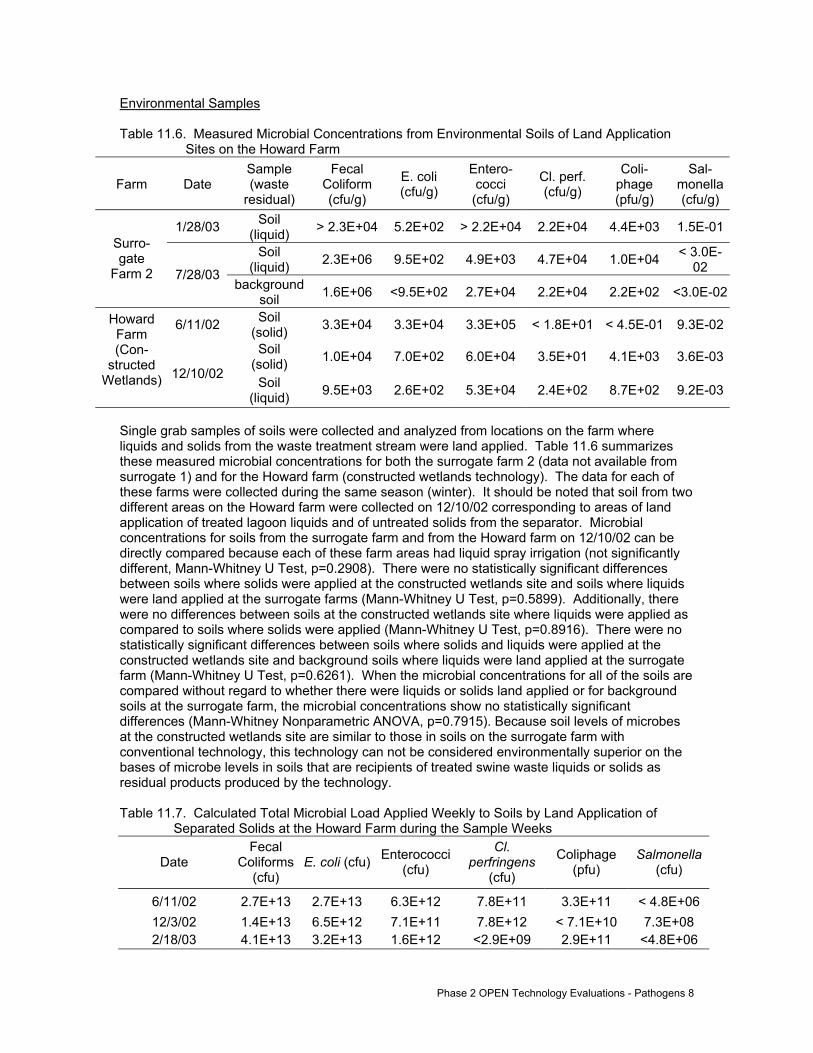
Single grab samples of soils were collected and analyzed from locations on the farm where liquids and solids from the waste treatment stream were land applied. Table 11.6 summarizes these measured microbial concentrations for both the surrogate farm 2 (data not available from surrogate 1) and for the Howard farm (constructed wetlands technology). The data for each of these farms were collected during the same season (winter). It should be noted that soil from two different areas on the Howard farm were collected on 12/10/02 corresponding to areas of land application of treated lagoon liquids and of untreated solids from the separator. Microbial concentrations for soils from the surrogate farm and from the Howard farm on 12/10/02 can be directly compared because each of these farm areas had liquid spray irrigation (not significantly different, Mann-Whitney U Test, p=0.2908). There were no statistically significant differences between soils where solids were applied at the constructed wetlands site and soils where liquids were land applied at the surrogate farms (Mann-Whitney U Test, p=0.5899). Additionally, there were no differences between soils at the constructed wetlands site where liquids were applied as compared to soils where solids were applied (Mann-Whitney U Test, p=0.8916). There were no statistically significant differences between soils where solids and liquids were applied at the constructed wetlands site and background soils where liquids were land applied at the surrogate farm (Mann-Whitney U Test, p=0.6261). When the microbial concentrations for all of the soils are compared without regard to whether there were liquids or solids land applied or for background soils at the surrogate farm, the microbial concentrations show no statistically significant differences (Mann-Whitney Nonparametric ANOVA, p=0.7915). Because soil levels of microbes at the constructed wetlands site are similar to those in soils on the surrogate farm with conventional technology, this technology can not be considered environmentally superior on the bases of microbe levels in soils that are recipients of treated swine waste liquids or solids as residual products produced by the technology. Table 11.7. Calculated Total Microbial Load Applied Weekly to Soils by Land Application of
Separated Solids at the Howard Farm during the Sample Weeks
Date Fecal
Coliforms (cfu)
E. coli (cfu) Enterococci (cfu)
Cl. perfringens
(cfu)
Coliphage (pfu)
Salmonella (cfu)
6/11/02 2.7E+13 2.7E+13 6.3E+12 7.8E+11 3.3E+11 < 4.8E+06 12/3/02 1.4E+13 6.5E+12 7.1E+11 7.8E+12 < 7.1E+10 7.3E+08 2/18/03 4.1E+13 3.2E+13 1.6E+12 <2.9E+09 2.9E+11 <4.8E+06
Phase 2 OPEN Technology Evaluations - Pathogens 8
In order to access the potential microbial load to the soil on this farm from the land application of untreated solids, the microbial concentrations and the volumes of solids that were land applied were used to calculate the total microbial load that was applied to soils on the farm (Table 11.7). For the Howard Farm, land application practices generally occurred twice weekly during sample weeks. From Table 11.7, it is apparent that high concentrations of indicator microorganisms and Salmonella are land applied at this farm as a result of land application of untreated solids from the separator. Table 11.8. Microbial Concentrations in Environmental Groundwater Samples Analyzed from
Observation Wells on the Howard Farm
Date Sample
(Ground- water)
Fecal Coliforms
(cfu/100mL)
E. coli (cfu/100mL)
Enterococci (cfu/100mL)
Cl. perfringens (cfu/100mL)
Coliphage (pfu/100mL)
Salmonella (cfu/100mL)
1 2.0E+00 1.0E+00 1.6E+01 5.0E+00 < 1.0E+00 < 9.0E-01 2 1.8E+01 1.6E+01 1.0E+00 5.0E-01 4.0E+00 < 9.0E-01 3 1.6E+01 1.6E+01 8.4E+00 5.0E-01 1.0E+00 < 9.0E-01 4 4.1E+00 4.1E+00 5.4E+01 2.4E+01 2.0E+00 < 9.0E-01
6/25/02
5 1.0E+00 1.0E+00 3.9E+01 2.0E+01 5.0E+00 < 9.0E-01 1 < 1.0E+00 < 1.0E+00 3.9E+01 2.7E+00 2.0E+00 < 3.0E-01 2 2.0E+00 < 1.0E+00 2.0E+00 4.1E+00 < 1.0E+00 < 3.0E-01 3 3.1E+00 < 1.0E+00 5.2E+00 9.0E-01 < 1.0E+00 < 3.0E-01 4 1.0E+00 < 1.0E+00 5.1E+00 1.4E+00 3.0E+00 < 3.0E-01
12/10/02
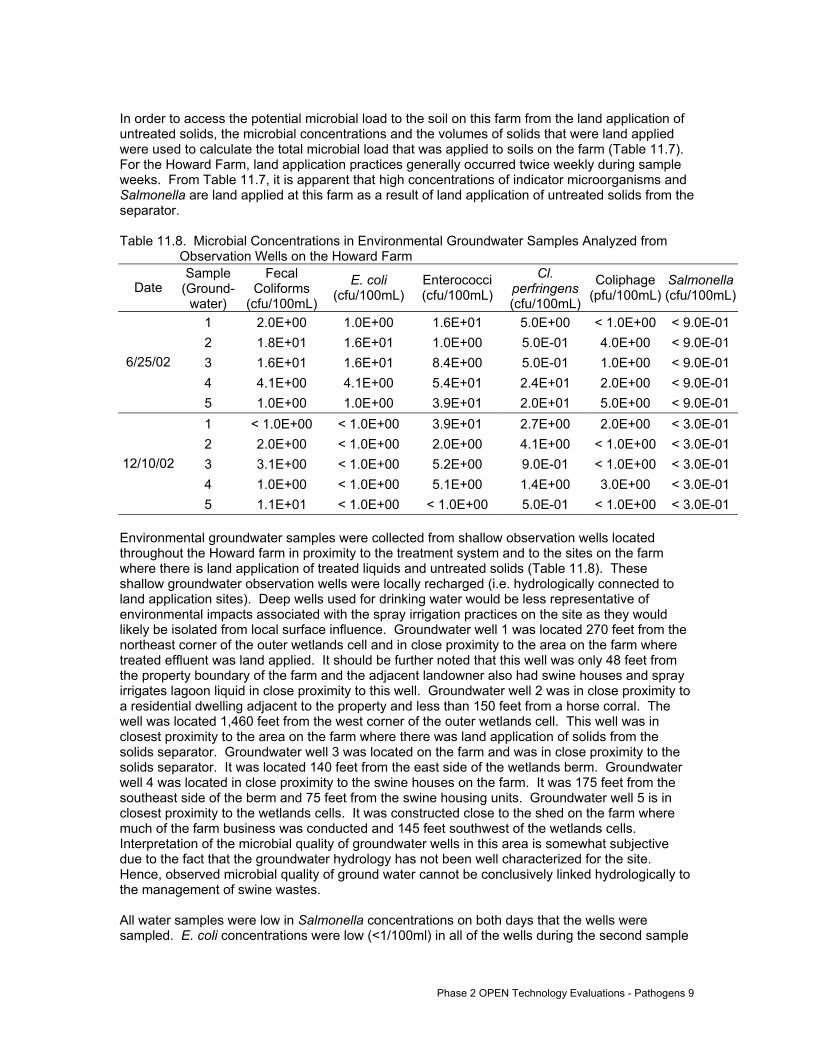
5 1.1E+01 < 1.0E+00 < 1.0E+00 5.0E-01 < 1.0E+00 < 3.0E-01 Environmental groundwater samples were collected from shallow observation wells located throughout the Howard farm in proximity to the treatment system and to the sites on the farm where there is land application of treated liquids and untreated solids (Table 11.8). These shallow groundwater observation wells were locally recharged (i.e. hydrologically connected to land application sites). Deep wells used for drinking water would be less representative of environmental impacts associated with the spray irrigation practices on the site as they would likely be isolated from local surface influence. Groundwater well 1 was located 270 feet from the northeast corner of the outer wetlands cell and in close proximity to the area on the farm where treated effluent was land applied. It should be further noted that this well was only 48 feet from the property boundary of the farm and the adjacent landowner also had swine houses and spray irrigates lagoon liquid in close proximity to this well. Groundwater well 2 was in close proximity to a residential dwelling adjacent to the property and less than 150 feet from a horse corral. The well was located 1,460 feet from the west corner of the outer wetlands cell. This well was in closest proximity to the area on the farm where there was land application of solids from the solids separator. Groundwater well 3 was located on the farm and was in close proximity to the solids separator. It was located 140 feet from the east side of the wetlands berm. Groundwater well 4 was located in close proximity to the swine houses on the farm. It was 175 feet from the southeast side of the berm and 75 feet from the swine housing units. Groundwater well 5 is in closest proximity to the wetlands cells. It was constructed close to the shed on the farm where much of the farm business was conducted and 145 feet southwest of the wetlands cells. Interpretation of the microbial quality of groundwater wells in this area is somewhat subjective due to the fact that the groundwater hydrology has not been well characterized for the site. Hence, observed microbial quality of ground water cannot be conclusively linked hydrologically to the management of swine wastes. All water samples were low in Salmonella concentrations on both days that the wells were sampled. E. coli concentrations were low (<1/100ml) in all of the wells during the second sample
Phase 2 OPEN Technology Evaluations - Pathogens 9

date. Higher concentrations of enterococci were detected in groundwater well 1 on both sample days, showing potential impacts from both the Howard farm, as well as the adjacent property with spray field irrigation and possibly other sources. On the first date sampled, there were higher concentrations of fecal coliform bacteria and E. coli in ground waters taken from wells 2 and 3. The microbial impacts detected in well 2 could possibly have come from the adjacent residential dwelling (unknown if this rural dwelling used on-sight waste water treatment), leachates from the horse corral, or possibly from the land application of solids on the farm. Microbial impacts observed at the groundwater 3 site would most likely have been from the wetlands or solids separator on the farm. However, other possible sources of microbial contamination of well 3 cannot be ruled out. Groundwater well 4 showed higher enterococci concentrations during the first sample date, and was the highest recorded concentrations for any of these samples. This well was constructed in close proximity to the barns, which may have led to these groundwater impacts on microbial quality for enterococci. Because low levels of fecal indicator microbes were found in all groundwater wells tested, it was possible that there were microbial impacts of the treatment technology on the quality of shallow groundwater. However, other sources of microbial impacts on groundwater quality cannot be ruled out. These ground waters would be considered unsuitable as for use as drinking water without further treatment because they contained fecal indicator bacteria. On-farm Air Samples Bacteria and Fungi in Air. As shown in Figure 11.2(a), concentrations of total bacteria in air on the Howard farm were higher than the concentrations on the surrogate farms (Mann-Whitney U-test, p=<0.0001). The concentrations of total bacteria were generally in the range of 3 to 4 log10 per cubic meter at the surrogate sites with generally higher concentrations detected at the Howard farm. Figure 11.2. The concentrations of airborne total bacteria and fungi in surrogate farms and the Howard Farm with the constructed wetland technology (UB: upper boundary; LB: lower boundary;
B: exhaust fan or near barn; L: lagoon or wetland; T: technology)
23
45
6
UB LB B L UB LB B L UB LB B L T
surrogate1 surrogate2 Howard
log1
0 (T
otal
Bac
teria
)
Graphs by Farm
a. Total Bacteria
Phase 2 OPEN Technology Evaluations - Pathogens 10

As shown in Figure 11.2(b), the levels of fungi in air tended to be generally similar on both the surrogate farms and the Howard farm. Concentrations were generally in the range of 3 log10 per
cubic meter.
ecal Indicator Bacteria in Air.
01
23
45
UB LB B L UB LB B L UB LB B L T
surrogate1 surrogate2 Howardlo
g10
(Tot
al F
ungi
)
Graphs by Farm
b. Total Fungi
F As shown by the results in Tables 11.9 to 11.11, the frequencies
of
able 11.9. The percentage of positive samples of Clostridium perfringens spores measured at d
Surrogate Farm 2 Constructed
of positive samples for fecal indicator bacteria and total coliphage were similar for the Howard farm and the two surrogate farms. For the surrogate farms and the Howard farm, the numbers positive samples for Cl. perfringens spores, total coliphages, and E. coli were generally very low or zero at the upper boundaries and higher at the lower boundaries. For each of the indicators, the number of positive results was highest at or near the barns and then next highest around thelagoons. These results indicate that the constructed wetlands technology contributed similar measurable fecal indicator bacteria to the air on the farm, as did the waste management technology of the surrogate farms. T
different sampling sites on the Surrogate Farm1, Surrogate Farm 2, and the ConstructeWetlands at the Howard Farm
Site Surrogate Farm 1 Wetlands boun 0 0 0
Lower boundary 0 29% 43%
50% 56% 75%
T
Exhaust fans or near barn Lagoon 13% 13% 25%
echnology n/a1 n/a 78% applicable
Upper dary
1 not
able 11.10. The percentage of positive samples of total coliphage measured at different
Surrogate Farm 2 Constructed
T
sampling sites on the Surrogate Farm1, Surrogate Farm 2, and the Constructed Wetlands at the Howard Farm
Site Surrogate Farm 1 Wetlands r boun 0 13% 0
Lower boundary 0 21% 0 Exhaust fans or
near barn Lagoon
13% 33% 38%
0 13% 13%
Uppe dary
Phase 2 OPEN Technology Evaluations - Pathogens 11
T y n n/a echnolog /a1 56% applicable 1 not
able 11.11. The percentage of positive samples of fecal coliform bacteria (E. coli) measured at
Surrogate Farm 2 Constructed
T
different sampling sites on the Surrogate Farm1, Surrogate Farm 2, and the ConstructedWetlands at the Howard Farm
Site Surrogate Farm 1 Wetlands r boun 6% (0) 0 0
Lower boundary 0 0 29% (0)
13% (0) 5
T y n
Exhaust fans or near barn Lagoon
0 0% (50%)
13% (0) 0 0 echnolog n/a1 /a 0
applicable
Uppe dary
1 not
he levels of endotoxins at farm sample sites are summarized in Table 11.12. Although the f
er
able 11.12. The levels of endotoxins from airborne dust at sampling sites Summary
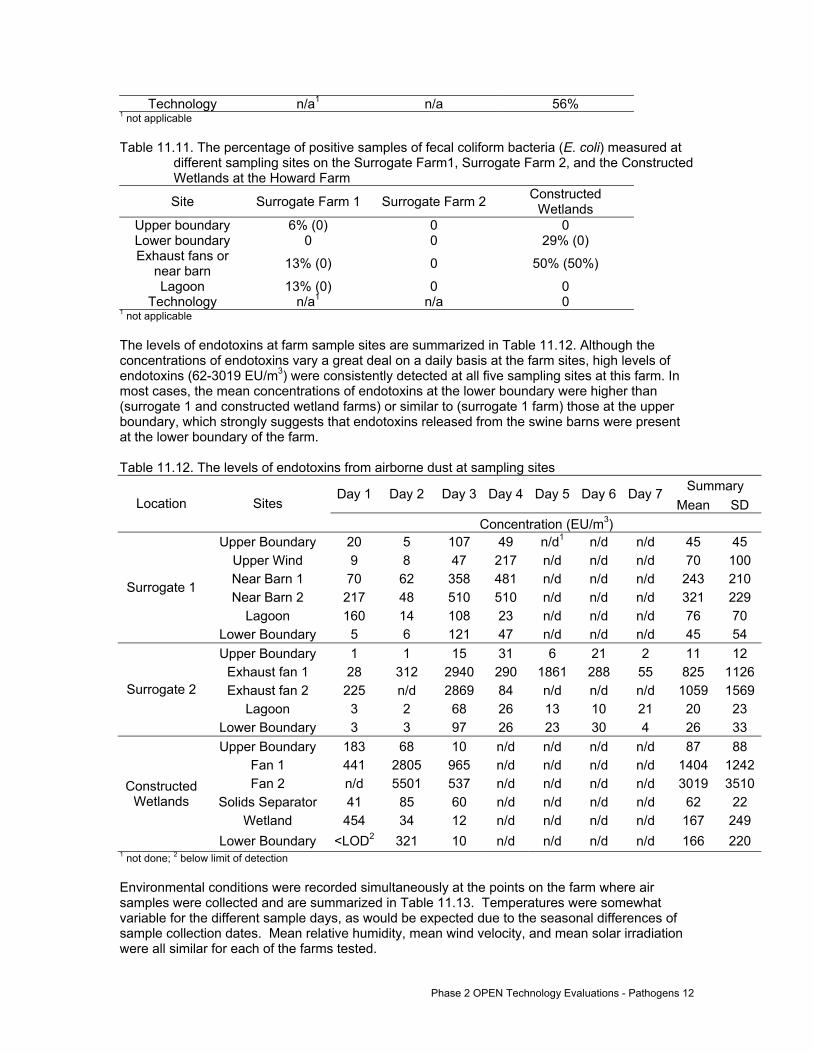
Tconcentrations of endotoxins vary a great deal on a daily basis at the farm sites, high levels oendotoxins (62-3019 EU/m3) were consistently detected at all five sampling sites at this farm. Inmost cases, the mean concentrations of endotoxins at the lower boundary were higher than (surrogate 1 and constructed wetland farms) or similar to (surrogate 1 farm) those at the uppboundary, which strongly suggests that endotoxins released from the swine barns were presentat the lower boundary of the farm. T
Day 1 Day 2 Day 3 Day 4 Day 5 Day 6 Day 7Mean SD Location Sites
Concentration (EU/m ) 3
49 n/d1 n/d Upper Wind 9 8 47 217 n/d n/d n/d 70 100 Near Barn 1 70 62 358 481 n/d n/d n/d 243 210 Near Barn 2 217 48 510 510 n/d n/d n/d 321 229
Lagoon 160 14 108 23 n/d n/d n/d 76 70
Surrogate 1
Low ary er Bound 5 6 121 47 n/d n/d n/d 45 54 Upper Boundary 1 1 15 31 6 21 2 11 12
Exhaust fan 1 28 312 2940 1861 1126Surrogate 2
Low ary 183 n/d
290 288 55 825 Exhaust fan 2 225 n/d 2869 84 n/d n/d n/d 1059 1569
Lagoon 3 2 68 26 13 10 21 20 23 er Bound 3 3 97 26 23 30 4 26 33
Upper Boundary 68 10 n/d n/d n/d 87 88 Fan 1 441 2805 1 1242
Solids ator Constructed
Low ry <
965 n/d n/d n/d n/d 404Fan 2 n/d 5501 537 n/d n/d n/d n/d 3019 3510
Separ 41 85 60 n/d n/d n/d n/d 62 22 Wetland 454 34 12 n/d n/d n/d n/d 167 249
Wetlands
er Bounda LOD2 321 10 n/d n/d n/d n/d 166 220 mit of detection
Upper Boundary 20 5 107 n/d 45 45
1 not done; 2 below li
nvironmental conditions were recorded simultaneously at the points on the farm where air
f
were all similar for each of the farms tested.
Esamples were collected and are summarized in Table 11.13. Temperatures were somewhatvariable for the different sample days, as would be expected due to the seasonal differences osample collection dates. Mean relative humidity, mean wind velocity, and mean solar irradiation
Phase 2 OPEN Technology Evaluations - Pathogens 12
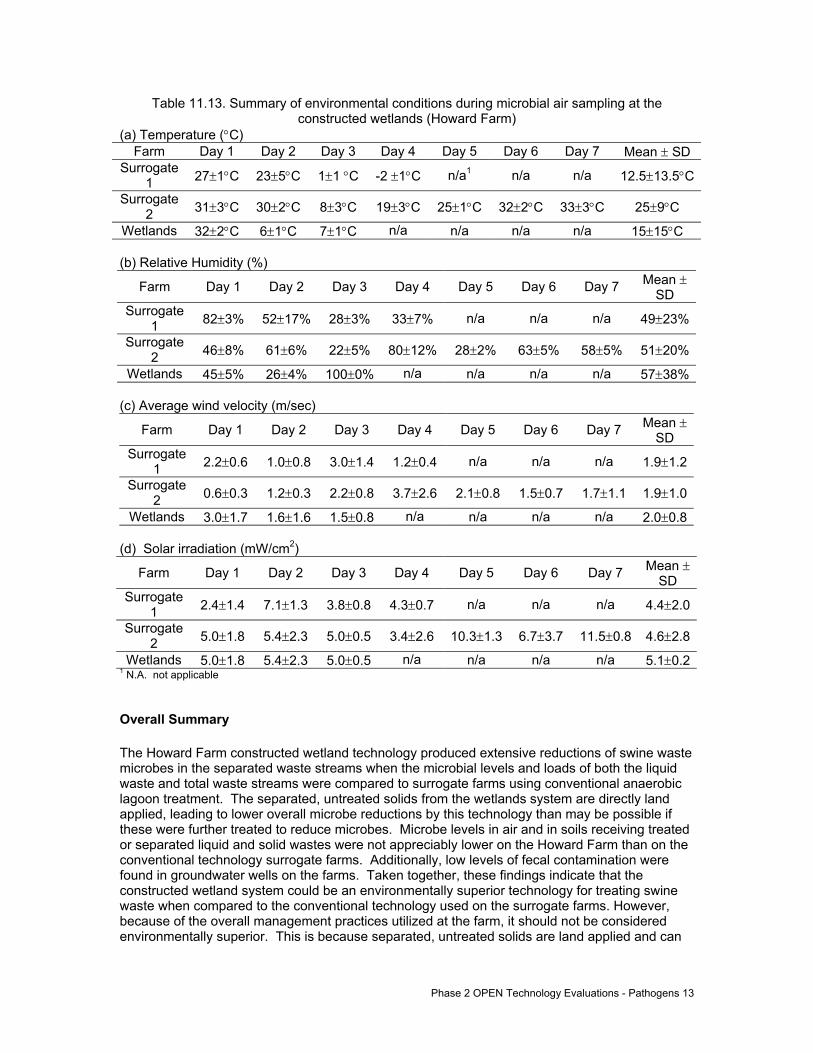
Table 11.13. Summary of environmental conditions during microbial air sampling at the constructed wetlands (Howard Farm)
(a) T
(%
( w it
(d diation (mW
1 N.A. not applic
verall Summary
onstructed wetland technology produced extensive reductions of swine waste icrobes in the separated waste streams when the microbial levels and loads of both the liquid
e
er,
Farm Day 1 Day 2 6 Day 7 Mean ± SD emperature (°C)
Day 3 Day 4 Day 5 Day
(b) Relative Humidity )
1 27±1°C 2 - 1 3±5°C 1±1 °C 2 ±1°C n/a n/a n/a 12.5±13.5°C
Surrogate 2 31±3°C 30±2°C 8±3°C 19±3°C 2 C 32 33 5±1° ±2°C ±3°C 25±9°C
Wetlands 32±2°C 6±1°C 7±1°C n/a n/a n/a n/a 15±15°C
Surrogate
Farm Day 1 Day
c) Average ind veloc y (m/sec)
urrogat1 82±3% 2±17% 28±3% 33±7% n/a n/a n/a 49±23%
Surrogate 2 46±8% 61±6% 22±5% 80±12% 2 6 5 8±2% 3±5% 8±5% 51±20%
Wetlands 45±5% 26±4% 100±0% n/a n/a n/a n/a 57±38%
2 Day 3 Day 4 Day 5 Day 6 Day 7 Mean ± SD
S e 5
Farm Day 1 Day 2
) Solar irra /cm2)
rrogat1 .2±0.6 .0±0.8 .0±1.4 1.2±0.4 n/a n/a n/a 1.9±1.2
Surrogate 2 0.6±0.3 1.2±0.3 2.2±0.8 3.7±2.6 2. 1. 1. 1 1±0.8 5±0.7 7±1. 1.9±1.0
Wetlands 3.0±1.7 1.6±1.6 1.5±0.8 n/a n/a n/a n/a 2.0±0.8
Day 3 Day 4 Day 5 Day 6 Day 7 Mean ± SD
Su e 2 1 3
Farm Day 1 Day 2
able
urrogat1 .4±1.4 7.1±1.3 .8±0.8 .3±0.7 n/a n/a n/a 4.4±2.0
Surrogate 2 5.0±1.8 5.4±2.3 5.0±0.5 3.4±2.6 10 .3 6. 11 8 .3±1 7±3.7 .5±0. 4.6±2.8
Wetlands 5.0±1.8 5.4±2.3 5.0±0.5 n/a n/a n/a n/a 5.1±0.2
Day 3 Day 4 Day 5 Day 6 Day 7 Mean ± SD
S e 2 3 4
O The Howard Farm cmwaste and total waste streams were compared to surrogate farms using conventional anaerobic lagoon treatment. The separated, untreated solids from the wetlands system are directly land applied, leading to lower overall microbe reductions by this technology than may be possible if these were further treated to reduce microbes. Microbe levels in air and in soils receiving treated or separated liquid and solid wastes were not appreciably lower on the Howard Farm than on thconventional technology surrogate farms. Additionally, low levels of fecal contamination were found in groundwater wells on the farms. Taken together, these findings indicate that the constructed wetland system could be an environmentally superior technology for treating swinewaste when compared to the conventional technology used on the surrogate farms. Howevbecause of the overall management practices utilized at the farm, it should not be considered environmentally superior. This is because separated, untreated solids are land applied and can
Phase 2 OPEN Technology Evaluations - Pathogens 13

contribute considerable microbial loads to the environment, just as do land applied lagoon wastes. If the untreated solids were either further treated or disposed of in a manner that would better contain them and thereby be more environmentally protective, this system may be considered superior to the conventional technology.
Phase 2 OPEN Technology Evaluations - Pathogens 14
12. Evaluation of ISSUES Technology at the Vestal Farm for Pathogens Project OPEN Science Team for Pathogens
Alternative Technology: Mesophilic Anaerobic Digester with methane recovery and power generation, Aerobic Digester, water reuse Location: one of three commercial swine production facilities, owned by Murphy-Brown Farms, in Duplin County, North Carolina Period of Operation: The evaluation dates are:
1st field experiment: 03/08/2004 (air and liquid/solid waste stream) 2nd field experiment: 08/02/2004 (air and liquid/solid waste stream) 3rd field experiment: 08/09/2004 (air only)
Technology Suppliers: Prince Dugba, Ph.D. (Smithfield Foods, 910-296-0795), Robert Hoffland – microturbine (Hoffland Environmental, 409-856-4515), Katie Elmer and Dave Elkins (Murphy Brown, LLC, 910-293-3434) NCSU Representative PI: Leonard S. Bull (919-515-6836) Statement of Task:
- Measurement of microbial indicator and pathogen concentrations at key points throughout the waste treatment stream of the technology
- Measurement of airborne microbial indicator and pathogen concentrations at selected sites on the farm in close proximity to the treatment system and at the upper and lower property boundaries
- Measurement of microbial indicator and pathogen concentrations within soils from sites where treated waste water was applied, as well as background soil where spray irrigation did not occur (did not spray irrigate during sample periods)
- Microbial measurements were made during two sessions corresponding to a warm and cold season.
- Microbial parameters measured for the waste stream: fecal indicators (fecal coliforms, E. coli, enterococci, spores of Clostridium perfringens, and total coliphages) and the bacterial pathogen Salmonella
- Microbial parameters measured in the air samples: total bacteria, total fungi, bacterial endotoxins, fecal indicators (fecal coliforms, E. coli, spores of Clostridium perfringens, and total coliphages) and the bacterial pathogen Salmonella
- Environmental conditions measured at sample points as air samples were collected: temperature, wind direction and speed, relative humidity, solar irradiance
Measurement of Pathogens: Treatment Technology The Vestal farm was a finishing operation permitted for 9,792 head at steady state. There were 8 barns on the farm, with the main source of pathogens being the fecal wastes from them. The barns had a flush style waster removal system and were naturally ventilated. Waste material was flushed daily to an equalization tank and then to a clarifier, used for solids thickening. Liquids from this clarifier entered a storage basin and the thickened solids were pumped to a mesophilic, anaerobic digester. Liquids from the digester were moved to the same storage basin as the liquids from the clarifier. The liquids from the storage basin were then treated in an aerobic digester and a portion of this material was used to refill the flush tanks at the barns. The other portion of this treated material was further treated in a water reuse system and used for drinking water for the pigs on the farm. During the first evaluation, this water reuse system was
Phase 2 OPEN Technology Evaluations - Pathogens 15

not operational. It should also be noted that land application of liquids from the storage basin occurred as permitted. Microbiological Samples Single grab samples were collected from points within the waste treatment streams to assess the microbial concentrations associated with the technology. Microbial concentrations were quantitatively determined in the waste stream for fecal indicators (fecal coliforms, E. coli, enterococci, spores of Clostridium perfringens, and total coliphages) and the bacterial pathogen, Salmonella. Microbiological assays were performed according to protocols outlined in the Quality Assurance Project Plan (QAPP) prepared by the Pathogens group of the OPEN team. Briefly, fecal coliform, E. coli, and enterococci bacteria were assayed using commercial, quantitative (quantal), biochemically-based microbial culture assay systems and other microbial indicators were assayed using standard quantitative microbial assay methods. Salmonella was assayed using an accepted most-probable number culture assay method based on published literature. Air samples for microbial analysis were collected at sites throughout the farm. Airborne microbial concentrations were measured for total (aerobic/heterotrophic) bacteria, total (aerobic/heterotrophic) fungi, spores of C. perfringens, fecal coliforms, E. coli, and Salmonella. Microbiological air sampling was performed using AGI-30 all-glass impingers with sampling at 12.5 LPM for 30 minutes per sample. Each microorganism was analyzed by culture methods described in the QAPP document from the OPEN team. In addition to culturable airborne microorganisms, airborne endotoxins were collected using personal SKC air samplers at approximately 4 LPM for 4 hours. Samples were analyzed by the Limulus amebocyte lysate (LAL) test. Environmental conditions, including temperature, relative humidity (RH), wind velocity, and solar irradiation, were measured and recorded at specific locations and times when microbial air samples were collected. These microbial measurements took place according to the following schedule: Table 12.1. Pathogen Measurement Schedule and Sample Locations at Vestal Farm Date Samples
Collected Air Samples Analyzed Waste Stream Samples Analyzed Environmental Samples Analyzed
3/8/2004 UB, LB, C, B, T FF, BF, CS, CL, EM, SB, IWR, EWR --
8/2/2004 UB, LB, C, B, T FF, BF, DS, CL, EM, SB, IWR, EWR --
8/9/2004 UB, LB, C, B, T -- --
UB=upper (upwind) boundary; LB=lower (downwind) boundary; B=barn; L=lagoon; T=technology; FF=fresh feces; BF=barn flush; CS=clarifier solids; CL=clarifier liquids; EM=effluent from mesophilic digester; SB=settling basin; IWR=influent to water reuse; EWR=effluent to water reuse; DS=digested solids (different sample for second round, replaced CS)
Phase 2 OPEN Technology Evaluations - Pathogens 16
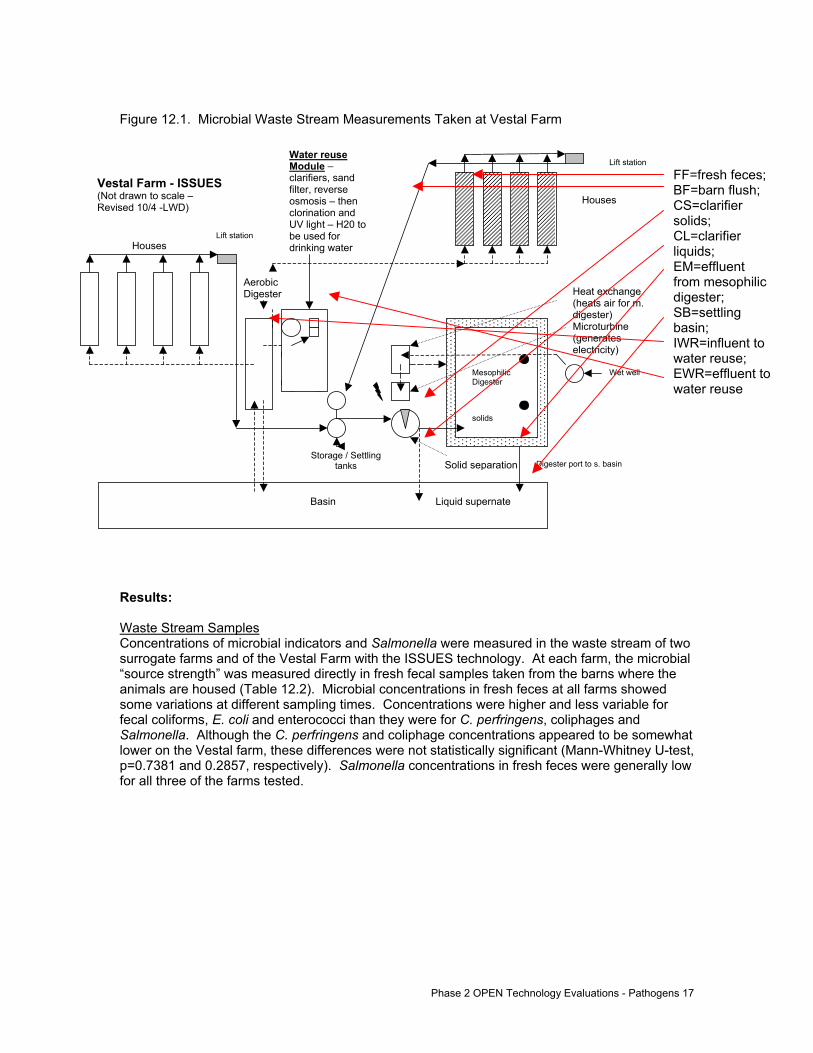
Figure 12.1. Microbial Waste Stream Measurements Taken at Vestal Farm
Basin
Mesophilic Digester
Wet well
Aerobic Digester
Water reuse Module – clarifiers, sand filter, reverse osmosis – then clorination and UV light – H20 tobe used for drinking water
Heat exchange (heats air for m. digester) Microturbine (generates electricity)
Storage / Settling tanks Solid separation
Liquid supernate
solids
Houses
Houses
Vestal Farm - ISSUES (Not drawn to scale – Revised 10/4 -LWD)
Lift station
Lift station
Digester port to s. basin
FF=fresh feces; BF=barn flush; CS=clarifier solids; CL=clarifier liquids; EM=effluent from mesophilic digester; SB=settling basin; IWR=influent to water reuse; EWR=effluent to water reuse
Results: Waste Stream Samples Concentrations of microbial indicators and Salmonella were measured in the waste stream of two surrogate farms and of the Vestal Farm with the ISSUES technology. At each farm, the microbial “source strength” was measured directly in fresh fecal samples taken from the barns where the animals are housed (Table 12.2). Microbial concentrations in fresh feces at all farms showed some variations at different sampling times. Concentrations were higher and less variable for fecal coliforms, E. coli and enterococci than they were for C. perfringens, coliphages and Salmonella. Although the C. perfringens and coliphage concentrations appeared to be somewhat lower on the Vestal farm, these differences were not statistically significant (Mann-Whitney U-test, p=0.7381 and 0.2857, respectively). Salmonella concentrations in fresh feces were generally low for all three of the farms tested.
Phase 2 OPEN Technology Evaluations - Pathogens 17
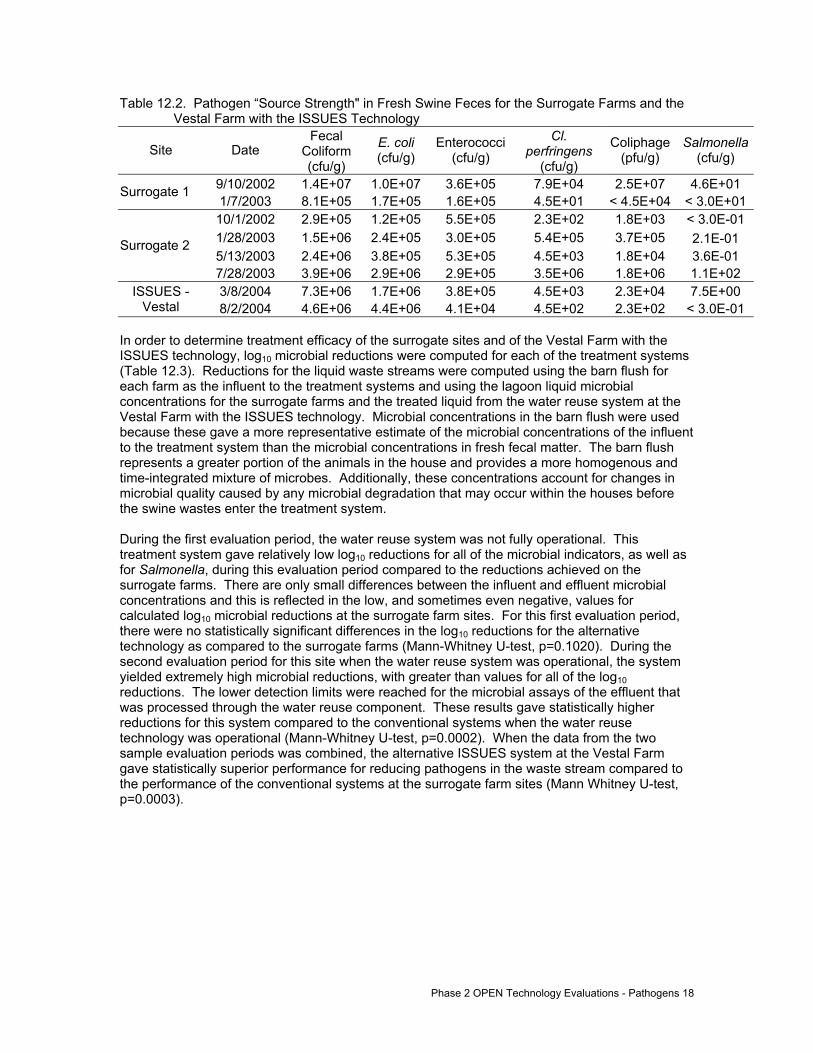
Table 12.2. Pathogen “Source Strength" in Fresh Swine Feces for the Surrogate Farms and the Vestal Farm with the ISSUES Technology
Site Date Fecal
Coliform (cfu/g)
E. coli (cfu/g)
Enterococci (cfu/g)
Cl. perfringens
(cfu/g)
Coliphage (pfu/g)
Salmonella (cfu/g)
9/10/2002 1.4E+07 1.0E+07 3.6E+05 7.9E+04 2.5E+07 4.6E+01 Surrogate 1 1/7/2003 8.1E+05 1.7E+05 1.6E+05 4.5E+01 < 4.5E+04 < 3.0E+01 10/1/2002 2.9E+05 1.2E+05 5.5E+05 2.3E+02 1.8E+03 < 3.0E-01 1/28/2003 1.5E+06 2.4E+05 3.0E+05 5.4E+05 3.7E+05 2.1E-01 5/13/2003 2.4E+06 3.8E+05 5.3E+05 4.5E+03 1.8E+04 3.6E-01
Surrogate 2
7/28/2003 3.9E+06 2.9E+06 2.9E+05 3.5E+06 1.8E+06 1.1E+02 3/8/2004 7.3E+06 1.7E+06 3.8E+05 4.5E+03 2.3E+04 7.5E+00 ISSUES -
Vestal 8/2/2004 4.6E+06 4.4E+06 4.1E+04 4.5E+02 2.3E+02 < 3.0E-01 In order to determine treatment efficacy of the surrogate sites and of the Vestal Farm with the ISSUES technology, log10 microbial reductions were computed for each of the treatment systems (Table 12.3). Reductions for the liquid waste streams were computed using the barn flush for each farm as the influent to the treatment systems and using the lagoon liquid microbial concentrations for the surrogate farms and the treated liquid from the water reuse system at the Vestal Farm with the ISSUES technology. Microbial concentrations in the barn flush were used because these gave a more representative estimate of the microbial concentrations of the influent to the treatment system than the microbial concentrations in fresh fecal matter. The barn flush represents a greater portion of the animals in the house and provides a more homogenous and time-integrated mixture of microbes. Additionally, these concentrations account for changes in microbial quality caused by any microbial degradation that may occur within the houses before the swine wastes enter the treatment system. During the first evaluation period, the water reuse system was not fully operational. This treatment system gave relatively low log10 reductions for all of the microbial indicators, as well as for Salmonella, during this evaluation period compared to the reductions achieved on the surrogate farms. There are only small differences between the influent and effluent microbial concentrations and this is reflected in the low, and sometimes even negative, values for calculated log10 microbial reductions at the surrogate farm sites. For this first evaluation period, there were no statistically significant differences in the log10 reductions for the alternative technology as compared to the surrogate farms (Mann-Whitney U-test, p=0.1020). During the second evaluation period for this site when the water reuse system was operational, the system yielded extremely high microbial reductions, with greater than values for all of the log10 reductions. The lower detection limits were reached for the microbial assays of the effluent that was processed through the water reuse component. These results gave statistically higher reductions for this system compared to the conventional systems when the water reuse technology was operational (Mann-Whitney U-test, p=0.0002). When the data from the two sample evaluation periods was combined, the alternative ISSUES system at the Vestal Farm gave statistically superior performance for reducing pathogens in the waste stream compared to the performance of the conventional systems at the surrogate farm sites (Mann Whitney U-test, p=0.0003).
Phase 2 OPEN Technology Evaluations - Pathogens 18
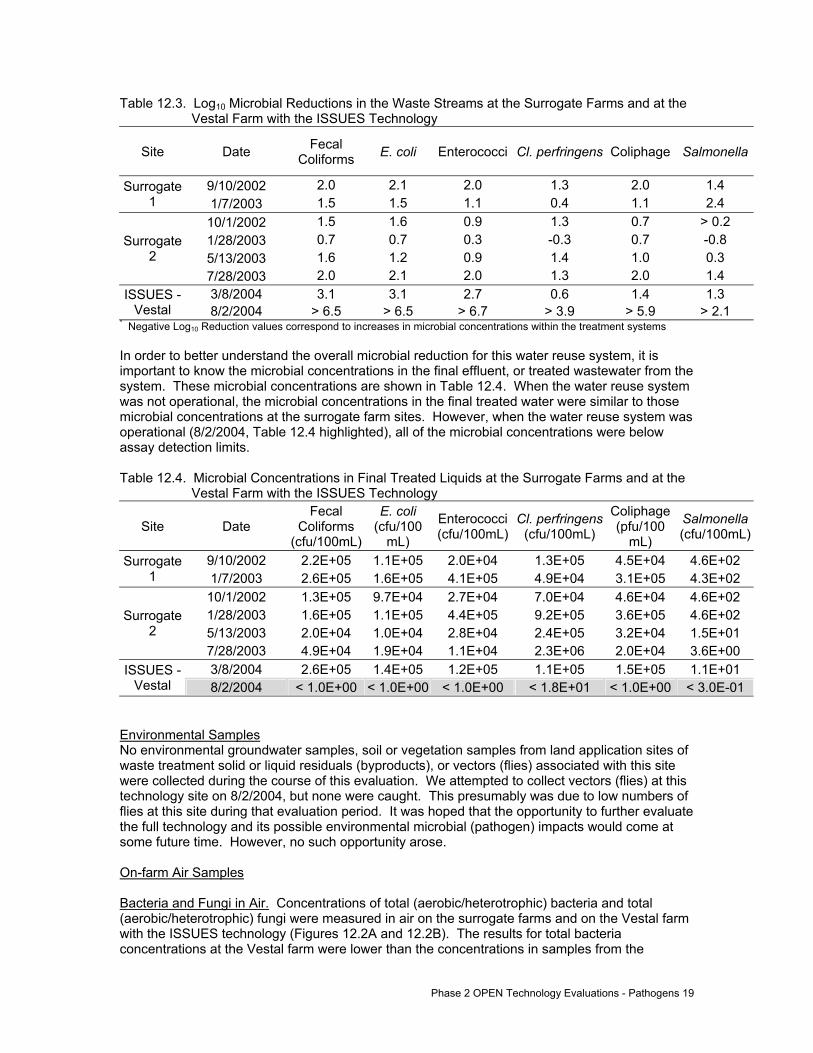
Table 12.3. Log10 Microbial Reductions in the Waste Streams at the Surrogate Farms and at the Vestal Farm with the ISSUES Technology
Site Date Fecal Coliforms E. coli Enterococci Cl. perfringens Coliphage Salmonella
9/10/2002 2.0 2.1 2.0 1.3 2.0 1.4 Surrogate 1 1/7/2003 1.5 1.5 1.1 0.4 1.1 2.4
10/1/2002 1.5 1.6 0.9 1.3 0.7 > 0.2 1/28/2003 0.7 0.7 0.3 -0.3 0.7 -0.8 5/13/2003 1.6 1.2 0.9 1.4 1.0 0.3
Surrogate 2
7/28/2003 2.0 2.1 2.0 1.3 2.0 1.4 3/8/2004 3.1 3.1 2.7 0.6 1.4 1.3 ISSUES -
Vestal 8/2/2004 > 6.5 > 6.5 > 6.7 > 3.9 > 5.9 > 2.1 * Negative Log10 Reduction values correspond to increases in microbial concentrations within the treatment systems In order to better understand the overall microbial reduction for this water reuse system, it is important to know the microbial concentrations in the final effluent, or treated wastewater from the system. These microbial concentrations are shown in Table 12.4. When the water reuse system was not operational, the microbial concentrations in the final treated water were similar to those microbial concentrations at the surrogate farm sites. However, when the water reuse system was operational (8/2/2004, Table 12.4 highlighted), all of the microbial concentrations were below assay detection limits. Table 12.4. Microbial Concentrations in Final Treated Liquids at the Surrogate Farms and at the
Vestal Farm with the ISSUES Technology
Site Date Fecal
Coliforms (cfu/100mL)
E. coli (cfu/100
mL)
Enterococci(cfu/100mL)
Cl. perfringens (cfu/100mL)
Coliphage(pfu/100
mL)
Salmonella(cfu/100mL)
9/10/2002 2.2E+05 1.1E+05 2.0E+04 1.3E+05 4.5E+04 4.6E+02 Surrogate 1 1/7/2003 2.6E+05 1.6E+05 4.1E+05 4.9E+04 3.1E+05 4.3E+02
10/1/2002 1.3E+05 9.7E+04 2.7E+04 7.0E+04 4.6E+04 4.6E+02 1/28/2003 1.6E+05 1.1E+05 4.4E+05 9.2E+05 3.6E+05 4.6E+02 5/13/2003 2.0E+04 1.0E+04 2.8E+04 2.4E+05 3.2E+04 1.5E+01
Surrogate 2
7/28/2003 4.9E+04 1.9E+04 1.1E+04 2.3E+06 2.0E+04 3.6E+00 3/8/2004 2.6E+05 1.4E+05 1.2E+05 1.1E+05 1.5E+05 1.1E+01 ISSUES -
Vestal 8/2/2004 < 1.0E+00 < 1.0E+00 < 1.0E+00 < 1.8E+01 < 1.0E+00 < 3.0E-01 Environmental Samples No environmental groundwater samples, soil or vegetation samples from land application sites of waste treatment solid or liquid residuals (byproducts), or vectors (flies) associated with this site were collected during the course of this evaluation. We attempted to collect vectors (flies) at this technology site on 8/2/2004, but none were caught. This presumably was due to low numbers of flies at this site during that evaluation period. It was hoped that the opportunity to further evaluate the full technology and its possible environmental microbial (pathogen) impacts would come at some future time. However, no such opportunity arose. On-farm Air Samples Bacteria and Fungi in Air. Concentrations of total (aerobic/heterotrophic) bacteria and total (aerobic/heterotrophic) fungi were measured in air on the surrogate farms and on the Vestal farm with the ISSUES technology (Figures 12.2A and 12.2B). The results for total bacteria concentrations at the Vestal farm were lower than the concentrations in samples from the
Phase 2 OPEN Technology Evaluations - Pathogens 19
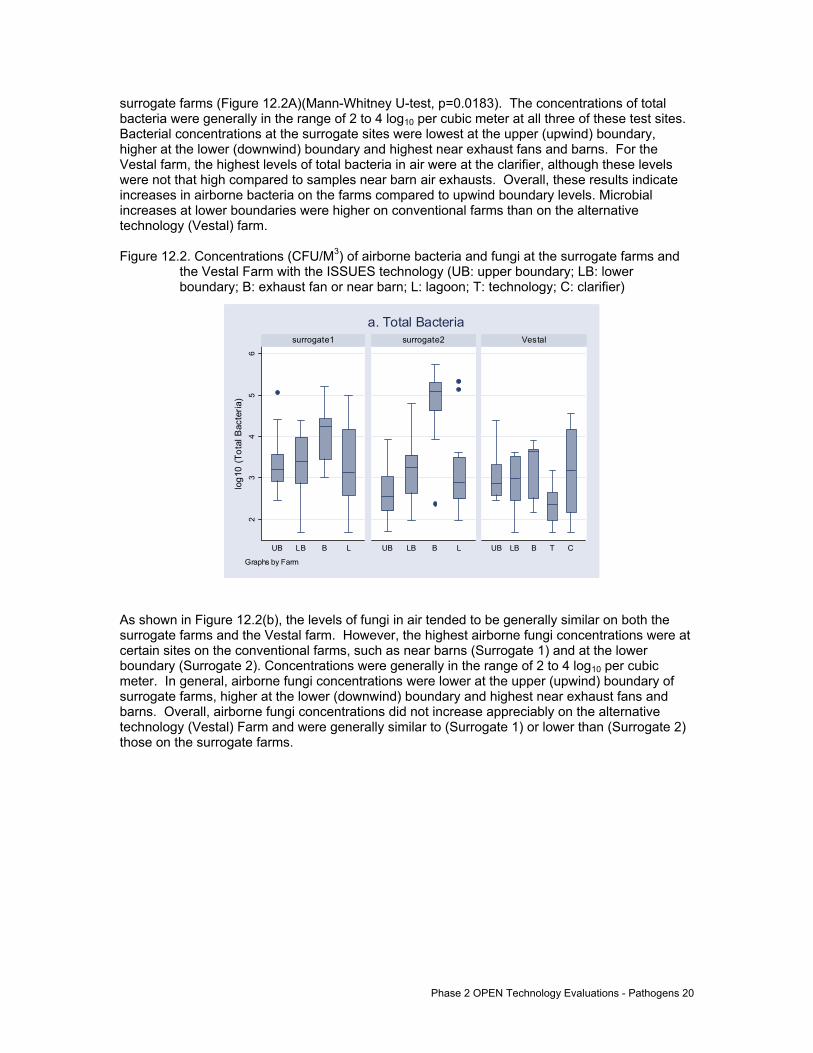
surrogate farms (Figure 12.2A)(Mann-Whitney U-test, p=0.0183). The concentrations of total bacteria were generally in the range of 2 to 4 log10 per cubic meter at all three of these test sites. Bacterial concentrations at the surrogate sites were lowest at the upper (upwind) boundary, higher at the lower (downwind) boundary and highest near exhaust fans and barns. For the Vestal farm, the highest levels of total bacteria in air were at the clarifier, although these levels were not that high compared to samples near barn air exhausts. Overall, these results indicate increases in airborne bacteria on the farms compared to upwind boundary levels. Microbial increases at lower boundaries were higher on conventional farms than on the alternative technology (Vestal) farm. Figure 12.2. Concentrations (CFU/M3) of airborne bacteria and fungi at the surrogate farms and
the Vestal Farm with the ISSUES technology (UB: upper boundary; LB: lower boundary; B: exhaust fan or near barn; L: lagoon; T: technology; C: clarifier)
23
45
6
UB LB B L UB LB B L UB LB B T C
surrogate1 surrogate2 Vestal
log1
0 (T
otal
Bac
teria
)
Graphs by Farm
a. Total Bacteria
As shown in Figure 12.2(b), the levels of fungi in air tended to be generally similar on both the surrogate farms and the Vestal farm. However, the highest airborne fungi concentrations were at certain sites on the conventional farms, such as near barns (Surrogate 1) and at the lower boundary (Surrogate 2). Concentrations were generally in the range of 2 to 4 log10 per cubic meter. In general, airborne fungi concentrations were lower at the upper (upwind) boundary of surrogate farms, higher at the lower (downwind) boundary and highest near exhaust fans and barns. Overall, airborne fungi concentrations did not increase appreciably on the alternative technology (Vestal) Farm and were generally similar to (Surrogate 1) or lower than (Surrogate 2) those on the surrogate farms.
Phase 2 OPEN Technology Evaluations - Pathogens 20

01
23
45
UB LB B L UB LB B L UB LB B T C
surrogate1 surrogate2 Vestal
log1
0 (T
otal
Fun
gi)
Graphs by Farm
b. Total Fungi
Fecal Indicator Bacteria in Air. Air samples were analyzed for fecal indicator organisms and for the pathogen, Salmonella. There were no positive air samples at any of the sites for Salmonella. Because many of the results for these samples were below the lower level of detection for the assays, the percentage of positive samples based on the total number of samples collected was computed and these percentages are summarized in Tables 12.5 to 12.7. Both of the surrogate farms had positive air samples at the upper boundary, suggesting that there may be airborne fecal impacts from other adjacent sources. The frequencies of samples positive for fecal indicator microbes in air were generally lowest for upper boundaries and highest for sample sites near waste sources, such as exhaust fans or near barns, lagoons, or the technology. The frequencies at which air samples were positive for fecal indicator microbes were slightly higher on the surrogate farms (38 of 416 samples or 9%) as compared to the Vestal farm (5 of 120 samples or 4%). However, these frequencies of positive samples were not significantly different (p = 0.39 by Fisher’s Exact Test). However, the concentrations of microbes in positive microbial air samples were significantly lower for the Vestal farm with the ISSUES technology when compared to the surrogate farms (median concentrations of 31 and 69 CFU/M3, respectively, Mann-Whitney U-test, p = 0.0048). These results indicate that there are environmental impacts associated with the Vestal farm and each of the surrogate farms; however, the environmental impacts to on-farm air samples by fecal microbes appeared to be less for the Vestal farm with the ISSUES technology than for the surrogate farms. Table 12.5. The percentage of positive samples of Clostridium perfringens spores measured at
different sampling sites on the Surrogate Farm1, Surrogate Farm 2, and Vestal Farm Site Surrogate Farm 1 Surrogate Farm 2 Vestal Farm
Upper boundary 0 0 0 Lower boundary 0 29% 17% Exhaust fans or
near barn 50% 56% 17%
Lagoon 13% 13% n/a1 Technology n/a n/a 0
Clarifier n/a n/a 0 1 not applicable
Phase 2 OPEN Technology Evaluations - Pathogens 21

Table 12.6. The percentage of positive samples of total coliphage measured at different sampling sites on the Surrogate Farm1, Surrogate Farm 2, and Vestal Farm Site Surrogate Farm 1 Surrogate Farm 2 Vestal Farm
Upper boundary 0 13% 0 Lower boundary 0 21% 0 Exhaust fans or
near barn 13% 33% 0
Lagoon 0 13% n/a1 Technology n/a n/a 0
Clarifier n/a n/a 0 1 not applicable Table 12.7. The percentage of positive samples of fecal coliform bacteria (E. coli) measured at
different sampling sites on the Surrogate Farm1, Surrogate Farm 2, and Vestal Farm Site Surrogate Farm 1 Surrogate Farm 2 Vestal Farm
Upper boundary 6% (0) 0 0 Lower boundary 0 0 17% (0) Exhaust fans or
near barn 13% (0) 0 0
Lagoon 13% (0) 0 n/a1 Technology n/a n/a 0
Clarifier n/a n/a 33% (0) 1 not applicable The levels of endotoxins measured at the two surrogate farms and the Vestal farm with the ISSUES technology are summarized in Table 12.8. The concentrations of endotoxins varied a great deal on a daily basis at the farm sites. High levels of endotoxins (mean 235 EU/m3) were detected at the barn sample for this farm. In most cases, the concentrations of endotoxins at the lower boundary were higher than (surrogate 1 and Vestal farm with the ISSUES technology) or similar to (surrogate 1 farm) those at the upper boundary, which strongly suggests that endotoxins released from the swine barns were reaching the lower boundary of the farm. Table 12.8. The levels of endotoxin from airborne dust at sampling sites
Summary Day 1 Day 2 Day 3 Day 4 Day 5 Day 6 Day 7 Mean SD Location Sites
Concentration (EU/m3) Upper Boundary 20 5 107 49 n/d1 n/d n/d 45 45
Upper Wind 9 8 47 217 n/d n/d n/d 70 100 Near Barn 1 70 62 358 481 n/d n/d n/d 243 210 Near Barn 2 217 48 510 510 n/d n/d n/d 321 229
Lagoon 160 14 108 23 n/d n/d n/d 76 70
Surrogate 1
Lower Boundary 5 6 121 47 n/d n/d n/d 45 54 Upper Boundary 1 1 15 31 6 21 2 11 12
Exhaust fan 1 28 312 2940 290 1861 288 55 825 1126Exhaust fan 2 225 n/d 2869 84 n/d n/d n/d 1059 1569
Lagoon 3 2 68 26 13 10 21 20 23 Surrogate 2
Lower Boundary 3 3 97 26 23 30 4 26 33 Upper Boundary 2 23 16 n/d n/d n/d n/d 14 11
Barn 145 17 545 n/d n/d n/d n/d 235 275 Clarifier 5 9 23 n/d n/d n/d n/d 12 9
Technology 37 10 18 n/d n/d n/d n/d 22 14
ISSUES -Vestal
Lower Boundary 84 7 19 n/d n/d n/d n/d 36 42 1 not done; 2 below limit of detection
Phase 2 OPEN Technology Evaluations - Pathogens 22

Environmental conditions were recorded simultaneously at the points on the farms where air samples were collected, with these values are summarized in Table 12.9. Temperatures were somewhat variable for the different sample days for each of the farm sites, as would be expected due to the varied seasons of sample collection. Mean relative humidity, mean wind velocity, and mean solar irradiation were similar for each of the farms tested. Table 12.9. Summary of environmental conditions during microbial air sampling at the Surrogate
Farm1, Surrogate Farm 2, and Vestal Farm (a) Temperature (°C)
Farm Day 1 Day 2 Day 3 Day 4 Day 5 Day 6 Day 7 Mean ± SD
Surrogate 1 27±1°C 23±5 °C 1±1 °C -2 ±1°C n/a1 n/a n/a 13±14°C
Surrogate 2 31±3°C 30±2°C 8±3°C 19±3°C 25±1°C 32±2°C 33±3°C 25±9°C
Vestal Farm 15±2°C 30±1°C 33±2°C n/a n/a n/a n/a 26±10°C
(b) Relative Humidity (%)
Farm Day 1 Day 2 Day 3 Day 4 Day 5 Day 6 Day 7 Mean ± SD
Surrogate 1 82±3% 52±17% 28±3% 33±7% n/a n/a n/a 49±23%
Surrogate 2 46±8% 61±6% 22±5% 80±12% 28±2% 63±5% 58±5% 51±20%
Vestal Farm 25±3% 76±5% 35±3% n/a n/a n/a n/a 46±27%
(c) Average wind velocity (m/sec)
Farm Day 1 Day 2 Day 3 Day 4 Day 5 Day 6 Day 7 Mean ± SD
Surrogate 1 2.2±0.6 1.0±0.8 3.0±1.4 1.2±0.4 n/a n/a n/a 1.9±1.2
Surrogate 2 0.6±0.3 1.2±0.3 2.2±0.8 3.7±2.6 2.1±0.8 1.5±0.7 1.7±1.1 1.9±1.0
Vestal Farm 2.7±1.5 1.1±0.8 0.8±0.7 n/a n/a n/a n/a 1.5±1.0
(d) Solar irradiation (mW/cm2)
1 not applicable
Farm Day 1 Day 2 Day 3 Day 4 Day 5 Day 6 Day 7 Mean ± SD
Surrogate 1 2.4±1.4 7.1±1.3 3.8±0.8 4.3±0.7 n/a n/a n/a 4.4±2.0
Surrogate 2 5.0±1.8 5.4±2.3 5.0±0.5 3.4±2.6 10.3±1.3 6.7±3.7 11.5±0.8 6.8±3.0
Vestal Farm 8.0±1.1 5.6±3.5 10.4±1.8 n/a n/a n/a n/a 8.0±2.4
Summary Analysis: The overall results of microbiological analyses of swine waste and its treated effluent showed lower microbial concentrations and therefore, greater reductions of microbes by the ISSUES technology at the Vestal Farm when compared to conventional technologies on surrogate swine farms. Reductions of microbes by the alternative treatment were significantly greater than they
Phase 2 OPEN Technology Evaluations - Pathogens 23
were with the conventional technology when the water reuse system on the Vestal farm was operational. However, when the water reuse system was not operational, the alternative water management system at the Vestal farm yielded statistically similar results to the surrogate farms. Because there were significantly fewer microbes remaining in the treated wastes with the alternative water reuse technology than with the conventional technology, the alternative technology would be considered superior on this basis. The frequencies of air samples positive for fecal microbes were similar at the Vestal farm with the ISSUES technology and the surrogate farms. However, concentrations of fecal microbes present in air were statistically significantly lower at the Vestal farm. Because the concentrations of airborne microbes at the Vestal farm with the ISSUES technology were generally lower than those on surrogate farms, this alternative treatment technology should be considered superior to the current technologies at the surrogate farms on this basis. Overall, it can be concluded that the Vestal farm with the ISSUES technology can be judged environmentally superior to the surrogate farms when the water reuse system is operational. This is because it reduced microbial indicators and the pathogen, Salmonella, in the treated waste effluent to a greater extent as compared to reductions achieved by conventional technologies at the surrogate farms. Although there were similar frequencies of airborne fecal contamination occurrence at the Vestal and surrogate farms, the microbial concentrations were statistically lower at the Vestal farm. Finally, we were unable to collect the necessary number of houseflies at the Vestal farm for assay In contrast houseflies harboring fecal microbes were found on surrogate farms. These finding suggest that there were few houseflies present at the alternative technology farm site, therefore allowing for the Vestal farm to be considered superior to the surrogate farms with regards to environmental impacts that may occur due to housefly vectors.
Phase 2 OPEN Technology Evaluations - Pathogens 24
13. Evaluation of ISSUES Technology at the Harrells Farm for Pathogens Project OPEN Science Team for Pathogens
Alternative Technology: Combined in-ground digester with permeable cover/ aerobic blanket – BioKinetic aeration process for nitrification-denitrification Location: one of three commercial swine production facilities, owned by Murphy-Brown Farms, in Duplin County, North Carolina Period of Operation: The evaluation dates are:
1st field experiment: 01/28/2004 (liquid/solid waste stream only) 2nd field experiment: 02/02/2004 (air only) 3rd field experiment: 06/01/2004 (air and liquid/solid waste stream) 4th field experiment: 06/07/2004 (air and environmental samples) 5th field experiment: 08/23/2004 (air and liquid/solid waste stream)
Technology Suppliers: Prince Dugba, Ph.D. (Smithfield Foods, 910-296-0795), John Baumgartner (Baumgartner Environics, Inc.), Katie Elmer (Murphy Brown, LLC, 910-293-3434) NCSU Representative PI: Leonard S. Bull (919-515-6836) Statement of Task:
- Measurement of microbial indicator and pathogen concentrations at key points throughout the waste treatment stream of the technology
- Measurement of airborne microbial indicator and pathogen concentrations at selected sites on the farm in close proximity to the treatment system and at the upper and lower property boundaries
- Measurement of microbial indicator and pathogen concentrations within soils from sites where treated waste water was applied, as well as background soil where spray irrigation did not occur (did not spray irrigate during sample periods)
- Microbial measurements were made during two sessions corresponding to a warm and cold season.
- Microbial parameters measured for the waste stream: fecal indicators (fecal coliforms, E. coli, enterococci, spores of Clostridium perfringens, and total coliphages) and the bacterial pathogen Salmonella
- Microbial parameters measured in the air samples: total bacteria, total fungi, bacterial endotoxins, fecal indicators (fecal coliforms, E. coli, spores of Clostridium perfringens, and total coliphages) and the bacterial pathogen Salmonella
- Environmental conditions measured at sample points as air samples were collected: temperature, wind direction and speed, relative humidity, solar irradiance
Measurement of Pathogens: Treatment Technology The Harrells farm was a finishing operation that was permitted for 6,120 head at steady state. There are 5 barns on the farm, with the main source of pathogens being the fecal wastes from the animals. The barns had a flush style waste removal system with 4 aisles in each of the barns. These were flushed an average of 16000 gallons per barn (test houses) per day. This farm had an unusual flow pattern for wastes, as the wastes from only two of the barns entered the alternative waste treatment system and the wastes from the other barns entered an existing conventional anaerobic lagoon system. Once treated through the alternative waste treatment system, the treated water was then used to fill the two test houses. Because of this unusual and
Phase 2 OPEN Technology Evaluations - Pathogens 25

complicated flow pattern, this was an extremely difficult farm on which to assess the efficacy of the alternative treatment system. From the barns, the flushed material was delivered to the alternative waste treatment system using a pump and lift station. The waste material entered a lagoon with a permeable cover and then an aerobic digester. Part of the material from the digester was used to refill the tanks used to flush two of the barns and the other portion of the material was held in a polishing reservoir from which the material was then land applied. An additional evaporation system was added to the existing alternative system that required further testing past the original evaluation period. This system consisted of spray evaporation units placed on top of the permeable covered lagoon. Using this system, liquid from the storage basin was spray irrigated over the permeable covered lagoon, with the goal of reducing the volume of liquids in the system from natural evaporative processes. We evaluated this portion of the system only once. Microbiological Samples Single grab samples were collected from points within the waste treatment streams to assess the microbial concentrations associated with the technology. Microbial concentrations were quantitatively determined in the waste stream for fecal indicators (fecal coliforms, E. coli, enterococci, spores of Clostridium perfringens, and total coliphages) and the bacterial pathogen, Salmonella. Microbiological assays were performed according to protocols outlined in the Quality Assurance Project Plan (QAPP) prepared by the Pathogens group of the OPEN team. Briefly, fecal coliform, E. coli, and enterococci bacteria were quantitatively (quantally) assayed using commercial, biochemically-based microbial culture assay systems and other microbial indicators were assayed using standard quantitative microbial assay methods. Salmonella was assayed quantally using an accepted most-probable number assay method based on published literature. Air samples were collected at sites throughout the farm. Airborne microbial concentrations were measured for the following: total (aerobic/heterotrophic) bacteria, total (aerobic/heterotrophic) fungi, spores of C. perfringens, fecal coliforms, E. coli, and Salmonella. Microbiological air sampling was performed using AGI-30 all-glass impingers with sampling at 12.5 LPM for 30 minutes per sample. Each microorganism was analyzed by culture methods described in the QAPP document from the OPEN team. In addition to culturable airborne microorganisms, airborne endotoxins were collected using personal SKC air samplers at approximately 4 LPM for 4 hours. Samples were analyzed by the Limulus amebocyte lysate (LAL) test. Environmental conditions, including temperature, relative humidity (RH), wind velocity, and solar irradiation, were measured and recorded at specific locations and times when microbial air samples were collected. These microbial measurements took place according to the following schedule: Table 13.1. Pathogen Measurement Schedule and Sample Locations at Harrells Farm Date Samples
Collected Air Samples Analyzed Waste Stream Samples Analyzed Environmental Samples Analyzed
1/28/2004 -- FF, BF, ID, IP, P --
2/2/2004 UB, LB, B, T -- --
6/1/2004 UB, LB, B, T FF, BF, ID, IP, P --
6/7/2004 UB, LB, B, T, US, LS -- SV, BS
8/23/2004 UB, LB, B, T, T2 FF, BF, ID, IP, P, CS --
UB=upper (upwind) boundary; LB=lower(downwind) boundary; B=barn; T=technology; US=upwind of spray field; LS= 75 feet downwind of spray field; T2=spray mist (new component); FF=fresh feces; BF=barn flush; ID=influent to digester; IP=influent to polishing reservoir; P=polishing reservoir; SV=spray irrigated soil/vegetation; BS=background soil; CS=collected spray material
Phase 2 OPEN Technology Evaluations - Pathogens 26

Figure 13.1. Microbial Waste Stream Measurements Taken at Harrells Farm
FF=fresh feces; BF=barn flush; ID=influent to digester; IP=influent to polishing resP=polishinreservoir; CS=collectspray ma
Houses
Lagoon w/Permeable Cover
Existing lagoon
Aerobic digester
Storage Basin
Houses 2 & 3 flush into the permeable covered lagoonHouse 1, 4, 5 flush into the lagoon (existing)Houses 2 & 3 are recharged with Aerobic Digester tre ated liquidHouses 1, 4, 5 are recharged with the (existing) lagoon liquid
Existing lagoon
Evaporation system
Land application (initially)
ervoir; g
ed terial
Results: Waste Stream Samples Concentrations of microbial indicators and Salmonella were measured in the waste stream of two surrogate farms and of the Harrells Farm with the ISSUES technology. With each of the farms, the microbial “source strength” was measured directly in fresh fecal samples taken from the barns where the animals are housed (Table 13.2). Three sets of microbial data were collected for the liquid-solid samples corresponding with two sampling periods of the original alternative technology evaluation effort and a third sampling period for evaluating the additional spray system that was later added over the permeable lagoon. Microbial concentrations at all farms showed some variations at different sampling times. Microbial concentrations were higher and less variable for fecal coliforms, E. coli and enterococci than they were for C. perfringens, coliphages and Salmonella. C. perfringens and coliphage concentrations were less variable at the Harrells site than for the surrogate farm sites. Salmonella concentrations were generally low for all three of the farms tested.
Phase 2 OPEN Technology Evaluations - Pathogens 27
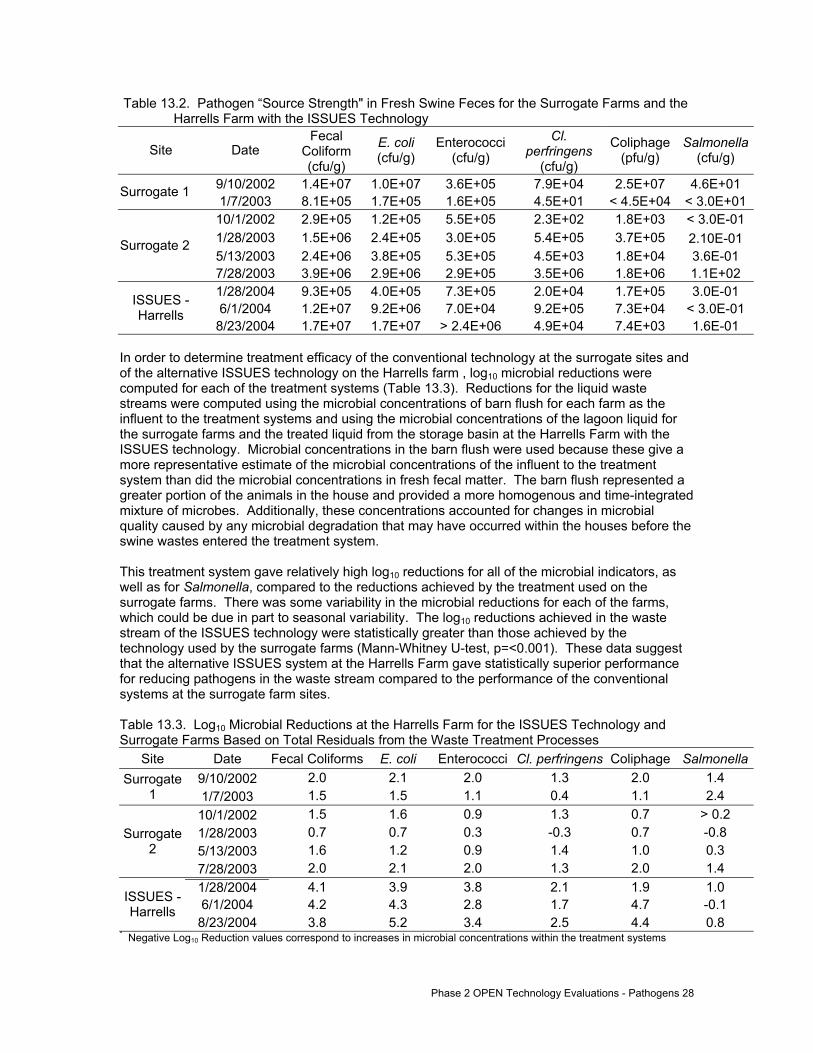
Table 13.2. Pathogen “Source Strength" in Fresh Swine Feces for the Surrogate Farms and the Harrells Farm with the ISSUES Technology
Site Date Fecal
Coliform (cfu/g)
E. coli (cfu/g)
Enterococci (cfu/g)
Cl. perfringens
(cfu/g)
Salmonella (cfu/g)
9/10/2002 1.4E+07 1.0E+07 3.6E+05 7.9E+04 Surrogate 1 1/7/2003 8.1E+05 1.7E+05 1.6E+05 4.5E+01
Coliphage (pfu/g)
2.5E+07 4.6E+01 < 4.5E+04 < 3.0E+01
10/1/2002
Surrogate 2
2.9E+05 1.2E+05 5.5E+05 2.3E+02 1.8E+03 < 3.0E-01 1/28/2003 1.5E+06 2.4E+05 3.0E+05 5.4E+05 3.7E+05 2.10E-01 5/13/2003 2.4E+06 3.8E+05 5.3E+05 4.5E+03 1.8E+04 3.6E-01 7/28/2003 3.9E+06 2.9E+06 3.5E+06 1.8E+06 1.1E+02 1/28/2004 9.3E+05 4.0E+05 7.3E+05 1.7E+05 3.0E-01
1.2E+07 9.2E+06 7.0E+04 9.2E+05 < 3.0E-01 8/23/2004 1.7E+07
2.9E+05 2.0E+04 ISSUES -
Harrells 6/1/2004 7.3E+04 1.7E+07 > 2.4E+06 4.9E+04 7.4E+03 1.6E-01
In order to determine treatment efficacy of the conventional technology at the surrogate sites and of the alternative ISSUES technology on the Harrells farm , log microbial reductions were computed for each of the treatment systems (Table 13.3). Reductions for the liquid waste streams were computed using the microbial concentrations of barn flush for each farm as the influent to the treatment systems and using the microbial concentrations of the lagoon liquid for the surrogate farms and the treated liquid from the storage basin at the Harrells Farm with the ISSUES technology. Microbial concentrations in the barn flush were used because these give a more representative estimate of the microbial concentrations of the influent to the treatment system than did the microbial concentrations in fresh fecal matter. The barn flush represented a greater portion of the animals in the house and provided a more homogenous and time-integrated mixture of microbes. Additionally, these concentrations accounted for changes in microbial quality caused by any microbial degradation that may have occurred within the houses before the swine wastes entered the treatment system.
10
This treatment system gave relatively high log reductions for all of the microbial indicators, as well as for Salmonella, compared to the reductions achieved by the treatment used on the surrogate farms. There was some variability in the microbial reductions for each of the farms, which could be due in part to seasonal variability. The log reductions achieved in the waste stream of the ISSUES technology were statistically greater than those achieved by the technology used by the surrogate farms (Mann-Whitney U-test, p=<0.001). These data suggest that the alternative ISSUES system at the Harrells Farm gave statistically superior performance for reducing pathogens in the waste stream compared to the performance of the conventional systems at the surrogate farm sites.
10
10
10
Site Date Fecal Coliforms Enterococci Cl. perfringens Coliphage Salmonella
Table 13.3. Log Microbial Reductions at the Harrells Farm for the ISSUES Technology and Surrogate Farms Based on Total Residuals from the Waste Treatment Processes
E. coli 9/10/2002 2.0 2.1 2.0 1.3 2.0 1.4 Surrogate
1 1/7/2003 1.5 1.5 1.1 0.4 1.1 2.4 10/1/2002 1.5 1.6 0.9 1.3 0.7 > 0.2 1/28/2003 0.7 0.3 -0.3 0.7 -0.8 5/13/2003 1.6 1.2 0.9 1.4 1.0 0.3
Surrogate 2
7/28/2003 2.0 2.1 2.0 1.3 2.0 1.4 1/28/2004 4.1 3.9 3.8 2.1 1.9 1.0 6/1/2004 4.2 4.3 2.8 1.7 4.7 -0.1 ISSUES -
Harrells 8/23/2004 3.8 5.2 3.4 2.5 4.4 0.8
0.7
* Negative Log10 Reduction values correspond to increases in microbial concentrations within the treatment systems
Phase 2 OPEN Technology Evaluations - Pathogens 28
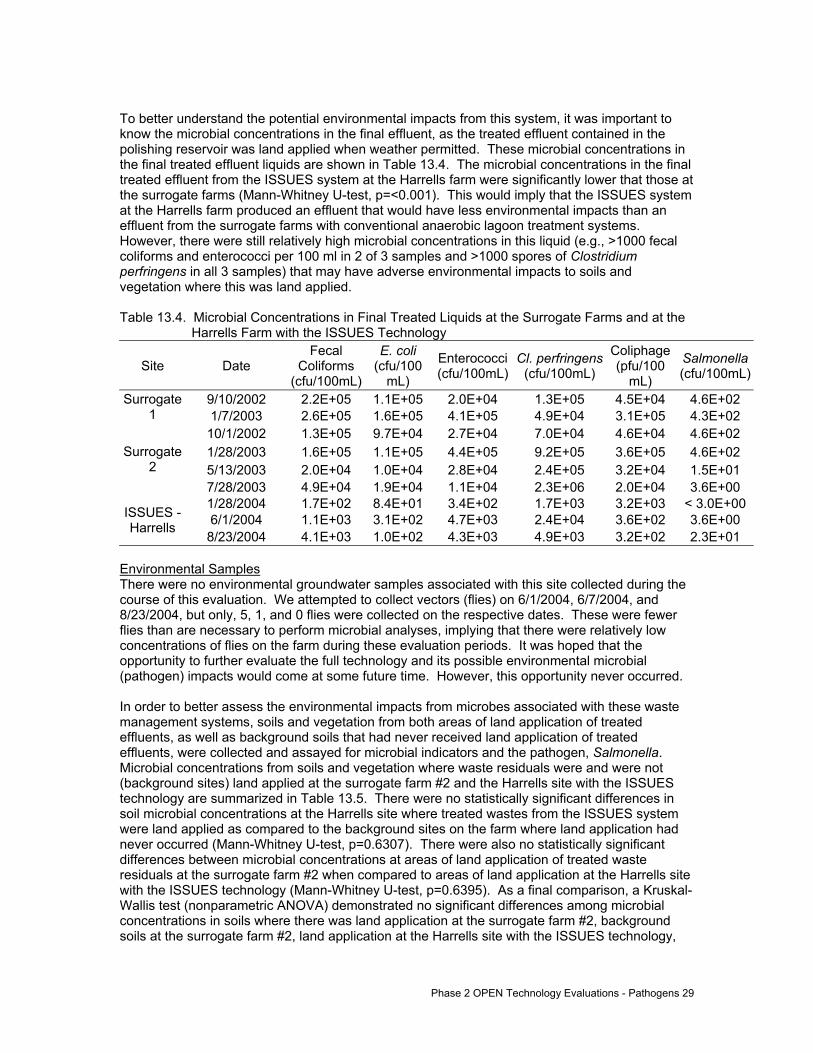
To better understand the potential environmental impacts from this system, it was important to know the microbial concentrations in the final effluent, as the treated effluent contained in the polishing reservoir was land applied when weather permitted. These microbial concentrations in the final treated effluent liquids are shown in Table 13.4. The microbial concentrations in the final treated effluent from the ISSUES system at the Harrells farm were significantly lower that those at the surrogate farms (Mann-Whitney U-test, p=<0.001). This would imply that the ISSUES system at the Harrells farm produced an effluent that would have less environmental impacts than an effluent from the surrogate farms with conventional anaerobic lagoon treatment systems. However, there were still relatively high microbial concentrations in this liquid (e.g., >1000 fecal coliforms and enterococci per 100 ml in 2 of 3 samples and >1000 spores of Clostridium perfringens in all 3 samples) that may have adverse environmental impacts to soils and vegetation where this was land applied. Table 13.4. Microbial Concentrations in Final Treated Liquids at the Surrogate Farms and at the
Harrells Farm with the ISSUES Technology
Site Date Fecal
Coliforms (cfu/100mL)
E. coli (cfu/100
mL)
Enterococci(cfu/100mL)
Cl. perfringens (cfu/100mL)
Coliphage(pfu/100
mL)
Salmonella(cfu/100mL)
9/10/2002 2.2E+05 1.1E+05 2.0E+04 1.3E+05 4.5E+04 4.6E+02 Surrogate 1 1/7/2003 2.6E+05 1.6E+05 4.1E+05 4.9E+04 3.1E+05 4.3E+02
10/1/2002 1.3E+05 9.7E+04 2.7E+04 7.0E+04 4.6E+04 4.6E+02 1/28/2003 1.6E+05 1.1E+05 4.4E+05 9.2E+05 3.6E+05 4.6E+02 5/13/2003 2.0E+04 1.0E+04 2.8E+04 2.4E+05 3.2E+04 1.5E+01
Surrogate 2
7/28/2003 4.9E+04 1.9E+04 1.1E+04 2.3E+06 2.0E+04 3.6E+00 1/28/2004 1.7E+02 8.4E+01 3.4E+02 1.7E+03 3.2E+03 < 3.0E+00 6/1/2004 1.1E+03 3.1E+02 4.7E+03 2.4E+04 3.6E+02 3.6E+00 ISSUES -
Harrells 8/23/2004 4.1E+03 1.0E+02 4.3E+03 4.9E+03 3.2E+02 2.3E+01
Environmental Samples There were no environmental groundwater samples associated with this site collected during the course of this evaluation. We attempted to collect vectors (flies) on 6/1/2004, 6/7/2004, and 8/23/2004, but only, 5, 1, and 0 flies were collected on the respective dates. These were fewer flies than are necessary to perform microbial analyses, implying that there were relatively low concentrations of flies on the farm during these evaluation periods. It was hoped that the opportunity to further evaluate the full technology and its possible environmental microbial (pathogen) impacts would come at some future time. However, this opportunity never occurred. In order to better assess the environmental impacts from microbes associated with these waste management systems, soils and vegetation from both areas of land application of treated effluents, as well as background soils that had never received land application of treated effluents, were collected and assayed for microbial indicators and the pathogen, Salmonella. Microbial concentrations from soils and vegetation where waste residuals were and were not (background sites) land applied at the surrogate farm #2 and the Harrells site with the ISSUES technology are summarized in Table 13.5. There were no statistically significant differences in soil microbial concentrations at the Harrells site where treated wastes from the ISSUES system were land applied as compared to the background sites on the farm where land application had never occurred (Mann-Whitney U-test, p=0.6307). There were also no statistically significant differences between microbial concentrations at areas of land application of treated waste residuals at the surrogate farm #2 when compared to areas of land application at the Harrells site with the ISSUES technology (Mann-Whitney U-test, p=0.6395). As a final comparison, a Kruskal-Wallis test (nonparametric ANOVA) demonstrated no significant differences among microbial concentrations in soils where there was land application at the surrogate farm #2, background soils at the surrogate farm #2, land application at the Harrells site with the ISSUES technology,
Phase 2 OPEN Technology Evaluations - Pathogens 29
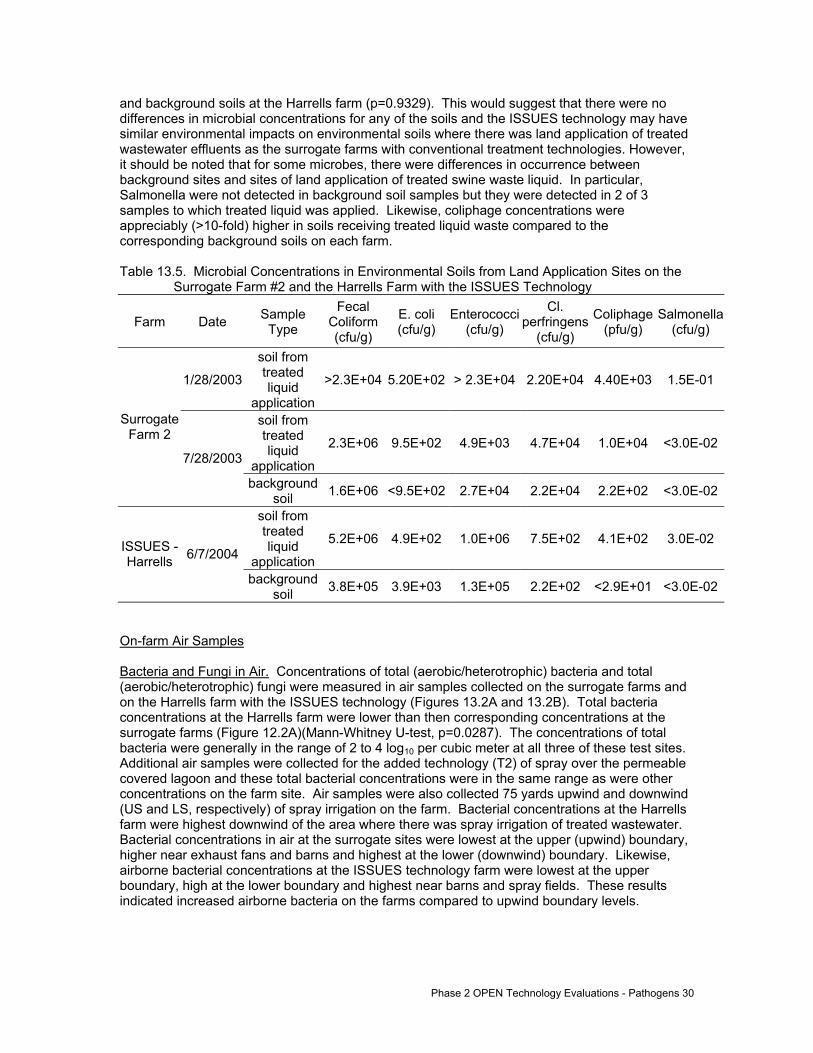
and background soils at the Harrells farm (p=0.9329). This would suggest that there were no differences in microbial concentrations for any of the soils and the ISSUES technology may have similar environmental impacts on environmental soils where there was land application of treated wastewater effluents as the surrogate farms with conventional treatment technologies. However, it should be noted that for some microbes, there were differences in occurrence between background sites and sites of land application of treated swine waste liquid. In particular, Salmonella were not detected in background soil samples but they were detected in 2 of 3 samples to which treated liquid was applied. Likewise, coliphage concentrations were appreciably (>10-fold) higher in soils receiving treated liquid waste compared to the corresponding background soils on each farm. Table 13.5. Microbial Concentrations in Environmental Soils from Land Application Sites on the
Surrogate Farm #2 and the Harrells Farm with the ISSUES Technology
Farm Date Sample Type
Fecal Coliform (cfu/g)
E. coli (cfu/g)
Enterococci (cfu/g)
Cl. perfringens
(cfu/g)
Coliphage (pfu/g)
Salmonella (cfu/g)
1/28/2003
soil from treated liquid
application
>2.3E+04 5.20E+02 > 2.3E+04 2.20E+04 4.40E+03 1.5E-01
soil from treated liquid
application
2.3E+06 9.5E+02 4.9E+03 4.7E+04 1.0E+04 <3.0E-02
Surrogate Farm 2
7/28/2003
background soil 1.6E+06 <9.5E+02 2.7E+04 2.2E+04 2.2E+02 <3.0E-02
soil from treated liquid
application
5.2E+06 4.9E+02 1.0E+06 7.5E+02 4.1E+02 3.0E-02 ISSUES - Harrells 6/7/2004
background soil 3.8E+05 3.9E+03 1.3E+05 2.2E+02 <2.9E+01 <3.0E-02
On-farm Air Samples Bacteria and Fungi in Air. Concentrations of total (aerobic/heterotrophic) bacteria and total (aerobic/heterotrophic) fungi were measured in air samples collected on the surrogate farms and on the Harrells farm with the ISSUES technology (Figures 13.2A and 13.2B). Total bacteria concentrations at the Harrells farm were lower than then corresponding concentrations at the surrogate farms (Figure 12.2A)(Mann-Whitney U-test, p=0.0287). The concentrations of total bacteria were generally in the range of 2 to 4 log10 per cubic meter at all three of these test sites. Additional air samples were collected for the added technology (T2) of spray over the permeable covered lagoon and these total bacterial concentrations were in the same range as were other concentrations on the farm site. Air samples were also collected 75 yards upwind and downwind (US and LS, respectively) of spray irrigation on the farm. Bacterial concentrations at the Harrells farm were highest downwind of the area where there was spray irrigation of treated wastewater. Bacterial concentrations in air at the surrogate sites were lowest at the upper (upwind) boundary, higher near exhaust fans and barns and highest at the lower (downwind) boundary. Likewise, airborne bacterial concentrations at the ISSUES technology farm were lowest at the upper boundary, high at the lower boundary and highest near barns and spray fields. These results indicated increased airborne bacteria on the farms compared to upwind boundary levels.
Phase 2 OPEN Technology Evaluations - Pathogens 30
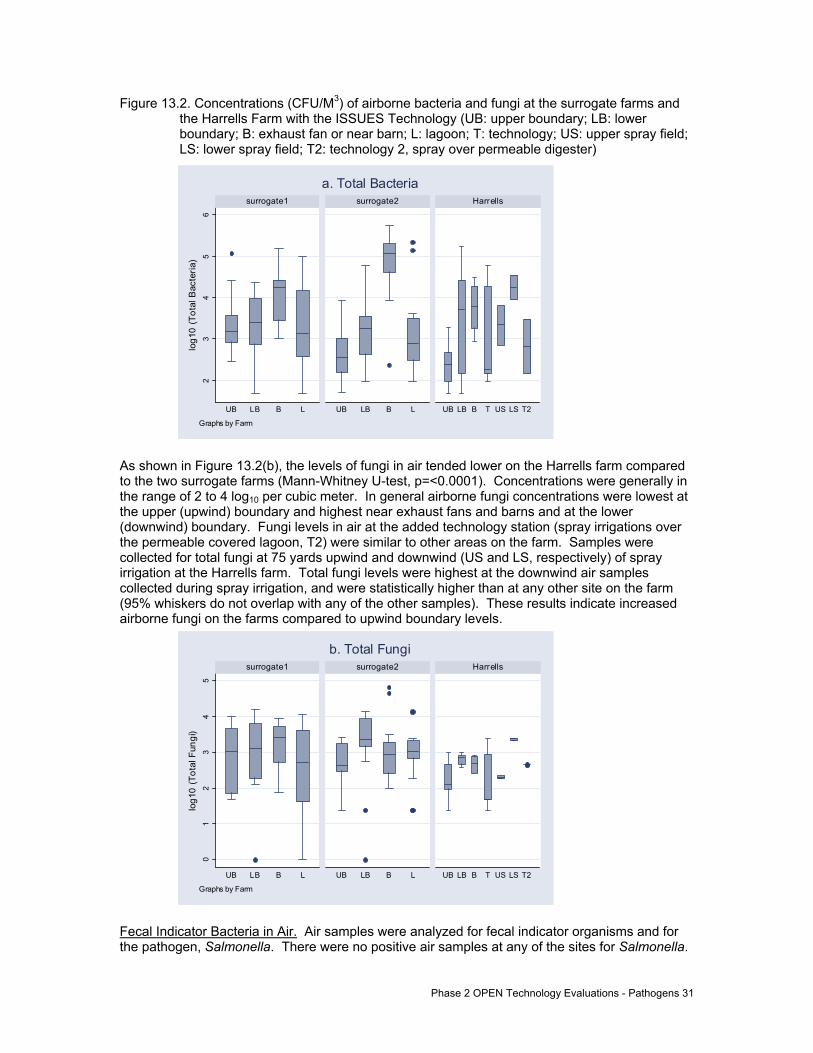
Figure 13.2. Concentrations (CFU/M3) of airborne bacteria and fungi at the surrogate farms and the Harrells Farm with the ISSUES Technology (UB: upper boundary; LB: lower boundary; B: exhaust fan or near barn; L: lagoon; T: technology; US: upper spray field; LS: lower spray field; T2: technology 2, spray over permeable digester)
23
45
6
UB LB B L UB LB B L UB LB B T US LS T2
surrogate1 surrogate2 Harrellslo
g10
(Tot
al B
acte
ria)
Graphs by Farm
a. Total Bacteria
As shown in Figure 13.2(b), the levels of fungi in air tended lower on the Harrells farm compared to the two surrogate farms (Mann-Whitney U-test, p=<0.0001). Concentrations were generally in the range of 2 to 4 log10 per cubic meter. In general airborne fungi concentrations were lowest at the upper (upwind) boundary and highest near exhaust fans and barns and at the lower (downwind) boundary. Fungi levels in air at the added technology station (spray irrigations over the permeable covered lagoon, T2) were similar to other areas on the farm. Samples were collected for total fungi at 75 yards upwind and downwind (US and LS, respectively) of spray irrigation at the Harrells farm. Total fungi levels were highest at the downwind air samples collected during spray irrigation, and were statistically higher than at any other site on the farm (95% whiskers do not overlap with any of the other samples). These results indicate increased airborne fungi on the farms compared to upwind boundary levels.
01
23
45
UB LB B L UB LB B L UB LB B T US LS T2
surrogate1 surrogate2 Harrells
log1
0 (T
otal
Fun
gi)
Graphs by Farm
b. Total Fungi
Fecal Indicator Bacteria in Air. Air samples were analyzed for fecal indicator organisms and for the pathogen, Salmonella. There were no positive air samples at any of the sites for Salmonella.
Phase 2 OPEN Technology Evaluations - Pathogens 31
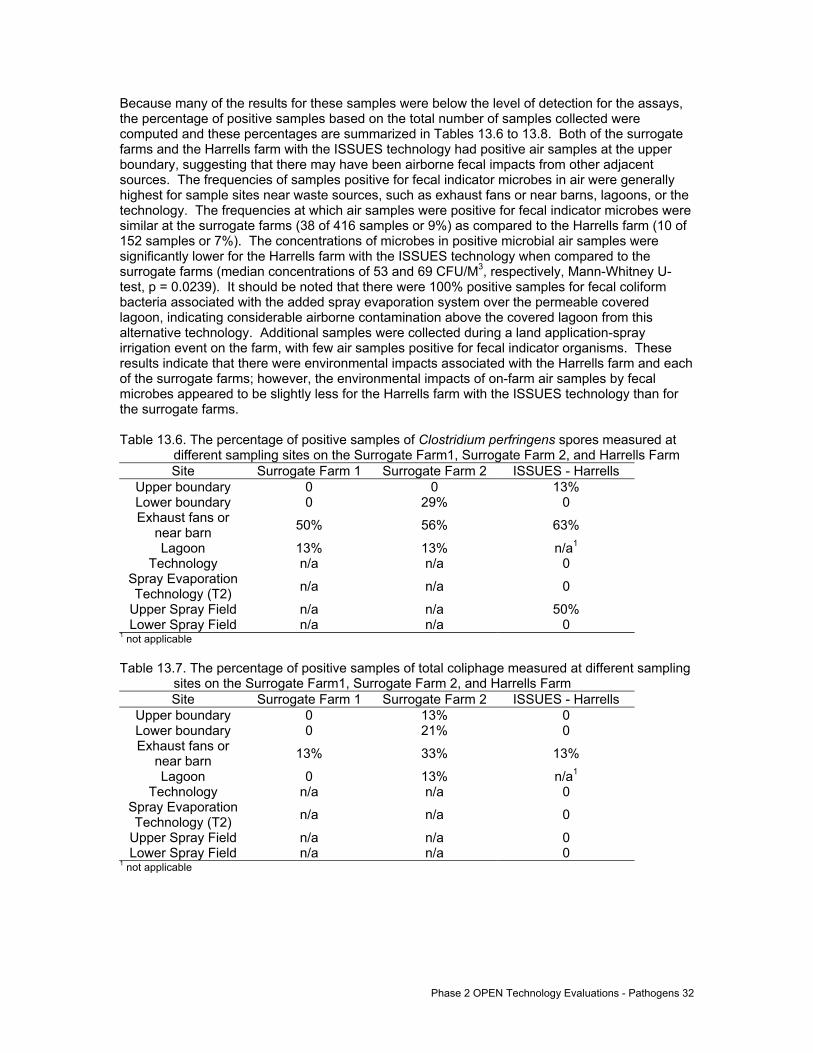
Because many of the results for these samples were below the level of detection for the assays, the percentage of positive samples based on the total number of samples collected were computed and these percentages are summarized in Tables 13.6 to 13.8. Both of the surrogate farms and the Harrells farm with the ISSUES technology had positive air samples at the upper boundary, suggesting that there may have been airborne fecal impacts from other adjacent sources. The frequencies of samples positive for fecal indicator microbes in air were generally highest for sample sites near waste sources, such as exhaust fans or near barns, lagoons, or the technology. The frequencies at which air samples were positive for fecal indicator microbes were similar at the surrogate farms (38 of 416 samples or 9%) as compared to the Harrells farm (10 of 152 samples or 7%). The concentrations of microbes in positive microbial air samples were significantly lower for the Harrells farm with the ISSUES technology when compared to the surrogate farms (median concentrations of 53 and 69 CFU/M3, respectively, Mann-Whitney U-test, p = 0.0239). It should be noted that there were 100% positive samples for fecal coliform bacteria associated with the added spray evaporation system over the permeable covered lagoon, indicating considerable airborne contamination above the covered lagoon from this alternative technology. Additional samples were collected during a land application-spray irrigation event on the farm, with few air samples positive for fecal indicator organisms. These results indicate that there were environmental impacts associated with the Harrells farm and each of the surrogate farms; however, the environmental impacts of on-farm air samples by fecal microbes appeared to be slightly less for the Harrells farm with the ISSUES technology than for the surrogate farms. Table 13.6. The percentage of positive samples of Clostridium perfringens spores measured at
different sampling sites on the Surrogate Farm1, Surrogate Farm 2, and Harrells Farm Site Surrogate Farm 1 Surrogate Farm 2 ISSUES - Harrells
Upper boundary 0 0 13% Lower boundary 0 29% 0 Exhaust fans or
near barn 50% 56% 63%
Lagoon 13% 13% n/a1 Technology n/a n/a 0
Spray Evaporation Technology (T2) n/a n/a 0
Upper Spray Field n/a n/a 50% Lower Spray Field n/a n/a 0
1 not applicable
Table 13.7. The percentage of positive samples of total coliphage measured at different sampling sites on the Surrogate Farm1, Surrogate Farm 2, and Harrells Farm Site Surrogate Farm 1 Surrogate Farm 2 ISSUES - Harrells
Upper boundary 0 13% 0 Lower boundary 0 21% 0 Exhaust fans or
near barn 13% 33% 13%
Lagoon 0 13% n/a1 Technology n/a n/a 0
Spray Evaporation Technology (T2) n/a n/a 0
Upper Spray Field n/a n/a 0 Lower Spray Field n/a n/a 0
1 not applicable
Phase 2 OPEN Technology Evaluations - Pathogens 32
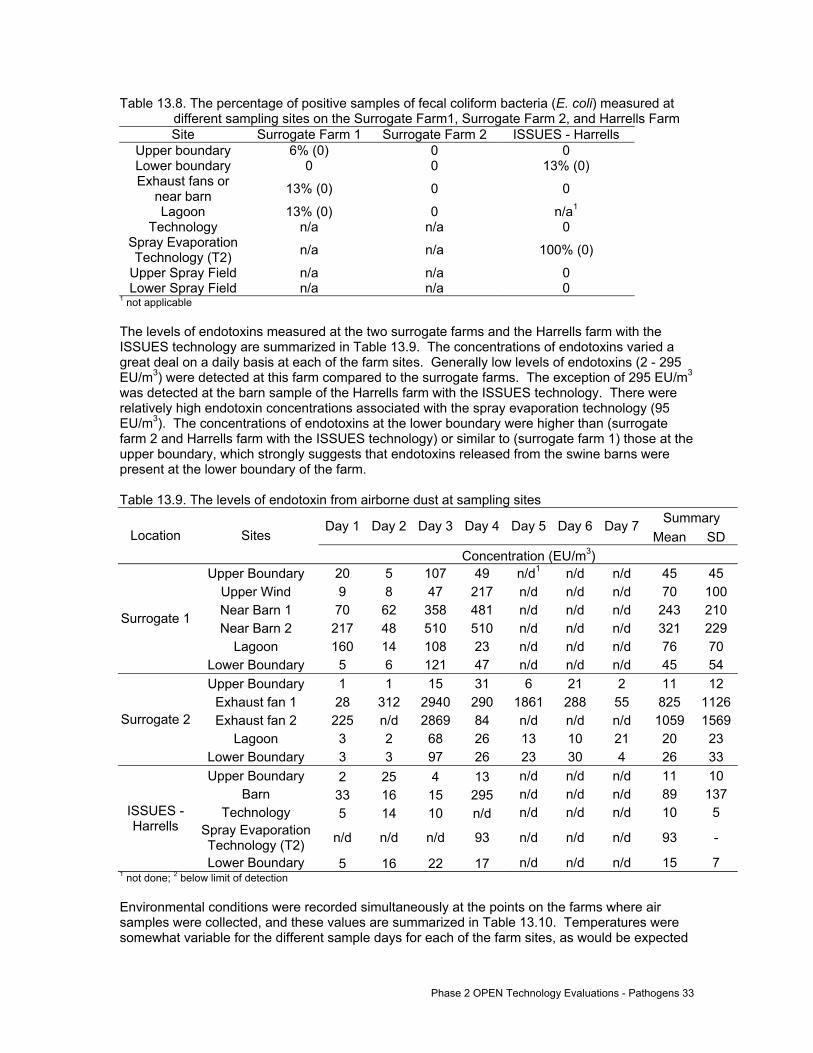
Table 13.8. The percentage of positive samples of fecal coliform bacteria (E. coli) measured at different sampling sites on the Surrogate Farm1, Surrogate Farm 2, and Harrells Farm Site Surrogate Farm 1 Surrogate Farm 2 ISSUES - Harrells
Upper boundary 6% (0) 0 0 Lower boundary 0 0 13% (0) Exhaust fans or
near barn 13% (0) 0 0
Lagoon 13% (0) 0 n/a1 Technology n/a n/a 0
Spray Evaporation Technology (T2) n/a n/a 100% (0)
Upper Spray Field n/a n/a 0 Lower Spray Field n/a n/a 0
1 not applicable The levels of endotoxins measured at the two surrogate farms and the Harrells farm with the ISSUES technology are summarized in Table 13.9. The concentrations of endotoxins varied a great deal on a daily basis at each of the farm sites. Generally low levels of endotoxins (2 - 295 EU/m3) were detected at this farm compared to the surrogate farms. The exception of 295 EU/m3 was detected at the barn sample of the Harrells farm with the ISSUES technology. There were relatively high endotoxin concentrations associated with the spray evaporation technology (95 EU/m3). The concentrations of endotoxins at the lower boundary were higher than (surrogate farm 2 and Harrells farm with the ISSUES technology) or similar to (surrogate farm 1) those at the upper boundary, which strongly suggests that endotoxins released from the swine barns were present at the lower boundary of the farm. Table 13.9. The levels of endotoxin from airborne dust at sampling sites
Summary Day 1 Day 2 Day 3 Day 4 Day 5 Day 6 Day 7 Mean SD Location Sites
Concentration (EU/m3) Upper Boundary 20 5 107 49 n/d1 n/d n/d 45 45
Upper Wind 9 8 47 217 n/d n/d n/d 70 100 Near Barn 1 70 62 358 481 n/d n/d n/d 243 210 Near Barn 2 217 48 510 510 n/d n/d n/d 321 229
Lagoon 160 14 108 23 n/d n/d n/d 76 70
Surrogate 1
Lower Boundary 5 6 121 47 n/d n/d n/d 45 54 Upper Boundary 1 1 15 31 6 21 2 11 12
Exhaust fan 1 28 312 2940 290 1861 288 55 825 1126Exhaust fan 2 225 n/d 2869 84 n/d n/d n/d 1059 1569
Lagoon 3 2 68 26 13 10 21 20 23 Surrogate 2
Lower Boundary 3 3 97 26 23 30 4 26 33 Upper Boundary 2 25 4 13 n/d n/d n/d 11 10
Barn 33 16 15 295 n/d n/d n/d 89 137 Technology 5 14 10 n/d n/d n/d n/d 10 5
Spray Evaporation Technology (T2) n/d n/d n/d 93 n/d n/d n/d 93 -
ISSUES - Harrells
Lower Boundary 5 16 22 17 n/d n/d n/d 15 7 1 not done; 2 below limit of detection Environmental conditions were recorded simultaneously at the points on the farms where air samples were collected, and these values are summarized in Table 13.10. Temperatures were somewhat variable for the different sample days for each of the farm sites, as would be expected
Phase 2 OPEN Technology Evaluations - Pathogens 33
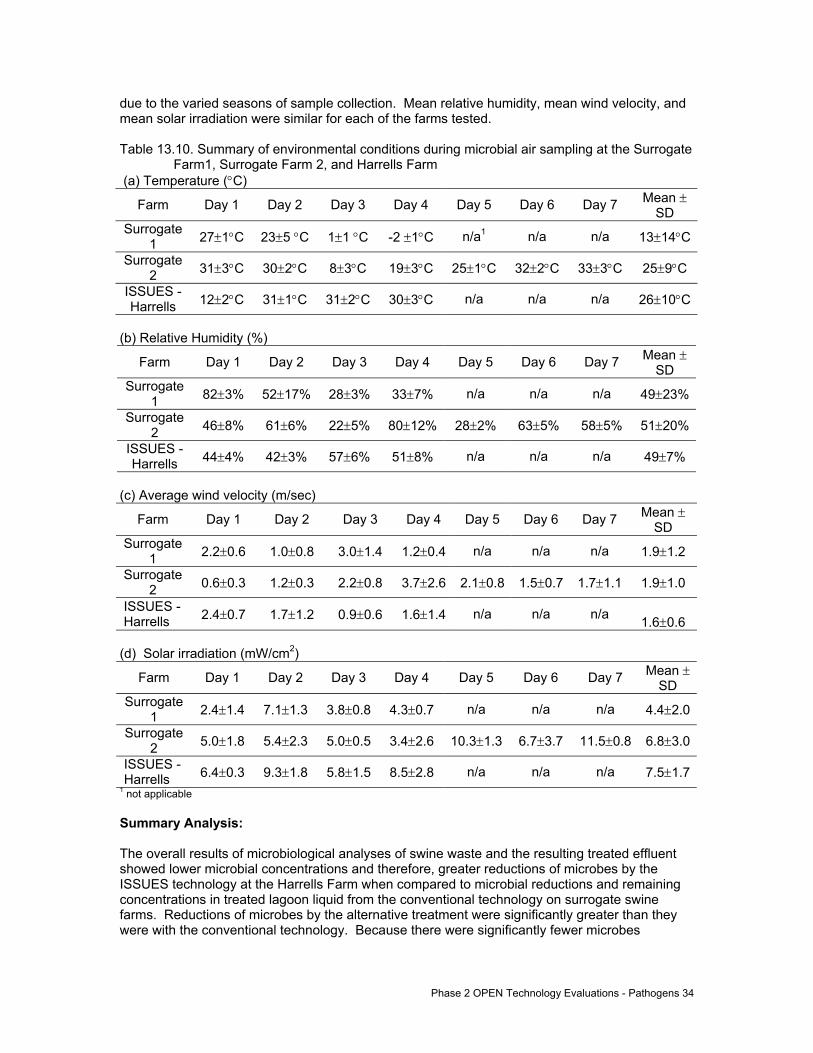
due to the varied seasons of sample collection. Mean relative humidity, mean wind velocity, and mean solar irradiation were similar for each of the farms tested. Table 13.10. Summary of environmental conditions during microbial air sampling at the Surrogate
Farm1, Surrogate Farm 2, and Harrells Farm (a) Temperature (°C)
Farm Day 1 Day 2 Day 3 Day 4 Day 5 Day 6 Day 7 Mean ± SD
Surrogate 1 27±1°C 23±5 °C 1±1 °C -2 ±1°C n/a1 n/a n/a 13±14°C
Surrogate 2 31±3°C 30±2°C 8±3°C 19±3°C 25±1°C 32±2°C 33±3°C 25±9°C
ISSUES - Harrells 12±2°C 31±1°C 31±2°C 30±3°C n/a n/a n/a 26±10°C
(b) Relative Humidity (%)
Farm Day 1 Day 2 Day 3 Day 4 Day 5 Day 6 Day 7 Mean ± SD
Surrogate 1 82±3% 52±17% 28±3% 33±7% n/a n/a n/a 49±23%
Surrogate 2 46±8% 61±6% 22±5% 80±12% 28±2% 63±5% 58±5% 51±20%
ISSUES - Harrells 44±4% 42±3% 57±6% 51±8% n/a n/a n/a 49±7%
(c) Average wind velocity (m/sec)
Farm Day 1 Day 2 Day 3 Day 4 Day 5 Day 6 Day 7 Mean ± SD
Surrogate 1 2.2±0.6 1.0±0.8 3.0±1.4 1.2±0.4 n/a n/a n/a 1.9±1.2
Surrogate 2 0.6±0.3 1.2±0.3 2.2±0.8 3.7±2.6 2.1±0.8 1.5±0.7 1.7±1.1 1.9±1.0
ISSUES - Harrells 2.4±0.7 1.7±1.2 0.9±0.6 1.6±1.4 n/a n/a n/a
1.6±0.6 (d) Solar irradiation (mW/cm2)
Farm Day 1 Day 2 Day 3 Day 4 Day 5 Day 6 Day 7 Mean ± SD
Surrogate 1 2.4±1.4 7.1±1.3 3.8±0.8 4.3±0.7 n/a n/a n/a 4.4±2.0
Surrogate 2 5.0±1.8 5.4±2.3 5.0±0.5 3.4±2.6 10.3±1.3 6.7±3.7 11.5±0.8 6.8±3.0
ISSUES - Harrells 6.4±0.3 9.3±1.8 5.8±1.5 8.5±2.8 n/a n/a n/a 7.5±1.7
1 not applicable Summary Analysis: The overall results of microbiological analyses of swine waste and the resulting treated effluent showed lower microbial concentrations and therefore, greater reductions of microbes by the ISSUES technology at the Harrells Farm when compared to microbial reductions and remaining concentrations in treated lagoon liquid from the conventional technology on surrogate swine farms. Reductions of microbes by the alternative treatment were significantly greater than they were with the conventional technology. Because there were significantly fewer microbes
Phase 2 OPEN Technology Evaluations - Pathogens 34
remaining in the treated wastes with the alternative water reuse technology than with the conventional technology, the alternative technology would be considered superior on this basis. Environmental soil and vegetation samples were collected from areas where treated wastewater was land applied and in areas on the farm were there had never been spray irrigation of treated wastewater (background samples). There were no statistically significant differences in microbial concentrations associated with background soils, soils and vegetation where there was land application of treated wastewaters at the Harrells farm with the ISSUES technology, or in background and areas of land application at the surrogate farm 2 with conventional waste treatment. This would imply that the ISSUES technology at the Harrells farm is not environmentally superior to conventional waste treatment systems. Additionally, air samples were statistically higher for both total bacteria and fungi in air samples collected downwind of spray irrigation at the Harrells farm when compared to the upwind samples. For the added spray evaporation system over the permeable covered lagoon, air samples analyzed for fecal coliform bacteria (fecal indicator) were 100% positive. These results demonstrate adverse environmental impacts associated with lagoon spray evaporation practices, both over the lagoon and potentially downwind on land of and adjacent to the farm site. However, the frequency of occurrence of airborne fecal microbes was low at the lower farm boundary and similar to that of the conventional technology farms. These results suggest no impact of airborne concentrations of fecal microbes any greater than that of conventional technologies Overall, the frequencies of air samples positive for fecal microbes were similar at the Harrells farm with the ISSUES technology and the surrogate farms. However, concentrations of fecal microbes present in air were statistically lower at the Harrells farm. Based on the concentrations of airborne microbes at the Harrells farm with the ISSUES technology, this alternative treatment technology should be considered superior to the current technologies at the surrogate farms on this basis. Overall, it can be concluded that the Harrells farm with the ISSUES technology may be judged environmentally superior to the surrogate farms because it reduced microbial indicators and the pathogen, Salmonella, in the treated waste effluent to a significantly greater extent as compared to reductions achieved by conventional technologies at the surrogate farms. Although the ISSUES waste treatment system appears to be superior to conventional technologies based on log10 microbial reductions in the waste stream, there are still considerable concentrations of microbial indicators in the treated effluent, which caused measurable environmental impacts in farm air due to spray irrigation/evaporation practices used on this farm site. The spray evaporation system employed over the permeable covered lagoon should not be considered environmentally superior with respect to pathogens because of the high incidence of fecal coliform bacteria in air samples associated with this part of the treatment technology. It is recommended that the farm practices of spray irrigation/evaporation be discontinued in order for this waste management system to be judged consistently environmentally superior to conventional waste management. For other farm sites, there were similar frequencies of airborne fecal contamination at the Harrells and surrogate farms; however, the microbial concentrations were statistically lower at the Harrells farm. Finally, we were unable to collect the necessary number of houseflies at the Harrells farm for assay, which would imply that there were few houseflies present at the site, therefore allowing for the Harrells farm to be considered superior to the surrogate farms with regards to environmental pathogen impacts that may occur due to fly vectors.
Phase 2 OPEN Technology Evaluations - Pathogens 35

14. Evaluation of ISSUES Technology at the Carrolls Farm for Pathogens Project OPEN Science Team for Pathogens
Alternative Technology: Combined in-ground anaerobic digester with aerobic blanket – BioKinetic aeration process for nitrification-denitrification Location: one of three commercial swine production facilities, owned by Murphy-Brown Farms, in Duplin County, North Carolina Period of Operation: The evaluation dates are:
1st field experiment: 03/29/2004 (liquid/solid waste stream only) 2nd field experiment: 04/05/2004 (air only) 3rd field experiment: 06/21/2004 (air and liquid/solid waste stream) 4th field experiment: 06/28/2004 (air only)
Technology Suppliers: Prince Dugba, Ph.D. (Smithfield Foods, 910-296-0795), Joe Pitts and Gordon Pearson (IESS, 843-681-8292), Katie Elmer (Murphy Brown, LLC, 910-293-3434) NCSU Representative PI: Leonard S. Bull (919-515-6836) Statement of Task:
- Measurement of microbial indicator and pathogen concentrations at key points throughout the waste treatment stream of the technology
- Measurement of airborne microbial indicator and pathogen concentrations at selected sites on the farm in close proximity to the treatment system and at the upper and lower property boundaries
- Measurement of microbial indicator and pathogen concentrations within soils from sites where treated waste water was applied, as well as background soil where spray irrigation did not occur (did not spray irrigate during sample periods)
- Microbial measurements were made during two sessions corresponding to a warm and cold season.
- Microbial parameters measured for the waste stream: fecal indicators (fecal coliforms, E. coli, enterococci, spores of Clostridium perfringens, and total coliphages) and the bacterial pathogen Salmonella
- Microbial parameters measured in the air samples: total bacteria, total fungi, bacterial endotoxins, fecal indicators (fecal coliforms, E. coli, spores of Clostridium perfringens, and total coliphages) and the bacterial pathogen Salmonella
- Environmental conditions measured at sample points as air samples were collected: temperature, wind direction and speed, relative humidity, solar irradiance
Measurement of Pathogens: Treatment Technology During the evaluation, the Carrolls #2529 farm was a farrow to finish operation that was converting to a finishing farm. It had two completely separate waste management systems on the farm, with one serving the farrow barns and the other serving the finishing operation. The alternative technology was implemented in conjunction with the waste management system for the finishing operation and a conventional anaerobic lagoon system was left intact for treatment of wastes from the current farrowing operation. This farm had 9 finishing barns capable of housing 6,480 head and 4 barns for gestation, farrowing, nursery, and isolation capable of housing 1,067 sows. The finishing operation, which was the focus of the alternative treatment system, used a flush style system for removal of wastes from the barn. The wastes from the barns were flushed to a primary lagoon, half of which was covered by an “aerobic blanket” system
Phase 2 OPEN Technology Evaluations - Pathogens 36

(ABS). The ABS used treated liquid from the aerobic digester to mist over the lagoon with the goal of reducing odor and nitrogen emissions. Like the other ISSUES projects, this farm had a very complicated flow pattern for wastes from the barns, with only part of the wastes fully treated by the alternative waste management system. Houses 5 through 13 were flushed to the primary lagoon and partially treated wastewater from this lagoon was used to refill the flush tanks for houses 5 through 11 (i.e. equivalent to conventional treatment using a primary anaerobic lagoon system). Part of the liquid from the primary lagoon was then transferred to a second IESS (International Ecological System & Services) aerobic nitrification basin for further treatment (automatic bio-augmentation for enhanced nitrogen and phosphorus removal). A portion of the effluent from this treatment system was then used to recharge the flush tanks for houses 12 and 13. Another portion of this liquid was further aerated in aeration tanks and used for the ABS system. Land application of treated effluents from the primary lagoon occurred as permitted. Microbiological Samples Single grab samples were collected from points within the waste treatment streams to assess the microbial concentrations associated with the technology. Microbial concentrations were quantitatively determined in the waste stream for fecal indicators (fecal coliforms, E. coli, enterococci, spores of Clostridium perfringens, and total coliphages) and the bacterial pathogen, Salmonella. Microbiological assays were performed according to protocols outlined in the Quality Assurance Project Plan (QAPP) prepared by the Pathogens group of the OPEN team. Briefly, fecal coliform, E. coli, and enterococci bacteria were quantitatively (quantally) assayed using biochemically-based microbial culture systems and other microbial indicators were assayed using standard quantitative microbial culture methods. Salmonella was assayed using an accepted quantal most-probable number culture method based on published literature. Air samples were collected at key sites throughout the farm, including at upwind and downwind farm boundaries, adjacent to barn exhaust and near waste management processes where aerosols could be generated. Airborne microbial concentrations were measured for: total (aerobic/heterotrophic) bacteria, total (aerobic/heterotrophic) fungi, spores of C. perfringens, fecal coliforms, E. coli, and Salmonella. Microbiological air sampling was performed using AGI-30 all-glass impingers with sampling at 12.5 LPM for 30 minutes per sample. Each microorganism was analyzed by culture methods described in the QAPP document from the OPEN team. In addition to culturable airborne microorganisms, airborne endotoxins were collected using personal SKC air samplers at approximately 4 LPM for 4 hours. Samples were analyzed by the Limulus amebocyte lysate (LAL) test. Environmental conditions, including temperature, relative humidity (RH), wind velocity, and solar irradiation, were measured and recorded at specific locations and times when microbial air samples were collected. These microbial measurements took place according to the following schedule: Table 14.1. Pathogen Measurement Schedule and Sample Locations at Carrolls Farm Date Samples
Collected Air Samples Analyzed Waste Stream Samples Analyzed
Environmental Samples Analyzed
3/29/2004 -- FF, BF, L1, L2, AS --
4/5/2004 UB, LB, B, AL1, AL2 -- --
6/21/2004 UB, LB, B, AL1, AL2 FF, BF, L1, L2, AS F, SV, BS
6/28/2004 UB, LB, B, AL1, AL2 -- --
UB=upper (upwind) boundary; LB=lower (downwind) boundary; B=barn; AL1= air lagoon 1; AL2= air aeration basin; T=technology; FF=fresh feces; BF=barn flush; L1=lagoon 1; L2=aeration basin; AS=aerated spray; F=flies; SV=spray irrigated soil/vegetation; BS=background soil
Phase 2 OPEN Technology Evaluations - Pathogens 37
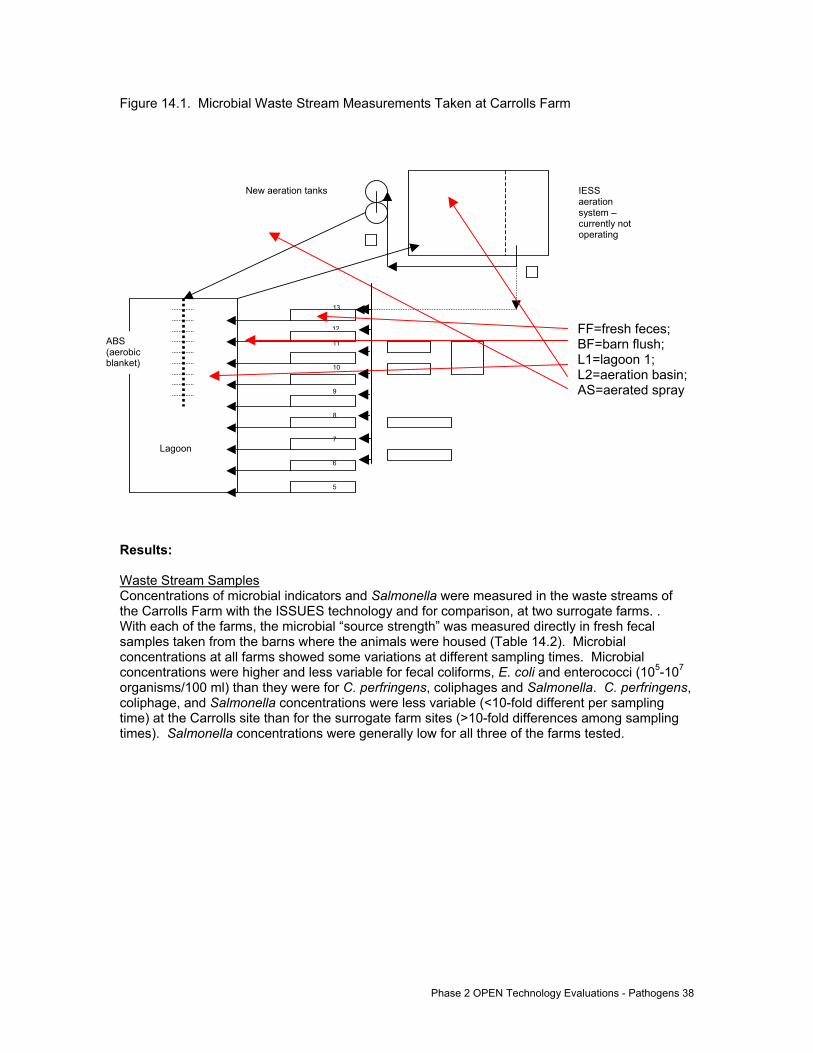
Figure 14.1. Microbial Waste Stream Measurements Taken at Carrolls Farm
IESS aeration system – currently not operating
New aeration tanks
ABS (aerobic blanket)
Lagoon
FF=fresh feces;
13
Results: Waste Stream Samples Concentrations of microbial indicatothe Carrolls Farm with the ISSUESWith each of the farms, the microbisamples taken from the barns wherconcentrations at all farms showedconcentrations were higher and lesorganisms/100 ml) than they were coliphage, and Salmonella concenttime) at the Carrolls site than for thtimes). Salmonella concentrations
12
BF=barn flush; L1=lagoon 1; L2=aeration basin; AS=aerated spray
11
10
9
8
7
6
5
rs and Salmonella were measured in the waste streams of technology and for comparison, at two surrogate farms. . al “source strength” was measured directly in fresh fecal e the animals were housed (Table 14.2). Microbial some variations at different sampling times. Microbial s variable for fecal coliforms, E. coli and enterococci (105-107 for C. perfringens, coliphages and Salmonella. C. perfringens, rations were less variable (<10-fold different per sampling e surrogate farm sites (>10-fold differences among sampling were generally low for all three of the farms tested.
Phase 2 OPEN Technology Evaluations - Pathogens 38
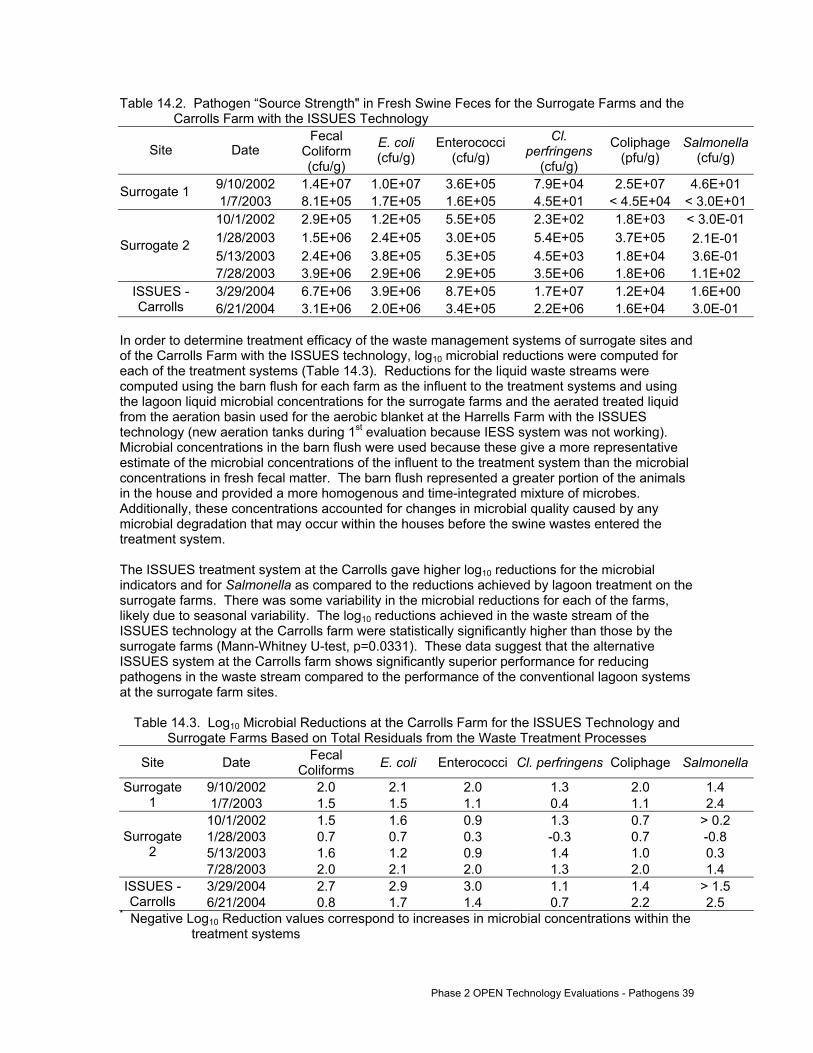
Table 14.2. Pathogen “Source Strength" in Fresh Swine Feces for the Surrogate Farms and the Carrolls Farm with the ISSUES Technology
Site Date Fecal
Coliform (cfu/g)
E. coli (cfu/g)
Enterococci (cfu/g)
Cl. perfringens
(cfu/g)
Coliphage (pfu/g)
Salmonella (cfu/g)
9/10/2002 1.4E+07 1.0E+07 3.6E+05 7.9E+04 2.5E+07 4.6E+01 Surrogate 1 1/7/2003 8.1E+05 1.7E+05 1.6E+05 4.5E+01 < 4.5E+04 < 3.0E+01 10/1/2002 2.9E+05 1.2E+05 5.5E+05 2.3E+02 1.8E+03 < 3.0E-01 1/28/2003 1.5E+06 2.4E+05 3.0E+05 5.4E+05 3.7E+05 2.1E-01 5/13/2003 2.4E+06 3.8E+05 5.3E+05 4.5E+03 1.8E+04 3.6E-01
Surrogate 2
7/28/2003 3.9E+06 2.9E+06 2.9E+05 3.5E+06 1.8E+06 1.1E+02 3/29/2004 6.7E+06 3.9E+06 8.7E+05 1.7E+07 1.2E+04 1.6E+00 ISSUES -
Carrolls 6/21/2004 3.1E+06 2.0E+06 3.4E+05 2.2E+06 1.6E+04 3.0E-01 In order to determine treatment efficacy of the waste management systems of surrogate sites and of the Carrolls Farm with the ISSUES technology, log10 microbial reductions were computed for each of the treatment systems (Table 14.3). Reductions for the liquid waste streams were computed using the barn flush for each farm as the influent to the treatment systems and using the lagoon liquid microbial concentrations for the surrogate farms and the aerated treated liquid from the aeration basin used for the aerobic blanket at the Harrells Farm with the ISSUES technology (new aeration tanks during 1st evaluation because IESS system was not working). Microbial concentrations in the barn flush were used because these give a more representative estimate of the microbial concentrations of the influent to the treatment system than the microbial concentrations in fresh fecal matter. The barn flush represented a greater portion of the animals in the house and provided a more homogenous and time-integrated mixture of microbes. Additionally, these concentrations accounted for changes in microbial quality caused by any microbial degradation that may occur within the houses before the swine wastes entered the treatment system. The ISSUES treatment system at the Carrolls gave higher log10 reductions for the microbial indicators and for Salmonella as compared to the reductions achieved by lagoon treatment on the surrogate farms. There was some variability in the microbial reductions for each of the farms, likely due to seasonal variability. The log10 reductions achieved in the waste stream of the ISSUES technology at the Carrolls farm were statistically significantly higher than those by the surrogate farms (Mann-Whitney U-test, p=0.0331). These data suggest that the alternative ISSUES system at the Carrolls farm shows significantly superior performance for reducing pathogens in the waste stream compared to the performance of the conventional lagoon systems at the surrogate farm sites.
Table 14.3. Log10 Microbial Reductions at the Carrolls Farm for the ISSUES Technology and Surrogate Farms Based on Total Residuals from the Waste Treatment Processes
Site Date Fecal Coliforms E. coli Enterococci Cl. perfringens Coliphage Salmonella
9/10/2002 2.0 2.1 2.0 1.3 2.0 1.4 Surrogate 1 1/7/2003 1.5 1.5 1.1 0.4 1.1 2.4
10/1/2002 1.5 1.6 0.9 1.3 0.7 > 0.2 1/28/2003 0.7 0.7 0.3 -0.3 0.7 -0.8 5/13/2003 1.6 1.2 0.9 1.4 1.0 0.3
Surrogate 2
7/28/2003 2.0 2.1 2.0 1.3 2.0 1.4 3/29/2004 2.7 2.9 3.0 1.1 1.4 > 1.5 ISSUES -
Carrolls 6/21/2004 0.8 1.7 1.4 0.7 2.2 2.5 * Negative Log10 Reduction values correspond to increases in microbial concentrations within the
treatment systems
Phase 2 OPEN Technology Evaluations - Pathogens 39

To better understand the potential environmental impacts from this alternative waste management system, it was important to know the microbial concentrations in the effluent liquids, as these treated effluents contained in the primary lagoon and aeration basin were land applied when weather permitted. The microbial concentrations in the treated effluent liquids that were land applied on the farms are summarized in Table 14.4. The microbial concentrations in the aeration basin from the ISSUES system at the Carrolls farm were statistically significantly lower that those in the primary lagoon at the Carrolls farm and at the surrogate farms (Mann-Whitney U-test, p=0.0147 and 0.0173, respectively). The microbial concentrations in the primary lagoon at the Carrolls farm were statistically similar to those in the conventional anaerobic lagoon systems at the surrogate farms (Mann-Whitney U-test, p=0.1464). These results would imply that the ISSUES system at the Harrells farm produced an effluent from the aeration basin that would have less environmental impacts than an effluent from the surrogate farms with conventional anaerobic lagoon treatment systems. However, there were still relatively high microbial concentrations in this liquid (>1000 to >100,000 fecal coliforms, E. coli or enterococci/100 ml) that may have adverse environmental impacts to soils and vegetation where this was land applied. Table 14.4. Microbial Concentrations in Final Treated Liquids at the Surrogate Farms and at the
Carrolls Farm with the ISSUES Technology
Site Date Fecal
Coliforms (cfu/100mL)
E. coli (cfu/100
mL)
Enterococci(cfu/100mL)
Cl. perfringens (cfu/100mL)
Coliphage(pfu/100
mL)
Salmonella(cfu/100mL)
9/10/2002 2.2E+05 1.1E+05 2.0E+04 1.3E+05 4.5E+04 4.6E+02 Surrogate 1 1/7/2003 2.6E+05 1.6E+05 4.1E+05 4.9E+04 3.1E+05 4.3E+02
10/1/2002 1.3E+05 9.7E+04 2.7E+04 7.0E+04 4.6E+04 4.6E+02 1/28/2003 1.6E+05 1.1E+05 4.4E+05 9.2E+05 3.6E+05 4.6E+02 5/13/2003 2.0E+04 1.0E+04 2.8E+04 2.4E+05 3.2E+04 1.5E+01
Surrogate 2
7/28/2003 4.9E+04 1.9E+04 1.1E+04 2.3E+06 2.0E+04 3.6E+00 3/29/2004 2.4E+05 1.6E+05 9.8E+04 5.4E+06 2.3E+05 2.0E+01 Carrolls –
Lagoon 1 6/21/2004 3.8E+05 2.3E+05 8.4E+04 1.7E+06 5.1E+04 9.3E+01 3/29/2004 6.2E+03 4.1E+03 1.2E+04 5.4E+05 2.2E+04 < 3.0E+00 Carrolls –
aeration basin 6/21/2004 3.9E+03 1.8E+03 4.1E+03 1.1E+05 7.7E+02 4.3E+00
Environmental Samples To assess potential environmental impacts associated with these waste management systems, soils and vegetation from areas of land application of treated effluents, as well as background soils that had never received land application of treated effluents, were collected and assayed for microbial indicators and the pathogen, Salmonella. Microbial concentrations from soils and vegetation where waste residuals were and were not (background sites) land applied at the surrogate farm #2 and the Carrolls site with the ISSUES technology are summarized in Table 14.5. There were no statistically significant differences in soil microbial concentrations at the Carrolls site where treated wastes from the ISSUES system were land applied as compared to the background sites on the farm where land application had never occurred (Mann-Whitney U-test, p=0.4848). There were also no statistically significant differences between microbial concentrations at areas of land application of treated waste residuals at the surrogate farm #2 when compared to areas of land application at the Carrolls site with the ISSUES technology (Mann-Whitney U-test, p=0.7503). As a final comparison, a Kruskal-Wallis test (nonparametric ANOVA) demonstrated no significant differences among microbial concentrations in soils where there was land application at the surrogate farm #2, background soils at the surrogate farm #2, land application at the Harrells site with the ISSUES technology, and background soils at the Harrells farm (p=0.8132). This would suggest that there were no differences in microbial concentrations for any of the soils and that the ISSUES technology had similar environmental impacts to environmental soils where there was land application of treated wastewater effluents as did the surrogate farms with conventional treatment technologies. However, it is noteworthy
Phase 2 OPEN Technology Evaluations - Pathogens 40
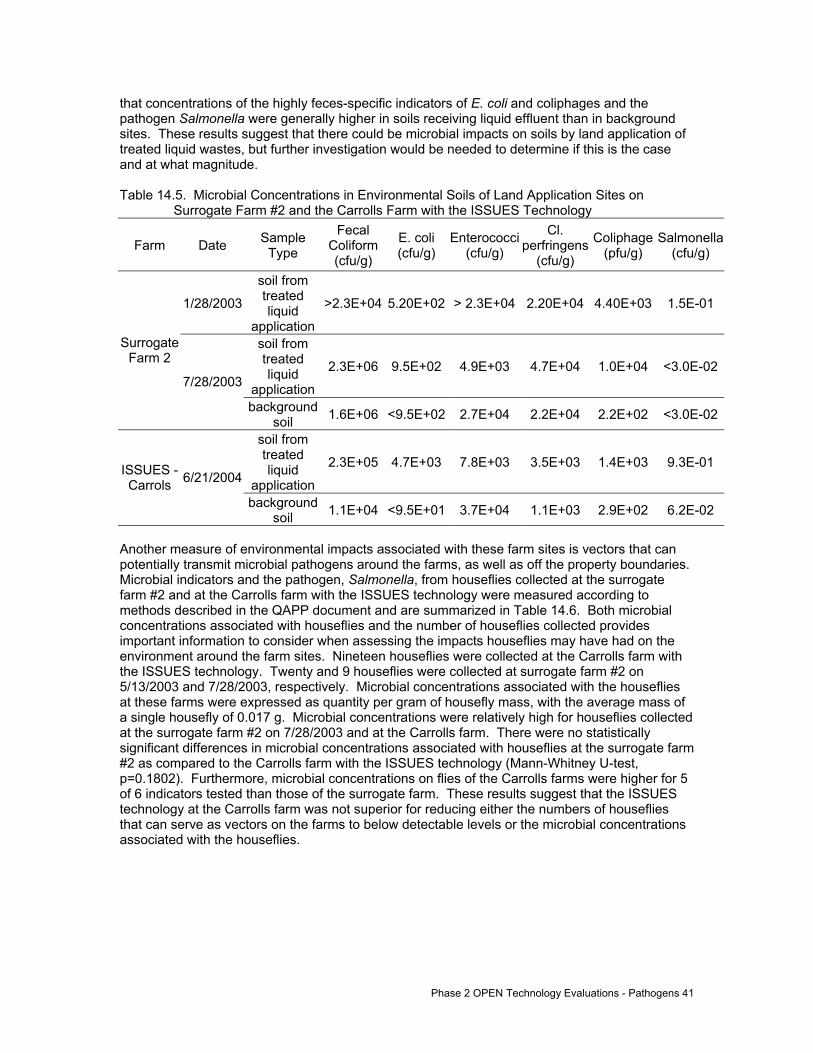
that concentrations of the highly feces-specific indicators of E. coli and coliphages and the pathogen Salmonella were generally higher in soils receiving liquid effluent than in background sites. These results suggest that there could be microbial impacts on soils by land application of treated liquid wastes, but further investigation would be needed to determine if this is the case and at what magnitude. Table 14.5. Microbial Concentrations in Environmental Soils of Land Application Sites on
Surrogate Farm #2 and the Carrolls Farm with the ISSUES Technology
Farm Date Sample Type
Fecal Coliform (cfu/g)
E. coli (cfu/g)
Enterococci (cfu/g)
Cl. perfringens
(cfu/g)
Coliphage (pfu/g)
Salmonella (cfu/g)
1/28/2003
soil from treated liquid
application
>2.3E+04 5.20E+02 > 2.3E+04 2.20E+04 4.40E+03 1.5E-01
soil from treated liquid
application
2.3E+06 9.5E+02 4.9E+03 4.7E+04 1.0E+04 <3.0E-02
Surrogate Farm 2
7/28/2003
background soil 1.6E+06 <9.5E+02 2.7E+04 2.2E+04 2.2E+02 <3.0E-02
soil from treated liquid
application
2.3E+05 4.7E+03 7.8E+03 3.5E+03 1.4E+03 9.3E-01 ISSUES - Carrols 6/21/2004
background soil 1.1E+04 <9.5E+01 3.7E+04 1.1E+03 2.9E+02 6.2E-02
Another measure of environmental impacts associated with these farm sites is vectors that can potentially transmit microbial pathogens around the farms, as well as off the property boundaries. Microbial indicators and the pathogen, Salmonella, from houseflies collected at the surrogate farm #2 and at the Carrolls farm with the ISSUES technology were measured according to methods described in the QAPP document and are summarized in Table 14.6. Both microbial concentrations associated with houseflies and the number of houseflies collected provides important information to consider when assessing the impacts houseflies may have had on the environment around the farm sites. Nineteen houseflies were collected at the Carrolls farm with the ISSUES technology. Twenty and 9 houseflies were collected at surrogate farm #2 on 5/13/2003 and 7/28/2003, respectively. Microbial concentrations associated with the houseflies at these farms were expressed as quantity per gram of housefly mass, with the average mass of a single housefly of 0.017 g. Microbial concentrations were relatively high for houseflies collected at the surrogate farm #2 on 7/28/2003 and at the Carrolls farm. There were no statistically significant differences in microbial concentrations associated with houseflies at the surrogate farm #2 as compared to the Carrolls farm with the ISSUES technology (Mann-Whitney U-test, p=0.1802). Furthermore, microbial concentrations on flies of the Carrolls farms were higher for 5 of 6 indicators tested than those of the surrogate farm. These results suggest that the ISSUES technology at the Carrolls farm was not superior for reducing either the numbers of houseflies that can serve as vectors on the farms to below detectable levels or the microbial concentrations associated with the houseflies.
Phase 2 OPEN Technology Evaluations - Pathogens 41

Table 14.6. Microbial Concentrations in Vectors (House Flies) on the Surrogate Farm #2 and the Carrolls Farm with the ISSUES Technology
Farm Date # Flies Caught
Fecal Coliform (cfu/g)
E. coli (cfu/g)
Enterococci (cfu/g)
Cl. perfringens
(cfu/g)
Coliphage (pfu/g)
Salmonella (cfu/g)
5/13/2003 20 4.4E+03 2.1E+03 > 2.0E+07 5.8E+03 3.0E+02 ND Surrogate 2 7/28/2003 9 3.2E+07 2.4E+07 4.3E+07 1.3E+06 8.8E+05 < 1.8E+03
ISSUES - Carrolls 6/21/2004 19 1.7E+08 1.1E+08 3.1E+08 3.3E+02 > 9.2E+06 > 9.2E+05
ND No Data Average Housefly mass = 0.017g There were no environmental groundwater samples associated with this site collected during the course of this evaluation. It was hoped that the opportunity to further evaluate the full technology and its possible environmental microbial (pathogen) impacts, including groundwater, would come at some future time. However, no such opportunity occurred before the study was completed. On-farm Air Samples Bacteria and Fungi in Air. Concentrations of total (aerobic/heterotrophic) bacteria and total (aerobic/heterotrophic) fungi were measured in air at selected locations on the surrogate farms and on the Carrolls farm with the ISSUES technology (Figures 14.2A and 14.2B). The results for total bacteria concentrations at the Carrolls farm were lower than the corresponding concentrations on the surrogate farms (Figure 12.2A)(Mann-Whitney U-test, p=0.0078). The concentrations of total bacteria were generally in the range of 2 to 4 log10 per cubic meter at all three of these farms. Bacterial concentrations at the surrogate sites and the Carrolls alternative technology site were lowest at the upper (upwind) boundary, higher at the lower (downwind) boundary and highest near exhaust fans and barns. These results indicate increases in airborne bacteria on the farms compared to upwind boundary levels. Figure 14.2. Concentrations (CFU/M3) of airborne bacteria and fungi at the surrogate farms and
at the Carrolls Farm with the ISSUES Technology (UB: upper boundary; LB: lower boundary; B: exhaust fan or near barn; L: lagoon; L2: aeration basin)
23
45
6
UB LB B L UB LB B L UB LB B L L2
surrogate1 surrogate2 Carrolls
log1
0 (T
otal
Bac
teria
)
Graphs by Farm
a. Total Bacteria
As shown in Figure 14.2(b), the levels of fungi in air tended to be higher on both the surrogate farms than those on the Carrolls farm (Mann-Whitney U-test, p=<0.0001). Concentrations were
Phase 2 OPEN Technology Evaluations - Pathogens 42
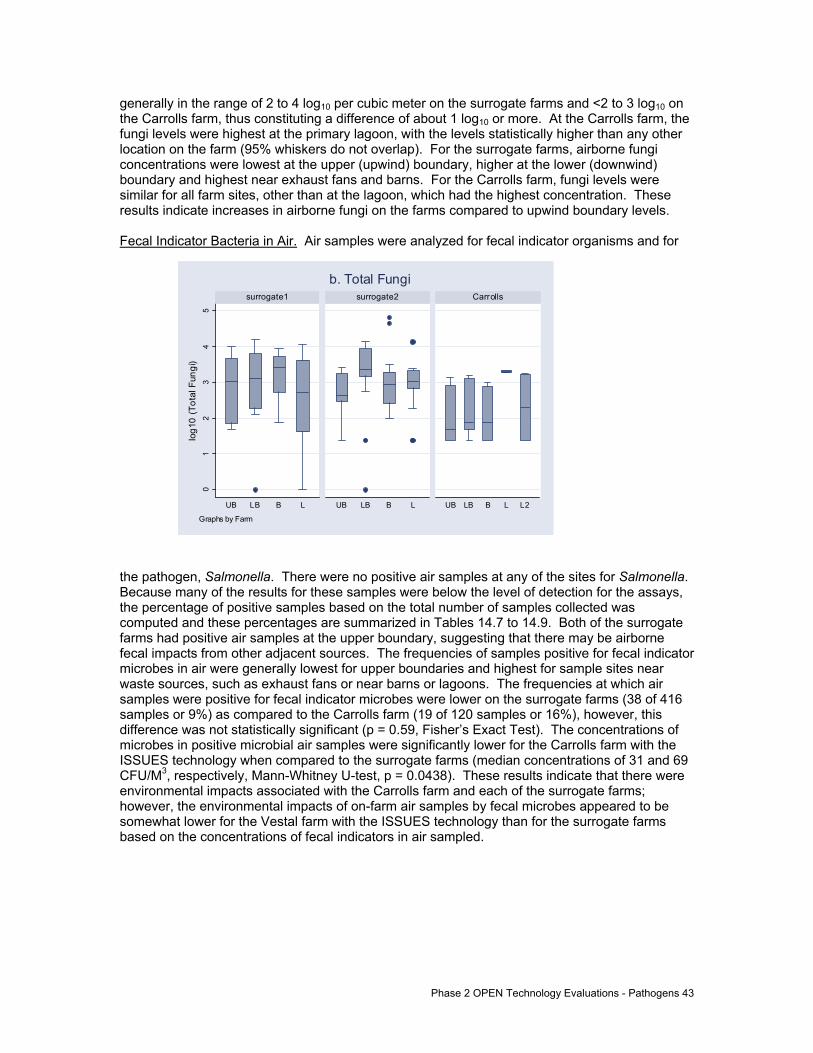
generally in the range of 2 to 4 log10 per cubic meter on the surrogate farms and <2 to 3 log10 on the Carrolls farm, thus constituting a difference of about 1 log10 or more. At the Carrolls farm, the fungi levels were highest at the primary lagoon, with the levels statistically higher than any other location on the farm (95% whiskers do not overlap). For the surrogate farms, airborne fungi concentrations were lowest at the upper (upwind) boundary, higher at the lower (downwind) boundary and highest near exhaust fans and barns. For the Carrolls farm, fungi levels were similar for all farm sites, other than at the lagoon, which had the highest concentration. These results indicate increases in airborne fungi on the farms compared to upwind boundary levels. Fecal Indicator Bacteria in Air. Air samples were analyzed for fecal indicator organisms and for
01
23
45
UB LB B L UB LB B L UB LB B L L2
surrogate1 surrogate2 Carrolls
log1
0 (T
otal
Fun
gi)
Graphs by Farm
b. Total Fungi
the pathogen, Salmonella. There were no positive air samples at any of the sites for Salmonella. Because many of the results for these samples were below the level of detection for the assays, the percentage of positive samples based on the total number of samples collected was computed and these percentages are summarized in Tables 14.7 to 14.9. Both of the surrogate farms had positive air samples at the upper boundary, suggesting that there may be airborne fecal impacts from other adjacent sources. The frequencies of samples positive for fecal indicator microbes in air were generally lowest for upper boundaries and highest for sample sites near waste sources, such as exhaust fans or near barns or lagoons. The frequencies at which air samples were positive for fecal indicator microbes were lower on the surrogate farms (38 of 416 samples or 9%) as compared to the Carrolls farm (19 of 120 samples or 16%), however, this difference was not statistically significant (p = 0.59, Fisher’s Exact Test). The concentrations of microbes in positive microbial air samples were significantly lower for the Carrolls farm with the ISSUES technology when compared to the surrogate farms (median concentrations of 31 and 69 CFU/M3, respectively, Mann-Whitney U-test, p = 0.0438). These results indicate that there were environmental impacts associated with the Carrolls farm and each of the surrogate farms; however, the environmental impacts of on-farm air samples by fecal microbes appeared to be somewhat lower for the Vestal farm with the ISSUES technology than for the surrogate farms based on the concentrations of fecal indicators in air sampled.
Phase 2 OPEN Technology Evaluations - Pathogens 43
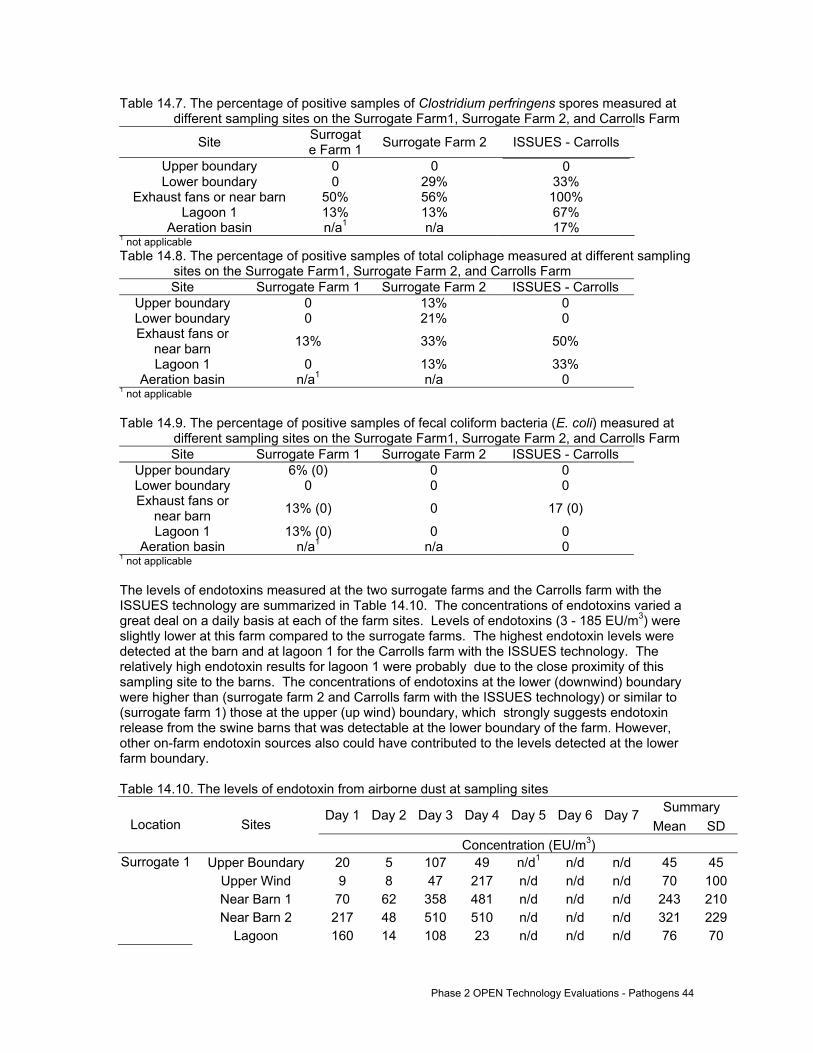
Table 14.7. The percentage of positive samples of Clostridium perfringens spores measured at different sampling sites on the Surrogate Farm1, Surrogate Farm 2, and Carrolls Farm
Site Surrogate Farm 1 Surrogate Farm 2 ISSUES - Carrolls
Upper boundary 0 0 0 Lower boundary 0 29% 33%
Exhaust fans or near barn 50% 56% 100% Lagoon 1 13% 13% 67%
Aeration basin n/a1 n/a 17% 1 not applicable Table 14.8. The percentage of positive samples of total coliphage measured at different sampling
sites on the Surrogate Farm1, Surrogate Farm 2, and Carrolls Farm Site Surrogate Farm 1 Surrogate Farm 2 ISSUES - Carrolls
Upper boundary 0 13% 0 Lower boundary 0 21% 0 Exhaust fans or
near barn 13% 33% 50%
Lagoon 1 0 13% 33% Aeration basin n/a1 n/a 0
1 not applicable Table 14.9. The percentage of positive samples of fecal coliform bacteria (E. coli) measured at
different sampling sites on the Surrogate Farm1, Surrogate Farm 2, and Carrolls Farm Site Surrogate Farm 1 Surrogate Farm 2 ISSUES - Carrolls
Upper boundary 6% (0) 0 0 Lower boundary 0 0 0 Exhaust fans or
near barn 13% (0) 0 17 (0)
Lagoon 1 13% (0) 0 0 Aeration basin n/a1 n/a 0
1 not applicable The levels of endotoxins measured at the two surrogate farms and the Carrolls farm with the ISSUES technology are summarized in Table 14.10. The concentrations of endotoxins varied a great deal on a daily basis at each of the farm sites. Levels of endotoxins (3 - 185 EU/m3) were slightly lower at this farm compared to the surrogate farms. The highest endotoxin levels were detected at the barn and at lagoon 1 for the Carrolls farm with the ISSUES technology. The relatively high endotoxin results for lagoon 1 were probably due to the close proximity of this sampling site to the barns. The concentrations of endotoxins at the lower (downwind) boundary were higher than (surrogate farm 2 and Carrolls farm with the ISSUES technology) or similar to (surrogate farm 1) those at the upper (up wind) boundary, which strongly suggests endotoxin release from the swine barns that was detectable at the lower boundary of the farm. However, other on-farm endotoxin sources also could have contributed to the levels detected at the lower farm boundary. Table 14.10. The levels of endotoxin from airborne dust at sampling sites
Summary Day 1 Day 2 Day 3 Day 4 Day 5 Day 6 Day 7 Mean SD Location Sites
Concentration (EU/m3) Upper Boundary 20 5 107 49 n/d1 n/d n/d 45 45
Upper Wind 9 8 47 217 n/d n/d n/d 70 100 Near Barn 1 70 62 358 481 n/d n/d n/d 243 210 Near Barn 2 217 48 510 510 n/d n/d n/d 321 229
Surrogate 1
Lagoon 160 14 108 23 n/d n/d n/d 76 70
Phase 2 OPEN Technology Evaluations - Pathogens 44

Lower Boundary 5 6 121 47 n/d n/d n/d 45 54 Upper Boundary 1 1 15 31 6 21 2 11 12
Exhaust fan 1 28 312 2940 290 1861 288 55 825 1126Exhaust fan 2 225 n/d 2869 84 n/d n/d n/d 1059 1569
Lagoon 3 2 68 26 13 10 21 20 23 Surrogate 2
Lower Boundary 3 3 97 26 23 30 4 26 33 Upper Boundary 3 5 7 n/d n/d n/d n/d 5 2
Barn 185 35 65 n/d n/d n/d n/d 95 79 Lagoon 1 72 42 43 n/d n/d n/d n/d 52 17
Aeration basin 8 7 7 n/d n/d n/d n/d 8 0
ISSUES - Carrolls
Lower Boundary 21 16 6 n/d n/d n/d n/d 15 7 1 not done; 2 below limit of detection Environmental conditions were recorded simultaneously at the points on the farms where air samples were collected, and these values are summarized in Table 14.11. Temperatures were somewhat variable for the different sample days for each of the farm sites, as would be expected due to the varied seasons of sample collection. Mean relative humidity, mean wind velocity, and mean solar irradiation were similar for each of the farms tested. Table 14.11. Summary of environmental conditions during microbial air sampling at the Surrogate
Farm1, Surrogate Farm 2, and the Carrolls Farm (a) Temperature (°C)
Farm Day 1 Day 2 Day 3 Day 4 Day 5 Day 6 Day 7 Mean ± SD
Surrogate 1 27±1°C 23±5 °C 1±1 °C -2 ±1°C n/a1 n/a n/a 13±14°C
Surrogate 2 31±3°C 30±2°C 8±3°C 19±3°C 25±1°C 32±2°C 33±3°C 25±9°C
ISSUES - Carrolls 12±3°C 29±2°C 29±1°C n/a n/a n/a n/a 23±10°C
(b) Relative Humidity (%)
Farm Day 1 Day 2 Day 3 Day 4 Day 5 Day 6 Day 7 Mean ± SD
Surrogate 1 82±3% 52±17% 28±3% 33±7% n/a n/a n/a 49±23%
Surrogate 2 46±8% 61±6% 22±5% 80±12% 28±2% 63±5% 58±5% 51±20%
ISSUES - Carrolls 29±4% 42±5% 72±4% n/a n/a n/a n/a 48±22%
(c) Average wind velocity (m/sec)
Farm Day 1 Day 2 Day 3 Day 4 Day 5 Day 6 Day 7 Mean ± SD
Surrogate 1 2.2±0.6 1.0±0.8 3.0±1.4 1.2±0.4 n/a n/a n/a 1.9±1.2
Surrogate 2 0.6±0.3 1.2±0.3 2.2±0.8 3.7±2.6 2.1±0.8 1.5±0.7 1.7±1.1 1.9±1.0
ISSUES - Carrolls 4.0±2.0 1.8±0.7 1.6±0.6 n/a n/a n/a n/a 2.5±1.3
(d) Solar irradiation (mW/cm2)
Phase 2 OPEN Technology Evaluations - Pathogens 45

1 not applicable
Farm Day 1 Day 2 Day 3 Day 4 Day 5 Day 6 Day 7 Mean ± SD
Surrogate 1 2.4±1.4 7.1±1.3 3.8±0.8 4.3±0.7 n/a n/a n/a 4.4±2.0
Surrogate 2 5.0±1.8 5.4±2.3 5.0±0.5 3.4±2.6 10.3±1.3 6.7±3.7 11.5±0.8 6.8±3.0
ISSUES - Carrolls 8.4±1.5 10.1±1.2 4.4±1.5 n/a n/a n/a n/a 7.6±2.9
Summary Analysis: The overall results of microbiological analyses of swine waste and treated effluents showed lower microbial concentrations and therefore, greater reductions of microbes by the ISSUES technology at the Carrolls farm when compared to conventional technologies on surrogate swine farms. Reductions of microbes by the alternative treatment were significantly greater than they were with the conventional technology. Because there were significantly fewer microbes remaining in the treated wastes when compared with the conventional technologies, the ISSUES technology would be considered superior on this basis. Environmental soil and vegetation samples were collected from areas where treated wastewater was land applied and in areas on the farm were there had never been spray irrigation of treated wastewater (background samples). There were no statistically significant differences in microbial concentrations associated with background soils, soils and vegetation where there was land application of treated wastewaters at the Carrolls farm with the ISSUES technology, or in background and areas of land application at the surrogate farm 2 with conventional waste treatment. For some fecal microbes there was more frequent presence and higher concentrations in soils that received liquid waste application than those that had not on both surrogate farms and the alternative technology farm. This indicates that the ISSUES technology at the Carrolls farm was not environmentally superior to conventional waste treatment systems based on microbial concentrations in soils at each of the farm sites. Houseflies, that may serve as vectors for transporting microbial contaminants both on- and off-farm, were collected at the Carrolls farm with the ISSUES technology and a surrogate farm. At many of the other sites, there were too few houseflies collected for assay, which implies that the concentrations of houseflies were higher on this farm as compared to other farms. Microbial concentrations were generally higher but not statistically significantly higher for houseflies collected at the Carrolls farm with the ISSUES technology as compared to microbial concentrations associated with houseflies from the surrogate farm. Based on these results for concentrations of houseflies on the farms and for microbial concentrations on the houseflies, the ISSUES technology at the Carrolls farm was not environmentally superior to the surrogate farms with conventional waste management systems. The frequencies of samples positive for fecal microbes were higher at the Carrolls farm with the ISSUES technology as compared with the surrogate farms, but not statistically significantly higher. However, concentrations of fecal microbes present in air were statistically significantly lower at the Carrolls farm. Based on these results, the Carrolls farm with the ISSUES technology should be considered equivalent to the current technologies at the surrogate farms on the basis of airborne microbe environmental impacts. Overall, it can be concluded that the Carrolls farm with the ISSUES technology may be judged environmentally superior to the surrogate farms because it reduced microbial indicators and the pathogen, Salmonella, in the treated waste effluent to a significantly greater extent as compared to reductions achieved by conventional technologies at the surrogate farms. Although the ISSUES waste treatment system appeared to be superior to conventional technologies based on log10 microbial reductions in the waste stream, there were still considerable concentrations of
Phase 2 OPEN Technology Evaluations - Pathogens 46

microbial indicators in the treated effluent. These microbes remaining in treated liquid effluent caused measurable microbial impacts on soil in environmental areas of spray irrigation implemented on this farm site as well as on surrogate farms. The farm practices of spray irrigation should be taken into consideration in making the decision about whether or not this waste management system is judged environmentally superior to conventional waste management. There were higher frequencies of airborne fecal contamination at the Carrolls alternative technology farm as compared to the surrogate farms; however, the microbial concentrations were statistically significantly lower at the Carrolls farm. Vectors collected at the Carrolls farm were similar both in numbers and microbial concentrations to those collected at the surrogate farms, based on statistical analyses. However, microbial concentrations on files from the Carrolls site were higher than those for the surrogate site for 5 of the 6 fecal microbes tested. Based collectively on this information, the ISSUES technology shows promise for being environmentally superior because it significantly reduced microbial contaminants in the waste stream; however, the waste management system as operated at the Carrolls farm cannot be judged environmentally superior based on environmental impacts to air, vectors, and soils from the farm. This interpretation of environmental impacts of the alternative technology compared to the conventional technology is made with an important caveat. This caveat is about microbial source attribution resulting from the dual presence of both the alternative and conventional technologies on the same farm. The presence of both technologies makes it difficult if not impossible to attribute environmental microbial impacts from one or the other technology or the combined effects of both.
Phase 2 OPEN Technology Evaluations - Pathogens 47
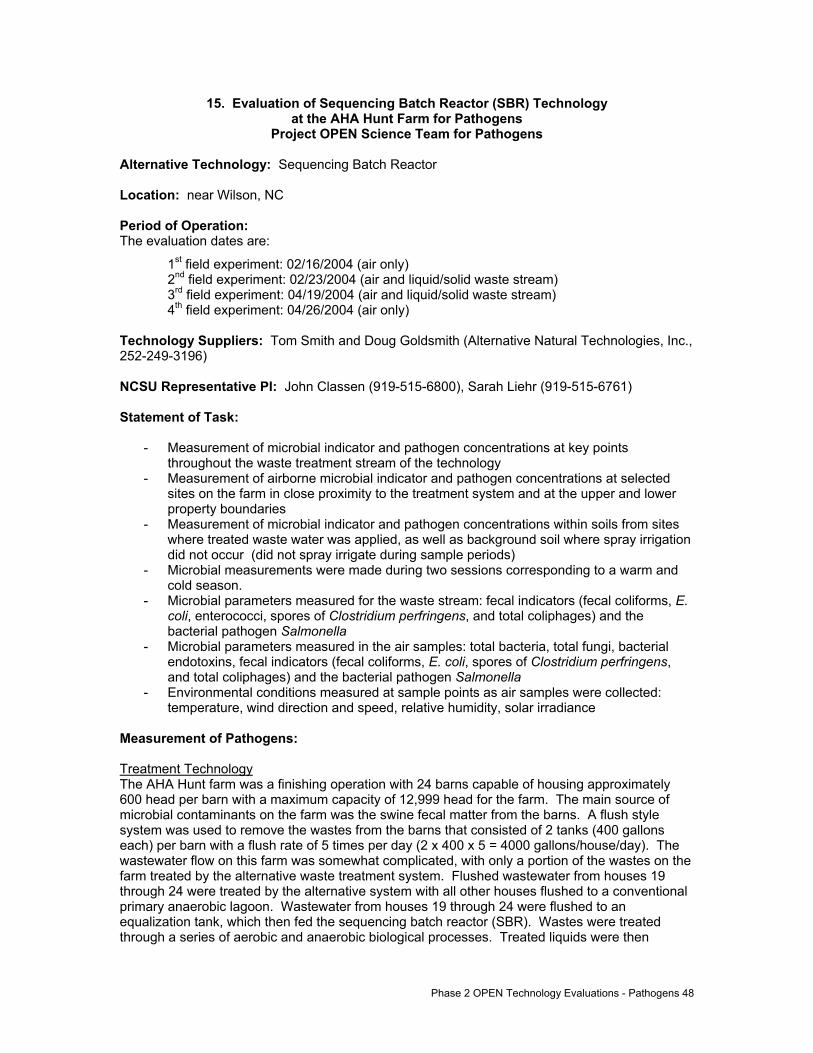
15. Evaluation of Sequencing Batch Reactor (SBR) Technology at the AHA Hunt Farm for Pathogens
Project OPEN Science Team for Pathogens Alternative Technology: Sequencing Batch Reactor Location: near Wilson, NC Period of Operation: The evaluation dates are:
1st field experiment: 02/16/2004 (air only) 2nd field experiment: 02/23/2004 (air and liquid/solid waste stream) 3rd field experiment: 04/19/2004 (air and liquid/solid waste stream) 4th field experiment: 04/26/2004 (air only)
Technology Suppliers: Tom Smith and Doug Goldsmith (Alternative Natural Technologies, Inc., 252-249-3196) NCSU Representative PI: John Classen (919-515-6800), Sarah Liehr (919-515-6761) Statement of Task:
- Measurement of microbial indicator and pathogen concentrations at key points throughout the waste treatment stream of the technology
- Measurement of airborne microbial indicator and pathogen concentrations at selected sites on the farm in close proximity to the treatment system and at the upper and lower property boundaries
- Measurement of microbial indicator and pathogen concentrations within soils from sites where treated waste water was applied, as well as background soil where spray irrigation did not occur (did not spray irrigate during sample periods)
- Microbial measurements were made during two sessions corresponding to a warm and cold season.
- Microbial parameters measured for the waste stream: fecal indicators (fecal coliforms, E. coli, enterococci, spores of Clostridium perfringens, and total coliphages) and the bacterial pathogen Salmonella
- Microbial parameters measured in the air samples: total bacteria, total fungi, bacterial endotoxins, fecal indicators (fecal coliforms, E. coli, spores of Clostridium perfringens, and total coliphages) and the bacterial pathogen Salmonella
- Environmental conditions measured at sample points as air samples were collected: temperature, wind direction and speed, relative humidity, solar irradiance
Measurement of Pathogens: Treatment Technology The AHA Hunt farm was a finishing operation with 24 barns capable of housing approximately 600 head per barn with a maximum capacity of 12,999 head for the farm. The main source of microbial contaminants on the farm was the swine fecal matter from the barns. A flush style system was used to remove the wastes from the barns that consisted of 2 tanks (400 gallons each) per barn with a flush rate of 5 times per day (2 x 400 x 5 = 4000 gallons/house/day). The wastewater flow on this farm was somewhat complicated, with only a portion of the wastes on the farm treated by the alternative waste treatment system. Flushed wastewater from houses 19 through 24 were treated by the alternative system with all other houses flushed to a conventional primary anaerobic lagoon. Wastewater from houses 19 through 24 were flushed to an equalization tank, which then fed the sequencing batch reactor (SBR). Wastes were treated through a series of aerobic and anaerobic biological processes. Treated liquids were then
Phase 2 OPEN Technology Evaluations - Pathogens 48

discharged from the system to the primary lagoon. From the primary lagoon, all of the wastes (from barns 1 through 18 and from the SBR system) were moved to a secondary lagoon and treated wastewater from the secondary lagoon was used to refill the flush tanks for all of the barns on the farm. Treated wastewater from the primary lagoon was land applied as permitted. Microbiological Samples Single grab samples were collected from key points within the waste treatment streams to assess the microbial concentrations associated with the technology. Microbial concentrations were quantitatively determined in the waste stream for fecal indicators (fecal coliforms, E. coli, enterococci, spores of Clostridium perfringens, and total coliphages) and the bacterial pathogen, Salmonella. Microbiological assays were performed according to protocols outlined in the Quality Assurance Project Plan (QAPP) prepared by the Pathogens group of the OPEN team. Briefly, fecal coliform, E. coli, and enterococci bacteria were quantified using biochemically-based microbial culture assay systems in a quantal (multiwell) format and other microbial indicators were assayed using standard quantitative microbial culture methods. Salmonella was quantitatively assayed using an accepted quantal, most-probable number culture method based on published literature. Air samples were collected at key sites throughout the farm, including upwind and downwind boundaries, adjacent to barn air exhaust and near waste management operations. Airborne microbial concentrations were measured and included total (aerobic/heterotrophic) bacteria, total (aerobic/heterotrophic) fungi, spores of C. perfringens, fecal coliforms, E. coli, and Salmonella. Microbiological air sampling was performed using AGI-30 all-glass impingers with sampling at 12.5 LPM for 30 minutes per sample. Each microorganism was analyzed by culture methods described in the QAPP document from the OPEN team. In addition to culturable airborne microorganisms, airborne endotoxins were collected using personal SKC air samplers at approximately 4 LPM for 4 hours. Samples were analyzed by the Limulus amebocyte lysate (LAL) test. Environmental conditions, including temperature, relative humidity (RH), wind velocity, and solar irradiation, were measured and recorded at specific locations and times when microbial air samples were collected. These microbial measurements took place according to the following schedule: Table 15.1. Pathogen Measurement Schedule and Sample Locations for the SBR Technology at
the AHA Hunt Farm Date Samples
Collected Air Samples Analyzed Waste Stream Samples Analyzed
Environmental Samples Analyzed
2/16/2004 UB, LB, B, L, T -- --
2/23/2004 UB, LB, B, L, T FF, BF, EE, SE, SB, L1, L2 --
4/19/2004 UB, LB, B, L, T FF, BF, EE, SE, SB, L1, L2 --
4/26/2004 UB, LB, B, L, T -- --
UB=upper (upwind) boundary; LB=lower (downwind) boundary; B=barn; L=lagoon; T=technology; FF=fresh feces; BF=barn flush; EE=equalization tank effluent; SE=SBR effluent; SB=SBR bacteria/activated sludge; L1=lagoon 1; L2= lagoon 2
Phase 2 OPEN Technology Evaluations - Pathogens 49
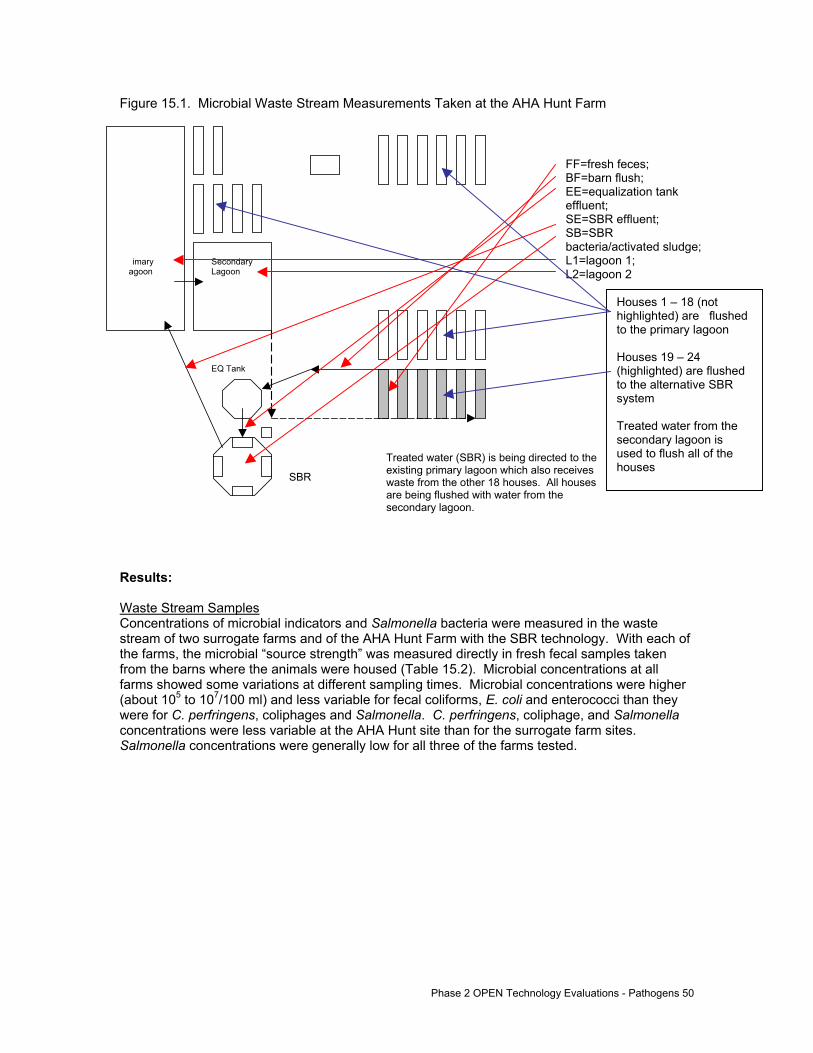
Figure 15.1. Microbial Waste Stream Measurements Taken at the AHA Hunt Farm Pr L
Secondary Lagoon
imary agoon
SBR
EQ Tank
Treated water (SBR) is being directed to the existing primary lagoon which also receives waste from the other 18 houses. All houses are being flushed with water from the secondary lagoon.
FF=fresh feces; BF=barn flush; EE=equalization tank effluent; SE=SBR effluent; SB=SBR bacteria/activated sludge; L1=lagoon 1; L2=lagoon 2
Houses 1 – 18 highlighted) arto the primary l Houses 19 – 24 (highlighted) arto the alternativsystem Treated water frsecondary lagoused to flush alhouses
(not e flushed agoon
e flushed e SBR
om the on is l of the
Results: Waste Stream Samples Concentrations of microbial indicators and Salmonella bacteria were measured in the waste stream of two surrogate farms and of the AHA Hunt Farm with the SBR technology. With each of the farms, the microbial “source strength” was measured directly in fresh fecal samples taken from the barns where the animals were housed (Table 15.2). Microbial concentrations at all farms showed some variations at different sampling times. Microbial concentrations were higher (about 105 to 107/100 ml) and less variable for fecal coliforms, E. coli and enterococci than they were for C. perfringens, coliphages and Salmonella. C. perfringens, coliphage, and Salmonella concentrations were less variable at the AHA Hunt site than for the surrogate farm sites. Salmonella concentrations were generally low for all three of the farms tested.
Phase 2 OPEN Technology Evaluations - Pathogens 50
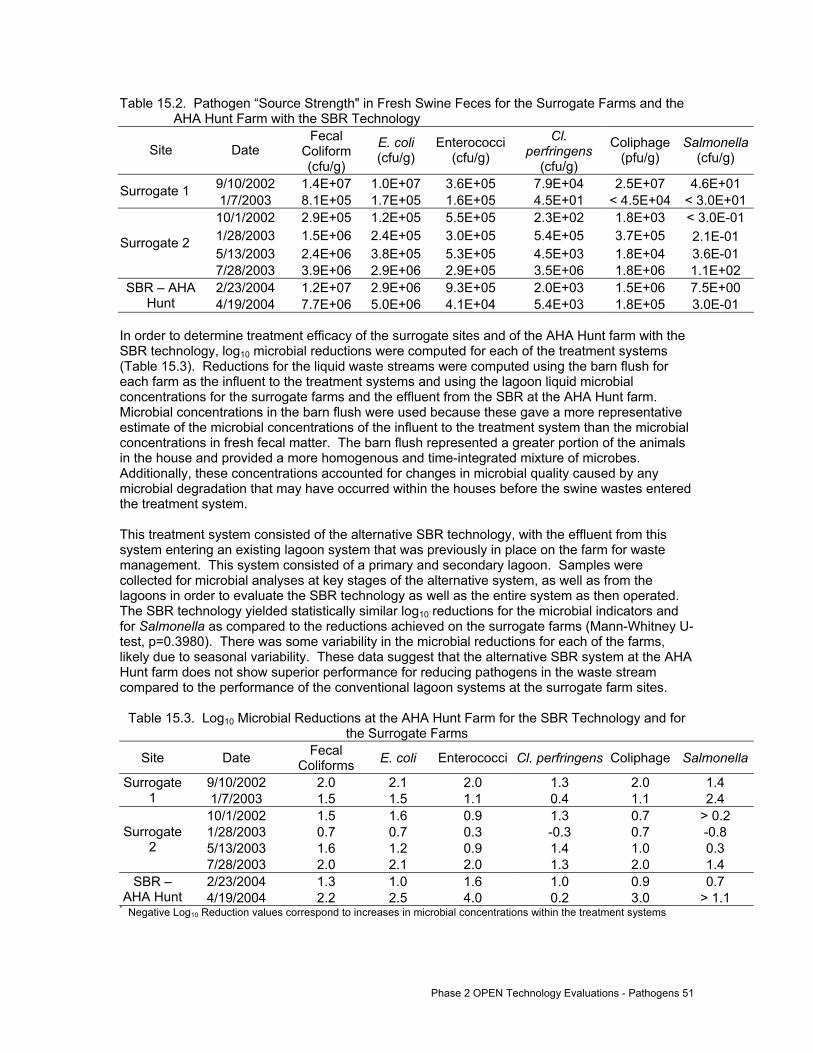
Table 15.2. Pathogen “Source Strength" in Fresh Swine Feces for the Surrogate Farms and the AHA Hunt Farm with the SBR Technology
Site Date Fecal
Coliform (cfu/g)
E. coli (cfu/g)
Enterococci (cfu/g)
Cl. perfringens
(cfu/g)
Coliphage (pfu/g)
Salmonella (cfu/g)
9/10/2002 1.4E+07 1.0E+07 3.6E+05 7.9E+04 2.5E+07 4.6E+01 Surrogate 1 1/7/2003 8.1E+05 1.7E+05 1.6E+05 4.5E+01 < 4.5E+04 < 3.0E+01 10/1/2002 2.9E+05 1.2E+05 5.5E+05 2.3E+02 1.8E+03 < 3.0E-01 1/28/2003 1.5E+06 2.4E+05 3.0E+05 5.4E+05 3.7E+05 2.1E-01 5/13/2003 2.4E+06 3.8E+05 5.3E+05 4.5E+03 1.8E+04 3.6E-01
Surrogate 2
7/28/2003 3.9E+06 2.9E+06 2.9E+05 3.5E+06 1.8E+06 1.1E+02 2/23/2004 1.2E+07 2.9E+06 9.3E+05 2.0E+03 1.5E+06 7.5E+00 SBR – AHA
Hunt 4/19/2004 7.7E+06 5.0E+06 4.1E+04 5.4E+03 1.8E+05 3.0E-01 In order to determine treatment efficacy of the surrogate sites and of the AHA Hunt farm with the SBR technology, log10 microbial reductions were computed for each of the treatment systems (Table 15.3). Reductions for the liquid waste streams were computed using the barn flush for each farm as the influent to the treatment systems and using the lagoon liquid microbial concentrations for the surrogate farms and the effluent from the SBR at the AHA Hunt farm. Microbial concentrations in the barn flush were used because these gave a more representative estimate of the microbial concentrations of the influent to the treatment system than the microbial concentrations in fresh fecal matter. The barn flush represented a greater portion of the animals in the house and provided a more homogenous and time-integrated mixture of microbes. Additionally, these concentrations accounted for changes in microbial quality caused by any microbial degradation that may have occurred within the houses before the swine wastes entered the treatment system. This treatment system consisted of the alternative SBR technology, with the effluent from this system entering an existing lagoon system that was previously in place on the farm for waste management. This system consisted of a primary and secondary lagoon. Samples were collected for microbial analyses at key stages of the alternative system, as well as from the lagoons in order to evaluate the SBR technology as well as the entire system as then operated. The SBR technology yielded statistically similar log10 reductions for the microbial indicators and for Salmonella as compared to the reductions achieved on the surrogate farms (Mann-Whitney U-test, p=0.3980). There was some variability in the microbial reductions for each of the farms, likely due to seasonal variability. These data suggest that the alternative SBR system at the AHA Hunt farm does not show superior performance for reducing pathogens in the waste stream compared to the performance of the conventional lagoon systems at the surrogate farm sites.
Table 15.3. Log10 Microbial Reductions at the AHA Hunt Farm for the SBR Technology and for the Surrogate Farms
Site Date Fecal Coliforms E. coli Enterococci Cl. perfringens Coliphage Salmonella
9/10/2002 2.0 2.1 2.0 Surrogate 1
1.5 1.6
7/28/2003 2.0
1.3 2.0 1.4 1/7/2003 1.5 1.5 1.1 0.4 1.1 2.4 10/1/2002 0.9 1.3 0.7 > 0.2 1/28/2003 0.7 0.7 0.3 -0.3 0.7 -0.8 5/13/2003 1.6 1.2 0.9 1.4 1.0 0.3
Surrogate 2
2.1 2.0 1.3 2.0 1.4 2/23/2004 1.3 1.0 1.6 1.0 0.9 0.7 SBR –
AHA Hunt 4/19/2004 2.2 2.5 4.0 0.2 3.0 > 1.1 * Negative Log10 Reduction values correspond to increases in microbial concentrations within the treatment systems
Phase 2 OPEN Technology Evaluations - Pathogens 51
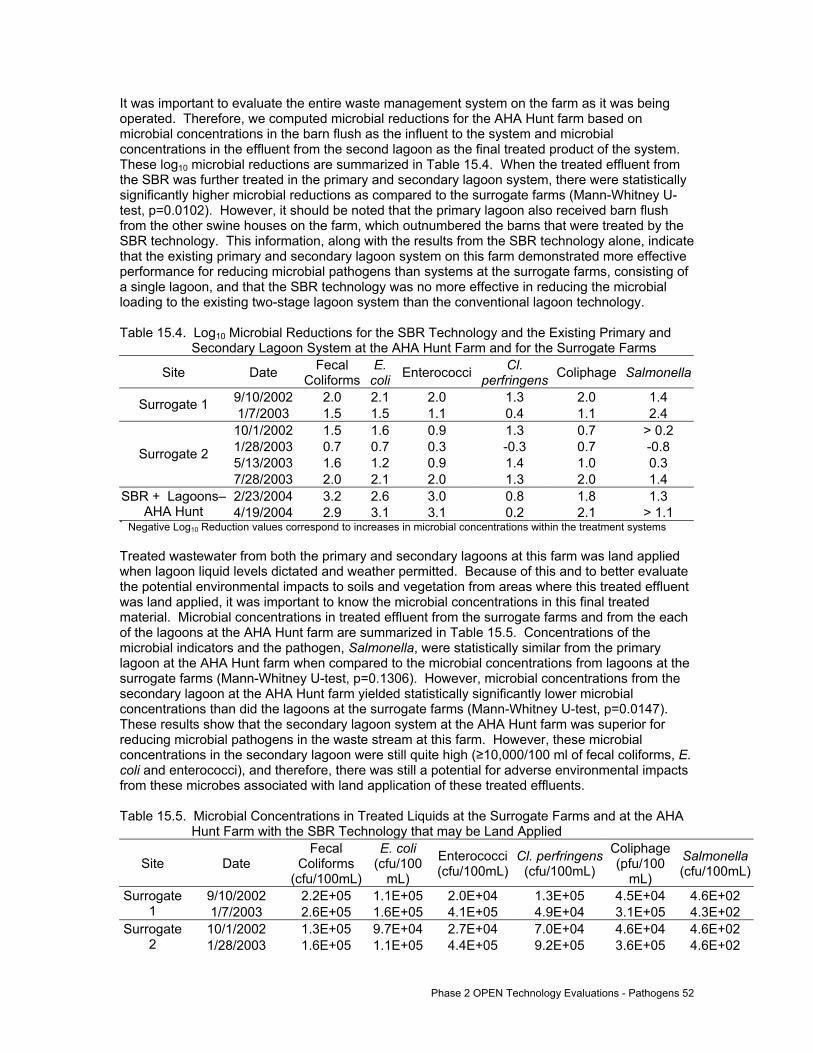
It was important to evaluate the entire waste management system on the farm as it was being operated. Therefore, we computed microbial reductions for the AHA Hunt farm based on microbial concentrations in the barn flush as the influent to the system and microbial concentrations in the effluent from the second lagoon as the final treated product of the system. These log10 microbial reductions are summarized in Table 15.4. When the treated effluent from the SBR was further treated in the primary and secondary lagoon system, there were statistically significantly higher microbial reductions as compared to the surrogate farms (Mann-Whitney U-test, p=0.0102). However, it should be noted that the primary lagoon also received barn flush from the other swine houses on the farm, which outnumbered the barns that were treated by the SBR technology. This information, along with the results from the SBR technology alone, indicate that the existing primary and secondary lagoon system on this farm demonstrated more effective performance for reducing microbial pathogens than systems at the surrogate farms, consisting of a single lagoon, and that the SBR technology was no more effective in reducing the microbial loading to the existing two-stage lagoon system than the conventional lagoon technology. Table 15.4. Log10 Microbial Reductions for the SBR Technology and the Existing Primary and
Secondary Lagoon System at the AHA Hunt Farm and for the Surrogate Farms
Site Date Fecal Coliforms
E. coli Enterococci Cl.
perfringens Coliphage Salmonella
1.2 0.9 1.4 1.0
9/10/2002 2.0 2.1 2.0 1.3 2.0 1.4 Surrogate 1 1/7/2003 1.5 1.5 1.1 0.4 1.1 2.4 10/1/2002 1.5 1.6 0.9 1.3 0.7 > 0.2 1/28/2003 0.7 0.7 0.3 -0.3 0.7 -0.8 5/13/2003 1.6
Surrogate 2 0.3
7/28/2003 2.0 2.1 2.0 1.3 2.0 1.4 2/23/2004 3.2 2.6 3.0 0.8 1.8 1.3 SBR + Lagoons–
AHA Hunt 4/19/2004 2.9 3.1 3.1 0.2 2.1 > 1.1 * Negative Log10 Reduction values correspond to increases in microbial concentrations within the treatment systems Treated wastewater from both the primary and secondary lagoons at this farm was land applied when lagoon liquid levels dictated and weather permitted. Because of this and to better evaluate the potential environmental impacts to soils and vegetation from areas where this treated effluent was land applied, it was important to know the microbial concentrations in this final treated material. Microbial concentrations in treated effluent from the surrogate farms and from the each of the lagoons at the AHA Hunt farm are summarized in Table 15.5. Concentrations of the microbial indicators and the pathogen, Salmonella, were statistically similar from the primary lagoon at the AHA Hunt farm when compared to the microbial concentrations from lagoons at the surrogate farms (Mann-Whitney U-test, p=0.1306). However, microbial concentrations from the secondary lagoon at the AHA Hunt farm yielded statistically significantly lower microbial concentrations than did the lagoons at the surrogate farms (Mann-Whitney U-test, p=0.0147). These results show that the secondary lagoon system at the AHA Hunt farm was superior for reducing microbial pathogens in the waste stream at this farm. However, these microbial concentrations in the secondary lagoon were still quite high (≥10,000/100 ml of fecal coliforms, E. coli and enterococci), and therefore, there was still a potential for adverse environmental impacts from these microbes associated with land application of these treated effluents. Table 15.5. Microbial Concentrations in Treated Liquids at the Surrogate Farms and at the AHA
Hunt Farm with the SBR Technology that may be Land Applied
Site Date Fecal
Coliforms (cfu/100mL)
E. coli (cfu/100
mL)
Enterococci(cfu/100mL)
Cl. perfringens (cfu/100mL)
Coliphage(pfu/100
mL)
Salmonella(cfu/100mL)
9/10/2002 2.2E+05 1.1E+05 2.0E+04 1.3E+05 4.5E+04 4.6E+02 Surrogate 1 1/7/2003 2.6E+05 1.6E+05 4.1E+05 4.9E+04 3.1E+05 4.3E+02
10/1/2002 1.3E+05 9.7E+04 2.7E+04 7.0E+04 4.6E+04 4.6E+02 Surrogate 2 1/28/2003 1.6E+05 1.1E+05 4.4E+05 9.2E+05 3.6E+05 4.6E+02
Phase 2 OPEN Technology Evaluations - Pathogens 52
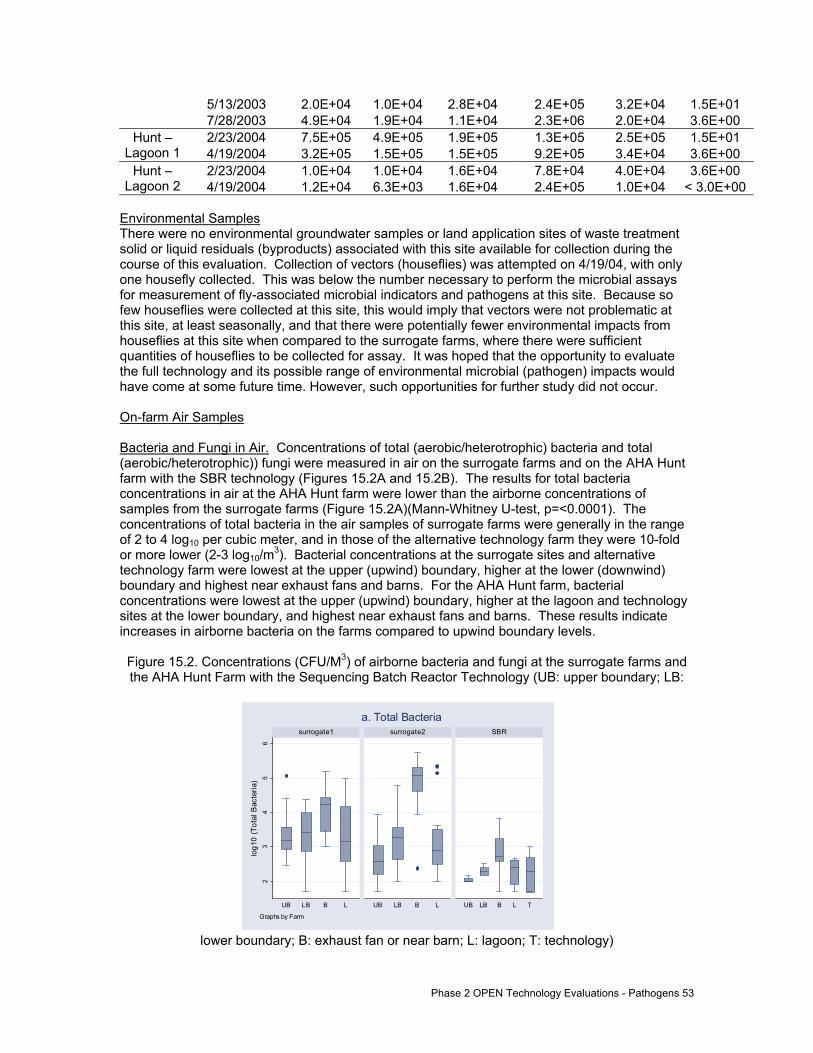
5/13/2003 2.0E+04 1.0E+04 2.8E+04 2.4E+05 3.2E+04 1.5E+01 7/28/2003 4.9E+04 1.9E+04 1.1E+04 2.3E+06 2.0E+04 3.6E+00 2/23/2004 7.5E+05 4.9E+05 1.9E+05 1.3E+05 2.5E+05 1.5E+01 Hunt –
Lagoon 1 4/19/2004 3.2E+05 1.5E+05 1.5E+05 9.2E+05 3.4E+04 3.6E+00 2/23/2004 1.0E+04 1.0E+04 1.6E+04 7.8E+04 4.0E+04 3.6E+00 Hunt –
Lagoon 2 4/19/2004 1.2E+04 6.3E+03 1.6E+04 2.4E+05 1.0E+04 < 3.0E+00
Environmental Samples There were no environmental groundwater samples or land application sites of waste treatment solid or liquid residuals (byproducts) associated with this site available for collection during the course of this evaluation. Collection of vectors (houseflies) was attempted on 4/19/04, with only one housefly collected. This was below the number necessary to perform the microbial assays for measurement of fly-associated microbial indicators and pathogens at this site. Because so few houseflies were collected at this site, this would imply that vectors were not problematic at this site, at least seasonally, and that there were potentially fewer environmental impacts from houseflies at this site when compared to the surrogate farms, where there were sufficient quantities of houseflies to be collected for assay. It was hoped that the opportunity to evaluate the full technology and its possible range of environmental microbial (pathogen) impacts would have come at some future time. However, such opportunities for further study did not occur. On-farm Air Samples Bacteria and Fungi in Air. Concentrations of total (aerobic/heterotrophic) bacteria and total (aerobic/heterotrophic)) fungi were measured in air on the surrogate farms and on the AHA Hunt farm with the SBR technology (Figures 15.2A and 15.2B). The results for total bacteria concentrations in air at the AHA Hunt farm were lower than the airborne concentrations of samples from the surrogate farms (Figure 15.2A)(Mann-Whitney U-test, p=<0.0001). The concentrations of total bacteria in the air samples of surrogate farms were generally in the range of 2 to 4 log10 per cubic meter, and in those of the alternative technology farm they were 10-fold or more lower (2-3 log10/m3). Bacterial concentrations at the surrogate sites and alternative technology farm were lowest at the upper (upwind) boundary, higher at the lower (downwind) boundary and highest near exhaust fans and barns. For the AHA Hunt farm, bacterial concentrations were lowest at the upper (upwind) boundary, higher at the lagoon and technology sites at the lower boundary, and highest near exhaust fans and barns. These results indicate increases in airborne bacteria on the farms compared to upwind boundary levels. Figure 15.2. Concentrations (CFU/M3) of airborne bacteria and fungi at the surrogate farms and the AHA Hunt Farm with the Sequencing Batch Reactor Technology (UB: upper boundary; LB:
lower boundary; B: exhaust fan or near barn; L: lagoon; T: technology)
23
45
6
UB LB B L UB LB B L UB LB B L T
surrogate1 surrogate2 SBR
log1
0 (T
otal
Bac
teria
)
Graphs by Farm
a. Total Bacteria
Phase 2 OPEN Technology Evaluations - Pathogens 53
As shown in Figure 15.2(b), the levels of fungi in air tended to be higher on both the surrogate farms compared to corresponding concentrations at the AHA Hunt farm (Mann-Whitney U-test, p=<0.0001). Concentrations were generally in the range of 2 to 4 log10 per cubic meter in surrogate farm samples and 1-2 log10 in alternative technology farm samples. In general, airborne fungi concentrations at the surrogate farms were lowest at the upper (upwind) boundary, higher at the lower (downwind) boundary and highest near exhaust fans and barns. Fungi levels at the AHA Hunt farm were highest near the technology and barns and similar for other sites on the farm. These results indicate increases in airborne fungi on the farms compared to upwind boundary levels.
01
23
45
UB LB B L UB LB B L UB LB B L T
surrogate1 surrogate2 SBR
log1
0 (T
otal
Fun
gi)
Graphs by Farm
b. Total Fungi
Fecal Indicator Bacteria in Air. Air samples were analyzed for fecal indicator organisms and for the pathogen, Salmonella. There were no positive air samples at any of the sites for Salmonella. Because many of the results for these samples were below the level of detection for the assays, the percentage of positive samples based on the total number of samples collected was computed and these percentages are summarized in Tables 15.6 to 15.8. Both of the surrogate farms had positive air samples at the upper boundary, suggesting that there may be airborne fecal impacts from other adjacent sources. The frequencies of samples positive for fecal indicator microbes in air were generally lowest for upper boundaries and highest for sample sites near waste sources, such as exhaust fans or near barns, lagoons, or the technology. The frequencies at which air samples were positive for fecal indicator microbes were significantly higher on the surrogate farms (38 of 416 samples or 9.1%) as compared to the AHA Hunt farm with the SBR technology (5 of 200 samples or 2.5%), with p = 0.002 by Fisher’s exact test.. However, the concentrations of microbes in positive microbial air samples were statistically similar for the AHA Hunt farm with the SBR technology when compared to the surrogate farms (median concentrations of 31 and 69 CFU/M3, respectively, Mann-Whitney U-test, p = 0.0689). These results indicate that there are somewhat lower environmental impacts at the AHA Hunt farm as compared with the surrogate farms with regards to airborne fecal contamination frequency (2.5% versus 9.1%) but not for airborne concentrations of positive samples. Table 15.6. The percentage of positive samples of Clostridium perfringens spores measured at
different sampling sites on the Surrogate Farm1, Surrogate Farm 2, and AHA Hunt Farm Site Surrogate Farm 1 Surrogate Farm 2 SBR – AHA Hunt
Upper boundary 0 0 0 Lower boundary 0 29% 0 Exhaust fans or 50% 56% 0
Phase 2 OPEN Technology Evaluations - Pathogens 54
near barn Lagoon 13% 13% 0
Technology n/a 1 n/a not applicable
Table 15.7. The percentage of positive samples of total coliphage measured at different sampling
sites on the Surrogate Farm1, Surrogate Farm 2, and AHA Hunt Farm
0 1
Site Surrogate Farm 1 Surrogate Farm 2 SBR – AHA Hunt Upper boundary 0 13% 0 Lower boundary 0 21% 0 Exhaust fans or
near barn 13% 33% 25%
Lagoon 0 13% 25% Technology n/a1 n/a 13%
1 not applicable Table 15.8. The percentage of positive samples of fecal coliform bacteria (E. coli) measured at
different sampling sites on the Surrogate Farm1, Surrogate Farm 2, and AHA Hunt Farm Site Surrogate Farm 1 Surrogate Farm 2 SBR – AHA Hunt
Upper boundary 6% (0) 0 0 Lower boundary 0 0 0 Exhaust fans or
near barn 13% (0) 0 0
Lagoon 13% (0) 0 0 Technology n/a1 n/a 0
1 not applicable The levels of endotoxins measured at the two surrogate farms and the AHA Hunt farm with the SBR technology are summarized in Table 15.9. The concentrations of endotoxins varied a great deal on a daily basis at each of the farm sites. Levels of endotoxins (<LOD - 33 EU/m3) were lower at this farm compared to the surrogate farms. The highest endotoxin levels were detected at the barn and at the technology for the Hunt farm with the SBR technology. The concentrations of endotoxins at the lower boundary were higher than (surrogate farm 2 and Hunt farm with the SBR technology) or similar to (surrogate farm 1) those at the upper boundary, which indicated that endotoxins released from the swine barns were potentially being detected at the lower boundary of the farm. However, other on-farm endotoxin sources also could have contributed to the levels detected at the lower farm boundary. Table 15.9. The levels of endotoxin from airborne dust at sampling sites
Summary Day 1 Day 2 Day 3 Day 4 Day 5 Day 6 Day 7 Mean SD Location Sites
Concentration (EU/m3) Upper Boundary 20 5 107 49 n/d1 n/d n/d 45 45
Upper Wind 9 8 47 217 n/d n/d n/d 70 100 Near Barn 1 70 62 358 481 n/d n/d n/d 243 210 Near Barn 2 217 48 510 510 n/d n/d n/d 321 229
Lagoon 160 14 108 23 n/d n/d n/d 76 70
Surrogate 1
Lower Boundary 5 6 121 47 n/d n/d n/d 45 54 Upper Boundary 1 1 15 31 6 21 2 11 12
Exhaust fan 1 28 312 2940 290 1861 288 55 825 1126Exhaust fan 2 225 n/d 2869 84 n/d n/d n/d 1059 1569
Lagoon 3 2 68 26 13 10 21 20 23 Surrogate 2
Lower Boundary 3 3 97 26 23 30 4 26 33
Phase 2 OPEN Technology Evaluations - Pathogens 55

Upper Boundary <LOD <LOD 6 1 n/d n/d n/d 4 3 Barn 3 7 16 28 n/d n/d n/d 13 11
Technology 3 3 13 33 n/d n/d n/d 13 14 Lagoon 2 3 19 11 n/d n/d n/d 9 8
SBR – AHA Hunt
Lower Boundary 18 <LOD 18 7 n/d n/d n/d 14 6 1 not done; 2 below limit of detection Environmental conditions were recorded simultaneously at the points on the farms where air samples were collected, with these values summarized in Table 15.10. Temperatures were somewhat variable for the different sample days for each of the farm sites, as would be expected due to the varied seasons of sample collection. Mean relative humidity, mean wind velocity, and mean solar irradiation were similar for each of the farms tested. Table 15.10. Summary of environmental conditions during microbial air sampling at the Surrogate
Farm1, Surrogate Farm 2, and AHA Hunt Farm (a) Temperature (°C)
(b) Relative Humidity (%)
Farm Day 1 Day 2 Day 3 Day 4 Day 5 Day 6 Day 7 Mean ± SD
Surrogate 1 27±1°C 23±5 °C 1±1 °C -2 ±1°C n/a1 n/a n/a 13±14°C
Surrogate 2 31±3°C 30±2°C 8±3°C 19±3°C 25±1°C 32±2°C 33±3°C 25±9°C
SBR-AHA Hunt 4±3°C 11±2°C 27±1°C 28±2°C n/a n/a n/a
17±12°C
(c) Average wind velocity (m/sec)
Farm Day 1 Day 2 Day 3 Day 4 Day 5 Day 6 Day 7 Mean ± SD
Surrogate 1 82±3% 52±17% 28±3% 33±7% n/a n/a n/a 49±23%
Surrogate 2 46±8% 61±6% 22±5% 80±12% 28±2% 63±5% 58±5% 51±20%
SBR-AHA Hunt 40±5% 38±5% 41±3% 56±9% n/a n/a n/a 44±8%
(d) Solar irradiation (mW/cm2)
Farm Day 1 Day 2 Day 3 Day 4 Day 5 Day 6 Day 7 Mean ± SD
Surrogate 1 2.2±0.6 1.0±0.8 3.0±1.4 1.2±0.4 n/a n/a n/a 1.9±1.2
Surrogate 2 0.6±0.3 1.2±0.3 2.2±0.8 3.7±2.6 2.1±0.8 1.5±0.7 1.7±1.1 1.9±1.0
SBR-AHA Hunt 2.5±1.7 1.3±0.8 3.1±1.3 2.7±1.2 n/a n/a n/a 2.4±0.8
1 not applicable
Farm Day 1 Day 2 Day 3 Day 4 Day 5 Day 6 Day 7 Mean ± SD
Surrogate 1 2.4±1.4 7.1±1.3 3.8±0.8 4.3±0.7 n/a n/a n/a 4.4±2.0
Surrogate 2 5.0±1.8 5.4±2.3 5.0±0.5 3.4±2.6 10.3±1.3 6.7±3.7 11.5±0.8 6.8±3.0
SBR-AHA Hunt 6.2±0.6 5.1±0.8 9.1±1.2 9.0±3.9 n/a n/a n/a 7.4±2.0
Phase 2 OPEN Technology Evaluations - Pathogens 56
Summary Analysis: The overall results of microbiological analyses of swine waste and treated effluent showed similar microbial concentrations and therefore, similar reductions of microbes by the SBR technology at the AHA Hunt farm when compared to conventional technologies on surrogate swine farms. Reductions of microbes by the alternative treatment were statistically similar to the conventional technology. When considering the technologies of this entire farm, treated effluent from the SBR technology was further treated by primary and secondary preexisting lagoons at the farm. In order to assess the efficacy of the entire system, samples were collected from each of the lagoons. There were statistically similar microbial reductions for the SBR and primary lagoon at the AHA Hunt farm as compared to conventional treatment at the surrogate farms. However, samples collected from the secondary lagoon, following treatment by the primary lagoon and SBR, showed statistically higher microbial reductions compared to the surrogate farms. It can be concluded from this information that the SBR technology alone was not superior to conventional treatment, but that further treatment of the SBR effluent in multistage lagoon systems provided superior performance for reducing microbial contaminants to a greater extent than conventional technologies at the surrogate farms. The frequencies of air samples positive for fecal microbes were significantly lower at the AHA Hunt farm with the SBR technology when compared to the surrogate farms. However, concentrations of fecal microbes present in air were statistically similar at the AHA Hunt farm. Based on the reduced frequency of microbially positive air samples at the AHA Hunt farm with the SBR technology but no significant decrease in the concentrations of airborne microbes , this alternative treatment technology cannot be considered truly superior to the current technologies at the surrogate farms on the basis of airborne contaminants. This assessment is consistent with the fact that both the alternative SBR technology as well as a system of dual lagoons in series was also present on the same farm. Therefore, it was not possible to adequately determine what the relative contributions of the different waste management technologies were to airborne microbial contamination farm-wide. Overall, it can be concluded that the SBR technology at AHA Hunt farm was not environmentally superior to the lagoon technology of surrogate farms because it did not more significantly reduce microbial indicators and the pathogen, Salmonella, in the treated waste effluent as compared to reductions achieved by conventional technologies at the surrogate farms. The preexisting lagoon system at the AHA Hunt farm, consisting of both a primary and secondary lagoon, did prove to yield statistically superior performance for reducing microbial indicators and Salmonella in SBR-treated effluent. However, there are still relatively high microbial concentrations in the treated wastewater from the secondary lagoon that should be carefully managed to avoid environmental contamination. Although there were significantly lower frequencies of positive samples for airborne fecal contamination at the AHA Hunt farm than at the surrogate farms, the microbial concentrations in positive samples were statistically similar. Based on these results, the SBR technology cannot be judged as environmentally superior to conventional technologies.
Phase 2 OPEN Technology Evaluations - Pathogens 57

16. Evaluation of Gasifier Technology at the Lake Wheeler Rd. Research Farm for Pathogens
Project OPEN Science Team for Pathogens Alternative Technology: A gasification system for treatment of separated solids intended to be linked with a belt system for removal and separation of the swine waste liquids and solids from the barns. Location: Lake Wheeler Farm Research Farm, NCSU (Raleigh, NC) Period of Operation: The evaluation dates are:
1st field experiment: 07/12/2004 (air and solid waste stream) Commercial Collaborators: Thomas Gnosa (Big Dutchman International, GmbH) and Brookes Gasification Process, Division of Infectrol, Inc. NCSU Representative PI: Jeanne B. Koger (919-515-4046), Preston Burnette (919-515-3319) Statement of Task:
- Measurement of microbial indicator and pathogen concentrations at key points throughout the waste treatment stream of the technology
- Measurement of airborne microbial indicator and pathogen concentrations at selected sites on the farm in close proximity to the treatment system and at the upper and lower property boundaries
- Measurement of microbial indicator and pathogen concentrations within soils from sites where treated waste residuals were applied, as well as background soil where waste residual application does not occur (Note: This technology evaluation did not land-apply residual material during sample periods. Therefore no environmental samples were available for collection)
- Microbial measurements were made during two sessions corresponding to a warm season (July).
- Microbial parameters measured for the waste stream: fecal indicators (fecal coliforms, E. coli, enterococci, spores of Clostridium perfringens, and total coliphages) and the bacterial pathogen Salmonella
- Microbial parameters measured in the air samples: total bacteria, total fungi, bacterial endotoxins, fecal indicators (fecal coliforms, E. coli, spores of Clostridium perfringens, and total coliphages) and the bacterial pathogen Salmonella
- Environmental conditions measured at sample points as air samples were collected: temperature, wind direction and speed, relative humidity, solar irradiance
Measurement of Pathogens: Treatment Technology The gasification system at the Lake Wheeler Research farm was part of the ReCycle technology and was intended to link with a belt system used to separate and remove the fecal waste solids and liquids from the barns at the Grinnells laboratory on the campus of North Carolina State University (evaluated during the Phase 1 Technology Determinations). Unlike the belt system, which was designed solely to separate and remove the wastes from the barn, this gasification system was designed to treat the solid wastes and to recover nutrients that can then be reused in animal feeds as a value-added product. The main source of microbial pathogens in this system was from the fecal wastes from the barns. This gasifier was a simple all-in, all-out type of system that used propane during the initial start up, after which, gases created during the process sustained the reaction. Collected wastes from the belt system (previously evaluated) were stored
Phase 2 OPEN Technology Evaluations - Pathogens 58
over the period of approximately a year during installation of the gasifier. Because of this, the microbial concentrations in the influent material were lower than would be expected in fresh feces from barns, which may not have allowed an accurate evaluation of the full efficacy of the system for treating microbial pathogens in the wastes. It remains unclear how the liquid wastes from the ReCycle technology will be further treated. This portion of the waste stream should be considered for pathogen impacts when making a technology determination concerning the complete system. Previously, the liquid waste stream from the belt system for solids separation was found to contain appreciable levels of fecal microbes (pathogens or pathogen surrogates), indicating the need for further treatment or other management systems to prevent or control environmental microbial pathogen contamination. Microbiological Samples Single grab samples were collected from points within the waste treatment stream to assess the microbial concentrations associated with the technology. Microbial concentrations were quantitatively determined in the waste stream for fecal indicators (fecal coliforms, E. coli, enterococci, spores of Clostridium perfringens, and total coliphages) and the bacterial pathogen, Salmonella. Microbiological assays were performed according to protocols outlined in the Quality Assurance Project Plan (QAPP) prepared by the Pathogens group of the OPEN team. Briefly, fecal coliform, E. coli, and enterococci bacteria were quantitatively assayed using quantal, biochemically-based microbial culture systems and other microbial indicators were assayed using standard quantitative microbial culture methods. Salmonella was quantified using an accepted quantal, most-probable number culture assay method based on published literature. Air samples were collected at key sites throughout the technology site. Airborne microbial concentrations were measured for total (aerobic/heterotrophic) bacteria, total (aerobic/heterotrophic) fungi, spores of C. perfringens, fecal coliforms, E. coli, and Salmonella. Microbiological air sampling was performed using AGI-30 all-glass impingers with sampling at 12.5 LPM for 30 minutes per sample. Each microorganism was analyzed by culture methods described in the QAPP document from the OPEN team. In addition to culturable airborne microorganisms, airborne endotoxins were collected using personal SKC air samplers at approximately 4 LPM for 4 hours. Samples were analyzed by the Limulus amebocyte lysate (LAL) test. Environmental conditions, including temperature, relative humidity (RH), wind velocity, and solar irradiation, were measured and recorded at specific locations and times when microbial air samples were collected. These microbial measurements took place according to the following schedule: Table 16.1. Pathogen Measurement Schedule and Sample Locations at Koger/van Kempen
Gasifier Technology at the Lake Wheeler Rd. Research Farm Date Samples
Collected Air Samples Analyzed Waste Stream Samples Analyzed
Environmental Samples Analyzed
07/12/2004 UB, LB, T IN, A --
UB=upper (upwind) boundary; LB=lower (downwind) boundary; T=technology; IN=influent solids; A=ash
Phase 2 OPEN Technology Evaluations - Pathogens 59
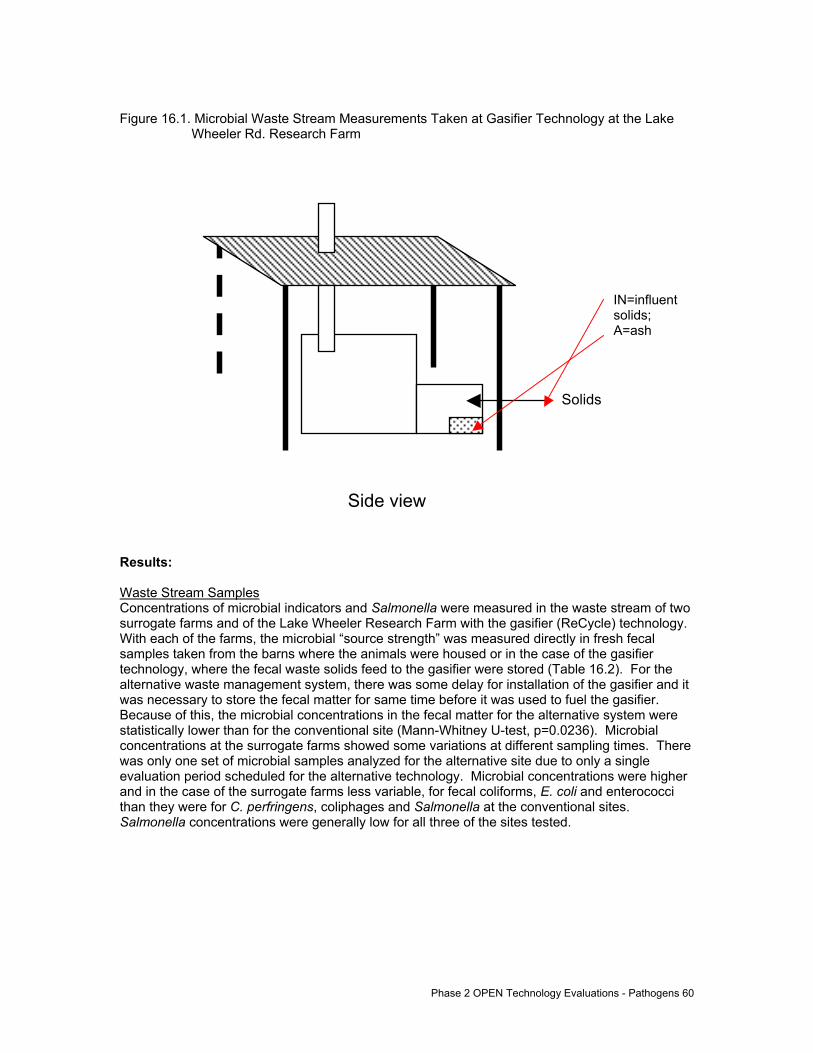
Figure 16.1. Microbial Waste Stream Measurements Taken at Gasifier Technology at the Lake
Wheeler Rd. Research Farm
Side view
Solids
solidA=
IN=influent s;
ash
Results: Waste Stream Samples Concentrations of microbial indicators and Salmonella were measured in the waste stream of two surrogate farms and of the Lake Wheeler Research Farm with the gasifier (ReCycle) technology. With each of the farms, the microbial “source strength” was measured directly in fresh fecal samples taken from the barns where the animals were housed or in the case of the gasifier technology, where the fecal waste solids feed to the gasifier were stored (Table 16.2). For the alternative waste management system, there was some delay for installation of the gasifier and it was necessary to store the fecal matter for same time before it was used to fuel the gasifier. Because of this, the microbial concentrations in the fecal matter for the alternative system were statistically lower than for the conventional site (Mann-Whitney U-test, p=0.0236). Microbial concentrations at the surrogate farms showed some variations at different sampling times. There was only one set of microbial samples analyzed for the alternative site due to only a single evaluation period scheduled for the alternative technology. Microbial concentrations were higher and in the case of the surrogate farms less variable, for fecal coliforms, E. coli and enterococci than they were for C. perfringens, coliphages and Salmonella at the conventional sites. Salmonella concentrations were generally low for all three of the sites tested.
Phase 2 OPEN Technology Evaluations - Pathogens 60
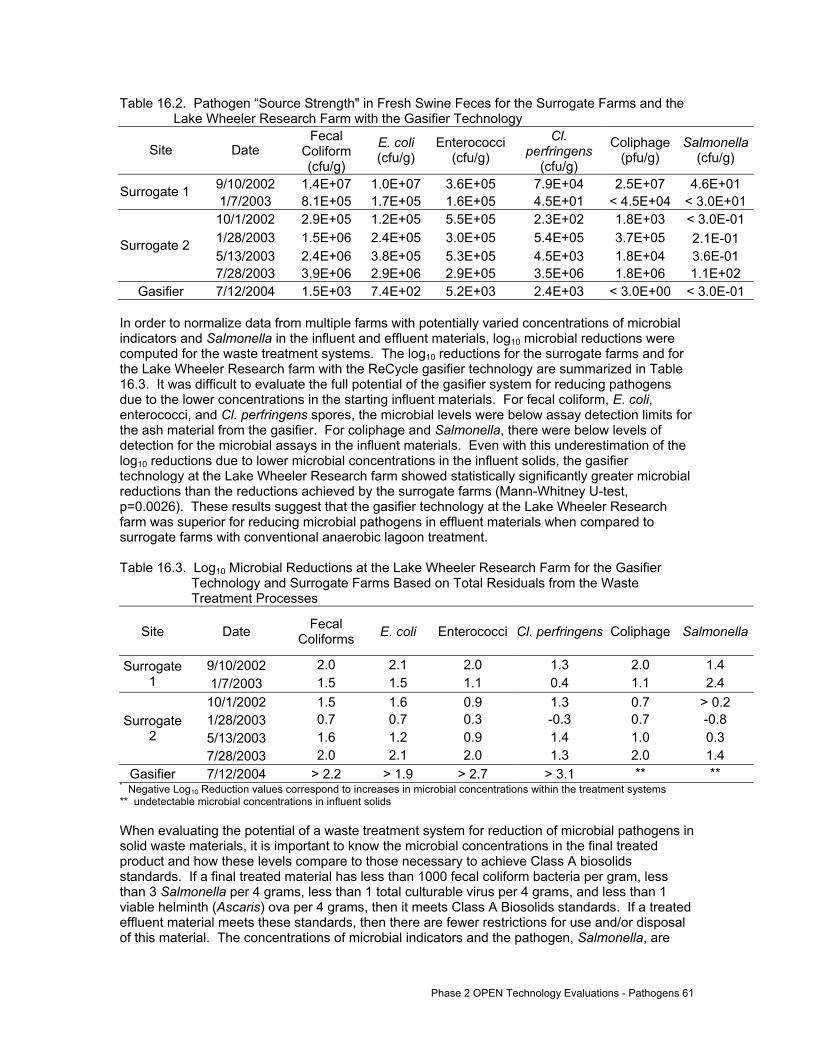
Table 16.2. Pathogen “Source Strength" in Fresh Swine Feces for the Surrogate Farms and the Lake Wheeler Research Farm with the Gasifier Technology
Site Date Fecal
Coliform (cfu/g)
E. coli (cfu/g)
Enterococci (cfu/g)
Cl. perfringens
(cfu/g)
Coliphage (pfu/g)
Salmonella (cfu/g)
9/10/2002 1.4E+07 1.0E+07 3.6E+05 7.9E+04 2.5E+07 4.6E+01 Surrogate 1 1/7/2003 8.1E+05 1.7E+05 1.6E+05 4.5E+01 < 4.5E+04 < 3.0E+01 10/1/2002 2.9E+05 1.2E+05 5.5E+05 2.3E+02 1.8E+03 < 3.0E-01 1/28/2003 1.5E+06 2.4E+05 3.0E+05 5.4E+05 3.7E+05 2.1E-01 5/13/2003 2.4E+06 3.8E+05 5.3E+05 4.5E+03 1.8E+04 3.6E-01
Surrogate 2
7/28/2003 3.9E+06 2.9E+06 2.9E+05 3.5E+06 1.8E+06 1.1E+02 Gasifier 7/12/2004 1.5E+03 7.4E+02 5.2E+03 2.4E+03 < 3.0E+00 < 3.0E-01
In order to normalize data from multiple farms with potentially varied concentrations of microbial indicators and Salmonella in the influent and effluent materials, log10 microbial reductions were computed for the waste treatment systems. The log10 reductions for the surrogate farms and for the Lake Wheeler Research farm with the ReCycle gasifier technology are summarized in Table 16.3. It was difficult to evaluate the full potential of the gasifier system for reducing pathogens due to the lower concentrations in the starting influent materials. For fecal coliform, E. coli, enterococci, and Cl. perfringens spores, the microbial levels were below assay detection limits for the ash material from the gasifier. For coliphage and Salmonella, there were below levels of detection for the microbial assays in the influent materials. Even with this underestimation of the log10 reductions due to lower microbial concentrations in the influent solids, the gasifier technology at the Lake Wheeler Research farm showed statistically significantly greater microbial reductions than the reductions achieved by the surrogate farms (Mann-Whitney U-test, p=0.0026). These results suggest that the gasifier technology at the Lake Wheeler Research farm was superior for reducing microbial pathogens in effluent materials when compared to surrogate farms with conventional anaerobic lagoon treatment. Table 16.3. Log10 Microbial Reductions at the Lake Wheeler Research Farm for the Gasifier
Technology and Surrogate Farms Based on Total Residuals from the Waste Treatment Processes
Site Date Fecal Coliforms E. coli Enterococci Cl. perfringens Coliphage Salmonella
9/10/2002 2.0 2.1 2.0 1.3 2.0 1.4 Surrogate 1 1/7/2003 1.5 1.5 1.1 0.4 1.1 2.4
10/1/2002 1.5 1.6 0.9 1.3 0.7 > 0.2 1/28/2003 0.7 0.7 0.3 -0.3 0.7 -0.8 5/13/2003 1.6 1.2
2.0 > 3.1
0.9 1.4 1.0 0.3 Surrogate
2 7/28/2003 2.0 2.1 1.3 2.0 1.4
Gasifier 7/12/2004 > 2.2 > 1.9 > 2.7 ** ** * Negative Log10 Reduction values correspond to increases in microbial concentrations within the treatment systems ** undetectable microbial concentrations in influent solids When evaluating the potential of a waste treatment system for reduction of microbial pathogens in solid waste materials, it is important to know the microbial concentrations in the final treated product and how these levels compare to those necessary to achieve Class A biosolids standards. If a final treated material has less than 1000 fecal coliform bacteria per gram, less than 3 Salmonella per 4 grams, less than 1 total culturable virus per 4 grams, and less than 1 viable helminth (Ascaris) ova per 4 grams, then it meets Class A Biosolids standards. If a treated effluent material meets these standards, then there are fewer restrictions for use and/or disposal of this material. The concentrations of microbial indicators and the pathogen, Salmonella, are
Phase 2 OPEN Technology Evaluations - Pathogens 61
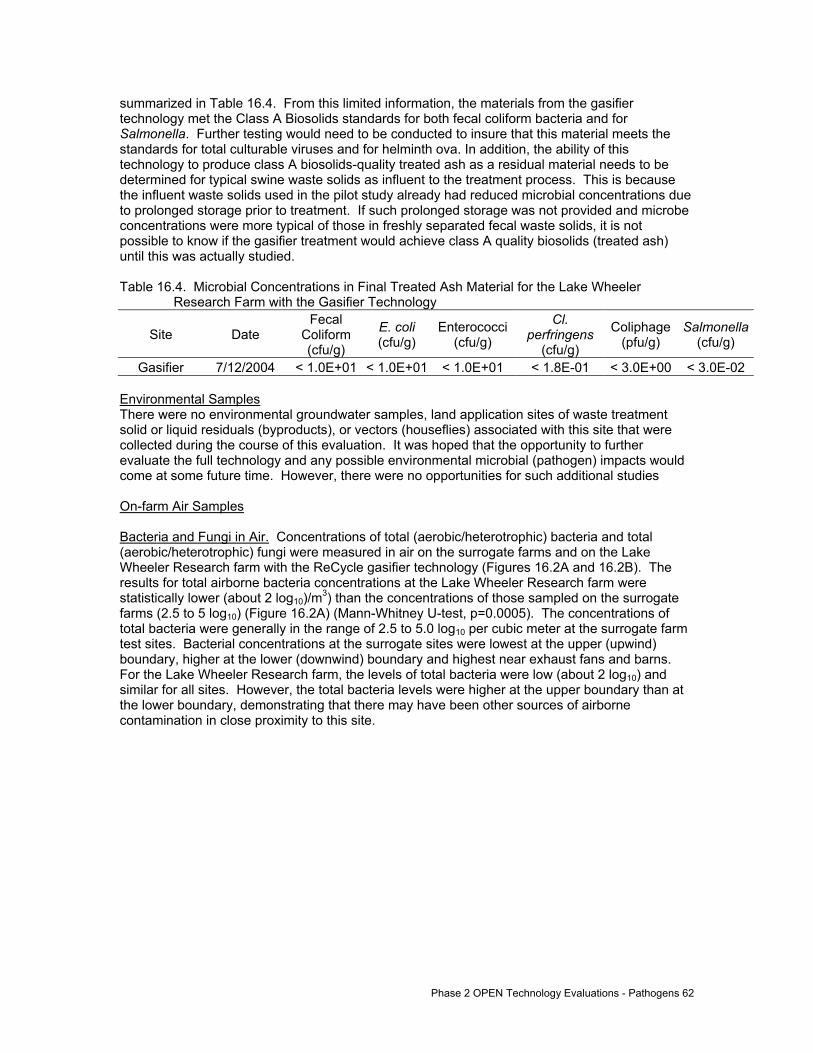
summarized in Table 16.4. From this limited information, the materials from the gasifier technology met the Class A Biosolids standards for both fecal coliform bacteria and for Salmonella. Further testing would need to be conducted to insure that this material meets the standards for total culturable viruses and for helminth ova. In addition, the ability of this technology to produce class A biosolids-quality treated ash as a residual material needs to be determined for typical swine waste solids as influent to the treatment process. This is because the influent waste solids used in the pilot study already had reduced microbial concentrations due to prolonged storage prior to treatment. If such prolonged storage was not provided and microbe concentrations were more typical of those in freshly separated fecal waste solids, it is not possible to know if the gasifier treatment would achieve class A quality biosolids (treated ash) until this was actually studied. Table 16.4. Microbial Concentrations in Final Treated Ash Material for the Lake Wheeler
Research Farm with the Gasifier Technology
Site Date Fecal
Coliform (cfu/g)
E. coli (cfu/g)
Enterococci (cfu/g)
Cl. perfringens
(cfu/g)
Coliphage (pfu/g)
Salmonella (cfu/g)
Gasifier 7/12/2004 < 1.0E+01 < 1.0E+01 < 1.0E+01 < 1.8E-01 < 3.0E+00 < 3.0E-02 Environmental Samples There were no environmental groundwater samples, land application sites of waste treatment solid or liquid residuals (byproducts), or vectors (houseflies) associated with this site that were collected during the course of this evaluation. It was hoped that the opportunity to further evaluate the full technology and any possible environmental microbial (pathogen) impacts would come at some future time. However, there were no opportunities for such additional studies On-farm Air Samples Bacteria and Fungi in Air. Concentrations of total (aerobic/heterotrophic) bacteria and total (aerobic/heterotrophic) fungi were measured in air on the surrogate farms and on the Lake Wheeler Research farm with the ReCycle gasifier technology (Figures 16.2A and 16.2B). The results for total airborne bacteria concentrations at the Lake Wheeler Research farm were statistically lower (about 2 log10)/m3) than the concentrations of those sampled on the surrogate farms (2.5 to 5 log10) (Figure 16.2A) (Mann-Whitney U-test, p=0.0005). The concentrations of total bacteria were generally in the range of 2.5 to 5.0 log10 per cubic meter at the surrogate farm test sites. Bacterial concentrations at the surrogate sites were lowest at the upper (upwind) boundary, higher at the lower (downwind) boundary and highest near exhaust fans and barns. For the Lake Wheeler Research farm, the levels of total bacteria were low (about 2 log10) and similar for all sites. However, the total bacteria levels were higher at the upper boundary than at the lower boundary, demonstrating that there may have been other sources of airborne contamination in close proximity to this site.
Phase 2 OPEN Technology Evaluations - Pathogens 62
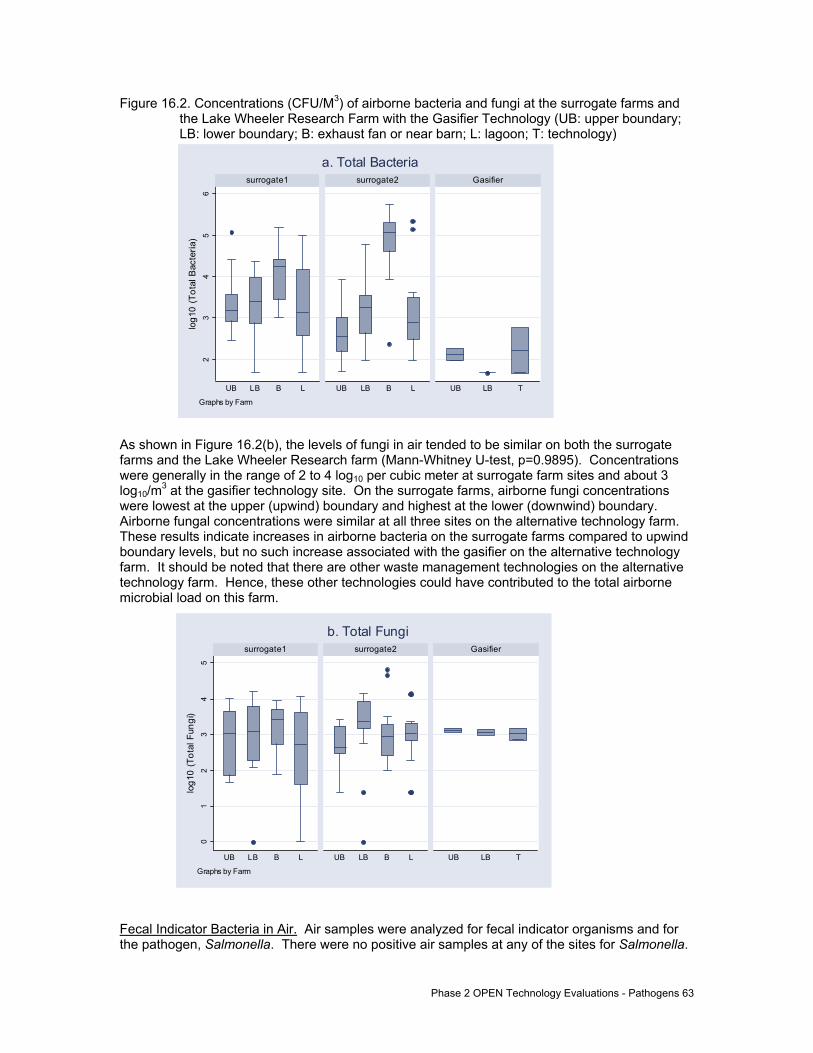
Figure 16.2. Concentrations (CFU/M3) of airborne bacteria and fungi at the surrogate farms and the Lake Wheeler Research Farm with the Gasifier Technology (UB: upper boundary; LB: lower boundary; B: exhaust fan or near barn; L: lagoon; T: technology)
As shown in Figure 16.2(b), the levels of fungi in air tended to be similar on both the surrogate
.
Fecal Indicator Bacteria in Air.
23
45
6
UB LB B L UB LB B L UB LB T
surrogate1 surrogate2 Gasifierlo
g10
(Tot
al B
acte
ria)
Graphs by Farm
a. Total Bacteria
farms and the Lake Wheeler Research farm (Mann-Whitney U-test, p=0.9895). Concentrationswere generally in the range of 2 to 4 log10 per cubic meter at surrogate farm sites and about 3 log10/m3 at the gasifier technology site. On the surrogate farms, airborne fungi concentrations were lowest at the upper (upwind) boundary and highest at the lower (downwind) boundary. Airborne fungal concentrations were similar at all three sites on the alternative technology farmThese results indicate increases in airborne bacteria on the surrogate farms compared to upwindboundary levels, but no such increase associated with the gasifier on the alternative technology farm. It should be noted that there are other waste management technologies on the alternative technology farm. Hence, these other technologies could have contributed to the total airborne microbial load on this farm.
01
23
45
UB LB B L UB LB B L UB LB T
surrogate1 surrogate2 Gasifier
log1
0 (T
otal
Fun
gi)
Graphs by Farm
b. Total Fungi
Phase 2 OPEN Technology Evaluations - Pathogens 63
Air samples were analyzed for fecal indicator organisms and for the pathogen, Salmonella. There were no positive air samples at any of the sites for Salmonella.
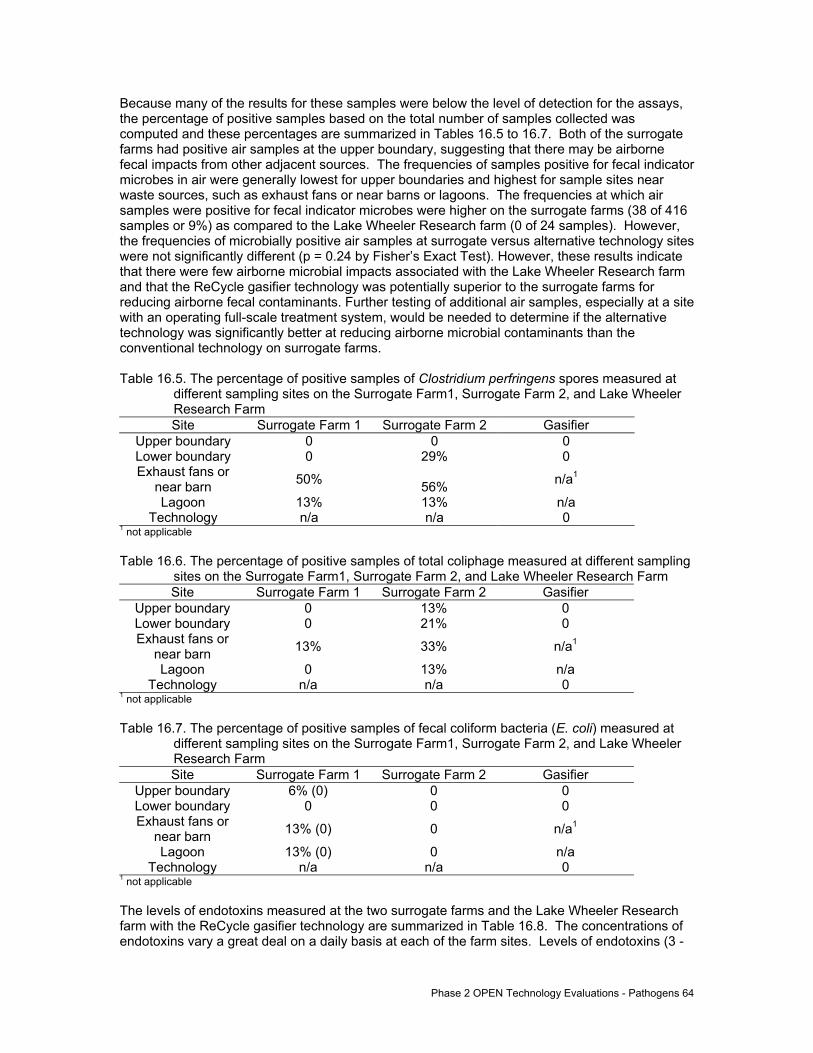
Because many of the results for these samples were below the level of detection for the assays, the percentage of positive samples based on the total number of samples collected was computed and these percentages are summarized in Tables 16.5 to 16.7. Both of the surrogate farms had positive air samples at the upper boundary, suggesting that there may be airbofecal impacts from other adjacent sources. The frequencies of samples positive for fecal indicatomicrobes in air were generally lowest for upper boundaries and highest for sample sites near waste sources, such as exhaust fans or near barns or lagoons. The frequencies at which air samples were positive for fecal indicator microbes were higher on the surrogate farms (38 of 4samples or 9%) as compared to the Lake Wheeler Research farm (0 of 24 samples). Howevethe frequencies of microbially positive air samples at surrogate versus alternative technology siteswere not significantly different (p = 0.24 by Fisher’s Exact Test). However, these results indicate that there were few airborne microbial impacts associated with the Lake Wheeler Research farm and that the ReCycle gasifier technology was potentially superior to the surrogate farms for reducing airborne fecal contaminants. Further testing of additional air samples, especially at a sitewith an operating full-scale treatment system, would be needed to determine if the alternativetechnology was significantly better at reducing airborne microbial contaminants than the conventional technology on surrogate farms. Table 16.5. The percentage of positive sample
rne r
16 r,
s of Clostridium perfringens spores measured at different sampling sites on the Surrogate Farm1, Surrogate Farm 2, and Lake Wheeler Research Farm Site Surrogate Farm 1 Surrogate Farm 2 Gasifier boundary Upper 0 0 0
Lower dary
50% n
13% T
boun 0 29% 0 Exhaust fans or
near barn 56% /a1
Lagoon echnology
13% n/a
n/a n/a 0
plicable 1 not ap
he percentage of positive samples of total coliphage measured at different sampling sites on the Surrogate Farm1, Surrogat rm 2, and Lake Wheeler Research Farm
Table 16.6. Te Fa
Site Surrogate Farm 1 Surrogate Farm 2 Gasifier boundary 0 13% 0 Upper
Lowe dary
13% 33% n
T
r boun 0 21% 0 Exhaust fans or
near barn /a1
Lagoon echnology
0 n/a
13% n/a
n/a 0
plicable 1 not ap
he percentage of positive samples of fecal coliform bacteria (E. coli) measured at different sampling sites on the Surrogate Farm1, Surrogate Farm 2, and Lake Wheeler
Table 16.7. T
Research Farm Site Surrogate Farm 1 Surrogate Farm 2 Gasifier boundary Upper 6% (0) 0 0
Lowe dary
13% (0) n
T n/a
r boun 0 0 0 Exhaust fans or
near barn 0 /a1
Lagoon echnology
13% (0) n/a
0 n/a 0
plicable 1 not ap
endotoxins measured at the two surrogate farms and the Lake Wheeler Research farm with the ReCycle gasifier technology are summarized in Table 16.8. The concentrations of endotoxins vary a great deal on a daily basis at each of the farm sites. Levels of endotoxins (3 -
The levels of
Phase 2 OPEN Technology Evaluations - Pathogens 64
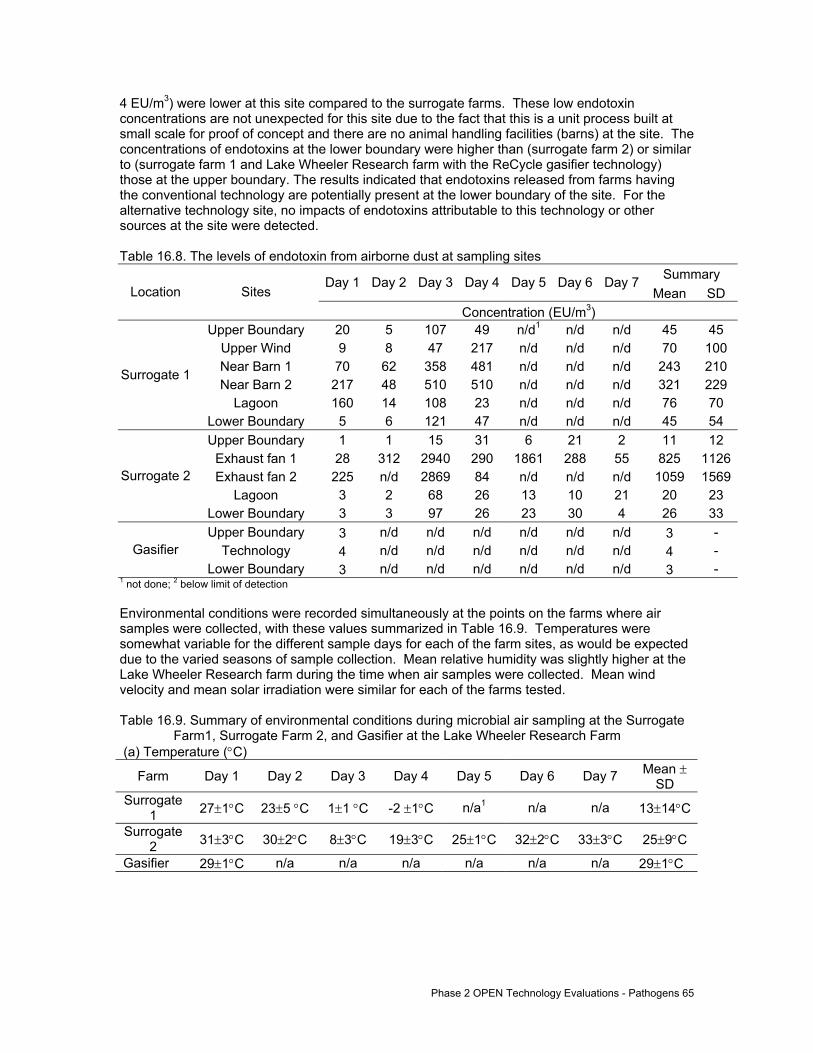
4 EU/m3) were lower at this site compared to the surrogate farms. These low endotoxin concentrations are not unexpected for this site due to the fact that this is a unit process built at small scale for proof of concept and there are no animal handling facilities (barns) at the site. Theconcen
r similar
Summary
trations of endotoxins at the lower boundary were higher than (surrogate farm 2) oto (surrogate farm 1 and Lake Wheeler Research farm with the ReCycle gasifier technology) those at the upper boundary. The results indicated that endotoxins released from farms having the conventional technology are potentially present at the lower boundary of the site. For the alternative technology site, no impacts of endotoxins attributable to this technology or other sources at the site were detected. Table 16.8. The levels of endotoxin from airborne dust at sampling sites
Day 1 Day 2 Day 3 Day 4 Day 5 Day 6 Day 7 Mean SD Location Sites
Concentration (EU/m3) Uppe dary r Boun 20 5 107 49 n/d1 n/d n/d 45 45
70 100 Near Barn 1 70
2162 358 4 81 n/d n/d n/d 243 210
Near Barn 2 n/d n/d 160
5 108 121
23 47
n/d n/d
n/d n/d
n/d n/d
76 45
70 54
er Bound 1 1 15 31 6 21 11 12 Exhaust fan 1 2 8 3 12 2940
2869 290 1 288 1
225 n/d 1059 1569Surrogate 2
L 30 Upp ary n/d n/d n/d
861 n/d
55 n/d
825 126Exhaust fan 2 84 n/d
Lagoon 3 2 68 26 13 10 21 20 23 ower Boundary 3 3 97 26 23 4 26 33
er Bound 3 n/d n/d n/d 3 - Technology
Lower Boundary 4 n/d n/d n/d Gasifier
n/d n/d n/d n/d n/d
n/d n/d
n/d n/d
4 - - 3 3
limit of detection
conditions were re ded ultan usly he po s on farm here
Upper Wind 9 8 47 217 n/d n/d n/d
7 48 510 510 n/d 321 229 Lagoon 14
Surrogate 1
Lower Boundary 6 Upp ary 2
1 not done; 2 below Environmental cor sim eo at t int the s w air
hese values summarized in Table 16.9. Temperatures were omewhat variable for the different sample days for each of the farm sites, as would be expected
the
ate ch Farm
a) Temperature (°C)
Farm SD
samples were collected, with tsdue to the varied seasons of sample collection. Mean relative humidity was slightly higher at Lake Wheeler Research farm during the time when air samples were collected. Mean wind velocity and mean solar irradiation were similar for each of the farms tested. Table 16.9. Summary of environmental conditions during microbial air sampling at the Surrog
Farm1, Surrogate Farm 2, and Gasifier at the Lake Wheeler Resear (
Day 1 Day 2 Day 3 Day 4 Day 5 Day 6 Day 7 Mean ±
1 27±1°C 23±5 °C 1±1 °C -2 ±1°C n/a1 n/a n/a 13±14°C
2 ± °
29±1°C n/a n/a 29±1°C
Surrogate
Surrogate 31±3°C 30±2°C 8±3°C 19±3°C 25±1°C 32±2°C 33±3°C 25 9 C
Gasifier n/a n/a n/a n/a
Phase 2 OPEN Technology Evaluations - Pathogens 65
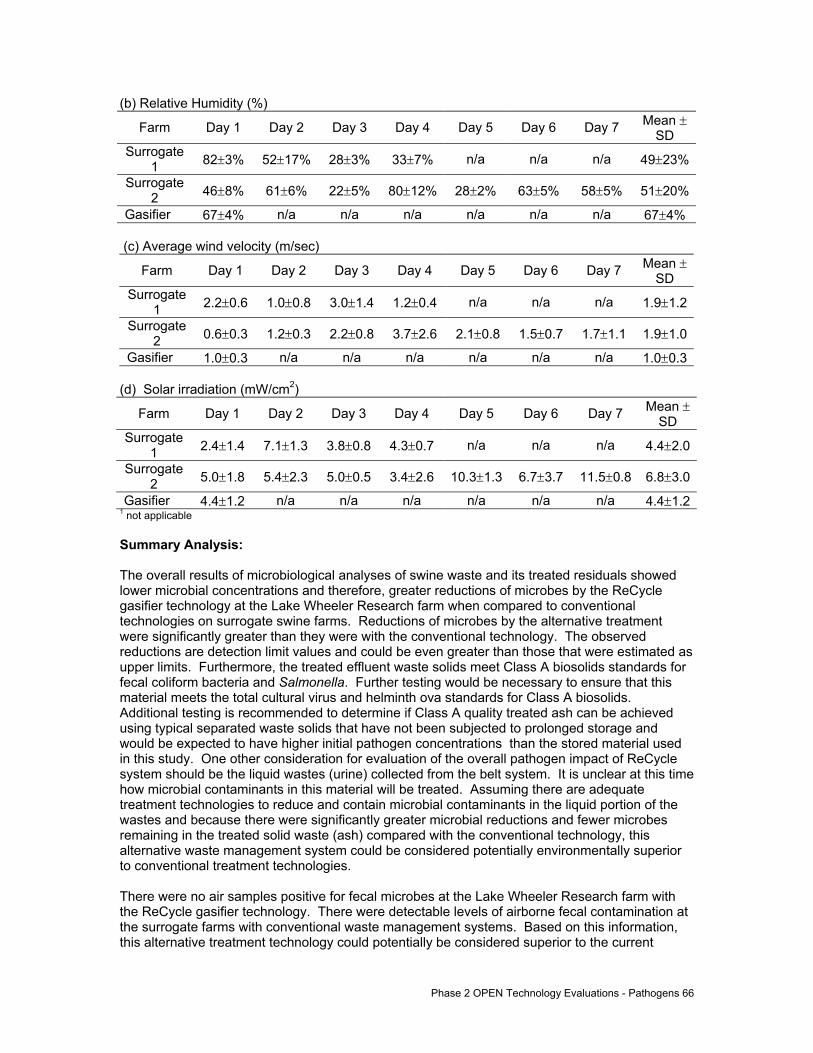
(b) Relative Humidity (%)
(c) Average wind velocity (m/sec)
Day 5 Farm Day 1 Day 2 Day 3 Day 4 Day 6 Day 7 Mean ± SD
Surrogate 1 82±3% 52±17% 28±3% 33±7% n/a n/a n/a 49±23%
Surrogate 2 46±8% 61±6% 22±5% 80±12% 28±2% 63±5% 58±5% 51±20%
Gasifier 67±4% n/a n/a n/a n/a n/a n/a 67±4%
Farm Day 1 Day 2 Day 3 Day 4 Day 5 Day 6 Day 7 Mean ± SD
Surrogate 1 2.2±0.6 1.0±0.8 3.0±1.4 1.2±0.4 n/a n/a n/a 1.9±1.2
Surrogate 2 0.6±0.3 1.2±0.3 2.2±0.8 3.7±2.6 2.1±0.8 1.5±0.7 1.7±1.1 1.9±1.0
Gasifier 1.0±0.3 n/a n/a n/a n/a n/a n/a 1.0±0.3
(d) Solar irradiation (mW/cm2)
1 not applicable
Farm Day 1 Day 2 Day 3 Day 4 Day 5 Day 6 Day 7 Mean ± SD
Surrogate 1 2.4±1.4 7.1±1.3 3.8±0.8 4.3±0.7 n/a n/a n/a 4.4±2.0
Surrogate 2 5.0±1.8 5.4±2.3 5.0±0.5 3.4±2.6 10.3±1.3 6.7±3.7 11.5±0.8 6.8±3.0
Gasifier 4.4±1.2 n/a n/a n/a n/a n/a n/a 4.4±1.2
Summary Analysis:
The overall results of microbiological analyses of swine waste and its treated residuals showed lower microbial concentrations and therefore, greater reductions of microbes by the ReCycle gasifier technology at the Lake Wheeler Research farm when compared to conventional technologies on surrogate swine farms. Reductions of microbes by the alternative treatment were significantly greater than they were with the conventional technology. The observed reductions are detection limit values and could be even greater than those that were estimated as upper limits. Furthermore, the treated effluent waste solids meet Class A biosolids standards for fecal coliform bacteria and Salmonella. Further testing would be necessary to ensure that this material meets the total cultural virus and helminth ova standards for Class A biosolids. Additional testing is recommended to determine if Class A quality treated ash can be achieved using typical separated waste solids that have not been subjected to prolonged storage and would be expected to have higher initial pathogen concentrations than the stored material used in this study. One other consideration for evaluation of the overall pathogen impact of ReCycle system should be the liquid wastes (urine) collected from the belt system. It is unclear at this time how microbial contaminants in this material will be treated. Assuming there are adequate treatment technologies to reduce and contain microbial contaminants in the liquid portion of the wastes and because there were significantly greater microbial reductions and fewer microbes remaining in the treated solid waste (ash) compared with the conventional technology, this alternative waste management system could be considered potentially environmentally superior to conventional treatment technologies. There were no air samples positive for fecal microbes at the Lake Wheeler Research farm with the ReCycle gasifier technology. There were detectable levels of airborne fecal contamination at the surrogate farms with conventional waste management systems. Based on this information, this alternative treatment technology could potentially be considered superior to the current
Phase 2 OPEN Technology Evaluations - Pathogens 66

technologies at the surrogate farms on this basis. However, there were too few samples to demonstrate a statistically significant difference in airborne microbial contamination frequencies between surrogate farm and alternative technology sites. Furthermore, the alternative technology was only a pilot and not a full-scale operation. Therefore, more frequent sampling of a full-scale system would be needed to better document the potential superiority of the gasifier system in reducing or preventing airborne microbial contamination. Overall, it can be concluded that the ReCycle gasifier technology constructed at the Lake Wheeler Research farm can be judged potentially environmentally superior to the surrogate farms because it reduced microbial indicators and the pathogen, Salmonella, in the treated waste material and there was no occurrence of microbes in air samples collected at the farm site as compared to microbial reductions achieved by conventional technologies at surrogate farms and detectable microbes in some air samples. We were unable to collect the necessary number of houseflies at the Lake Wheeler Research farm for assay, which would imply that there were few houseflies present at the pilot gasifier technology site. Provisionally, the gasifier technology at the Lake Wheeler Research farm was considered superior to the surrogate farms with regards to environmental impacts that may occur due to fly vectors. However, the inability to evaluate a full-scale waste separation and gasifier system that includes all elements of waste management made it impossible to determine if such a system would be environmentally superior on the basis of pathogens associated with fly vectors.
Phase 2 OPEN Technology Evaluations - Pathogens 67
17. Evaluation of Super Soils Composting Technology at the Hickory Grove Site for Pathogens
Project OPEN Science Team for Pathogens Alternative Technology: Solids composting and processing facility linked to the Super Soils system at the Goshen Ridge Farm site. Waste solids were processed for value-added products that would be for use and sale off site. Location: Timber Ridge Farms, Hickory Grove site near Clinton, NC Period of Operation: The evaluation dates are:
1st field experiment: 07/19/2004 (air, solid waste stream and flies) 2nd field experiment: 11/08/2004 (air, solid waste stream and flies) 3rd field experiment: 11/15/2004 (air only) 4th field experiment: 12/13/2004 (solid waste stream)
Technology Supplier: Lew Fetterman and C. Ray Campbell (Super Soil Systems USA, Inc., 919-851-5751) Principal Investigators: Mattis Vanotti, Patricia Millner, Ariel Szogi, Patrick Hunt (USDA-ARS, Florence, SC, 843-669-5203); Frank Humenik (NCSU, 919-515-6767) Statement of Task:
- Measurement of microbial indicator and pathogen concentrations at key points throughout the waste treatment stream of the technology
- Measurement of airborne microbial indicator and pathogen concentrations at selected sites on the farm in close proximity to the treatment system and at the upper and lower property boundaries
- Measurement of microbial indicator and pathogen concentrations within soils from sites where treated waste water was applied, as well as background soil where spray irrigation did not occur (did not spray irrigate during sample periods)
- Microbial measurements were made during two sessions corresponding to a warm and cold season.
- Microbial parameters measured for the waste stream: fecal indicators (fecal coliforms, E. coli, enterococci, spores of Clostridium perfringens, and total coliphages) and the bacterial pathogen Salmonella
- Microbial parameters measured in the air samples: total bacteria, total fungi, bacterial endotoxins, fecal indicators (fecal coliforms, E. coli, spores of Clostridium perfringens, and total coliphages) and the bacterial pathogen Salmonella
- Environmental conditions measured at sample points as air samples were collected: temperature, wind direction and speed, relative humidity, solar irradiance
Measurement of Pathogens: Treatment Technology The compost system at the Hickory Grove site was a component of the Super Soils alternative treatment technology, with the other portion of the technology constructed at the Goshen Ridge site. The main source of microbial pathogens at this site was the separated solid fecal matter from the barns located at the Goshen Ridge farm. The aim of the Super Soils components at the Goshen Ridge site was for treatment of the liquid portions of the waste, with the separated solids treated by the compost system constructed at the Hickory Grove site. Separated solids from the farm were delivered to the compost system by trailer and were physically mixed with amendment
Phase 2 OPEN Technology Evaluations - Pathogens 68
material at the site. During the course of these evaluations, the technology providers tested several different amendment materials and mix ratios for the compost material, or “blends”. Wood shavings, bark, and cotton offal were all used as amendment materials, with the technology providers concentrating a great deal of their testing efforts on the cotton offal, as it was a readily available and fairly inexpensive material for composting. The compost system was of the windrow type in a series of bins with an automatic composter that operated to turn the composting material in each row several times during the day. As the piles were turned, it systematically moved the material, such that there was a portion of the final composted material coming out of each bin every day. The compost system had a residence time of approximately 30 days (30 days for influent material to move through the compost pile). The technology also had an additional step where the composted material was stored in curing piles for an additional 30 days onsite before it was to be used for soil amendment or some other value-added purpose. The technology providers had performed extensive testing on this material during this post-composting process and there appeared to be a significant amount of microbiological activity in the material during this time period as evidenced by the elevated temperatures in the piles. For this evaluation, we examined pathogens in the system with and without this additional treatment or “holding” step. It is not clear at this point what the final fate of the composted material will be, as the technology providers have not communicated a marketing plan for the material. At the time of this study, this composted material was currently being stored at the Hickory Grove site. Microbiological Samples Single grab samples were collected from key points within the waste treatment streams to assess the microbial concentrations associated with the technology. Microbial concentrations were quantitatively determined in the waste stream for fecal indicators (fecal coliforms, E. coli, enterococci, spores of Clostridium perfringens, and total coliphages) and the bacterial pathogen, Salmonella. Microbiological assays were performed according to protocols outlined in the Quality Assurance Project Plan (QAPP) prepared by the Pathogens group of the OPEN team. Briefly, fecal coliform, E. coli, and enterococci bacteria were quantified using quantal, biochemically-based microbial culture systems and other microbial indicators were assayed using standard quantitative microbial culture methods. Salmonella was quantified using an accepted quantal, most-probable number culture method based on published literature. Air samples were collected at key sites throughout the farm. Airborne microbial concentrations were measured and included total (aerobic/heterotrophic) bacteria, total (aerobic/heterotrophic) fungi, spores of C. perfringens, fecal coliforms, E. coli, and Salmonella. Microbiological air sampling was performed using AGI-30 all-glass impingers with sampling at 12.5 LPM for 30 minutes per sample. Each microorganism was analyzed by culture methods described in the QAPP document from the OPEN team. In addition to culturable airborne microorganisms, airborne endotoxins were collected using personal SKC air samplers at approximately 4 LPM for 4 hours. Samples were analyzed by the Limulus amebocyte lysate (LAL) test. Environmental conditions, including temperature, relative humidity (RH), wind velocity, and solar irradiation, were measured and recorded at specific locations and times when microbial air samples were collected. These microbial measurements took place according to the following schedule: Table 17.1. Pathogen Measurement Schedule and Sample Locations at the Hickory Grove Site
for the Super Soils Composting Technology Date Samples
Collected Air Samples Analyzed Waste Stream Samples Analyzed
Environmental Samples Analyzed
7/19/2004 UB, LB, T IN, SC, EF, PS, C, W F
11/8/2004 UB, LB, T IN, EF, PS, C F
UB, LB, T
12/13/2004
11/15/2004 -- F
-- IN, EF, PS, C --
Phase 2 OPEN Technology Evaluations - Pathogens 69
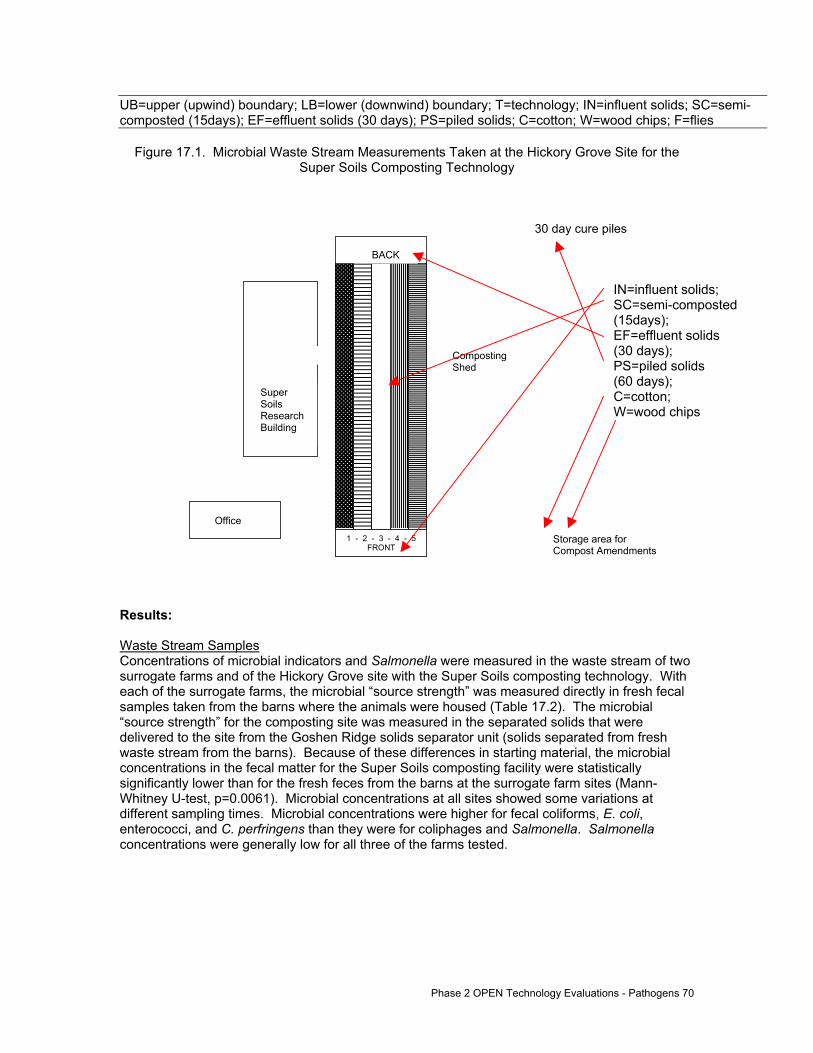
UB=upper (upwind) boundary; LB=lower (downwind) boundary; T=technology; IN=influent solids; SC=semi-composted (15days); EF=effluent solids (30 days); PS=piled solids; C=cotton; W=wood chips; F=flies
Figure 17.1. Microbial Waste Stream Measurements Taken at the Hickory Grove Site for the Super Soils Composting Technology
30 day cure piles
Super Soils Research Building
Office
Composting Shed
Storage area for Compost Amendments
BACK
1 - 2 - 3 - 4 - 5FRONT
IN=influent solids; SC=semi-co(15days); EF=effluent solids (30 days); PS=piled soli(60 days); C=cotton; W=wood chips
mposted
ds
Results: Waste Stream Samples Concentrations of microbial indicators and Salmonella were measured in the waste stream of two surrogate farms and of the Hickory Grove site with the Super Soils composting technology. With each of the surrogate farms, the microbial “source strength” was measured directly in fresh fecal samples taken from the barns where the animals were housed (Table 17.2). The microbial “source strength” for the composting site was measured in the separated solids that were delivered to the site from the Goshen Ridge solids separator unit (solids separated from fresh waste stream from the barns). Because of these differences in starting material, the microbial concentrations in the fecal matter for the Super Soils composting facility were statistically significantly lower than for the fresh feces from the barns at the surrogate farm sites (Mann-Whitney U-test, p=0.0061). Microbial concentrations at all sites showed some variations at different sampling times. Microbial concentrations were higher for fecal coliforms, E. coli, enterococci, and C. perfringens than they were for coliphages and Salmonella. Salmonella concentrations were generally low for all three of the farms tested.
Phase 2 OPEN Technology Evaluations - Pathogens 70
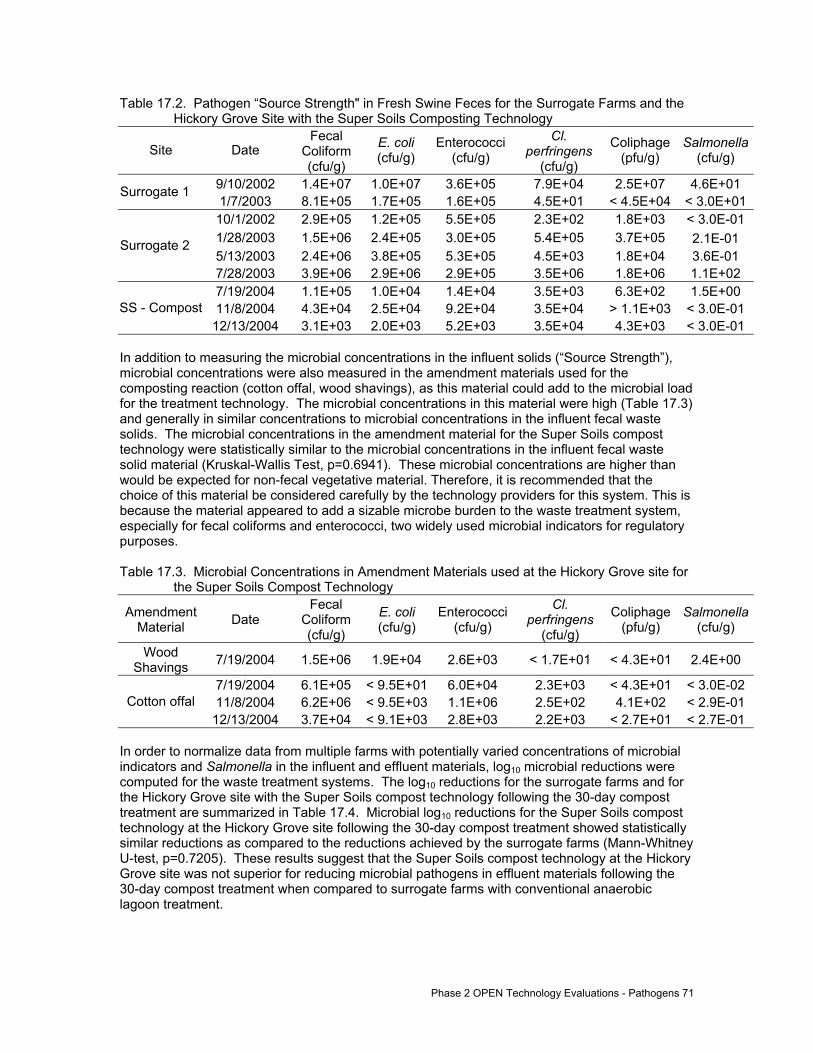
Table 17.2. Pathogen “Source Strength" in Fresh Swine Feces for the Surrogate Farms and the Hickory Grove Site with the Super Soils Composting Technology
Site Date Fecal
Coliform (cfu/g)
E. coli (cfu/g)
Enterococci (cfu/g)
Cl. perfringens
(cfu/g)
Coliphage (pfu/g)
Salmonella (cfu/g)
9/10/2002 1.4E+07 1.0E+07 3.6E+05 7.9E+04 2.5E+07 4.6E+01 Surrogate 1 1/7/2003
2.9E+05 2.3E+02 8.1E+05 1.7E+05 1.6E+05 4.5E+01 < 4.5E+04 < 3.0E+01
10/1/2002 1.2E+05 5.5E+05 1.8E+03 < 3.0E-01 1/28/2003 1.5E+06 2.4E+05
2.4E+06 3.6E-01 Surrogate 2 3.0E+05 5.4E+05 3.7E+05 2.1E-01
5/13/2003 3.8E+05 5.3E+05 4.5E+03 1.8E+04 7/28/2003 3.9E+06 2.9E+06 2.9E+05 3.5E+06 1.8E+06 1.1E+02 7/19/2004 1.1E+05 1.0E+04 1.4E+04 3.5E+03 6.3E+02 1.5E+00 11/8/2004 4.3E+04 2.5E+04 9.2E+04 3.5E+04 > 1.1E+03 < 3.0E-01 SS - Compost
12/13/2004 3.1E+03 2.0E+03 5.2E+03 3.5E+04 4.3E+03 < 3.0E-01 In addition to measuring the microbial concentrations in the influent solids (“Source Strength”), microbial concentrations were also measured in the amendment materials used for the composting reaction (cotton offal, wood shavings), as this material could add to the microbial load for the treatment technology. The microbial concentrations in this material were high (Table 17.3) and generally in similar concentrations to microbial concentrations in the influent fecal waste solids. The microbial concentrations in the amendment material for the Super Soils compost technology were statistically similar to the microbial concentrations in the influent fecal waste solid material (Kruskal-Wallis Test, p=0.6941). These microbial concentrations are higher than would be expected for non-fecal vegetative material. Therefore, it is recommended that the choice of this material be considered carefully by the technology providers for this system. This is because the material appeared to add a sizable microbe burden to the waste treatment system, especially for fecal coliforms and enterococci, two widely used microbial indicators for regulatory purposes. Table 17.3. Microbial Concentrations in Amendment Materials used at the Hickory Grove site for
the Super Soils Compost Technology
Amendment Material Date
Fecal Coliform (cfu/g)
E. coli (cfu/g)
Enterococci (cfu/g)
Cl. perfringens
(cfu/g)
Coliphage (pfu/g)
Salmonella (cfu/g)
Wood Shavings 7/19/2004 1.5E+06 1.9E+04 2.6E+03 < 1.7E+01 < 4.3E+01 2.4E+00
7/19/2004 6.1E+05 < 9.5E+01 6.0E+04 2.3E+03 < 4.3E+01 < 3.0E-02 11/8/2004 6.2E+06 < 9.5E+03 1.1E+06 2.5E+02 4.1E+02 < 2.9E-01 Cotton offal
12/13/2004 3.7E+04 < 9.1E+03 2.8E+03 2.2E+03 < 2.7E+01 < 2.7E-01
In order to normalize data from multiple farms with potentially varied concentrations of microbial indicators and Salmonella in the influent and effluent materials, log10 microbial reductions were computed for the waste treatment systems. The log10 reductions for the surrogate farms and for the Hickory Grove site with the Super Soils compost technology following the 30-day compost treatment are summarized in Table 17.4. Microbial log10 reductions for the Super Soils compost technology at the Hickory Grove site following the 30-day compost treatment showed statistically similar reductions as compared to the reductions achieved by the surrogate farms (Mann-Whitney U-test, p=0.7205). These results suggest that the Super Soils compost technology at the Hickory Grove site was not superior for reducing microbial pathogens in effluent materials following the 30-day compost treatment when compared to surrogate farms with conventional anaerobic lagoon treatment.
Phase 2 OPEN Technology Evaluations - Pathogens 71
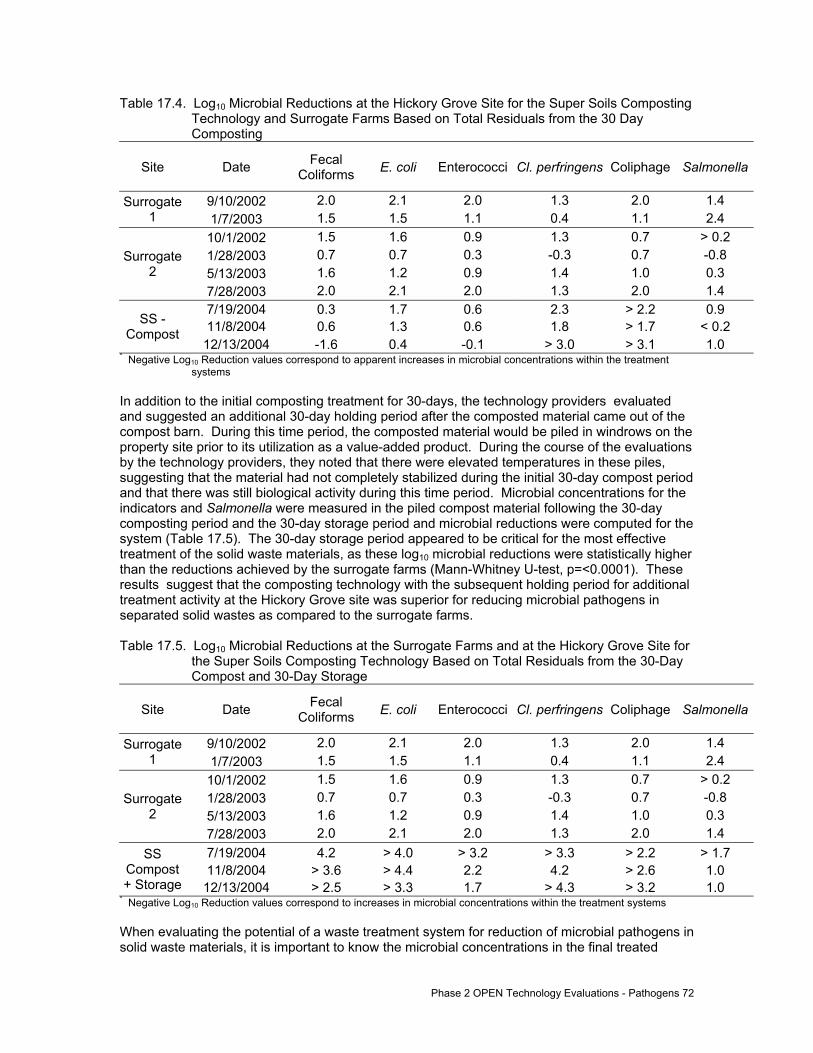
Table 17.4. Log10 Microbial Reductions at the Hickory Grove Site for the Super Soils Composting Technology and Surrogate Farms Based on Total Residuals from the 30 Day Composting
Site Date Fecal Coliforms E. coli Enterococci Cl. perfringens Coliphage Salmonella
9/10/2002 2.0 2.1 2.0 1.3 2.0 1.4 Surrogate 1 1/7/2003 1.5 1.5 1.1 0.4 1.1 2.4
10/1/2002 1.5 1.6 0.9 1.3 0.7 > 0.2 1/28/2003 0.7 0.7 0.3 -0.3 0.7 -0.8 5/13/2003 1.6 1.2 0.9 1.4 1.0 0.3
Surrogate 2
7/28/2003 2.0 2.1 2.0 1.3 2.0 1.4 7/19/2004 0.3 1.7 0.6 2.3 > 2.2 0.9 11/8/2004 0.6 1.3 0.6 1.8 > 1.7 < 0.2 SS -
Compost 12/13/2004 -1.6 0.4 -0.1 > 3.0 > 3.1 1.0
* Negative Log10 Reduction values correspond to apparent increases in microbial concentrations within the treatment systems
In addition to the initial composting treatment for 30-days, the technology providers evaluated and suggested an additional 30-day holding period after the composted material came out of the compost barn. During this time period, the composted material would be piled in windrows on the property site prior to its utilization as a value-added product. During the course of the evaluations by the technology providers, they noted that there were elevated temperatures in these piles, suggesting that the material had not completely stabilized during the initial 30-day compost period and that there was still biological activity during this time period. Microbial concentrations for the indicators and Salmonella were measured in the piled compost material following the 30-day composting period and the 30-day storage period and microbial reductions were computed for the system (Table 17.5). The 30-day storage period appeared to be critical for the most effective treatment of the solid waste materials, as these log10 microbial reductions were statistically higher than the reductions achieved by the surrogate farms (Mann-Whitney U-test, p=<0.0001). These results suggest that the composting technology with the subsequent holding period for additional treatment activity at the Hickory Grove site was superior for reducing microbial pathogens in separated solid wastes as compared to the surrogate farms.
Table 17.5. Log10 Microbial Reductions at the Surrogate Farms and at the Hickory Grove Site for the Super Soils Composting Technology Based on Total Residuals from the 30-Day Compost and 30-Day Storage
Site Date Fecal Coliforms E. coli Enterococci Cl. perfringens Coliphage Salmonella
9/10/2002 2.0 2.1 2.0 1.3 2.0 1.4 Surrogate 1 1/7/2003 1.5 1.5 1.1 0.4 1.1 2.4
10/1/2002 1.5 1.6 0.9 1.3 0.7 > 0.2 1/28/2003 0.7 0.7 0.3 -0.3 0.7 -0.8 5/13/2003 1.6 1.2 0.9 1.4 1.0 0.3
Surrogate 2
7/28/2003 2.0 2.1 2.0 1.3 2.0 1.4 7/19/2004 4.2 > 4.0 > 3.2 > 3.3 > 2.2 > 1.7 11/8/2004 > 3.6 > 4.4 2.2 4.2 > 2.6 1.0
SS Compost + Storage 12/13/2004 > 2.5 > 3.3 1.7 > 4.3 > 3.2 1.0
* Negative Log Reduction values correspond to increases in microbial concentrations within the treatment systems 10 When evaluating the potential of a waste treatment system for reduction of microbial pathogens in solid waste materials, it is important to know the microbial concentrations in the final treated
Phase 2 OPEN Technology Evaluations - Pathogens 72
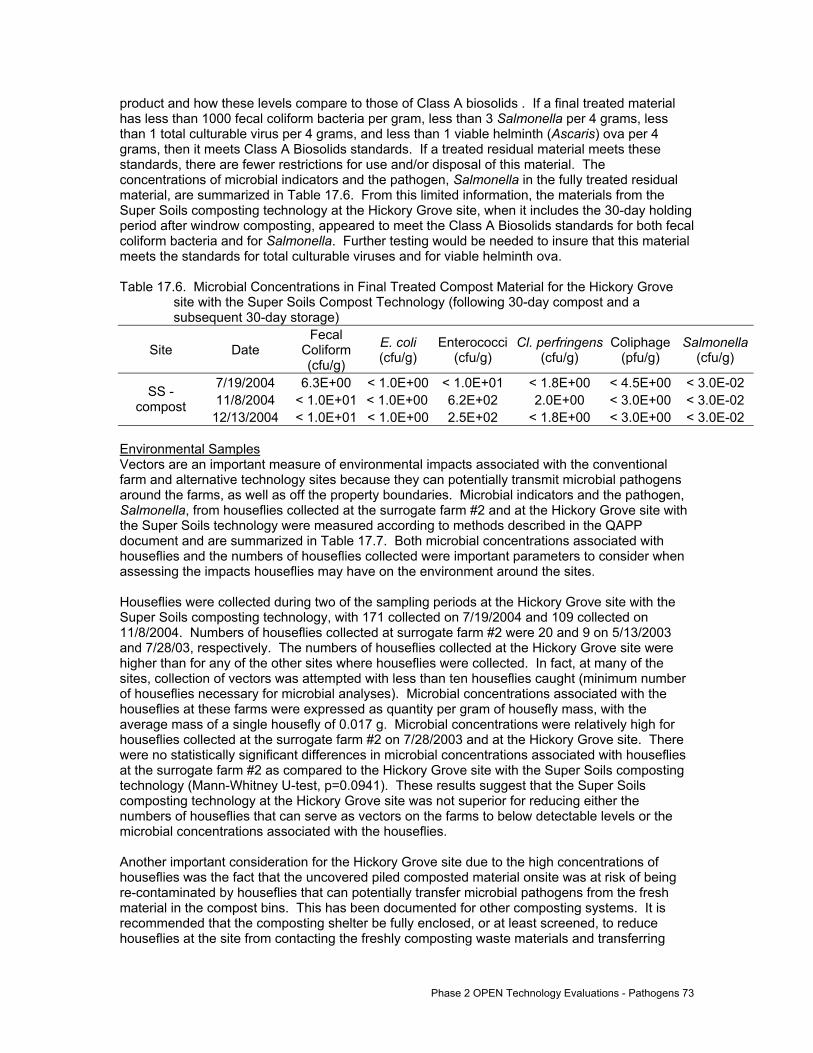
product and how these levels compare to those of Class A biosolids . If a final treated material has less than 1000 fecal coliform bacteria per gram, less than 3 Salmonella per 4 grams, less than 1 total culturable virus per 4 grams, and less than 1 viable helminth (Ascaris) ova per 4 grams, then it meets Class A Biosolids standards. If a treated residual material meets these standards, there are fewer restrictions for use and/or disposal of this material. The concentrations of microbial indicators and the pathogen, Salmonella in the fully treated residual material, are summarized in Table 17.6. From this limited information, the materials from the Super Soils composting technology at the Hickory Grove site, when it includes the 30-day holding period after windrow composting, appeared to meet the Class A Biosolids standards for both fecal coliform bacteria and for Salmonella. Further testing would be needed to insure that this material meets the standards for total culturable viruses and for viable helminth ova. Table 17.6. Microbial Concentrations in Final Treated Compost Material for the Hickory Grove
site with the Super Soils Compost Technology (following 30-day compost and a subsequent 30-day storage)
Site Date Fecal
Coliform (cfu/g)
E. coli (cfu/g)
Enterococci (cfu/g)
Cl. perfringens (cfu/g)
Coliphage (pfu/g)
Salmonella (cfu/g)
7/19/2004 6.3E+00 < 1.0E+00 < 1.0E+01 < 1.8E+00 < 4.5E+00 < 3.0E-02 11/8/2004 < 1.0E+01 < 1.0E+00 6.2E+02 2.0E+00 < 3.0E+00 < 3.0E-02 SS -
compost 12/13/2004 < 1.0E+01 < 1.0E+00 2.5E+02 < 1.8E+00 < 3.0E+00 < 3.0E-02
Environmental Samples Vectors are an important measure of environmental impacts associated with the conventional farm and alternative technology sites because they can potentially transmit microbial pathogens around the farms, as well as off the property boundaries. Microbial indicators and the pathogen, Salmonella, from houseflies collected at the surrogate farm #2 and at the Hickory Grove site with the Super Soils technology were measured according to methods described in the QAPP document and are summarized in Table 17.7. Both microbial concentrations associated with houseflies and the numbers of houseflies collected were important parameters to consider when assessing the impacts houseflies may have on the environment around the sites. Houseflies were collected during two of the sampling periods at the Hickory Grove site with the Super Soils composting technology, with 171 collected on 7/19/2004 and 109 collected on 11/8/2004. Numbers of houseflies collected at surrogate farm #2 were 20 and 9 on 5/13/2003 and 7/28/03, respectively. The numbers of houseflies collected at the Hickory Grove site were higher than for any of the other sites where houseflies were collected. In fact, at many of the sites, collection of vectors was attempted with less than ten houseflies caught (minimum number of houseflies necessary for microbial analyses). Microbial concentrations associated with the houseflies at these farms were expressed as quantity per gram of housefly mass, with the average mass of a single housefly of 0.017 g. Microbial concentrations were relatively high for houseflies collected at the surrogate farm #2 on 7/28/2003 and at the Hickory Grove site. There were no statistically significant differences in microbial concentrations associated with houseflies at the surrogate farm #2 as compared to the Hickory Grove site with the Super Soils composting technology (Mann-Whitney U-test, p=0.0941). These results suggest that the Super Soils composting technology at the Hickory Grove site was not superior for reducing either the numbers of houseflies that can serve as vectors on the farms to below detectable levels or the microbial concentrations associated with the houseflies. Another important consideration for the Hickory Grove site due to the high concentrations of houseflies was the fact that the uncovered piled composted material onsite was at risk of being re-contaminated by houseflies that can potentially transfer microbial pathogens from the fresh material in the compost bins. This has been documented for other composting systems. It is recommended that the composting shelter be fully enclosed, or at least screened, to reduce houseflies at the site from contacting the freshly composting waste materials and transferring
Phase 2 OPEN Technology Evaluations - Pathogens 73
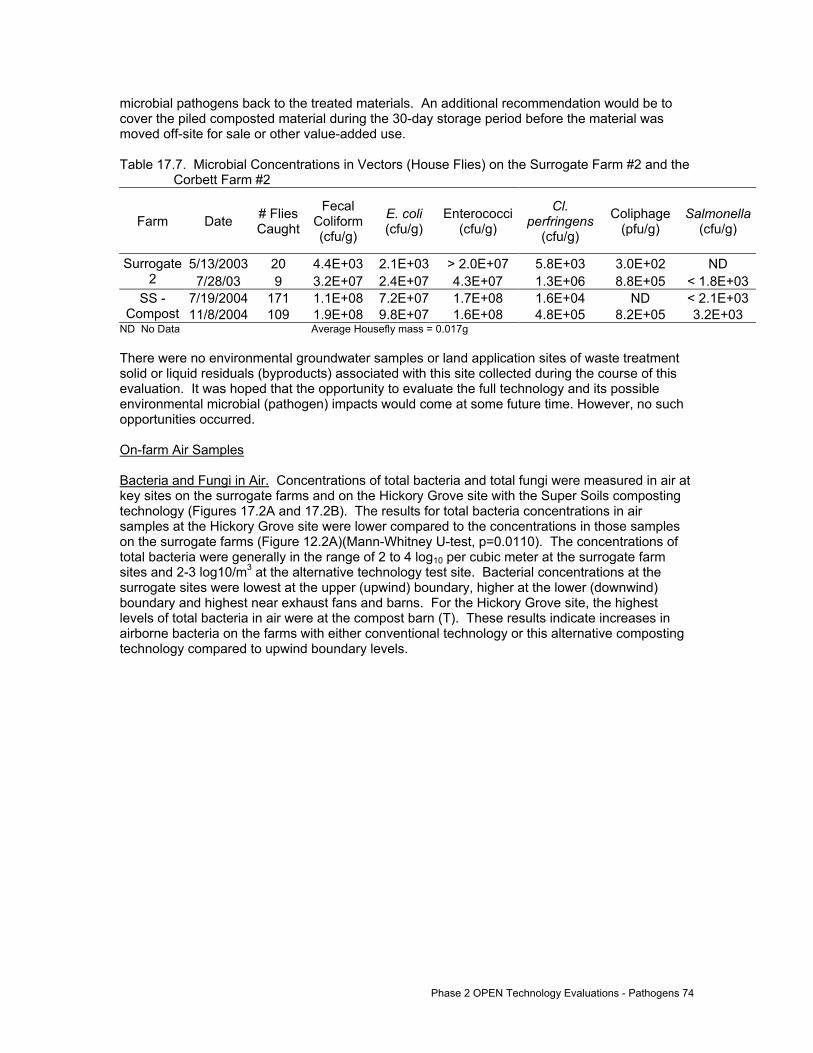
microbial pathogens back to the treated materials. An additional recommendation would be to cover the piled composted material during the 30-day storage period before the material was moved off-site for sale or other value-added use. Table 17.7. Microbial Concentrations in Vectors (House Flies) on the Surrogate Farm #2 and the
Corbett Farm #2
Farm Date # Flies Caught
Fecal Coliform (cfu/g)
E. coli (cfu/g)
Enterococci (cfu/g)
Cl. perfringens
(cfu/g)
Coliphage (pfu/g)
Salmonella (cfu/g)
5/13/2003 20 4.4E+03 2.1E+03 > 2.0E+07 5.8E+03 3.0E+02 ND Surrogate 2 7/28/03 9 3.2E+07 2.4E+07 4.3E+07 1.3E+06 8.8E+05 < 1.8E+03
7/19/2004 171 1.1E+08 7.2E+07 1.7E+08 1.6E+04 ND < 2.1E+03SS - Compost 11/8/2004 109 1.9E+08 9.8E+07 1.6E+08 4.8E+05 8.2E+05 3.2E+03
ND No Data Average Housefly mass = 0.017g There were no environmental groundwater samples or land application sites of waste treatment solid or liquid residuals (byproducts) associated with this site collected during the course of this evaluation. It was hoped that the opportunity to evaluate the full technology and its possible environmental microbial (pathogen) impacts would come at some future time. However, no such opportunities occurred. On-farm Air Samples Bacteria and Fungi in Air. Concentrations of total bacteria and total fungi were measured in air at key sites on the surrogate farms and on the Hickory Grove site with the Super Soils composting technology (Figures 17.2A and 17.2B). The results for total bacteria concentrations in air samples at the Hickory Grove site were lower compared to the concentrations in those samples on the surrogate farms (Figure 12.2A)(Mann-Whitney U-test, p=0.0110). The concentrations of total bacteria were generally in the range of 2 to 4 log10 per cubic meter at the surrogate farm sites and 2-3 log10/m3 at the alternative technology test site. Bacterial concentrations at the surrogate sites were lowest at the upper (upwind) boundary, higher at the lower (downwind) boundary and highest near exhaust fans and barns. For the Hickory Grove site, the highest levels of total bacteria in air were at the compost barn (T). These results indicate increases in airborne bacteria on the farms with either conventional technology or this alternative composting technology compared to upwind boundary levels.
Phase 2 OPEN Technology Evaluations - Pathogens 74
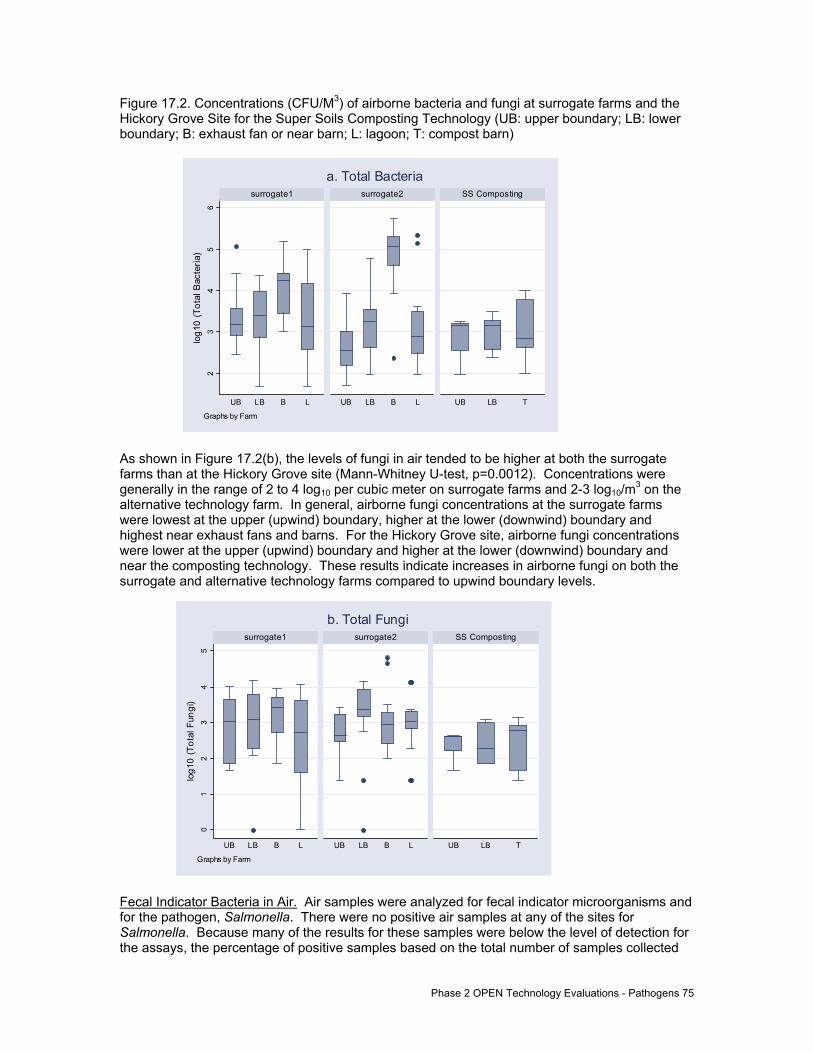
Figure 17.2. Concentrations (CFU/M3) of airborne bacteria and fungi at surrogate farms and the Hickory Grove Site for the Super Soils Composting Technology (UB: upper boundary; LB: lower boundary; B: exhaust fan or near barn; L: lagoon; T: compost barn)
23
45
6
UB LB B L UB LB B L UB LB T
surrogate1 surrogate2 SS Compostinglo
g10
(Tot
al B
acte
ria)
Graphs by Farm
a. Total Bacteria
As shown in Figure 17.2(b), the levels of fungi in air tended to be higher at both the surrogate farms than at the Hickory Grove site (Mann-Whitney U-test, p=0.0012). Concentrations were generally in the range of 2 to 4 log10 per cubic meter on surrogate farms and 2-3 log10/m3 on the alternative technology farm. In general, airborne fungi concentrations at the surrogate farms were lowest at the upper (upwind) boundary, higher at the lower (downwind) boundary and highest near exhaust fans and barns. For the Hickory Grove site, airborne fungi concentrations were lower at the upper (upwind) boundary and higher at the lower (downwind) boundary and near the composting technology. These results indicate increases in airborne fungi on both the surrogate and alternative technology farms compared to upwind boundary levels.
01
23
45
UB LB B L UB LB B L UB LB T
surrogate1 surrogate2 SS Composting
log1
0 (T
otal
Fun
gi)
Graphs by Farm
b. Total Fungi
Fecal Indicator Bacteria in Air. Air samples were analyzed for fecal indicator microorganisms and for the pathogen, Salmonella. There were no positive air samples at any of the sites for Salmonella. Because many of the results for these samples were below the level of detection for the assays, the percentage of positive samples based on the total number of samples collected
Phase 2 OPEN Technology Evaluations - Pathogens 75
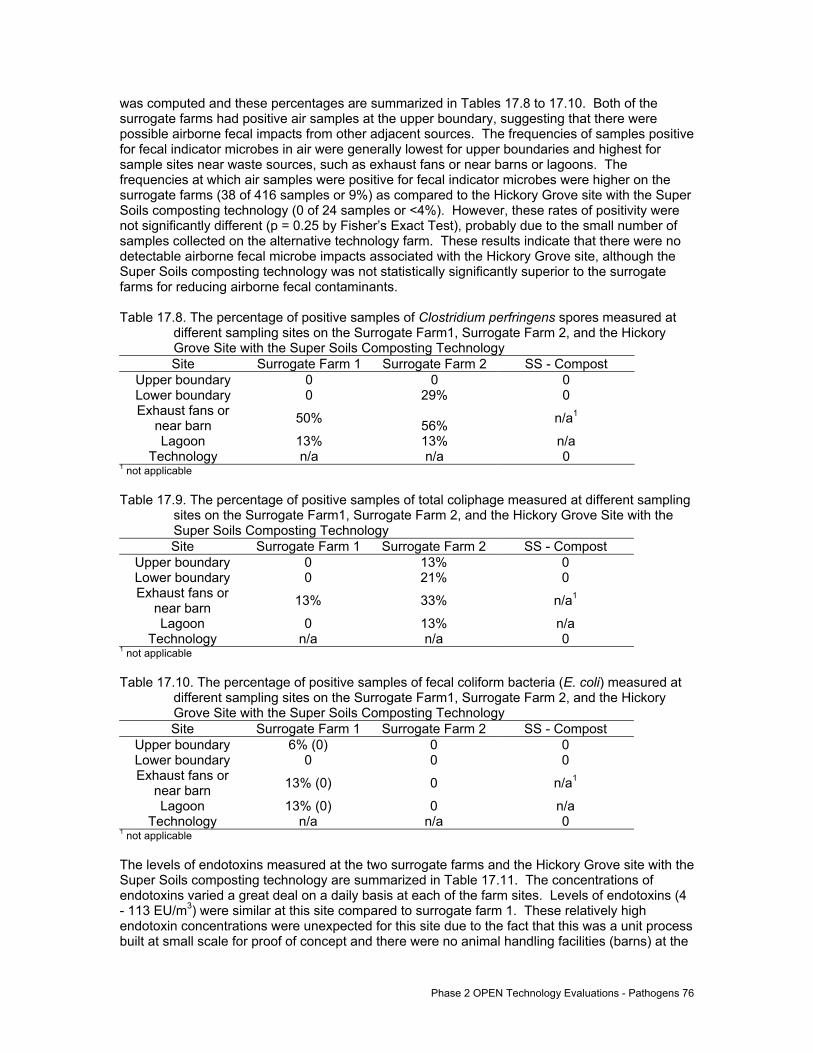
was computed and these percentages are summarized in Tables 17.8 to 17.10. Both of the surrogate farms had positive air samples at the upper boundary, suggesting that there were possible airborne fecal impacts from other adjacent sources. The frequencies of samples positive for fecal indicator microbes in air were generally lowest for upper boundaries and highest for sample sites near waste sources, such as exhaust fans or near barns or lagoons. The frequencies at which air samples were positive for fecal indicator microbes were higher on the surrogate farms (38 of 416 samples or 9%) as compared to the Hickory Grove site with the Super Soils composting technology (0 of 24 samples or <4%). However, these rates of positivity were not significantly different (p = 0.25 by Fisher’s Exact Test), probably due to the small number of samples collected on the alternative technology farm. These results indicate that there were no detectable airborne fecal microbe impacts associated with the Hickory Grove site, although the Super Soils composting technology was not statistically significantly superior to the surrogate farms for reducing airborne fecal contaminants. Table 17.8. The percentage of positive samples of Clostridium perfringens spores measured at
different sampling sites on the Surrogate Farm1, Surrogate Farm 2, and the Hickory Grove Site with the Super Soils Composting Technology Site Surrogate Farm 1 Surrogate Farm 2 SS - Compost
Upper boundary 0 0 0 Lower boundary 0 29% 0 Exhaust fans or
near barn 50% 56% n/a1
Lagoon 13% 13% n/a Technology n/a n/a 0
1 not applicable
Table 17.9. The percentage of positive samples of total coliphage measured at different sampling sites on the Surrogate Farm1, Surrogate Farm 2, and the Hickory Grove Site with the Super Soils Composting Technology Site Surrogate Farm 1 Surrogate Farm 2 SS - Compost
Upper boundary 0 13% 0 Lower boundary 0 21% 0 Exhaust fans or
near barn 13% 33% n/a1
Lagoon 0 13% n/a Technology n/a n/a 0
1 not applicable Table 17.10. The percentage of positive samples of fecal coliform bacteria (E. coli) measured at
different sampling sites on the Surrogate Farm1, Surrogate Farm 2, and the Hickory Grove Site with the Super Soils Composting Technology Site Surrogate Farm 1 Surrogate Farm 2 SS - Compost
Upper boundary 6% (0) 0 0 Lower boundary 0 0 0 Exhaust fans or
near barn 13% (0) 0 n/a1
Lagoon 13% (0) 0 n/a Technology n/a n/a 0
1 not applicable The levels of endotoxins measured at the two surrogate farms and the Hickory Grove site with the Super Soils composting technology are summarized in Table 17.11. The concentrations of endotoxins varied a great deal on a daily basis at each of the farm sites. Levels of endotoxins (4 - 113 EU/m3) were similar at this site compared to surrogate farm 1. These relatively high endotoxin concentrations were unexpected for this site due to the fact that this was a unit process built at small scale for proof of concept and there were no animal handling facilities (barns) at the
Phase 2 OPEN Technology Evaluations - Pathogens 76

site. However, increased airborne levels of endotoxins have been previously reported for composting facilities and other solid waste management facilities. The concentrations of endotoxins at the lower boundary were higher than (surrogate farm 2) or similar to (surrogate farm 1) those at the upper boundary for the surrogate farm sites, however, the endotoxin concentrations were actually higher at the upper boundary than at the lower boundary for the Hickory Grove site with the Super Soils composting technology. This suggests that this site was impacted by endotoxins released from an upwind source relative to the technology. However, it should be noted that the highest endotoxin levels were detected in air samples at the technology of this site. These results suggest that there were environmental impacts associated with endotoxins from the Super Soils compost technology at the Hickory Grove site. Table 17.11. The levels of endotoxin from airborne dust at sampling sites
Summary Day 1 Day 2 Day 3 Day 4 Day 5 Day 6 Day 7 Mean SD Location Sites
Concentration (EU/m3) Upper Boundary 20 5 107 49 n/d1 n/d n/d 45 45
9 8 47 217 n/d n/d n/d 70 100 62 358 481 n/d n/d n/d 243 210
Near Barn 2 217 48 510 510 n/d n/d n/d 321 229 160 14 108 23 n/d n/d n/d 76 70
Surrogate 1
6 121 47 n/d n/d n/d 45 54 Upper Boundary 1 1 15 31 6 21 2 11 12
Exhaust fan 1 28 312 2940 290 1861 288 55 825 1126Exhaust fan 2 225 n/d 2869 84 n/d n/d n/d 1059 1569
Lagoon 3 2 68 26 13 10 21 20 23 Surrogate 2
Lower Boundary 3 3 97 26 23 30 4 26 33 Upper Boundary 12 30 24 n/d n/d n/d n/d 22 9
Technology 6 113 95 n/d n/d n/d n/d 71 57 SS -
Compost Lower Boundary 4 23 16 n/d n/d n/d n/d 14 10
Upper Wind Near Barn 1 70
Lagoon Lower Boundary 5
1 not done; 2 below limit of detection Environmental conditions were recorded simultaneously at the points on the sites where air samples were collected, with these values summarized in Table 17.12. Temperatures were somewhat variable for the different sample days for each of the farm sites, as would be expected due to the varied seasonality of sample collection. Mean relative humidity, mean wind velocity, and mean solar irradiation were similar for each of the farms tested. Table 17.12. Summary of environmental conditions during microbial air sampling at the Surrogate
Farm1, Surrogate Farm 2, and the Hickory Grove Site with the Super Soils Composting Technology
(a) Temperature (°C)
Farm Day 1 Day 2 Day 3 Day 4 Day 5 Day 6 Day 7 Mean ± SD
Surrogate 1 27±1°C 23±5 °C 1±1 °C -2 ±1°C n/a n/a 13±14°C
Surrogate 2 31±3°C 30±2°C 8±3°C 19±3°C 25±1°C 32±2°C 33±3°C 25±9°C
SS - Compost 29±2°C 25±3°C 17±1°C n/a n/a n/a n/a 24±6°C
n/a1
Phase 2 OPEN Technology Evaluations - Pathogens 77
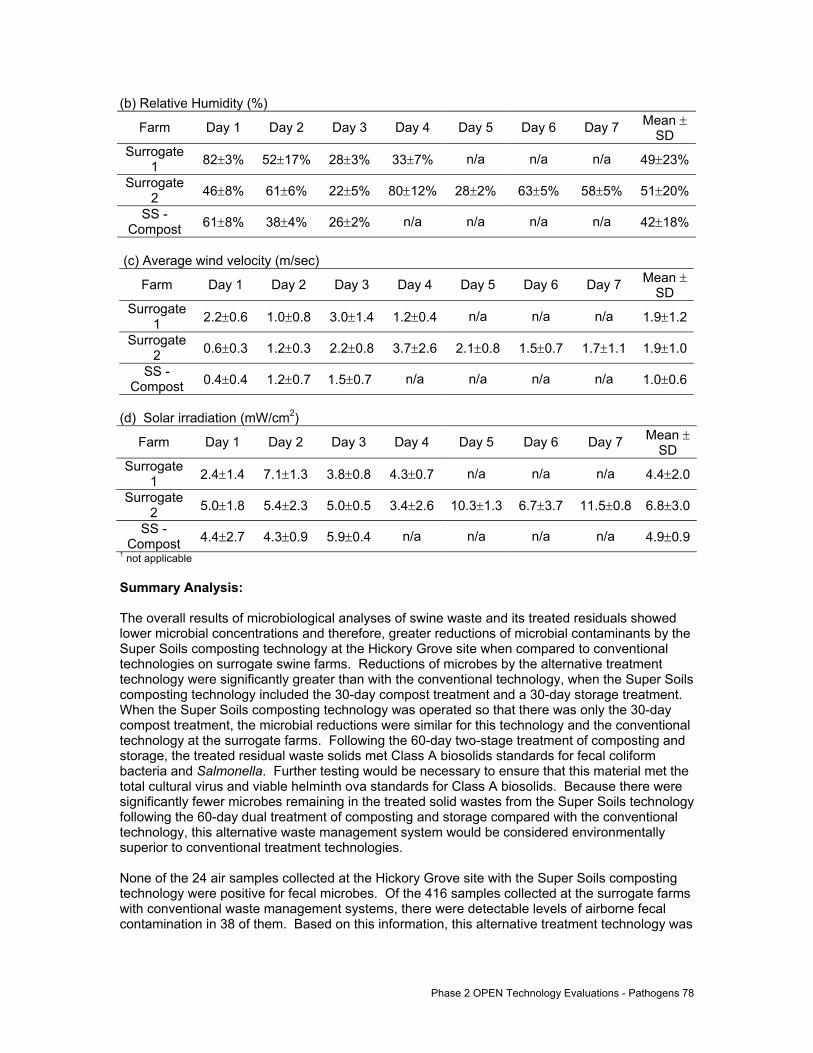
(b) Relative Humidity (%)
Farm Day 1 Day 2 Day 3 Day 4 Day 5 Day 6 Day 7 Mean ± SD
Surrogate 1 82±3% 52±17% 28±3% 33±7% n/a n/a n/a 49±23%
Surrogate 2 46±8% 61±6% 22±5% 80±12% 28±2% 63±5% 58±5% 51±20%
SS - Compost 61±8% 38±4% 26±2% n/a n/a n/a n/a 42±18%
(c) Average wind velocity (m/sec)
Farm Day 1 Day 2 Day 3 Day 4 Day 5 Day 6 Day 7 Mean ± SD
Surrogate 1 2.2±0.6 1.0±0.8 3.0±1.4 1.2±0.4 n/a n/a n/a 1.9±1.2
Surrogate 2 0.6±0.3 1.2±0.3 2.2±0.8 3.7±2.6 2.1±0.8 1.5±0.7 1.7±1.1 1.9±1.0
SS - Compost 0.4±0.4 1.2±0.7 1.5±0.7 n/a n/a n/a n/a 1.0±0.6
(d) Solar irradiation (mW/cm2)
1 not applicable
Farm Day 1 Day 2 Day 3 Day 4 Day 5 Day 6 Day 7 Mean ± SD
Surrogate 1 2.4±1.4 7.1±1.3 3.8±0.8 4.3±0.7 n/a n/a n/a 4.4±2.0
Surrogate 2 5.0±1.8 5.4±2.3 5.0±0.5 3.4±2.6 10.3±1.3 6.7±3.7 11.5±0.8 6.8±3.0
SS - Compost 4.4±2.7 4.3±0.9 5.9±0.4 n/a n/a n/a n/a 4.9±0.9
Summary Analysis: The overall results of microbiological analyses of swine waste and its treated residuals showed lower microbial concentrations and therefore, greater reductions of microbial contaminants by the Super Soils composting technology at the Hickory Grove site when compared to conventional technologies on surrogate swine farms. Reductions of microbes by the alternative treatment technology were significantly greater than with the conventional technology, when the Super Soils composting technology included the 30-day compost treatment and a 30-day storage treatment. When the Super Soils composting technology was operated so that there was only the 30-day compost treatment, the microbial reductions were similar for this technology and the conventional technology at the surrogate farms. Following the 60-day two-stage treatment of composting and storage, the treated residual waste solids met Class A biosolids standards for fecal coliform bacteria and Salmonella. Further testing would be necessary to ensure that this material met the total cultural virus and viable helminth ova standards for Class A biosolids. Because there were significantly fewer microbes remaining in the treated solid wastes from the Super Soils technology following the 60-day dual treatment of composting and storage compared with the conventional technology, this alternative waste management system would be considered environmentally superior to conventional treatment technologies. None of the 24 air samples collected at the Hickory Grove site with the Super Soils composting technology were positive for fecal microbes. Of the 416 samples collected at the surrogate farms with conventional waste management systems, there were detectable levels of airborne fecal contamination in 38 of them. Based on this information, this alternative treatment technology was
Phase 2 OPEN Technology Evaluations - Pathogens 78
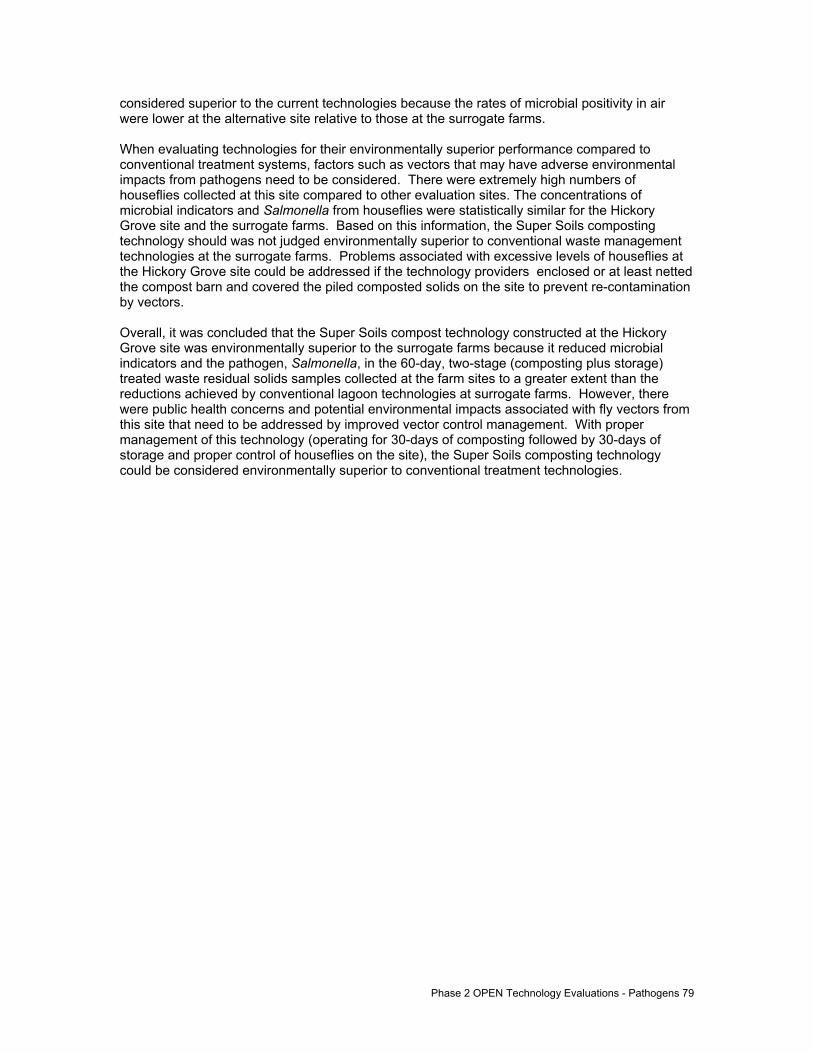
considered superior to the current technologies because the rates of microbial positivity in air were lower at the alternative site relative to those at the surrogate farms. When evaluating technologies for their environmentally superior performance compared to conventional treatment systems, factors such as vectors that may have adverse environmental impacts from pathogens need to be considered. There were extremely high numbers of houseflies collected at this site compared to other evaluation sites. The concentrations of microbial indicators and Salmonella from houseflies were statistically similar for the Hickory Grove site and the surrogate farms. Based on this information, the Super Soils composting technology should was not judged environmentally superior to conventional waste management technologies at the surrogate farms. Problems associated with excessive levels of houseflies at the Hickory Grove site could be addressed if the technology providers enclosed or at least netted the compost barn and covered the piled composted solids on the site to prevent re-contamination by vectors. Overall, it was concluded that the Super Soils compost technology constructed at the Hickory Grove site was environmentally superior to the surrogate farms because it reduced microbial indicators and the pathogen, Salmonella, in the 60-day, two-stage (composting plus storage) treated waste residual solids samples collected at the farm sites to a greater extent than the reductions achieved by conventional lagoon technologies at surrogate farms. However, there were public health concerns and potential environmental impacts associated with fly vectors from this site that need to be addressed by improved vector control management. With proper management of this technology (operating for 30-days of composting followed by 30-days of storage and proper control of houseflies on the site), the Super Soils composting technology could be considered environmentally superior to conventional treatment technologies.
Phase 2 OPEN Technology Evaluations - Pathogens 79
18. Antimicrobial Resistance Occurrence and Patterns in E. coli and Salmonella Isolated from
Phase 1 and Phase 2 Alternative Technologies and Surrogate Farm Sites Project OPEN Science Team for Pathogens
Antimicrobial Resistance of Bacteria collected from Surrogate Farms and Farms with Alternative Waste Management Systems This section of the report summarizes the essential study findings on the performance of the alternative swine waste technologies for presence and reductions of antimicrobial resistance for E. coli and Salmonella relative to the antimicrobial resistance for bacteria isolated from the surrogate farms and relative to each other. Antimicrobial resistance analyses were performed on bacteria isolates from ten swine farms: the two surrogate farms and eight of the farms with alternative technologies. The alternative technology farms include the Goshen Ridge farm with the Super Soils technology for treatment of liquid wastes, the Hickory Grove site with the Super Soils composting technology for the waste solids from the Goshen Ridge farm, Grinnells laboratory with the ReCycle belt system, the Lake Wheeler Research farm with the ReCycle gasifier, the Harrells farm with the ISSUES technology, the Carrolls farm with the ISSUES technology, the Vestal farm with the ISSUES technology, and the Barham farm with a covered ambient temperature digester, biological nitrification of digester liquid effluent and recycle of the nitrified effluent for fertilization of greenhouse tomatoes. Both E. coli and Salmonella were chosen for antibiotic testing because it is possible for each of them to cause disease outbreaks in animals and humans. Salmonella is clearly a frank pathogen. Although it is not always a frank pathogen, since antibiotic resistance can be caused by genetic material on plasmids that can be transferred from one bacteria to another, multiple antibiotic resistance is also important for E. coli. Furthermore, some strains of E. coli harbored by animals are human pathogens, such as E. coli O157:H7. It may be possible that the widespread antibiotic resistance seen in the E. coli isolates, including the non-pathogenic strains, can be transferred to other frank pathogens, such as pathogenic strains of E. coli, Salmonella and Campylobacter. In order to judge alternative technologies superior to conventional technologies, it is important to understand both the concentrations of bacteria (E. coli and Salmonella), as well as the antimicrobial resistance traits of these bacteria. A superior technology would be one that reduced both the concentrations of bacteria, as well as those populations of bacteria with antimicrobial resistant properties, in the treated waste residuals from the system. For the antimicrobial resistance testing of these bacterial isolates from swine farms, a micro-dilution method was used as described in detail in the QAPP document for this project. Bacterial isolates were tested for their resistance to nine different antibiotics: streptomycin (STR), chlortetracycline (CTET), tetracycline (TET), trimethoprim (TMP), sulfamethoxazole (SMX), chloramphenicol (CHL), ciprofloxacin (CIP), gentamicin (GEN), and ampicillin (AMP). Briefly, bacteria were isolated from waste stream, air, and environmental samples from the farms. Such isolation was a subsequent step following enumeration of the bacteria for evaluation of remaining microbial concentrations in treatment residuals and environmental media potentially impacted the systems and determination of microbial reductions by treatment processes. The bacterial isolates were purified by three successive pure colony isolation procedures and resulting isolates were subjected to biochemical confirmation of their identity (i.e. E. coli or Salmonella). Provided the isolates confirmed as the bacteria of interest, they were then diluted to a proper concentration for testing by analysis on antimicrobial microtiter plates for sensitivity assay. The microtiter plates have varying concentrations of the antibiotics of interest pre-distributed to wells on the plates and equal amounts of bacteria are inoculated to each of the wells. Following a 24-hour incubation, wells are scored as positive (antimicrobially resistant) or negative (antimicrobially sensitive) for bacterial growth.
Phase 2 OPEN Technology Evaluations - Pathogens 80

From this information, a minimum inhibitory concentration (MIC) for each antibiotic can be calculated. This MIC corresponds to the least amount of each antibiotic that is required to inhibit growth of the bacterial isolate. Depending on the MIC, the E. coli and Salmonella isolates were classified into susceptible or resistant categories based on the breakpoints for humans set by the National Committee for Clinical Laboratory Standards (NCCLS). This classification was used instead of any corresponding MICs for animals because of the interest in human public health impacts associated with antimicrobial resistant bacteria from these farms. An additional use for antimicrobial resistance patterning is for microbial source tracking, where it is possible compare the numbers and types of antimicrobials detected in the waste stream samples on the farms to those from environmental samples (i.e. air, ground and surface waters, and soils and vegetation from land application sites on the farms of treated residual material). Unfortunately, we were unable to isolate a sufficient number of E. coli and Salmonella from environmental samples to effectively make these comparisons for microbial source tracking analysis. Where environmental isolates were collected, they are noted in the report. Sources of Bacterial Isolates on Farms
Source
Bacterial isolates used for determining antimicrobial resistance were collected from throughout the waste streams on each of the test farms. These locations are summarized in Tables 18.1 to 18.10. For each of the farm sites, an attempt was made to collect equivalent numbers of isolates from each of the sample locations on the farms. This was possible for E. coli due to the sizeable number of isolated colonies, but it was not always possible for Salmonella because few if any of these bacteria were isolated from some sites and samples. Surrogate farm 1 was a commercial swine farm that used a conventional waste treatment system consisting of an anaerobic lagoon and sprayfield. This system flushed wastes from the barns into a conventional anaerobic lagoon system. Nineteen E. coli and twenty Salmonella isolates that were tested from Farm 1, and their sources are summarized in Table 18.1.
Table 18.1 Sources of E. coli and Salmonella isolates from Surrogate Farm 1
# of E. coli isolates (n=19)
# of Salmonella isolates (n=20)
Fresh Feces 6 3 Influent to Lagoon 6 8 Lagoon 7 8
(n=33)
Surrogate farm 2 was a commercial swine farm that used a conventional waste treatment system consisting of an anaerobic lagoon and sprayfield in which the waste from the barn was flushed into an anaerobic lagoon. Thirty-one E. coli isolates and 33 Salmonella isolates were collected and analyzed. Isolates were also collected and analyzed from environmental samples of soils and vegetation to which lagoon liquid had been land applied in accordance with the waste management plan for the farm. The locations from which bacteria were isolated on the surrogate farm 2 are summarized in Table 18.2. Table 18.2 Sources of E. coli and Salmonella isolates from Surrogate Farm 2
Source # of E. coli
isolates (n=31)
# of Salmonella isolates
Fresh Feces 8 10 Influent to Lagoon 6 7 Lagoon 9 13 Environmental 8 3
Phase 2 OPEN Technology Evaluations - Pathogens 81

The Barham Farm used an alternative waste treatment system employing an in-ground, covered, ambient temperature, anaerobic digester and biofilters for nitrification of digester effluent that was first stored briefly in a lagoon. Treated effluent from the system was used in a drip irrigation system with additional micronutrients provided as supplemental material for growing greenhouse tomatoes. Twenty-three E. coli isolates and 30 Salmonella isolates were tested from the Barham Farm and the locations are summarized in Table 18.3. Table 18.3 Sources of E. coli and Salmonella isolates from the Barham Farm with the Covered Anaerobic Digester, Biofilters, and Irrigation for Greenhouse Tomatoes
Source # of E. coli
Isolates (n=23)
# of Salmonella isolates (n=30)
Fresh Feces 4 2 Digester Influent 4 8 Digester Effluent 5 8 First Biofilter 4 10 Second Biofilter 4 0 Greenhouse Leached Effluent 2 2 The Goshen Ridge Farm with the Super Soils technology used an alternative waste treatment system consisting of initial separation of waste solids from waste liquid, followed by further treatment of the separated liquid by a series of biological processes and a chemical precipitation process for phosphorous. Seventeen E. coli isolates and 20 Salmonella isolates were collected and analyzed for antimicrobial resistance, and the sources of these isolates are shown in Table 18.4. Table 18.4 Sources of E. coli and Salmonella isolates from the Goshen Ridge Farm with the Super Soils Technology for Treatment on Waste Liquids
Source # of E. coli
isolates (n=17)
# of Salmonella isolates (n=20)
Fresh Feces 3 4 Solid Separator 2 4 Barn Flush 3 4 Influent to Denitrification Tank 3 0 Homogenation Tank 2 5 Post-Phosphorus Solids 2 0 Effluent from settling tank (solids/nitrogen removed; no phosphorous removal) 2 0
The Grinnell’s laboratory system (Koger/van Kempen ReCycle Belt Conveyor System) was designed to separate the liquid and solid wastes, and was not specifically aimed at waste treatment for pathogen reduction. This technology was linked with the ReCycle gasifier system at the Lake Wheeler Research farm. This was a pilot-scale facility the final fate of the separated liquid (urine) from the system was not specified. Six E. coli isolates were collected and analyzed for antimicrobial resistance, and the sources of these isolates are shown in Table 18.5. Table 18.5 Sources of E. coli isolates from the ReCycle Belt System at the Grinnells Laboratory
Source # of E. coli
isolates (n=6)
Feces from belt 5 Urine 1
Phase 2 OPEN Technology Evaluations - Pathogens 82
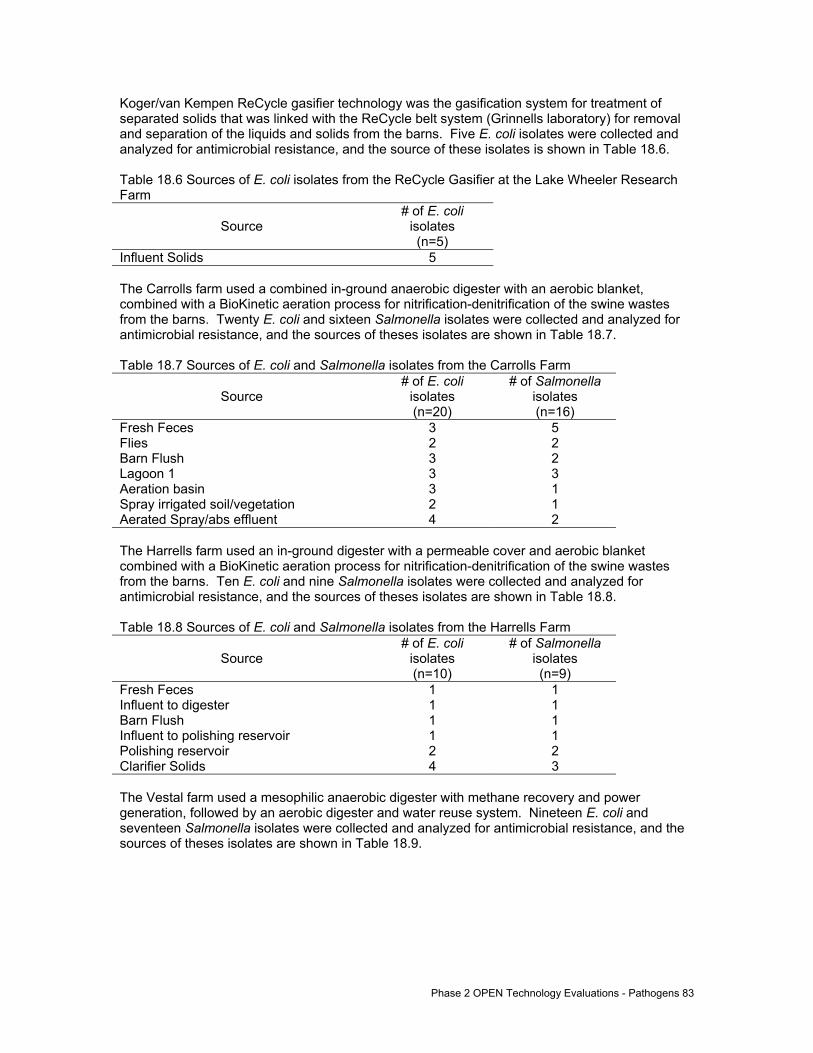
Koger/van Kempen ReCycle gasifier technology was the gasification system for treatment of separated solids that was linked with the ReCycle belt system (Grinnells laboratory) for removal and separation of the liquids and solids from the barns. Five E. coli isolates were collected and analyzed for antimicrobial resistance, and the source of these isolates is shown in Table 18.6.
The Carrolls farm used a combined in-ground anaerobic digester with an aerobic blanket, combined with a BioKinetic aeration process for nitrification-denitrification of the swine wastes from the barns. Twenty E. coli and sixteen Salmonella isolates were collected and analyzed for antimicrobial resistance, and the sources of theses isolates are shown in Table 18.7.
Table 18.6 Sources of E. coli isolates from the ReCycle Gasifier at the Lake Wheeler Research Farm
Source # of E. coli
isolates (n=5)
Influent Solids 5
Table 18.7 Sources of E. coli and Salmonella isolates from the Carrolls Farm
Source # of E. coli
isolates (n=20)
# of Salmonella isolates (n=16)
Fresh Feces 3 5 Flies 2 2 Barn Flush 3 2 Lagoon 1 3 3 Aeration basin 3 1 Spray irrigated soil/vegetation 2 1 Aerated Spray/abs effluent 4 2 The Harrells farm used an in-ground digester with a permeable cover and aerobic blanket combined with a BioKinetic aeration process for nitrification-denitrification of the swine wastes from the barns. Ten E. coli and nine Salmonella isolates were collected and analyzed for antimicrobial resistance, and the sources of theses isolates are shown in Table 18.8. Table 18.8 Sources of E. coli and Salmonella isolates from the Harrells Farm
Source # of E. coli
isolates (n=10)
# of Salmonella isolates (n=9)
Fresh Feces 1 1 Influent to digester 1 1 Barn Flush 1 1 Influent to polishing reservoir 1 1 Polishing reservoir 2 2 Clarifier Solids 4 3 The Vestal farm used a mesophilic anaerobic digester with methane recovery and power generation, followed by an aerobic digester and water reuse system. Nineteen E. coli and seventeen Salmonella isolates were collected and analyzed for antimicrobial resistance, and the sources of theses isolates are shown in Table 18.9.
Phase 2 OPEN Technology Evaluations - Pathogens 83
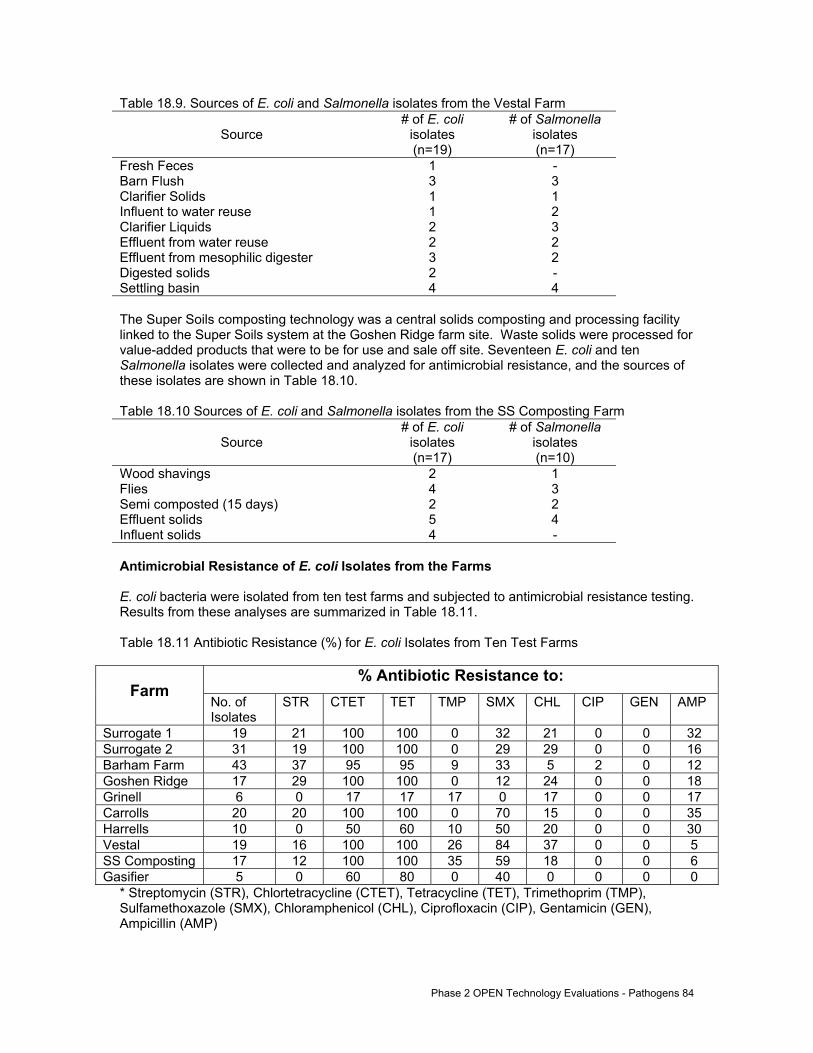
Table 18.9. Sources of E. coli and Salmonella isolates from the Vestal Farm
Source # of E. coli
isolates (n=19)
# of Salmonella isolates (n=17)
Fresh Feces 1 - Barn Flush 3 3 Clarifier Solids 1 1 Influent to water reuse 1 2 Clarifier Liquids 2 3 Effluent from water reuse 2 2 Effluent from mesophilic digester 3 2 Digested solids 2 - Settling basin 4 4 The Super Soils composting technology was a central solids composting and processing facility linked to the Super Soils system at the Goshen Ridge farm site. Waste solids were processed for value-added products that were to be for use and sale off site. Seventeen E. coli and ten Salmonella isolates were collected and analyzed for antimicrobial resistance, and the sources of these isolates are shown in Table 18.10. Table 18.10 Sources of E. coli and Salmonella isolates from the SS Composting Farm
Source # of E. coli
isolates (n=17)
# of Salmonella isolates (n=10)
Wood shavings 2 1 Flies 4 3 Semi composted (15 days) 2 2 Effluent solids 5 4 Influent solids 4 - Antimicrobial Resistance of E. coli Isolates from the Farms E. coli bacteria were isolated from ten test farms and subjected to antimicrobial resistance testing. Results from these analyses are summarized in Table 18.11. Table 18.11 Antibiotic Resistance (%) for E. coli Isolates from Ten Test Farms
% Antibiotic Resistance to: Farm
No. of Isolates
STR CTET TET TMP SMX CHL CIP GEN AMP
Surrogate 1 19 21 100 100 0 32 21 0 0 32 Surrogate 2 31 19 100 100 0 29 29 0 0 16 Barham Farm 43 37 95 95 9 33 5 2 0 12 Goshen Ridge 17 29 100 100 0 12 24 0 0 18 Grinell 6 0 17 17 17 0 17 0 0 17 Carrolls 20 20 100 100 0 70 15 0 0 35 Harrells 10 0 50 60 10 50 20 0 0 30 Vestal 19 16 100 100 26 84 37 0 0 5 SS Composting 17 12 100 100 35 59 18 0 0 6 Gasifier 5 0 60 80 0 40 0 0 0 0
* Streptomycin (STR), Chlortetracycline (CTET), Tetracycline (TET), Trimethoprim (TMP), Sulfamethoxazole (SMX), Chloramphenicol (CHL), Ciprofloxacin (CIP), Gentamicin (GEN), Ampicillin (AMP)
Phase 2 OPEN Technology Evaluations - Pathogens 84
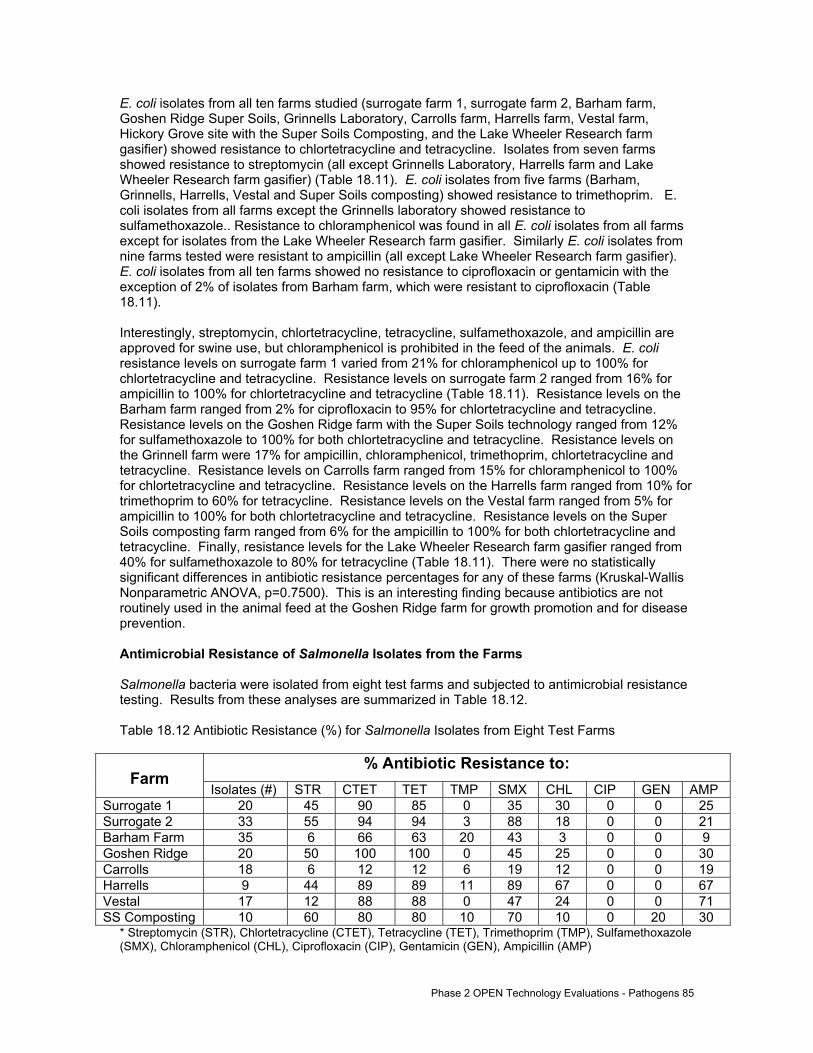
E. coli isolates from all ten farms studied (surrogate farm 1, surrogate farm 2, Barham farm, Goshen Ridge Super Soils, Grinnells Laboratory, Carrolls farm, Harrells farm, Vestal farm, Hickory Grove site with the Super Soils Composting, and the Lake Wheeler Research farm gasifier) showed resistance to chlortetracycline and tetracycline. Isolates from seven farms showed resistance to streptomycin (all except Grinnells Laboratory, Harrells farm and Lake Wheeler Research farm gasifier) (Table 18.11). E. coli isolates from five farms (Barham, Grinnells, Harrells, Vestal and Super Soils composting) showed resistance to trimethoprim. E. coli isolates from all farms except the Grinnells laboratory showed resistance to sulfamethoxazole.. Resistance to chloramphenicol was found in all E. coli isolates from all farms except for isolates from the Lake Wheeler Research farm gasifier. Similarly E. coli isolates from nine farms tested were resistant to ampicillin (all except Lake Wheeler Research farm gasifier). E. coli isolates from all ten farms showed no resistance to ciprofloxacin or gentamicin with the exception of 2% of isolates from Barham farm, which were resistant to ciprofloxacin (Table 18.11). Interestingly, streptomycin, chlortetracycline, tetracycline, sulfamethoxazole, and ampicillin are approved for swine use, but chloramphenicol is prohibited in the feed of the animals. E. coli resistance levels on surrogate farm 1 varied from 21% for chloramphenicol up to 100% for chlortetracycline and tetracycline. Resistance levels on surrogate farm 2 ranged from 16% for ampicillin to 100% for chlortetracycline and tetracycline (Table 18.11). Resistance levels on the Barham farm ranged from 2% for ciprofloxacin to 95% for chlortetracycline and tetracycline. Resistance levels on the Goshen Ridge farm with the Super Soils technology ranged from 12% for sulfamethoxazole to 100% for both chlortetracycline and tetracycline. Resistance levels on the Grinnell farm were 17% for ampicillin, chloramphenicol, trimethoprim, chlortetracycline and tetracycline. Resistance levels on Carrolls farm ranged from 15% for chloramphenicol to 100% for chlortetracycline and tetracycline. Resistance levels on the Harrells farm ranged from 10% for trimethoprim to 60% for tetracycline. Resistance levels on the Vestal farm ranged from 5% for ampicillin to 100% for both chlortetracycline and tetracycline. Resistance levels on the Super Soils composting farm ranged from 6% for the ampicillin to 100% for both chlortetracycline and tetracycline. Finally, resistance levels for the Lake Wheeler Research farm gasifier ranged from 40% for sulfamethoxazole to 80% for tetracycline (Table 18.11). There were no statistically significant differences in antibiotic resistance percentages for any of these farms (Kruskal-Wallis Nonparametric ANOVA, p=0.7500). This is an interesting finding because antibiotics are not routinely used in the animal feed at the Goshen Ridge farm for growth promotion and for disease prevention. Antimicrobial Resistance of Salmonella Isolates from the Farms Salmonella bacteria were isolated from eight test farms and subjected to antimicrobial resistance testing. Results from these analyses are summarized in Table 18.12. Table 18.12 Antibiotic Resistance (%) for Salmonella Isolates from Eight Test Farms
% Antibiotic Resistance to: Farm
Isolates (#) STR CTET TET TMP SMX CHL CIP GEN AMP Surrogate 1 20 45 90 85 0 35 30 0 0 25 Surrogate 2 33 55 94 94 3 88 18 0 0 21 Barham Farm 35 6 66 63 20 43 3 0 0 9 Goshen Ridge 20 50 100 100 0 45 25 0 0 30 Carrolls 18 6 12 12 6 19 12 0 0 19 Harrells 9 44 89 89 11 89 67 0 0 67 Vestal 17 12 88 88 0 47 24 0 0 71 SS Composting 10 60 80 80 10 70 10 0 20 30
* Streptomycin (STR), Chlortetracycline (CTET), Tetracycline (TET), Trimethoprim (TMP), Sulfamethoxazole (SMX), Chloramphenicol (CHL), Ciprofloxacin (CIP), Gentamicin (GEN), Ampicillin (AMP)
Phase 2 OPEN Technology Evaluations - Pathogens 85
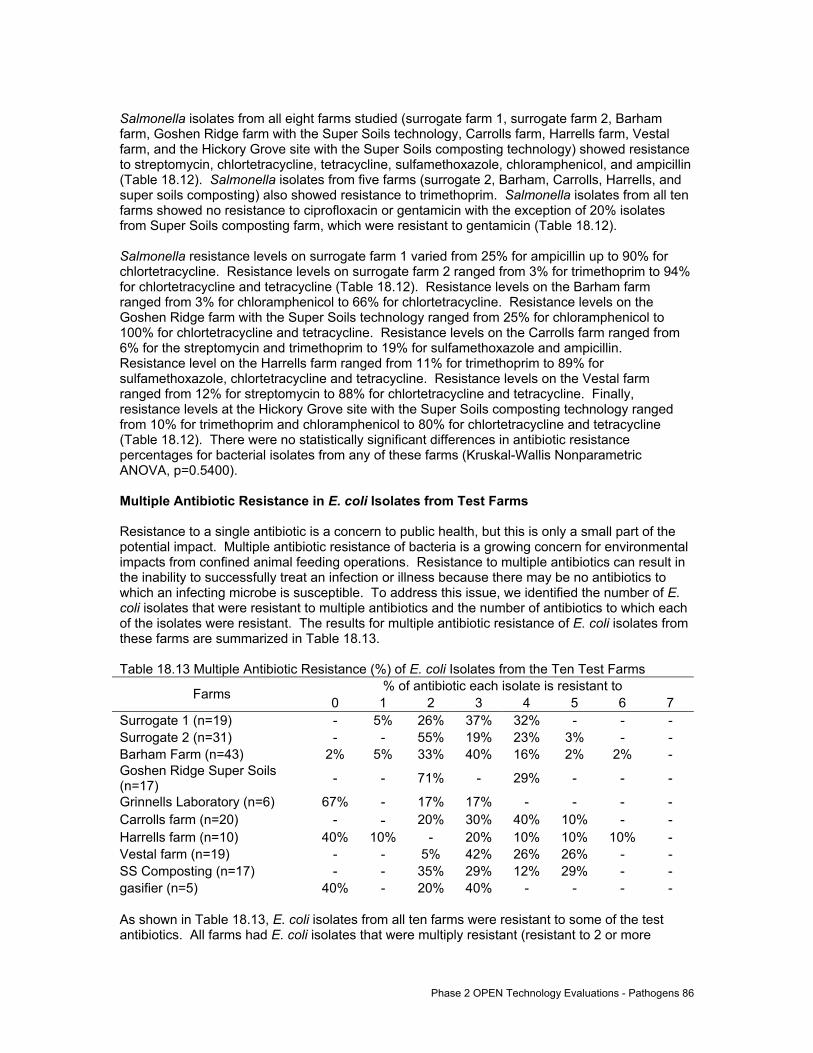
Salmonella isolates from all eight farms studied (surrogate farm 1, surrogate farm 2, Barham farm, Goshen Ridge farm with the Super Soils technology, Carrolls farm, Harrells farm, Vestal farm, and the Hickory Grove site with the Super Soils composting technology) showed resistance to streptomycin, chlortetracycline, tetracycline, sulfamethoxazole, chloramphenicol, and ampicillin (Table 18.12). Salmonella isolates from five farms (surrogate 2, Barham, Carrolls, Harrells, and super soils composting) also showed resistance to trimethoprim. Salmonella isolates from all ten farms showed no resistance to ciprofloxacin or gentamicin with the exception of 20% isolates from Super Soils composting farm, which were resistant to gentamicin (Table 18.12). Salmonella resistance levels on surrogate farm 1 varied from 25% for ampicillin up to 90% for chlortetracycline. Resistance levels on surrogate farm 2 ranged from 3% for trimethoprim to 94% for chlortetracycline and tetracycline (Table 18.12). Resistance levels on the Barham farm ranged from 3% for chloramphenicol to 66% for chlortetracycline. Resistance levels on the Goshen Ridge farm with the Super Soils technology ranged from 25% for chloramphenicol to 100% for chlortetracycline and tetracycline. Resistance levels on the Carrolls farm ranged from 6% for the streptomycin and trimethoprim to 19% for sulfamethoxazole and ampicillin. Resistance level on the Harrells farm ranged from 11% for trimethoprim to 89% for sulfamethoxazole, chlortetracycline and tetracycline. Resistance levels on the Vestal farm ranged from 12% for streptomycin to 88% for chlortetracycline and tetracycline. Finally, resistance levels at the Hickory Grove site with the Super Soils composting technology ranged from 10% for trimethoprim and chloramphenicol to 80% for chlortetracycline and tetracycline (Table 18.12). There were no statistically significant differences in antibiotic resistance percentages for bacterial isolates from any of these farms (Kruskal-Wallis Nonparametric ANOVA, p=0.5400). Multiple Antibiotic Resistance in E. coli Isolates from Test Farms Resistance to a single antibiotic is a concern to public health, but this is only a small part of the potential impact. Multiple antibiotic resistance of bacteria is a growing concern for environmental impacts from confined animal feeding operations. Resistance to multiple antibiotics can result in the inability to successfully treat an infection or illness because there may be no antibiotics to which an infecting microbe is susceptible. To address this issue, we identified the number of E. coli isolates that were resistant to multiple antibiotics and the number of antibiotics to which each of the isolates were resistant. The results for multiple antibiotic resistance of E. coli isolates from these farms are summarized in Table 18.13. Table 18.13 Multiple Antibiotic Resistance (%) of E. coli Isolates from the Ten Test Farms
% of antibiotic each isolate is resistant to Farms 0 1 2 3 4 5 6 7 Surrogate 1 (n=19) - 5% 26% 37% 32% - - - Surrogate 2 (n=31) - - 55% 19% 23% 3% - - Barham Farm (n=43) 2% 5% 33% 40% 16% 2% 2% - Goshen Ridge Super Soils (n=17) - - 71% - 29% - - -
Grinnells Laboratory (n=6) 67% - 17% 17% - - - - Carrolls farm (n=20) - - 20% 30% 40% 10% - - Harrells farm (n=10) 40% 10% - 20% 10% 10% 10% - Vestal farm (n=19) - - 5% 42% 26% 26% - - SS Composting (n=17) - - 35% 29% 12% 29% - - gasifier (n=5) 40% - 20% 40% - - - - As shown in Table 18.13, E. coli isolates from all ten farms were resistant to some of the test antibiotics. All farms had E. coli isolates that were multiply resistant (resistant to 2 or more
Phase 2 OPEN Technology Evaluations - Pathogens 86
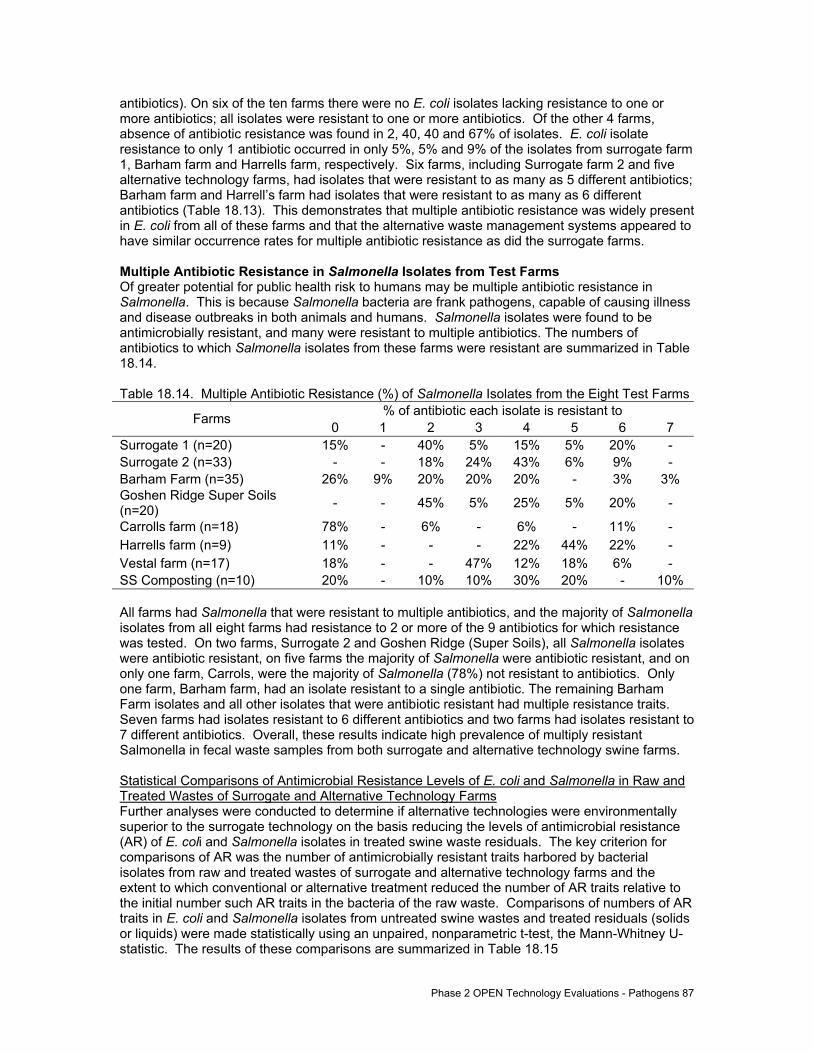
antibiotics). On six of the ten farms there were no E. coli isolates lacking resistance to one or more antibiotics; all isolates were resistant to one or more antibiotics. Of the other 4 farms, absence of antibiotic resistance was found in 2, 40, 40 and 67% of isolates. E. coli isolate resistance to only 1 antibiotic occurred in only 5%, 5% and 9% of the isolates from surrogate farm 1, Barham farm and Harrells farm, respectively. Six farms, including Surrogate farm 2 and five alternative technology farms, had isolates that were resistant to as many as 5 different antibiotics; Barham farm and Harrell’s farm had isolates that were resistant to as many as 6 different antibiotics (Table 18.13). This demonstrates that multiple antibiotic resistance was widely present in E. coli from all of these farms and that the alternative waste management systems appeared to have similar occurrence rates for multiple antibiotic resistance as did the surrogate farms. Multiple Antibiotic Resistance in Salmonella Isolates from Test Farms Of greater potential for public health risk to humans may be multiple antibiotic resistance in Salmonella. This is because Salmonella bacteria are frank pathogens, capable of causing illness and disease outbreaks in both animals and humans. Salmonella isolates were found to be antimicrobially resistant, and many were resistant to multiple antibiotics. The numbers of antibiotics to which Salmonella isolates from these farms were resistant are summarized in Table 18.14. Table 18.14. Multiple Antibiotic Resistance (%) of Salmonella Isolates from the Eight Test Farms
% of antibiotic each isolate is resistant to Farms 0 1 2 3 4 5 6 7 Surrogate 1 (n=20) 15% - 40% 5% 15% 5% 20% - Surrogate 2 (n=33) - - 18% 24% 43% 6% 9% - Barham Farm (n=35) 26% 9% 20% 20% 20% - 3% 3% Goshen Ridge Super Soils (n=20) - - 45% 5% 25% 5% 20% -
Carrolls farm (n=18) 78% - 6% - 6% - 11% - Harrells farm (n=9) 11% - - - 22% 44% 22% - Vestal farm (n=17) 18% - - 47% 12% 18% 6% - SS Composting (n=10) 20% - 10% 10% 30% 20% - 10% All farms had Salmonella that were resistant to multiple antibiotics, and the majority of Salmonella isolates from all eight farms had resistance to 2 or more of the 9 antibiotics for which resistance was tested. On two farms, Surrogate 2 and Goshen Ridge (Super Soils), all Salmonella isolates were antibiotic resistant, on five farms the majority of Salmonella were antibiotic resistant, and on only one farm, Carrols, were the majority of Salmonella (78%) not resistant to antibiotics. Only one farm, Barham farm, had an isolate resistant to a single antibiotic. The remaining Barham Farm isolates and all other isolates that were antibiotic resistant had multiple resistance traits. Seven farms had isolates resistant to 6 different antibiotics and two farms had isolates resistant to 7 different antibiotics. Overall, these results indicate high prevalence of multiply resistant Salmonella in fecal waste samples from both surrogate and alternative technology swine farms. Statistical Comparisons of Antimicrobial Resistance Levels of E. coli and Salmonella in Raw and Treated Wastes of Surrogate and Alternative Technology Farms Further analyses were conducted to determine if alternative technologies were environmentally superior to the surrogate technology on the basis reducing the levels of antimicrobial resistance (AR) of E. coli and Salmonella isolates in treated swine waste residuals. The key criterion for comparisons of AR was the number of antimicrobially resistant traits harbored by bacterial isolates from raw and treated wastes of surrogate and alternative technology farms and the extent to which conventional or alternative treatment reduced the number of AR traits relative to the initial number such AR traits in the bacteria of the raw waste. Comparisons of numbers of AR traits in E. coli and Salmonella isolates from untreated swine wastes and treated residuals (solids or liquids) were made statistically using an unpaired, nonparametric t-test, the Mann-Whitney U-statistic. The results of these comparisons are summarized in Table 18.15
Phase 2 OPEN Technology Evaluations - Pathogens 87

Table 18.15. Statistical Comparisons of Antimicrobial Resistance Levels of E. coli and Salmonella in Raw and Treated Wastes of Surrogate and Alternative Technology Farms Bacteria Type (number of isolates)
Technology Type
Swine Waste Type
Mean No. (SD) AR Traits/Isolate
Comparison P-value (Signifi- cance)
E. coli (40) Untreated 3.5 (1.1) E. coli (25)
Alternative Treated 3.0 (1.1)
AR traits in Raw vs. Treated Waste Isolates
0.08 (NS)*
E. coli (14) Untreated 2.6 (0.74) E. coli (14)
Surrogate Treated 3.0 (1.0)
AR traits in Raw vs. Treated Waste Isolates
0.43 (NS)
Untreated 1.6 (2.1)
Salmonella (28) Alternative
Treated 2.6 (1.8) AR traits in Raw vs. Treated Waste Isolates
0.34 (S)
Salmonella (13) Untreated 3.5 (1.1) Salmonella (26)
Surrogate Treated 3.5 (1.9)
AR traits in Raw vs. Treated Waste Isolates
0.90 (NS)
Salmonella (32)
* NS = not significant; S = significant; 5% level of significance or P < 0.05 As shown in Table 18.15, the levels of antibiotic resistance traits of E. coli isolates in raw and treated wastes were not significantly different for either the alternative technologies or the surrogate technology. The numbers of antibiotic resistance traits in E. coli remained essentially unchanged after treatment from their numbers in the raw waste. These results suggest that neither alternative nor conventional treatments reduced the carriage of antibiotic resistance traits by E. coli in swine wastes. The results in Table 18.15 for Salmonella also indicate that the levels of antibiotic resistance traits of isolates in raw and treated wastes were not significantly reduced by the alternative technologies or the surrogate technology. The numbers of antibiotic resistance traits in Salmonella after treatment by alternative technologies were actually significantly greater than their numbers in the raw waste. For the surrogate (conventional) technology farms, the numbers of antibiotic resistance traits in Salmonella isolates in treated waste residuals remained essentially unchanged from their numbers in the raw waste. These results suggest that neither alternative nor conventional treatments reduced the carriage of antibiotic resistance traits by Salmonella in swine wastes. Overall, the results of these analyses indicate that neither alternative nor conventional treatment systems significantly changed the levels of carriage of antibiotic resistance by E. coli and Salmonella in swine wastes. The majority of these bacteria continued to harbor multiple resistance to antibiotics. However, it is important to recall that the actual concentrations and total loads of these bacteria were appreciably reduced by swine waste treatment. Therefore, while the extent of carriage of antimicrobial resistance by E. coli and Salmonella was not reduced, the numbers of such bacteria were reduced to varying extents, depending upon the type of treatment and waste management system. Nevertheless, some E. coli and Salmonella harboring multiple antibiotic resistance remained in the treated waste residuals of the treatment technologies. Therefore, such waste residuals need to be properly managed to reduce human and animal exposure to such bacteria, some of which are known pathogens (all Salmonella and some strains of E. coli). Further evidence for the environmental persistence and presence of multiple antimicrobial resistant E. coli and Salmonella was provided by the antibiotic resistance characteristics of the environmental isolates from soil, vegetation and flies. As shown by the results summarized in Table 18.16, multiply antimicrobial resistant E. coli and Salmonella were found in environmental isolates of these bacteria in samples from both alternative and surrogate (conventional) technology farms.
Phase 2 OPEN Technology Evaluations - Pathogens 88
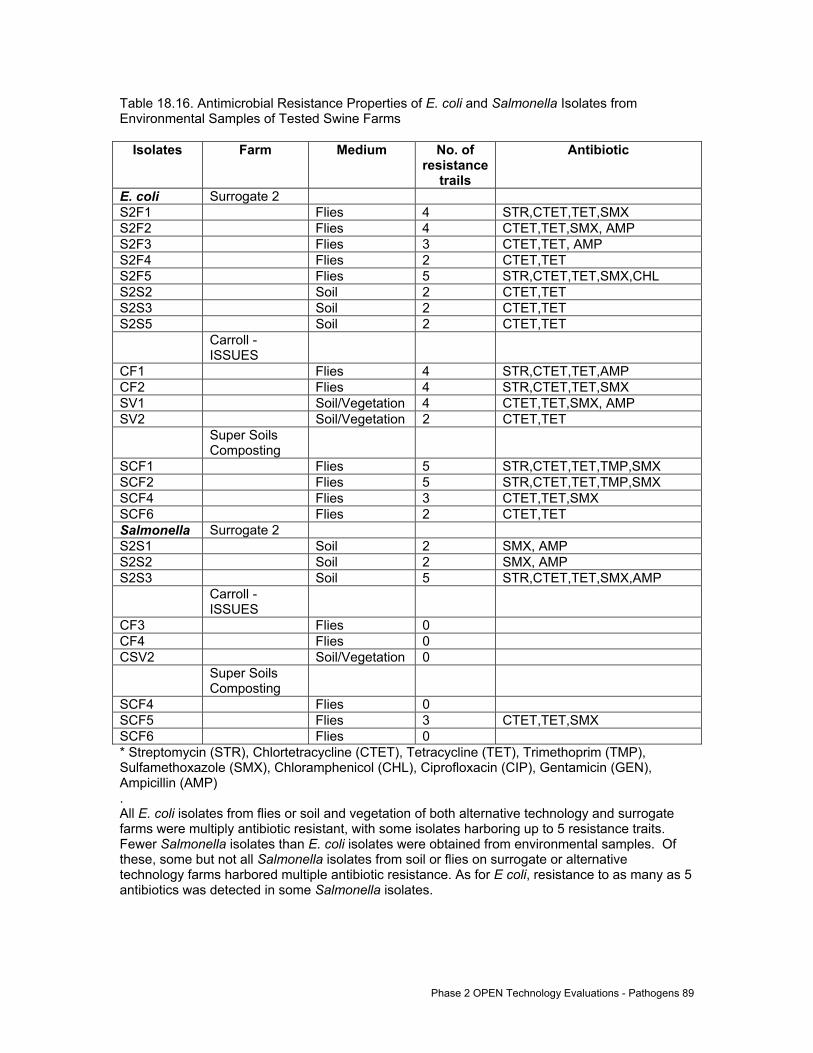
Table 18.16. Antimicrobial Resistance Properties of E. coli and Salmonella Isolates from Environmental Samples of Tested Swine Farms
Isolates Farm Medium No. of resistance
trails
Antibiotic
E. coli Surrogate 2 S2F1 Flies 4 STR,CTET,TET,SMX S2F2 Flies 4 CTET,TET,SMX, AMP S2F3 Flies 3 CTET,TET, AMP S2F4 Flies 2 CTET,TET S2F5 Flies 5 STR,CTET,TET,SMX,CHL S2S2 Soil 2 CTET,TET S2S3 Soil 2 CTET,TET S2S5 Soil 2 CTET,TET Carroll -
ISSUES
CF1 Flies 4 STR,CTET,TET,AMP CF2 Flies 4 STR,CTET,TET,SMX SV1 Soil/Vegetation 4 CTET,TET,SMX, AMP SV2 Soil/Vegetation 2 CTET,TET Super Soils
Composting
SCF1 Flies 5 STR,CTET,TET,TMP,SMX SCF2 Flies 5 STR,CTET,TET,TMP,SMX SCF4 Flies 3 CTET,TET,SMX SCF6 Flies 2 CTET,TET Salmonella Surrogate 2 S2S1 Soil 2 SMX, AMP S2S2 Soil 2 SMX, AMP S2S3 Soil 5 STR,CTET,TET,SMX,AMP Carroll -
ISSUES
CF3 Flies 0 CF4 Flies 0 CSV2 Soil/Vegetation 0 Super Soils
Composting
SCF4 Flies 0 SCF5 Flies 3 CTET,TET,SMX SCF6 Flies 0 * Streptomycin (STR), Chlortetracycline (CTET), Tetracycline (TET), Trimethoprim (TMP), Sulfamethoxazole (SMX), Chloramphenicol (CHL), Ciprofloxacin (CIP), Gentamicin (GEN), Ampicillin (AMP) . All E. coli isolates from flies or soil and vegetation of both alternative technology and surrogate farms were multiply antibiotic resistant, with some isolates harboring up to 5 resistance traits. Fewer Salmonella isolates than E. coli isolates were obtained from environmental samples. Of these, some but not all Salmonella isolates from soil or flies on surrogate or alternative technology farms harbored multiple antibiotic resistance. As for E coli, resistance to as many as 5 antibiotics was detected in some Salmonella isolates.
Phase 2 OPEN Technology Evaluations - Pathogens 89
Overall Summary for Antimicrobial Resistance on Study Farms Antibiotic resistance and multiple antibiotic resistance has been associated with bacteria from confined animal feeding operations due to the common practice of using these pharmaceuticals in the feed for therapeutic disease prevention, as well as sub-therapeutically for growth promotion of the animals. These antimicrobial resistance properties of bacteria present on the farm can have subsequent adverse public health impacts if people on farms are exposed to them or if these bacteria are carried off the farms and people and other animals become exposed to them. These potential human and animal health impacts are a concern because some of the antibiotics used on the farms are also used to combat human infections. This widespread use of antibiotics, and the corresponding increases in antibiotic resistant bacteria, impact the medical and veterinary communities, making it difficult for physicians and veterinarians to treat human and animal bacterial disease cases and outbreaks with first-line antibiotics. Because of the lack of epidemiological data, it is still difficult to fully quantify health risks or the extent to which antibiotic use and resulting antibiotic resistant bacteria results in exposures that impact the health of human and animal populations. Both E. coli and Salmonella isolates from the waste management systems on these farms and the environmental samples from surrogate farm 2 and some alternative technology farms tested were widely resistant to antibiotics. The two most common antibiotics for which the bacteria were resistant were chlortetracycline and tetracycline. There were two bacteria isolates resistant to gentamicin and only one isolate was resistant to ciprofloxacin. This resistance to ciprofloxacin is of particular concern because this antibiotic has been banned for use in animal feeds. There were also few bacteria isolates resistant to trimethoprim.
Multiple antibiotic resistance of bacteria isolated from these farms was widespread. For E. coli, all of the isolates were resistant to antibiotics, with all ten tested farms having isolates resistant to two or more antibiotics. Potentially of greater public health concern is the multiple antibiotic resistance in Salmonella. On all but one of the farms the majority of Salmonella isolates had multiple antibiotic resistance, and two farms had isolates resistant to 7 different antibiotics. The reasons for the persistence of these multiple antibiotic resistance traits in both E. coli and Salmonella is uncertain at this time. It could be due to the continued presence of the antibiotic in the waste material and the environmental samples or to the ability of the bacteria to maintain the antibiotic resistance gene and its expression in the environment, even if the antibiotic and its selective pressure were no longer present.
When comparing these test farms for the extent of antimicrobial resistance among E. coli and Salmonella, there appear to be no differences between the extent of the resistance on the surrogate farms with conventional waste management technology and on the farms with alternative waste management technologies A large proportion of the bacteria isolated from each of the farms were resistant to multiple antibiotics. Furthermore, the levels of multiple antibiotic resistance in E. coli and Salmonella were not reduced by the alternative or surrogate (conventional) swine waste treatment processes and management systems. Levels of multiple antibiotic resistance in E. coli and Salmonella isolates from treated wastes or from environmental media (flies, soil and vegetation), remained unchanged from the resistance levels found in isolates of these bacteria from untreated wastes. Based on these results, none of the alternative waste management systems can be judged environmentally superior to the conventional technology at the surrogate farms based on reduction of the levels of antimicrobial resistance in bacteria in treated swine waste residuals or environmental media. However, the concentrations of these bacteria and the total loads of these bacteria were often significantly reduced by alternative treatment processes and systems. On the basis of remaining concentrations or total numbers (loads) of antimicrobially resistant bacteria, many of these alternative technologies were superior to the surrogate (conventional) technology.
Phase 2 OPEN Technology Evaluations - Pathogens 90
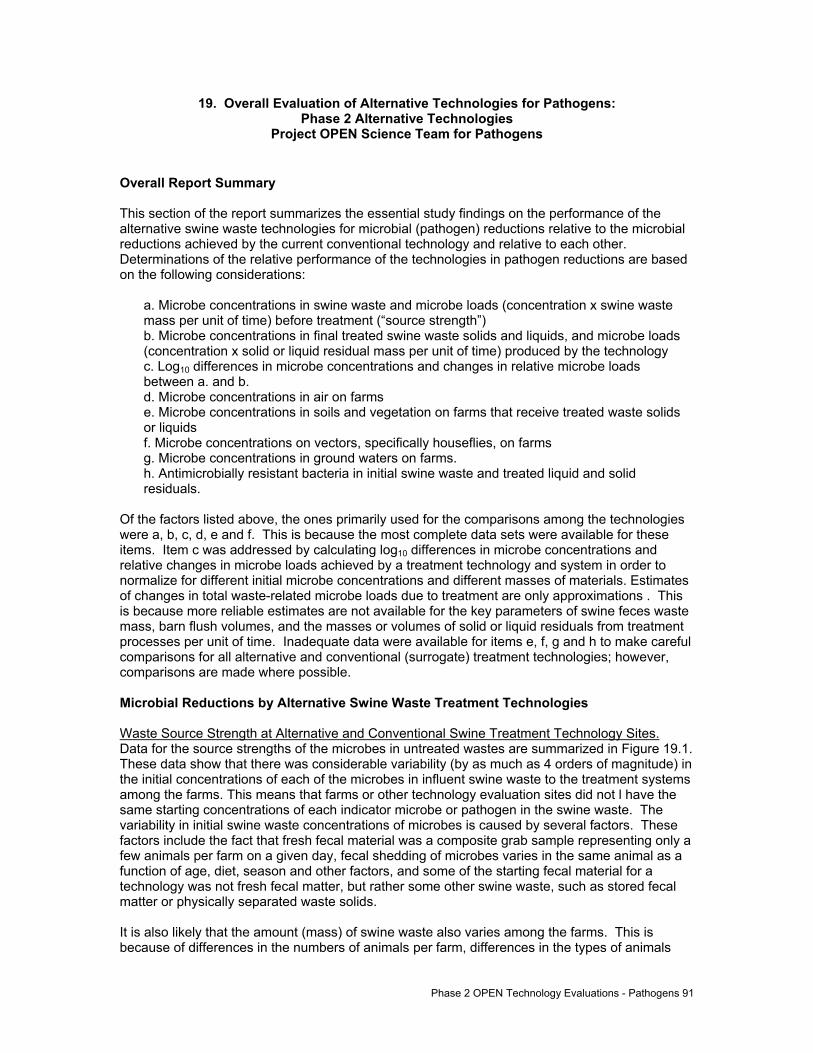
19. Overall Evaluation of Alternative Technologies for Pathogens: Phase 2 Alternative Technologies
Project OPEN Science Team for Pathogens
g. Microbe concentrations in ground waters on farms. h. Antimicrobially resistant bacteria in initial swine waste and treated liquid and solid residuals.
Overall Report Summary This section of the report summarizes the essential study findings on the performance of the alternative swine waste technologies for microbial (pathogen) reductions relative to the microbial reductions achieved by the current conventional technology and relative to each other. Determinations of the relative performance of the technologies in pathogen reductions are based on the following considerations:
a. Microbe concentrations in swine waste and microbe loads (concentration x swine waste mass per unit of time) before treatment (“source strength”) b. Microbe concentrations in final treated swine waste solids and liquids, and microbe loads (concentration x solid or liquid residual mass per unit of time) produced by the technology c. Log10 differences in microbe concentrations and changes in relative microbe loads between a. and b. d. Microbe concentrations in air on farms e. Microbe concentrations in soils and vegetation on farms that receive treated waste solids or liquids f. Microbe concentrations on vectors, specifically houseflies, on farms
Of the factors listed above, the ones primarily used for the comparisons among the technologies were a, b, c, d, e and f. This is because the most complete data sets were available for these items. Item c was addressed by calculating log10 differences in microbe concentrations and relative changes in microbe loads achieved by a treatment technology and system in order to normalize for different initial microbe concentrations and different masses of materials. Estimates of changes in total waste-related microbe loads due to treatment are only approximations . This is because more reliable estimates are not available for the key parameters of swine feces waste mass, barn flush volumes, and the masses or volumes of solid or liquid residuals from treatment processes per unit of time. Inadequate data were available for items e, f, g and h to make careful comparisons for all alternative and conventional (surrogate) treatment technologies; however, comparisons are made where possible. Microbial Reductions by Alternative Swine Waste Treatment Technologies
Waste Source Strength at Alternative and Conventional Swine Treatment Technology Sites. Data for the source strengths of the microbes in untreated wastes are summarized in Figure 19.1. These data show that there was considerable variability (by as much as 4 orders of magnitude) in the initial concentrations of each of the microbes in influent swine waste to the treatment systems among the farms. This means that farms or other technology evaluation sites did not l have the same starting concentrations of each indicator microbe or pathogen in the swine waste. The variability in initial swine waste concentrations of microbes is caused by several factors. These factors include the fact that fresh fecal material was a composite grab sample representing only a few animals per farm on a given day, fecal shedding of microbes varies in the same animal as a function of age, diet, season and other factors, and some of the starting fecal material for a technology was not fresh fecal matter, but rather some other swine waste, such as stored fecal matter or physically separated waste solids. It is also likely that the amount (mass) of swine waste also varies among the farms. This is because of differences in the numbers of animals per farm, differences in the types of animals
Phase 2 OPEN Technology Evaluations - Pathogens 91
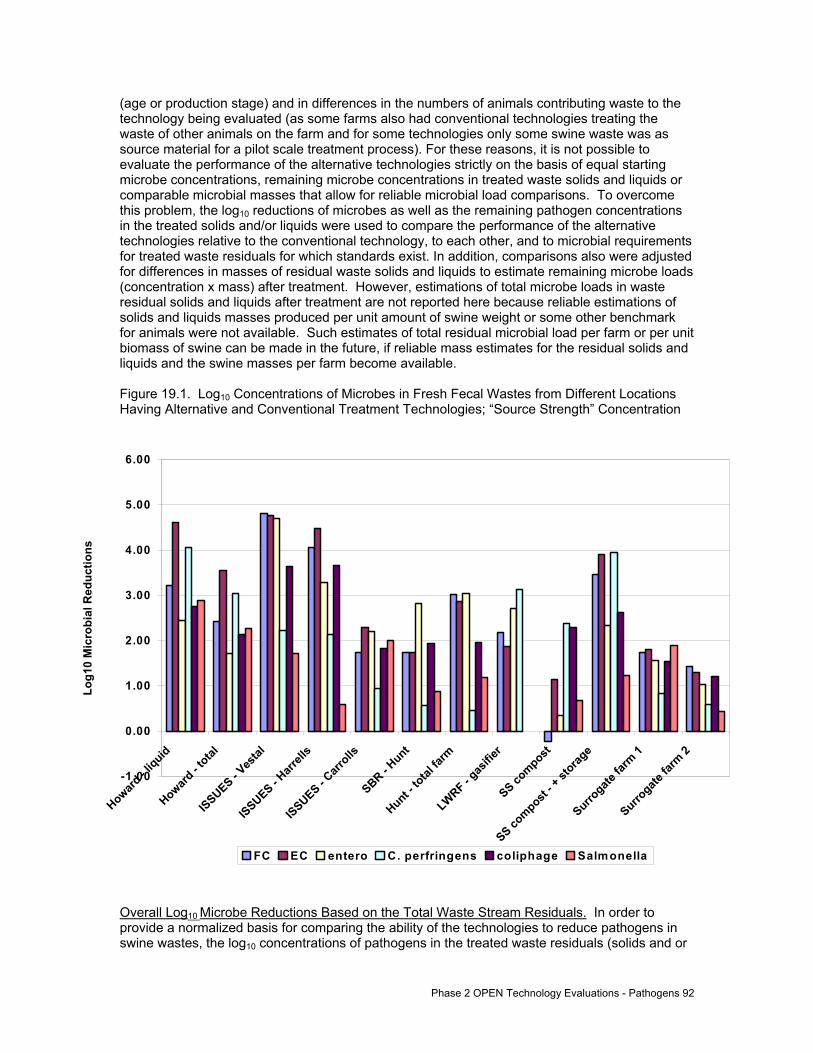
(age or production stage) and in differences in the numbers of animals contributing waste to the technology being evaluated (as some farms also had conventional technologies treating the waste of other animals on the farm and for some technologies only some swine waste was as source material for a pilot scale treatment process). For these reasons, it is not possible to evaluate the performance of the alternative technologies strictly on the basis of equal starting microbe concentrations, remaining microbe concentrations in treated waste solids and liquids or comparable microbial masses that allow for reliable microbial load comparisons. To overcome this problem, the log10 reductions of microbes as well as the remaining pathogen concentrations in the treated solids and/or liquids were used to compare the performance of the alternative technologies relative to the conventional technology, to each other, and to microbial requirements for treated waste residuals for which standards exist. In addition, comparisons also were adjusted for differences in masses of residual waste solids and liquids to estimate remaining microbe loads (concentration x mass) after treatment. However, estimations of total microbe loads in waste residual solids and liquids after treatment are not reported here because reliable estimations of solids and liquids masses produced per unit amount of swine weight or some other benchmark for animals were not available. Such estimates of total residual microbial load per farm or per unit biomass of swine can be made in the future, if reliable mass estimates for the residual solids and liquids and the swine masses per farm become available.
Figure 19.1. Log10 Concentrations of Microbes in Fresh Fecal Wastes from Different Locations Having Alternative and Conventional Treatment Technologies; “Source Strength” Concentration
-1.00
0.00
1.00
2.00
3.00
4.00
5.00
6.00
Howard - l
iquid
Howard - t
otal
ISSUES - Ves
tal
ISSUES - Harr
ells
ISSUES - Carr
olls
SBR - Hunt
Hunt - total
farm
LWRF - gas
ifier
SS compost
SS compost
- + st
orage
Surrogate
farm
1
Surrogate
farm
2
Log1
0 M
icro
bial
Red
uctio
ns
FC EC entero C. perfringens coliphage Salmonella
Overall Log10 Microbe Reductions Based on the Total Waste Stream Residuals. In order to provide a normalized basis for comparing the ability of the technologies to reduce pathogens in swine wastes, the log10 concentrations of pathogens in the treated waste residuals (solids and or
Phase 2 OPEN Technology Evaluations - Pathogens 92

liquids) were subtracted from the log10 concentrations of these same pathogens in the untreated waste fed to the treatment technology to calculate the log10 reductions in concentration resulting from treatment. This is a standard approach used by us and most other investigators to quantify technology performance for pathogen reduction. It is important to note that most of the Phase 2 farms had only one waste treatment residual material (solid or liquid).However, the Howard farm with the constructed wetlands technology had two (solid and liquid), but only the liquid fraction was subjected to treatment by the alternative technology process (solids were simply separated and land applied). As shown in Figure 19.2 below, when both waste residuals are considered for the constructed wetlands system, the overall microbe reductions are less because the solid portion of the waste stream is untreated by the alternative technology. In contrast, The ReCycle gasifier at the Lake Wheeler Research farm treated only separated swine waste solids. , It remains unclear what the fate of the separated liquids from the previously evaluated belt system will be. There is a potential for high microbial concentrations in the separated solids of the constructed wetlands and the separated liquids of the ReCycle system to pose a pathogen burden to the environment. Hence, there should be provisions for treating and managing these untreated residual materials.
Of the alternative technologies evaluated, the log10 microbe reductions were highest for the ReCycle gasifier at the Lake Wheeler Research farm (all microbe levels below detection limits) and next highest for the ISSUES technologies at the Vestal and Harrells farms. It should be noted that the water reuse system was not operational at the Vestal farm during one of the evaluation periods, which resulted in the average microbial reductions to be lower than they would have otherwise been. The Super Soils composting technology at the Hickory Grove site gave log10 reductions for microbes in the waste solids after the 30-day compost period followed by a 30-day storage period that were significantly greater than the conventional technology. Without this additional 30-day storage of the composted waste, during which there was additional treatment, the Super Soils composting technology yielded log10 reductions that were similar to the conventional anaerobic lagoon technologies. Most of these alternative swine waste treatment and management systems gave log10 reductions that were higher than those achieved by the conventional technology (anaerobic lagoons) at surrogate farm sites. An exception to this was the sequencing batch reactor (SBR) at the AHA Hunt farm that yielded similar results to the reductions achieved at the surrogate farms. However, because this farm had a pre-existing primary and secondary lagoon system, this treatment by dual lagoon in series was effective at reducing the total microbial levels in wastes to lower levels than the SBR technology alone. This dual treatment by SBR and then dual lagoons in series resulted in higher log10 reductions than those achieved by the conventional technology of the surrogate farms.
On the basis of the results for overall log10 microbe reductions, only the SBR technology at the AHA Hunt farm and the Super Soils composting technology with only the 30-day composting treatment are not environmentally superior to the conventional swine waste treatment technology (statistically compared in table 19.1). It should be noted that the ReCycle gasifier technology at the Lake Wheeler Research farm (treating separated solids only) and the ISSUES technology at the Vestal farm (with water reuse operational) stand out above the other technologies because the microbe levels in their final residuals were below microbial assay detection limits for most or all of the microbial indicators and Salmonella. However, microbial reduction efficiencies and microbial loads in waste residuals of the entire treatment technology trains and management systems should be considered in future analyses because all pathogens arising from swine wastes need to be addressed by technologies that would be considered truly superior in pathogen reduction at the farm level.
Phase 2 OPEN Technology Evaluations - Pathogens 93
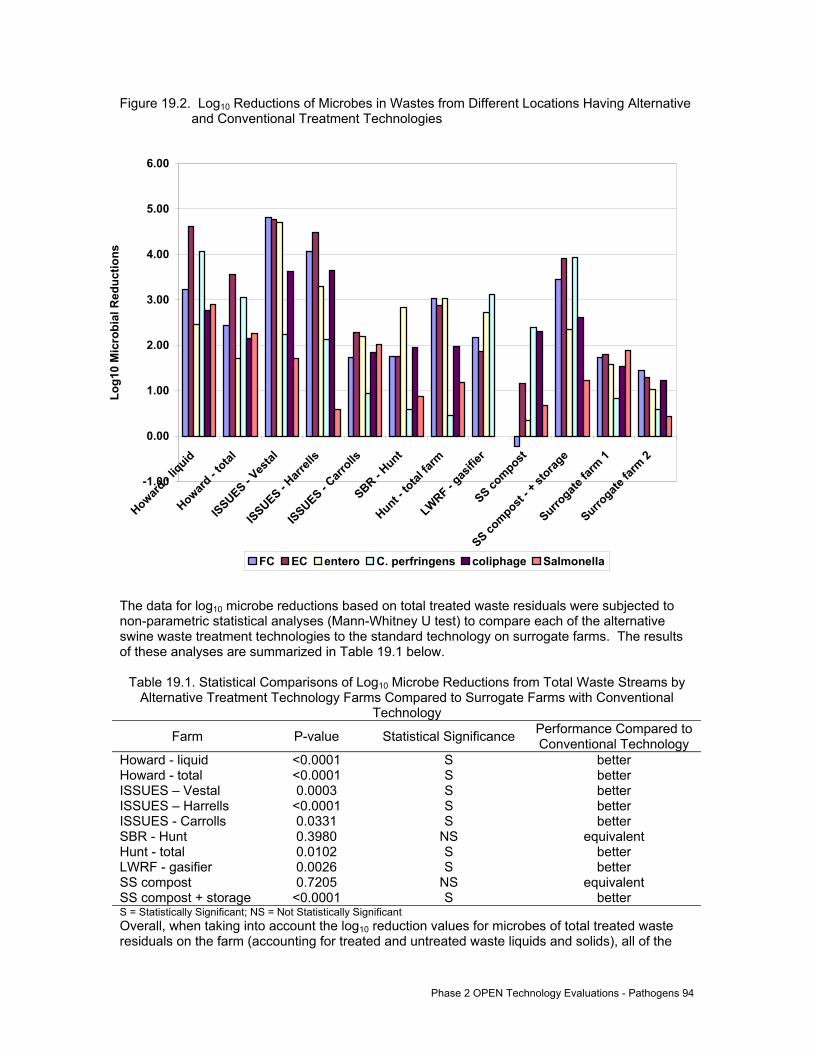
Figure 19.2. Log10 Reductions of Microbes in Wastes from Different Locations Having Alternative and Conventional Treatment Technologies
-1.00
0.00
1.00
2.00
3.00
4.00
5.00
6.00
Howard - l
iquid
Howard - t
otal
ISSUES - Ves
tal
ISSUES - Harr
ells
ISSUES - Carr
olls
SBR - Hunt
Hunt - total
farm
LWRF - gas
ifier
SS compost
SS compost
- + st
orage
Surrogate
farm
1
Surrogate
farm
2
Log1
0 M
icro
bial
Red
uctio
ns
FC EC entero C. perfringens coliphage Salmonella
The data for log10 microbe reductions based on total treated waste residuals were subjected to non-parametric statistical analyses (Mann-Whitney U test) to compare each of the alternative swine waste treatment technologies to the standard technology on surrogate farms. The results of these analyses are summarized in Table 19.1 below.
Table 19.1. Statistical Comparisons of Log10 Microbe Reductions from Total Waste Streams by Alternative Treatment Technology Farms Compared to Surrogate Farms with Conventional
Technology
Farm P-value Statistical Significance Performance Compared to Conventional Technology
Howard - liquid <0.0001 S better Howard - total <0.0001 S better ISSUES – Vestal
S
0.0003 S better ISSUES – Harrells <0.0001 S better ISSUES - Carrolls 0.0331 better SBR - Hunt 0.3980 NS equivalent Hunt - total 0.0102 S better LWRF - gasifier 0.0026 S better SS compost 0.7205 NS equivalent SS compost + storage <0.0001 S better S = Statistically Significant; NS = Not Statistically Significant Overall, when taking into account the log10 reduction values for microbes of total treated waste residuals on the farm (accounting for treated and untreated waste liquids and solids), all of the
Phase 2 OPEN Technology Evaluations - Pathogens 94
technologies, except the SBR technology at the Hunt farm and the Super Soils compost technology without the additional 30-day storage, are statistically superior to the lagoon treatment of surrogate farms.
Microbial Concentrations in Remaining Waste Residuals on Technology Sites. In order to assess potential environmental impacts of treated and untreated swine wastes on the evaluated farms, concentrations of microbes in resulting liquid and solid residuals should be considered and these are summarized in Figure 19.3. There are relatively high concentrations of microbial indicators and Salmonella in resulting residual materials (lagoon liquid) from the surrogate farms. On a per unit mass or volume basis (g or ml), the microbial concentrations are higher in the separated solid material from the Howard farm with the constructed wetlands technology compared to other residual waste materials. This is particularly important because this material is land applied without further treatment on the farm site. Because of this, there can be environmental impacts resulting from airborne exposures during the application process, from vectors that may become contaminated prior to land applications, to ground waters following land application, and to nearby surface water from runoff cause by precipitation events.
Another technology that had relatively high microbial levels in treated residuals was the Super Soils compost technology for treating solid wastes after only the 30-day composting. This system achieved relatively high microbial reductions that resulted in low levels of microbial indicators and Salmonella following the 30-day compost treatment and a subsequent 30-day on-site storage, during which additional waste stabilization and further microbial reduction was occurring. This 60-day combined treatment resulted in microbe levels in the final material that met Class A biosolids standards for both fecal coliform bacteria and for Salmonella. This Class A designation is important because there are fewer restrictions on the subsequent use of the materials. Class A biosolids quality is met when fecal coliform levels are below 1000 per gram, Salmonella levels are below 3 per 4 grams, total culturable virus levels are below 1 per 4 grams, and viable helminth (Ascaris) ova levels are less than 1 per 4 grams. Another system that achieved Class A biosolids standards for fecal coliforms and Salmonella in the resulting solids was the ReCycle gasifier at the Lake Wheeler Research farm (fecal coliform and Salmonella only). In fact, all of the microbial levels in the final residual solid material were below assay detection limits for all of the microbial indicators and Salmonella. Further testing of these residual solids is recommended to ensure that each of these systems also meet Class A biosolids levels for total culturable viruses and for viable helminth ova. In addition, further testing is recommended for the ReCycle gasifier using more typical separated swine waste solids that are likely to have higher initial concentrations of microbes tan the stored separated swine waste solids used in these studies.
The ISSUES technologies at the Vestal and Harrells farms achieved appreciable log10 reductions that resulted in relatively low microbe levels in the treated effluents. Evaluation of the Vestal farm system would have provided better results than those reported if the water reuse system had been operational during both of the evaluation periods. During the second evaluation period when the water reuse system was operational, all of the microbial indicator and Salmonella concentrations were below the detection limits for the assays. These results documented extensive microbial reductions when the treatment system was functional and making this treated wastewater suitable for drinking water for the pigs housed at the site on the basis of sufficiently low microbial concentrations to meet drinking water quality targets.
Phase 2 OPEN Technology Evaluations - Pathogens 95
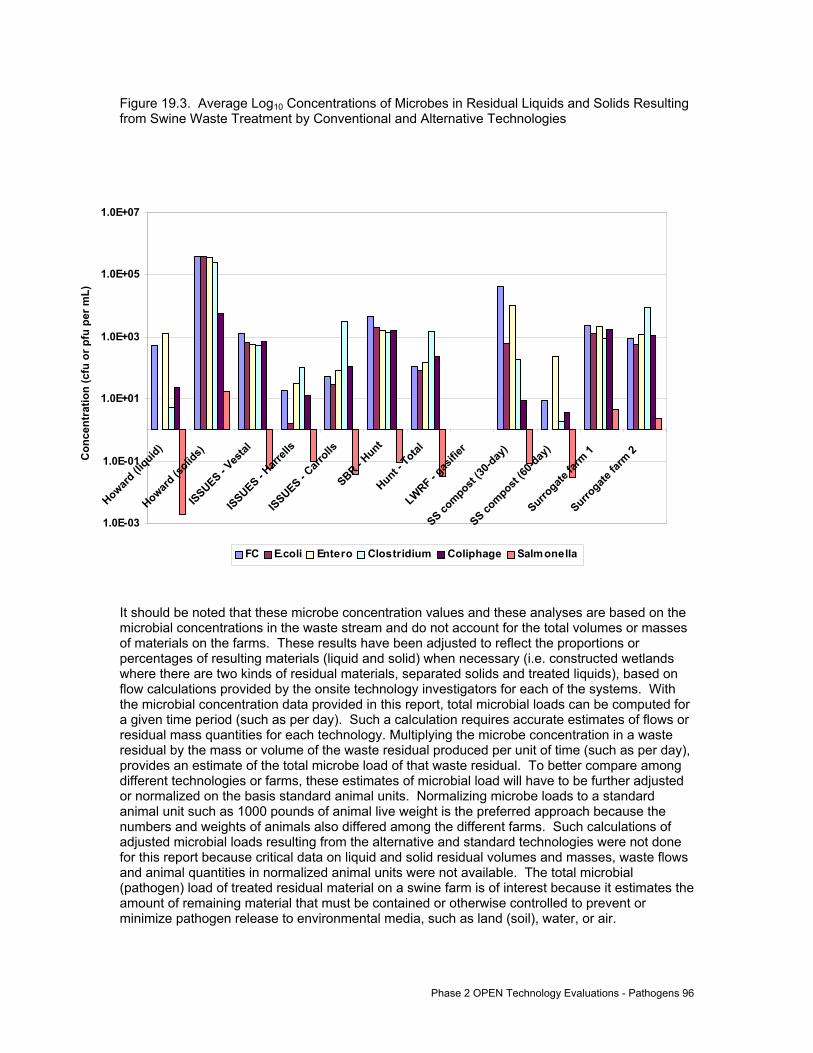
Figure 19.3. Average Log10 Concentrations of Microbes in Residual Liquids and Solids Resulting from Swine Waste Treatment by Conventional and Alternative Technologies
should be noted that these microbe concentration values and these analyses are based on the
ands
r
ates the
1.0E-03
1.0E-01
1.0E+01
1.0E+03
1.0E+05
1.0E+07
Howard (li
quid)
Howard (s
olids)
ISSUES - Ves
tal
ISSUES - Harr
ells
ISSUES - Carr
olls
SBR - Hunt
Hunt - Total
LWRF - gas
ifier
SS compost
(30-day
)
SS compost
(60-day
)
Surrogate
farm
1
Surrogate
farm
2Con
cent
ratio
n (c
fu o
r pfu
per
mL)
FC E.coli Entero Clostridium Coliphage Salmonella
Itmicrobial concentrations in the waste stream and do not account for the total volumes or masses of materials on the farms. These results have been adjusted to reflect the proportions or percentages of resulting materials (liquid and solid) when necessary (i.e. constructed wetlwhere there are two kinds of residual materials, separated solids and treated liquids), based on flow calculations provided by the onsite technology investigators for each of the systems. With the microbial concentration data provided in this report, total microbial loads can be computed foa given time period (such as per day). Such a calculation requires accurate estimates of flows or residual mass quantities for each technology. Multiplying the microbe concentration in a waste residual by the mass or volume of the waste residual produced per unit of time (such as per day), provides an estimate of the total microbe load of that waste residual. To better compare among different technologies or farms, these estimates of microbial load will have to be further adjusted or normalized on the basis standard animal units. Normalizing microbe loads to a standard animal unit such as 1000 pounds of animal live weight is the preferred approach because the numbers and weights of animals also differed among the different farms. Such calculations of adjusted microbial loads resulting from the alternative and standard technologies were not done for this report because critical data on liquid and solid residual volumes and masses, waste flowsand animal quantities in normalized animal units were not available. The total microbial (pathogen) load of treated residual material on a swine farm is of interest because it estimamount of remaining material that must be contained or otherwise controlled to prevent or minimize pathogen release to environmental media, such as land (soil), water, or air.
Phase 2 OPEN Technology Evaluations - Pathogens 96
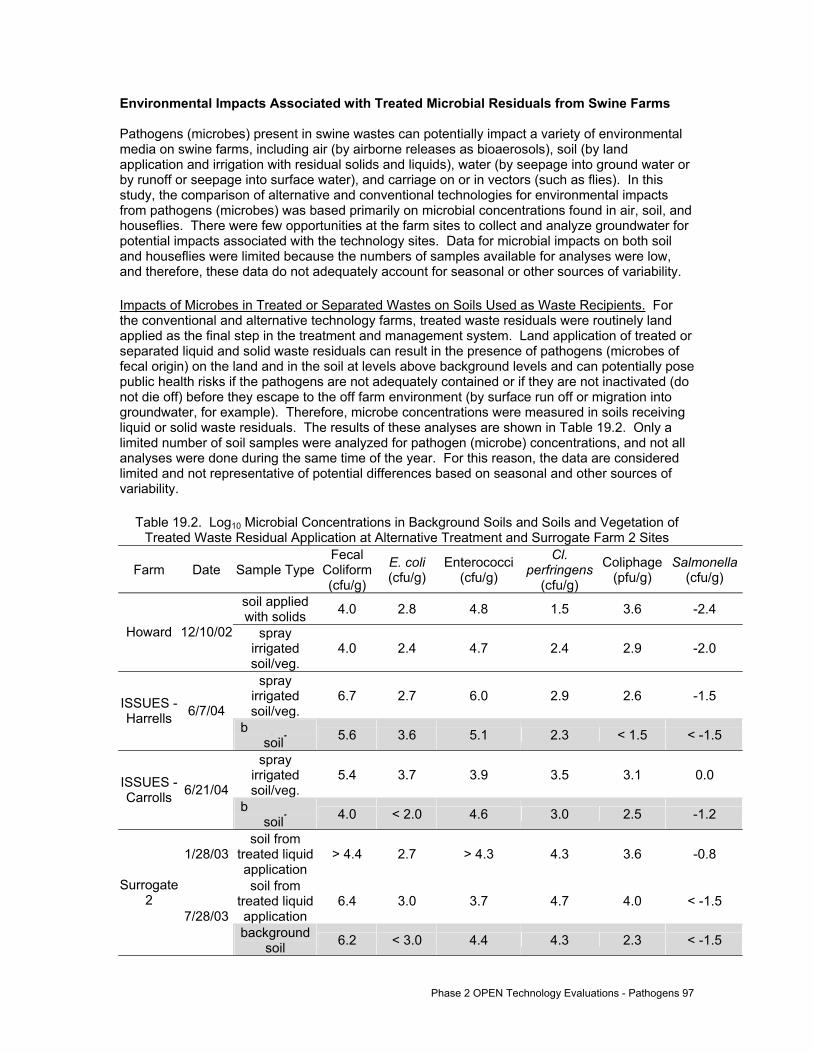
Environmental Impacts Associated with Treated Microbial Residuals from Swine Farms
athogens (microbes) present in swine wastes can potentially impact a variety of environmental
water or
nd
.
Impacts of Microbes in Treated or Separated Wastes on Soils Used as Waste Recipients.
Pmedia on swine farms, including air (by airborne releases as bioaerosols), soil (by land application and irrigation with residual solids and liquids), water (by seepage into groundby runoff or seepage into surface water), and carriage on or in vectors (such as flies). In this study, the comparison of alternative and conventional technologies for environmental impacts from pathogens (microbes) was based primarily on microbial concentrations found in air, soil, ahouseflies. There were few opportunities at the farm sites to collect and analyze groundwater for potential impacts associated with the technology sites. Data for microbial impacts on both soil and houseflies were limited because the numbers of samples available for analyses were low, and therefore, these data do not adequately account for seasonal or other sources of variability
For
e
g
ll
Table 19.2. Log10 Microbial Concentrations in Background Soils and Soils and Vegetation of
Farm Date Sample Type Coliform perf ns onella
the conventional and alternative technology farms, treated waste residuals were routinely land applied as the final step in the treatment and management system. Land application of treated or separated liquid and solid waste residuals can result in the presence of pathogens (microbes of fecal origin) on the land and in the soil at levels above background levels and can potentially pospublic health risks if the pathogens are not adequately contained or if they are not inactivated (do not die off) before they escape to the off farm environment (by surface run off or migration into groundwater, for example). Therefore, microbe concentrations were measured in soils receivinliquid or solid waste residuals. The results of these analyses are shown in Table 19.2. Only a limited number of soil samples were analyzed for pathogen (microbe) concentrations, and not aanalyses were done during the same time of the year. For this reason, the data are considered limited and not representative of potential differences based on seasonal and other sources of variability.
Treated Waste Residual Application at Alternative Treatment and Surrogate Farm 2 Sites Fecal E. coli Enterococci Cl. Coliphage Salm
(cfu/g) (cfu/g) (cfu/g) ringe(cfu/g) (pfu/g) (cfu/g)
with solids 4.0 1.5
spray rrigatedsoil/veg.
spray i 6.7 2.7 6.0 2.9 2.6 -1.5 rrigatedsoil/veg. Harrells ackground
soil* pray
rrigatedsoil/veg. Carrolls ackground
soil*
ated liquiapplication soil from
tre d 6.4 3.0 3.7 4.7 4.0 < -1.5 Surr ate
2 ated liquiapplication
og
7/28/03 background
soil applied 2.8 4.8 3.6 -2.4
Howard 12/10/02 i 4.0 2.4 4.7 2.4 2.9 -2.0
ISSUES - 6/7/04 b 5.6 3.6 5.1 2.3 < 1.5 < -1.5
si 5.4 3.7 3.9 3.5 3.1 0.0 ISSUES - 6/21/04
b 4.0 < 2.0 4.6 3.0 2.5 -1.2
1/28/03 soil from
tre d > 4.4 2.7 > 4.3 4.3 3.6 -0.8
soil 6.2 < 3.0 4.4 4.3 2.3 < -1.5
Phase 2 OPEN Technology Evaluations - Pathogens 97
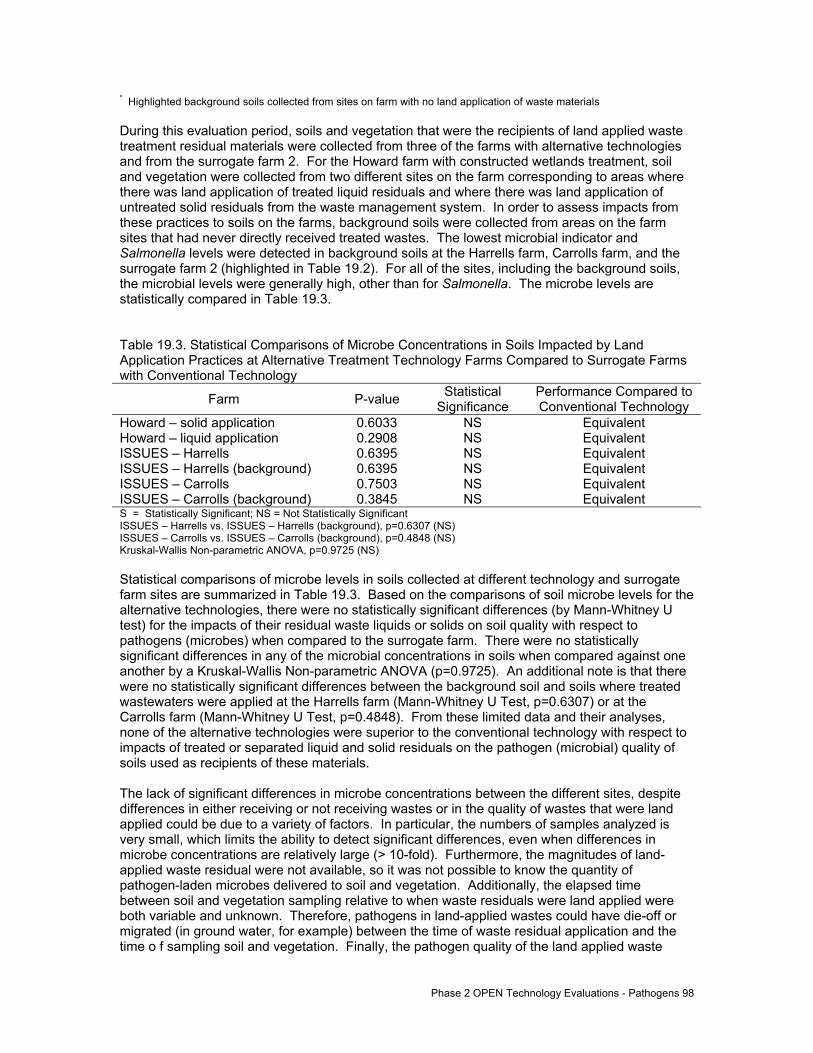
* Highlighted background soils collected from sites on farm with no land application of waste materials
pplied waste eatment residual materials were collected from three of the farms with alternative technologies
e soils,
able 19.3. Statistical Comparisons of Microbe Concentrations in Soils Impacted by Land pplication Practices at Alternative Treatment Technology Farms Compared to Surrogate Farms
Significance Conventional Technology
During this evaluation period, soils and vegetation that were the recipients of land atrand from the surrogate farm 2. For the Howard farm with constructed wetlands treatment, soil and vegetation were collected from two different sites on the farm corresponding to areas where there was land application of treated liquid residuals and where there was land application of untreated solid residuals from the waste management system. In order to assess impacts from these practices to soils on the farms, background soils were collected from areas on the farm sites that had never directly received treated wastes. The lowest microbial indicator and Salmonella levels were detected in background soils at the Harrells farm, Carrolls farm, and thsurrogate farm 2 (highlighted in Table 19.2). For all of the sites, including the backgroundthe microbial levels were generally high, other than for Salmonella. The microbe levels are statistically compared in Table 19.3. TAwith Conventional Technology
Farm P-value Statistical Performance Compared to
Howard – solid ation 0.6033 applic NS Equivalent d applic NS Equivalent
ISSUES – Harrells 0.6395 NS Equivalent ISSUES – Harrells (backgrou NS Equivalent ISSUES – Carrolls 0.7503 NS Equivalent ISSUES – Carrolls (background) 0.3845 NS Equivalent S = Statistically Significant; NS = Not Statistically t
(backgro .6307 (NS) (backgro .4848 (NS)
ils collected at different technology and surrogate rm sites are summarized in Table 19.3. Based on the comparisons of soil microbe levels for the
st one t there
ect to
concentrations between the different sites, despite ifferences in either receiving or not receiving wastes or in the quality of wastes that were land
were ff or
SignificanISSUES – Harrells vs. ISSUES – Harrells ISSUES – Carrolls vs. ISSUES – Carrolls
und), p=0und), p=0
Howard – liqui ation 0.2908
nd) 0.6395
Kruskal-Wallis Non-parametric ANOVA, p=0.9725 (NS) Statistical comparisons of microbe levels in sofaalternative technologies, there were no statistically significant differences (by Mann-Whitney U test) for the impacts of their residual waste liquids or solids on soil quality with respect to pathogens (microbes) when compared to the surrogate farm. There were no statistically significant differences in any of the microbial concentrations in soils when compared againanother by a Kruskal-Wallis Non-parametric ANOVA (p=0.9725). An additional note is thawere no statistically significant differences between the background soil and soils where treated wastewaters were applied at the Harrells farm (Mann-Whitney U Test, p=0.6307) or at the Carrolls farm (Mann-Whitney U Test, p=0.4848). From these limited data and their analyses, none of the alternative technologies were superior to the conventional technology with respimpacts of treated or separated liquid and solid residuals on the pathogen (microbial) quality ofsoils used as recipients of these materials. The lack of significant differences in microbe dapplied could be due to a variety of factors. In particular, the numbers of samples analyzed is very small, which limits the ability to detect significant differences, even when differences in microbe concentrations are relatively large (> 10-fold). Furthermore, the magnitudes of land-applied waste residual were not available, so it was not possible to know the quantity of pathogen-laden microbes delivered to soil and vegetation. Additionally, the elapsed time between soil and vegetation sampling relative to when waste residuals were land appliedboth variable and unknown. Therefore, pathogens in land-applied wastes could have die-omigrated (in ground water, for example) between the time of waste residual application and the time o f sampling soil and vegetation. Finally, the pathogen quality of the land applied waste
Phase 2 OPEN Technology Evaluations - Pathogens 98
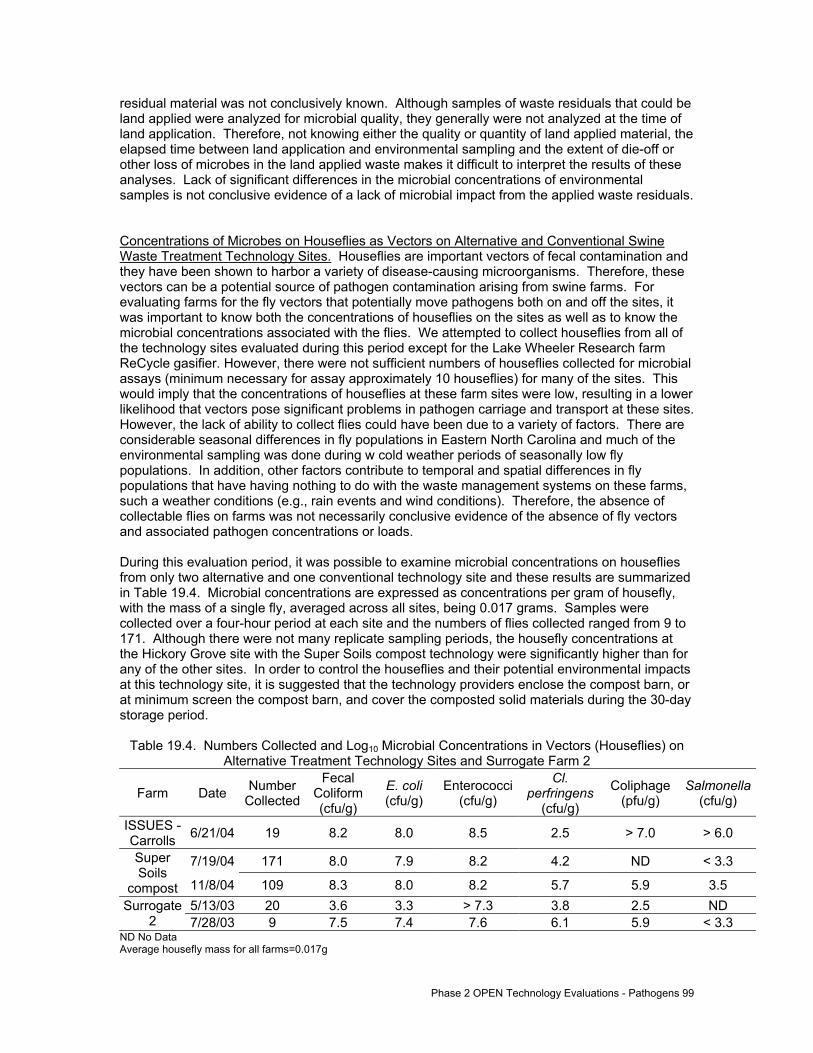
residual material was not conclusively known. Although samples of waste residuals that could bland applied were analyzed for microbial quality, they generally were not analyzed at the time land application. Therefore, not knowing either the quality or quantity of land applied material, the elapsed time between land application and environmental sampling and the extent of die-off or other loss of microbes in the land applied waste makes it difficult to interpret the results of these analyses. Lack of significant differences in the microbial concentrations of environmental samples is not conclusive evidence of a lack of microbial impact from the applied waste residuals
e of
.
Concentrations of Microbes on Houseflies as Vectors on Alternative and Conventional Swine Waste Treatment Technology Sites. Houseflies are important vectors of fecal contamination and
se
he
s.
se farms, of
ine microbial concentrations on houseflies om only two alternative and one conventional technology site and these results are summarized
ts
mbers Collected and Log10 Microbial Concentrations in Vectors (Houseflies) on Alternative Treatment Technology Sites and Surrogate Farm 2
Farm Date Collected (cfu/g) (cfu/g) (c ) (pfu/g) almonella (cfu/g)
they have been shown to harbor a variety of disease-causing microorganisms. Therefore, thevectors can be a potential source of pathogen contamination arising from swine farms. For evaluating farms for the fly vectors that potentially move pathogens both on and off the sites, it was important to know both the concentrations of houseflies on the sites as well as to know tmicrobial concentrations associated with the flies. We attempted to collect houseflies from all ofthe technology sites evaluated during this period except for the Lake Wheeler Research farm ReCycle gasifier. However, there were not sufficient numbers of houseflies collected for microbialassays (minimum necessary for assay approximately 10 houseflies) for many of the sites. Thiswould imply that the concentrations of houseflies at these farm sites were low, resulting in a lower likelihood that vectors pose significant problems in pathogen carriage and transport at these siteHowever, the lack of ability to collect flies could have been due to a variety of factors. There are considerable seasonal differences in fly populations in Eastern North Carolina and much of the environmental sampling was done during w cold weather periods of seasonally low fly populations. In addition, other factors contribute to temporal and spatial differences in fly populations that have having nothing to do with the waste management systems on thesuch a weather conditions (e.g., rain events and wind conditions). Therefore, the absencecollectable flies on farms was not necessarily conclusive evidence of the absence of fly vectors and associated pathogen concentrations or loads. During this evaluation period, it was possible to examfrin Table 19.4. Microbial concentrations are expressed as concentrations per gram of housefly, with the mass of a single fly, averaged across all sites, being 0.017 grams. Samples were collected over a four-hour period at each site and the numbers of flies collected ranged from 9 to171. Although there were not many replicate sampling periods, the housefly concentrations at the Hickory Grove site with the Super Soils compost technology were significantly higher than for any of the other sites. In order to control the houseflies and their potential environmental impacat this technology site, it is suggested that the technology providers enclose the compost barn, or at minimum screen the compost barn, and cover the composted solid materials during the 30-day storage period.
Table 19.4. Nu
Number Fecal Coliform E. coli Enterococci Cl.
perfringens Coliphage S
(cfu/g) fu/g
8.2 8.0 8.5 2.5 > 7.0 > 6.0
8.0 7.9 8.2 4.2 ND < 3.3 Super Soils
c ompost 11/8/04 109 8.3 8.0 8.2 5.7 5.9 3.5 rrogat
2 7/28/03 9 7.5 7.4 7.6 6.1 5.9 3.3ND No Data Average housefly mass for all farms=0.017g
ISSUES - Carrolls 6/21/04 19
7/19/04 171
5/13/03 20 3.6 3.3 > 7.3 3.8 2.5 ND Su e <
Phase 2 OPEN Technology Evaluations - Pathogens 99
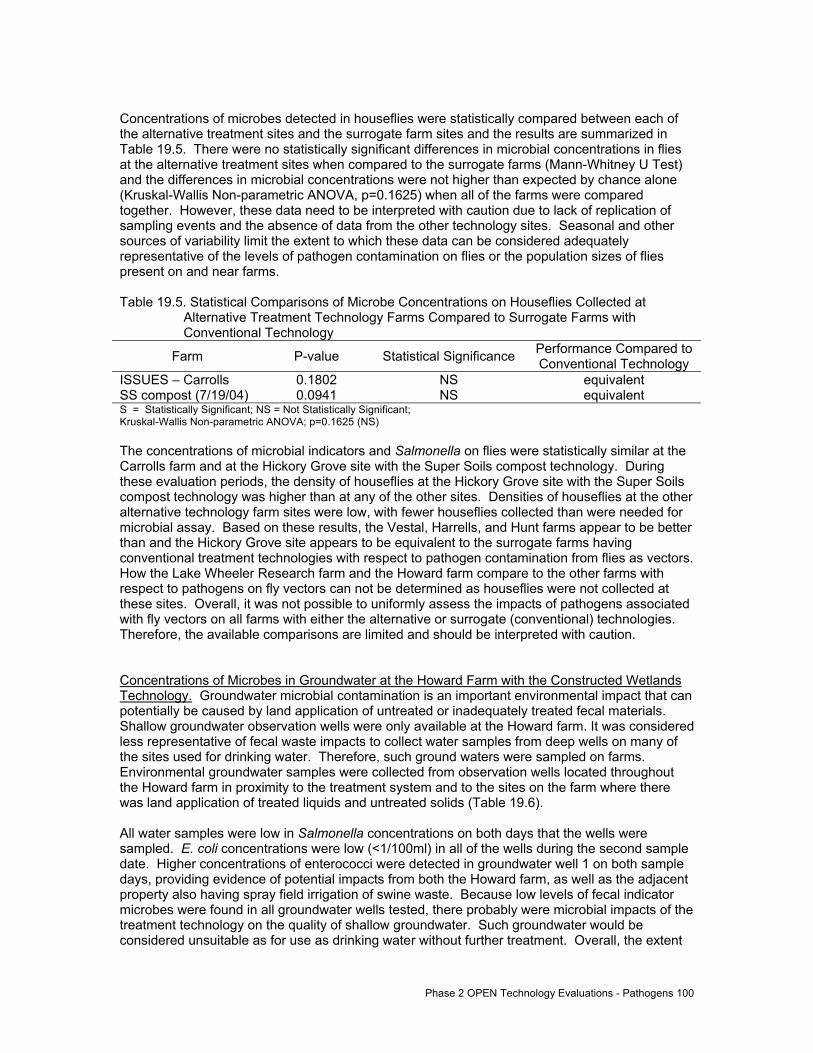
ions of microbes detected in houseflies were statistically compared between each of
e surrogate farm sites and the results are summarized in able 19.5. There were no statistically significant differences in microbial concentrations in flies
nt Technology Farms Compared to Surrogate Farms with Conventional Technology
F to hnology
Concentratthe alternative treatment sites and thTat the alternative treatment sites when compared to the surrogate farms (Mann-Whitney U Test) and the differences in microbial concentrations were not higher than expected by chance alone(Kruskal-Wallis Non-parametric ANOVA, p=0.1625) when all of the farms were compared together. However, these data need to be interpreted with caution due to lack of replication of sampling events and the absence of data from the other technology sites. Seasonal and other sources of variability limit the extent to which these data can be considered adequately representative of the levels of pathogen contamination on flies or the population sizes of flies present on and near farms. Table 19.5. Statistical Comparisons of Microbe Concentrations on Houseflies Collected at
Alternative Treatme
arm P-value Statistical Significance Performance Compared Conventional Tec
Carrolls 0.1802 ISSUES – NS equivalent SS comp 19/04) ost (7/ 0.0941 NS equivalent
Kruskal-Wallis Non-param A; p=0.1625
S = Statistically Significant; NS = Not Statistically Significant; etric ANOV (NS)
onella on flies were statistically similar at the th the Super Soils compost technology. During
ese evaluation periods, the density of houseflies at the Hickory Grove site with the Super Soils compost technology was higher than at any of the other sites. Densities of houseflies at the other alternative technology farm sites were low, with fewer houseflies collected than were needed for microbial assay. Based on these results, the Vestal, Harrells, and Hunt farms appear to be better than and the Hickory Grove site appears to be equivalent to the surrogate farms having conventional treatment technologies with respect to pathogen contamination from flies as vectors. How the Lake Wheeler Research farm and the Howard farm compare to the other farms with respect to pathogens on fly vectors can not be determined as houseflies were not collected at these sites. Overall, it was not possible to uniformly assess the impacts of pathogens associated with fly vectors on all farms with either the alternative or surrogate (conventional) technologies. Therefore, the available comparisons are limited and should be interpreted with caution. Concentrations of Microbes in Groundwater at the Howard Farm with the Constructed Wetlands
The concentrations of microbial indicators and SalmCarrolls farm and at the Hickory Grove site with
Technology. Groundwater microbial contamination is an important environmental impact that can potentially be caused by land application of untreated or inadequately treated fecal materials.
ring the second sample ate. Higher concentrations of enterococci were detected in groundwater well 1 on both sample
nt
Shallow groundwater observation wells were only available at the Howard farm. It was consideredless representative of fecal waste impacts to collect water samples from deep wells on many of the sites used for drinking water. Therefore, such ground waters were sampled on farms. Environmental groundwater samples were collected from observation wells located throughout the Howard farm in proximity to the treatment system and to the sites on the farm where there was land application of treated liquids and untreated solids (Table 19.6). All water samples were low in Salmonella concentrations on both days that the wells were sampled. E. coli concentrations were low (<1/100ml) in all of the wells duddays, providing evidence of potential impacts from both the Howard farm, as well as the adjaceproperty also having spray field irrigation of swine waste. Because low levels of fecal indicator microbes were found in all groundwater wells tested, there probably were microbial impacts of thetreatment technology on the quality of shallow groundwater. Such groundwater would be considered unsuitable as for use as drinking water without further treatment. Overall, the extent
Phase 2 OPEN Technology Evaluations - Pathogens 100

to which shallow (water table or unconfined aquifer) ground water was microbially impacted by land applied swine waste residuals could not be determined for most of the swine farms ofstudy. Therefore, it is not possible to determine if a particular alternative technology was superiorto either the conventional technology or another alternative technology on this basis. Table 19.6. Microbial Concentrations in Environmental Groundwater Samples Analyzed from
Observation Wells on the Howard Farm
this
Date (cfu/100mL) (cfu/100mL) perfringens
(cfu/100mL) (pfu/100mL)almonella
(cfu/100mL)
water 1
Sample Type
Fecal Coliforms E. coli
(cfu/100mL) Enterococci Cl. Coliphage S
Ground 2.0E+00 1.0E+00 1.6E+01 5.0E+00 < 1.0E+00 < 9.0E-01
water 2 Ground water 3 Ground water 4 Ground water 5 Ground water 1 Ground water 2 2.0E+00 < 1.0E+00 2.0E+00 4.1E+00 < 1.0E+00 < 3.0E-01
Ground 3.1E+00 < 1.0E+00 5.2E+00 9.0E-01 < 1.0E+00 < 3.0E-01
1.0E+00 < 1.0E+00 5.1E+00 1.4E+00 3.0E+00 < 3.0E-01
12/10/02
1.1E+01 < 1.0E+00 < 1.0E+00 5.0E-01 < 1.0E+00 < 3.0E-01
water 3 Ground water 4 Ground water 5
oncentra s in Air on ine Farms a Experiment ites havin lternative a d al Techn gies. Microbi s f olog ere o
total (aerobic/heterotrophic) bacteria, total (aerobic/heterotrophic) fungi, fecal coliforms, E. coli,
ia and
f the
ubmitted
l, wind farm
al air sample rom all techn y sites w analyzed f r
Ground 1.8E+01 1.6E+01 1.0E+00 5.0E-01 4.0E+00 < 9.0E-01
1.6E+01 1.6E+01 8.4E+00 5.0E-01 1.0E+00 < 9.0E-01
4.1E+00 4.1E+00 5.4E+01 2.4E+01 2.0E+00 < 9.0E-01
6/25/02
1.0E+00 1.0E+00 3.9E+01 2.0E+01 5.0E+00 < 9.0E-01
< 1.0E+00 < 1.0E+00 3.9E+01 2.7E+00 2.0E+00 < 3.0E-01
Microbial C tion Sw nd al S g A nConvention olo
Cl. perfringens spores, coliphages, Salmonella and endotoxins. These parameters were measured at upper (up wind) and lower (down wind) site boundaries, near barn exhaust fans and near other waste treatment operations and structures from which aerosols were likely to be emitted due to waste separation, mixing and other mechanical processes. Aerobic bacterfungi were detected in all air samples at all sites and the results for these samples are summarized in Tables 19.7. Airborne endotoxins have been completed for most but not all osites. Data that were available are summarized in Table 19.7. Endotoxins were detected in manyof the samples collected. A revised report with complete data for all of the sites will be swhen available. Total bacteria, fungi, and endotoxins are common in air and can arise from a variety of sources, however, they are not specific to fecal contamination. Because of the ubiquitous nature of these airborne microbes, a main goal of analyzing for them was to determineif the concentrations of these microbes differed with location on the site and between sites withdifferent treatment technologies. It is possible that the waste treatment and management operations and conditions on the sites were sources of these microbes and that increased or higher levels of these microbes in air emissions from waste sources or their treatment technologies would be indicative of increased airborne microbe concentrations on the site, especially in the downwind direction of air movement in relation to the technologies. In generaairborne concentrations of bacteria, fungi, and endotoxins tended to be lowest at the upboundary and highest near barn air exhausts and certain waste treatment operations (solids
Phase 2 OPEN Technology Evaluations - Pathogens 101

separation, aeration processes and waste treatment unit processes). Airborne concentrations of these microbes generally were higher at the downwind, (lower) farm boundary than at the upwind (upper) farm boundary, suggesting contributions to these bacteria by the farm waste management system or other farm sources. Table 19.7. Log10 Concentrations of Total Aerobic Bacteria, Total Fungi, and Endotox
Bioaerosol Samples at the Alternains in
tive Technology and Surrogate Farms
ummarized in Table 19.8. Four of the alternative treatment sites (Harrells, Carrolls, Hunt, and than
heeler
mean stdev mean stdev mean stdev
Endotoxincfu / m3 EU / m3Farm ion
Total Aerobic Bacteria Total FungiLocat
The total bacteria and fungi concentrations from alternative treatment technology sites were statistically compared to the concentrations at surrogate farm sites and the results are
Upper Boundary 5.0 5.0 3.5 3.4 1.9 1.9Lower Boundary 5.2 5.1 3.7 3.7 2.2 2.3
Barn 5.9 5.9 3.6 3.6 3.3 3.3Wetland 5.4 5.6 3.3 3.5 2.2 2.4
Technology 5.3 5.4 3.5 3.5 1.8 1.3Upper Boundary 3.7 4.0 3.3 3.4 13.6 10.6Lower Boundary 3.2 3.2 3.2 3.2 36.4 41.6
Barn 3.6 3.5 2.9 3.0 235.5 275.4Technology 2.6 2.7 3.0 3.2 21.7 14.2
Clarifier 4.0 4.2 3.2 3.2 12.3 9.3Upper Boundary 2.6 2.8 2.4 2.5 11.0 10.4Lower Boundary 4.4 4.8 2.7 2.6 14.9 7.1
Barn 4.0 4.0 2.6 2.5 89.5 137.1Technology 4.0 4.3 2.7 2.9 9.7 4.7Upper Spray 3.6 3.6 2.3 1.3 n/dLower Spray 4.4 4.3 3.4 2.3 n/dTechnology 2 3.2 3.3 2.7 0.0 93.1
Upper Boundary 2.8 2.7 2.6 2.8 5.1 2.1Lower Boundary 3.2 2.9 2.7 2.8 14.6 7.4
Barn 3.8 3.8 2.5 2.6 94.9 79.1Lagoon 1 3.1 2.9 2.8 3.0 52.2 16.9Lagoon 2 2.4 2.2 2.8 2.9 7.6 0.5
Upper Boundary 1.7 1.8 1.9 2.1 3.8 3.5Lower Boundary 2.1 2.1 1.5 1.5 14.5 6.5
Barn 3.1 3.3 1.8 1.8 13.4 11.3Lagoon 2.1 2.3 1.4 1.6 8.6 7.8
Technology 2.5 2.5 2.6 2.9 13.0 14.2Upper Boundary 2.2 1.8 3.1 2.3 2.8Lower Boundary 1.4 1.5 3.1 2.5 2.6
Technology 2.5 2.6 3.0 2.7 4.3Upper Boundary 2.9 2.9 2.4 2.3 22.1 8.9Lower Boundary 3.1 3.0 2.6 2.7 14.4 9.7
Technology 3.5 3.6 2.8 2.7 71.3 57.0Upper Boundary 4.0 4.5 3.5 3.5 1.7 1.7Lower Boundary 3.8 4.0 3.7 3.8 1.7 1.7
Barn 4.5 4.7 3.5 3.5 2.5 2.3Lagoon 4.3 4.6 3.5 3.6 1.9 1.8
Upper Boundary 3.1 3.4 3.0 3.0 1.0 1.1Lower Boundary 3.9 4.3 3.6 3.6 1.4 1.5
Barn 5.2 5.2 3.8 4.3 3.0 3.1Lagoon 4.4 4.8 3.4 3.6 1.3 1.4
Super Soils compost
LWRF - gasifier
ISSUES - Vestal
ISSUES - Harrells
ISSUES - Carrolls
SBR - Hunt
Surrogate 2
CW
Surrogate 1
sHickory Grove sites) were statistically better (had significantly lower airborne concentrations) the surrogate farms for both total bacteria and fungi. It should be noted that the Lake W
Phase 2 OPEN Technology Evaluations - Pathogens 102

Research farm ReCycle gasifier and the Hickory Grove Super Soils composting technology siteswere central processing facilities for solids treatment with none of the typical components on a swine farm that may impact air quality (i.e. barns, lagoons, sprayfields, etc.). Based on the concentrations of total bacteria and fungi in air on the alternative waste treatment sites, the Harrells farm and Carrolls farm with the ISSUES technology, the Hunt farm with the SBR technology, and Hickory Grove site with the Super Soils compost technology were environmentally superior to conventional treatment technologies. These findings must be interpreted with caution due to potential variations in other factors and conditions influencimicrobial air quality, such as season, other temporal changes, local meteorology anfarm or nearby off-farm activities besides waste management systems. It was not possibleseparate, distinguish or quantify the contributions to airborne microbe concentrations of wastetreatment and management technologies from those of other airborne microbial sources on farmor test sites. Therefore, these statistical comparisons do not necessarily indicate the specific roor contribution of the waste treatment technology and management system in the air quality thawas measured. There were simply too many other factors that could have influenced microbial air quality that were not measured or accounted for in these analyses. So, attributions to effects of the technology alone are not possible and interpretations of results need to be made with due caution. Table 19.8. Statistical Comparisons of Total Bacteria, Total Fungi, and Endotoxin Concentrations
ng d other on-
to
s le t
in Air Sampled at Alternative Treatment Technology Farms Compared to Surrogate Farms with Conventional Technology
Concentrati Farms and Experimental Sites having
S Statistically Significant; NS Not Statistically Significant
P-value (Significant)
compared to surrogate
farms
P-value (Significant)
compared to surrogate
farms
P-value (Significant)
compared to surrogate
farmsHoward <0.0001 (S) worse 0.1396 (NS) equivalent 0.3515 (NS) equivalent
ISSUES - Vestal 0.0183 (S) better 0.0622 (NS) equivalent 0.0233 (S) better
ISSUES - Harrells 0.0287 (S) better <0.0001 (S) better 0.0024 (S) better
ISSUES - Carrolls 0.0078 (S) better <0.0001 (S) better 0.0093 (S) better
SBR - Hunt <0.0001 (S) better <0.0001 (S) better 0.0011 (S) betterLWRF - gasifier 0.0005 (S) better 0.9895 (NS) equivalent 0.0003 (S) better
Super Soils compost 0.0110 (S) better 0.0012 (S) better 0.0595 (NS) equivalent
Farm
K-W p=<0.0001 (S) K-W p=<0.0001 (S) K-W p=<0.0001 (S)
ons of Fecal Indicators in Air on Swine
performance performance performanEndotoxinTotal Bacteria Total Fungi
Alternative and Conventional Technologies. The data for airborne microbes associated with fecal contamination (fecal coliforms, E. coli, Cl. perfringens spores, coliphages and Salmonella) are summarized in Table 19.9 on the basis of percent of samples positive for any fecal indicator
cal
s and
ce
microbe along with geometric mean and median concentrations of airborne microbes of feorigin in positive samples. On the farms with conventional technology, 9% of samples were positive for fecal microbes. On alternative technology sites, the percentages of positive sampleranged from 0% to 19%. For sites where fecal indicators were detected, the geometric meanmedian microbe concentrations were similar, and ranged from 24 to 154 cfu per cm3 and 31 to100 cfu per cm3, respectively. On the basis of the number of positive samples on farms, theVestal farm with the ISSUES technology, the Harrells farm with the ISSUES technology, the Hunt
Phase 2 OPEN Technology Evaluations - Pathogens 103
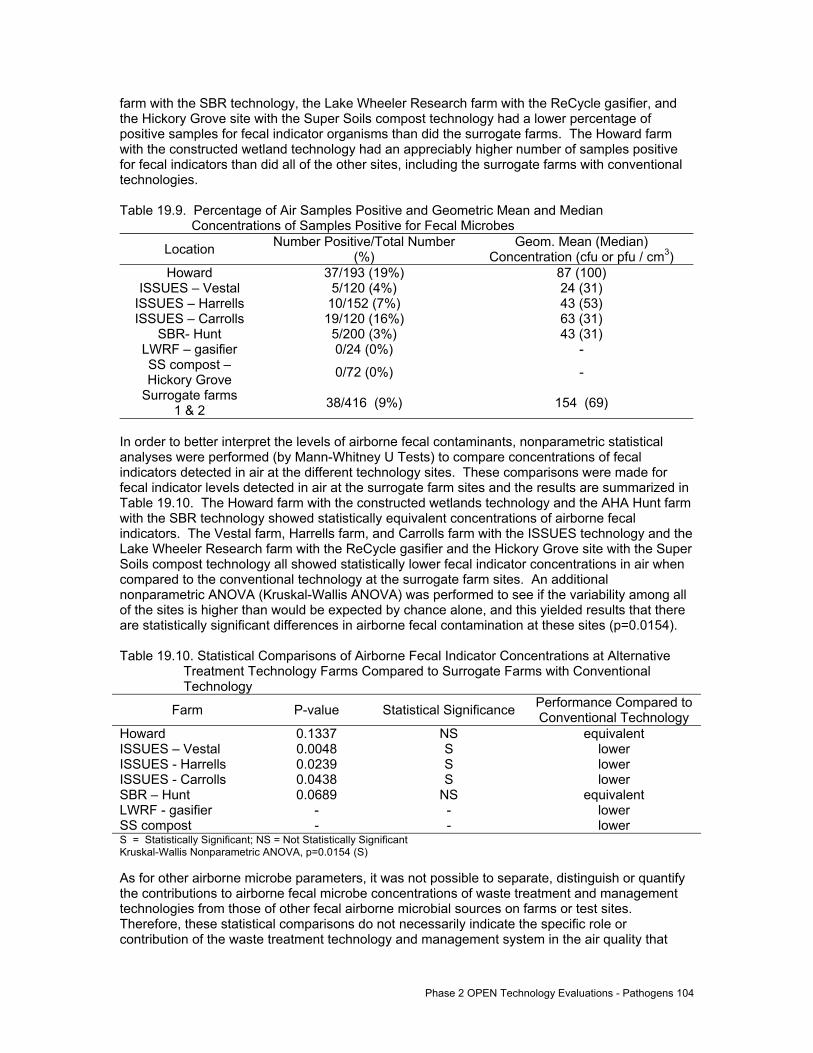
farm with the SBR technology, the Lake Wheeler Research farm with the ReCycle gasifier, and the Hickory Grove site with the Super Soils compost technology had a lower percentage of positive samples for fecal indicator organisms than did the surrogate farms. The Howard farmwith the constructed wetland technology had an appreciably higher number of samples positive for fecal indicators than did all of the other sites, including the surrogate farms with conventional technologies. Table 19.9. Percentage of Air Samples Positive and Geometric Mean and Median
Concentrations of Samples Positive for Fecal Microbes
Location
Number Positive/Total Number (%)
Geom. Mean (Median) Concentration (cfu or pfu / cm3)
Howard 37/193 (19%) 87 (100) – Vestal 5/120 (4%) ISSUES 24 (31)
ISSUES – Harrells ISSUES – Carrolls 19/120 (16%)
S
Su s 3 1
10/152 (7%) 43 (53) 63 (31)
BR- Hunt 5/200 (3%) 43 (31) LWRF – gasifier 0/24 (0%) - SS compost – Hickory Grove 0/72 (0%) -
rrogate farm1 & 2 8 ) /416 (9% 54 69) (
der to better inte of airborne etlyses were perform -Whitney U Te
erent technologtrations of ons were s detec
In or rpret the levels fecal contaminants, nonparam ric statistical ana ed (by Mann sts) to compare concen fecal indicator ted in air at the diff y sites. These comparis made for
cal indicator levels detected in air at the surrogate farm sites and the results are summarized in rm
the
Performance Compared to y
feTable 19.10. The Howard farm with the constructed wetlands technology and the AHA Hunt fawith the SBR technology showed statistically equivalent concentrations of airborne fecal indicators. The Vestal farm, Harrells farm, and Carrolls farm with the ISSUES technology and Lake Wheeler Research farm with the ReCycle gasifier and the Hickory Grove site with the Super Soils compost technology all showed statistically lower fecal indicator concentrations in air when compared to the conventional technology at the surrogate farm sites. An additional nonparametric ANOVA (Kruskal-Wallis ANOVA) was performed to see if the variability among all of the sites is higher than would be expected by chance alone, and this yielded results that there are statistically significant differences in airborne fecal contamination at these sites (p=0.0154). Table 19.10. Statistical Comparisons of Airborne Fecal Indicator Concentrations at Alternative
Treatment Technology Farms Compared to Surrogate Farms with Conventional Technology
Farm P-value Statistical Significance Conventional Technolog0.1337 NS equivalent
Vestal Howard ISSUES – 0.0048 S lower ISSUES lls ISSUES lls
nt
-
- Harre - Carro
0.0239 0.0438
S S
lower lower
SBR – Hu 0.0689 NS equivalent LWRF - gasifier - - lower SS compost - lower S = Statistically Significant; NS = Not Statistically Significant
onparametric ANOVA, p=0.0154 (S)
rne microbe parameters, it was not possible to separate, disting ntify rne fecal microbe concentrations of waste treatment and management
rne microbial sources on farms or test sites. herefore, these statistical comparisons do not necessarily indicate the specific role or
contribution of the waste treatment technology and management system in the air quality that
Kruskal-Wallis N
irboAs for other athe contributions to airbo
uish or qua
technologies from those of other fecal airboT
Phase 2 OPEN Technology Evaluations - Pathogens 104
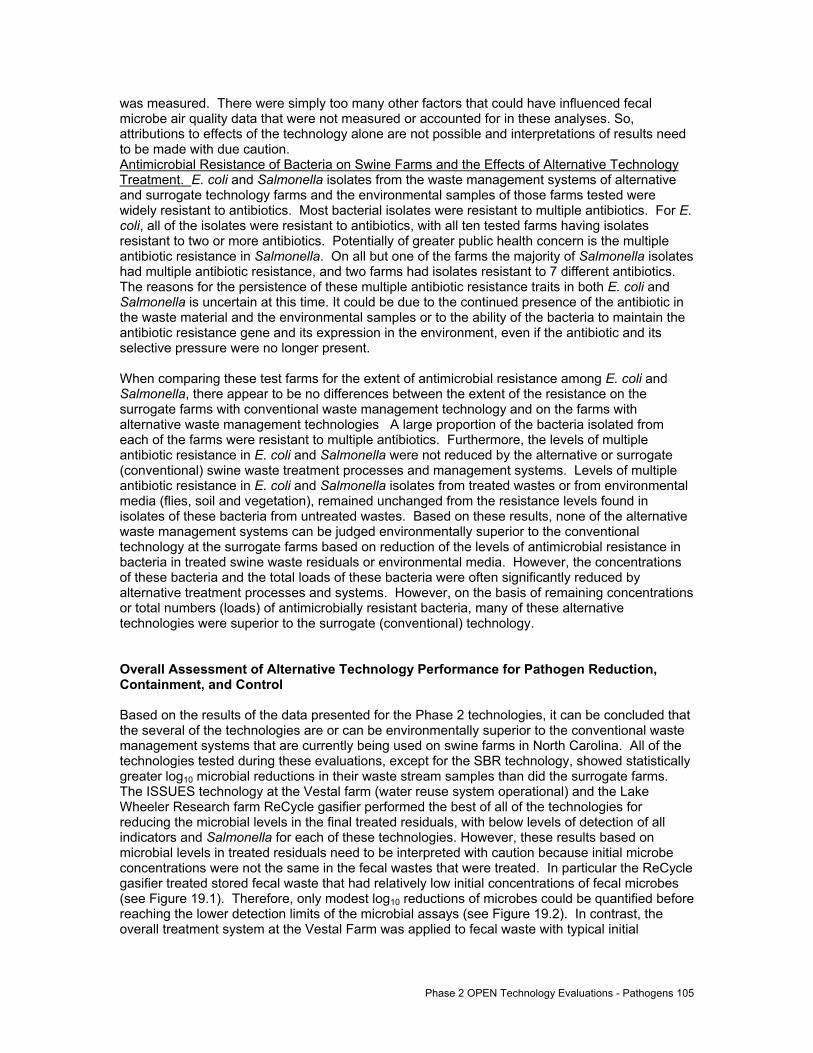
was measured. There were simply too many other factors that could have influenced fecal microbe air quality data that were not measured or accounted for in these analyses. So, attributions to effects of the technology alone are not possible and interpretations of resulto be made with due caution. Antimicrobial Resistance of Bacteria on Swine Farms and the Effects of Alternative Technology
ts need
Treatment. E. coli and Salmonella isolates from the waste management systems of alternatand surrogate technology farms and the environmental samples of those farms tested wewidely resistant to antibiotics. Most bacterial isolates were resistant to multiple antibiotics. For E.coli, all of the isolates were re
ive re
sistant to antibiotics, with all ten tested farms having isolates
s.
tic in e
large proportion of the bacteria isolated from ach of the farms were resistant to multiple antibiotics. Furthermore, the levels of multiple
iple mental
ative
ased on the results of the data presented for the Phase 2 technologies, it can be concluded that e several of the technologies are or can be environmentally superior to the conventional waste
the ese evaluations, except for the SBR technology, showed statistically
greater log10 microbial reductions in their waste stream samples than did the surrogate farms.
Cycle obes
fore
resistant to two or more antibiotics. Potentially of greater public health concern is the multiple antibiotic resistance in Salmonella. On all but one of the farms the majority of Salmonella isolates had multiple antibiotic resistance, and two farms had isolates resistant to 7 different antibioticThe reasons for the persistence of these multiple antibiotic resistance traits in both E. coli and Salmonella is uncertain at this time. It could be due to the continued presence of the antibiothe waste material and the environmental samples or to the ability of the bacteria to maintain thantibiotic resistance gene and its expression in the environment, even if the antibiotic and its selective pressure were no longer present. When comparing these test farms for the extent of antimicrobial resistance among E. coli and Salmonella, there appear to be no differences between the extent of the resistance on the surrogate farms with conventional waste management technology and on the farms with alternative waste management technologies A eantibiotic resistance in E. coli and Salmonella were not reduced by the alternative or surrogate (conventional) swine waste treatment processes and management systems. Levels of multantibiotic resistance in E. coli and Salmonella isolates from treated wastes or from environmedia (flies, soil and vegetation), remained unchanged from the resistance levels found in isolates of these bacteria from untreated wastes. Based on these results, none of the alternwaste management systems can be judged environmentally superior to the conventional technology at the surrogate farms based on reduction of the levels of antimicrobial resistance in bacteria in treated swine waste residuals or environmental media. However, the concentrations of these bacteria and the total loads of these bacteria were often significantly reduced by alternative treatment processes and systems. However, on the basis of remaining concentrationsor total numbers (loads) of antimicrobially resistant bacteria, many of these alternative technologies were superior to the surrogate (conventional) technology. Overall Assessment of Alternative Technology Performance for Pathogen Reduction, Containment, and Control Bthmanagement systems that are currently being used on swine farms in North Carolina. All of technologies tested during th
The ISSUES technology at the Vestal farm (water reuse system operational) and the Lake Wheeler Research farm ReCycle gasifier performed the best of all of the technologies for reducing the microbial levels in the final treated residuals, with below levels of detection of all indicators and Salmonella for each of these technologies. However, these results based on microbial levels in treated residuals need to be interpreted with caution because initial microbe concentrations were not the same in the fecal wastes that were treated. In particular the Regasifier treated stored fecal waste that had relatively low initial concentrations of fecal micr(see Figure 19.1). Therefore, only modest log10 reductions of microbes could be quantified bereaching the lower detection limits of the microbial assays (see Figure 19.2). In contrast, theoverall treatment system at the Vestal Farm was applied to fecal waste with typical initial
Phase 2 OPEN Technology Evaluations - Pathogens 105
concentrations of microbes in fecal wastes (see Figure 19.1), and therefore, extensive log10 reductions could be documented as evidence of highly effective performance (see Figure 19.2). When measuring environmental impacts of the alternative waste treatment systems and comparing environmental impacts from the surrogate farms, soil and vegetation collections frland application areas, vectors, groundwater, and air were used as the basis for comparisons.
om
here were no statistically significant differences for impacts to soils from any of the sites. There for
ere
ckory oils compost technology. At this time, endotoxin analyses have not
een completed and these results will be reported in a revised report as soon as they are
e ted
sible to derive valid onclusions about whether or not there was superior performance on the basis of these
by the logies
rior to the conventional technology. The SUES waste management system installed at the Vestal farm is superior for treatment of
or
r
n such that its athogen content was effectively reduced and contained. The Lake Wheeler Research Farm
such n
control
Twere no statistically significant differences for microbial concentrations on or in housefliessites from which houseflies were collected. Housefly densities were highest at the Hickory Grovesite with the Super Soils compost technology and lowest (below levels necessary for microbial assays) for the Vestal and Harrells farms with the ISSUES technology and for the Hunt farm with the SBR technology. Only one site had accessible shallow groundwater (Howard farm) and thwas evidence of fecal contamination in these test wells making them unsuitable for use as drinking water. Airborne microbial contamination (total bacteria and fungi) were lower at the Harrells and Carrolls farms with the ISSUES technology, at the Hunt farm with the SBR technology, and at the HiGrove site with the Super Sbavailable. The numbers of air samples positive for fecal microbes were lower from all of the Phase 2 technology sites, except for the Howard farm with the constructed wetlands technology and the Carrolls farm with the ISSUES technology. When the fecal indicator concentrations werstatistically compared, all of the sites were lower except for the Howard farm with the construcwetlands technology and the Hunt farm with the SBR technology. Overall, the lack of environmental samples for many of the candidate technologies, the limited data for others and the variability of the farms and sites with respect to a variety of other environmental and management conditions makes it almost imposcenvironmental parameters for microbial quality. However, based on all available data and especially the microbial reductions achieved waste treatment processes and technologies in particular, several of the Phase 2 technocan or could be considered environmentally supeISwastes and effectively reduced pathogens in both solid and liquid fractions of the swine waste.However, there are levels of airborne microbial contamination equivalent to that on the conventional farms. The ISSUES waste management system at the Harrells Farm also cancould be considered superior for waste treatment as well. It effectively reduced pathogens inboth the solid and liquid fractions of the swine waste. However, the spray evaporation system fothe covered lagoon contributes undesirable levels of microbes to the air. For those technologies that treated only separated waste solids or liquids and did not treat theother waste fraction, such technologies can be considered environmentally superior only if effective treatment and management was applied to the other waste fractiopReCycle gasifier is superior to the conventional sites for treatment of solid wastes. However, inprevious studies the separated swine waste liquid still contained relatively high levels of pathogens and therefore, further treatment of this residual material is recommended. Withmodifications in operations, management or additional treatment of a currently untreated fractioof separated swine waste, the ReCycle gasifier as well as several other technologies, could be considered environmentally superior to conventional treatment. With improved fly vector at the Hickory Grove site, the Super Soils compost technology plus subsequent storage of the compost would be considered environmentally superior for treatment of separated swine waste solids because of the extensive microbial reductions achieved by the dual processes of composting followed by storage. However, the separated liquid fraction of the swine waste also
Phase 2 OPEN Technology Evaluations - Pathogens 106
would need to be treated and managed to significantly reduce and contain pathogens. The constructed wetland treatment system of the Howard Farm effectively treated only separated swine waste liquid and on this basis was superior to the surrogate technology. However, the separated swine waste solids were not further treated to reduce pathogens and high pathogen levels remained in this material when land applied. Further pathogen treatment of these separated solids is recommended. In making decisions regarding a particular technology being considered environmental superior,is recommended that only those technologies that achieved: (1) extensive reductions of pathogens in unseparated or combin
it
ed swine waste or (2) extensive reductions in both the eparated solids and liquid fractions to be considered environmentally superior as an overall
ids or y ne
stechnology. However, it is further recommended that treatment technologies found effective in appreciably reducing pathogens in one of the separated fractions of the swine waste (solliquids) be considered potentially environmentally superior if combined with another technologthat was effective in appreciably reducing pathogens in the other separated fraction of the swiwaste. The use of both treatment technologies together could then be considered environmentally superior because they are capable of achieving extensive overall reductions of pathogens in both of the separated fractions (solid and liquid) of the swine waste.
Phase 2 OPEN Technology Evaluations - Pathogens 107

20. Evaluation of Belt System for Manure Removal and the Black Soldier Fly (BSF) Technology (Lake Wheeler Research Farm) for Pathogens
Project OPEN Science Team for Pathogens
Alternative Technology: Retrofit installation of a conveyor belt designed to separate the solid and liquid manure or fecal waste of swine. This technology is linked with the Black Soldier Fly (BSF) technology for treat to a value-added roject (protein that can be recovered for animal feed).
he evaluation dates were:
and air) nd /15/02003 (air only)
003 (belt liquid/solid and air) 003 (air only)
ry Newton, Gary Burtle, Robert Dove – BSF
CSU Representative PI: Wes Watson – BSF (919-513-2028)
- Measurement of microbial indicator and pathogen concentrations at key points in the
- Measurement of airborne microbial indicator and pathogen concentrations at selected udy site in close proximity to the treatment system and at the upper and
- ncentrations on flies collected on the
-
- Microbial parameters measured for the waste stream: fecal indicators (fecal coliforms, E. coli, enterococci, spores of Clostridium perfringens, and total coliphages) and the
- amples: total bacteria, total fungi, bacterial
- ured at same sample points as air samples were
MeasurTreatme
ment of the solid waste fraction and conversionp Location: Lake Wheeler Research Farm (Raleigh, NC) Period of Operation: T
st field experiment: 07/08/2003 (belt and BSF liquid/solid12 field experiment: 07
rd3 field experiment: 11/10/24th field experiment: 11/17/2 Technology Supplier: Craig Sheppard, Lar(University of Georgia, 229-386-3374) N Statement of Task:
waste treatment unit processes of the technologies
sites on the stlower property boundaries Measurement of microbial indicator and pathogen costudy site that may serve as pathogen vectors Microbial measurements were made during two sessions corresponding to a warm andcold season (warm season only for BSF).
bacterial pathogen Salmonella Microbial parameters measured in the air sendotoxins, fecal indicators (fecal coliforms, E. coli, spores of Clostridium perfringens, and total coliphages) and the bacterial pathogen Salmonella Environmental conditions meascollected: temperature, wind direction and speed, relative humidity, solar irradiance
ement of Pathogens: nt Technology
jor source of pathogens for the pilot-scale system was fecal matter from the animals The maoused in the barn. This waste management technology focused on the separation of feces and
aste from the barn, which was coupled with the black soldier fly t of waste solids. A belt ran under the swine holding facilities and
y so
SF)
e-
hurine in the combined animal wtechnology for treatmenseparated the solids from the liquid of the manure. The belt was convex and ran continuouslurine could run off to both sides into a gutter system, after which the liquid was stored with no further treatment. Based on this information, the samples to be collected and analyzed were fresh feces, solids from the belt, and the diverted urine. The combined Black Soldier Fly (Btechnology was intended to treat the fecal wastes from the barn, where Black Soldier Fly larva (pre-pupae) feed on the fecal matter, were collected, and subjected to further processing (freezdrying) for recovery to a value-added product. The protein rich freeze-dried Black Soldier Fly
Phase 2 OPEN Technology Evaluations - Pathogens 108
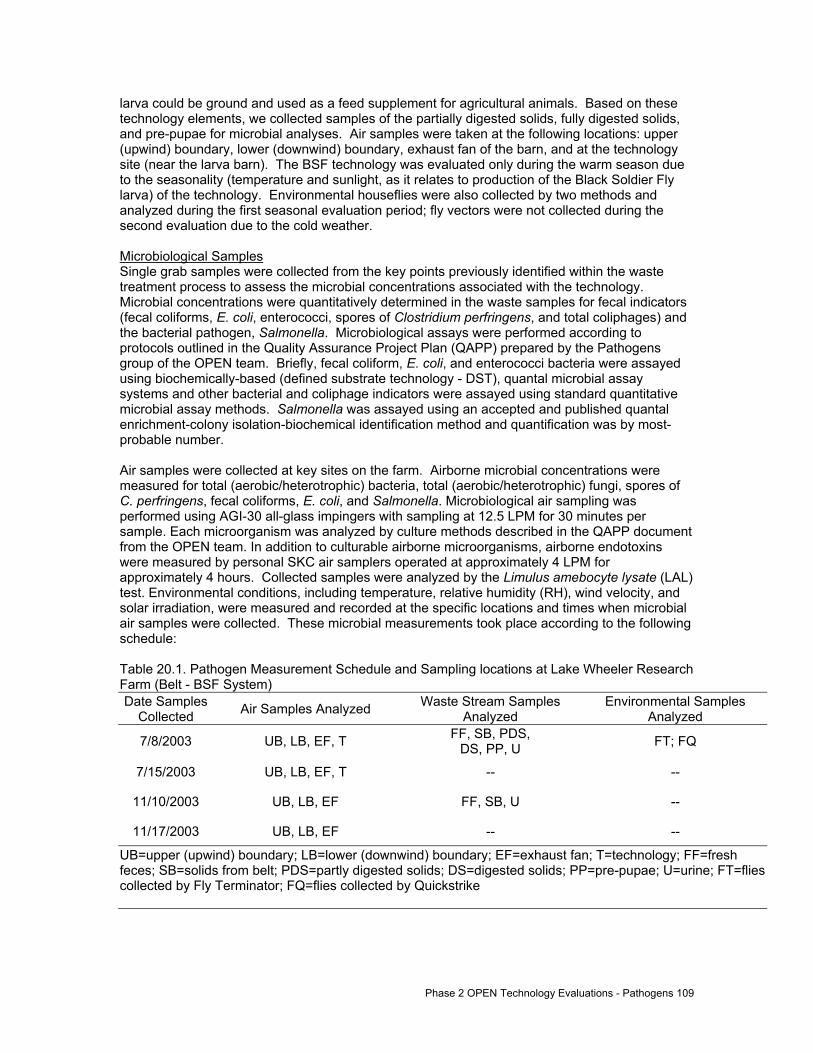
larva could be ground and used as a feed supplement for agricultural animals. Based on these technology elements, we collected samples of the partially digested solids, fully digested solids,and pre-pupae for microbial analyses. Air samples were taken at the following locations: upper (upwind) boundary, lower (downwind) boundary, exhaust fan of the barn, and at the technology site (near the larva barn). The BSF technology was evaluated only during the warm season dueto the seasonality (temperature and sunlight, as it relates to production of the Black Soldier Fly larva) of the technology. Environmental houseflies were also collected by two methods and analyzed during the first seasonal evaluation period; fly vectors were not collected during the second evaluation due to the cold weather. Microbiological Samples
Single grab samples were collected from the key points previously identified within the waste treatment process to assess the microbial concentrations associated with the technology. Microbial concentrations were quantitatively determined in the waste samples for fecal indicators
terococci, spores of Clostridium perfringens, and total coliphages) and
s
ative
f l coliforms, E. coli, and Salmonella. Microbiological air sampling was
erformed using AGI-30 all-glass impingers with sampling at 12.5 LPM for 30 minutes per ent
(LAL)
ial the following
ples Collected Air Samples Analyzed Waste Stream Samples
Analyzed Environmental Samples
Analyzed
(fecal coliforms, E. coli, enthe bacterial pathogen, Salmonella. Microbiological assays were performed according to protocols outlined in the Quality Assurance Project Plan (QAPP) prepared by the Pathogengroup of the OPEN team. Briefly, fecal coliform, E. coli, and enterococci bacteria were assayed using biochemically-based (defined substrate technology - DST), quantal microbial assay systems and other bacterial and coliphage indicators were assayed using standard quantitmicrobial assay methods. Salmonella was assayed using an accepted and published quantalenrichment-colony isolation-biochemical identification method and quantification was by most-probable number. Air samples were collected at key sites on the farm. Airborne microbial concentrations were measured for total (aerobic/heterotrophic) bacteria, total (aerobic/heterotrophic) fungi, spores oC. perfringens, fecapsample. Each microorganism was analyzed by culture methods described in the QAPP documfrom the OPEN team. In addition to culturable airborne microorganisms, airborne endotoxins were measured by personal SKC air samplers operated at approximately 4 LPM for approximately 4 hours. Collected samples were analyzed by the Limulus amebocyte lysatetest. Environmental conditions, including temperature, relative humidity (RH), wind velocity, and solar irradiation, were measured and recorded at the specific locations and times when microbair samples were collected. These microbial measurements took place according to schedule: Table 20.1. Pathogen Measurement Schedule and Sampling locations at Lake Wheeler ResearchFarm (Belt - BSF System) Date Sam
7/8/2003 UB FF, SB, PDS, , LB, EF, T DS, PP, U FT; FQ
7/15/2003 UB, LB, EF, T -- --
1
U ind) boun er (downwind) boun xhaust fan; T=technolog F=fresh fe s from belt digested solids; D solids; PP=pre-pupae; U=urine; FT=flies co Terminat ollected by Quickstrike
1/10/2003 UB, LB, EF FF, SB, U --
11/17/2003 UB, LB, EF -- --
B=upper (upwces; SB=solid
dary; LB=low; PDS=partly
dary; EF=eS=digested
y; F
llected by Fly or; FQ=flies c
Phase 2 OPEN Technology Evaluations - Pathogens 109
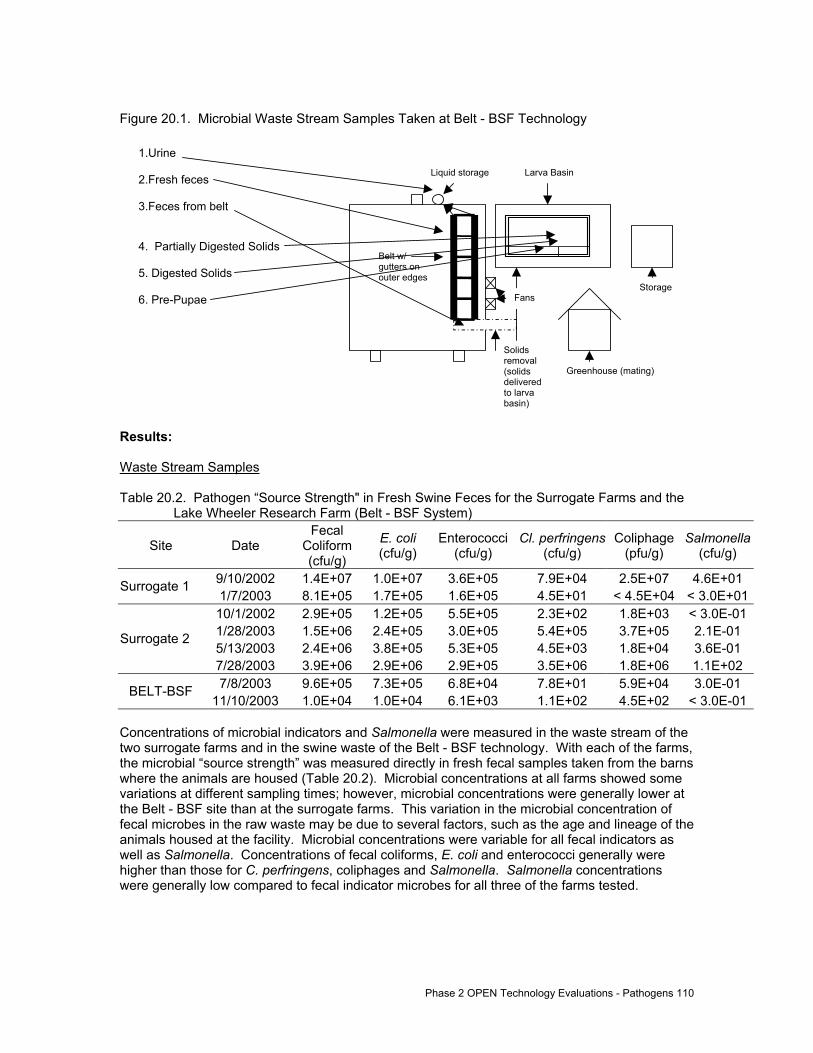
Figure 20.1. Microbial Waste Stream Samples Taken at Belt - BSF Technology
Results:
Liquid storage
Solids removal (solids delivered to larva basin)
Greenhouse (mating)
Storage
Larva Basin
Belt w/ gutters on outer edges
Fans
2.Fresh feces 3.Feces from belt 4. Partially Digested Solids 5. Digested Solids 6. Pre-Pupae
Waste Stream Samples Table 20.2. Pathogen “Source Strength" in Fresh Swine Feces for the Surrogate Farms and the
Lake Wheeler Research Farm (Belt - BSF System)
Site Date Fecal
Coliform E. coli Enterococci Cl. perfringens Coliphage Salmonella(cfu/g) (cfu/g) (cfu/g) (cfu/g) (cfu/g) (pfu/g)
9/10/2002 1.4E+07 1.0E+07 3.6E+05 7.9E+04 2.5E+07 4.6E+01 Surrogate 1 1/7/2003 8 110/1/2002 2.9E+05 1 5 2 1 <
.1E+05 .7E+05.2E+05
1.6E+05 .5E+05
4.5E+01 .3E+02
< 4.5E+04.8E+03
< 3.0E+01 3.0E-01
5/13/2003 2.4E+06 3.8E+05 1.8E+04 3.6E-01 7/28/2003 3.9E+06 2.9E+06 2.9E+05 3.5E+06 1.8E+06 7/8/2003 9.6E+05 7.3E+05 6.8E+04 7.8E+01 5.9E+04 3.0E-01
1.0E+04 1.0E+04 6.1E+03 4.5E+02 3.0E-01
of microbial icators an Salmonel ere meas in the was tream of th o surrogatee microbial
ms and in swine waste of the Beource strength” was meas red direct fresh fec mples take om the ba s
1/28/2003 1.5E+06 2.4E+05 3.0E+05 5.4E+05 3.7E+05 2.1E-01 5.3E+05 4.5E+03
Surrogate 2
1.1E+02
BELT-BSF 11/10/2003 1.1E+02 <
Concentrations ind d la w ured te s etw far the lt - BSF technology. With each of the farms, th “s u ly in al sa n fr rn
here the animals are housed (Table 20.2). Microbial concentrations at all farms showed some
1.Urine
wvariations at different sampling times; however, microbial concentrations were generally lower at the Belt - BSF site than at the surrogate farms. This variation in the microbial concentration of fecal microbes in the raw waste may be due to several factors, such as the age and lineage of the animals housed at the facility. Microbial concentrations were variable for all fecal indicators as well as Salmonella. Concentrations of fecal coliforms, E. coli and enterococci generally were higher than those for C. perfringens, coliphages and Salmonella. Salmonella concentrations were generally low compared to fecal indicator microbes for all three of the farms tested.
Phase 2 OPEN Technology Evaluations - Pathogens 110
Table 20.3. Log10 Microbial Reductions based on the Separated Solids of the Swine Waste Stream Achieved by the Belt System on the Lake Wheeler Research Farm and on the Lagoon Liquid at the Surrogate Farms
Site Date Fecal Coliforms E. coli Enterococci Cl. perfringens Coliphage Salmonella
9/10/2002 2.0 2.1 2.0 1.3 2.0 1.4 Surrogate 1 1/7/2003 1.5 1.5 1.1 0.4 1.1 2.4
10/1/2002 1.5 1.6 0.9 1.3 0.7 > 0.2
5/13/2003 1.6 1.2 0.9 1.4 1.0 0.3 2 2.1 2.0 1.3 2.0 1.4
7/8/2003 0.3 0.2 -0.8 -1.2 -0.8 BELT 11/10/2003 -1.3 -1.1 0.4 -0.5 > 0.0 > 0.0
micro within ystem
order to Belt sy
rmine trea fficac con es anm, log10 micro educti re co for e
1/28/2003 0.7 0.7 0.3 -0.3 0.7 -0.8 Surrogate
7/28/2003 2.0 0.1
* Negative log10 reduction values correspond to increased be levels treatment s s In dete tment e y of the ventional technology at surrogate sit d of the ste bial r ons we mputed ach of the systems (Table 20.3).
influent to the treatment systems and the lagoon liquid microbial concentrations as the final treated material for
t
a
rated
t
each
ids than from the lagoon liquids at either of the surrogate farms. This was not unexpected because this belt system was designed to separate the liquid and solid portion of the
-
Reductions were computed using the barn flush for each surrogate farm as the
the surrogate farms. Reductions were computed for the solid waste stream of the Belt system based on microbial concentrations in the fresh feces as the starting material and feces collected from the belt after the system was operated and before it was subject to further waste treatmenby the pre-pupae in the Black Soldier Fly (BSF) system on Lake Wheeler Research Farm. Microbial concentrations in the barn flush were used for the surrogate farms because these givemore representative estimate of the microbial concentrations of the influent to the treatment system than the microbial concentrations in fresh fecal matter. The barn flush represents a greater portion of the animals in the house and provides a more homogenous and time-integmixture of microbes. Additionally, these concentrations in fresh barn flush account for any microbial degradation that may occur within the houses before the waste enters the treatmensystem. There appeared to be some variability of microbial reductions at the Belt technology site forof the sample dates, but in each case, the microbe reductions were generally lower from the separated sol
waste stream and was not specifically aimed at treatment of the waste. The log10 reductions of allmicrobial indicators and Salmonella from the separated solids were significantly lower (p=<0.0001) than those achieved by the lagoon of surrogate farms, as determined by the nonparametric Mann-Whitney U-test. It should be noted that this technology was linked with the BSF treatment technology on the same site, which was designed for conversion of the swine waste to value-added product (Black Soldier Fly pre-pupae).
Phase 2 OPEN Technology Evaluations - Pathogens 111
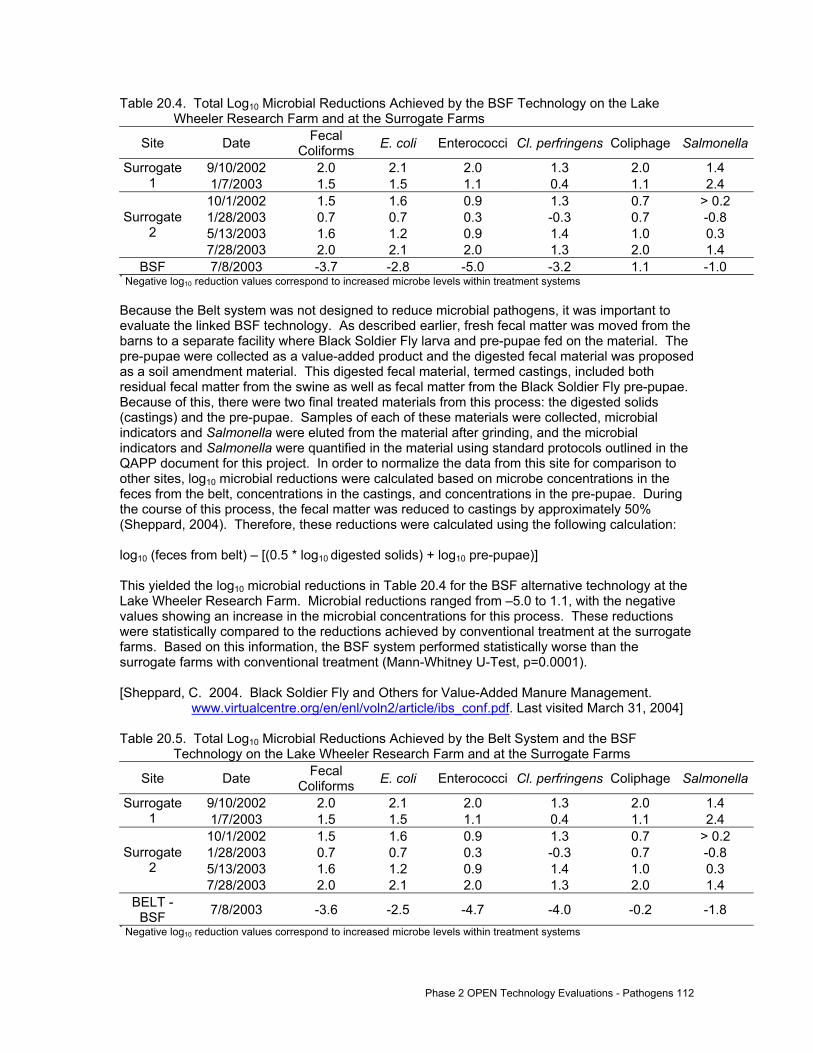
Table 20.4. Total Log10 Microbial Reductions Achieved by the BSF Technology on the Lake Wheeler Research Farm and at the Surrogate Farms
Site Date Fecal Coliforms E. coli Enterococci Cl. perfringens Coliphage Salmonella
9/10/2002 2.0 2.1 2.0 1.3 2.0 1.4 Surrogate 1 1/7/2003 1.5 1.5 1.1 0.4 1.1 2.4
10/1/2002 1.5 1.6 0.9 1.3 0.7 > 0.2 1/28/2003 0.7 0.7 0.3 -0.3 0.7 -0.8 5/13/2003 1.6 1.2 0.9 1.4 1.0 0.3
Surrogate 2
7/28/2003 2.0 2.1 2.0 1.3 2.0 1.4 BSF 7/8/2003 -3.7 -2.8 -5.0 -3.2 1.1 -1.0
* Negative log10 reduction values correspond to increased microbe levels within treatment systems
Because the Belt system was not designed to reduce microbial pathogens, it was important to evaluate the linked BSF technology. As described earlier, fresh fecal matter was moved from the barns to a separate facility where Black Soldier Fly larva and pre-pupae fed on the material. The pre-pupae were collected as a value-added product and the digested fecal material was proposed as a soil amendment material. This digested fecal material, termed castings, included both residual fecal matter from the swine as well as fecal matter from the Black Soldier Fly pre-pupae. Because of this, there were two final treated materials from this process: the digested solids (castings) and the pre-pupae. Samples of each of these materials were collected, microbial indicators and Salmonella were eluted from the material after grinding, and the microbial indicators and Salmonella were quantified in the material using standard protocols outlined in the QAPP document for this project. In order to normalize the data from this site for comparison to other sites, log10 microbial reductions were calculated based on microbe concentrations in the feces from the belt, concentrations in the castings, and concentrations in the pre-pupae. During the course of this process, the fecal matter was reduced to castings by approximately 50% (Sheppard, 2004). Therefore, these reductions were calculated using the following calculation:
log10 (feces from belt) – [(0.5 * log10 digested solids) + log10 pre-pupae)]
This yielded the log10 microbial reductions in Table 20.4 for the BSF alternative technology at the Lake Wheeler Research Farm. Microbial reductions ranged from –5.0 to 1.1, with the negative values showing an increase in the microbial concentrations for this process. These reductions were statistically compared to the reductions achieved by conventional treatment at the surrogate farms. Based on this information, the BSF system performed statistically worse than the surrogate farms with conventional treatment (Mann-Whitney U-Test, p=0.0001).
[Sheppard, C. 2004. Black Soldier Fly and Others for Value-Added Manure Management. www.virtualcentre.org/en/enl/voln2/article/ibs_conf.pdf. Last visited March 31, 2004]
Table 20.5. Total Log10 Microbial Reductions Achieved by the Belt System and the BSF
Technology on the Lake Wheeler Research Farm and at the Surrogate Farms
Site Date Fecal Coliforms E. coli Enterococci Cl. perfringens Coliphage Salmonella
9/10/2002 2.0 2.1 2.0 1.3 2.0 1.4 Surrogate 1 1/7/2003 1.5 1.5 1.1 0.4 1.1 2.4
10/1/2002 1.5 1.6 0.9 1.3 0.7 > 0.2 1/28/2003 0.7 0.7 0.3 -0.3 0.7 -0.8 5/13/2003 1.6 1.2 0.9 1.4 1.0
Surrogate 2
BELT - BSF 7/8/2003
0.3 7/28/2003 2.0 2.1 2.0 1.3 2.0 1.4
-3.6 -2.5 -4.7 -4.0 -0.2 -1.8 * Negative log10 reduction values correspond to increased microbe levels within treatment systems
Phase 2 OPEN Technology Evaluations - Pathogens 112
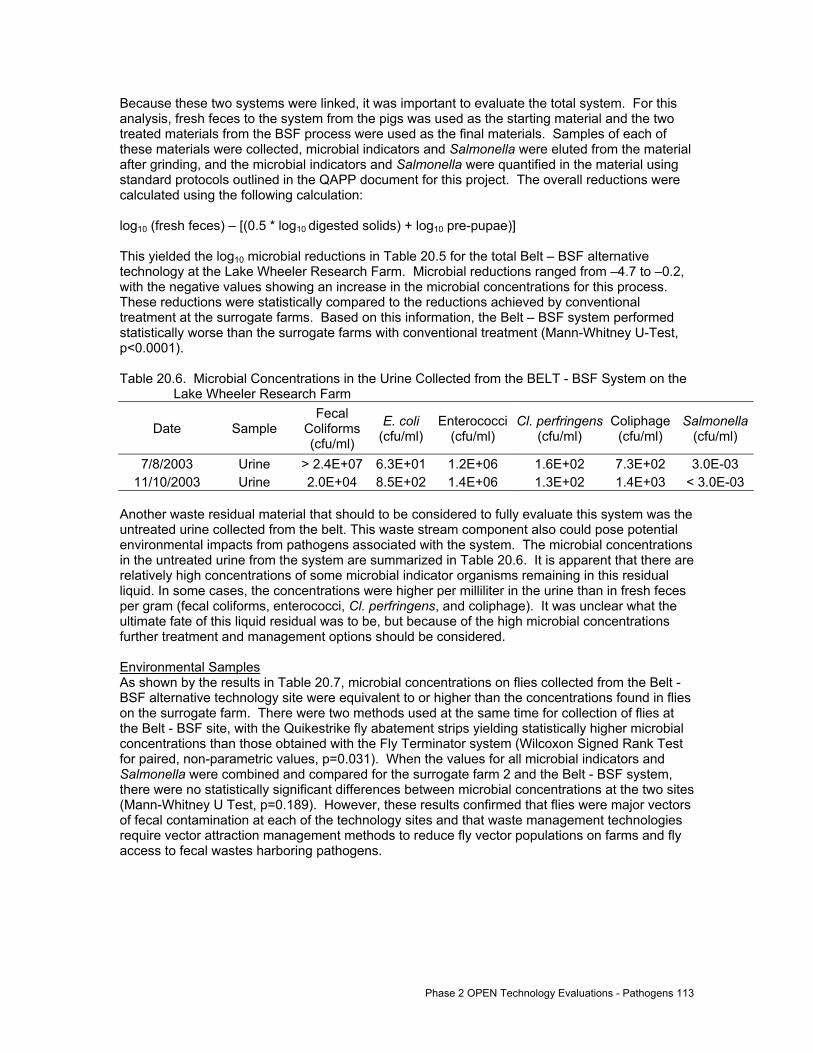
Because these two systems were linked, it was important to evaluate the total system. For this analysis, fresh feces to the system from the pigs was used as the starting material and the two treated materials from the BSF process were used as the final materials. Samples of each of these materials were collected, microbial indicators and Salmonella were eluted from the material after grinding, and the microbial indicators and Salmonella were quantified in the material using standard protocols outlined in the QAPP document for this project. The overall reductions were calculated using the following calculation:
log10 (fresh feces) – [(0.5 * log10 digested solids) + log10 pre-pupae)]
This yielded the log10 microbial reductions in Table 20.5 for the total Belt – BSF alternative technology at the Lake Wheeler Research Farm. Microbial reductions ranged from –4.7 to –0.2, with the negative values showing an increase in the microbial concentrations for this process. These reductions were statistically compared to the reductions achieved by conventional treatment at the surrogate farms. Based on this information, the Belt – BSF system performed statistically worse than the surrogate farms with conventional treatment (Mann-Whitney U-Test, p<0.0001). Table 20.6. Microbial Concentrations in the Urine Collected from the BELT - BSF System on the
Lake Wheeler Research Farm
Date Sample Fecal
Coliforms (cfu/ml)
E. coli (cfu/ml)
Enterococci (cfu/ml)
Cl. perfringens (cfu/ml)
Coliphage (cfu/ml)
Salmonella (cfu/ml)
7/8/2003 Urine > 2.4E+07 6.3E+01 1.2E+06 1.6E+02 7.3E+02 3.0E-03 11/10/2003 Urine 2.0E+04 8.5E+02 1.4E+06 1.3E+02 1.4E+03 < 3.0E-03
Another waste residual material that should to be considered to fully evaluate this system was the untreated urine collected from the belt. This waste stream component also could pose potential environmental impacts from pathogens associated with the system. The microbial concentrations in the untreated urine from the system are summarized in Table 20.6. It is apparent that there are relatively high concentrations of some microbial indicator organisms remaining in this residual liquid. In some cases, the concentrations were higher per milliliter in the urine than in fresh feces per gram (fecal coliforms, enterococci, Cl. perfringens, and coliphage). It was unclear what the ultimate fate of this liquid residual was to be, but because of the high microbial concentrations further treatment and management options should be considered. Environmental Samples As shown by the results in Table 20.7, microbial concentrations on flies collected from the Belt - BSF alternative technology site were equivalent to or higher than the concentrations found in flies on the surrogate farm. There were two methods used at the same time for collection of flies at the Belt - BSF site, with the Quikestrike fly abatement strips yielding statistically higher microbial concentrations than those obtained with the Fly Terminator system (Wilcoxon Signed Rank Test for paired, non-parametric values, p=0.031). When the values for all microbial indicators and Salmonella were combined and compared for the surrogate farm 2 and the Belt - BSF system, there were no statistically significant differences between microbial concentrations at the two sites (Mann-Whitney U Test, p=0.189). However, these results confirmed that flies were major vectors of fecal contamination at each of the technology sites and that waste management technologies require vector attraction management methods to reduce fly vector populations on farms and fly access to fecal wastes harboring pathogens.
Phase 2 OPEN Technology Evaluations - Pathogens 113
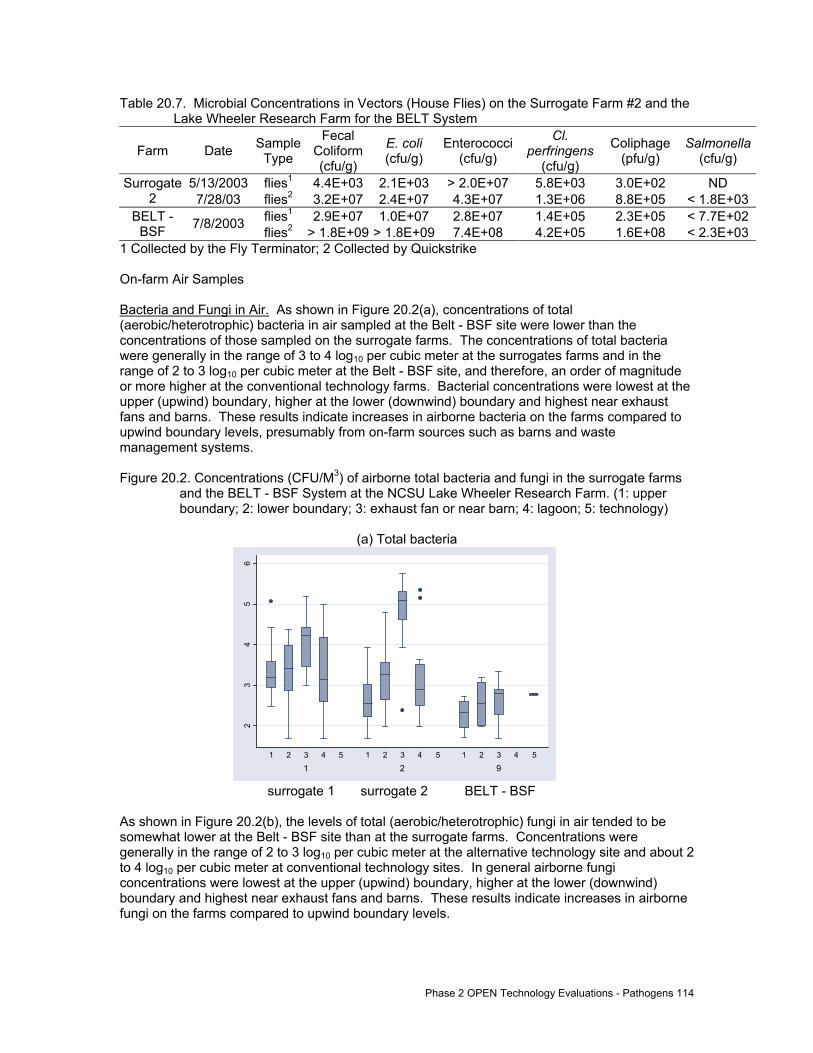
Table 20.7. Microbial Concentrations in Vectors (House Flies) on the Surrogate Farm #2 and the Lake Wheeler Research Farm for the BELT System
Farm Date Sample Type
Fecal Coliform (cfu/g)
E. coli (cfu/g)
Enterococci (cfu/g)
Cl. perfringens
(cfu/g)
Coliphage (pfu/g)
Salmonella (cfu/g)
5/13/2003 flies1 4.4E+03 2.1E+03 > 2.0E+07 5.8E+03 3.0E+02 ND Surrogate 2 7/28/03 flies2 3.2E+07 2.4E+07 4.3E+07 1.3E+06 8.8E+05 < 1.8E+03
flies1 2.9E+07 1.0E+07 2.8E+07 1.4E+05 2.3E+05 < 7.7E+02BELT - BSF 7/8/2003
flies2 > 1.8E+09 > 1.8E+09 7.4E+08 4.2E+05 1.6E+08 < 2.3E+031 Collected by the Fly Terminator; 2 Collected by Quickstrike On-farm Air Samples Bacteria and Fungi in Air. As shown in Figure 20.2(a), concentrations of total (aerobic/heterotrophic) bacteria in air sampled at the Belt - BSF site were lower than the concentrations of those sampled on the surrogate farms. The concentrations of total bacteria were generally in the range of 3 to 4 log10 per cubic meter at the surrogates farms and in the range of 2 to 3 log10 per cubic meter at the Belt - BSF site, and therefore, an order of magnitude or more higher at the conventional technology farms. Bacterial concentrations were lowest at the upper (upwind) boundary, higher at the lower (downwind) boundary and highest near exhaust fans and barns. These results indicate increases in airborne bacteria on the farms compared to upwind boundary levels, presumably from on-farm sources such as barns and waste management systems.
Figure 20.2. Concentrations (CFU/M3) of airborne total bacteria and fungi in the surrogate farms and the BELT - BSF System at the NCSU Lake Wheeler Research Farm. (1: upper boundary; 2: lower boundary; 3: exhaust fan or near barn; 4: lagoon; 5: technology)
(a) Total bacteria
23
45
6
1 2 91 2 3 4 5 1 2 3 4 5 1 2 3 4 5
surrogate 1 surrogate 2 BELT - BSF
As shown in Figure 20.2(b), the levels of total (aerobic/heterotrophic) fungi in air tended to be somewhat lower at the Belt - BSF site than at the surrogate farms. Concentrations were generally in the range of 2 to 3 log10 per cubic meter at the alternative technology site and about 2 to 4 log10 per cubic meter at conventional technology sites. In general airborne fungi concentrations were lowest at the upper (upwind) boundary, higher at the lower (downwind) boundary and highest near exhaust fans and barns. These results indicate increases in airborne fungi on the farms compared to upwind boundary levels.
Phase 2 OPEN Technology Evaluations - Pathogens 114
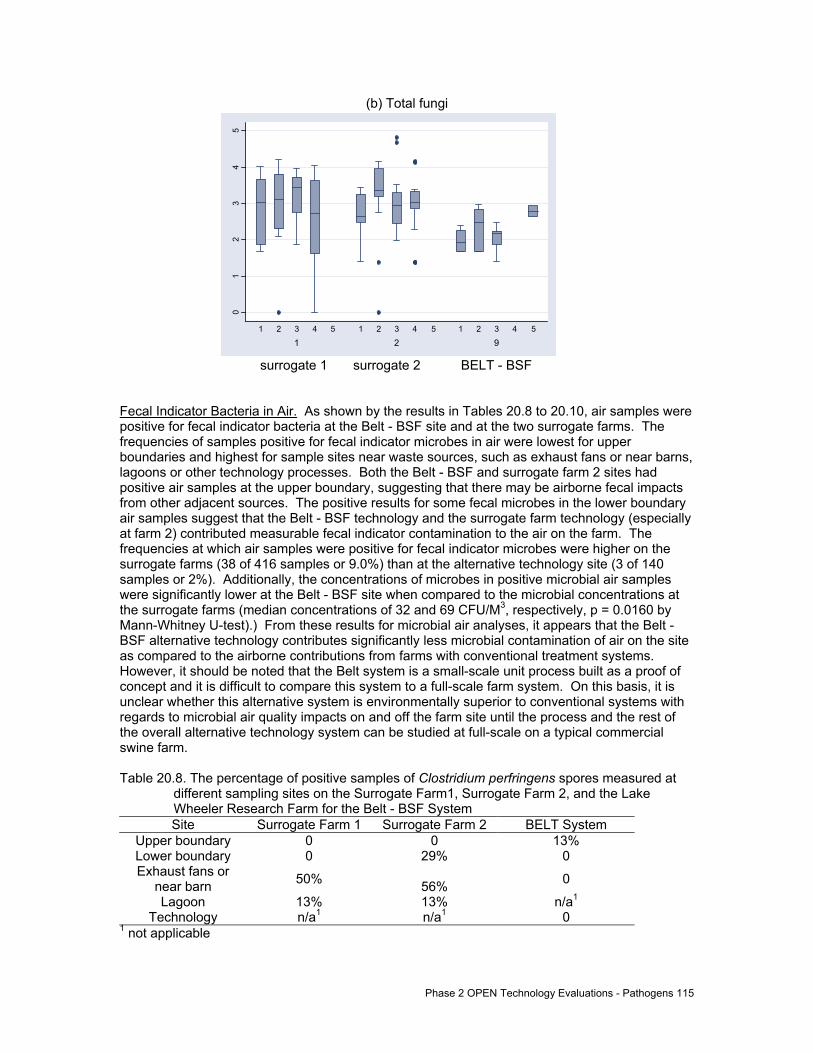
(b) Total fungi
surrogate 1 surrogate 2 BELT - BSF
01
23
45
1 2 91 2 3 4 5 1 2 3 4 5 1 2 3 4 5
Fecal Indicator Bacteria in Air. As shown by the results in Tables 20.8 to 20.10, air samples were positive for fecal indicator bacteria at the Belt - BSF site and at the two surrogate farms. The frequencies of samples positive for fecal indicator microbes in air were lowest for upper boundaries and highest for sample sites near waste sources, such as exhaust fans or near barns, lagoons or other technology processes. Both the Belt - BSF and surrogate farm 2 sites had positive air samples at the upper boundary, suggesting that there may be airborne fecal impacts from other adjacent sources. The positive results for some fecal microbes in the lower boundary air samples suggest that the Belt - BSF technology and the surrogate farm technology (especially at farm 2) contributed measurable fecal indicator contamination to the air on the farm. The frequencies at which air samples were positive for fecal indicator microbes were higher on the surrogate farms (38 of 416 samples or 9.0%) than at the alternative technology site (3 of 140 samples or 2%). Additionally, the concentrations of microbes in positive microbial air samples were significantly lower at the Belt - BSF site when compared to the microbial concentrations at the surrogate farms (median concentrations of 32 and 69 CFU/M3, respectively, p = 0.0160 by Mann-Whitney U-test).) From these results for microbial air analyses, it appears that the Belt - BSF alternative technology contributes significantly less microbial contamination of air on the site as compared to the airborne contributions from farms with conventional treatment systems. However, it should be noted that the Belt system is a small-scale unit process built as a proof of concept and it is difficult to compare this system to a full-scale farm system. On this basis, it is unclear whether this alternative system is environmentally superior to conventional systems with regards to microbial air quality impacts on and off the farm site until the process and the rest of the overall alternative technology system can be studied at full-scale on a typical commercial swine farm. Table 20.8. The percentage of positive samples of Clostridium perfringens spores measured at
different sampling sites on the Surrogate Farm1, Surrogate Farm 2, and the Lake Wheeler Research Farm for the Belt - BSF System Site Surrogate Farm 1 Surrogate Farm 2 BELT System
Upper boundary 0 0 13% Lower boundary 0 29% 0 Exhaust fans or
near barn 50% 56% 0
Lagoon 13% 13% n/a1
Technology n/a1 n/a1 0 1 not applicable
Phase 2 OPEN Technology Evaluations - Pathogens 115
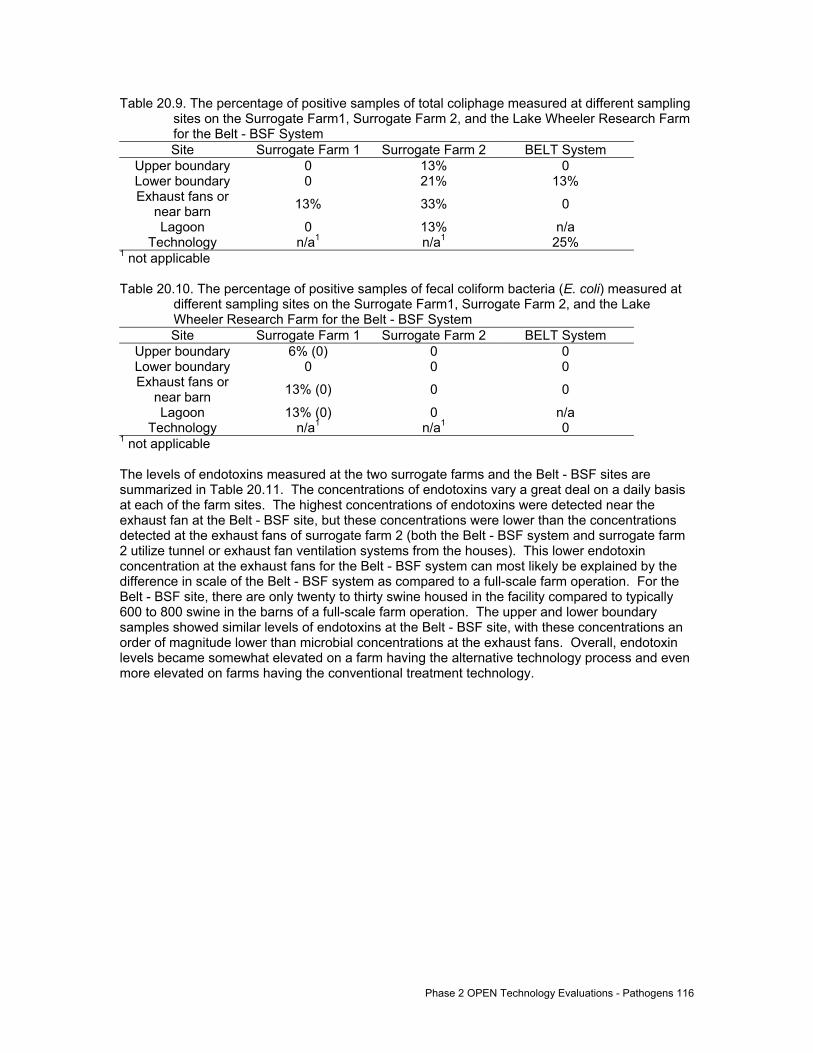
Table 20.9. The percentage of positive samples of total coliphage measured at different sampling sites on the Surrogate Farm1, Surrogate Farm 2, and the Lake Wheeler Research Farm for the Belt - BSF System Site Surrogate Farm 1 Surrogate Farm 2 BELT System
Upper boundary 0 13% 0 Lower boundary 0 21% 13% Exhaust fans or
near barn 13% 33% 0
Lagoon 0 13% n/a Technology n/a1 n/a1 25%
1 not applicable Table 20.10. The percentage of positive samples of fecal coliform bacteria (E. coli) measured at
different sampling sites on the Surrogate Farm1, Surrogate Farm 2, and the Lake Wheeler Research Farm for the Belt - BSF System Site Surrogate Farm 1 Surrogate Farm 2 BELT System
Upper boundary 6% (0) 0 0 Lower boundary 0 0 0 Exhaust fans or
near barn 13% (0) 0 0
Lagoon 13% (0) 0 n/a Technology n/a1 n/a1 0
1 not applicable The levels of endotoxins measured at the two surrogate farms and the Belt - BSF sites are summarized in Table 20.11. The concentrations of endotoxins vary a great deal on a daily basis at each of the farm sites. The highest concentrations of endotoxins were detected near the exhaust fan at the Belt - BSF site, but these concentrations were lower than the concentrations detected at the exhaust fans of surrogate farm 2 (both the Belt - BSF system and surrogate farm 2 utilize tunnel or exhaust fan ventilation systems from the houses). This lower endotoxin concentration at the exhaust fans for the Belt - BSF system can most likely be explained by the difference in scale of the Belt - BSF system as compared to a full-scale farm operation. For the Belt - BSF site, there are only twenty to thirty swine housed in the facility compared to typically 600 to 800 swine in the barns of a full-scale farm operation. The upper and lower boundary samples showed similar levels of endotoxins at the Belt - BSF site, with these concentrations an order of magnitude lower than microbial concentrations at the exhaust fans. Overall, endotoxin levels became somewhat elevated on a farm having the alternative technology process and even more elevated on farms having the conventional treatment technology.
Phase 2 OPEN Technology Evaluations - Pathogens 116
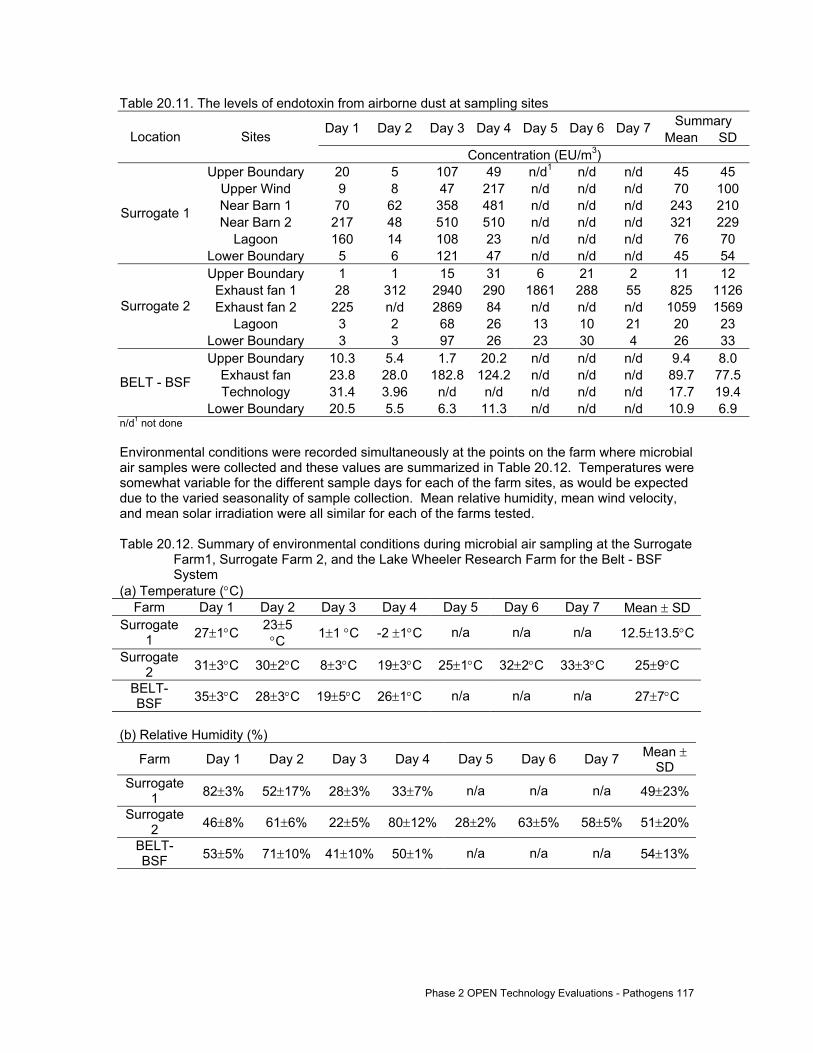
Table 20.11. The levels of endotoxin from airborne dust at sampling sites Summary Day 1 Day 2 Day 3 Day 4 Day 5 Day 6 Day 7
Mean SD Location Sites Concentration (EU/m3)
Upper Boundary 20 5 107 49 n/d1 n/d n/d 45 45 Upper Wind 9 8 47 217
n/d 108 23
Lower Boundary
n/d n/d n/d 70 100 Near Barn 1 70 62 358 481 n/d n/d n/d 243 210 Near Barn 2 217 48 510 510 n/d n/d 321 229
Lagoon 160 14 n/d n/d n/d 76 70
Surrogate 1
5 6 121 47 n/d n/d n/d 45 54 Upper Boundary 1 1 15 31 6 21 2 11 12
Exhaust fan 1 28 312 2940 290 1861 288 55 825 1126Exhaust fan 2 225 n/d 2869 84 n/d n/d n/d 1059 1569
Lagoon 3 2 68 26 13 10 21 20 23 Surrogate 2
Lower Boundary 3 3 97 26 23 30 4 26 33 Upper Boundary 10.3 5.4 1.7 20.2 n/d n/d n/d 9.4 8.0
Exhaust fan 23.8 28.0 182.8 124.2 n/d n/d n/d 89.7 77.5 Technology 31.4 3.96 n/d n/d n/d n/d n/d 17.7 19.4
BELT - BSF
6.3 n/d n/d 10.9 6.9 Lower Boundary 20.5 5.5 11.3 n/d n/d1 not done Environmental conditions were recorded simultaneously at the points on the farm where microbial air samples were collected and these values are summarized in Table 20.12. Temperatures were somewhat variable for the different sample days for each of the farm sites, as would be expected due to the varied seasonality of sample collection. Mean relative humidity, mean wind velocity, and mean solar irradiation were all similar for each of the farms tested. Table 20.12. Summary of environmental conditions during microbial air sampling at the Surrogate
Farm1, Surrogate Farm 2, and the Lake Wheeler Research Farm for the Belt - BSF System
(a) Temperature (°C)
(b) Relative Humidity (%)
Farm Day 1 Day 2 Day 3 Day 4 Day 5 Day 6 Day 7 Mean ± SD Surrogate
1 27±1°C 23±5 °C 1±1 °C -2 ±1°C n/a n/a n/a 12.5±13.5°C
Surrogate 2 31±3°C 30±2°C 8±3°C 19±3°C 25±1°C 33±3°C 25±9°C
BELT-BSF 35±3°C 28±3°C 19±5°C 26±1°C n/a n/a n/a 27±7°C
Farm Day 1 Day 2 Day 3 Day 4 Day 5 Day 6 Day 7 Mean ± SD
Surrogate 1 82±3% 52±17% 28±3% 33±7% n/a n/a n/a 49±23%
Surrogate 2 46±8% 61±6% 22±5% 80±12% 28±2% 63±5% 58±5% 51±20%
BELT-BSF 53±5% 71±10% 41±10% 50±1% n/a n/a n/a 54±13%
32±2°C
Phase 2 OPEN Technology Evaluations - Pathogens 117
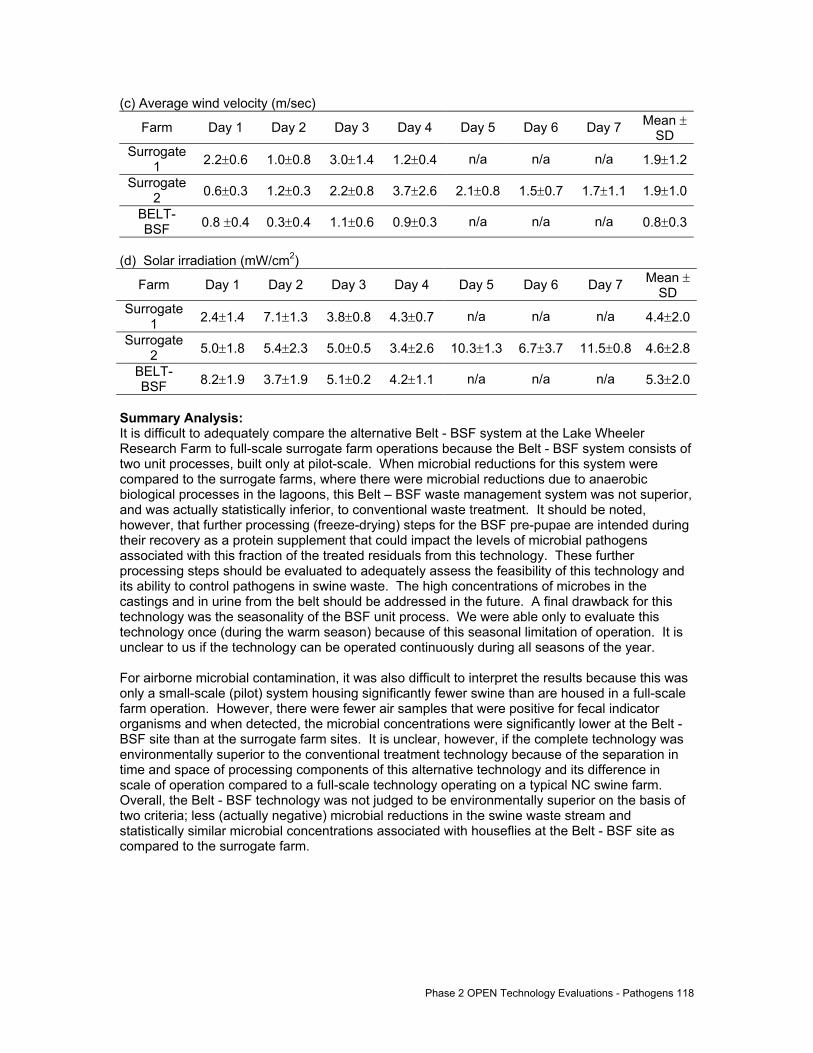
(c) Average wind velocity (m/sec)
Phase 2 OPEN Technology Evaluations - Pathogens 118
Farm Day 1 Day 2 Day 3 Day 4 Day 5 Day 6 Day 7 Mean ± SD
Surrogate 1 2.2±0.6 1.0±0.8 3.0±1.4 1.2±0.4 n/a n/a n/a 1.9±1.2
Surrogate 2 0.6±0.3 1.2±0.3 2.2±0.8 3.7±2.6 2.1±0.8 1.5±0.7 1.7±1.1 1.9±1.0
BELT-BSF 0.8 ±0.4 0.3±0.4 1.1±0.6 0.9±0.3 n/a n/a n/a 0.8±0.3
(d) Solar irradiation (mW/cm2)
Farm Day 1 Day 2 Day 3 Day 4 Day 5 Day 6 Day 7 Mean ± SD
Surrogate 1 2.4±1.4 7.1±1.3 3.8±0.8 4.3±0.7 n/a n/a n/a 4.4±2.0
Surrogate 2 5.0±1.8 5.4±2.3 5.0±0.5 3.4±2.6 10.3±1.3 6.7±3.7 11.5±0.8 4.6±2.8
BELT-BSF 8.2±1.9 3.7±1.9 5.1±0.2 4.2±1.1 n/a n/a n/a 5.3±2.0
Summary Analysis: It is difficult to adequately compare the alternative Belt - BSF system at the Lake Wheeler Research Farm to full-scale surrogate farm operations because the Belt - BSF system consists of two unit processes, built only at pilot-scale. When microbial reductions for this system were compared to the surrogate farms, where there were microbial reductions due to anaerobic biological processes in the lagoons, this Belt – BSF waste management system was not superior, and was actually statistically inferior, to conventional waste treatment. It should be noted, however, that further processing (freeze-drying) steps for the BSF pre-pupae are intended during their recovery as a protein supplement that could impact the levels of microbial pathogens associated with this fraction of the treated residuals from this technology. These further processing steps should be evaluated to adequately assess the feasibility of this technology and its ability to control pathogens in swine waste. The high concentrations of microbes in the castings and in urine from the belt should be addressed in the future. A final drawback for this technology was the seasonality of the BSF unit process. We were able only to evaluate this technology once (during the warm season) because of this seasonal limitation of operation. It is unclear to us if the technology can be operated continuously during all seasons of the year. For airborne microbial contamination, it was also difficult to interpret the results because this was only a small-scale (pilot) system housing significantly fewer swine than are housed in a full-scale farm operation. However, there were fewer air samples that were positive for fecal indicator organisms and when detected, the microbial concentrations were significantly lower at the Belt - BSF site than at the surrogate farm sites. It is unclear, however, if the complete technology was environmentally superior to the conventional treatment technology because of the separation in time and space of processing components of this alternative technology and its difference in scale of operation compared to a full-scale technology operating on a typical NC swine farm. Overall, the Belt - BSF technology was not judged to be environmentally superior on the basis of two criteria; less (actually negative) microbial reductions in the swine waste stream and statistically similar microbial concentrations associated with houseflies at the Belt - BSF site as compared to the surrogate farm.