phase one – understanding the...
TRANSCRIPT

Strategy Unit Drugs Report
Phase one – Understanding the issues
12 May 2003
This report presents the Strategy Unit’s analysis of the harms caused by crack and heroin This is not a statement of government policy

1
SU Drugs Project
Phase 1 Report: Understanding the Issues
Project aim:To identify the mix of policies which will substantially reduce the harms caused by drugs to users and others

Summary of the report’s main findings
2
• All drugs have an adverse impact; but heroin and crack are by far the most addictive, expensive and harmful drugs
• Heroin and/or crack users cause harm to the health and social functioning of users and society as a whole, but users also commit substantial amounts of crime to fund their drug use (costing £16bn a year). Including health and social functioning harms, the harms arising from drug use amount to £24bn a year
• There are an estimated 280,000 heroin and/or crack users: at any one time, only 20% of high harm causing users are receiving treatment, whilst 80% are not
• Over the course of a year, two thirds of high harm causing users engage with either treatment or criminal justice, but:
– those engaging with treatment tend not to stay with it for long– many of those engaging with criminal justice are not formally identified as users or do not
have their use dealt with– a third of high harm causing users do not engage with either treatment or the criminal
justice system• The drugs supply business is large, highly flexible and very adaptable; over time the industry
has seen consumption grow and prices reduce• Interventions at every stage of the production, trafficking, wholesaling and dealing process
have resulted overall in modest seizure rates of up to ~20% of total production • Even if supply-side interventions were more effective, it is not clear that the impact on the
harms caused by serious drug users would be reduced

3
INTRODUCTION 3
1: CONSUMPTION 8
2: SUPPLY 55
3: HARMS AND THE SUPPLY CHAIN 95
CONCLUSIONS AND NEXT STEPS 103

There are seven commonly used controlled drugs
4
HEROIN and other opiates
CRACK COCAINE COCAINE AMPHETAMINES
ECSTASY CANNABIS LSD
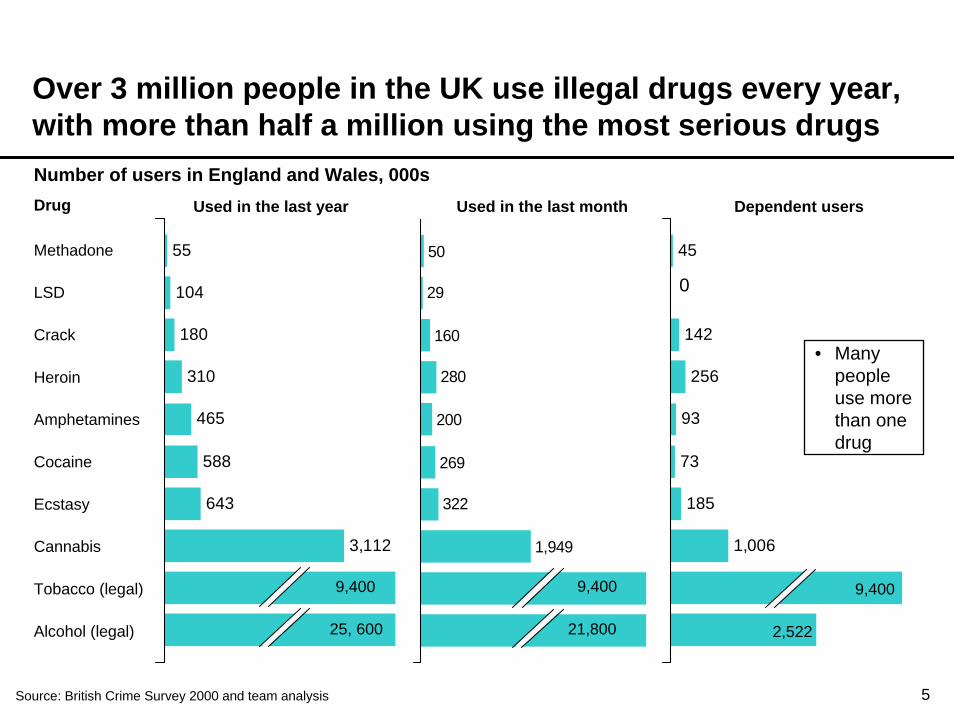
Over 3 million people in the UK use illegal drugs every year, with more than half a million using the most serious drugs
5
Number of users in England and Wales, 000s
50
29
160
280
200
269
322
1,949
Amphetamines
Drug Used in the last year
Methadone
LSD
Crack
Heroin
55
104
180
310
465
588
643
3,112
45
142
256
93
73
185
1,006
Cocaine
Ecstasy
Cannabis
Tobacco (legal)
Alcohol (legal)
9,400 9,400
2,522
9,400
21,80025, 600
Used in the last month Dependent users
0
• Many people use more than one drug
Source: British Crime Survey 2000 and team analysis
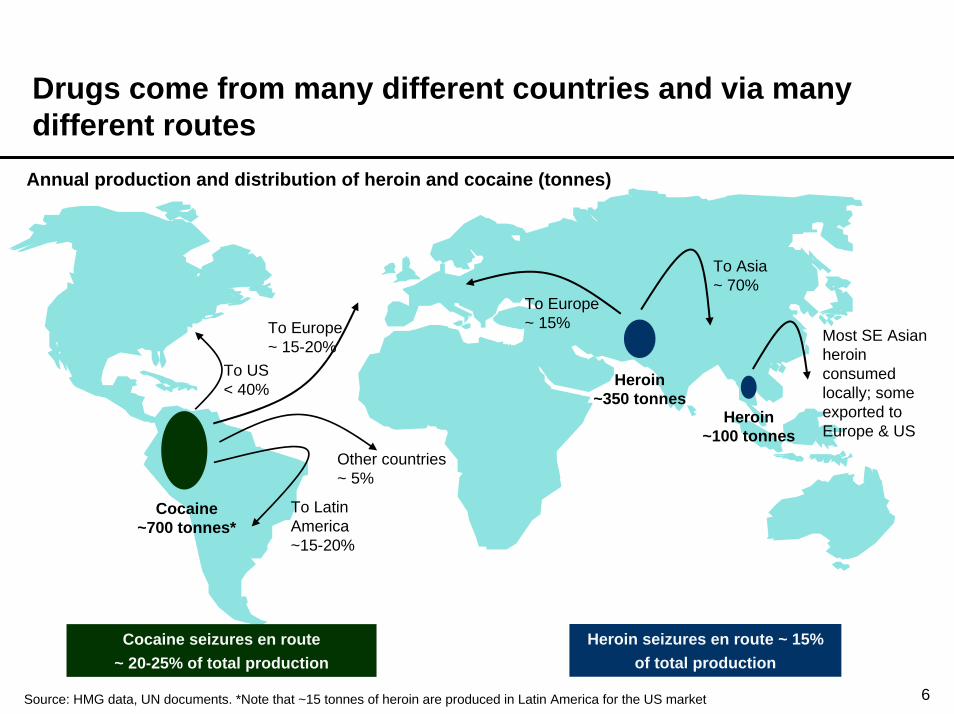
Drugs come from many different countries and via many different routes
6
To US < 40%
To Latin America ~15-20%
To Europe ~ 15-20%
Other countries ~ 5%
Cocaine seizures en route ~ 20-25% of total production
Heroin seizures en route ~ 15%of total production
To Europe ~ 15%
To Asia ~ 70%
Most SE Asian heroin consumed locally; some exported to Europe & US
Annual production and distribution of heroin and cocaine (tonnes)
Heroin ~350 tonnes
Heroin ~100 tonnes
Cocaine ~700 tonnes*
Source: HMG data, UN documents. *Note that ~15 tonnes of heroin are produced in Latin America for the US market

Far more drugs are used now than in the past, though they have been used for centuries
7
Indicative numbers of dependent users of heroin and cocaine/crack in the UK from 1800
1800 1900 2000
Users250k
Heroin and cocaine isolated during C19
Heroin sold alongside aspirin, cocaine used in
‘health’ cordials
1890s: association of use of drugs with immigrant
cultures viewed as threatening; inspires greater prohibition of drugs, led by the US
1950s: system of prescribing heroin to a small number of
addicts in UK begins to break down as a few doctors allow
heroin to ‘leak’
1960s: increased availability of smokeableheroin makes initiation
more attractive
Late 1970s: some youth culture
becomes nihilistic
1970s-80s: socioeconomic change, especially youth unemployment, promotes
dislocationDrugs have been used throughout
history
Late 1960s: restrictions on
prescribing coincide with increase in black-
market availability: drug industry begins
to enlarge
1950s-60s: increased youth incomes
promote development of youth culture and
leisure time
Source: Heroin Addiction and Drug Policy, J. Strang and M.Gossop, 1994; ‘A Brief History of British Drugs Policy 1950-2001’, R. Yates, 2002; ‘Social and Historical context of drug policy in UK’, G. Stimson, 1991; ‘Cocaine: global histories’ P. Gootenburg, 1990; The Pursuit of Oblivion R. Davenport-Hines 2001, and others. Pre: 1890s, numbers reflect opium rather than heroin use.

8
INTRODUCTION 3
1: CONSUMPTION 8
THE USERS 37THE DRUGS 8
THE HARMS 13 CONCLUSIONS 53
2: SUPPLY 55
3: HARMS AND THE SUPPLY CHAIN 95
CONCLUSIONS AND NEXT STEPS 103

The individual characteristics of both the drug and of the user contribute to addiction
9
Interaction between the characteristics of the drug and the characteristics of the user
THE DRUG THE USER
Brain’s reward system stimulated by drug, leading to
cravings for further use
Individual users may be genetically predisposed to
addiction
Likelihood of addiction
enhanced if drug has quick,
intensive, short lived effects on
user
Promotes feelings of pleasure
Causes withdrawal symptoms once effects
wear off

Different drugs affect the user in different ways
10
Drug Group Examples Effect of drug
OPIATES• Opiates promote feelings of euphoria and relax the central
nervous system• Users experience severe withdrawal symptoms if regular use
ceases• Heroin takes effect more quickly than methadone and lasts
for shorter period
Heroin, methadone
STIMULANTS• Stimulants promote feelings of confidence and energy• Users will not experience physical withdrawal but may
become anxious and paranoid after use• Crack cocaine and methamphetamines (which are smoked)
take effect within seconds and effects wear off within minutes– the extremes experienced with these drugs can lead to
psychotic behaviour
SEDATIVES• Cannabis promotes feelings of calm and pleasure• Heavy use may lead to feelings of paranoia and anxiety
Cocaine, crack amphetamines,
ecstasy
Cannabis
HALLUCINOGENS• LSD is a hallucinogenic drug - users see unusual visions and
coloursLSD
Source: Team analysis based on variety of sources
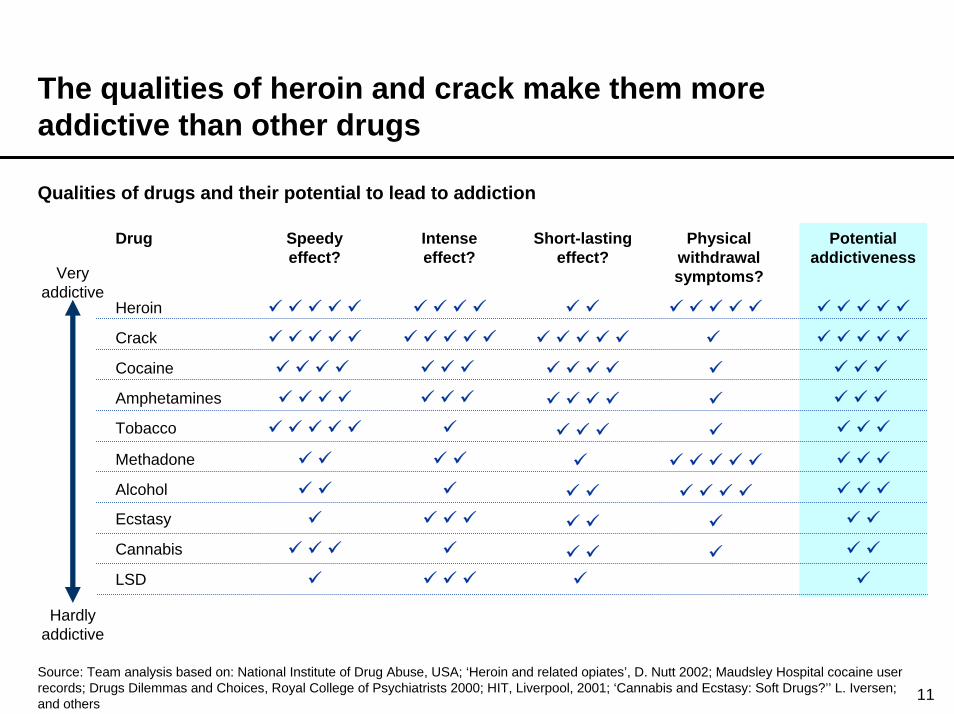
The qualities of heroin and crack make them more addictive than other drugs
11
Qualities of drugs and their potential to lead to addiction
Speedy effect?
Intense effect?
Short-lasting effect?
Cannabis
Cocaine
Methadone
Amphetamines
Crack
Heroin
Tobacco
LSD
Ecstasy
Alcohol
Source: Team analysis based on: National Institute of Drug Abuse, USA; ‘Heroin and related opiates’, D. Nutt 2002; Maudsley Hospital cocaine user records; Drugs Dilemmas and Choices, Royal College of Psychiatrists 2000; HIT, Liverpool, 2001; ‘Cannabis and Ecstasy: Soft Drugs?’’ L. Iversen; and others
Physical withdrawal symptoms?
Potential addictiveness
Very addictive
Hardlyaddictive
Drug

Heavy use of crack, cocaine and heroin is very expensive to support
12
Cost of drug use for a heavy user
Unit of measure Estimated units used per week
Drug Cost per unit (£)
Total cost (£/week)
3
1
6
6
9
60
60
21
4
* Price for prescribed methadone - street price may vary greatly from thisSource: NCIS “A guide to drug prices and drug valuation in the UK” May to August 2002; Maudsley Hospital cocaine user records; ‘Drug Users and Drug Dealers’, Brownsberger, ed., 2001
Heroin
Methadone*
Crack Cocaine
Amphetamines
Cocaine
Cannabis
Tobacco
Alcohol
LSD
Ecstasy
1g
100ml
0.2g ‘Rock’
1g
1g
2g
Cigarette
10ml
Paper Square
Tablet
5
50
10
18
15
10
5
7
25
280
15
65
65
67
89
90
300
420
525
560
• The more addictive and expensive a drug, the more disruptive it will be to a user

13
INTRODUCTION 4
1: CONSUMPTION 8
THE USERS 37THE DRUGS 8
THE HARMS 13 CONCLUSIONS 53
2: SUPPLY 55
3: HARMS AND THE SUPPLY CHAIN 95
CONCLUSIONS AND NEXT STEPS 103

Significant harms attach to drug use
14
HEALTH
SOCIAL FUNCTIONING
CRIME
• Drugs can cause direct health harms, including death and mental illness
• The individual method of use can cause specific health harms, e.g., infected needles spread disease
Both the effect of drugs and the lifestyle associated with drug use have an impact on a user’s ability
– to work– to care for dependents– to form relationships
• Most users commit crime to fund their habit• Some drugs can induce violent behaviour
•

Heroin and methadone cause the most acute deaths per year
15
Acute deaths per annum as a result of illegal drug use
25
20
12
11
97
652
0
Heroin
• Acute deaths caused by overdose or poisoning are recorded here, not chronic deaths caused by long-term health damage arising from drug use
• Heroin and methadone deaths are caused by overdose
• Ecstasy deaths are contributed to by drinking too little or too much water while using the drug
• 1:100 regular heroin users die each year, but only 1:100,000 cocaine users
• In comparison, alcohol causes 6,000 acute and chronic deaths per year, and tobacco smoking around 100,000
0
Methadone *
Ecstasy
Crack
Amphetamines
Cocaine
Cannabis
LSD
Sources: ONS Health Statistics Quarterly 17, ‘Deaths relating to drug poisoning’* Methadone deaths will be chiefly those who have not had the drug prescribed

Injecting drugs, common practice with heroin use, leads to high levels of infection with serious diseases
16
• Injecting users share needles and infected needles spread diseases• Drug users then pass diseases on to non-users through other means, for example sex, causing
wider public health harms
Number of past and current injectors infected as a result of intravenous drug use
0
500
1000
1500
2000
2500
3000
HIV AIDS
• HIV infection will lead eventually to individuals developing AIDS and to premature death
• Treatment to delay the onset of AIDS is expensive
0
20,000
40,000
60,000
80,000
100,000
Hepatitis B Hepatitis C
• Hepatitis B and Hepatitis C are both chronic liver diseases• Around 20% of those infected with Hepatitis C will die of
the disease
Source: ‘Economic and social costs of Class A drug use’, Home Office 2002

Drugs cause, or are associated with, psychological damage to the user
17
Psychological damage caused by use of illegal drugs
Methadone
Ecstasy
Heroin
Crack
Amphetamines
Cocaine
Cannabis
LSD
Mental health difficulties (hospital admissions pa)*Number of dependent users
256,000
185,000
142,000
93,000
45,000
1,006,000
70,000
0
0
0
137
674
3,480
74
518
146
• Dependence on drugs should itself be considered a psychological condition
* These figures show hospital admissions where the drug was recorded as the major reason for admissionSources: Department of Health HES Statistics, British Crime Survey 2001/2, Psychiatric Morbidity Survey
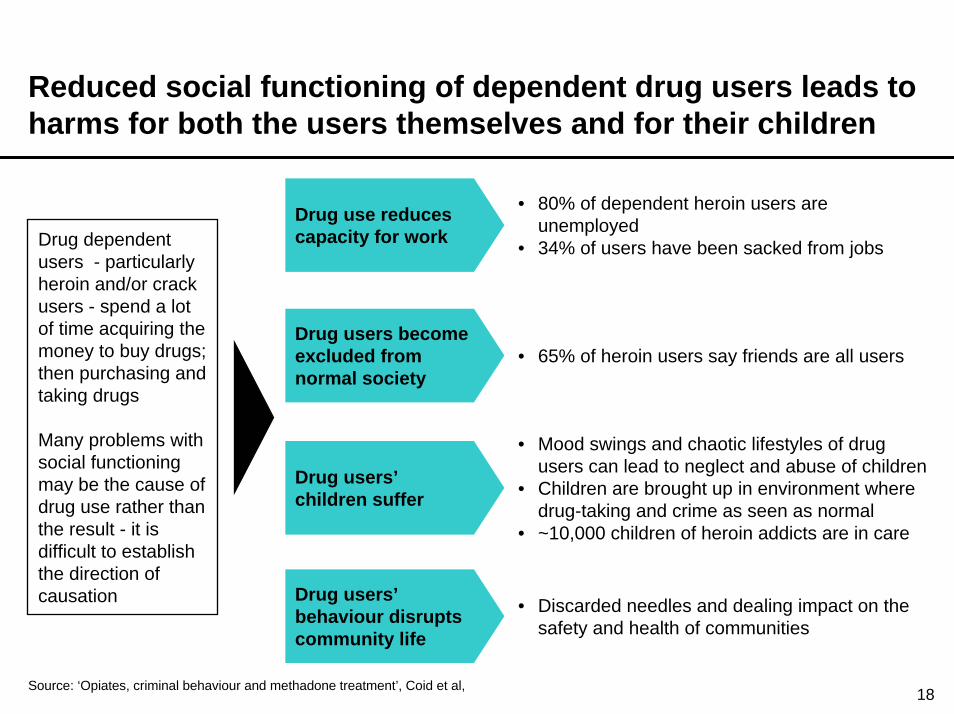
Reduced social functioning of dependent drug users leads to harms for both the users themselves and for their children
18
Drug use reduces capacity for work
• 80% of dependent heroin users are unemployed
• 34% of users have been sacked from jobsDrug dependent users - particularly heroin and/or crack users - spend a lot of time acquiring the money to buy drugs; then purchasing and taking drugs
Many problems with social functioning may be the cause of drug use rather than the result - it is difficult to establish the direction of causation
Drug users become excluded from normal society
• 65% of heroin users say friends are all users
• Mood swings and chaotic lifestyles of drug users can lead to neglect and abuse of children
• Children are brought up in environment where drug-taking and crime as seen as normal
• ~10,000 children of heroin addicts are in care
Drug users’ children suffer
Drug users’ behaviour disrupts community life
• Discarded needles and dealing impact on the safety and health of communities
Source: ‘Opiates, criminal behaviour and methadone treatment’, Coid et al,

Heroin and crack cause the greatest harms to the health and social functioning of users and others
19
Damage to health and social functioning caused by illegal drugs
Drug Harms from injection
Long-term physical damage
Long-term mental damage
Acute health damage
Ecstasy
Cocaine
Amphetamines
Methadone
Crack
Heroin
LSD
Cannabis
TOTALhealth & social
harms
Damage to social functioning
Heroin and crack cause the most damage to health and social functioning* Social functioning is weighted as equal to the other four categories amalgamated

The cost of harms to health and social functioning from heroin and/or crack use are estimated at £5bn per year
20
Cost of damage to health and social functioning of heroin and/or crack users arising from use
Lost quality of life and output• Damage to quality of life
includes e.g. loss of ability to look after self and damage to mental health
• Lost output of users
Health service• Cost of providing treatment• Cost of treating conditions
arising as a result of use
Death• Lost output of victim• Human cost element, e.g.
emotional effect on relatives
Category of harmDeath
£1bn
Health service
£1bnLost quality of life and output
£3bn
Source: Team analysis

Crime harms arise from the users’ need to pay for drugs; the behaviour drug use causes; and the activities of suppliers
21
Drug alters user’s behaviour: the highs and lows experienced by those on stimulants - especially crack - can promote psychotic episodes
User needs to buy drug frequently but is unlikely to have enough money from legitimate sources • Drug-using offenders
have a similar social profile to non-drug using offenders and are therefore likely to commit some crime regardless of drug use - the offences described are those which are specifically drug-motivated
Reasons for crime Type of crime committed
• User commits acquisitive crimes such as theft to find money
• User will commit violent crimes and/or acquisitive crimes will be accompanied by greater violence
• Drugs have been associated with a rise in gun crime, but so far numbers of gun
The drugs business itself can lead to violence: as illegality means that contracts are only enforceable through violence
crimes are still very low in England

Drug users are estimated to commit 36m drug-motivated crimes each year, 56% of the total number of crimes
22
* Offences of possession or supply of drugs were not included because the victims (i.e. the user and society at large) and costs of offences of possession or supply were already taken account of in the other harms we have analysed. Drug user defined as self-reported use of drugs from slide 4 in last 30 days** Data from NEW ADAM was to make an estimate of the proportion of drug users’ crimes which are specifically motivated by drug useSource: Team analysis, NEW ADAM survey of arrestees 1999-2002, ‘Economic and social costs of crime’, Home Office 2000
Crimes committed by drug users, whether drug-motivated or not
drug-motivated53m offences
All crime, committed by drug users and non users*
64m offences
Offender not using drugs:11m offences
Offender using drugs:53m offences
Offences not motivated by drug use:17m offences
Offences motivated by drug use:36m offences**

Drug-motivated offences are estimated to be responsible for around a third of the total cost of crime
23
Cost of drug-motivated crimes*
Cost of all crime Cost of drug-motivated crime
£58bn
£19bn**
• Drug motivated crime accounts for 33% of the cost of all crime, while accounting for 56% of the volume
• The substantial contribution of drug-motivated crime to all crime was recognised in the Home Office’s updated Drugs Strategy
• In comparison, the cost of crime linked to alcohol is estimated to be ~£12bn per year
* Includes: security expenditure, property stolen, emotional impact on victim, lost output and expenditure on criminal justice system** This is an estimate within a range of £14-20bnSource: Team analysis, based on NEW ADAM survey of arrestees 1999-2002, ‘Economic and social costs of crime’

Drug-motivated crime is skewed towards property crime rather than high victim trauma crimes
24
High victim traumaViolenceSexualRobbery
Medium victim traumaDomestic burglaryNon-domestic burglaryTheft from/of vehicleCommon assault
Low victim traumaCriminal damageShoplifting
No victim traumaFraudTrafficOther
Medium trauma
Low trauma
High trauma
No trauma
High trauma
Low trauma
Medium trauma
No trauma
Cost of all crime Cost of drug-motivated crime£58bn £19bn
£17bn£22bn
£6bn
£7bn
£12bn£3bn
£6bn
£4bn
Source: Team analysis, NEW ADAM survey of arrestees 1999-2002, ‘Economic and social costs of crime’

Drug use is responsible for the great majority of some types of crime, such as shoplifting and burglary
25
Percentage of different crimes motivated by drug use
85%80%
71%
55% 54%
45%
27%
0%
10%
20%
30%
40%
50%
60%
70%
80%
90%
100%
Shoplifting DomesticBurglary
Non-DomesticBurglary
Theft frommotor vehicle
Robbery Fraud Theft of motorvehicle
Source: Team analysis, NEW ADAM survey of arrestees 1999-2002, ‘Economic and social costs of crime’

However, drug use is still linked to some violent crime, including ~130 homicides in a year
26
• While a lower proportion of drug-motivated crimes is high trauma than other categories of crime, a significant number of violent crimes are nonetheless associated with drugs
Stranger & acquaintance violence
Muggings Homicide
Not drug-motivated1,469,000
Drug-motivated345,000
Not drug-motivated208,000
Drug-motivated 238,000
Not drug-motivated 750
Drug-motivated 130
Sources: BCS 2001/2; NEW ADAM survey of arrestees 1999-2002; ‘Crack and homicide in NYC 1988’, P. Goldstein et al, 1989

Drug-motivated crime has risen over the last 7 years, while other crime has remained stable or fallen
27
Changes in drug-motivated and non-drug-motivated crime since 1995*
* NB: analysis based on conviction data which may mirror the efficiency of the CJS rather than actual crimes committed** Includes acquisitive and violent crimesSource: ‘A volume index for drug-related crime: measurement using individual conviction histories’, S. Pudney & C. Goulden, Home Office, not yet published.; the peak in 1999 has not been fully explained but is thought to be due to reporting anomalies.
• Home Office work shows that drug-motivated crime has risen, while other crime has remained relatively stable
0
100
200
300
400
500
600
1995
Q119
95Q3
1996
Q119
96Q3
1997
Q119
97Q3
1998
Q119
98Q3
1999
Q119
99Q3
2000
Q120
00Q3
2001
Q120
01Q3
2002
Q1
Drug-motivated crime**
Non-drug-motivated crime**
Index (1995Q1 = 100)

Driving under the influence of drugs causes 200 deaths per year - most from opiates, stimulants or a combination
28
• The pharmacological effect of illegal drugs can impair judgement, so driving while under the influence of illegal drugs can be dangerous
• Different drugs have different effects - extensive tests on cannabis, for example, suggest it is unlikely to cause deaths from driving, though this is not definitive
100
60
35
0
Multiple drugs Opiates Stimulants* Cannabis
Deaths caused by driving under the influence of illegal drugs each year in England
* including cocaine and amphetaminesSource: Team analysis based on ‘The incidence of drugs and alcohol in road accident fatalities’ TRL 49, Inquiry into the Effects of Drugs on Road Safety in Victoria, DfT road accident statistics

29
The 280,000 users of heroin and/or crack are responsible for the vast majority of the cost of drug-motivated crime
Crime motivated by offenders' use of heroin and/or crack£16bn
Crime motivated by offenders' use of drugs other than heroin and/or crack*£3bn
Cost of drug-motivated crime by drugs used
* Includes: amphetamines, cannabis, cocaine, ecstasy, LSD and methadoneSource: NEW ADAM, ‘Economic and social costs of crime’
• 280,000 users of heroin and/or crack are responsible for 87% of the cost of drug-motivated crime
• Many heroin and crack users also take other drugs, but it is the use of heroin and crack that drives their criminal behaviour
• Very few people who only use cocaine commit crime as a result of their drug use
£19bn total

The 120,000 users who take both heroin and crack commit nearly three-quarters of the crime associated with these drugs
30
Cost of heroin and crack users’ crime, by drug(s) used
Both crack & heroin£11bn
Crack not heroin£1bn
Heroin not crack£4bn
Source: Team analysis, NEW ADAM survey of arrestees 1999-2002, ‘Economic and social costs of crime’
£16bn total

The 30,000 highest offending heroin and/or crack users commit more than half of all drug-motivated crime
31
• 30,000 people (10% of heroin and/or crack users) commit:
– 21m offences per year (an average of 680 offences each per year)
– around a third of the volume of all crime
• We have not yet identified any characteristics of this group of 30,000 which are significantly different from those of other heroin and/or crack users
• We will do further work to understand this group
Top 10% of offenders (30,000 users) using heroin and/or crack£11bn
Other drug motivated offenders£8bn
Source: Team analysis, NEW ADAM survey of arrestees 1999-2002, ‘Economic and social costs of crime’
Cost of drug-motivated crime, split by top 10% of most offending heroin and/or crack users and by the remainder of drug users
£19bn total

The highest offending heroin and/or crack users could be responsible for crime costing over £360,000 per user per year
32
Estimated cost of crime per user per year
Heroin and/orcrack
Heroin and crack Crack not heroin Heroin not crack Top 10% heroinand/or crack users
£58,000
£91,500
£45,500
£29,500
£366,500
Source: Team analysis, NEW ADAM survey of arrestees 1999-2002, ‘Economic and social costs of crime’NB as before, these exclude crimes of possession or supply of drugs

Users of heroin and/or crack cause high levels of every kind of harm
33
SOCIAL FUNCTIONING harms
CRIME harms
TOTALharmsHEALTH harms
Heroin and crack users
High - users at high risk of overdose and infection from injecting
High - daily heroin use and crack binges seriously affect ability to work and care for others
High - heroin and crack associated with very high cost of offending
Medium - long term threat of heart disease
High - crack binges seriously affect ability to work and care for others
High - crack users responsible for high cost of crime
Crack not heroin users
Heroin not crack users
High - users at high risk of overdose and infection from injecting
High - daily use of heroin seriously affects ability to work and care for others
Medium - users commit slightly lower cost of crime than those also taking crack
Source: Team analysis

In comparison, users of other drugs do not cause significant harms
34
SOCIAL FUNCTIONING harms
CRIME harms
TOTALharmsHEALTH harms
Cocaine, amphetamines,
Medium - unlikely to cause death, though can lead to cardiac problems and some mental illness
Medium - very heavy use may affect ability to work and care for others
Low - use unlikely to motivate crime
Low - unlikely to cause significant health damage
Medium - very heavy use may affect ability to work and care for others
Low - use unlikely to motivate crime
Cannabis, ecstasy, LSD
Source: Team analysis, from previous sources

Users of heroin and/or crack are by far the drug users who cause the most harm, both to themselves and to society
35
Harm to othersHIGH
LOW
Harm to self
HIGHLOW
Crack users
Heroin users
Cannabis users
Ecstasy users
LSD users
Methadone users
Harm to selfAmphetamine
users
Cocaine users
Scale of crime, health and social harms caused by the users of different drugs to themselves and to society
• Our subsequent analysis will focus on heroin and/or crack users as they are the ‘high harm causing users’
• This analysis supports the emphasis of the government Drugs Strategy
Harm to others
Source: Team analysis

The total cost of all harms caused by heroin and/or crack users is £21bn, with crime harms by far the most costly
36
Harms caused by heroin and/or crack users per year
Crime harms
£16bn
Health and social functioning harms
£5bn
100% = £21bn
Source: Team analysis

37
INTRODUCTION 3
1: CONSUMPTION 8
THE USERS 37THE DRUGS 8
THE HARMS 13 CONCLUSIONS 53
2: SUPPLY 55
3: HARMS AND THE SUPPLY CHAIN 95
CONCLUSIONS AND NEXT STEPS 103

The use of high harm causing drugs has risen dramatically over the last 30 years
38
0
10,000
20,000
30,000
40,000
50,000
60,000
70,000
80,000
90,000
100,000
1970
1972
1974
1976
1978
1980
1982
1984
1986
1988
1990
1992
1994
1996
1998
2000
Addicts notified to HONumber in treatment
• Crack use began in the late 1980s but has only begun to rise substantially in the last few years
• Numbers in treatment are used as a proxy for use -other indicators show a similar pattern
Dependent opiate and cocaine users known to treatment services, by year
Sources: Home Office Addicts Index, Regional Drugs Misuse Treatment Databases. NB it is not possible to separate opiates from cocaine.

There are an estimated 280,000 high harm causing drug users in England
39
OPIATE AND CRACK USERS
Heroin not
crack**136,000
120,000
22,000
Crack and heroin**
Crack not heroin
In addition, there are 15,000 ex-high harm causing users in prison who are likely to relapse on release
N. B. This estimate has a range of 200,000-400,000** Includes other opiates such as methadone being used in treating users Source: Team analysis, DH treatment statistics, NEW ADAM, Arrest Referral statistics

The 280,000 high harm causing drug users are more likely to be found in deprived urban centres
40
Highest ten areas (problem drug users per 1000 population 15-44 yrs)
Liverpool 31E London 31Manchester 28Lambeth 25Birmingham 25
Tees 25St Helen’s 24Wolverhampton 23Camden & Islington 22Sandwell 22
Lowest ten areas (problem drug users per 1000 population 15-44yrs)
East Surrey 4West Surrey 4N and Mid Hants 5Oxfordshire 6W Sussex 6
Buckinghamshire 6Hertfordshire 7Berkshire 7Kingston & Richm’d 7Wiltshire 7
Source: Team analysis based on University of York formula for allocating resources for dealing with drug misuse.
Health authority areas in England with the highest and lowest proportions ofhigh harm causing users
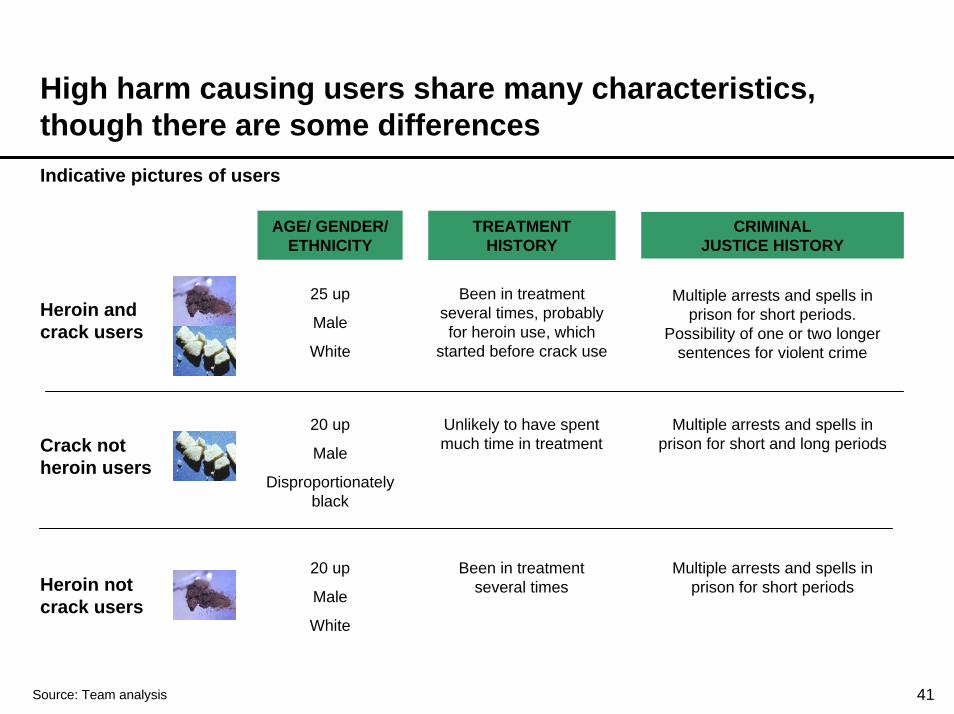
High harm causing users share many characteristics, though there are some differences
41
Indicative pictures of users
AGE/ GENDER/ ETHNICITY
TREATMENT HISTORY
CRIMINAL JUSTICE HISTORY
25 up
Male
White
Been in treatment several times, probably for heroin use, which
started before crack use
Multiple arrests and spells in prison for short periods.
Possibility of one or two longer sentences for violent crime
Heroin and crack users
Source: Team analysis
Crack not heroin users
Unlikely to have spent much time in treatment
Multiple arrests and spells in prison for short and long periods
20 up
Male
Disproportionatelyblack
20 up
Male
White
Been in treatment several times
Multiple arrests and spells in prison for short periodsHeroin not
crack users

High harm causing drug users share risk factors with young offenders and tend to drink and smoke before taking drugs
42
Indicative pattern of drug use
19 years
Try heroin for first time
12 years
Drink alcohol for first time
13
Smoke cigarette for first time
15
Drink and smoke heavily, use cannabis
occasionally
17
Try cocaine, amphetamines or
ecstasy
14
Try cannabis for first time
16
Use cannabis frequently
18
Begin to use stimulants frequently
• Family background - and specifically family conflict - is a key risk factor for heavy drug use• Socioeconomic background can contribute to family risk factors such as conflict and also makes it more likely young
people will come into contact with drugs• These risk factors lead initially to young offending, which almost always precedes early experimentation with less
harmful drugs such as cannabis, followed by heavy use of heroin and/or crack• While light use of recreational drugs always precedes heavy use of heroin and/or crack, the key indicators for heavy
use later are family background, criminal behaviour and recreational drug use in early to mid teens
Source: Various including Addiction, vol 97, 2002; ‘Structural determinants of youth drugs use’ Spooner et al, 2001; Drug Misuse and the Environment Home Office, 2002.

At any one time, over 220,000 high harm causing drug users are not engaged in treatment
43
Snapshot of high harm causing users’ interaction with treatment
High harm causing users in treatment60,000
Ex high harm causing users in prison, not in treatment*12,000
* Included because a high proportion are likely to re-use on release Source: Team analysis based on DH Treatment statistics, Home Office Prison statistics and Probation statistics, 2002
High harm causing users not in treatment220,000
• Treatment outside prison can take place in the community or in residential settings
• Community interventions include methadone maintenance or weekly counselling
• Residential treatment includes detoxification and/or intensive counselling/therapy
Ex high harm causing users in prison, in treatment3,000

Less than half of high harm causing drug users engage with treatment each year
44
High harm causing users in treatment, entering treatment and moving out of treatment during the course of a year
0
20,000
40,000
60,000
80,000
100,000
120,000
140,000
In treatment Apr2002
Entering treatmentduring year
Quit/fail treatment Become abstinent In treatment Apr2003
Source: Team analysis based on Regional Drug Misuse Database and others
60,000
60,000 40,000
65,000
15,000
• Even brief treatment episodes which do not result in abstinence can have a positive impact on levels of use; on injection of drugs; and on amount of crime committed

A particularly low proportion of crack users are engaged in treatment
45
Percentage of users in treatment at any one time, according to drug/s used
• Only ~1,000 crack-only users (5% of whole) are in treatment
• Crack use can be difficult to treat and capacity is currently very limited
• Many of the heroin and crack users will be receiving treatment for their heroin use but not for their crack use
0
10
20
30
40
50
60
70
80
90
100
Heroin not crack Heroin and crack Crack not heroin
In treatmentNot in treatment%
Source: Team analysis based on previous analyses and DH treatment statistics
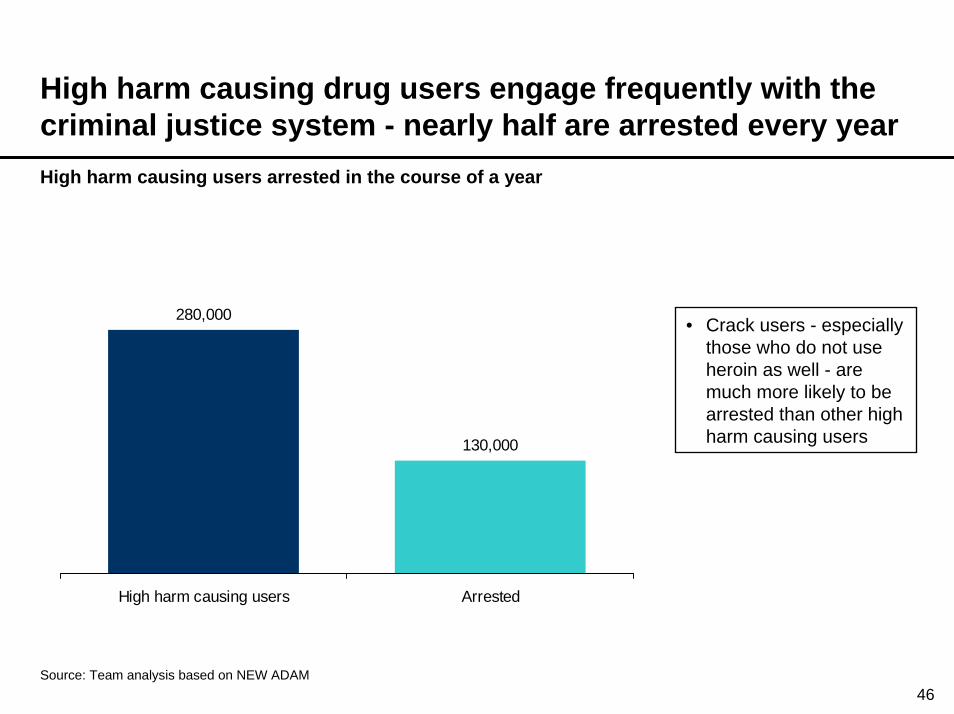
High harm causing drug users engage frequently with the criminal justice system - nearly half are arrested every year
46
High harm causing users arrested in the course of a year
280,000
130,000
High harm causing users Arrested
• Crack users - especially those who do not use heroin as well - are much more likely to be arrested than other high harm causing users
Source: Team analysis based on NEW ADAM

Of high harm causing drug users arrested, less than 1 in 5 are referred to treatment - and less than 1 in 25 actually attend
47
High harm causing users referred to treatment through Arrest Referral
• Arrest Referral is an informal system which aims to identify drug users among arrestees and refer them to treatment
• Arrestees are assessed for drug dependence by interview
• Drug testing of those arrested for a ‘trigger offence’* is currently being rolled out to 30 BCUs. It is intended to identify more users among arrestees, and identify users with greater certainty
• Currently there are no sanctions if the arrestee does not engage with treatment after referral. However, the Criminal Justice White Paper suggests that those not taking up treatment should not be bailed
130,000
5,000
20,000
High harm causingusers arrested
Referred totreatment
Engage withtreatment services
* ‘Trigger offences’ are those typically linked to drug use, e.g. mugging, shoplifting, drugs offences, burglary Source: Arrest Referral Statistical Update 2001

Only 5,000 high harm causing drug users receive a sentence each year specifically addressing their drug use
48
High harm causing users passing through the criminal justice system in the course of a year
0
50,000
100,000
150,000
200,000
250,000
300,000
High harm causingusers
Arrested in a year forany offence
Cautioned, givencommunity sentence
or not charged
Given a DTTO Sent to prison
280,000
130,000 75,000
5,000 50,000
Source: Team analysis based on NEW ADAM and Home Office Prison statistics
• Drug testing and treatment orders (DTTOs) can be granted in place of custodial sentences and require offenders to attend treatment rather than go to prison
• The number of DTTOs is projected to rise to 12,000 by 2005

Many high harm causing users enter prison each year, and most leave again within a year
49
High harm causing users in prison, entering prison and leaving prison during a year
0
10,000
20,000
30,000
40,000
50,000
60,000
70,000
In prison Jan 2001 Enter prison during year Released from prison In prison Jan 2002
• Nearly a quarter of high harm causing users are in prison at one point during any year
• Their average sentence length is around 4 months
15,000
50,000 49,000
16,000
Source: Team analysis, based on Prison statistics 2001, NEW ADAM, ONS Psychiatric Morbidity of Prisoners 1998, Criminality Survey 2000

Of high harm causing users entering prison, a minority have access to specialised treatment
50
High harm users entering prison in a year with access to specialist treatment units
• Prisoners are assessed for health needs on arrival in prison, including drug problems
• Most high harm users are imprisoned for minor offences and short periods; as a result they are most likely to enter local prisons - which are less likely than higher security prisons to have specialist drug treatment services
Entering prison with access to
treatment
Entering prison without access to
treatment
10,000
40,000
Source: Team analysis, based on analysis for previous slide plus NAO and SEU Reducing Reoffending reports, 2002.

In sum, the majority of high harm causing users have contact with treatment or criminal justice each year - but a third do not
51
Interactions of high harm causing users with the treatment and criminal justice system over the course of a year
In treatment(and in prison)
40,000
Arrested (and in
treatment)25,000
All high harm causing users280,000
Arrested (not sent to prison)
80,000
In treatment(community and residential)
120,000
Not in contact with treatment or criminal justice
95,000
In contact with treatment and/or criminal justice over the course of a year185,000
Source: Team analysis
Arrested (and sent to prison)
50,000

Planned additional treatment capacity may be insufficient to deal with the scale of high harm causing use
52
Cumulative real growth in treatment resources from 2002/3, by year
• Treatment resources come from two sources: a ringfenced budget (the pooled treatment budget) and mainstream budgets (e.g. NHS, local authorities)
• Over the Spending Review period the pooled treatment budget will increase by 57% in cash terms
• But over the same period funding from mainstream treatment budgets is projected to remain roughly constant
• After allowing for price increases, total treatment resources will increase by around 18% over the period 2002/3 - 2005/6
• The picture is far from uniform across the country: the increase in resources will vary widely
However:• Current treatment capacity appears to be well below
need• The mismatch is particularly acute for crack users
who cause disproportionate harm• The effectiveness and efficiency of treatment
services and the scope for their expansion and improvement will be examined in Phase 2
0%
2%
4%
6%
8%
10%
12%
14%
16%
18%
20%
2003/4 2004/5 2005/6
Source: NTA, Team analysis

53
INTRODUCTION 3
1: CONSUMPTION 8
THE USERS 37THE DRUGS 8
THE HARMS 13 CONCLUSIONS 53
2: SUPPLY 55
3: HARMS AND THE SUPPLY CHAIN 95
CONCLUSIONS AND NEXT STEPS 103

Main conclusions on drug consumption
54
THE DRUGS• Heroin and crack are the most addictive drugs, and some of the most
expensive
• The vast majority of heroin and/or crack users are not in prison or in treatment at any one time
• Two-thirds of high harm users will come into contact with treatment and/or criminal justice in the course of a year
• When users do come into contact with services– they do not engage for long – they are not identified and dealt with as users
THE HARMS
THE USERS
• Drug use (especially of heroin and crack) damages health and quality of life• Drug use causes users to commit crime
– heroin and/or crack users commit most crime– the worst offenders use heroin and crack in combination

55
INTRODUCTION 5
1: CONSUMPTION 8
2: SUPPLY 57
SUMMARY 57 THE UK BUSINESS 78
PRODUCTION 57 OVERVIEW OF SUPPLY 87
TRAFFICKING 63 CONCLUSIONS 92
MONEY-LAUNDERING 74
3: HARMS AND THE SUPPLY CHAIN 95
CONCLUSIONS AND NEXT STEPS 103

Summary of analysis of the drugs supply market
56
Production• Interventions to reduce production are complex, time-consuming and
expensive to achieve. They often result in displacement of production elsewhere
Trafficking• Traffickers have adapted effectively to government interventions. They
run highly profitable businesses and can withstand temporary shocks to their profitability. Interventions have been short-lived or have had a negligible impact on the retail market
Money laundering
• Cash is of critical importance for traffickers, but the money laundering business has become increasingly sophisticated and difficult to disrupt
UK market• The UK drugs business is highly fluid; dealers manipulate purity and
alter the weights sold to maintain revenue
Impact of intervention
• Even if supply interventions did successfully increase price, the evidence is not sufficiently strong to prove that this would reduce harm. However, shortages in local availability when they do occur can influence short-term demand and drive users into treatment

57
INTRODUCTION 3
1: CONSUMPTION 8
2: SUPPLY 55
SUMMARY 55 THE UK BUSINESS 78
PRODUCTION 57 OVERVIEW OF SUPPLY 87
TRAFFICKING 63 CONCLUSIONS 92
MONEY-LAUNDERING 74
3: HARMS AND THE SUPPLY CHAIN 95
CONCLUSIONS AND NEXT STEPS 103

Poverty often leaves farmers in drug growing regions few options but to grow illicit crops
58
• Coca bush and poppy are amongst the few crops that grow successfully on the poor quality land available to farmers
• High population densities and a lack of non-agricultural opportunities provide plentiful manpower for the labour-intensive cultivation process
• Farmers often have no access to licit markets that offer stable or reliable cash incomes, as in the northern Highlands of Thailand before intervention
• There is typically limited (or costly) access to the infrastructure necessary to transport alternate crops or products to markets
• There is a lack of knowledge about how to grow other crops productively– Plan Colombia found that some farmers were using outdated growing techniques that limited
productivity and therefore viability
Poverty and weak agricultural sectors in drug-growing regions leave farmers with a lack of viable alternatives that can match illicit crop returns:
Source: UNODC, team analysis

Additional factors beyond poverty have also helped to entrench farmers’ cultivation of illicit crops
59
A range of additional factors help drive cultivation patterns:
• Debts denominated in illicit crops force farmers into an ongoing crop cultivation cycle– landlords and drug traders extend credit to farmers, such as in Afghanistan – this credit must usually be paid back in harvested opium and so even if the farmers were able
to raise cash, they would still be tied into growing the crop– illicit crops can become the only reliable means of exchange
• this forces farmers to grow the crop just to buy the goods necessary for survival
• A lack of access to land forces farmers to grow illicit crops– due to the profits that they can make, landowners only lease land if tenants agree to cultivate
illicit drug crops– illicit crops are in any case often well-suited to the terrain and the workforce
• Cultural factors support the production of illicit crops- widespread consumption of drugs in producer areas is traditional- in Bolivia, cultivation for personal use is legal
• Powerful interests drive continued production of illicit crops– farmers and their families can face violence from drug traders if they try to stop growing illicit
crops (as seen in the Andean area)– officials corrupted by drug traders have an interest in hindering alternative incomes for farmers
Source: Team analysis

Western influence in production areas is limited because a drugs economy thrives where the rule of law has failed, or where international norms have been breached
60
• Drugs lock countries into a vicious spiral leading towards state failure
– whilst the breakdown of the rule of law is a necessary factor for widespread drugs cultivation, the profits of the drugs industry themselves drive further political destabilisation
• Large-scale drug cultivation often occurs in weak or failing states, and is enabled by the interaction of several related political factors
– a lack of central government control in key production areas– the presence of anti-government movements – widespread corruption of individual officials or whole sectors
of the government apparatus• Organised trafficking groups take advantage of this
breakdown of the rule of law by– working closely with anti-government groups or individuals
• FARC in Colombia are connected to major Colombian traffickers• influential governors in Afghanistan support, and profit from,
traffickers’ activities– working with corrupt elements in the government, or actively
bringing about that corruption to subvert law enforcement• the embedding of criminality within parts of the government is
particularly difficult to remove • ‘Pariah states’ can be directly implicated in the large-scale
production of drugs, e.g., the Taleban
Typical conditions in major drug-producing countries
Failing states
Source: HMG data, team analysis

Drug crop eradication alone appears not to limit illicit crops in the long term
61
0
100
200
300
400
500
600
700
800
900
1000
1989 1991 1993 1995 1997 1999 2001
Metric Tonnes
ColombiaBolivia Peru
Manufacture of cocaine*• Uncompensated crop eradication alone has not
worked as a method of reducing acres under plantation in the long term
– eradication does not address the forces that drive farmers to grow the crops in the first place
• Farmers and crop buyers respond in different ways to eradication programs
– different cultivation techniques, e.g., use of smaller plots or interspersed with other crops
– displacement: crops grown in new areas in-country, as well as in other countries
– prices in the eradicating country are driven up, encouraging farmers furtively to return to growing
• Effective efforts at eradicating coca growing in Colombia is thought to have displaced crops to Peru and Bolivia. Whether this displacement will outstrip the reduction achieved in Colombia remains to be seen
• Eradication has been successful, as in Thailand and Pakistan, but only when undertaken following a comprehensive set of interventions designed to address the underlying drivers of cultivation
Source: UNODC, team analysis* Potential production based on coca bush cultivation

Weaning farmers off a dependence on illicit crops is a time-consuming, complex and expensive process of state-building
62
• Subsistence lifestyle• Poor returns on all potential
crops• Inhabitants of remote,
marginalised, underdeveloped communities
• Croppers often indebted to landowners, debts often denominated in illicit crop
• Some alternatives to crop based credit
• Limited infrastructure & market access
• Wider access to assets• Work outside illicit crop
cultivation appearing
• Access to market credit• Variety of options for labourers
• Government controls absent• Local currency often illicit
crop• Corruption & coercion often
rife• Infrastructure absent• Poor access to markets• Crop eradication often forcible
• Credible claims of on-going central government control
• Functioning law enforcement and judicial system
• Minimal corruption• Increased access to markets• Education & labour
development
Government conditions & provisions
Conditions affecting the
farmer
Illicit crop grower Legitimate industryIllicit crops & legitimate industry
• Access to viable & diverse alternative product markets
• On-going stable government
• Effective judicial system• Road and transport
infrastructure• Crop eradication where
alternative livelihoods exist
For example • Myanmar, Colombia • Laos, Peru • Thailand, Pakistan
Source: Team analysis

63
INTRODUCTION 3
1: CONSUMPTION 8
2: SUPPLY 55
SUMMARY 55 THE UK BUSINESS 78
PRODUCTION 57 OVERVIEW OF SUPPLY 87
TRAFFICKING 63 CONCLUSIONS 92
MONEY-LAUNDERING 74
3: HARMS AND THE SUPPLY CHAIN 95
CONCLUSIONS AND NEXT STEPS 103

64
The capacity of the drugs industry to source and supply heroin and cocaine is enhanced by the wide diversity of routings, methods and types/scales of organisations involved
Characteristics of some principal drug-trafficking groupsColombians Jamaicans Turks Gulf-based West Africans
Drug Cocaine; some heroin tothe US
Cocaine Heroin Heroin Cocaine, heroin &other drugs
Variation inroutes &transport
types
High: exit via Colombia,Ecuador, Venezuela;sea transportationincludes containers,mother ships, fast boats
Low: operate fromJamaica and EasternCaribbean using aircouriers
Medium: operate via arange of European roadtransport routes, as wellas sea routes
Not known: likely to bemedium, particularlyusing containers via apotentially wide range ofroutes
High: worldwideoperations using aircouriers, particularlyto service second-tiermarkets.
Size ofconsignments
High: consignments canbe over 10 tonnes insize, though smaller inthe EU
Low-Medium: up to1 kg for internalconcealment; up to~50kg in freight
Medium: consignmentscan be up to 100s of kgs,usually repeattransactions with trustedUK wholesale customers
Medium-High: traffickmulti-tonneconsignments
Low-Medium:usually small butfrequent operations,though some larger
Degree ofcentral
organisation
High: sophisticated andwith international reach
Low: small groupsoperatingindependently
Medium: tightly knitdistribution networks,often based on clan andextended family ties
High: highly-organisedtrafficking operations,well protected by seniorofficials in the Gulfstates
Low: fluid &opportunistic groupscome together forparticular operations
Numbers ofplayers
involved
Medium: over 160principal groupsestimated to beoperating
Medium: severaldozens of similarly-sized playersoperating
Medium: 30-50 majorgroups operating
Low: probably a few keytraffickers
Medium: manygroups operating
Degree ofintegration in
the supplychain
Medium/High: sourcedrugs direct from rebelgroups; maintain controlover consignment intodestination country, butsmall UK distributionnetwork
Medium: sourcedrugs from othertraffickers, but haveaccess to significantUK distributionnetwork
Medium: source drugsfrom other traffickers, buthave access to significantUK distribution network
Not known: but unlikelyto have significantdistribution capacitydownstream
Low: no vertically-integrated supplychain maintained –no distributioncapacity
Colombians Jamaicans Turks West AfricansGulf-based
Source: HMG data

The drugs trafficking business is innovative and flexible in response to law enforcement interventions
65
Flexibility
• Trafficking groups are extremely flexible and respond quickly & innovatively to law enforcement efforts
– e.g., Jamaican groups switched to cruise liners after crack-down on air routes
• The technological sophistication of traffickers is increasing
– e.g., deep concealment techniques; secure organisational structures; counter-intelligence measures
Innovative
• The combination of high profitability and relative poverty ensures an inexhaustible supply of new participants
New participants
Constant adaptation
• A combination of flexibility, new participants & innovation has enabled traffickers to maintain a steady flow of drugs
– e.g., the Colombian cartels of the 1980-1990s were removed but quickly replaced by a larger number of low-profile groups
Source: HMG data, team analysis

66
The high profitability of the drugs business is derived from a premium for taking on risk, as well as from the willingness of drug users to pay high pricesPrice mark-up for shipping across a border : product comparisons
0%
200%
400%
600%
800%
1000%
Coffee Heroin Cocaine
1,000%
360%
18%
% mark-up(price at import compared to price at export)
Source: Reuter and Greenfield (2001), HMG data, team analysis. Cocaine mark-up is Colombia to Spain; heroin mark-up is from Iran to UK
The appetite for risk varies between individual traffickers, making the impact of increasing risk unpredictable
67
• Individual traffickers have different tolerances to risk– some employ a range of risk-minimisation techniques, particularly for personal risk e.g.
using go-betweens when dealing with purchasers; as a result, they perceive risks to themselves as being quite low
– others actually appear to enjoy the risks of “taking on” law enforcement agencies by being more closely involved in operational activities
– traffickers may take more risks earlier in their careers in order to establish themselves– variation in risk tolerance may reflect cultural differences between different ethnic groups
• Quantitative estimates of personal risk appear to bear out these differing perceptions of risk
– undercapitalised risk-toleraters are up to 10 times more likely to be apprehended by law enforcement agencies than well-capitalised risk-minimising principals
• Risk-minimisers benefit from the same high prices charged by risk-toleraters, despite taking on less risk
– so risk-minimising traffickers may actually benefit from increasing levels of risk because overall prices are driven up
Source: ISDD report to HMCE

Seizures only have a limited impact on profitability for traffickers
68
0
20
40
60
80
High case Low case
Revenues foregone from seizures
Profits
All other costs
Raw material costs
Modelled total annual turnover for a major Afghan traffickerTurnover(US $ millions)
• Even in the worst case scenario, a major Afghan trafficker can still make over $10 million per year
Total annual profits$37 million
Total annual profits$11 million
Source: HMG data, team analysis. Data is for trafficker processing base and shipping to Turkey. ‘High case’ refers to low costs (including product costs), high sale price, and low seizure rates; vice versa for ‘Low case’.
69
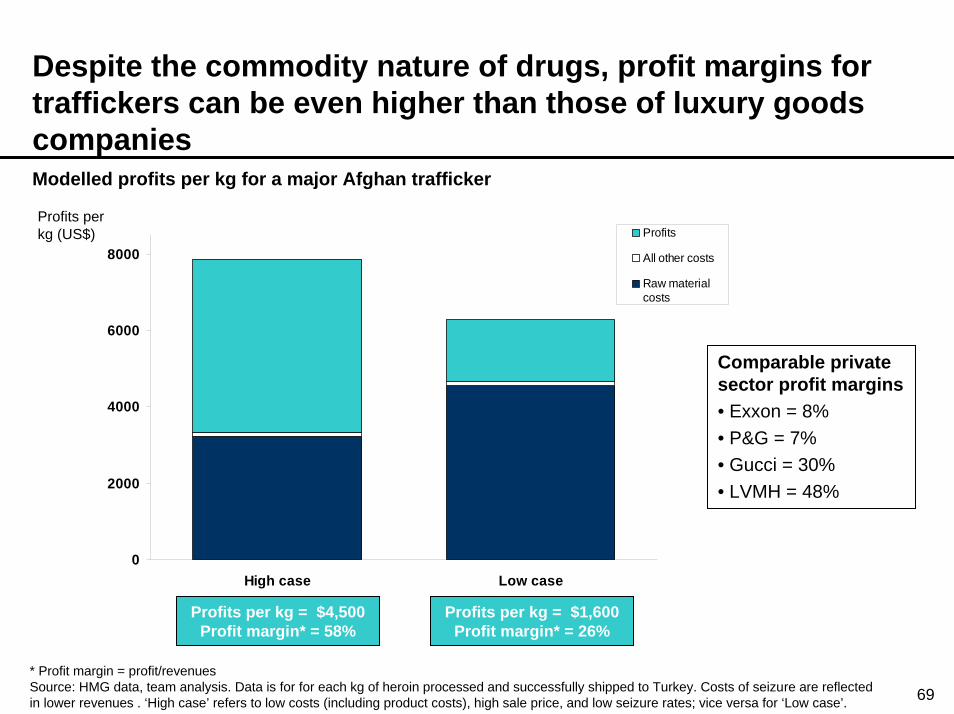
Despite the commodity nature of drugs, profit margins for traffickers can be even higher than those of luxury goods companies
0
2000
4000
6000
8000
High case Low case
Profits
All other costs
Raw materialcosts
Modelled profits per kg for a major Afghan trafficker
Profits per kg (US$)
Profits per kg = $4,500 Profit margin* = 58%
Profits per kg = $1,600 Profit margin* = 26%
Comparable private sector profit margins• Exxon = 8% • P&G = 7%• Gucci = 30%• LVMH = 48%
* Profit margin = profit/revenuesSource: HMG data, team analysis. Data is for for each kg of heroin processed and successfully shipped to Turkey. Costs of seizure are reflected in lower revenues . ‘High case’ refers to low costs (including product costs), high sale price, and low seizure rates; vice versa for ‘Low case’.

Major upstream interruptions to drug production can drive up prices in the producing region
70
0
100
200
300
400
500
0
1000
2000
3000
4000
5000
6000
Heroin production(tonnes)
Heroin prices(US$/kg)
• Natural and political events in Afghanistan significantly reduced production levels
• This reduction in supply drove up heroin prices
Source: UNDCCP - Global illicit drug trends 2002 * Afghanistan + Pakistan ** Average of Iran, Pakistan, Tajikistan
Heroinproduction*
Heroin price**
Taleban total cultivation ban
Taleban deposed
Drought in Afghanistan
Variations in opiate production and price in South West Asia
1996 1997 1998 1999 2000 2001 2002

71
The impact on street prices of shortages upstream is minimised, however, because drug traffickers do not pass on the increase in costsVariations in price between Turkey and the UK
September 2001 (£/kg)
September 2002 (£/kg)
Price increase
670
3,330
13,000
1,670
5,000
16,000
• Although September 11th caused a 150% increase in morphine prices in Turkey, the cost of heroin purchased in the UK increased by only 25%
• Instead of passing on price increases to their UK customers, Turkish traffickers were prepared to see their profit margins cut
Morphine base imported into Turkey
~150%
Processed heroin sold in Turkey
~50%
Heroin soldin UK ~25%
Traffickermark-up * ~1,850 % ~850 %
* For a vertically-integrated trafficker sourcing morphine in Turkey and selling heroin in the UK. Mark-ups do not factor in other costs. Whilst purity changes have not been factored in, latest evidence suggests that Turkish purity dipped until end-2001, and then started increasing through 2002.Source: HMG data / NCS.

Western government interventions have tended to have a short-lived or negligible impact on retail prices downstream
72
0
50
100
150
200
250
300
350
400
450
500
1981
1982
1983
1984
1985
1986
1987
1988
1989
1990
1991
1992
1993
1994
1995
1996
1997
1998
1999
2000
Year
‘War on Drugs’ begins *
Peruvian shoot-down policy **
Cocaine price to retail user
Cocaine price to wholesale distributor
* US/Colombian campaign against the cartels ** Unidentified light planes flying between Peru & ColombiaSource: ONDCP, 2001, US Institute for Defence Studies
US retail cocaine prices ($ per pure gram, 2000 prices)
Governmental interventions against the cocaine trade in Colombia
• The impact of US & Colombian interventions against the cocaine trade appears to be small and short-lived
• Wholesale price is a better indicator of the impact of upstream intervention than retail price
Plan Colombia

The high seizure rates required to put a major trafficker out ofbusiness pose a substantial challenge to law enforcement
73
Profit margins for a major trafficker at different seizure ratesExample:
Afghan traffickers
Seizure Rates High case Low case • A sustained seizure rate of over 60% is required to put a successful trafficker out of business
– anecdotal evidence suggests that seizure rates as high as 80% may be needed in some cases
• Sustained successful interventions on this scale have never been achieved
10% 58% 26%
25% 49% 14%
40% bust37%
60% bust5%
Source: HMG data, team analysis

74
INTRODUCTION 3
1: CONSUMPTION 8
2: SUPPLY 55
SUMMARY 55 THE UK BUSINESS 78
PRODUCTION 57 OVERVIEW OF SUPPLY 87
TRAFFICKING 63 CONCLUSIONS 92
MONEY-LAUNDERING 74
3: HARMS AND THE SUPPLY CHAIN 95
CONCLUSIONS AND NEXT STEPS 103

Cash is of vital importance to the drugs business
75
• The trafficking of drugs generates significant volumes of cash; if it is to be used or enjoyed by those involved in the drugs business it needs to flow back across borders and to be legitimised within the financial system
• Managing the flows of cash is of vital importance to drugs traffickers– traffickers rely on current sales to pay for future imports– where traffickers make use of credit, they rely on proceeds to pay off their debts
• The most challenging tasks for drugs traffickers are – getting cash into the legitimate financial system
• criminal organisations are likely either to make small deposits in financial institutions or to use cash-based businesses to achieve this
– moving cash across borders• many traffickers will physically carry cash across borders (£1m weighs around 20 Kg in
sterling, 15 Kg in dollars, and 3 Kg in Euros)• electronic transfer is widely used, mainly via money service businesses
Source: Team analysis

Money laundering is a highly complex process
76
There are three key phases:
Placement: cash into financial institution or used to buy asset
Layering: process of concealing cash via financial transactions
Integration: proceeds legitimised and returned to criminal organisation
Asset purchase or exchange: purchase and sale (and, possibly, trafficking) of high value goods
Cash: by couriers (up to £200,000 on their body); by car (up to £1m in vehicles), or by sea (containers out of Spain carrying £500,000 per month)
Black market peso exchange (BMPE): Broker uses company to buy goods which are exported to Colombia and sold. US estimates $3-6b p.a. laundered via BMPE
Electronic transfer: £2-2.5b pa estimated to leave UK via bureaux de change; large number of small transactions to avoid raising suspicions
Bank complicity: failure to record or report suspicious activity. Control of banks via criminal organisations
Other false invoicing: cash-based businesses; over-valuing goods (Panama: estimated £1b pa gap between money entering and goods exported
Hawala: hawala banker arranges for money to be paid overseas; accounts reconciled via banking system or other commodities
The process is not necessarily linear; several stages may occur at once
Source: HMG data, team analysis

The money laundering business has become increasingly sophisticated and difficult to disrupt
77
• The money laundering business has become sophisticated, global and flexible. Its importance is highly valued by drugs traffickers
– money laundering has become increasingly sophisticated • traffickers, especially for cocaine, place more emphasis on trusted contacts (often family members)
for managing the proceeds than for trafficking the product • the management of proceeds has become increasingly separate from the trafficking of product• the increase in fees paid by drugs traffickers for money laundering services demonstrates increased
professionalisation (fees have increased from 6-8% in early 1980s to 20-25% now)– traffickers will seek and find the weakest link in law enforcement; despite significant
progress in the UK, countries with poor controls/enforcement will continue to be used• the Gulf: poor banking supervision; money laundering laws still in draft; patronage of governing elite• the Turkish Republic of Northern Cyprus: relative lack of financial regulation• Central America: Panama legislation not to be enacted until 2005
While money laundering legislation may be effective in targeting specific trafficking groups, it is less likely to have a long-term strategic impact in disrupting the flows of drugs money
• New money laundering patterns may emerge which will make it even more difficult to tackle
– for example, we may see an increased use of internet, purchase/control of banks, increasing use of hawala in response to money laundering legislation
Source: HMG data, team analysis

78
INTRODUCTION 3
1: CONSUMPTION 8
2: SUPPLY 55
SUMMARY 55 THE UK BUSINESS 78
PRODUCTION 57 OVERVIEW OF SUPPLY 87
TRAFFICKING 63 CONCLUSIONS 92
MONEY-LAUNDERING 74
3: HARMS AND THE SUPPLY CHAIN 95
CONCLUSIONS AND NEXT STEPS 103

The UK heroin, cocaine and crack market is estimated to have a value in excess of £4 billion per annum
79
UK drugs market estimates*
Heroin Crack CocaineEstimated UserNumbers**
260,000 140,000 250,000
Estimated AverageAnnual Spend perUser
~£10,000 ~£10,000 ~£5,500
Derived RetailMarket Size
~£1,9bn ~£1bn ~£1,4bn
Price per gram £60 £105 £60
Derived retailtonnes
31 10 22
* These estimates are conservative, and may underestimate true market value ** These numbers are not additive. Total heroin and/or crack user population is estimated at 280,000Source: HMC&E, Team analysis
• The entire estimated UK supply of heroin and cocaine could be transported into the country in five standard-sized shipping containers
Heroin Crack Cocaine

The long term decline in the real price of drugs, against a backdrop of rising consumption, indicates that an ample supply of heroin and cocaine has been reaching the UK market
80
Real purity-adjusted retail prices*
* Real purity adjusted prices show a different trend to nominal unadjusted purity prices. Nominal prices have remained largely stable, while purity has risen over time. This leads to falling real purity adjusted prices Source: NCIS Streetwise, Forensic Science Service Drug Abuse Trends
0
50
100
150
200
250
300
350
1990 1992 1994 1996 1998 2000 2002
£/pure gram, 2000 prices
Heroin
Cocaine
Crack
Note: prices would have fallen even further had traffickers not had to face the risk of apprehension or seizure by law enforcement
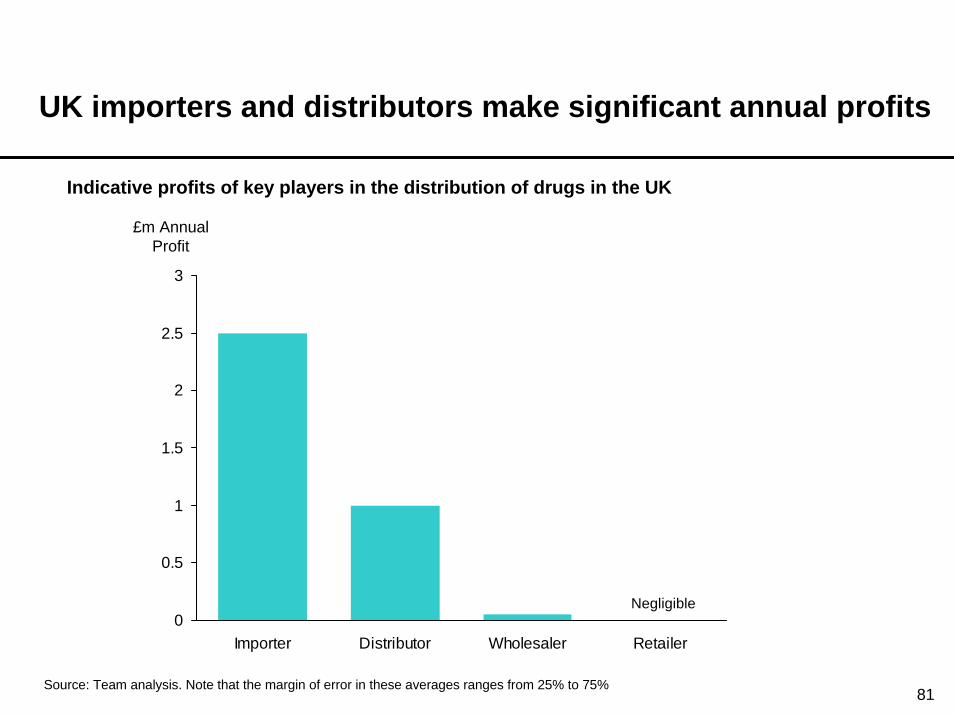
UK importers and distributors make significant annual profits
81
Indicative profits of key players in the distribution of drugs in the UK
0
0.5
1
1.5
2
2.5
3
Importer Distributor Wholesaler Retailer
Negligible
£m Annual Profit
Source: Team analysis. Note that the margin of error in these averages ranges from 25% to 75%

UK importers and suppliers make enough profit to absorb the modest cost of drug seizures
82
Profitability in the UK supply chain
• While retail dealers make most profit per gram, they sell only very small quantities
• Differences between drugs:– Heroin: retail profits are
highest per gram, but absolute returns increase up the chain
– Crack: appears to mirror heroin patterns
– Cocaine: too little is known about cocaine trading to know whether it is similar to crack or heroin
• Because upstream UK suppliers enjoy high profits, they are more able to absorb the cost of interception. Thus upstream seizures may temporarily impact street availability, but are unlikely to threaten the viability of any individual business
* Total revenue less cost of productSource: Team analysis, NCIS Streetwise
0
10
20
30
40
50
60
70
UK Importer Distributor Wholesaler Retailer
Dealer profit*
Heroin Cost
Monthly kg/
Heroin Price (£/g)
Monthly Supply (kg per dealer)
dealer
30
40
70
60
50
20
10
0
Volume of heroin

The lure of higher profits encourages suppliers to move up the supply chain
83
• Moving up the supply chain requires the funds to bank-roll consignments before revenue is received
• There are often more than four links in the supply chain
• Some supply chains will be formed specifically for a particular consignment; others are more enduring
• Individuals’ positions in the chain are fluid and they will operate in different roles e.g. as a retailer on one drug consignment and as a wholesaler on a simultaneous but separate consignment
Relatively few importers numbering in the low
hundreds
Relatively few importers numbering in the low
hundreds
Distributors often have a fairly consistent
relationship with a small number of importers
Distributors often have a fairly consistent
relationship with a small number of importers
Wholesalers may well deal in all Class A drugsWholesalers may well
deal in all Class A drugsMany thousands of
retailersMany thousands of
retailers
Importers will usually focus on one drug though
may diversify
Importers will usually focus on one drug though
may diversify
Distributors often required by UK importer to ensure that product
has a buyer
Distributors often required by UK importer to ensure that product
has a buyer
May have a series of ‘employee’ retailers that sell their drugs or may
simply on-sell drugs to an independent retailer
May have a series of ‘employee’ retailers that sell their drugs or may
simply on-sell drugs to an independent retailer
Retailers will tend to deal in either heroin and crack or cocaine and synthetics
Retailers will tend to deal in either heroin and crack or cocaine and synthetics
UK Importer Distributor Wholesaler Retailer
Source: Team analysis

Cocaine retailers maintain revenues by adjusting purity, not price, so that their prices remains stable
84
Nominal retail cocaine prices and purityPrice (£/g) Purity %
0
20
40
60
80
100
120
140
160
180
200
1997 1998 1999 2000 2001 20020%
10%
20%
30%
40%
50%
60%
70%
80%
• Nominal retail prices have remained steady
• Street purity, on the other hand, has oscillated up and down around the 50% mark
• Dealers appear to keep prices constant and to adjust purity to cope with short-term fluctuations in supply
– a shortfall leads to a reduction in purity, so drug retailers maintain their revenues
• Heroin retailers do not appear to react in the same way. They may alter the size of unit sold more frequently instead. Further research is needed here
• Cocaine retailer behaviour means purity can play a role in tracking street volume trends
Year
Street Purity %
Wholesale price
Retail price
Wholesale Purity %UK retailer tactics
Source: NCIS Streetwise, Forensic Science Service Drug Abuse Trends

The user-dealer relationship will vary between individuals but has some common characteristics
85
The retailer-user relationship
User-Dealers• Probably make up bulk of
retailers• Will seek to sell enough to fund
own habit• Can have as few as 6 long term
clients & not likely to market services unless they lose clients
• Since aim is to fund habit rather than maximise profits, pricing may not be as consistent as non-using retailers
Retailers• Non-using retailers will seek
to maximise profits in order to raise the capital sum required to finance a wholesale deal
• Non-using retailers tend to sell larger volumes than user dealers (e.g. up to 3 grams a day)
• Non-using retailers can have up to 200 (probably short-term) clients, particularly if dealing openly in street.
Users• The number of dealers a
user patronises may depend on the drug they use (heroin users may have more dealers than cocaine users)
• Users may obtain credit from suppliers, but only in instances of familiarity
• Users are quite price sensitive and may shop around by phone
Source: Team analysis

Less is known about the UK drugs market than about drug production and trafficking overseas
86
• Data across the UK drug supply chain has not been consistently collected, analysed and interpreted
– UK drug suppliers are numerous, operate in a fluid fashion and adapt effectively to surveillance efforts
• As a result, there are still significant gaps in government knowledge about the UK market in drugs
– the typical number of links in the domestic supply chain is estimated at between 4 and 7, but there is insufficient evidence to be certain
– the buy and sell rates at the various points in the chain (other than wholesale and retail) are largely unknown; revenues and profits along the chain can only be estimated
– though the numbers of individuals involved in the chain can be estimated, there is little hard evidence or intelligence available

87
INTRODUCTION 3
1: CONSUMPTION 8
2: SUPPLY 55
SUMMARY 55 THE UK BUSINESS 78
PRODUCTION 57 OVERVIEW OF SUPPLY 87
TRAFFICKING 63 CONCLUSIONS 92
MONEY-LAUNDERING 74
3: HARMS AND THE SUPPLY CHAIN 95
CONCLUSIONS AND NEXT STEPS 103

The drugs industry is a large employer worldwide, but with comparatively few personnel involved in cross-border trafficking into the West
88
Worldwide Worldwide cocaine industry heroin industry
Source: HMG data, UNODC, team analysis
Coca leaf production & processing 100s of 1000s
FARC & AUC (base sales, cocaine processing & sales) ~10’s of 1000s of rebels
Some involvement in trafficking industry estimated ~10,000
Important involvement in trafficking ~6,000
~40 ‘Major League’ traffickers in Colombia
80-120 major importers into UK
100s of major distributors in UK
1000s of wholesalers in UK
10s of 1000s of retailers in UK
Involved in poppy production ~500,000
Opium collection, basic processing, selling ~10s of 1000s
1000s employed in secondary processing and transportation work
100s of minor traffickers out of production areas
<20 ‘Major League’ traffickers out Afghanistan / Pakistan
~20 heads of major Turkish family groups importing into Europe
30-50 major importers into UK
120-160 major distributors in UK
~1,500 wholesalers in UK
10s of 1000s of retailers in UK
• In addition to the concentration of the industry around a relatively small number of major traffickers, there are certain geographical choke-points- The Netherlands in particular is a major entrepot for the European class A drugs industry

Exports of cocaine to Europe and the UK account for a small proportion of total production
89
0
100
200
300
400
500
600
700
800
900
1000
1989 1990 1991 1992 1993 1994 1995 1996 1997 1998 1999 2000 2001 2002
Met
ric T
onne
s
ColombiaBolivia Peru
Cocaine manufacture*Estimated cocaine production, and consumption in Europe and UK
Export to Europe (~20%)
UK retail (<5%)
~700 tonnes (100% purity)
Production in Andean region
(100%)
* Potential production based on coca bush cultivationSource: UNDCCP Global Illicit Drug Trends 2002
Source: HMG data, UN documentsNote: UK retail volumes based on retail purity of c.50%

Exports of heroin to Europe and the UK also account for a small proportion of total production
90
0
100
200
300
400
500
600
700
1989
1990
1991
1992
1993
1994
1995
1996
1997
1998
1999
2000
2001
2002
Met
ric T
onne
s
ColombiaThailandViet NamOther AsianMexicoPakistanLao PDRAfghanistanMyanmar
Production in Afghanistan
Export to Europe (c15%)
UK retail (4%)
Estimated heroin production, and consumption in Europe and UK
Source: UN DCCP Global Illicit Drug Trends 2002. * Estimate for countries other than Afghanistan in 2002 based on 2001 data; potential production based on opium cultivation
*
~340 tonnes (100% purity)
Heroin manufacture
Talebanban
Source: HMG data, UNODCNote: UK retail volumes based on retail purity of c.40%

91
Although some drugs are seized, falling prices and rising consumption over time suggest that the market receives an ample supply
Production in Andean region (100% purity)
Total seizures (~23%)
UK seizures (~1%)
Total seizures (~15%)
UK seizures (~1%)
Estimated worldwide cocaine seizures
Estimated worldwide heroin seizures
Production in Afghanistan
(100% purity)
0
5000
10000
15000
20000
25000
30000
35000
40000
Heroin Crack Cocaine
Quantity after seizureSeizures
UK (Kg)Estimated UK seizures
10% <1% 15%
• Despite seizures, real prices for heroin and cocaine in the UK have halved over the last ten years
Note: HMG data, UN documents

92
INTRODUCTION 3
1: CONSUMPTION 8
2: SUPPLY 55
SUMMARY 55 THE UK BUSINESS 78
PRODUCTION 57 OVERVIEW OF SUPPLY 87
TRAFFICKING 63 CONCLUSIONS 92
MONEY-LAUNDERING 74
3: HARMS AND THE SUPPLY CHAIN 95
CONCLUSIONS AND NEXT STEPS 103

In summary, government can make a range of interventions in the supply chain which have different advantages and disadvantages
93
Increases risks of illegal cultivation to farmers… but increases social tensions in poor communities, benefits anti-government groups & displaces cultivation to new regions
Objective Nature of Intervention Value of intervention
Reducing quantities of drugs released into supply chain
Compensated forced eradication
Release resources into local communities… but very expensive & encourages further planting by farmers
Uncompensated forced eradication
Comprehensive set of alternative development interventions
By targeting causes of illicit cultivation, has a high impact on overall production levels & is sustainable… but is expensive, takes time & requires development of good governance in source country… and displaces cultivation to other countries
Seizing drugs before they reach the UK
Upstream supply chain seizures
Larger consignment sizes mean bigger seizures… but proximity to source means that consignments are low in value & easy to replace, and there is no assurance that consignments are UK-bound
Downstream supply chain seizures (e.g. at UK border)
Proximity to UK means that seizures will directly reduce flow of drugs into the UK market, & consignments are of high value & harder to replace, but small consignment sizes mean smaller seizures & it is impossible to disrupt the large number of routes completely
Disrupting distribution networks within the UK
Targeting higher-level dealers (distributors and wholesalers)
Removes drugs before they hit the streets in small quantities…but resource-intensive & relatively little known about this part of the market
Disrupting retailer activity within the UK
Targeting street dealers High visibility policing helps reduce anti-social street dealer behaviour…but street dealers replaced quickly & only tiny quantities of drugs removed from circulation
Reducing financial rewards for drugs-trafficking
Targeting proceeds and assets of drug groups
Attacks profits & hence rationale of drugs-traffickers…but is resource-intensive & technical, and money-laundering modus operandi likely to change as law enforcement focuses on this area

Conclusions on the drugs supply market
94
• Over the past 10-15 years, despite interventions at every point in the supply chain, cocaine and heroin consumption has been rising, prices falling and drugs have continued to reach users
– government interventions against the drug business are a cost of business, rather than a substantive threat to the industry’s viability
– however, by increasing risk, government interventions are likely to have slowed the decline in prices

95
INTRODUCTION 3
1: CONSUMPTION 8
2: SUPPLY 55
3: HARMS AND THE SUPPLY CHAIN 95
CONCLUSIONS AND NEXT STEPS 103
Current policies are underpinned by an assumption that reducing drug availability and increasing price reduce harm
96
• Supply-side interventions may impact on price, purity, and/or availability. Current supply-side policies focus on seizing drugs and disrupting the business in order to reduce availability and increase price. The implicit assumption is that this will lead to a reduction in harm by
– reducing consumption amongst the most problematic users – inhibiting the initiation of new users– buying ‘breathing space’ for demand-side policies to take effect
• For all of this to hold true, evidence would need to demonstrate that overall levels of harm respond to changes in price, purity and/or availability to the drug user
– e.g., that seizures, by reducing availability and/or increasing price, thereby reduce crime-motivated harms as well as health and social functioning harms
– and that supply-side policies can successfully reduce availability and increase price
Source: Team analysis
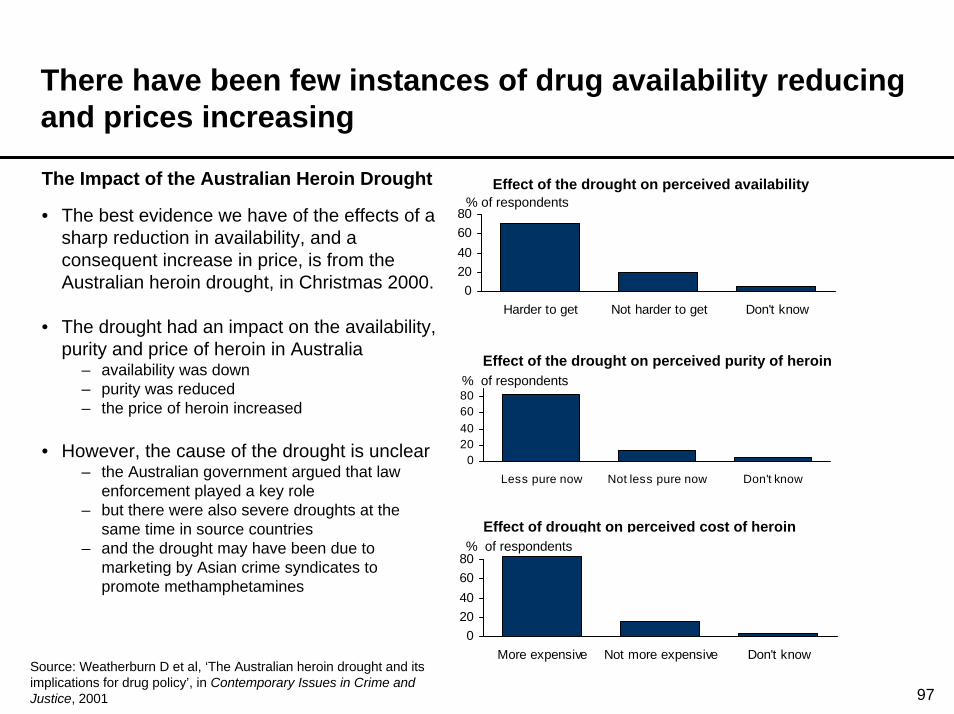
There have been few instances of drug availability reducing and prices increasing
97
The Impact of the Australian Heroin Drought
020406080
Harder to get Not harder to get Don't know
% of respondentsEffect of the drought on perceived availability
• The best evidence we have of the effects of a sharp reduction in availability, and a consequent increase in price, is from the Australian heroin drought, in Christmas 2000.
• The drought had an impact on the availability, purity and price of heroin in Australia
– availability was down– purity was reduced– the price of heroin increased
• However, the cause of the drought is unclear– the Australian government argued that law
enforcement played a key role– but there were also severe droughts at the
same time in source countries– and the drought may have been due to
marketing by Asian crime syndicates to promote methamphetamines
Effect of the drought on perceived purity of heroin
020406080
Less pure now Not less pure now Don't know
% of respondents
Effect of drought on perceived cost of heroin
020406080
More expensive Not more expensive Don't know
% of respondents
Source: Weatherburn D et al, ‘The Australian heroin drought and its implications for drug policy’, in Contemporary Issues in Crime and Justice, 2001

The consumption of drugs does appear to react both ways to changes in price
98
0
100
200
300
400
500
600
700
800
900
1000
Cap Quarter Half Gram
Median w eekly expenditurebefore drought
Median w eekly expenditureafter drought
Median weekly expenditure ($)
Effect of the drought on median weekly heroin expenditure
Usual purchase unit
When prices rise• In Australia, there was a sharp drop in positive
tests for opiates after the drought, and total expenditure on drugs appears to have fallen, at least amongst regular users.
When prices fall• In the UK, heroin and cocaine consumption has
at least doubled over the last 10 years whilst real purity adjusted prices have halved
• Recent academic literature argues that price increases may reduce consumption significantly, but there is a wide range of estimates about the scale of the impact
– conversely, falling prices may have contributed to the significant increase in initiation rates
Source: Team analysis, Weatherburn D et al, ‘The Australian heroin drought and its implications for drug policy’, in Contemporary Issues in Crime and Justice, 2001

99
Even though overall consumption may drop as prices go up, those who cause most harm, however, may be more willing to pay higher prices to maintain their habit• In the Australian drought, heavy users were less
responsive to price increases and committed more crime– after the drought, 42% committed more crime (of
those who used heroin more than twice a day, over half reported more crime)
– and user-dealers in Oslo have proved much more willing to pay higher prices than ordinary users
• Reduced consumption of one drug may also be offset by increased consumption of another harmful drug
– during the heroin drought, cocaine use increased, especially among heavy users
• It is possible, therefore, that price increases may even increase overall harm, as determined users commit more crime to fund their habit and more than offset the reduction in crime from lapsed users
• BUT it is also plausible that sustained price rises - at a far higher level than has hitherto been achieved - could have a significant long-term effect as users either face difficulties in increasing criminal income to fund consumption and become incarcerated, or seek treatment
Source: Team analysis, Weatherburn D et al, ‘The Australian heroin drought and its implications for drug policy’, in Contemporary Issues in Crime and Justice, 2001
0102030405060
Twice daily or less More than twice daily
% of respondents
Percentage reporting more crime by level of heroin use
0
5
10
15
20
25
1999
Q3
1999
Q4
2000
Q1
2000
Q2
2000
Q3
2000
Q4
2001
Q1
2001
Q2
BankstownParramatta
Trends in positive urine tests to cocaine (September 1999 to June 2001)
% of positive tests
Quarter

100
Successful seizures appear most likely to lead to purity changes rather than to price changes, but the consequential impact on harm is unclear
• Evidence on prices in the UK suggests that nominal prices tend to be held steady at street level whilst purity levels may vary
– dealers appear to show a tendency to dilute purity (particularly for cocaine), or reduce the size of unit sold, in response to drug shortages rather than to increase price
– this response may be because dealers fear losing customers if they raise price– as a result, dealers maintain their income and users’ expenditure (and therefore crime
harms) remains steady even where volumes fluctuate, reducing the harm impact of successful seizures
• Fluctuating purity levels may also have an adverse impact on health harms– reduced purity may increase health harms by increasing risk of overdose when higher
purity levels return
• Short-term shortages in drugs supply tend to be manifested through changes in purity (or transaction size) rather than changes in nominal prices
– this maintains total expenditure levels despite the reduced volume of drugs on the street, thereby reducing the potential impact of seizures on harm
Source: Team analysis

Reductions in local availability may have a greater impact on harms than changes in price or purity
101
• The most pronounced effect of the Australian heroin drought was in its positive impact on treatment and overdose levels
– it prompted a sharp upturn of admissions and re-admissions to methadone treatment
– re-admissions appear to have stabilised at a lower level after the drought, suggesting that the positive impacts may have been sustained
– the drought also resulted in fewer overdoses: there were 74% fewer overdose administrations in the first half of 2001 than in the last half of 2000
• Local absence of availability may therefore have a greater beneficial impact on harms than changes to other supply chain variables
• If interventions were successfully to reduce local availability, even for a period, they might bring a sustainable benefit in reducing demand
• The harm impact is complex, however, as the shortage in Australia pushed up both prices and the volume of crime committed by heavy users
Date drought started
Date drought started
Source: Team analysis, Weatherburn D et al, ‘The Australian heroin drought and its implications for drug policy’, in Contemporary Issues in Crime and Justice, 2001
0
10
2030
40
50
6070
Jul '
00
Aug
'00
Sep
'00
Oct
'00
Nov
'00
Dec
'00
Jan
'01
Feb
'01
Mar
'01
Apr
'01
May
'01
Jun
'01
AllNew admissionsRe-admissions
Admissions to methadone in Cabramatta, Australia (July 2000 to June 2001)
Number of admissions
Month
010203040506070
Jul '
00
Aug
'00
Sep
'00
Oct
'00
Nov
'00
Dec
'00
Jan
'01
Feb
'01
Mar
'01
Apr
'01
May
'01
Jun
'01
Frequency of useTrends in Narcan use (for overdoses) in Cabramatta
Month
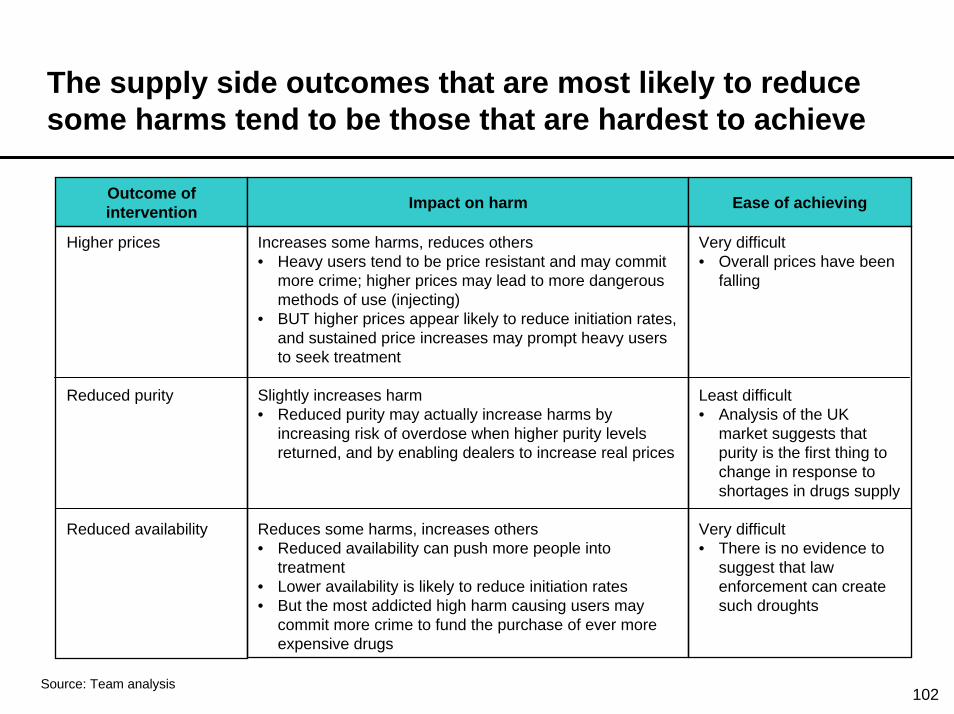
The supply side outcomes that are most likely to reduce some harms tend to be those that are hardest to achieve
102
Outcome of intervention
Higher prices
Reduced purity
Reduced availability
Impact on harm
Increases some harms, reduces others• Heavy users tend to be price resistant and may commit
more crime; higher prices may lead to more dangerous methods of use (injecting)
• BUT higher prices appear likely to reduce initiation rates, and sustained price increases may prompt heavy users to seek treatment
Slightly increases harm• Reduced purity may actually increase harms by
increasing risk of overdose when higher purity levels returned, and by enabling dealers to increase real prices
Reduces some harms, increases others• Reduced availability can push more people into
treatment• Lower availability is likely to reduce initiation rates• But the most addicted high harm causing users may
commit more crime to fund the purchase of ever more expensive drugs
Ease of achieving
Very difficult• Overall prices have been
falling
Least difficult• Analysis of the UK
market suggests that purity is the first thing to change in response to shortages in drugs supply
Very difficult• There is no evidence to
suggest that law enforcement can create such droughts
Source: Team analysis

103
INTRODUCTION 3
1: CONSUMPTION 8
2: SUPPLY 55
3: HARMS AND THE SUPPLY CHAIN 95
CONCLUSIONS AND NEXT STEPS 103

Conclusions at the end of the first phase of the project
104
• The rising use of serious drugs over the past twenty years has had an increasingly adverse impact on users, their families and the rest of society
• The drugs supply market is highly sophisticated, and attempts to intervene have not resulted in sustainable disruption to the market at any level. As a result:
− the supply of drugs has increased− prices are low enough not to deter initiation− but prices are high enough to cause heavy users to commit high levels of crime to
fund their habits
• The 280,000 high harm causing heroin and/or crack users engage frequently with treatment and/or criminal justice but either remain engaged for short periods of time and/or do not have their use identified. There is scope for the state to deal more effectively with users when they come into contact with government services and substantially to reduce the harms the cause

Phase 2: next steps
105
• To identify policies which will substantially reduce the harms caused by drug users, both to society and to themselves
In particular to :• Define a rationale for intervention in the drugs supply chain, such
that interventions in the market help to reduce harm• Identify which interventions with users and potential users will
most reduce harm• Propose the most cost-effective means overall of reducing harms
through interventions both with users and in the supply chain