phase transformations and complex properties - a ...based on crystal plasticity and measured...
TRANSCRIPT

1
A COMPARION OF YIELD LOCI MEASURED WITH MECHANICAL
TESTS AND CALCULATED FROM CRYSTAL PLASTICITY FOR STEEL SHEETS
AN, Y.G, ATZEMA, E., WORKEL, M., VEGTER, H., ELLIOTT, L., MOERMAN, J.
Corus RD&T, IJmuiden, The Netherlands
ABSTRACT In the sheet forming industry, FEM techniques are now widely used for the optimisation of tool geometry and process parameters in the process design stage. The reliability of FEM modelling depends not only on the numerical description of the problem, but also on the description of process parameters and the constitutive material models available. Accurate phenomenological descriptions of the yield locus are based on measurements made in various mechanical tests. However, an alternative approach to the description of yield function is based on crystal plasticity and measured crystallographic texture data.
In the present study, yield loci measured using various mechanical tests are compared to those derived from the crystal plasticity approach for a range of low carbon steels. Results indicate that the difference in the simple shear points calculated using the full constraint Taylor model and Taylor Pancake model is quite small. The measured simple shear points do not deviate much from those calculated from the Taylor models for low carbon steels. The Taylor Pancake model predicts the biaxial point for most low carbon steels quite well. However, the measured plane strain points deviate from those predicted from Taylor models. In order to obtain more reliable predictions using crystal plasticity models, further development of these descriptions or other approaches are needed. KEYWORDS: Yield loci, work hardening, texture, mechanical test, low carbon steel
INTRODUCTION In the automotive industry, there is an increasing time pressure on the development phase of new car models. Therefore, quick and reliable numerical techniques (FEM) are needed that can be used to optimise tool geometry and various process parameters in the process design stage for sheet forming processes. These powerful modelling techniques replace many expensive and time-consuming experiments and trials and have become widely used by the sheet forming industry.
The reliability of FEM modelling depends not only on the numerical description of the problem, but also on the description of process parameters and the constitutive material models available. Accurate phenomenological descriptions of yield locus involve multi-parameters that are determined by various mechanical tests [1-4]. However, most mechanical tests are time-consuming and expensive. An alternative approach to the description of yield functions, based on crystal plasticity and measured texture data, is simple and fast. The Taylor model assumes that plastic flow occurs by crystallographic slip on given slip systems

2
within each crystal and each crystal undergoes a level of same strain equal to the macroscopic strain. The Taylor pancake model partly abandons Taylor’s hypothesis of homogeneous deformation by relaxing the through-thickness shear components [5,6]. Based on these assumptions, yield loci can be easily derived. In the present study, the yield loci derived from various mechanical tests and from a crystal plasticity approach are compared and discussed for several low carbon steels.
EXPERIMENTAL WORK
MATERIALS The materials tested were one cold rolled low carbon steel, two galvanized low carbon forming steels, three rephosphorised high strength steels, and one CMn steel. They are designated A to G in Table 1. The average mechanical properties are also listed below.
Table. 1. The average mechanical properties of the materials
Material Code σ0.2 [MPa] UTS[MPa] δu [%] δt [%] R n
DC04 A 164 306 23.0 40.0 1.71 0.216
DX52 B 309 378 18.5 31.0 0.99 0.172
DX52 C 276 377 18.0 31.0 1.13 0.172
Rephos IF D 243 375 21.1 36.2 1.86 0.202
Rephos IF E 270 402 19.8 33.6 1.45 0.184
Rephos AK F 365 450 17.0 29.0 1.04 0.161
CMn G 298 411 15.6 26.2 0.97 0.175
TEXTURE MEASUREMENT Preferred crystallographic orientation was determined using data from 110, 200 and 211 incomplete reflection pole figure data set. Harmonic coefficients were calculated from this data to a truncation of L=22 using a least square method.
The characteristic feature of the cold rolled low carbon steel has a peak type (111)//ND fibre with intensity peaks near the (111)<110>. The galvanized low carbon forming steels display a weak pipe-shaped 111//ND fibre and partial <110>//RD fibre. The rephosphorised IF-steels have a peak type 111//ND fibre with intensity peaks near the 111⟨112⟩ component and a diffused α-fibre. A weak 001<110> component is observed. ϕ2=45o sections of ODFs for cold rolled low carbon steel A, galvanized low carbon steel B, and rephosphorised IF steel E are plotted in Fig. 1.

3
A B E
Fig. 1. ODF contour plot in the ϕ2=45o sections for steel A, B and E (intensity 1.0 - 1.3 - 1.6 -2.0 - 2.5 - 3.2 - 4.0 - 5.0 - 6.4 - 8.0).
MECHANICAL TESTS In order to define the constants required for a constitutive material model of yield loci, mechanical tests, namely through-thickness compression test, plane strain and simple shear test, were conducted. Compression tests were carried out in a MTS hydraulic testing machine using stacked brick specimens. The tests were performed at a crosshead speed of 0.10mm/s, which gave a strain rate of approximately 1.0x10⁻²s-1. Oiled PTFE film was used as a lubricant. The effect of friction was considered in the way described in ref [7]. During the compression tests, the displacements in the rolling and transverse directions were measured with an extensometer, as shown in Fig.2. Continuous load and displacement were measured and used to calculate the stress and strain data.
Plane strain tensile tests were conducted in the same hydraulic testing machine. The crosshead speed was 0.05mm/sec, which gave a strain rate of approximately 1.0x10⁻²s-1. The extensometer, shown in Fig. 3, has an initial gauge length of 4mm with an accuracy of class 0.2 according to EN10002. The gauge width of the specimen used in the plane strain test was 70mm. The influence of the edges on the work hardening is less than 2% [8]. The load and displacement were measured continuously during the test.
Fig. 2. The extensometer for the compression test using a stacked specimen. The displacements in the RD and TD are measured for the calculation of strains.

4
Fig. 3. The plane strain tensile test using an extensometer.
Fig. 4. Specimens for the simple shear test before and after shear deformation.
Simple shear tests were performed using an MTS hydraulic testing machine with a load cell of 50kN. The specimen used for testing is shown in Fig. 4. The test piece consists of two deformation zones with shear length of 30mm, and width of 4mm. All the tests were run with displacement control and the ramp velocity was 0.04mm/s, which gave a strain rate of approximately 1.0x10⁻²s-1. For strain measurement, 1mm square photo grids were applied on all the specimens. Photographs of the deformed samples were taken using a stereomicroscope Leica MZ8. The co-ordinates of the grids were obtained using Leica image analysis software, from which the shear angles and relevant shear strains could be calculated. Shear stress was obtained by dividing the applied load by the cross-sectional area.
CONSTITUTIVE MATERIAL MODEL
WORK HARDENING BEHAVIOUR The work hardening measured in uniaxial tension, plane strain tension, through-thickness compression and simple shear was measured as shown in Fig. 5 for DC04. An isotropic work hardening model can describe the work hardening behaviour in different strain state and in the present study, the Bergstrom stress - strain relationship was employed [9]. The stress and strain data in the tensile tests are used to fit the strain hardening model. The parameters σ0,

5
∆σm and Ω of the formula are obtained by a multi-linear regression of the stress and strain data given by the uniaxial tensile tests. The parameters β, n’, ε0, m were kept constant in the fitting procedure and their values are listed below. The fitted parameters are listed in table 2.
σ σ σ β ε ε σεε
ε εf m
n mek T
G= + ⋅ ⋅ + + − + ⋅ +
⋅⋅− ⋅ +
0 0 00 0
1 10∆∆
Ω( ) [ ] [ ln(&
&)]( ) ' *
σ0 static yield stress
∆σm stress increase parameter for strain hardening
β strain hardening parameter for large strain behaviour (0.25)
Ω strain hardening parameter for low strain behaviour
ε0 pre-deformation parameter (0.005)
n’ exponent for the strain hardening behaviour (0.75)
σ0* limit dynamic flow stress
∆G0 maximum activation enthalpy
m power for the strain rate behaviour (2.2)
k Boltzmann constant = 8.617⋅10-5 eV/K
T absolute temperature in °K
0ε& limit strain rate for thermal activated movement
Table 2. The fitted hardening parameters for the work hardening model
Material Code σ0 ∆σm Ω σ0∗
DC04 A 114.8 250.3 8.10 600
DX52 B 216.6 243.8 8.22 600
DX52 C 197.5 238.8 9.87 600
Rephos IF D 190.8 279.8 7.68 565
Rephos IF E 208.0 277.3 9.78 600
Rephos AK F 261.7 278.3 9.07 600
CMn G 203.1 283.1 10.48 600
0
100
200
300
400
500
600
0 0.1 0.2 0.3ε
σ, M
Pa
Uniaxial0
PST0
Comp_ND
Shear
Fig. 5. The stress - strain curves in different strain state for DC04 in the rolling direction

6
VEGTER YIELD FUNCTION The Vegter yield function uses a Bezier interpolation to construct a smooth yield locus based on the stress factors derived in different strain states. The mathematical description of the yield locus takes the following form:
−
+
⋅+
−
⋅+
=
⋅
2
1
2
1
2
12
2
1
2
1
2
1
2
1
,
221BB
CC
AA
AA
BB
AA
meanv
µµσσ
σ
where Ai and Ci are stress factors for the reference points and Bi for hinge points. The initial reference yield stress is defined by the initial yield stress in the rolling direction.
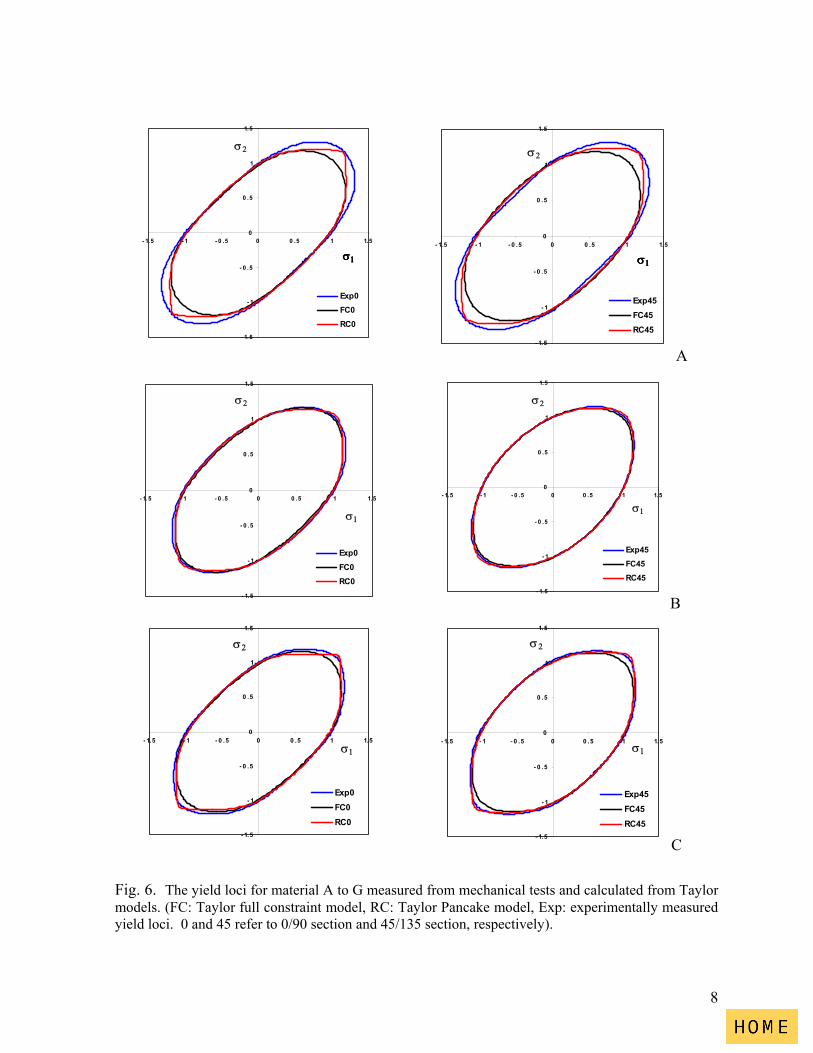
Based on the derived work hardening model and the measured work hardening data in uniaxial tension, plane strain tension, through-thickness compression and simple shear, stress factors for the yield loci can be determined. These stress factors, together with the plastic anisotropy parameter, R-values and the strain vector determined in the compression test, give enough information to use the Bezier interpolation to construct a smooth yield surface. The yield loci based on the mechanical tests are plotted in Fig. 6. YIELD LOCI BASED ON POLYCRYSTAL PLASTICITY Based on the measured texture data and crystal plasticity models, the yield loci can be derived. The full constraints Taylor model (FC) assumes that plastic flow occurs by crystallographic slip on given slip systems within each crystal and each crystal undergoes the same macroscopic strain. The Pancake model (RC) partly abandons Taylor’s hypothesis of homogeneous deformation by relaxing through-thickness shear components. In the present study, yield loci were calculated using the full constraints Taylor model and the Pancake model as shown in Fig.6. MTM-FHM software developed by van Houtte was used in the calculations [10]. RESULTS AND DISCUSSION The yield loci based on the mechanical tests and those derived from crystal plasticity are plotted in fig. 6 for 0/90 section and 45/135 section. They are all scaled relative to the uniaxial point in the rolling direction for comparison.
The yield loci predicted from the Taylor full constraint model are different from those predicted from the Taylor pancake model. The difference in the shear regime is negligible, independent of materials. While for the biaxial regime a large difference is observed; the equal biaxial point from the Pancake model is always larger than that from the full constraints model. The difference is materials dependent; for rephospherised IF steels, the difference between the two predictions for the biaxial point is significant.
A comparison of the measured yield loci and those predicted from the Taylor model indicates that the Taylor Pancake model gives in general much better prediction than the Taylor full constraint model. In the shear regime, the difference between the predictions from the Taylor models and the measured yield loci is minor for all materials. In the stretching regime, the differences among the calculated and the measured yield depend on the type of material tested. For rephospherised IF steels, the Taylor Pancake model predicts the yield loci quite well compared with the measured ones, while the Taylor full constraint model underestimates the biaxial point. For cold rolled and galvanized low carbon steels, the biaxial points calculated

7
using the Taylor Pancake model were consistent with the measured ones, however, the model sometimes underestimates the plane strain points, in particular for DC04. CMn260 is the only exception of the materials tested; the Taylor full constraint model gives much more accurate prediction of the yield loci than the Taylor Pancake model.
In summary, the Taylor full constraint model and the Taylor Pancake model can both give good prediction of the simple shear points on the yield loci. The biaxial point predicted by the Taylor Pancake model is in general greater than that predicted from the Taylor full constraints model and is in most cases close to the measured points. The prediction of the plane strain points is more complicated. The measured plane strain points can be either larger or smaller than those predicted from Taylor model. For accurate prediction of full yield loci, further development of crystal plasticity model or other approach is needed.
CONCLUSIONS The difference in the simple shear points calculated using the full constraint Taylor model and the Taylor Pancake model is quite small. The measured simple shear points do not deviate much from those calculated from the Taylor models for all materials tested.
In the biaxial stretching regime, the Taylor Pancake model can predict the biaxial point for most low carbon steels and rephosphorised IF steels very well, with the exception of CMn steel.
Measured plane strain points can be significantly larger than those predicted by the Taylor models. For accurate prediction of full yield loci, further development of the crystal plasticity model or other approaches is needed.
REFERENCES 1. R. Hill.; Constitutive modeling of orthotropic plasticity in sheet metals, J. Mech. Phys. Solids,
Vol.38, p.405, 1990. 2. H. Vegter, P. Drent, and J. Huetink.; A planar isotropic yield criterion based on
mechanical testing at multi-axial stress states, Proceedings of the fifth international conference on numerical methods in industrial forming processes, USA, 1995.
3. F. Barlat, Y. Maeda, K. Chung, M. Yanagawa, J.C. Brem, Y. Hayashida, D.J. Lege, K. Matsui, S.J. Murtha, S. Hattori, R. Becker, and S. Makosey; Yield function development for aluminum alloy sheets, J. Mech. phys. Solids, vol.45, p.1727, 1997.
4. D. Banabic, D.D. Comsa, T. Balan; Yield criterion for orthotropic sheet metals, Proc. Of the conf. Metal forming, Krakow, Balkema, 2000.
5. J. F. W. Bishop, and R. Hill, A theoretical derivation of the plastic properties of a polycrystalline Face-centred metal, Phil. Mag. 42, 414, 1951.
6. P. Van Houtte; Calculation of the yield locus of texture polycrystals using the Taylor and the Relaxed Taylor theory, Texture and Microstructures, Vol.7, p.29, 1987.
7. Y. G. An and H. Vegter., Analytical and experimental study of frictional behavior in through-thickness compression test, J. Mater. Process. Technol. 160 (2005) 148-155.
8. Y.G. An, H. Vegter and L. Elliott, A novel and simple method for the measurement of plane strain work hardening, J. Mater. Process. Technol. 155-156 (2004) 1616-1622.
9. Y. Bergstrom, A dislocation model for the stress strain behavior of polycrystalline α-Fe with special emphasis on the variation of the densities of mobile and immobile dislocations, Mat. Sci .Eng., 5 (1969/70), p.179-192.
10. P. Van Houtte; The ‘’MTM-FHM’’ software system Version 2, Katholieke Universiteit Leuven, Belgium, 1995.
8
- 1.5
- 1
- 0 .5
0
0 .5
1
1.5
- 1.5 - 1 - 0 .5 0 0 .5 1 1.5
Exp0FC0RC0
σ1
σ2
σ1σ1
- 1.5
- 1
- 0 .5
0
0 .5
1
1.5
- 1.5 - 1 - 0 .5 0 0 .5 1 1.5
Exp45FC45RC45
σ1
σ2
σ1σ1
A
- 1.5
- 1
- 0 .5
0
0 .5
1
1.5
- 1.5 - 1 - 0 .5 0 0 .5 1 1.5
Exp0FC0RC0
σ1
σ2
- 1.5
- 1
- 0 .5
0
0 .5
1
1.5
- 1.5 - 1 - 0 .5 0 0 .5 1 1.5
Exp45FC45RC45
σ2
σ1
B
- 1.5
- 1
- 0 .5
0
0 .5
1
1.5
- 1.5 - 1 - 0 .5 0 0 .5 1 1.5
Exp0FC0RC0
σ2
σ1
- 1.5
- 1
- 0 .5
0
0 .5
1
1.5
- 1.5 - 1 - 0 .5 0 0 .5 1 1.5
Exp45FC45RC45
σ1
σ2
C
Fig. 6. The yield loci for material A to G measured from mechanical tests and calculated from Taylor models. (FC: Taylor full constraint model, RC: Taylor Pancake model, Exp: experimentally measured yield loci. 0 and 45 refer to 0/90 section and 45/135 section, respectively).

9
- 1.5
- 1
- 0 .5
0
0 .5
1
1.5
- 1.5 - 1 - 0 .5 0 0 .5 1 1.5
Exp0
FC0
RC0
σ1
σ2
- 1.5
- 1
- 0 .5
0
0 .5
1
1.5
- 1.5 - 1 - 0 .5 0 0 .5 1 1.5
Exp45
FC45
RC45
σ1
σ2
D
- 1.5
- 1
- 0 .5
0
0 .5
1
1.5
- 1.5 - 1 - 0 .5 0 0 .5 1 1.5
Exp0FC0RC0
σ1
σ2
- 1.5
- 1
- 0 .5
0
0 .5
1
1.5
- 1.5 - 1 - 0 .5 0 0 .5 1 1.5
Exp45FC45RC45
σ1
σ2
E
- 1.5
- 1
- 0 .5
0
0 .5
1
1.5
- 1.5 - 1 - 0 .5 0 0 .5 1 1.5
Exp0FC0RC0
σ1
σ2
- 1.5
- 1
- 0 .5
0
0 .5
1
1.5
- 1.5 - 1 - 0 .5 0 0 .5 1 1.5
Exp45FC45RC45
σ1
σ2
F Fig. 6 (cont). The yield loci for material A to G measured from mechanical tests and calculated from Taylor models. (FC: Taylor full constraint model, RC: Taylor Pancake model, Exp: experimentally measured yield loci. 0 and 45 refer to 0/90 section and 45/135 section, respectively).

10
- 1.5
- 1
- 0 .5
0
0 .5
1
1.5
- 1.5 - 1 - 0 .5 0 0 .5 1 1.5
Exp0FC0RC0
σ1
σ2
- 1.5
- 1
- 0 .5
0
0 .5
1
1.5
- 1.5 - 1 - 0 .5 0 0 .5 1 1.5
Exp45FC45RC45
σ1
σ2
G Fig. 6 (cont). The yield loci for material A to G measured from mechanical tests and calculated from Taylor models. (FC: Taylor full constraint model, RC: Taylor Pancake model, Exp: experimentally measured yield loci. 0 and 45 refer to 0/90 section and 45/135 section, respectively).