phasors , capacitors, impedance
DESCRIPTION
Phasors , Capacitors, Impedance. Spin My World Right Round. LPF Application: Gastric Electrical Activity. 60-70 million people suffer from GI disorder Electrically active organ. http://www.virtualmedicalcentre.com/anatomy/gastrointestinal-system/7. - PowerPoint PPT PresentationTRANSCRIPT
Phasors, Capacitors, Impedance
Spin My World Right Round
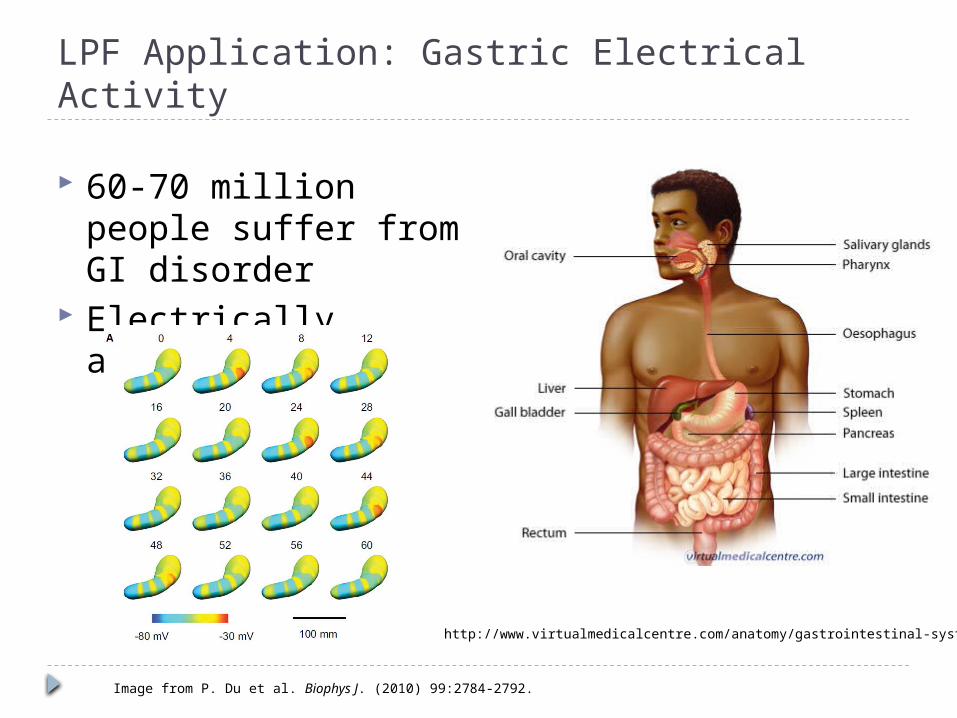
LPF Application: Gastric Electrical Activity
60-70 million people suffer from GI disorder
Electrically active organ
http://www.virtualmedicalcentre.com/anatomy/gastrointestinal-system/7
Image from P. Du et al. Biophys J. (2010) 99:2784-2792.
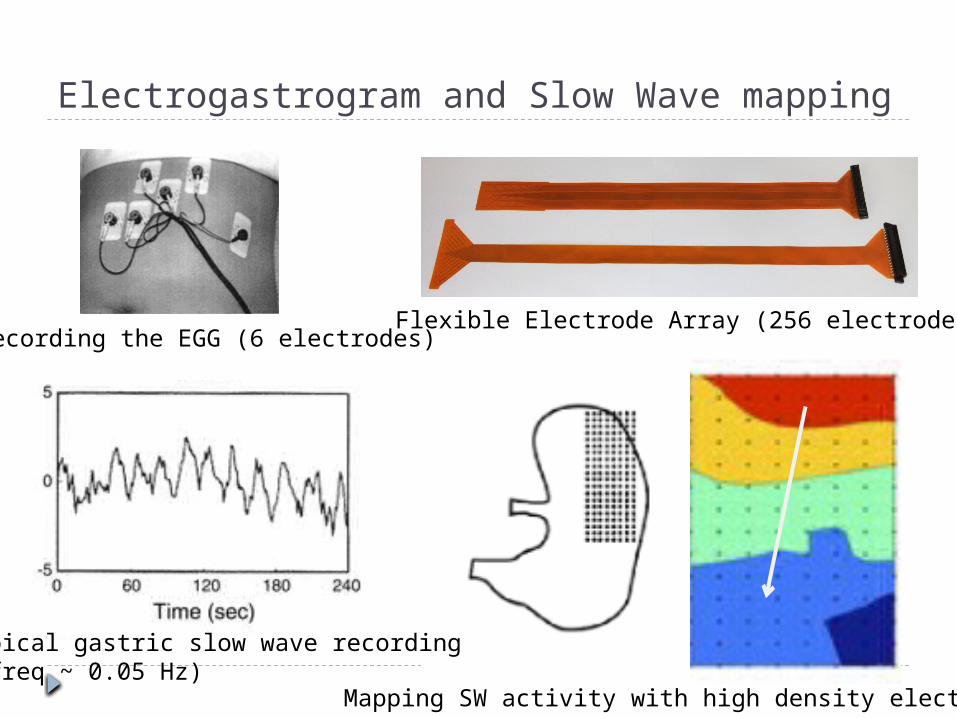
Electrogastrogram and Slow Wave mapping
Recording the EGG (6 electrodes)Flexible Electrode Array (256 electrodes)
Typical gastric slow wave recording (freq ~ 0.05 Hz)
Mapping SW activity with high density electrodes
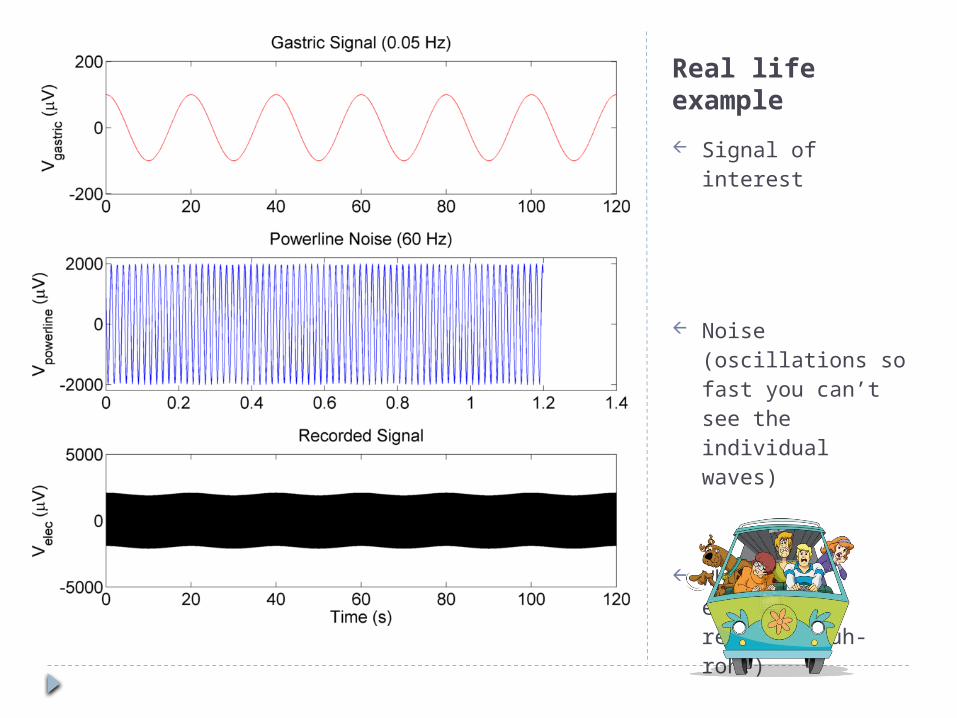
Real life example
Signal of interest
Noise (oscillations so fast you can’t see the individual waves)
What the electrode records (ruh-roh!)

One possible solution: Low Pass Filter
• High frequency components: Kill off (strongly attenuate) • Low frequency components: Pass through essentially untouched
Vout(t)

LPF in Action
Strongly attenuated 60Hz
Barely attenuated 0.05Hz
0 0.02 0.04 0.06 0.08 0.1 0.12 0.14 0.16 0.18 0.2-5
-4
-3
-2
-1
0
1
2
3
4
5
Time (s)
Sig
nal (
V)
60Hz power line noise
0 10 20 30 40 50 60-0.25
-0.2
-0.15
-0.1
-0.05
0
0.05
0.1
0.15
0.2
0.25
Time (s)
Sig
nal (
V)
Gastric Slow Wave

Raw vs. Filtered Signal
0 10 20 30 40 50 60-6
-4
-2
0
2
4
6
Raw S
ignal
(V)
0 10 20 30 40 50 60-0.4
-0.3
-0.2
-0.1
0
0.1
0.2
0.3
Filter
ed Si
gnal
(V)
Time (s)
0 10 20 30 40 50 60-6
-4
-2
0
2
4
6
Raw
Signa
l (V)
0 10 20 30 40 50 60-0.4
-0.3
-0.2
-0.1
0
0.1
0.2
0.3
Filter
ed Si
gnal
(V)
Time (s)
INPUT
(raw gastric + raw powerline)
OUTPUT
(filtered gastric + raw powerline)
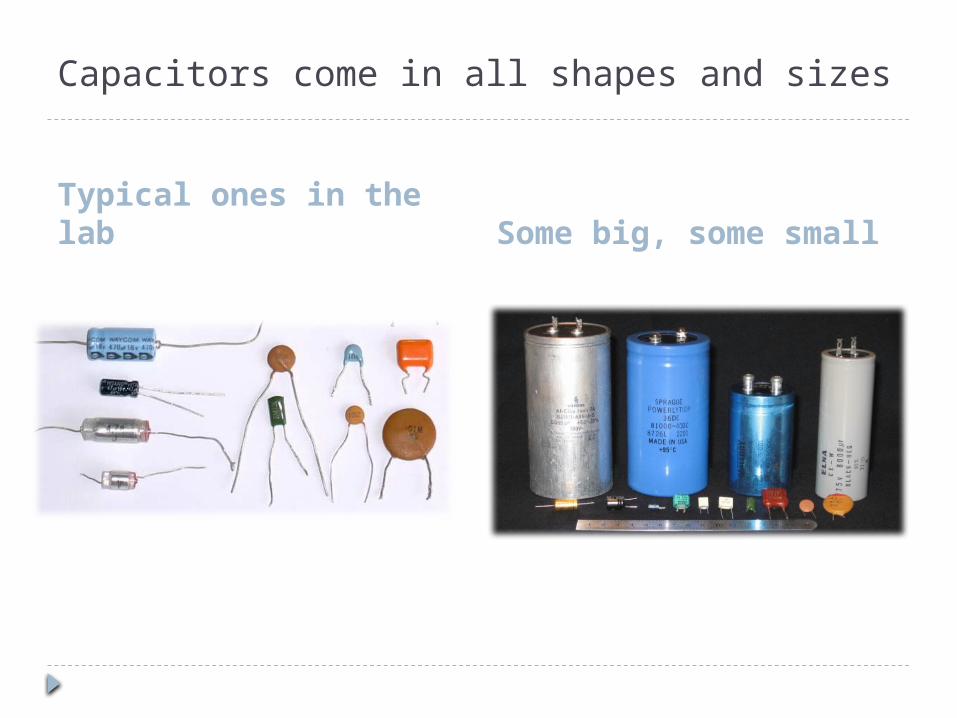
Capacitors come in all shapes and sizes
Typical ones in the lab Some big, some small
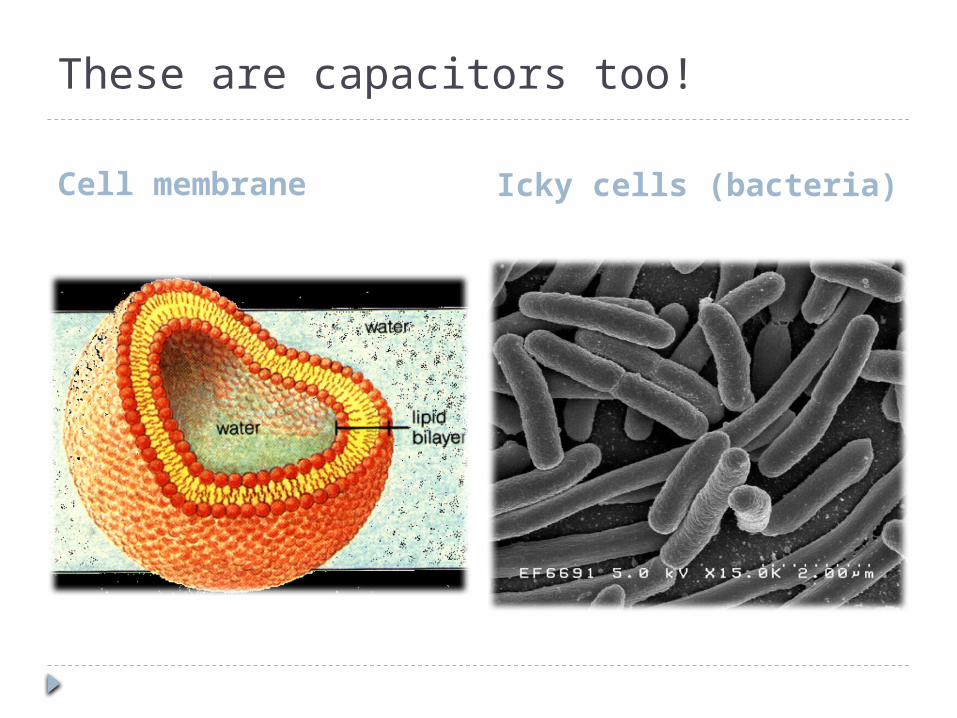
These are capacitors too!
Cell membrane Icky cells (bacteria)

And so is this!
PC boardRed = top layerGreen = bottom layer
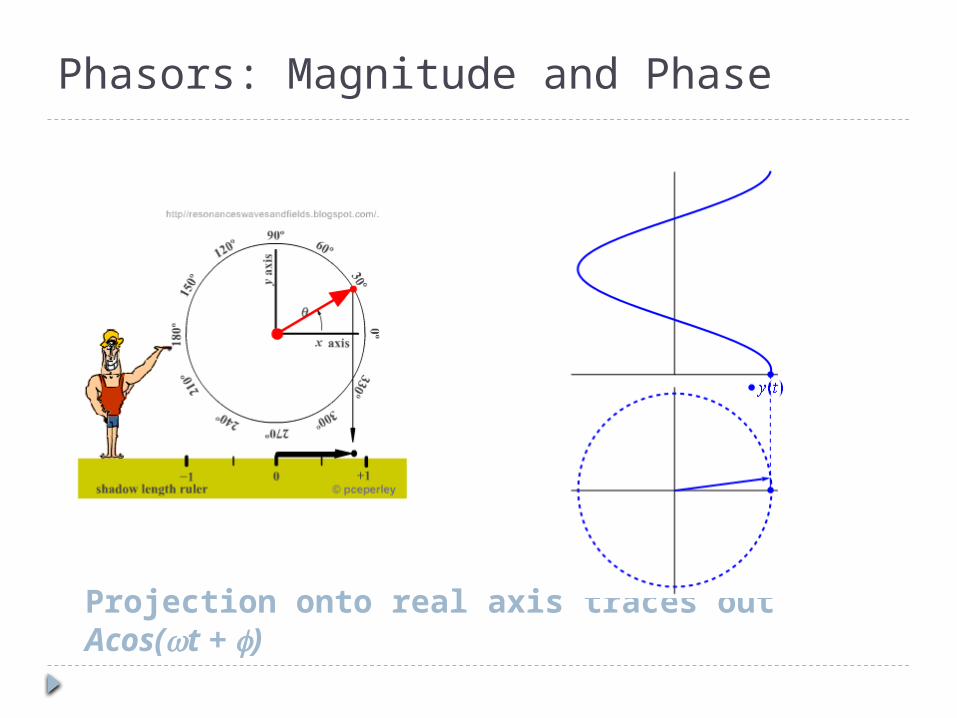
Phasors: Magnitude and Phase
Projection onto real axis traces out Acos(wt + f)

Magnitude and Phase
http://resonanceswavesandfields.blogspot.com/2007/08/phasors.html#phasor-beating

Phasors!
coswt-coswt
sinwt
-sinwt
Rotates in timeBut we just read off the magnitude and phase information at one instant (usually, t = 0)

Raw vs. Filtered Signal
0 10 20 30 40 50 60-6
-4
-2
0
2
4
6
Raw S
ignal
(V)
0 10 20 30 40 50 60-0.4
-0.3
-0.2
-0.1
0
0.1
0.2
0.3
Filter
ed Si
gnal
(V)
Time (s)
0 10 20 30 40 50 60-6
-4
-2
0
2
4
6
Raw
Signa
l (V)
0 10 20 30 40 50 60-0.4
-0.3
-0.2
-0.1
0
0.1
0.2
0.3
Filter
ed Si
gnal
(V)
Time (s)
(50 k )W
(10 mF)
We now interrupt this broadcast to do some phasor math…

Implementing a low pass filter (LPF)
Strongly attenuated 60Hz
Barely attenuated 0.05Hz
0 0.02 0.04 0.06 0.08 0.1 0.12 0.14 0.16 0.18 0.2-5
-4
-3
-2
-1
0
1
2
3
4
5
Time (s)
Sig
nal (
V)
60Hz power line noise
0 10 20 30 40 50 60-0.25
-0.2
-0.15
-0.1
-0.05
0
0.05
0.1
0.15
0.2
0.25
Time (s)
Sig
nal (
V)
Gastric Slow Wave

60 Hz signal zoomed in
0.01 0.02 0.03 0.04 0.05 0.06 0.07 0.08 0.09 0.1
-1
-0.5
0
0.5
1
1.5
2
Time (s)
Sig
nal (
V)
60Hz power line noise
f
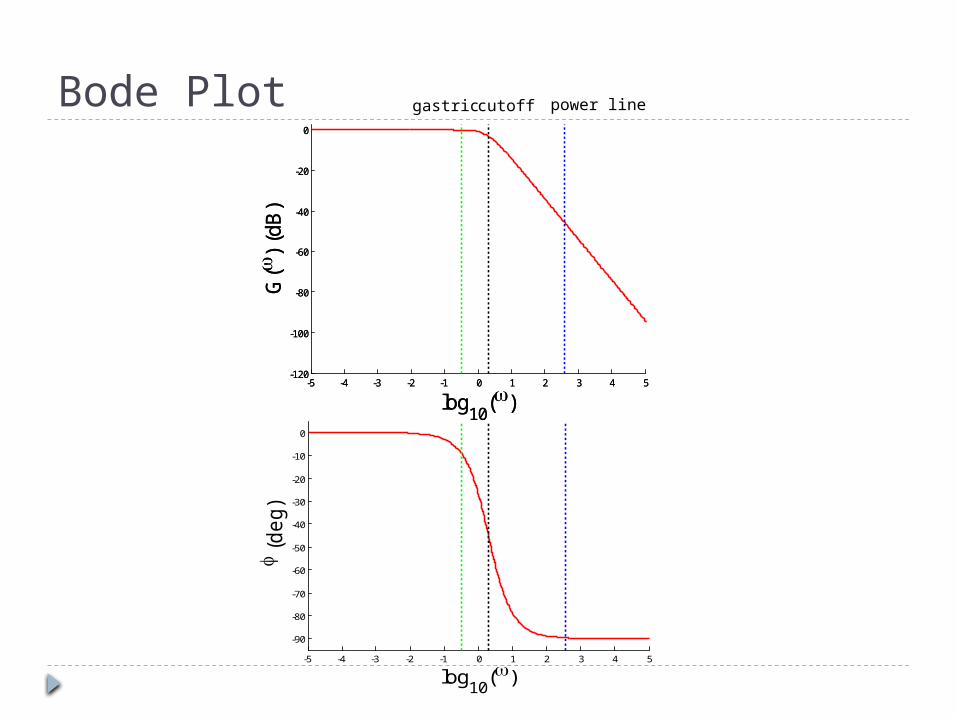
Bode Plot
-5 -4 -3 -2 -1 0 1 2 3 4 5-120
-100
-80
-60
-40
-20
0
log10
()
G(
) (d
B)
-5 -4 -3 -2 -1 0 1 2 3 4 5-120
-100
-80
-60
-40
-20
0
log10
()
G(
) (d
B)
-5 -4 -3 -2 -1 0 1 2 3 4 5
-90
-80
-70
-60
-50
-40
-30
-20
-10
0
log10
()
(d
eg)
gastric power linecutoff

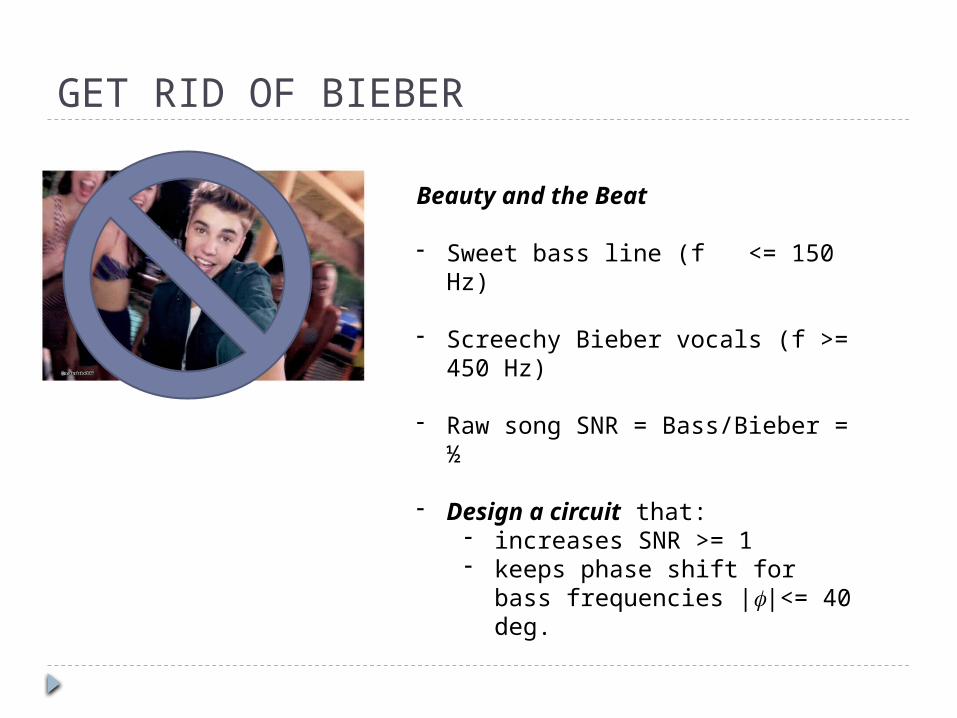
GET RID OF BIEBER
Beauty and the Beat
- Sweet bass line (f <= 150 Hz)
- Screechy Bieber vocals (f >= 450 Hz)
- Raw song SNR = Bass/Bieber = ½
- Design a circuit that:- increases SNR >= 1- keeps phase shift for bass
frequencies |f|<= 40 deg.