philippine commercial capital, inc. · reyes tacandong & co. is a member of the rsm network....
TRANSCRIPT

With independent auditors’ report provided by
REYES TACANDONG & CO. FIRM PRINCIPLES. WISE SOLUTIONS.
Philippine Commercial Capital, Inc. (A Wholly‐owned Subsidiary of Hortivellum Property
Holdings, Inc.)
Financial Statements
December 31, 2019 and 2018

Reyes Tacandong & Co. is a member of the RSM network. Each member of the RSM network is an independent accounting and consulting firm, and practices in its own right. The RSM network is not itself a separate legal entity of any description in any jurisdiction.
INDEPENDENT AUDITORS’ REPORT
The Stockholders and Board of Directors Philippine Commercial Capital, Inc.
Opinion
We have audited the accompanying financial statements of Philippine Commercial Capital, Inc. (the Company), a wholly‐owned subsidiary of Hortivellum Property Holdings, Inc., which comprise the statements of financial position as at December 31, 2019 and 2018 and the statements of comprehensive income, statements of changes in equity and statements of cash flows for the years then ended, and notes to financial statements, including a summary of significant accounting policies. In our opinion, the financial statements present fairly, in all material respects, the financial position of the Company as at December 31, 2019 and 2018, and its financial performance and its cash flows for the years then ended in accordance with Philippine Financial Reporting Standards (PFRS).
Basis for Opinion
We conducted our audits in accordance with Philippine Standards on Auditing (PSA). Our responsibilities under those standards are further described in the Auditors’ Responsibilities for the Audit of the Financial Statements section of our report. We are independent of the Company in accordance with the Code of Ethics for Professional Accountants in the Philippines (Code of Ethics) together with the ethical requirements that are relevant to the audit of the financial statements in the Philippines, and we have fulfilled our other ethical responsibilities in accordance with these requirements and the Code of Ethics. We believe that the audit evidence we have obtained is sufficient and appropriate to provide a basis for our opinion.
Responsibilities of Management and Those Charged with Governance for the Financial Statements
Management is responsible for the preparation and fair presentation of the financial statements in accordance with PFRS, and for such internal control as management determines is necessary to enable the preparation of the financial statements that are free from material misstatement, whether due to fraud or error.
BOA/PRC Accreditation No. 4782 October 4, 2018, valid until August 15, 2021
SEC Accreditation No. 0207-FR-3 (Group A) August 29, 2019, valid until August 28, 2022
Citibank Tower 8741 Paseo de Roxas Makati City 1226 Philippines Phone : +632 8 982 9100 Fax : +632 8 982 9111 Website : www.reyestacandong.com

‐ 2 ‐
In preparing the financial statements, management is responsible for assessing the Company’s ability to continue as a going concern, disclosing, as applicable, matters related to going concern and using the going concern basis of accounting unless management either intends to liquidate the Company or to cease operations, or has no realistic alternative but to do so. Those charged with governance are responsible for overseeing the Company’s financial reporting process. Auditors’ Responsibilities for the Audit of the Financial Statements Our objectives are to obtain reasonable assurance about whether the financial statements as a whole are free from material misstatement, whether due to fraud or error, and to issue an auditors’ report that includes our opinion. Reasonable assurance is a high level of assurance, but is not a guarantee that an audit conducted in accordance with PSA will always detect a material misstatement when it exists. Misstatements can arise from fraud or error and are considered material if, individually or in the aggregate, these could reasonably be expected to influence the economic decisions of users taken on the basis of the financial statements. As part of an audit in accordance with PSA, we exercise professional judgment and maintain professional skepticism throughout the audit. We also:
Identify and assesses the risks of material misstatement of the financial statements, whether due to
fraud or error, design and perform audit procedures responsive to those risks, and obtain audit evidence that is sufficient and appropriate to provide a basis for our opinion. The risk of not detecting a material misstatement resulting from fraud is higher than for one resulting from error, as fraud may involve collusion, forgery, intentional omissions, misrepresentations, or the override of internal control.
Obtain an understanding of internal control relevant to the audit in order to design audit procedures that are appropriate in the circumstances, but not for the purpose of expressing an opinion on the effectiveness of the Company’s internal control.
Evaluate the appropriateness of accounting policies used and the reasonableness of accounting estimates and related disclosures made by management.
Conclude on the appropriateness of management’s use of the going concern basis of accounting and, based on the audit evidence obtained, whether a material uncertainty exists related to events or conditions that may cast significant doubt on the Company’s ability to continue as a going concern. If we conclude that a material uncertainty exists, we are required to draw attention in our auditors’ report to the related disclosures in the financial statements or, if such disclosures are inadequate, to modify our opinion. Our conclusions are based on the audit evidence obtained up to the date of our auditors’ report. However, future events or conditions may cause the Company to cease to continue as a going concern.
Evaluate the overall presentation, structure and content of the financial statements, including the disclosures, and whether the financial statements represent the underlying transactions and events in a manner that achieves fair presentation.

‐ 3 ‐
We communicate with those charged with governance regarding, among other matters, the planned scope and timing of the audit and significant audit findings, including any significant deficiencies in internal control that we identify during our audits.
REYES TACANDONG & CO. HAYDEE M. REYES Partner CPA Certificate No. 83522 Tax Identification No. 102‐095‐265‐000 BOA Accreditation No. 4782; Valid until August 15, 2021 SEC Accreditation No. 0663‐AR‐3 Group A Valid until August 30, 2020 BIR Accreditation No. 08‐005144‐006‐2019 Valid until October 20, 2022 PTR No. 8116475 Issued January 6, 2020, Makati City
April 3, 2020 Makati City, Metro Manila

PHILIPPINE COMMERCIAL CAPITAL, INC. (A Wholly‐owned Subsidiary of Hortivellum Property Holdings, Inc.)
STATEMENTS OF FINANCIAL POSITION
December 31
Note 2019 2018
ASSETS Cash and Cash Equivalents 6 P=116,859,478 P=32,365,167 Investment Securities 7 341,506,148 411,729,293 Receivables 8 13,999,903 8,287,510 Property and Equipment 9 63,934,143 65,955,130 Retirement Asset 14 12,508,089 16,134,210 Other Assets 10 18,529,785 17,869,643
P=567,337,546 P=552,340,953
LIABILITIES AND EQUITY Liabilities
Bills Payable 11 P=154,992,496 P=157,054,540
Accounts Payable and Other Liabilities 12 29,798,093 30,213,838
Deferred Tax Liabilities 16 18,018,467 20,164,751
Total Liabilities 202,809,056 207,433,129
Equity Capital Stock 4 485,666,700 485,666,700 Additional Paid‐in Capital 4 76,984 76,984 Treasury Stock ‐ at cost 4 (32,573,600) (32,573,600) Deficit 4 (108,419,924) (126,215,803) Other Equity Reserves 19,778,330 17,953,543
Total Equity 364,528,490 344,907,824
P=567,337,546 P=552,340,953
See accompanying Notes to the Financial Statements.

PHILIPPINE COMMERCIAL CAPITAL, INC. (A Wholly‐owned Subsidiary of Hortivellum Property Holdings, Inc.)
STATEMENTS OF COMPREHENSIVE INCOME
Years Ended December 31
Note 2019 2018
REVENUE Commission and underwriting fees P=62,686,779 P=91,579,809 Interest 6,7,8 18,897,969 18,763,217 Dividend 7 2,364,374 870,940
83,949,122 111,213,966
INTEREST EXPENSE ON BILLS PAYABLE 11 (7,915,547) (26,613,623)
OTHER INCOME (CHARGES) Net trading gains (losses) from investment securities 7 13,624,261 (3,394,384) Loss on sale of assets 13 – (169,477,180) Reversal of allowance for impairment losses on receivables 8 – 7,567,356 Others ‐ net (93,821) (20,153)
13,530,440 (165,324,361)
OPERATING EXPENSES Compensation and employee benefits 28,929,080 26,071,866 Management and professional fees 10,031,024 13,614,007 Representation and entertainment 9,880,973 3,790,695 Taxes and licenses 6,782,141 21,537,152 Depreciation 9 5,138,392 3,047,167 Occupancy 4,111,017 5,245,178 Transportation and travel 1,912,577 2,287,369 Membership fees and dues 1,433,420 788,983 Communication 1,063,803 1,040,482 Others 2,390,769 2,321,018
71,673,196 79,743,917
INCOME (LOSS) BEFORE INCOME TAX 17,890,819 (160,467,935)
INCOME TAX EXPENSE (BENEFIT) 16 Current 5,826,955 16,680,602 Deferred (2,083,331) (682,236)
3,743,624 15,998,366
NET INCOME (LOSS) 14,147,195 (176,466,301)
OTHER COMPREHENSIVE INCOME Item that may be reclassified subsequently to profit or loss‐ Net unrealized gains (losses) on fair value changes of
investment securities 7 4,378,866 (2,823,510) Items that may not be reclassified to profit or loss: Revaluation increase, net of deferred tax 9 – 37,034,179 Remeasurement loss of retirement asset, net of
deferred tax 14 – (1,234,382)
4,378,866 32,976,287
TOTAL COMPREHENSIVE INCOME (LOSS) P=18,526,061 (P=143,490,014)
See accompanying Notes to the Financial Statements.

PHILIPPINE COMMERCIAL CAPITAL, INC. (A Wholly‐owned Subsidiary of Hortivellum Property Holdings, Inc.)
STATEMENTS OF CHANGES IN EQUITY
Years Ended December 31
Note 2019 2018
CAPITAL STOCK 4 P=485,666,700 P=485,666,700
ADDITIONAL PAID‐IN CAPITAL 4 76,984 76,984
TREASURY STOCK ‐ at cost 4 (32,573,600) (32,573,600)
RETAINED EARNINGS (DEFICIT) Balance at beginning of year (126,215,803) 48,426,156 Net income (loss) 14,147,195 (176,466,301) Transfer of revaluation increment through depreciation 9 3,648,684 1,824,342
Balance at end of year (108,419,924) (126,215,803)
OTHER EQUITY RESERVES Revaluation Surplus 9 Balance at beginning of year 35,757,140 – Revaluation increase – 37,034,179 Transfer of revaluation increment through depreciation,
net of deferred tax (2,554,079) (1,277,039)
Balance at end of year 33,203,061 35,757,140
Cumulative Remeasurement Losses on
Retirement Asset 14 Balance at beginning of year (9,884,755) (8,650,373) Net remeasurement loss – (1,234,382)
Balance at end of year (9,884,755) (9,884,755)
Cumulative Unrealized Losses on Investment Securities 7 Balance at beginning of year (7,918,842) (5,095,332) Unrealized gain (loss) on valuation 4,378,866 (2,823,510)
Balance at end of year (3,539,976) (7,918,842)
19,778,330 17,953,543
P=364,528,490 P=344,907,824
See accompanying Notes to the Financial Statements.

PHILIPPINE COMMERCIAL CAPITAL, INC. (A Wholly‐owned Subsidiary of Hortivellum Property Holdings, Inc.)
STATEMENTS OF CASH FLOWS
Years Ended December 31
Note 2019 2018
CASH FLOWS FROM OPERATING ACTIVITIES Income (loss) before income tax P=17,890,819 (P=160,467,935) Adjustments for:
Interest income 6,7,8 (18,897,969) (18,763,217) Net trading losses (gains) from investment securities 7 (13,624,261) 3,394,384 Interest expense 11 7,915,547 26,613,623 Depreciation 9 5,138,392 3,047,167 Retirement benefits 14 3,626,121 2,767,020 Dividend 7 (2,364,374) (870,940) Loss (gain) on sale of:
Investments in subsidiaries 13 – 145,486,637 Investment properties 13 – 64,138,248 Asset held for sale 13 – (40,147,705)
Reversal of allowance for impairment losses on receivables 8 – (7,567,356)
Operating income (loss) before working capital changes (315,725) 17,629,926 Decrease (increase) in:
Financial assets at fair value through profit or loss (78,942,797) 185,423,855 Receivables (4,711,298) 19,085,322 Other assets (1,676,523) 3,516,369
Decrease in: Bills payable (2,062,044) (634,486,165) Accounts payable and other liabilities (34,592) (19,904,770)
Net cash used for operations (87,742,979) (428,735,463) Interest received 17,896,874 19,647,697 Interest paid (8,296,700) (29,882,387) Final taxes paid 16 (3,778,922) (15,648,950) Retirement benefits paid 14 – (492,898)
Net cash used in operating activities (81,921,727) (455,112,001)
CASH FLOWS FROM INVESTING ACTIVITIES Proceeds from disposal of:
Financial assets fair value through other comprehensive income 7 1,049,388,482 –
Asset held for sale 13 – 332,320,002 Investments in subsidiaries 17 – 32,000,000 Investment properties 17 – 27,800,000
Additions to: Financial assets fair value through other
comprehensive income 7 (882,219,413) (59,602,306) Property and equipment 9 (3,117,405) (26,755)
Dividends received 2,364,374 870,940
Net cash provided by investing activities 166,416,038 333,361,881
NET INCREASE (DECREASE) IN CASH AND CASH EQUIVALENTS 84,494,311 (121,750,120)
CASH AND CASH EQUIVALENTS AT BEGINNING OF YEAR 32,365,167 154,115,287
CASH AND CASH EQUIVALENTS AT END OF YEAR 6 P=116,859,478 P=32,365,167
See accompanying Notes to the Financial Statements.

PHILIPPINE COMMERCIAL CAPITAL, INC. (A Wholly‐owned Subsidiary of Hortivellum Property Holdings, Inc.)
NOTES TO FINANCIAL STATEMENTS
1. Corporate Information Philippine Commercial Capital, Inc. (PCCI or the Company) was incorporated in the Philippines and registered with the Securities and Exchange Commission (SEC) on September 23, 1975. The Company is primarily engaged in trading and brokering of commercial papers and government securities, and investment advisory services. In 1986, the Company was granted by the SEC a license to operate as an investment house, to engage in the underwriting of privately or publicly issued securities. In 1992, the Company was granted by the Bangko Sentral ng Pilipinas (BSP) a license to engage in trust and other fiduciary activities. On July 13, 2018, Hortivellum Property Holdings, Inc. (HPHI or the Parent Company), a financial holding entity incorporated in the Philippines, acquired 100% ownership of the Company. The registered office address of the Company is at 6th Floor, PCCI Corporate Center, 118 L.P. Leviste St., Salcedo Village, Makati City. Disposal of Subsidiaries On July 13, 2018, the Company entered into a Deed of Sale with the major stockholder and with Rhinefield Holdings, Inc. (RHI, a wholly‐owned subsidiary) for the sale of all of its subsidiaries for an aggregate amount of P=32.0 million. The disposal of the foregoing wholly owned subsidiaries resulted to a loss of P=145.5 million. On the same date, the Company has also entered into a Deed of Sale with Januarius Holdings, Inc. for the sale of its investment in Ampersand Capital Incorporated (ACI), a wholly‐owned subsidiary classified as “Asset held for sale”, for a total consideration of P=332.3 million. The sale resulted to a gain amounting to P=40.1 million. Approval of Financial Statements The accompanying financial statements of the Company as at and for the years ended December 31, 2019 and 2018 were approved and authorized for issue by the Board of Directors (BOD) on April 3, 2020.
2. Summary of Significant Accounting Policies
Basis of Preparation and Statement of Compliance The financial statements have been prepared in accordance with the Philippine Financial Reporting Standards (PFRS) issued by the Philippine Financial Reporting Standards Council and adopted by the SEC. This financial reporting framework includes PFRS, Philippine Accounting Standards (PAS) and Philippine Interpretations from International Financial Reporting Interpretations Committee (IFRIC), including the SEC provisions. Measurement Bases The financial statements are presented in Philippine Peso (Peso), which is the functional and presentation currency of the Company. All amounts are in absolute values, unless otherwise stated.

‐ 2 ‐
The Company presents its statement of financial position broadly in the order of liquidity. An analysis of recoveries or settlements within 12 months (current) and more than 12 months (noncurrent) after the reporting date is presented in Note 15, Maturity Analysis of Assets and Liabilities. The financial statements of the Company have been prepared on a historical cost basis, except for:
investment securities classified as financial assets measured at fair value through profit or loss (FVPL) and fair value through other comprehensive income (FVOCI);
condominium unit presented under “Property and equipment” account that is carried at revalued amount; and
retirement asset that is carried at fair value of plan assets less the present value of defined benefit obligation.
Historical cost is generally based on the fair value of the consideration given in exchange for an asset and fair value of the consideration received in exchange for incurring a liability. Fair value is the price that would be received to sell an asset or paid to transfer a liability in an orderly transaction between market participants at the measurement date. A fair value measurement of a nonfinancial asset considers a market participant’s ability to generate economic benefits by using the asset at its highest and best use or by selling to another market participant who would use the asset in its highest and best use. The Company uses valuation techniques that are appropriate in the circumstances and for which sufficient data are available to measure fair value, maximizing the use of relevant observable inputs and minimizing the use of unobservable inputs.
All assets and liabilities for which fair value is measured or disclosed in the financial statements are categorized within the fair value hierarchy, described as follows, based on the lowest level input that is significant to the fair value measurement as a whole:
Level 1 ‐ quoted (unadjusted) market prices in active market for identical assets or liabilities;
Level 2 ‐ valuation techniques for which the lowest level input that is significant to the fair value measurement is directly or indirectly observable;
Level 3 ‐ valuation techniques for which the lowest level input that is significant to the fair value measurement is unobservable.
For assets and liabilities that are recognized in the financial statements on a recurring basis, the Company determines whether transfers have occurred between levels in the hierarchy by re‐assessing categorization (based on the lowest level input that is significant to the fair value measurement as a whole) at the end of each reporting year. For the purpose of fair value disclosures, the Company has determined classes of assets and liabilities on the basis of the nature, characteristics and risks of the asset or liability and the level of the fair value hierarchy as explained in the foregoing.

‐ 3 ‐
Further information about the assumptions made in measuring fair value is included in Note 5, Fair Value Measurement. Adoption of New and Amended PFRS The accounting policies adopted are consistent with those of the previous financial year, except for the adoption of the following new and amended PFRS effective January 1, 2019.
Amendments to PFRS 9, Financial Instruments – Prepayment Features with Negative Compensation – The amendments clarify that a financial asset passes the “solely payments of principal and interest” criterion regardless of an event or circumstance that causes the early termination of the contract and irrespective of which party pays or receives reasonable compensation for the early termination of the contract. Consequently, financial assets with termination provisions can now be measured at amortized cost or, depending on the business model, at FVOCI.
Philippine Interpretation IFRIC 23, Uncertainty Over Income Tax Treatments – The interpretation provides guidance on how to reflect the effects of uncertainty in accounting for income taxes under PAS 12, Income Taxes, in particular (i) matters to be considered in accounting for uncertain tax treatments separately, (ii) assumptions for taxation authorities’ examinations, (iii) determinants of taxable profit (tax loss), tax bases, unused tax losses, unused tax credits and tax rates, and (iv) effect of changes in facts and circumstances.
Amendments to PAS 19, Employee Benefits ‐ Plan Amendment, Curtailment or Settlement – The amendments specify how companies remeasure a defined benefit plan when a change ‐ an amendment, curtailment or settlement ‐ to a plan takes place during a reporting period. It requires entities to use the updated assumptions from this remeasurement to determine current service cost and net interest cost for the remainder of the reporting period after the change to the plan.
The adoption of the foregoing new and amended PFRS did not have any material effect on the financial statements of the Company. Additional disclosures were included in the financial statements, as applicable.
Amended PFRS Issued But Not Yet Effective Relevant amended PFRS, which are not yet effective as at December 31, 2019 and have not been applied in preparing the financial statements, are summarized below. Effective for annual periods beginning on or after January 1, 2020:
Amendments to References to the Conceptual Framework in PFRS – The amendments include a new chapter on measurement; guidance on reporting financial performance; improved definitions and guidance–in particular the definition of a liability; and clarifications in important areas, such as the roles of stewardship, prudence and measurements uncertainty in financial reporting. The amendments should be applied retrospectively unless retrospective application would be impracticable or involve undue cost or effort.

‐ 4 ‐
Amendments to PFRS 3 ‐ Definition of a Business – This amendment provides a new definition of a “business” which emphasizes that the output of a business is to provide goods and services to customers, whereas the previous definition focused on returns in the form of dividends, lower costs or other economic benefits to investors and others. To be considered a business, ‘an integrated set of activities and assets’ must now include ‘an input and a substantive process that together significantly contribute to the ability to create an output’. The distinction is important because an acquirer may recognize goodwill (or a bargain purchase) when acquiring a business but not a group of assets. An optional simplified assessment (the concentration test) has been introduced to help companies determine whether an acquisition is of a business or a group of assets.
Amendments to PAS 1, Presentation of Financial Statements and PAS 8, Accounting Policies, Changes in Accounting Estimates and Errors ‐ Definition of Material – The amendments clarify the definition of “material” and how it should be applied by companies in making materiality judgments. The amendments ensure that the new definition is consistent across all PFRS. Based on the new definition, an information is “material” if omitting, misstating or obscuring it could reasonably be expected to influence the decisions that the primary users of general purpose financial statements make on the basis of those financial statements.
Under prevailing circumstances, the adoption of the foregoing amended PFRS is not expected to have any material effect on the financial statements of the Company. Additional disclosures will be included in the financial statements, as applicable.
Financial Instruments Date of Recognition. The Company recognizes a financial asset or liability in the statement of financial position when the Company becomes a party to the contractual provisions of a financial instrument. In the case of a regular way purchase or sale of financial assets, recognition and derecognition, as applicable, is done using trade date accounting. Initial Recognition and Measurement. Financial instruments are recognized initially at fair value, which is the fair value of the consideration given (in case of an asset) or received (in case of a liability). The initial measurement of financial instruments, except for those designated at FVPL, includes transaction cost. “Day 1” Difference. Where the transaction in a non‐active market is different from the fair value of other observable current market transactions in the same instrument or based on a valuation technique whose variables include only data from observable market, the Company recognizes the difference between the transaction price and fair value (a “Day 1” difference) in profit or loss. In cases where there is no observable data on inception, the Company deems the transaction price as the best estimate of fair value and recognizes “Day 1” difference in profit or loss when the inputs become observable or when the instrument is derecognized. For each transaction, the Company determines the appropriate method of recognizing the “Day 1” difference. Financial Assets Classification. The Company classifies its financial assets at initial recognition under the following categories: (a) financial assets at FVPL, (b) financial assets at amortized cost and (c) financial assets at FVOCI. The classification of a financial instrument largely depends on the Company’s business model and its contractual cash flow characteristics.

‐ 5 ‐
Financial Assets at FVPL. Financial assets that do not meet the criteria for being measured at amortized cost or FVOCI are classified under this category. Specifically, financial assets at FVPL include financial assets that are (a) held for trading, (b) designated upon initial recognition at FVPL, or (c) mandatorily required to be measured at fair value. Financial assets are classified as held for trading if these are acquired for the purpose of selling or repurchasing in the near term. Derivatives, including separated embedded derivatives, are also classified as held for trading unless these are designated as effective hedging instruments. Financial assets with cash flows that are not solely payments of principal and interest are classified and measured at FVPL, irrespective of the business model. Notwithstanding the criteria for debt instruments to be classified at amortized cost or at FVOCI, debt instruments may be designated at FVPL on initial recognition if doing so eliminates, or significantly reduces, an accounting mismatch. Financial assets at FVPL are measured at fair value at each reporting date, with any fair value gains or losses recognized in profit or loss. As at December 31, 2019 and 2018, certain government securities and corporate notes are included in this category. Financial Assets at Amortized Cost. Financial assets should be measured at amortized cost if both of the following conditions are met:
the financial asset is held within a business model whose objective is to hold financial assets in order to collect contractual cash flows; and
the contractual terms of the financial asset give rise, on specified dates, to cash flows that are solely payments of principal and interest on the principal amount outstanding.
After initial recognition, financial assets at amortized cost are subsequently measured at amortized cost using the effective interest method, less any allowance for impairment. Amortized cost is calculated by taking into account any discount or premium on acquisition and fees that are an integral part of the effective interest rate. Gains and losses are recognized in profit or loss when the financial assets are derecognized, impaired and through amortization process. As at December 31, 2019 and 2018, cash and cash equivalents and receivables are classified under this category. Cash and cash equivalents include cash in bank and short‐term placements with original maturities of three months or less that were readily convertible to known amounts of cash and which are subject to an insignificant risk of changes in value. Financial Assets at FVOCI (Debt Securities). Debt securities that are not designated at FVPL under the fair value option should be measured at FVOCI if both of the following conditions are met:
the financial asset is held within a business model whose objective is to hold financial assets in order to collect contractual cash flows and selling the financial assets; and
the contractual terms of the financial asset give rise, on specified dates, to cash flows that are solely payments of principal and interest on the principal amount outstanding.
‐ 6 ‐
Debt securities at FVOCI are subsequently measured at fair value with unrealized gains and losses arising from fair valuation recognized in other comprehensive income. Interest income (calculated using the effective interest rate method), foreign currency gains or losses and impairment losses of debt securities measured at FVOCI are recognized directly in profit or loss. When the financial asset is derecognized, the cumulative gains or losses previously recognized in other comprehensive income are reclassified from equity to profit or loss as a reclassification adjustment.
Investments in government securities are included under this category.
Equity Instruments Designated at FVOCI. On initial recognition, equity instruments that are not held for trading may be irrevocably designated as a financial asset to be measured at FVOCI. Dividends from equity instruments held at FVOCI are recognized in profit or loss when the right to receive payment is established, unless the dividend clearly represents a recovery of part of the cost of the investment. Foreign currency gains or losses and unrealized gains or losses from equity instruments are recognized in other comprehensive income and presented in the equity section of the statements of financial position. These fair value changes are recognized in equity and are not reclassified to profit or loss in subsequent periods. Unquoted equity securities are included in this category.
Reclassification The Company reclassifies its financial assets when, and only when, it changes its business model for managing those financial assets. The reclassification is applied prospectively from the first day of the first reporting period following the change in the business model (reclassification date).
For a financial asset reclassified out of the financial assets at amortized cost category to financial assets at FVPL, any gain or loss arising from the difference between the previous amortized cost of the financial asset and fair value is recognized in profit or loss.
For a financial asset reclassified out of the financial assets at amortized cost category to financial assets at FVOCI, any gain or loss arising from a difference between the previous amortized cost of the financial asset and fair value is recognized in other comprehensive income. For a financial asset reclassified out of the financial assets at FVPL category to financial assets at amortized cost, its fair value at the reclassification date becomes its new gross carrying amount. For a financial asset reclassified out of the financial assets at FVOCI category to financial assets at amortized cost, the financial asset is reclassified at its fair value at the reclassification date, and the cumulative gain or loss previously recognized in other comprehensive income is removed from equity and adjusted against the fair value of the financial asset at the reclassification date. For a financial asset reclassified out of the financial assets at FVPL category to financial assets at FVOCI, its fair value at the reclassification date becomes its new gross carrying amount. Meanwhile, for a financial asset reclassified out of the financial assets at FVOCI category to financial assets at FVPL, the cumulative gain or loss previously recognized in other comprehensive income is reclassified from equity to profit or loss as a reclassification adjustment at the reclassification date.

‐ 7 ‐
Equity instruments designated at FVOCI may no longer be reclassified to a different category. Impairment of Financial Assets The Company recognizes an allowance for expected credit loss (ECL) for all debt instruments not measured at FVPL. ECL is based on the difference between the contractual cash flows due in accordance with the contract and all the cash flows that the Company expects to receive. The difference is then discounted at an approximation to the asset’s original effective interest rate.
The Company measures loss allowances at an amount equivalent to the 12‐month ECL for debt instruments on which credit risk has not increased significantly since initial recognition or that are determined to have low credit risk at reporting date.
The 12‐month ECL is the portion of ECL that results from default events on a financial instrument that are possible within the 12 months after the reporting date. Financial instruments for which a 12‐month ECL is recognized are referred to as “Stage 1 financial instruments.” However, when there has been a significant increase in credit risk since initial recognition, the allowance will be based on the lifetime ECL. Lifetime ECL are the ECL that result from all possible default events over the expected life of the financial instrument. Financial instruments for which a lifetime ECL is recognized but which are not credit‐impaired are referred to as “Stage 2 financial instruments.” When determining whether the credit risk of a financial asset has increased significantly since initial recognition, the Company compares the risk of a default occurring on the financial instrument as at the reporting date with the risk of a default occurring on the financial instrument as at the date of initial recognition and consider reasonable and supportable information, that is available without undue cost or effort, that is indicative of significant increases in credit risk since initial recognition. The Company’s assessment of significant increase in credit risk involves looking at both the quantitative and qualitative elements, as well as if the credit exposure is unpaid for at least 30 days. At each reporting date, the Company assesses whether financial assets carried at amortized cost are credit‐impaired (referred to as “Stage 3 financial assets”). A financial asset is ‘credit‐impaired’ when one or more events that have a detrimental impact on the estimated future cash flows of the financial asset have occurred. ECL for credit‐impaired financial assets is based on the difference between the gross carrying amount and present value of estimated future cash flows. Financial assets are written off when there is no reasonable expectation of recovering the financial asset in its entirety or a portion thereof. This is generally the case when the Company determines that the counterparty does not have assets or sources of income that could generate sufficient cash flows to repay the amounts subject to the write‐off. This assessment is carried out at the individual asset level. Derecognition of Financial Assets A financial asset (or where applicable, a part of a financial asset or part of a group of similar financial assets) is derecognized when:
the right to receive cash flows from the asset has expired;
the Company retains the right to receive cash flows from the financial asset, but has assumed an obligation to pay them in full without material delay to a third party under a “pass‐through” arrangement; or

‐ 8 ‐
the Company has transferred its right to receive cash flows from the financial asset and either (a) has transferred substantially all the risks and rewards of the asset, or (b) has neither transferred nor retained substantially all the risks and rewards of the asset, but has transferred control of the asset.
When the Company has transferred its right to receive cash flows from a financial asset or has entered into a pass‐through arrangement, and has neither transferred nor retained substantially all the risks and rewards of ownership of the financial asset nor transferred control of the financial asset, the financial asset is recognized to the extent of the Company’s continuing involvement in the financial asset. Continuing involvement that takes the form of a guarantee over the transferred financial asset is measured at the lower of the original carrying amount of the financial asset and the maximum amount of consideration that the Company could be required to repay. Financial Liabilities Classification. The Company classifies its financial liabilities at initial recognition under the following categories: (a) financial liabilities at amortized cost and (b) financial liabilities at FVPL. As at reporting date, the Company does not have financial liabilities at FVPL.
Financial Liabilities at Amortized Cost. Financial liabilities are categorized as financial liabilities at amortized cost when the substance of the contractual arrangement results in the Company having an obligation either to deliver cash or another financial asset to the holder, or to settle the obligation other than by the exchange of a fixed amount of cash or another financial asset for a fixed number of its own equity instruments.
These financial liabilities are initially recognized at fair value less any directly attributable transaction costs. After initial recognition, these financial liabilities are subsequently measured at amortized cost using the effective interest method. Amortized cost is calculated by taking into account any discount or premium on the issue and fees that are an integral part of the effective interest rate. Gains and losses are recognized in profit or loss when the liabilities are derecognized or through the amortization process.
Bills payable and accounts payable and other liabilities (excluding statutory payables) are included under this category. Classification of Financial Instrument between Liability and Equity A financial instrument is classified as liability if it provides for a contractual obligation to:
Deliver cash or another financial asset to another entity;
Exchange financial assets or financial liabilities with another entity under conditions that are potentially unfavorable to the Company; or
Satisfy the obligation other than by the exchange of a fixed amount of cash or another financial asset for a fixed number of own equity shares.
If the Company does not have an unconditional right to avoid delivering cash or another financial asset to settle its contractual obligation, the obligation meets the definition of a financial liability.

‐ 9 ‐
Derecognition of Financial Liabilities A financial liability is derecognized when the obligation under the liability is discharged, cancelled or has expired. When an existing financial liability is replaced by another from the same lender on substantially different terms, or the terms of an existing liability are substantially modified, such an exchange or modification is treated as a derecognition of the original liability and the recognition of a new liability, and the difference in the respective carrying amounts is recognized in profit or loss. Offsetting of Financial Assets and Liabilities Financial assets and liabilities are offset and the net amount is reported in the statement of financial position if, and only if, there is a currently enforceable legal right to offset the recognized amounts and there is intention to settle on a net basis, or to realize the asset and settle the liability simultaneously. This is not generally the case with master netting agreements, and the related assets and liabilities are presented gross in the statement of financial position.
Property and Equipment Property and equipment (except for condominium unit which is stated at revalued amount, as determined by an independent firm of appraisers) are stated at costs less accumulated depreciation and any impairment losses. The initial cost of property and equipment consists of its purchase price, including import duties, nonrefundable taxes and any directly attributable costs in bringing the asset to its working condition and location for its intended use. Expenditures incurred after the property and equipment have been put into operations, such as repairs and maintenance, are normally charged to profit or loss in the year when the costs are incurred. In situations where it can be clearly demonstrated that the expenditures have resulted in an increase in the future economic benefits expected to be obtained from the use of an item of property and equipment beyond its originally assessed standard of performance, the expenditures are capitalized as additional cost of property and equipment. The cost of replacing a part of the property and equipment is capitalized when that cost is incurred and all the relevant asset recognition criteria are met. The carrying amount of a part of an item of property and equipment that has been replaced is derecognized.
In 2018, the Company adopted the revaluation model in measuring its condominium unit. The change in the accounting policy was applied by the Company prospectively. Under the revaluation model, condominium unit is initially recorded at cost and subsequently measured at fair value. Valuations are performed with sufficient regularity to ensure that the fair value of a revalued asset does no differ materially from its carrying amount. A revaluation increase is recorded initially in other comprehensive income and accumulated to the revaluation surplus in equity under “Other equity reserves.” However, the increase is recognized in profit or loss to the extent that it reverses a revaluation decrease of the same asset previously recognized in profit or loss. A revaluation decrease is recognized in profit or loss, except to the extent that it offsets an existing surplus on the same asset recognized in revaluation surplus in equity in which case the decrease is recognized in other comprehensive income. Transfers from revaluation surplus to retained earnings are made for the difference between depreciation based on cost and the revalued carrying amount of condominium unit.

‐ 10 ‐
Upon disposal, any revaluation surplus relating to the particular asset being sold is transferred to retained earnings. Depreciation is computed on a straight‐line basis over the estimated useful lives of the assets. The estimated useful lives of the property and equipment are as follows:
Asset Category Number of Years
Condominium unit 50 Furniture, fixtures and equipment 5 Transportation equipment 5 Building improvements 5
The estimated useful lives and depreciation method are reviewed at each reporting date to ensure that these are consistent with the expected pattern of economic benefits from items of property and equipment. Fully depreciated assets are retained in the accounts until these are no longer in use and no further charge for depreciation is made in respect of those assets. When an asset is disposed of, or is permanently withdrawn from use and no future economic benefits are expected from its disposal, the cost and accumulated depreciation and impairment are removed from the accounts and any resulting gain or loss arising from the retirement or disposal is recognized in profit or loss.
Other Assets Other assets mainly include creditable withholding tax (CWT). CWT. CWT represents the amount withheld by the Company’s customers in relation to its income. CWT can be utilized as payment for income taxes provided that these are properly supported by certificates of creditable tax withheld at source subject to the rules on Philippine income taxation. Excess CWT is carried forward to be utilized in succeeding years. Impairment of Nonfinancial Assets The carrying amounts of nonfinancial assets are reviewed for impairment when events or changes in circumstances indicate that the carrying amount may not be recoverable. If any such indication exists and when the carrying amounts exceed the estimated recoverable amounts, the nonfinancial assets are written down to their recoverable amounts. The recoverable amount of the asset is the greater of the fair value less cost of disposal and value in use. The fair value less cost of disposal is the amount obtainable from the sale of an asset in an arm’s length transaction less the cost of disposal. In assessing value in use, the estimated future cash flows are discounted to their present value using a pretax discount rate that reflects current market assessments of the time value of money and the risks specific to the asset. For an asset that does not generate largely independent cash inflows, the recoverable amount is determined for the cash‐generating unit to which the asset belongs. Impairment losses are recognized in profit or loss unless the asset is carried at revalued amount. An impairment loss on a revalued asset is recognized in other comprehensive income to the extent that it does not exceed the amount in the revaluation surplus for that same asset. Such an impairment loss on a revalued asset reduces the revaluation surplus for that asset.

‐ 11 ‐
An assessment is made at each reporting date as to whether there is any indication that previously recognized impairment losses may no longer exist or may have decreased. If such indication exists, the recoverable amount is estimated. A previously recognized impairment loss is reversed only if there has been a change in the estimates used to determine the asset’s recoverable amount since the last impairment loss was recognized. If that is the case, the carrying amount of the asset is increased to its recoverable amount. That increased amount cannot exceed the carrying amount that would have been determined, net of depreciation, had no impairment loss been recognized for the asset in prior years. Such reversal is recognized in profit or loss unless the asset is carried at revalued amount, in which case the reversal is treated as a revaluation increase. After such reversal, the depreciation is adjusted in future years to allocate the asset’s revised carrying amount on a systematic basis over its remaining useful life. Equity Capital Stock. Capital stock is measured at par value for all shares issued. When the shares are sold at premium, the difference between the proceeds and the par value is credited to the additional paid‐in capital in equity. Incremental costs directly attributable to the issue of common shares are recognized as a deduction from equity, net of any tax effects.
Treasury Stock. Own equity instruments which are reacquired are recognized at cost and deducted from equity. No gain or loss is recognized in the statement of comprehensive income on the purchase, sale, issue or cancellation of the Company’s own equity instruments. Any difference between the carrying amount and the consideration, if reissued, is recognized as additional paid‐in capital. Voting rights related to treasury shares are nullified for the Company and no dividends are allocated. Deficit. Deficit represents all current and prior results of operations as reported in the statement of comprehensive income reduced by the amounts of dividends declared, if any. Other Equity Reserves Other comprehensive income (loss) comprises items of income and expenses (including items previously presented under statement of changes in equity) that are not recognized in profit or loss for the year. Other comprehensive income (loss), which is presented as “Other equity reserves”, pertains to revaluation surplus, cumulative remeasurement losses on retirement assets and cumulative unrealized losses on fair value changes of investment securities. Revenue Recognition Revenue from contracts with customers is recognized when the customer obtains control of the services at an amount that reflects the consideration to which the Company expects to be entitled in exchange for those services. The Company also assesses its revenue arrangements to determine if it is acting as a principal or as an agent. The Company has assessed that it acts as a principal in all of its revenue sources, except for commissions and underwriting fees.

‐ 12 ‐
The following specific recognition criteria must also be met before revenue within the scope of PFRS 15 is recognized: Commissions and Underwriting Fees. Commissions and fees arising from providing transaction services are recognized upon completion of the transaction or over a period of time. Commissions are recorded on a trade date basis. Underwriting fees are recognized upon the completion of all underwriting services and where the Company does not have the obligation to perform additional services under the underwriting agreement.
Trust fees earned from PCCI Trust and Investment Group’s fiduciary activities are recognized over a period of time. Other Income. Other income is recognized when earned. Revenue outside the scope of PFRS 15 is recognized as follows: Interest Income. Interest income is recognized in profit or loss as the interest accrues, taking into account the effective yield of the asset. When calculating the effective interest rate, the Company estimates cash flows considering all contractual terms of the financial instrument but does not consider future credit losses. The calculation includes all fees paid or received between parties to the contract that are an integral part of the effective rate, transaction costs and all other premiums or discounts. Under PFRS 9, when a financial asset becomes credit‐impaired and is, therefore, regarded as Stage 3, the Company calculates interest income by applying the effective interest rate to the net amortized cost of the financial asset. If a financial asset cures and is no longer credit‐impaired, the Company reverts to calculating interest income on a gross basis. Dividend Income. Dividend income is recognized when the Company’s right to receive the dividends is established. Net Trading Gains (Losses) from Investment Securities. Net trading gains or losses represent results arising from trading activities including gains and losses from changes in fair value of financial assets at FVPL and realized gains or losses on disposals of investment securities. Gains (Losses) on Sale of Assets. Income or loss from sale of assets is recognized upon completion of the earning process and the collectibility of the sales price is reasonably assured. Costs and Expense Recognition Costs and expenses are recognized in profit or loss when a decrease in future economic benefit related to a decrease in an asset or an increase of a liability has arisen that can be measured reliably. Costs and expenses are recognized upon receipt of goods, utilization of services or when the costs and expenses are incurred. Interest Expense. Interest expense is recognized in profit or loss using the effective interest rate of the financial liabilities to which these relate.

‐ 13 ‐
Operating Expenses. Operating expenses constitute costs which arise in the normal business operations and are recognized when incurred. Employee Benefits Short‐term Benefits. Short‐term employee benefits given by the Company to its employees include salaries and wages, social security contributions, short‐term compensated absences, bonuses and other benefits. The Company recognizes a liability, net of amounts already paid, and an expense for services rendered by employees during the year. A liability is recognized for the amount expected to be paid if the Company has a present legal or constructive obligation to pay this amount as a result of past service provided by the employee and the obligation can be estimated reliably.
Retirement Benefits. Retirement benefit costs are actuarially determined using the projected unit credit method, which reflects services rendered by employees to the date of valuation and incorporates assumptions concerning employees’ projected salaries.
The Company recognizes service costs, comprising of current service costs, past service costs, gains and losses on curtailments and non‐routine settlements, and net interest expense or income in profit or loss. Net interest expense or income is calculated by applying the discount rate to the net retirement liability or asset. Past service costs are recognized in profit or loss on the earlier of the date of the plan amendment or curtailment and the date that the Company recognizes restructuring‐related costs. Remeasurements comprising actuarial gains and losses, return on plan assets and any change in the effect of the asset ceiling (excluding net interest on defined benefit obligation) are recognized immediately in other comprehensive income in the year in which these arise. Remeasurements are not reclassified to profit or loss in subsequent years.
The retirement asset is the aggregate of the present value of the defined benefit obligation and the fair value of plan assets out of which the obligations are to be settled directly. The present value of the retirement liability is determined by discounting the estimated future cash outflows using interest rate on government securities that have terms to maturity approximating the terms of the related retirement liability. Actuarial valuations are made with sufficient regularity so that the amounts recognized in the financial statements do not differ materially from the amounts that would be determined at the reporting date. Income Taxes Current Tax. Current tax assets and liabilities for the current and prior years are measured at the amount expected to be recovered from or paid to the tax authorities. The tax rates and the tax laws used to compute the amount are those that are enacted or substantively enacted at the end of the reporting year.

‐ 14 ‐
Deferred Tax. Deferred tax is provided on all temporary differences at the end of the reporting year between the tax bases of assets and liabilities and their carrying amounts for financial reporting purposes. Deferred tax liabilities are recognized for all taxable temporary differences. Deferred tax assets are recognized for all deductible temporary differences, carryforward of unused tax credits from the excess minimum corporate income tax (MCIT) over the regular corporate income tax (RCIT) and unused net operating loss carry over (NOLCO), to the extent that it is probable that sufficient future taxable profits will be available against which the deductible temporary differences and carryforward of unused tax credits from MCIT and unused NOLCO can be utilized. Deferred tax, however, is not recognized when it arises from the initial recognition of an asset or liability in a transaction that is not a business combination and, at the time of the transaction, affects neither the accounting profit or loss nor taxable profit or loss.
The carrying amount of deferred tax assets is reviewed at the end of each reporting year and reduced to the extent that it is no longer probable that sufficient future taxable profit will be available to allow all or part of the deferred tax assets to be utilized. Unrecognized deferred tax assets are re‐assessed at the end of each reporting year and are recognized to the extent that it has become probable that sufficient future taxable profit will allow the deferred tax asset to be recovered. Deferred tax assets and liabilities are measured at the tax rate that are expected to apply to the period when the asset is realized or the liability is settled, based on tax rate (and tax laws) that have been enacted or substantively enacted at the end of reporting year. Deferred tax assets and liabilities are offset, if a legally enforceable right exists to set off current tax assets against current tax liabilities and the deferred taxes relate to the same taxable entity and the same taxing authority. Deferred tax is recognized in profit or loss except to the extent that it relates to items recognized directly in equity as other comprehensive income. Fiduciary Activities The Company excludes from these financial statements the assets and income arising from fiduciary activities, together with related undertakings to return such assets to customer, where the Company acts in a fiduciary capacity such as a nominee, trustee or agent.
Related Party Relationship and Transactions Parties are considered to be related if one party has the ability, directly or indirectly, to control the other party or exercise significant influence over the other party in making financial and operating decisions. Parties are also considered to be related if they are subject to common control or common significant influence. A related party transaction is a transfer of resources, services or obligations between a reporting entity and a related party, regardless of whether a price is charged.

‐ 15 ‐
Foreign Currency Denominated Transactions Transactions denominated in foreign currencies are initially recorded in Peso using the exchange rate prevailing at the date of transaction. Monetary assets and liabilities denominated in foreign currencies are restated at the functional currency using the rate of exchange prevailing at the reporting date. Foreign exchange differences between the rate at transaction date and settlement date or reporting date are credited to or charged against profit or loss. Nonmonetary items that are measured in terms of historical cost in foreign currency are translated using the exchange rate at the dates of initial transactions. Provisions Provisions are recognized only when the Company has a present legal or constructive obligation as a result of a past event, it is probable that an outflow of resources embodying economic benefits will be required to settle the obligation, and a reliable estimate can be made of the amount of the obligation. If the effect of the time value of money is material, provisions are determined by discounting the expected future cash flows at a pre‐tax rate that reflects current market assessments of the time value of money and, where appropriate, the risks specific to the liability. Where discounting is used, the increase in the provision due to the passage of time is recognized as an interest expense. Provisions are reviewed at each reporting date and adjusted to reflect the current best estimate. Contingencies Contingent liabilities are not recognized in the financial statements. These are disclosed in the notes to financial statements unless the possibility of an outflow of resources embodying economic benefits is remote. Contingent assets are not recognized in the financial statements but are disclosed in the notes to financial statements when an inflow of economic benefits is probable. Events after the Reporting Year Post year‐end events that provide additional information about the Company’s financial position at reporting date (adjusting events) are reflected in the financial statements. Post year‐end events that are not adjusting events are disclosed in the notes to the financial statements when material.
3. Significant Judgments, Accounting Estimates and Assumptions The preparation of the financial statements in compliance with PFRS requires management to exercise judgment, make estimates, and use assumptions that affect amounts of assets, liabilities, income and expenses reported in the financial statements and related disclosures. The judgments, estimates and assumptions used in the financial statements are based upon management’s evaluation of relevant facts and circumstances as at the date of the financial statements. While management believes that the assumptions are reasonable and appropriate, significant differences in the actual experience or significant changes in the assumptions may materially affect the estimated amounts. Actual results could differ from such estimates.

‐ 16 ‐
Judgments In the process of applying the Company’s accounting policies, management has made the following judgments, apart from those involving estimations, which have the most significant effect on the amounts recognized in the financial statements. Determining the Classification of Financial Assets. Classification of financial assets depends on the results of the “solely payment of principal and interest” (SPPI) test and on the business model used for managing those financial assets. When performing the SPPI test, the Company applies judgment and evaluates relevant factors and characteristics such as the behavior and nature of contractual cash flows, the timing and frequency of interest rate repricing, contingent events that would alter the amount and/or timing of cash flows, prepayment or extension options and other features that may modify the consideration for the time value of money. The Company also performs business model assessment to reflect how financial assets are managed in order to generate cash flows based on the following factors:
business objectives and strategies for holding the financial assets;
performance measures and benchmarks being used to evaluate the Company’s key management personnel accountable to the financial assets;
risks associated to the financial assets and the tools applied in managing those risks;
compensation structure of business units, including whether based on fair value changes of the investments managed or on the generated cash flows from transactions; and
frequency and timing of disposals Determining the Fair Values of Financial Instruments. PFRS requires certain financial assets and liabilities to be carried at fair value. While significant components of fair value measurement were determined using verifiable objective evidence, the amount of changes in fair value would differ if the Company utilized different valuation methodologies. Any changes in fair value of these financial assets would affect profit or loss and equity. When the fair values of financial assets and liabilities recognized or disclosed in the financial statements cannot be derived from the active market, the fair values are determined using internal valuation techniques that include the use of mathematical models. The inputs to these models are taken from observable market where possible, but where this is not feasible, a degree of judgment is required in establishing fair values. The fair values of the financial instruments are disclosed in Note 5. Accounting Estimates and Assumptions The key assumptions concerning the future and other key sources of estimation uncertainty at the financial reporting date, that have a significant risk of causing a material adjustment to the carrying amounts of assets and liabilities within the next financial year are discussed below. Assessing Credit Losses on Financial Assets. In assessing ECL, the Company uses historical experience adjusted for forward‐looking factors, as appropriate. The Company has no historical loss experience since investment in debt securities are determined to have credit risk rating equivalent to “investment grade”, and thus, have a low credit risk at the reporting date.

‐ 17 ‐
The Company assessed that the credit risk on other financial assets measured at amortized cost has not increased significantly since initial recognition. No provision for impairment losses on financial assets was recognized in 2019 and 2018. The carrying amounts of financial asset and the information on credit quality and impairment assessment made on these financial assets is disclosed in Note 4, Financial Risk and Capital Management Objectives and Policies. Assessing the Impairment of Nonfinancial Assets. The Company assesses impairment on property and equipment and other assets whenever events or changes in circumstances indicate that the carrying amount of these assets may not be recoverable. The relevant factors that the Company considers in deciding whether to perform an asset impairment review includes, among others, the following:
significant underperformance relative to expected historical or projected future operating results;
significant changes in the manner of use of the acquired assets or the strategy for overall business; and
significant negative industry or economic trends. There is no indication that property and equipment and other assets are impaired. No impairment losses were recognized in 2019 and 2018. The carrying amount of property and equipment as at December 31, 2019 and 2018 amounted to P=63.9 million and P=66.0 million, respectively (see Note 9). The carrying amount of other assets as at December 31, 2019 and 2018 amounted to P=18.5 million and P=17.9 million, respectively (see Note 10).
Estimating the Useful Lives of Property and Equipment. The Company estimates the useful lives of property and equipment based on the period over which the property and equipment are expected to be available for use. Such estimation is based on collective assessment of industry practice, internal technical evaluation and experience with similar assets. The Company reviews annually the estimated useful lives of property and equipment based on the factors that include asset utilization, internal technical evaluation, technological changes, environmental and anticipated use of the assets tempered by related industry benchmark information. It is possible that the future results of operations could be materially affected by changes in these estimates brought about by changes in factors mentioned. A reduction in the estimated useful lives of property and equipment would increase the recorded expense and decrease noncurrent assets. There are no changes in the estimated useful lives of property and equipment in 2019 and 2018.

‐ 18 ‐
The carrying amount of the property and equipment amounted to P=63.9 million and P=66.0 million as at December 31, 2019 and 2018, respectively (see Note 9). Determining the Fair Value of Property and Equipment Measured at Revalued Amount. The Company engaged an independent appraiser to determine the fair value of its condominium unit. The fair value of the condominium unit was determined using the Market Data Approach. This approach requires the establishment of comparable properties by reducing reasonable comparative sales and listings to a common denominator. Differences between the subject property to those actual sales and listings regarded as comparable were adjusted. The properties used as bases of comparison are situated within the immediate vicinity of the subject property. The comparison was premised on factors such as location and time element. The appraiser also considered the concept of value in use which is based on the highest and most profitable continuous use or that which may reasonably be expected to produce the greatest net return over a given period of time. The latest appraisal report was made in July 2018, with appraisal increase of P=52.9 million. The resulting increase in the valuation of condominium unit under property and equipment based on the valuation made by an independent appraiser is presented under “Revaluation surplus,” net of related deferred tax, in the statement of changes in equity as part of other equity reserves. The carrying amount of property and equipment measured at revalued amount as at December 31, 2019 and 2018 amounted to P=60.6 million and P=65.2 million, respectively. In 2019 and 2018, the realized portion of revaluation surplus, net of tax, transferred to deficit amounted to P=2.6 million and P=1.3 million, respectively (see Note 9). Determining the Retirement Benefits. The determination of the obligation and cost of retirement benefits is dependent on the selection of certain assumptions used by the actuary in calculating such amounts. Those assumptions which include, among others, discount rate and salary increase rate are disclosed in Note 14, Retirement Benefits. While the Company has assessed that the assumptions are reasonable and appropriate, significant differences in the actual experiences or significant changes in the assumptions may materially affect the retirement benefits. Retirement assets amounted to P=12.5 million and P=16.1 million as at December 31, 2019 and 2018, respectively (see Note 14). Assessing the Realizability of Deferred Tax Assets. The Company reviews the carrying amount of deferred tax assets at each reporting date and reduced to the extent that it is no longer probable that sufficient taxable profits will be available to allow all or part of the deferred tax assets to be utilized. Unrecognized deferred tax assets are reassessed at each reporting date and are recognized to the extent that it has become probable that future taxable profit will allow the deferred tax asset to be recovered. Deferred tax assets amounting to P=4.7 million and P=9.4 million as at December 31, 2019 and 2018, respectively, were not recognized (see Note 16). Management assessed that it is not probable that sufficient future taxable profit will be available to allow the deferred tax assets to be utilized.

‐ 19 ‐
4. Financial Risk and Capital Management Objectives and Policies The Company has exposure to the following major risks from its use of financial instruments:
Credit risk
Liquidity risk
Market risk Risk Management Framework The BOD has the overall responsibility over the Company's risk management process which involves identifying, measuring, analyzing, monitoring and mitigating risks. The BOD has delegated to senior management the task of developing and updating specific risk management policies and procedures as well as assessing the adequacy thereof relative to the financial risks being faced by the Company. The Company’s specific risk management policies are anchored on risk limits and operational controls. For this purpose, risk management policies and systems are reviewed annually to reflect changes in market conditions and the Company’s activities. Monitoring exposures to financial risks are also captured in the annual operating budgets. Most importantly, the senior management, through continuous training and communication to the Company's personnel, aims to develop a disciplined and control‐conscious environment. The Company’s senior management is assisted by the Internal Audit in monitoring strict compliance to these risk management policies and procedures. Credit Risk Credit risk is the risk of financial loss to the Company if a customer or counterparty to a financial instrument fails to meet its contractual obligations to the Company based on the original terms. For risk management reporting purposes, the Company considers and consolidates all elements of credit risk exposure. The BOD has delegated the responsibility of managing and monitoring credit risk to its Credit Committee (CRECOM). The Credit and Supervision and Research Group (CSRG), which directly reports to the CRECOM, is responsible for oversight over the Company's credit risk management functions, including:
Formulating credit policies covering collateral requirements, credit assessment and risk reporting.
Establishing the authorization structure for the approval and renewal of credit facilities, which require approval by the CRECOM or the BOD as appropriate.
Assessing the creditworthiness of the customers and reviewing process on renewal of credit facilities. Risk assessment is performed to determine if impairment provisions may be required against specific credit exposures.
Limiting concentrations of exposure to counterparties and industries.
Reviewing compliance with agreed exposure limits. Deviations to the established credit facility are presented to the CRECOM for approval.

‐ 20 ‐
The senior management is responsible for the quality and performance of its credit portfolio and for monitoring and controlling all credit risks in its portfolios. Regular audits of the Company and its credit processes are also undertaken by Internal Audit to ensure full compliance. The carrying amounts of financial assets representing the maximum credit exposure of the Company, excluding equity securities, are as follows:
2019 2018
Cash in banks and cash equivalents P=116,851,478 P=32,352,167 Investment securities: Financial assets at FVOCI 255,305,977 404,592,445 Financial assets at FVPL 79,151,856 88,533 Receivables 13,999,903 8,287,510
P=465,309,214 P=445,320,655
The concentration of credit risk of the Company is on the limited number of counterparties that the Company transacts with. These counterparties include the following:
2019
Government Bank or Financial
Institutions Corporate Total
Cash in banks and cash equivalents P=– P=116,851,478 P=– P=116,851,478 Investment securities: Financial assets at FVOCI* 255,305,977 – – 255,305,977 Financial assets at FVPL 79,067,580 – 84,276 79,151,856 Receivables 1,758,549 – 12,241,354 13,999,903
P=336,132,106 P=116,851,478 P=12,325,630 P=465,309,214
*Excluding equity securities.
2018
Government Bank or Financial
Institutions Corporate Total
Cash in banks and cash equivalents P=– P=32,352,167 P=– P=32,352,167 Investment securities: Financial assets at FVOCI* 404,592,445 – – 404,592,445 Financial assets at FVPL – – 88,533 88,533 Receivables 757,454 – 7,530,056 8,287,510
P=405,349,899 P=32,352,167 P=7,618,589 P=445,320,655
*Excluding equity securities.
The Company manages its credit risk by setting limits to customers and other counterparties, monitors credit exposures, and continually assesses the creditworthiness of counterparties. The Company obtains security where appropriate, enters into collateral arrangements with counterparties and limits the duration of the exposures.

‐ 21 ‐
An analysis of the carrying amount of the Company's financial assets classified according to credit quality follows: 2019
Stage 1 Stage 2 Stage 3 Total
Financial Assets at Amortized Cost Cash in banks and cash equivalents‐ High grade P=116,851,478 P=– P=– P=116,851,478 Receivables‐ High grade 13,462,484 – – 13,462,484 Low grade – 537,419 – 537,419 Financial Assets at FVOCI Government securities‐ High grade 255,305,977 – – 255,305,977 Financial Assets at FVPL Government securities‐
High grade 79,067,580 – – 79,067,580 Corporate note‐ High grade 84,276 – – 84,276
P=464,771,795 P=537,419 P=– P=465,309,214
2018
Stage 1 Stage 2 Stage 3 Total
Financial Assets at Amortized Cost Cash in banks and cash equivalents‐ High grade P=32,352,167 P=– P=– P=32,352,167 Receivables‐ High grade 7,339,687 – – 7,339,687 Low grade – 947,823 – 947,823 Financial Assets at FVOCI Government securities‐ High grade 404,592,445 – – 404,592,445 Financial Assets at FVPL Corporate note‐ High grade 88,533 – – 88,533
P=444,372,832 P=947,823 P=– P=445,320,655
Cash in Banks and Cash Equivalents. The credit risk for cash in banks and cash equivalents is considered negligible because the counterparties are reputable banks with high quality external credit ratings. Receivables. The credit risk for receivables is considered minimal since these are mitigated with income from trust operations. Financial Assets at FVOCI and FVPL. Credit risk for financial assets at FVOCI and FVPL is addressed by setting limits on the maximum amount of investments that can be made on certain type of security with consideration for the credit quality of the counterparty. Significant portion of the Company’s investments pertain to a portfolio of treasury bills and government bonds with zero credit risk. As at December 31, 2019 and 2018, these investments are determined to have zero credit risk, hence, the resulting ECL is not significant.

‐ 22 ‐
The credit quality of financial assets is managed by the Company using the following internal credit ratings:
a. High grade ‐ Accounts that are neither past due nor impaired with a very low probability of default as demonstrated by the counterparty’s long history of stability, profitability and diversity. The counterparty has the ability to raise substantial amounts of funds through the public markets. The counterparty has a strong debt service record and a moderate use of leverage.
b. Low grade ‐ Risk of default is higher than normal. The counterparty is expected to be able to service its debt under normal economic and business conditions. Any prolonged economic or business downturn would however ostensibly create liquidity issues for the counterparty. The counterparty may have a history of default but have regularized its debt service performance as at reporting date.
c. Impaired ‐ Accounts determined to be probable that all principal and interest due based on contractual terms and agreements will not be collected.
Liquidity Risk Liquidity risk is the risk that the Company will encounter difficulty in meeting obligations from its financial liabilities as these fall due. The table below summarizes the financial assets and liabilities’ liquidity information which includes coupon cash flows categorized based on the expected date on which the asset will be realized and the liability will be settled. 2019
Six Months
or Less Six to
12 Months Over
One Year Total
Assets Cash and cash equivalents P=116,859,478 P=– P=– P=116,859,478 Investment securities: Financial assets at FVOCI 4,001,250 109,001,250 170,458,390 283,460,890 Financial assets at FVPL 290,526 70,206,250 11,501,952 81,998,728 Receivables 13,999,903 – – 13,999,903
135,151,157 179,207,500 181,960,342 496,318,999
Liabilities Bills payable 155,255,676 – – 155,255,676 Accounts payable and other liabilities* 10,546,005 – – 10,546,005
165,801,681 – – 165,801,681
Net Liquidity Surplus (Gap) (P=30,650,524) P=179,207,500 P=181,960,342 P=330,517,318
*Excluding statutory payables.

‐ 23 ‐
2018
Six Months
or Less Six to
12 Months Over
One Year Total
Assets Cash and cash equivalents P=32,365,167 P=– P=– P=32,365,167 Investment securities: Financial assets at FVOCI 232,512,500 185,012,500 71,686,877 489,211,877 Financial assets at FVPL 88,533 – – 88,533 Receivables 8,287,510 – – 8,287,510
273,253,710 185,012,500 71,686,877 529,953,087
Liabilities Bills payable 157,290,282 – – 157,290,282 Accounts payable and other liabilities* 10,044,874 – – 10,044,874
167,335,156 – – 167,335,156
Net Liquidity Surplus P=105,918,554 P=185,012,500 P=71,686,877 P=362,617,931
*Excluding statutory payables.
The Company’s approach to managing liquidity is to ensure sufficient liquidity to meet its liabilities when due, under both normal and stressed conditions, without incurring unacceptable losses or risking damage to the Company’s reputation. The liquidity position of the Company is monitored and liquidity strategies are discussed by senior management on a regular basis. Gapping of assets and liabilities are likewise monitored. All liquidity policies are subject to review and approval by senior management. The stockholder has also committed to provide the necessary financial supports to the Company to adequately address any liquidity requirements. Market Risk Market risk is the risk that changes in market prices, such as fluctuation in interest rates (interest risk) and equity prices (equity price risk) which will affect the Company’s income or the value of its holdings of financial instruments. The objective of market risk management is to manage and control risk exposures within acceptable parameter, while optimizing the return on risk.
Interest Rate Risk Sensitivity Analysis The Company’s exposure to fair value interest rate risk arises from the following interest‐bearing financial instruments:
Note 2019 2018
Cash in banks and cash equivalents 6 P=116,851,478 P=32,352,167 Investment securities: Financial assets at FVOCI* 7 255,305,977 404,592,445 Financial assets at FVPL 7 79,151,856 88,533 Bills payable 11 (154,992,496) (157,054,540)
P=296,316,815 P=279,978,605 *Excluding equity securities.

‐ 24 ‐
The primary measure of interest rate risk is the duration of the financial instruments. It quantifies the effect of changes in interest rates in the value of financial instruments. The longer the duration, the more sensitive it should be to changes in interest rates. The following table illustrates the sensitivity of the Company’s profit or loss to a reasonably possible change in interest rates of its interest‐bearing financial instruments with all other variables held constant. 2019 2018
+/‐% Effect on
Profit or Loss +/‐% Effect on
Profit or Loss
Cash in banks 0.44% P=55,367 1.93% P=518,155 Cash equivalents 2.03% 2,114,667 2.28% 125,508 Investment securities: Financial assets at FVOCI* 2.69% 7,048,693 3.04% 12,513,879 Financial assets at FVPL 2.69% 2,126,579 3.04% 2,691 Bills payable 0.46% (708,826) 1.24% (1,949,214)
P=10,636,480 P=11,211,019 *Excluding equity securities.
The changes in interest rates used in the analysis of cash in banks and cash equivalents are based on the volatility of the BSP’s compilation of domestic rates computed using standard deviation. The changes in interest rates used in the analysis of investment securities and bills payable have been determined based on the average volatility in interest rates of the said financial instruments in the past 12 months. Equity Price Risk The Company is subject to minimal transaction and exposures resulting from changes in equity prices arising from holdings in equity securities designated as financial assets at FVOCI. The Company regularly monitors equity securities and maintains them at a level responsive to the current equity prices so as to minimize the related risks. Foreign Currency Exchange Risk Foreign currency exchange risk is the risk that the fair value or future cash flows of a financial instrument will fluctuate because of changes in foreign exchange rates. The Company’s foreign currency exchange risk results primarily from movements of the Peso against the United States (US) Dollar with respect to US dollar‐denominated cash and cash equivalents. As at December 31, 2019 and 2018, the Company’s US dollar‐denominated cash and cash equivalents amounted to US$24,078 with a Peso equivalent of P=1.2 million and US$41,871 with a Peso equivalent of P=2.2 million, respectively.
For purposes of translating the outstanding balance of the Company’s foreign currency‐denominated assets as at December 31, 2019 and 2018, the exchange rate applied was P=50.64 and P=52.72, respectively, per US$1.

‐ 25 ‐
The table below demonstrates the sensitivity to a reasonably possible change in the US Dollar exchange rate, with all other variables held constant, of the Company’s income before tax for the year ended December 31, 2019 and December 31, 2018 (due to changes in the fair value of financial assets). There is no other impact on the Company’s equity other than those already affecting profit or loss.
Increase/Decrease in Exchange Rate
Effect on Income before Tax
December 31, 2019 +28 P=341,321 ‐28 (341,321) December 31, 2018 +41 915,052 ‐41 (915,052)
Capital Management The Company defines capital as capital stock, additional paid‐in capital, treasury stock and deficit. Other components of equity such as revaluation surplus, cumulative remeasurement losses on retirement asset and cumulative unrealized losses on investment securities are excluded from capital for purposes of capital management. The Company’s objective when managing capital is to ensure that a stable capital base is maintained in accordance with industry regulations, while maintaining investor, creditor and market confidence to sustain the future development of the business. The Company manages its capital structure and makes the necessary adjustments to address the risk and adapt to changes in economic conditions. To maintain or adjust the capital structure, the Company may adjust the dividend payment to stockholders, return capital to stockholders or issue new shares. The composition of the Company‘s capital is as follows:
2019 2018
Capital stock P=485,666,700 P=485,666,700 Additional paid‐in capital 76,984 76,984 Treasury stock (32,573,600) (32,573,600) Deficit (108,419,924) (126,215,803)
P=344,750,160 P=326,954,281
Details on the number of common shares at P=100 par value as at December 31, 2019 and 2018 are as follows:
Number of Shares
Authorized 6,250,000 Issued 4,856,667 Treasury stock 325,736
Treasury stock amounting to P=32.6 million consists of cost of shares repurchased by the Company. The Company monitors capital on the basis of the debt‐to‐equity ratio which is calculated as total debt divided by total equity, excluding other equity reserves.

‐ 26 ‐
The Company’s debt‐to‐equity ratio is as follows:
2019 2018
Total liabilities P=202,809,056 P=207,433,129 Total equity 344,750,160 326,954,281
Debt‐to‐equity ratio 0.59:1 0.63:1
The Company’s net asset value per share is as follows:
2019 2018
Total liabilities P=364,528,490 P=344,907,824 Outstanding shares 4,530,931 4,530,931
Net asset value per share P=80.45 P=76.12
Required Capitalization for Investment Houses Pursuant to RA 8366, Investment Houses Law, the minimum paid‐up capital of an investment house should be P=300,000,000. The Monetary Board of the BSP may eventually prescribe a higher minimum capitalization in order to promote and ensure the stability of the Philippine capital markets and the competitiveness of the investment house industry in line with the national economic goals, which the Company as an investment house has to observe. As at December 31, 2019 and 2018, the Company has complied with the capitalization requirement.
5. Fair Value Measurement The following table presents the carrying amounts and fair values of the Company’s assets and liability measured at fair value and for which fair values are disclosed, and the corresponding hierarchy: 2019
Carrying Fair Value
Amount Level 1 Level 2 Level 3 Total
Assets Measured at Fair Value Investment securities:
Financial assets at FVOCI ‐ Government securities P=255,305,977 P=255,305,977 P=– P=– P=255,305,977
Financial assets at FVPL ‐ Government securities 79,067,580 79,067,580 – – 79,067,580 Corporate notes 84,276 84,276 – – 84,276
Property and equipment ‐ Condominium unit 60,604,970 – 60,604,970 – 60,604,970
Total Assets P=395,062,803 P=334,457,833 P=60,604,970 P=– P=395,062,803
Liability for which Fair Value is Disclosed
Bills payable P=154,992,496 P=– P=154,992,496 P=– P=154,992,496

‐ 27 ‐
2018
Carrying Fair Value
Amount Level 1 Level 2 Level 3 Total
Assets Measured at Fair Value Investment securities:
Financial assets at FVOCI ‐ Government securities P=404,592,445 P=404,592,445 P=– P=– P=404,592,445
Financial assets at FVPL ‐ Corporate notes 88,533 88,533 – – 88,533
Property and equipment ‐ Condominium unit 65,190,486 – 65,190,486 – 65,190,486
Total Assets P=469,871,464 P=404,680,978 P=65,190,486 P=– P=469,871,464
Liability for which Fair Value is Disclosed
Bills payable P=157,054,540 P=– P=157,054,540 P=– P=157,054,540
The following methods and assumptions are used to estimate the fair value of each class of financial instruments: Investment Securities. The fair values of government securities and corporate notes categorized within Level 1 are determined based on the prices of relative benchmark securities which are quoted at Bloomberg. Unquoted equity securities measured at cost are not included since the fair value of these equity securities cannot be reliably measured.
Property and Equipment. The fair values of the condominium unit under property and equipment is based on the independent appraiser’s report. Valuations derived based on sales and listings of comparable properties within the vicinity. The valuations are based on active market prices, adjusted for any difference in the nature, location or condition of the specific property. Bills Payable. Bills payable are measured at estimated present value of future cash flows discounted at the market rate of interest at the reporting date. The fair value of bills payable approximates its carrying amount due to its short‐term nature.
Cash and Cash Equivalents and Receivables. Carrying amounts of cash and cash equivalents and receivables maturing within 12 months are assumed to approximate fair values. This assumption is applied to liquid assets and the short‐term elements of all other financial assets. Accounts Payable and Other Liabilities. The carrying amount of accounts payable and other liabilities (excluding statutory payables) approximate the fair values due to short‐term nature of the transactions. As at December 31, 2019 and 2018, there were no transfers between Levels 1, 2 and 3 fair value measurements.

‐ 28 ‐
6. Cash and Cash Equivalents
This account consists of:
2019 2018
Cash on hand P=8,000 P=13,000 Cash in banks 12,627,483 26,847,413 Cash equivalents 104,223,995 5,504,754
P=116,859,478 P=32,365,167
Cash in banks earn nominal interest at prevailing bank deposit rates. Cash equivalents refer to short‐term placements which are highly liquid placements in banks with maturities of three months or less and bear interest ranging from 0.85% to 3.63% and 0.80% to 6.10% in 2019 and 2018, respectively.
Interest income from cash and cash equivalents amounted to P=765,714 and P=2,102,300 in 2019 and 2018, respectively.
7. Investment Securities
This account consists of:
2019
Financial Assets
at FVOCI Financial
Assets at FVPL Total
Balances at beginning of year P=411,640,760 P=88,533 P=411,729,293 Disposals (1,035,884,747) (749,765,758) (1,785,650,505) Additions 882,219,413 828,708,555 1,710,927,968 Net unrealized fair value gains 4,378,866 120,526 4,499,392
Balances at end of year P=262,354,292 P=79,151,856 P=341,506,148
2018
Financial Assets
at FVOCI Financial
Assets at FVPL Total
Balances at beginning of year P=354,861,964 P=188,906,772 P=543,768,736 Disposals – (188,818,239) (188,818,239) Additions 59,602,306 – 59,602,306 Net unrealized fair value losses (2,823,510) – (2,823,510)
Balances at end of year P=411,640,760 P=88,533 P=411,729,293
Financial Assets at FVOCI This account consists of:
2019 2018
Government securities P=255,305,977 P=404,592,445 Unquoted equity securities 7,048,315 7,048,315
P=262,354,292 P=411,640,760

‐ 29 ‐
Government securities pertain to reserves maintained by the Company against funds held in trust as required by the BSP (see Note 18). Government securities are carried at fair value using published rates. The investments in government securities bear annual effective interest rates that range from 3.42% to 3.84% and 5.94% to 6.93% in 2019 and 2018, respectively. Unquoted equity shares are not listed and publicly traded. The Company intends to immediately dispose of these securities once the opportunity or requirement arises. As permitted under PFRS 9, cost may be an appropriate estimate of fair value if insufficient information is available to measure fair value, or if there is a wide range of possible fair value measurements. Proceeds from disposal of financial assets at FVOCI amounted to P=1,049.4 million in 2019. The movement of net unrealized gains (losses) on revaluation of financial assets at FVOCI recognized as a component of equity is as follows:
2019 2018
Balance at beginning of year (P=7,918,842) (P=5,095,332) Net unrealized gains (losses) 4,378,866 (2,823,510)
Balance at end of year (P=3,539,976) (P=7,918,842)
Financial Assets at FVPL This account consists of:
2019 2018
Government securities P=79,067,580 P=– Corporate notes 84,276 88,533
P=79,151,856 P=88,533
Debt securities classified as financial assets at FVPL bear annual effective interest rates ranging from 3.39% to 4.00% in 2019. Interest income from investment securities are as follows:
2019 2018
Financial assets at FVOCI P=16,679,273 P=14,565,771 Financial assets at FVPL 1,452,982 1,799,040
P=18,132,255 P=16,364,811
Dividend income from investment securities are as follows:
2019 2018
Financial assets at FVOCI P=2,364,374 P=756,960 Financial assets at FVPL – 113,980
P=2,364,374 P=870,940

‐ 30 ‐
Net trading gains (losses) from investment securities are as follows:
2019 2018
Net realized gains (losses) on disposal of investment securities
P=13,503,735
(P=3,394,384)
Net unrealized gains on fair value changes of financial assets at FVPL
120,526
–
P=13,624,261 (P=3,394,384)
8. Receivables This account consists of:
2019 2018
Receivable from trust operations P=11,703,935 P=6,582,233 Accrued interest 1,758,549 757,454 Accounts receivable 537,419 947,823
P=13,999,903 P=8,287,510
Receivables are unsecured and collectible within 30 days. Receivables from trust operations and accounts receivables are noninterest‐bearing. In 2018, the Company reversed the allowance for impairment losses of P=7.6 million that were previously provided for certain receivables. Interest income earned amounted to P=296,106 in 2018.
9. Property and Equipment Details of property and equipment carried at appraised values and at cost are as follows:
2019 2018
At revalued amount P=60,604,970 P=65,190,486 At cost 3,329,173 764,644
P=63,934,143 P=65,955,130
At Revalued Amount In 2018, the Company adopted the revaluation model for the subsequent measurement of its condominium unit. Movements in this account are as follows:
2019 2018
At Revalued Amount Balance at beginning of year P=168,921,568 P=37,402,199 Appraisal increase – 131,519,369
Balance at end of year 168,921,568 168,921,568
(Forward)

‐ 31 ‐
2019 2018
Accumulated Depreciation Balance at beginning of year P=103,731,082 P=22,356,509 Appraisal increase – 78,613,399 Depreciation 4,585,516 2,761,174
Balance at end of year 108,316,598 103,731,082
Carrying Amount P=60,604,970 P=65,190,486
Fair Value Measurement The fair value of the condominium unit based on an independent appraiser’s report dated July 2, 2018 using Market Data Approach amounted to P=68.1 million. The difference between the fair value and the carrying amount of the property amounting to P=52.9 million was recognized as appraisal increase. The fair value measurement for condominium unit has been categorized as Level 2 (significant observable inputs). The valuation process considered the determination of the inputs such as the size, age, and condition of the land and buildings, and the comparable prices in the corresponding property location. In estimating the fair value of these properties, management takes into account the market participant’s ability to generate economic benefits by using the assets in their highest and best use. Based on management assessment, the best use of the nonfinancial assets indicated in the foregoing is their current use. Sensitivity Analysis. Significant increase (decrease) in the average selling price and depreciated replacement costs per square meter would result to a significantly higher (lower) fair value measurement.
Movements in revaluation surplus recognized in the equity section of the statement of financial position are as follows:
2019
Revaluation
Increase Deferred Tax (see Note 15) Net
Balance at beginning of year P=51,081,628 P=15,324,488 P=35,757,140 Transfer of revaluation increment through
depreciation (3,648,684) (1,094,605) (2,554,079)
Balance at end of year P=47,432,944 P=14,229,883 P=33,203,061
2018
Revaluation
Increase Deferred Tax (see Note 15) Net
Revaluation increase P=52,905,970 P=15,871,791 P=37,034,179 Transfer of revaluation increment through
depreciation (1,824,342) (547,303) (1,277,039)
Balance at end of year P=51,081,628 P=15,324,488 P=35,757,140
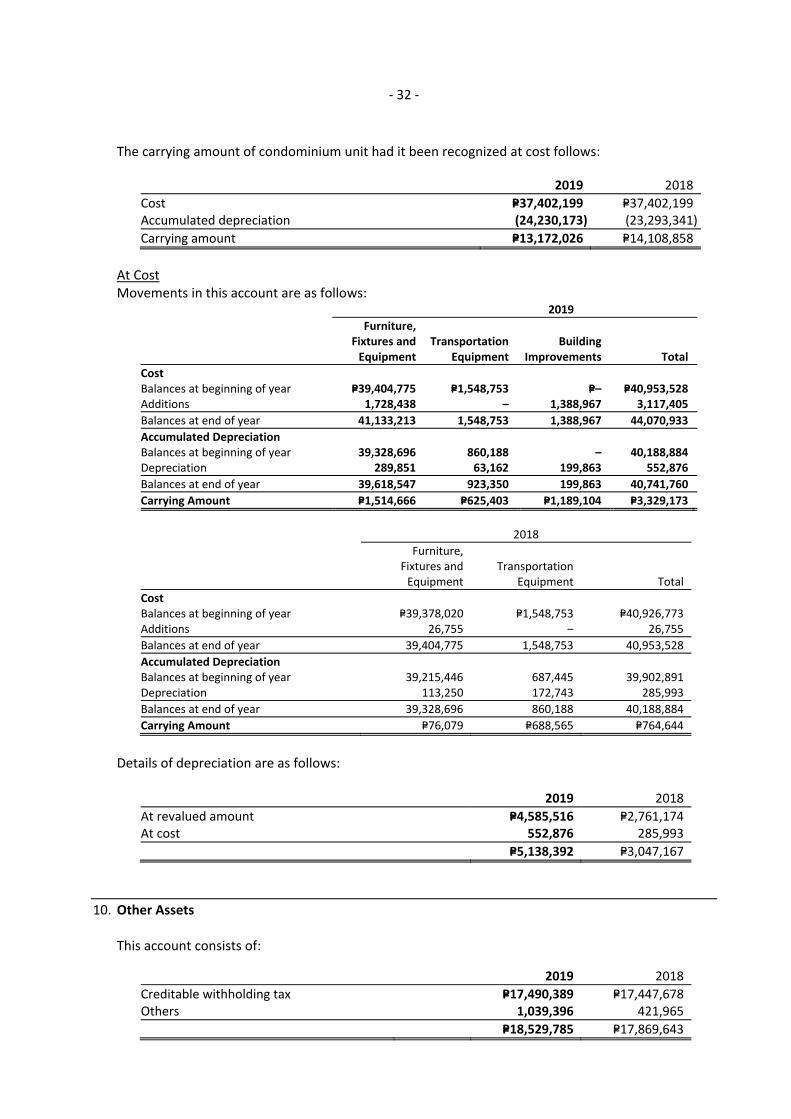
‐ 32 ‐
The carrying amount of condominium unit had it been recognized at cost follows:
2019 2018
Cost P=37,402,199 P=37,402,199 Accumulated depreciation (24,230,173) (23,293,341)
Carrying amount P=13,172,026 P=14,108,858
At Cost Movements in this account are as follows:
2019
Furniture, Fixtures and Equipment
Transportation Equipment
Building Improvements Total
Cost Balances at beginning of year P=39,404,775 P=1,548,753 P=– P=40,953,528 Additions 1,728,438 – 1,388,967 3,117,405
Balances at end of year 41,133,213 1,548,753 1,388,967 44,070,933
Accumulated Depreciation Balances at beginning of year 39,328,696 860,188 – 40,188,884 Depreciation 289,851 63,162 199,863 552,876
Balances at end of year 39,618,547 923,350 199,863 40,741,760
Carrying Amount P=1,514,666 P=625,403 P=1,189,104 P=3,329,173
2018
Furniture, Fixtures and Equipment
Transportation Equipment Total
Cost Balances at beginning of year P=39,378,020 P=1,548,753 P=40,926,773 Additions 26,755 ‒ 26,755
Balances at end of year 39,404,775 1,548,753 40,953,528
Accumulated Depreciation Balances at beginning of year 39,215,446 687,445 39,902,891 Depreciation 113,250 172,743 285,993
Balances at end of year 39,328,696 860,188 40,188,884
Carrying Amount P=76,079 P=688,565 P=764,644
Details of depreciation are as follows:
2019 2018
At revalued amount P=4,585,516 P=2,761,174 At cost 552,876 285,993
P=5,138,392 P=3,047,167
10. Other Assets This account consists of:
2019 2018
Creditable withholding tax P=17,490,389 P=17,447,678 Others 1,039,396 421,965
P=18,529,785 P=17,869,643

‐ 33 ‐
11. Bills Payable This account consists of borrowings from:
2019 2018
Individuals P=98,605,736 P=5,132,145 Non‐bank financial institutions 50,246,422 – Banks 6,140,338 151,922,395
P=154,992,496 P=157,054,540
Payment terms range from 8 to 91 days and 20 to 90 days in 2019 and 2018, respectively. Bills payable bear annual interest ranging from 4.63% to 5.25% and 4.53% to 6.50% in 2019 and 2018, respectively. Interest expense amounted to P=7.9 million and P=26.6 million in 2019 and 2018, respectively.
Movements in bills payable are presented below:
2019 2018
Balance at beginning of year P=157,054,540 P=791,540,705 Net payments:
Maturity (2,133,999,012) (5,460,051,317) Additions 2,131,936,968 4,825,565,152
(2,062,044) (634,486,165)
Balance at end of year P=154,992,496 P=157,054,540
12. Accounts Payable and Other Liabilities This account consists of:
2019 2018
Statutory payables P=19,252,088 P=20,168,964 Accrued expenses 5,594,589 4,032,253 Accounts payable 4,951,416 6,012,621
P=29,798,093 P=30,213,838
Statutory payables include unremitted documentary stamp taxes, withholding taxes and statutory contributions.
Accrued expenses include compensation, interest, utilities, and professional fees, among others. Accounts payable pertains to amounts owed to suppliers related to the normal business of the Company. Accounts payable and other liabilities are normally settled within the next reporting month.

‐ 34 ‐
13. Gain (Loss) on Sale of Assets In 2018, this account consists of:
Note
Gain (loss) on sale of: Investments in subsidiaries 17 (P=145,486,637) Investment properties 17 (64,138,248) Asset held for sale 1 40,147,705
(P=169,477,180)
As discussed in Note 1, the Company entered into a Deed of Sale with Januarius Holdings, Inc. for the sale of its investment in ACI, a wholly‐owned subsidiary classified as “Asset held for sale”, for a total consideration of P=332.3 million. The sale resulted to a gain amounting to P=40.1 million.
14. Retirement Benefits
The Company has a funded, non‐contributory, defined benefit retirement plan (Plan) covering all of its regular employees. Contributions and costs are determined in accordance with the actuarial studies made for the Plan. Annual cost is determined using the projected unit credit actuarial cost method. The last actuarial report is for the year ended December 31, 2018.
The control and administration of the Plan is vested with the Company’s key officers (Trustee) as duly appointed by the members of the Board of Trustees (BOT) of the Plan. The Trustee shall hold and invest all the funds and assets, and pay all costs and expenses incurred in connection with the administration of the Plan. The Plan is registered with the Bureau of Internal Revenue.
The retirement benefits recognized in the profit or loss as follows:
2019 2018
Current service cost P=4,056,180 P=3,863,029 Net interest income (430,059) (1,096,009)
P=3,626,121 P=2,767,020
Details of cumulative remeasurement losses recognized in other comprehensive income follow:
Cumulative Remeasurement
Losses Deferred Tax Net
Balance as at January 1, 2018 P=12,357,676 (P=3,707,303) P=8,650,373 Remeasurement loss 1,763,403 (529,021) 1,234,382
Balance as at December 31, 2019 and 2018 P=14,121,079 (P=4,236,324) P=9,884,755
Components of retirement asset recognized in the statement of financial position are as follows:
2019 2018
Fair value of plan assets P=27,622,666 P=31,261,295 Present value of defined benefit obligation (15,114,577) (15,127,085)
P=12,508,089 P=16,134,210

‐ 35 ‐
Movements in present value of the defined benefit obligations follow:
2019 2018
Balance at beginning of year P=15,127,085 P=26,409,510 Benefits paid from:
Retirement plan (5,162,376) (11,757,572) Company operations – (492,898)
Current service cost 4,056,180 3,863,029 Interest cost 1,093,688 1,174,468 Realized actuarial loss (gain) arising from:
Experience adjustment – (2,624,119) Financial assumptions – (1,445,333)
Balance at end of year P=15,114,577 P=15,127,085
Movements in the fair value of the plan assets follow:
2019 2018
Balance at beginning of year P=31,261,295 P=46,581,245 Benefits paid (5,162,376) (11,757,572) Interest income 1,523,747 2,270,477 Remeasurement loss – (5,832,855)
Balance at end of year P=27,622,666 P=31,261,295
The composition of plan assets is as follows:
2019 2018
Investment securities P=27,014,039 P=3,575 Cash and cash equivalents 1,358,966 31,274,750 Accrued interest 53 94,804 Other liabilities (750,392) (111,834)
P=27,622,666 P=31,261,295
The principal actuarial assumptions used as at December 31, 2019 and 2018 are as follows:
Discount rate 7.23% Salary increase 5.00%
The sensitivity of the defined benefit obligation to changes in the weighted principal assumptions as at December 31, 2019 follows:
Basis Points
Effect on Defined Benefit
Obligation
Discount rate +100 bps (P=11,877,608) ‐100 bps 15,962,419 Salary increase rate +100 bps 16,059,130 ‐100 bps (14,252,050)

‐ 36 ‐
The foregoing sensitivity analyses are based on a change in an assumption while holding all other assumptions constant. In practice, this is unlikely to occur, and changes in some of the assumptions may be correlated. When calculating the sensitivity of the defined benefit obligation to significant actuarial assumptions, the same method (present value of the defined benefit obligation calculated with the projected unit credit method at the end of the reporting period) has been applied as when calculating the retirement liability recognized within the statement of financial position. The BOT reviews the level of funding required for the retirement fund. Such a review includes the asset‐liability matching (ALM) strategy and investment risk management policy. The objective of ALM is to match maturities of the plan assets to the retirement benefit obligation. The BOT monitors how the duration and expected yield of the investments are matching the expected cash outflows arising from the retirement benefit obligations.
The average duration of the defined benefit obligation at the end of the reporting year is 11 years.
As at December 31, 2019, the projected maturity analysis of undiscounted retirement benefit payments follows:
Amount
One to five years P=3,050,575 Five to 10 years 14,979,705 Over 10 years 21,939,223
15. Maturity Analysis of Assets and Liabilities
The following tables present the assets and liabilities of the Company analyzed according to whether these are expected to be recovered or settled within one year and beyond one year from the reporting date: 2019 2018
Note Within One Year Over One Year Total Within One Year Over One Year Total
Financial Assets Cash and cash equivalents 6 P=116,859,478 P=– P=116,859,478 P=32,365,167 P=– P=32,365,167 Investment securities: 7 Financial assets at FVOCI 102,997,187 159,357,105 262,354,292 352,414,231 59,226,529 411,640,760 Financial assets at FVPL 79,151,856 – 79,151,856 88,533 – 88,533 Receivables 8 13,999,903 – 13,999,903 8,287,510 – 8,287,510
313,008,424 159,357,105 472,365,529 393,155,441 59,226,529 452,381,970
Nonfinancial Assets Property and equipment 9 – 212,992,501 212,992,501 – 209,875,096 209,875,096 Retirement asset 14 – 12,508,089 12,508,089 – 16,134,210 16,134,210 Other assets 10 18,529,785 – 18,529,785 17,869,643 – 17,869,643
18,529,785 225,500,590 244,030,375 17,869,643 226,009,306 243,878,949
Less: Accumulated depreciation 9 – 149,058,358 149,058,358 – 143,919,966 143,919,966
P=331,538,209 P=235,799,337 P=567,337,546 P=411,025,084 P=141,315,869 P=552,340,953
Financial Liabilities Bills payable 11 P=154,992,496 P=– P=154,992,496 P=157,054,540 P=– P=157,054,540 Accounts payable and other liabilities 12 10,546,005 – 10,546,005 10,044,874 – 10,044,874
165,538,501 – 165,538,501 167,099,414 – 167,099,414
Nonfinancial Liabilities Statutory payables 12 19,252,088 – 19,252,088 20,168,964 – 20,168,964 Deferred tax liabilities 16 – 18,018,467 18,018,467 – 20,164,751 20,164,751
19,252,088 18,018,467 37,270,555 20,168,964 20,164,751 40,333,715
P=184,790,589 P=18,018,467 P=202,809,056 P=187,268,378 P=20,164,751 P=207,433,129

‐ 37 ‐
16. Income Taxes
Income tax expense consists of:
2019 2018
Current income tax expense: Final tax P=3,778,922 P=15,648,950 RCIT 2,048,033 – MCIT – 1,031,652
5,826,955 16,680,602 Deferred income tax benefit (2,083,331) (682,236)
P=3,743,624 P=15,998,366
The reconciliation of income tax expense (benefit) at the statutory tax rate and the effective rate follows:
2019 2018
Income tax expense (benefit) at statutory income tax rate P=5,367,246 (P=48,140,381) Final taxes 3,778,922 15,648,950 Additions to (reductions in) income taxes resulting from
the effects of: Nondeductible expenses 5,701,212 56,723,889 Interest income subjected to final tax (5,669,391) (5,540,133) Changes in unrecognized deferred income tax assets (4,725,053) (1,804,922) Nontaxable income (709,312) (889,037)
Income tax expense at effective income tax rate P=3,743,624 P=15,998,366
Deferred tax liabilities consist of:
Note 2019 2018
Revaluation surplus 9 P=14,229,883 P=15,324,488 Retirement asset 3,752,426 4,840,263 Unrealized gain on financial assets at FVPL 36,158 –
P=18,018,467 P=20,164,751
Movements of net deferred tax expense (benefit) are recognized as follows:
2019 2018
Through: Profit or loss (P=2,083,331) (P=682,236) Other comprehensive income – 15,342,770
(P=2,083,331) P=14,660,534

‐ 38 ‐
As at December 31, 2019 and 2018, unrecognized deferred tax assets consist of:
2019 2018
Unamortized past service cost of retirement liability P=4,662,114 P=5,399,560 NOLCO – 2,985,221 MCIT – 1,031,652 Others 29,266 –
P=4,691,380 P=9,416,433
Management assessed that it is not probable that sufficient future taxable profit will be available to allow the deferred tax assets to be utilized. NOLCO and MCIT incurred in 2018 amounting to P=10.0 million and P=1.0 million, respectively, were applied in determining the tax due for 2019.
17. Related Party Transactions and Balances The Company has transactions in the normal course of its business with common directors, officers and major stockholders, or with which it has certain relationships (DOSRI), subsidiaries, retirement plan and other related parties.
Disposal of Investments in Subsidiaries and Investment Properties As discussed in Note 1, the Company sold all of its investments in subsidiaries to its previous stockholders and RHI on July 13, 2018. On the same date, the Company entered into another Deed of Sale with RHI covering its investment properties. The details of these transactions and the resulting loss on sale are presented below:
Investments in
Subsidiaries Investment Properties
Carrying amount P=177,486,637 P=91,938,248 Proceeds 32,000,000 27,800,000
Loss on sale P=145,486,637 P=64,138,248
Bills Payable The Company’s bills payable amounting to P=62.0 million as at December 31, 2019 was funded thru PCCI Trust and Investment Group’s (TIG). Interest rate on bills payable ranges from 4.75% to 5.25%. Interest expense incurred on these bills payable amounted to P=168,038 in 2019. These bills payable are due within 30 days. Compensation of Key Management Personnel Compensation of key management personnel charged to profit or loss as follows:
2019 2018
Short‐term employee benefits P=6,007,119 P=5,986,575 Post‐employment retirement benefits 2,082,273 2,131,131
P=8,089,392 P=8,117,706

‐ 39 ‐
Transactions with Retirement Plan The retirement plan of the Company is considered as a related party. The retirement plan is in the form of a trust administered by the Trustee under the supervision of the BOT (see Note 14).
18. Trust Operations On May 21, 2008, the Company was granted a license by the BSP to conduct its trust operations. Funds or assets (consisting mainly of investments in shares of stock, government securities, and loans and discounts) held by the Company in fiduciary or agency capacity for its customers are not included in the financial statements since these are not assets of the Company.
Total assets held by the TIG of the Company amounted to P=22,801.4 million and P=28,356.2 million as at December 31, 2019 and 2018, respectively.
In compliance with the BSP regulations relative to the Company’s trust operations, government securities classified as financial assets at FVOCI with a total face value of P=249.0 million and P=414.5 million as at December 31, 2019 and 2018, respectively, are deposited with the BSP. The fair value of these government securities in accordance with the BSP prescribed computation amounted to P=253.1 million and P=401.8 million as at December 31, 2019 and 2018, respectively.
19. Events After the Reporting Period
The Philippine government implemented an Enhanced Community Quarantine throughout Luzon starting March 16, 2020 until April 12, 2020 due to the COVID‐19 outbreak. While the financial impact of the crisis is considered a non‐adjusting subsequent event as at December 31, 2019, the effect on Company’s operations and financial performance, however, cannot be reasonably determined as at reporting date.