philippines-japan economic partnership agreement … · philippine institute for development ......
TRANSCRIPT
For comments, suggestions or further inquiries please contact:
Philippine Institute for Development StudiesSurian sa mga Pag-aaral Pangkaunlaran ng Pilipinas
The PIDS Discussion Paper Seriesconstitutes studies that are preliminary andsubject to further revisions. They are be-ing circulated in a limited number of cop-ies only for purposes of soliciting com-ments and suggestions for further refine-ments. The studies under the Series areunedited and unreviewed.
The views and opinions expressedare those of the author(s) and do not neces-sarily reflect those of the Institute.
Not for quotation without permissionfrom the author(s) and the Institute.
The Research Information Staff, Philippine Institute for Development Studies5th Floor, NEDA sa Makati Building, 106 Amorsolo Street, Legaspi Village, Makati City, PhilippinesTel Nos: (63-2) 8942584 and 8935705; Fax No: (63-2) 8939589; E-mail: [email protected]
Or visit our website at http://www.pids.gov.ph
January 2013
DISCUSSION PAPER SERIES NO. 2013-12
Philippines-Japan EconomicPartnership Agreement (PJEPA):
An Initial Ex-post ReviewErlinda M. Medalla and Veredigna M. Ledda
Abstract
While it is too early to undertake rigorous quantitative analysis on the impact of the Philippines-Japan Economic Partnership Agreement (PJEPA) on the Philippines, this initial ex-post study concludes that based on several key indicators the country has not suffered major adjustment costs because of the PJEPA. There is also evidence to show that the Philippines was able to secure concessions comparable to other partner countries of Japan in similar EPAs. The study echoes earlier research that indicated the short-run impact of the PJEPA on GDP would be small but the dynamic benefits could be very significant. On the whole, indicators are positive, although more could be done especially in terms of labor protection, attracting Japanese investments and taking advantage of the cooperation elements of the agreement.
Keywords
Philippines-Japan Economic Partnership Agreement, PJEPA, bilateral trade agreement, trade, tariff
Philippines – Japan Economic Partnership Agreement (PJEPA): An Initial Ex-Post Review
Erlinda M. Medalla and Veredigna M. Ledda∗
A. Overview and Context
The Philippines and Japan signed an economic partnership agreement on September 9, 2006, capping almost three years of formal negotiations and bringing to another level the long-standing relationship between the two countries. The Philippines-Japan Economic Partnership Agreement (PJEPA) is considered a milestone in Philippine international trade relations for several reasons. It is the first and so far, the only bilateral economic partnership agreement (EPA) entered into by the country. Similar international engagements of the Philippines are increasingly being negotiated multilaterally in the context of the country’s membership in the ASEAN. Secondly, the PJEPA is a “New Age” Free Trade Agreement (FTA). Going beyond the elimination of tariffs on traded goods which characterizes an FTA, the PJEPA includes provisions for the smooth trans-border flow of people, capital and information in areas such as investment, competition, government procurement, trade facilitation, cooperation in science in and technology (S&T), human resource development (HRD), small and medium enterprises (SMEs) and the environment (Yap, Medalla and Aldaba, 2006). The design of a comprehensive partnership highlights the capacity building and cooperation aspects of an EPA especially in areas considered to be important in helping the country achieve sustainable growth and address development gaps.
Thirdly, the PJEPA is significant for triggering strong opposition and lobbying by certain segments of Philippine society. Owing perhaps to the unfamiliar nature of an EPA and apprehension about its possible negative impact, several interest groups voiced their concerns when the signing of the PJEPA was announced. As a result, while the Japanese Diet ratified the agreement in December 2006, three months from the signing of the agreement, the corresponding process in the Philippines dragged on with the PJEPA ratified by the Senate on October 8, 2008, almost two years later.
Given the limited time that has elapsed since the start of the implementation of PJEPA, it is premature to undertake a comprehensive assessment of the impact of the agreement. It would take time for the effects on the overall investment environment and capacity building to take root, and thus for the fuller and wider impact of the agreement to manifest. However, initial trends and qualitative factors can already give some indication of the effects thus far of the PJEPA from certain key perspectives which will be discussed in this study. The study will also surface pending issues of particular concern to the country that remain inadequately
∗ PIDS Senior Research Fellow and Research Associate respectively
2
addressed, and suggest courses of action that may help the expected gains from PJEPA to fully materialize. This initial ex-post study builds on and extends the discussions contained in the seminal, ex-ante research papers on the PJEPA1. It is important to point out that the early studies concluded that the short-run impact of the PJEPA on GDP would be small but the dynamic benefits could be very significant. The generally low tariffs already in effect before the signing of the PJEPA were not expected to generate major adjustment costs in the near term and that the more substantial impact was expected to come from an improved investment environment including clearer rules for engagement, increased transparency, and enhanced cooperation. It is interesting to note that these early years of the implementation of the PJEPA have indeed been devoid of significant disruptions and that the moderate gearing up of investments from Japan shows promise of placing the Philippines more favorably within the context of East Asian regional integration and international production networks.
B. Methodology and Caveats
An economic partnership agreement or New Age FTA encompasses many other aspects beyond the consideration of tariffs affecting cross-border relations. Aside from measures to liberalize trade in goods and services in terms of tariff reduction and the removal of non-tariff barriers, an EPA includes cooperation agreements and capacity-building projects. In particular, the PJEPA is similar to other EPAs entered into by Japan that emphasize the features of liberalization, facilitation and cooperation.
This wider perspective is also the framework for analysis of this initial ex-post review, subject to some important caveats. Firstly, although it has been nominally five years since the signing of the agreement in 2006, the PJEPA came into effect on the 30th day after the date when both countries completed the ratification process, ending with an exchange of notes of its ratification.2 Given the belated completion of the ratification process by the Philippines through the Senate concurrence in October 2008, the implementation of the PJEPA thus far has been conducted over barely four years. The insufficiency of time series data prevents the use of more complex quantitative tools that would have facilitated a more rigorous evaluation of the actual impact of the PJEPA on the Philippine economy. Secondly, the conduct of this review is being done in the context of the intervening and ongoing global financial crisis. Japan entered into a recession in late 2008 with a strong yen further eroding exports already
1 In particular, please see “Japan-Philippines Economic Partnership Agreement (JPEPA): Toward a Framework for Regional Economic Integration” by Medalla, Erlinda M., Vidar-Vale Catherine and Balboa, Jenny D., PIDS Discussion Paper Series No. 2010-19, and “Assessing the Japan-Philippines Economic Partnership Agreement” by Yap, Josef T., Medalla, Erlinda M., and Aldaba, Rafaelita M., PIDS Discussion Paper Series No. 2006. 2 Primer on the Japan-Philippines Economic Partnership Agreement.
3
weakened by falling worldwide demand. Although fiscal stimulus spending in 2009 and 2010 helped prop up the economy, the crisis has heightened domestic concerns to address the restructuring of the economy and government debt.
Thirdly, in a series of unfortunate events, an earthquake of 9.0 magnitude and the ensuing tsunami wreaked havoc on Honshu Island on March 11, 2011. Japan continues to address serious radiation issues resulting from the severely damaged nuclear power plants and the enormous and costly task of rebuilding and reconstruction. With economic forecasts seeing a decline in GDP for the year, the reality of a domestic economy already weaker than anticipated due to the global crisis may perhaps have a bearing on Japan’s attitude towards and execution of its international commitments, including EPAs. It may be useful to note that any positive effects reflected in certain aspects of the Philippines-Japan bilateral relationship resulting from the implementation of the PJEPA in the past three years have happened despite these adverse global and local economic conditions. This may imply perhaps that in better times or more normal circumstances, even more significant gains and palpable benefits for both parties may be realized.
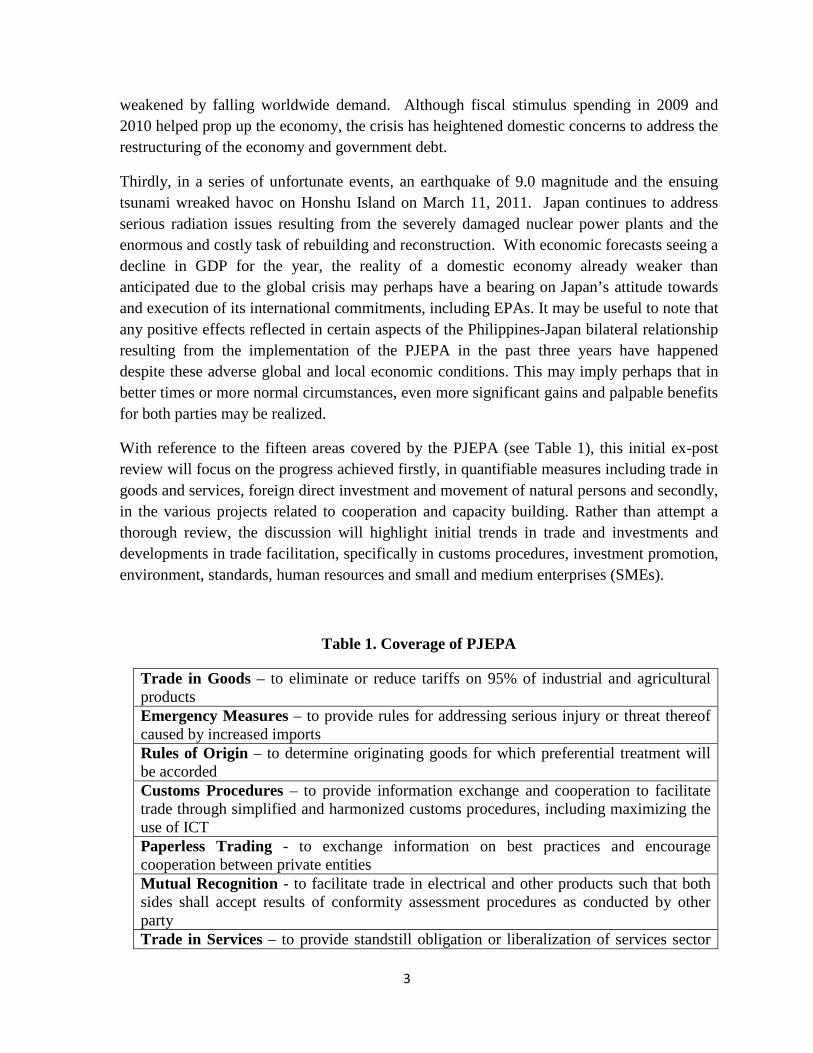
With reference to the fifteen areas covered by the PJEPA (see Table 1), this initial ex-post review will focus on the progress achieved firstly, in quantifiable measures including trade in goods and services, foreign direct investment and movement of natural persons and secondly, in the various projects related to cooperation and capacity building. Rather than attempt a thorough review, the discussion will highlight initial trends in trade and investments and developments in trade facilitation, specifically in customs procedures, investment promotion, environment, standards, human resources and small and medium enterprises (SMEs).
Table 1. Coverage of PJEPA
Trade in Goods – to eliminate or reduce tariffs on 95% of industrial and agricultural products Emergency Measures – to provide rules for addressing serious injury or threat thereof caused by increased imports Rules of Origin – to determine originating goods for which preferential treatment will be accorded Customs Procedures – to provide information exchange and cooperation to facilitate trade through simplified and harmonized customs procedures, including maximizing the use of ICT Paperless Trading - to exchange information on best practices and encourage cooperation between private entities Mutual Recognition - to facilitate trade in electrical and other products such that both sides shall accept results of conformity assessment procedures as conducted by other party Trade in Services – to provide standstill obligation or liberalization of services sector

4
such as outsourcing, air transport, health related and social services, tourism and travel related services, maritime transport services, telecommunications and banking Investment - to include provisions concerning National Treatment, MFN Treatment and Performance Requirements Prohibition for the liberalization of investment and enhance transparency by specifying all exceptions to these provisions Movement of Natural Persons – to assure easier entry of qualified Filipino nurses and certified caregivers through language training, clear guidelines on exercise of profession/occupation and streamlining processing of application, including the possible application in other professions. Intellectual Property - to enhance understanding of protecting intellectual property, given Japanese practices. This also includes cooperation and appropriate protection and enforcement elements. Government Procurement - to increase transparency of government procurement laws, regulations and procedures and possible liberalization of government procurement activities taking into account the development, financial and trade needs of both parties Competition - to promote increased vigilance and increased attention to the protection of fair competition. It also includes measures to promote competition by addressing anti-competitive activities and cooperation in the field of competition. Improvement of the Business Environment - to encourage cooperation to improve the business environment of both countries. A framework of consultations will be set up to ensure more efficient and timely resolution of issues affecting Japanese and Filipino enterprises in both countries. Cooperation – to provide bilateral economic assistance in ten fields within the context of Official Development Assistance (ODA) Dispute Avoidance and Settlement - to provide a mechanism for addressing government disputes in the interpretation of implementation procedures while relying on the primacy of consultations
Sources: Primer on the Japan-Philippines Economic Partnership Agreement (JPEPA) and in Medalla et al (2010)
C. Performance of “sensitive” sectors and adjustment costs
Concerns have been raised about the serious adjustment costs of opening up the economy as a result of PJEPA. In particular, there were claims of significant dislocation in the automotive and related sectors. In the four years of the implementation of the PJEPA, the good news is that there have been no apparent major adjustment costs for the Philippines as a result of the agreement.
The automotive sector
The ASEAN Free Trade Agreement (AFTA) had been in place years before PJEPA, and most of the adverse effect on the automotive sector would have been felt with its implementation. The sector (particularly assembly) enjoyed among the highest tariff protection in manufacturing. This has been part of the government policy to promote parts and components manufacturers and to protect local assemblers. But since the Philippines’ trade commitments in WTO and AFTA-
5
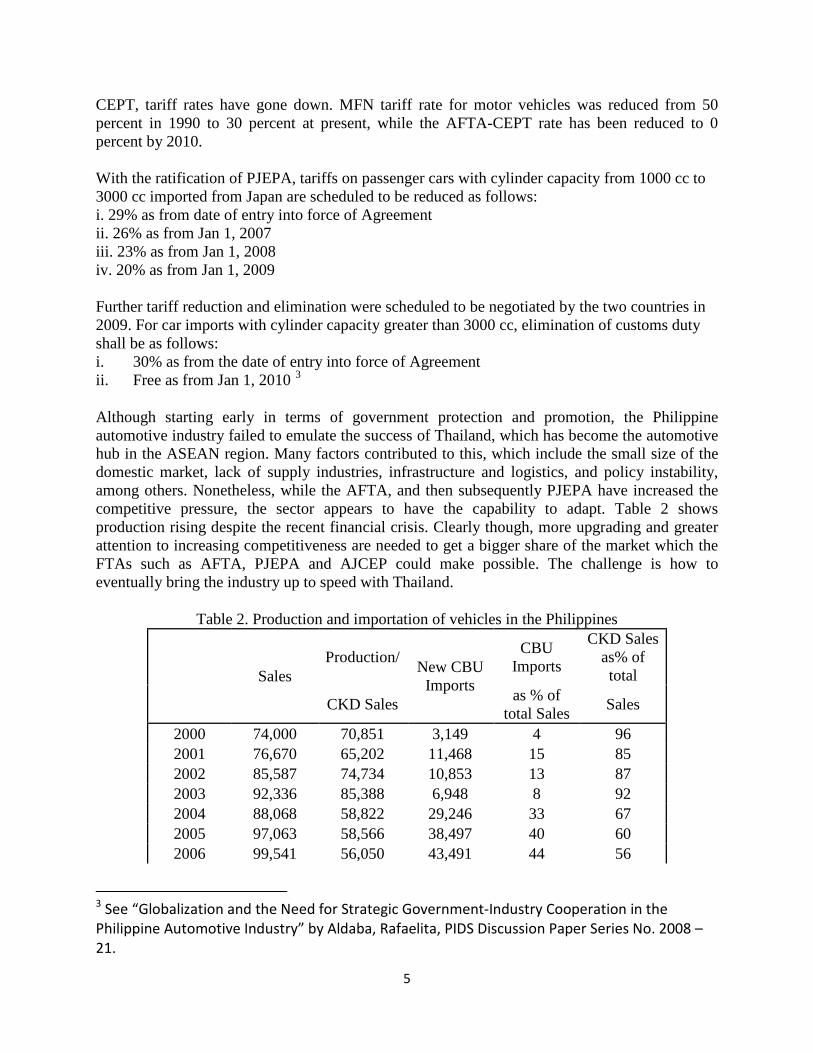
CEPT, tariff rates have gone down. MFN tariff rate for motor vehicles was reduced from 50 percent in 1990 to 30 percent at present, while the AFTA-CEPT rate has been reduced to 0 percent by 2010. With the ratification of PJEPA, tariffs on passenger cars with cylinder capacity from 1000 cc to 3000 cc imported from Japan are scheduled to be reduced as follows: i. 29% as from date of entry into force of Agreement ii. 26% as from Jan 1, 2007 iii. 23% as from Jan 1, 2008 iv. 20% as from Jan 1, 2009 Further tariff reduction and elimination were scheduled to be negotiated by the two countries in 2009. For car imports with cylinder capacity greater than 3000 cc, elimination of customs duty shall be as follows: i. 30% as from the date of entry into force of Agreement ii. Free as from Jan 1, 2010 3
Although starting early in terms of government protection and promotion, the Philippine automotive industry failed to emulate the success of Thailand, which has become the automotive hub in the ASEAN region. Many factors contributed to this, which include the small size of the domestic market, lack of supply industries, infrastructure and logistics, and policy instability, among others. Nonetheless, while the AFTA, and then subsequently PJEPA have increased the competitive pressure, the sector appears to have the capability to adapt. Table 2 shows production rising despite the recent financial crisis. Clearly though, more upgrading and greater attention to increasing competitiveness are needed to get a bigger share of the market which the FTAs such as AFTA, PJEPA and AJCEP could make possible. The challenge is how to eventually bring the industry up to speed with Thailand.
Table 2. Production and importation of vehicles in the Philippines
Sales
Production/ New CBU Imports
CBU Imports
CKD Sales as% of total
CKD Sales as % of total Sales Sales
2000 74,000 70,851 3,149 4 96 2001 76,670 65,202 11,468 15 85 2002 85,587 74,734 10,853 13 87 2003 92,336 85,388 6,948 8 92 2004 88,068 58,822 29,246 33 67 2005 97,063 58,566 38,497 40 60 2006 99,541 56,050 43,491 44 56
3 See “Globalization and the Need for Strategic Government-Industry Cooperation in the Philippine Automotive Industry” by Aldaba, Rafaelita, PIDS Discussion Paper Series No. 2008 – 21.
6
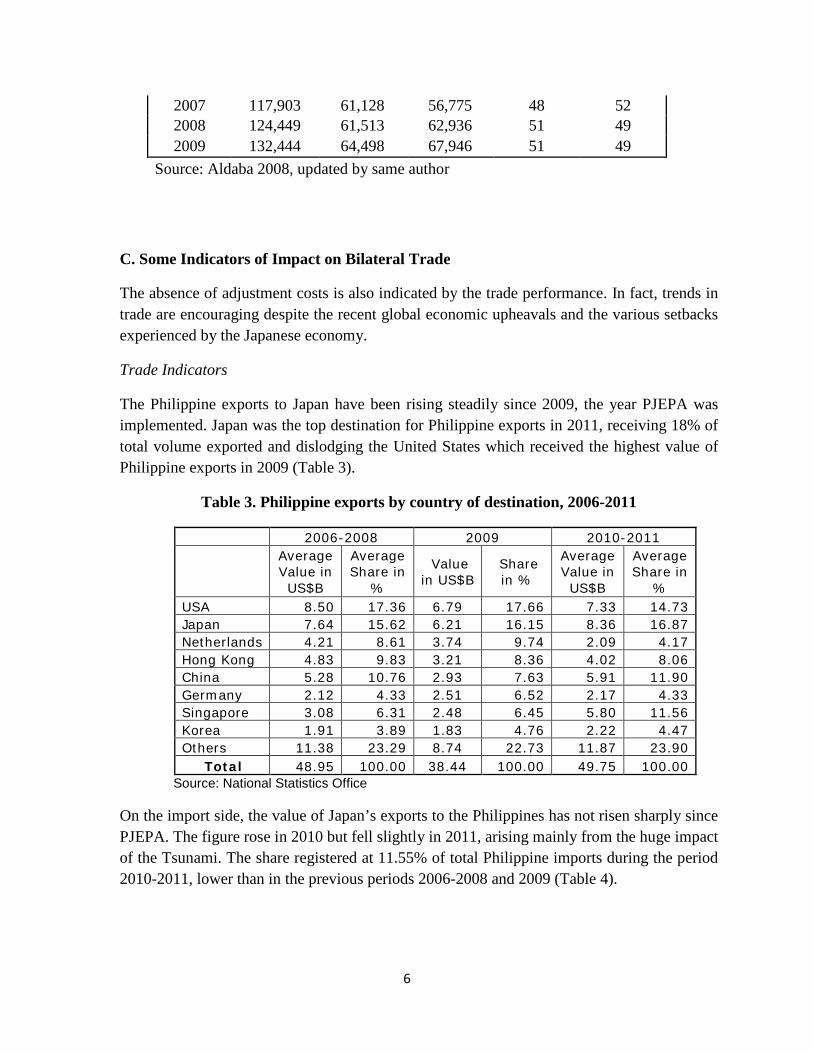
2007 117,903 61,128 56,775 48 52 2008 124,449 61,513 62,936 51 49 2009 132,444 64,498 67,946 51 49
Source: Aldaba 2008, updated by same author
C. Some Indicators of Impact on Bilateral Trade
The absence of adjustment costs is also indicated by the trade performance. In fact, trends in trade are encouraging despite the recent global economic upheavals and the various setbacks experienced by the Japanese economy.
Trade Indicators
The Philippine exports to Japan have been rising steadily since 2009, the year PJEPA was implemented. Japan was the top destination for Philippine exports in 2011, receiving 18% of total volume exported and dislodging the United States which received the highest value of Philippine exports in 2009 (Table 3).
Table 3. Philippine exports by country of destination, 2006-2011
2006-2008 2009 2010-2011
Average Value in US$B
Average Share in
%
Value in US$B
Share in %
Average Value in US$B
Average Share in
% USA 8.50 17.36 6.79 17.66 7.33 14.73 Japan 7.64 15.62 6.21 16.15 8.36 16.87 Netherlands 4.21 8.61 3.74 9.74 2.09 4.17 Hong Kong 4.83 9.83 3.21 8.36 4.02 8.06 China 5.28 10.76 2.93 7.63 5.91 11.90 Germany 2.12 4.33 2.51 6.52 2.17 4.33 Singapore 3.08 6.31 2.48 6.45 5.80 11.56 Korea 1.91 3.89 1.83 4.76 2.22 4.47 Others 11.38 23.29 8.74 22.73 11.87 23.90 Total 48.95 100.00 38.44 100.00 49.75 100.00
Source: National Statistics Office
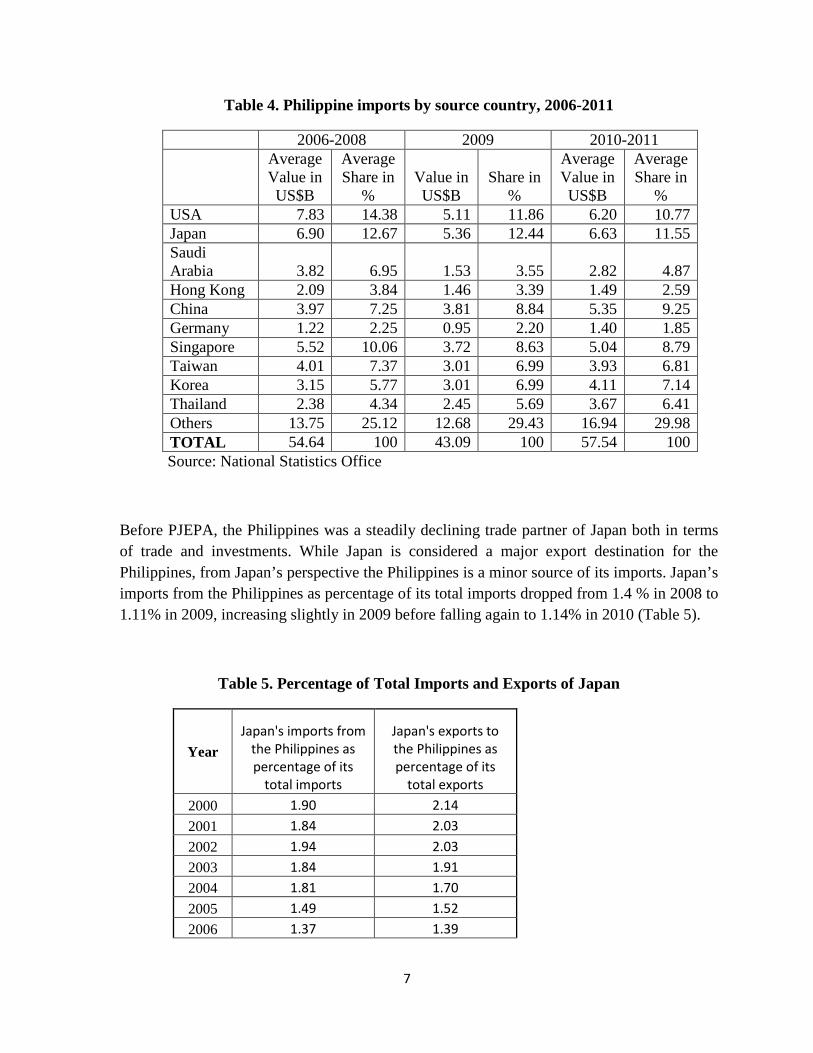
On the import side, the value of Japan’s exports to the Philippines has not risen sharply since PJEPA. The figure rose in 2010 but fell slightly in 2011, arising mainly from the huge impact of the Tsunami. The share registered at 11.55% of total Philippine imports during the period 2010-2011, lower than in the previous periods 2006-2008 and 2009 (Table 4).
7
Table 4. Philippine imports by source country, 2006-2011
2006-2008 2009 2010-2011
Average Value in US$B
Average Share in
% Value in US$B
Share in %
Average Value in US$B
Average Share in
% USA 7.83 14.38 5.11 11.86 6.20 10.77 Japan 6.90 12.67 5.36 12.44 6.63 11.55 Saudi Arabia 3.82 6.95 1.53 3.55 2.82 4.87 Hong Kong 2.09 3.84 1.46 3.39 1.49 2.59 China 3.97 7.25 3.81 8.84 5.35 9.25 Germany 1.22 2.25 0.95 2.20 1.40 1.85 Singapore 5.52 10.06 3.72 8.63 5.04 8.79 Taiwan 4.01 7.37 3.01 6.99 3.93 6.81 Korea 3.15 5.77 3.01 6.99 4.11 7.14 Thailand 2.38 4.34 2.45 5.69 3.67 6.41 Others 13.75 25.12 12.68 29.43 16.94 29.98 TOTAL 54.64 100 43.09 100 57.54 100
Source: National Statistics Office
Before PJEPA, the Philippines was a steadily declining trade partner of Japan both in terms of trade and investments. While Japan is considered a major export destination for the Philippines, from Japan’s perspective the Philippines is a minor source of its imports. Japan’s imports from the Philippines as percentage of its total imports dropped from 1.4 % in 2008 to 1.11% in 2009, increasing slightly in 2009 before falling again to 1.14% in 2010 (Table 5).
Table 5. Percentage of Total Imports and Exports of Japan
Year Japan's imports from
the Philippines as percentage of its
total imports
Japan's exports to the Philippines as percentage of its
total exports
2000 1.90 2.14
2001 1.84 2.03
2002 1.94 2.03
2003 1.84 1.91
2004 1.81 1.70
2005 1.49 1.52
2006 1.37 1.39
8
2007 1.40 1.33
2008 1.11 1.28
2009 1.16 1.42
2010 1.14 1.44 Source: Japan Ministry of Finance website
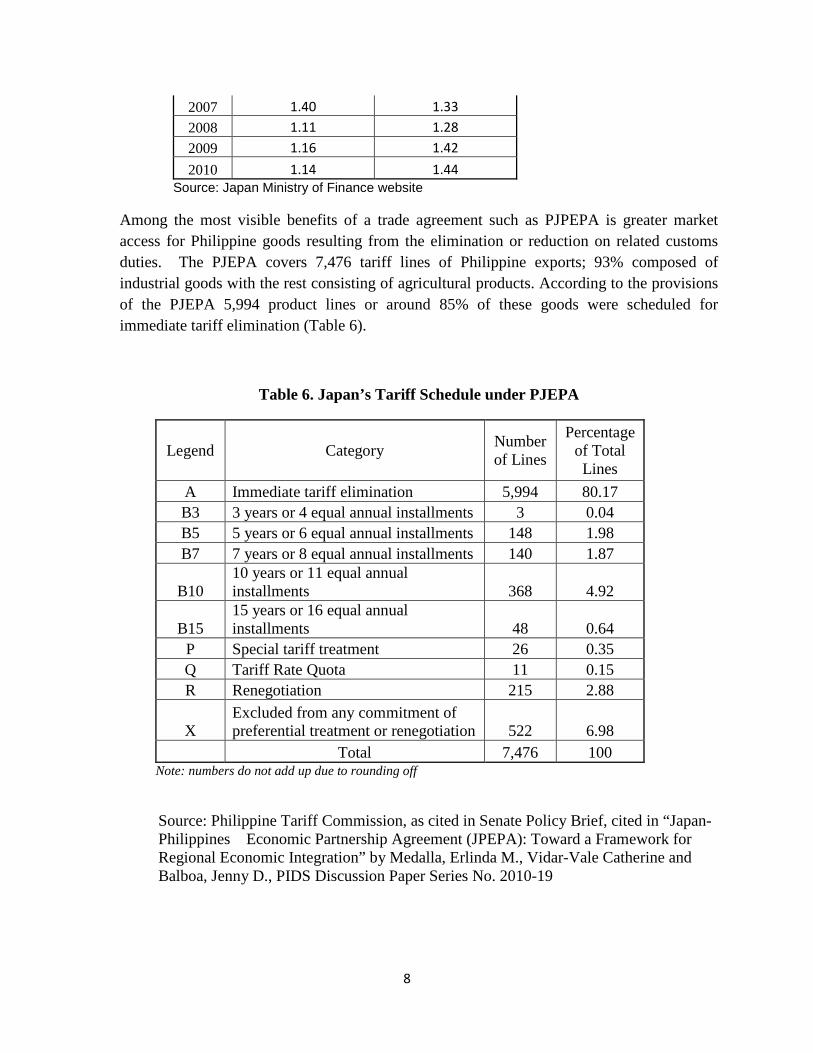
Among the most visible benefits of a trade agreement such as PJPEPA is greater market access for Philippine goods resulting from the elimination or reduction on related customs duties. The PJEPA covers 7,476 tariff lines of Philippine exports; 93% composed of industrial goods with the rest consisting of agricultural products. According to the provisions of the PJEPA 5,994 product lines or around 85% of these goods were scheduled for immediate tariff elimination (Table 6).
Table 6. Japan’s Tariff Schedule under PJEPA
Legend Category Number of Lines
Percentage of Total Lines
A Immediate tariff elimination 5,994 80.17 B3 3 years or 4 equal annual installments 3 0.04 B5 5 years or 6 equal annual installments 148 1.98 B7 7 years or 8 equal annual installments 140 1.87
B10 10 years or 11 equal annual installments 368 4.92
B15 15 years or 16 equal annual installments 48 0.64
P Special tariff treatment 26 0.35 Q Tariff Rate Quota 11 0.15 R Renegotiation 215 2.88
X Excluded from any commitment of preferential treatment or renegotiation 522 6.98
Total 7,476 100 Note: numbers do not add up due to rounding off
Source: Philippine Tariff Commission, as cited in Senate Policy Brief, cited in “Japan-Philippines Economic Partnership Agreement (JPEPA): Toward a Framework for Regional Economic Integration” by Medalla, Erlinda M., Vidar-Vale Catherine and Balboa, Jenny D., PIDS Discussion Paper Series No. 2010-19

9
Before the PJEPA came into force, a number of Philippine agricultural products were already making inroads in the Japanese market despite the high tariffs imposed on goods from this sector. Pineapples and bananas led other exports such as seafood (tuna, prawns, crabs, shrimps), chicken, mangoes and cane molasses in gaining market share for Philippine exports. After the implementation of the tariff reductions provided for in the PJEPA, there is some early evidence to show improving market share in Japan for a number of Philippine agricultural exports, as Table 7 shows.
Table 7. Trade Volume Changes of Selected Philippine Exports to Japan 2008 - 2009
Source: 外務省 (Japanese Foreign Ministry)
According to statistics sourced from Japan’s Foreign Ministry, when Japan’s tariff rates decreased from 2008 to 2009, Philippine exports of cuttlefish and squid, coconuts, mackerel, shrimps and prawns and fruits such as bananas and mangoes registered significant increases in export volumes.
Table 7 also shows early gainers among non-agricultural product sectors that have benefited from the lower tariff rates accorded by the PJEPA, among them women’s clothing articles and footwear.
10
Indicator of Philippine Market Position in Japan
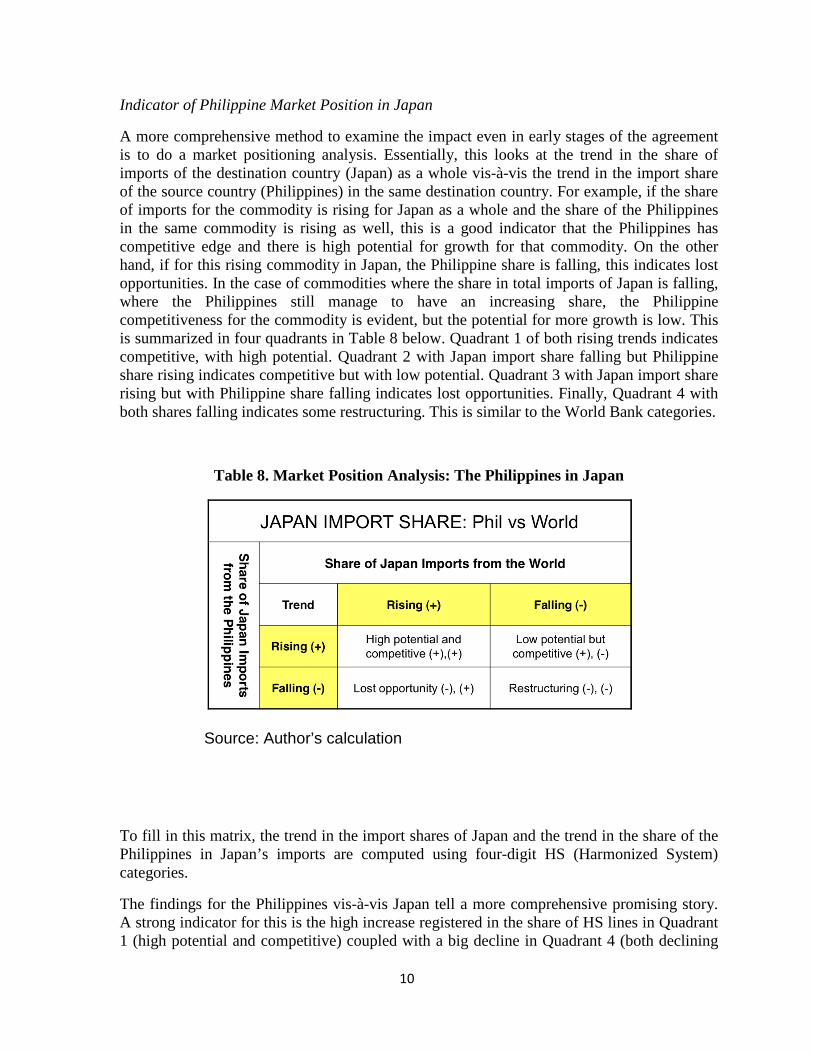
A more comprehensive method to examine the impact even in early stages of the agreement is to do a market positioning analysis. Essentially, this looks at the trend in the share of imports of the destination country (Japan) as a whole vis-à-vis the trend in the import share of the source country (Philippines) in the same destination country. For example, if the share of imports for the commodity is rising for Japan as a whole and the share of the Philippines in the same commodity is rising as well, this is a good indicator that the Philippines has competitive edge and there is high potential for growth for that commodity. On the other hand, if for this rising commodity in Japan, the Philippine share is falling, this indicates lost opportunities. In the case of commodities where the share in total imports of Japan is falling, where the Philippines still manage to have an increasing share, the Philippine competitiveness for the commodity is evident, but the potential for more growth is low. This is summarized in four quadrants in Table 8 below. Quadrant 1 of both rising trends indicates competitive, with high potential. Quadrant 2 with Japan import share falling but Philippine share rising indicates competitive but with low potential. Quadrant 3 with Japan import share rising but with Philippine share falling indicates lost opportunities. Finally, Quadrant 4 with both shares falling indicates some restructuring. This is similar to the World Bank categories.
Table 8. Market Position Analysis: The Philippines in Japan
Source: Author’s calculation
To fill in this matrix, the trend in the import shares of Japan and the trend in the share of the Philippines in Japan’s imports are computed using four-digit HS (Harmonized System) categories.
The findings for the Philippines vis-à-vis Japan tell a more comprehensive promising story. A strong indicator for this is the high increase registered in the share of HS lines in Quadrant 1 (high potential and competitive) coupled with a big decline in Quadrant 4 (both declining
11
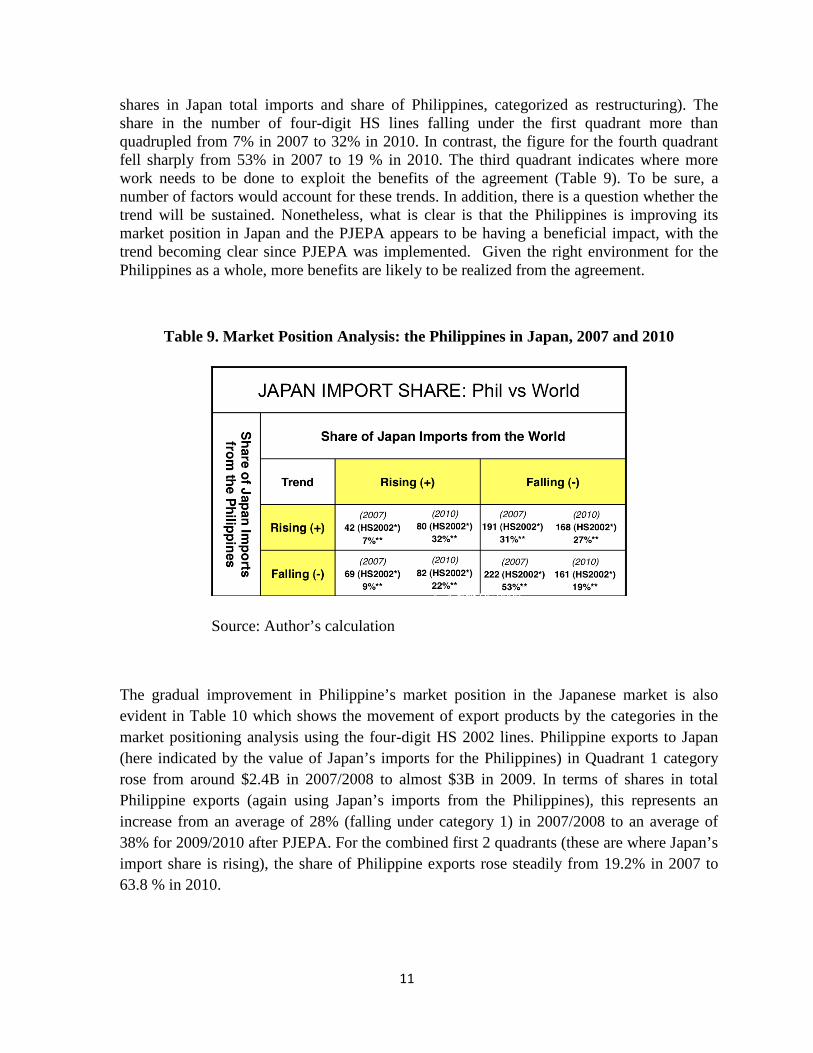
shares in Japan total imports and share of Philippines, categorized as restructuring). The share in the number of four-digit HS lines falling under the first quadrant more than quadrupled from 7% in 2007 to 32% in 2010. In contrast, the figure for the fourth quadrant fell sharply from 53% in 2007 to 19 % in 2010. The third quadrant indicates where more work needs to be done to exploit the benefits of the agreement (Table 9). To be sure, a number of factors would account for these trends. In addition, there is a question whether the trend will be sustained. Nonetheless, what is clear is that the Philippines is improving its market position in Japan and the PJEPA appears to be having a beneficial impact, with the trend becoming clear since PJEPA was implemented. Given the right environment for the Philippines as a whole, more benefits are likely to be realized from the agreement.
Table 9. Market Position Analysis: the Philippines in Japan, 2007 and 2010
Source: Author’s calculation
The gradual improvement in Philippine’s market position in the Japanese market is also evident in Table 10 which shows the movement of export products by the categories in the market positioning analysis using the four-digit HS 2002 lines. Philippine exports to Japan (here indicated by the value of Japan’s imports for the Philippines) in Quadrant 1 category rose from around $2.4B in 2007/2008 to almost $3B in 2009. In terms of shares in total Philippine exports (again using Japan’s imports from the Philippines), this represents an increase from an average of 28% (falling under category 1) in 2007/2008 to an average of 38% for 2009/2010 after PJEPA. For the combined first 2 quadrants (these are where Japan’s import share is rising), the share of Philippine exports rose steadily from 19.2% in 2007 to 63.8 % in 2010.

12
Table 10. Value of Japan’s Imports from the Philippines in US$ 2007 - 2010
Source of basic data: UNCOMTRADE
Utilization of PJEPA by Philippine Exporters
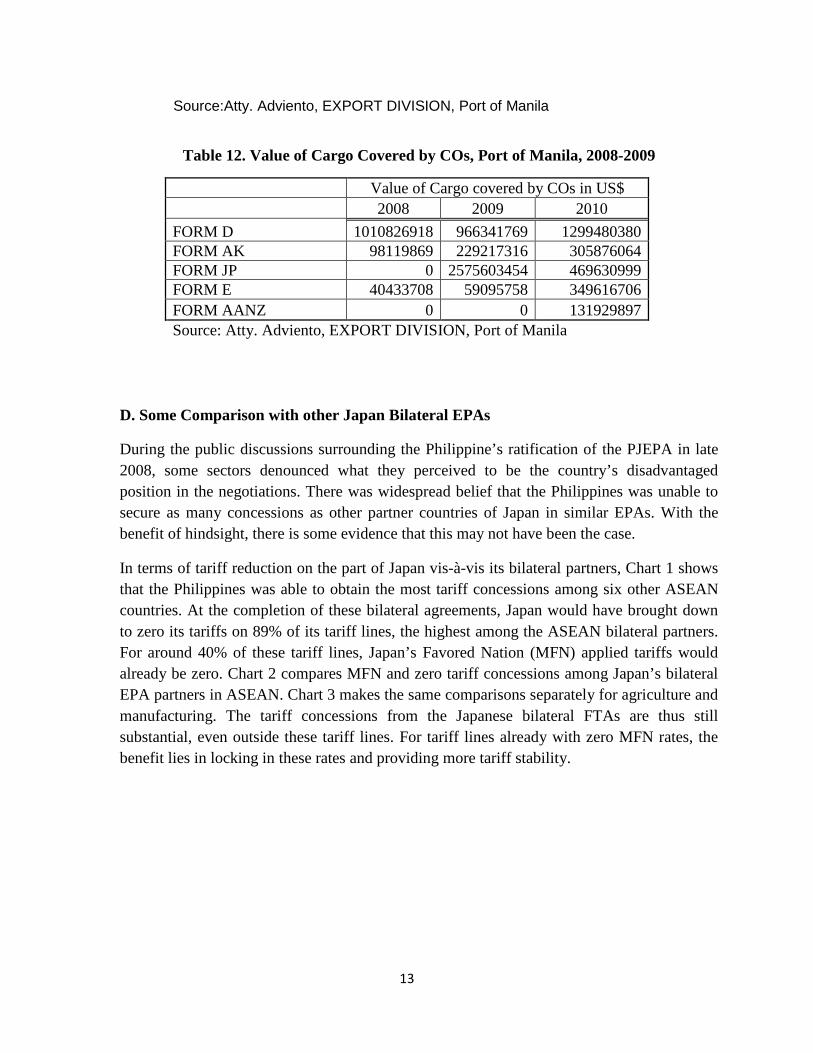
We also note the utilization of PJEPA by looking at the Certificate of Origins (COs) issued by the Philippine Bureau of Customs (BOC- the agency in charge of issuing the COs for the Philippines). Except for ASEAN-Australia New Zealand Free Trade Agreement (AANZFTA), the FTAs involving the Philippines entered into force ahead of PJEPA, with the ASEAN Free Trade Agreement (AFTA) as the oldest. Table 11 shows many exporters quickly made use of PJEPA. Indeed, in terms of value of cargo, it overtook ASEAN at its start (Table 12). While the number of COs rose for PJEPA, the value of cargos covered in 2010 went down. This follows from the overall decline in Philippine exports to Japan for that year, most possibly arising from the tsunami.
Table 11. Number of Certificate of Origins Issued, Port of Manila, 2008-2009
Number of COs issued 2008 2009 2010
FORM D (AFTA) 13650 12749 15117 FORM AK (ASEAN Korea) 1970 2082 2415 FORM JP (PJEPA) 0 7382 8214 FORM E (ASEAN-China) 678 972 2633 FORM AANZ (ASEAN-Australia/New Zealand 0 0 2559
13
Source:Atty. Adviento, EXPORT DIVISION, Port of Manila
Table 12. Value of Cargo Covered by COs, Port of Manila, 2008-2009
Value of Cargo covered by COs in US$ 2008 2009 2010 FORM D 1010826918 966341769 1299480380 FORM AK 98119869 229217316 305876064 FORM JP 0 2575603454 469630999 FORM E 40433708 59095758 349616706 FORM AANZ 0 0 131929897 Source: Atty. Adviento, EXPORT DIVISION, Port of Manila
D. Some Comparison with other Japan Bilateral EPAs
During the public discussions surrounding the Philippine’s ratification of the PJEPA in late 2008, some sectors denounced what they perceived to be the country’s disadvantaged position in the negotiations. There was widespread belief that the Philippines was unable to secure as many concessions as other partner countries of Japan in similar EPAs. With the benefit of hindsight, there is some evidence that this may not have been the case.
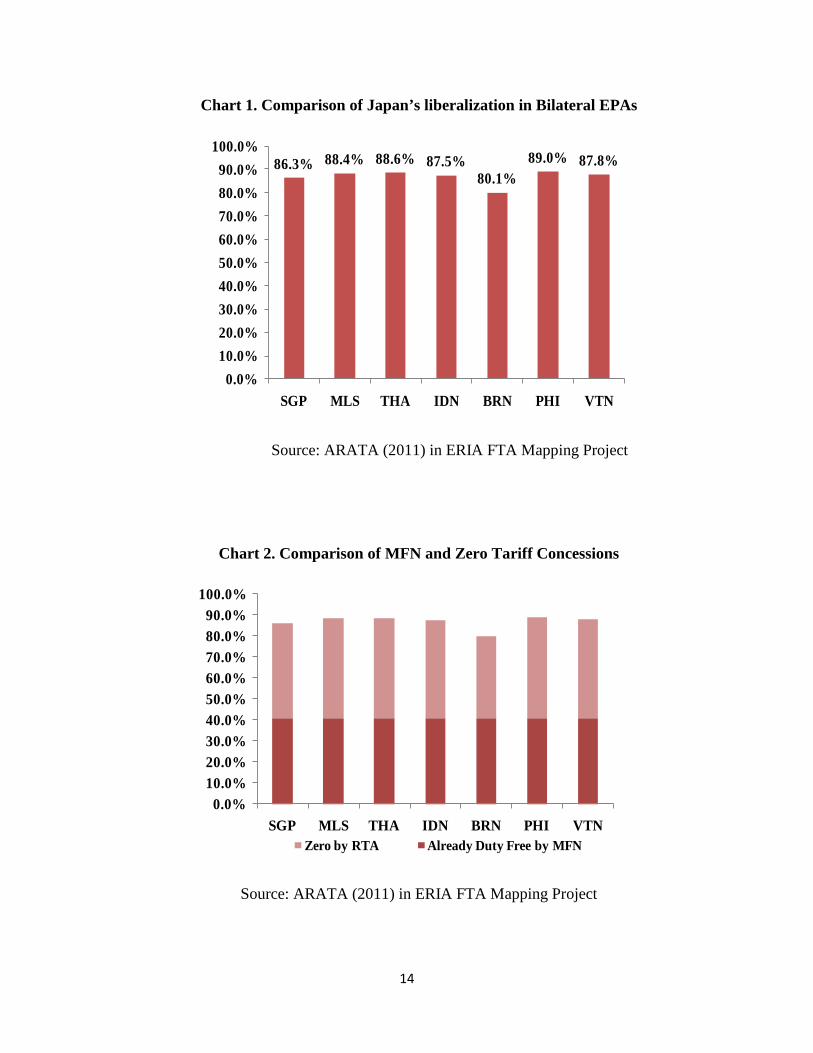
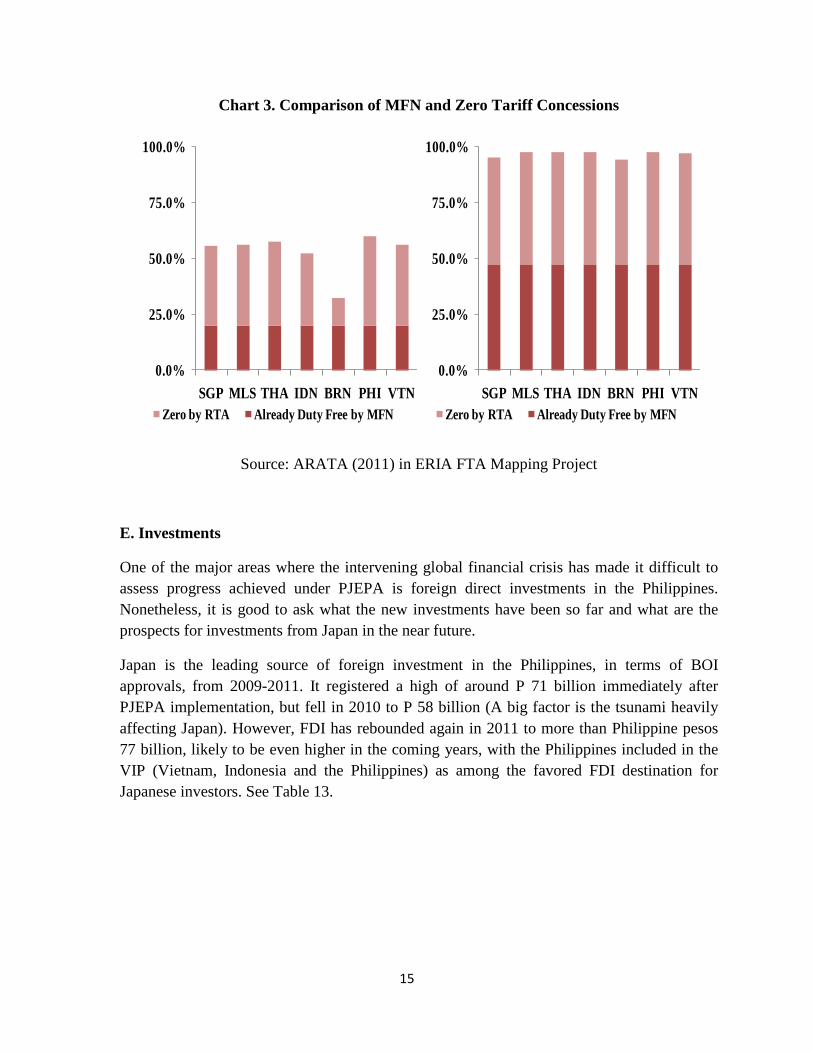
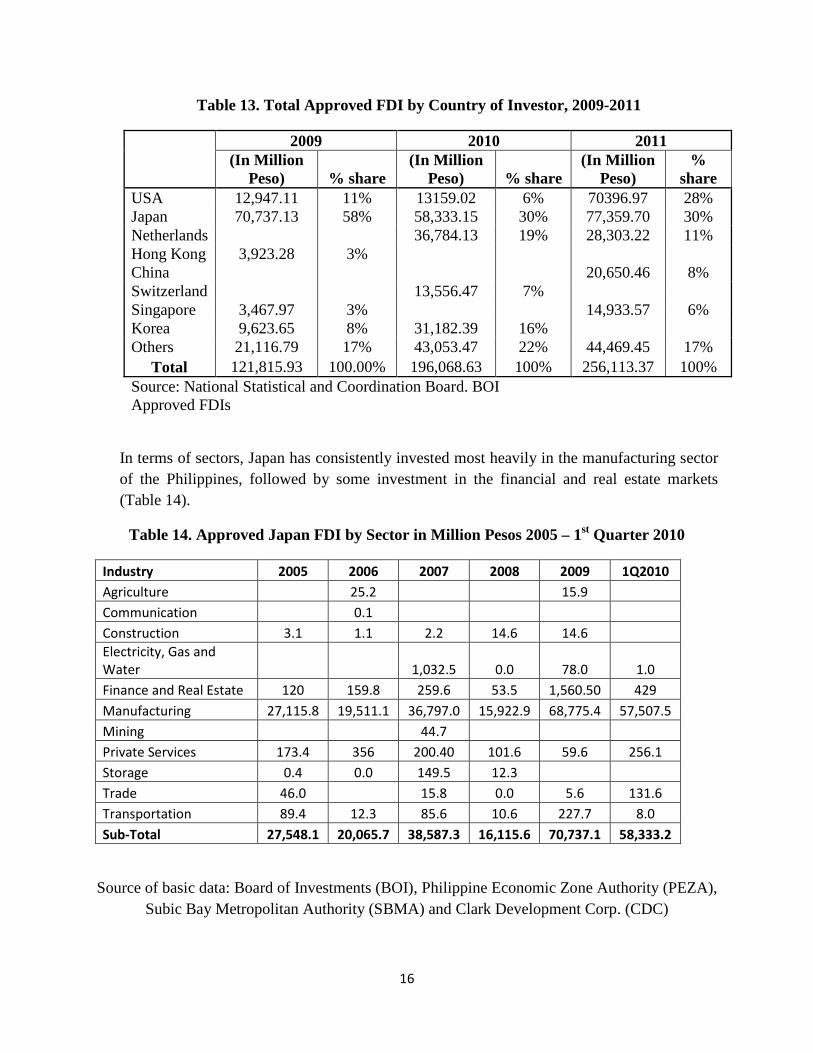
In terms of tariff reduction on the part of Japan vis-à-vis its bilateral partners, Chart 1 shows that the Philippines was able to obtain the most tariff concessions among six other ASEAN countries. At the completion of these bilateral agreements, Japan would have brought down to zero its tariffs on 89% of its tariff lines, the highest among the ASEAN bilateral partners. For around 40% of these tariff lines, Japan’s Favored Nation (MFN) applied tariffs would already be zero. Chart 2 compares MFN and zero tariff concessions among Japan’s bilateral EPA partners in ASEAN. Chart 3 makes the same comparisons separately for agriculture and manufacturing. The tariff concessions from the Japanese bilateral FTAs are thus still substantial, even outside these tariff lines. For tariff lines already with zero MFN rates, the benefit lies in locking in these rates and providing more tariff stability.
14
Chart 1. Comparison of Japan’s liberalization in Bilateral EPAs
Source: ARATA (2011) in ERIA FTA Mapping Project
Chart 2. Comparison of MFN and Zero Tariff Concessions
Source: ARATA (2011) in ERIA FTA Mapping Project
86.3% 88.4% 88.6% 87.5%80.1%
89.0% 87.8%
0.0%10.0%20.0%30.0%40.0%50.0%60.0%70.0%80.0%90.0%
100.0%
SGP MLS THA IDN BRN PHI VTN
0.0%10.0%20.0%30.0%40.0%50.0%60.0%70.0%80.0%90.0%
100.0%
SGP MLS THA IDN BRN PHI VTNZero by RTA Already Duty Free by MFN
15
Chart 3. Comparison of MFN and Zero Tariff Concessions
Source: ARATA (2011) in ERIA FTA Mapping Project
E. Investments
One of the major areas where the intervening global financial crisis has made it difficult to assess progress achieved under PJEPA is foreign direct investments in the Philippines. Nonetheless, it is good to ask what the new investments have been so far and what are the prospects for investments from Japan in the near future.
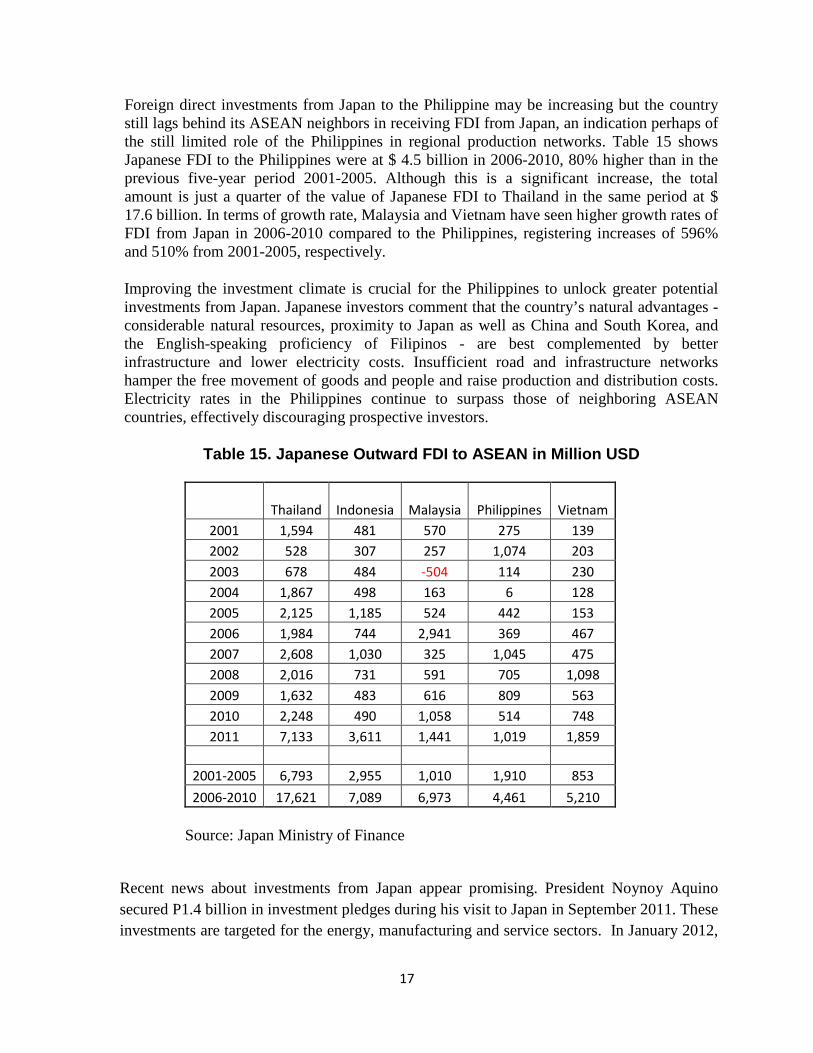
Japan is the leading source of foreign investment in the Philippines, in terms of BOI approvals, from 2009-2011. It registered a high of around P 71 billion immediately after PJEPA implementation, but fell in 2010 to P 58 billion (A big factor is the tsunami heavily affecting Japan). However, FDI has rebounded again in 2011 to more than Philippine pesos 77 billion, likely to be even higher in the coming years, with the Philippines included in the VIP (Vietnam, Indonesia and the Philippines) as among the favored FDI destination for Japanese investors. See Table 13.
0.0%
25.0%
50.0%
75.0%
100.0%
SGP MLS THA IDN BRN PHI VTNZero by RTA Already Duty Free by MFN
0.0%
25.0%
50.0%
75.0%
100.0%
SGP MLS THA IDN BRN PHI VTNZero by RTA Already Duty Free by MFN
16
Table 13. Total Approved FDI by Country of Investor, 2009-2011
2009 2010 2011
(In Million
Peso) % share (In Million
Peso) % share (In Million
Peso) %
share USA 12,947.11 11% 13159.02 6% 70396.97 28% Japan 70,737.13 58% 58,333.15 30% 77,359.70 30% Netherlands 36,784.13 19% 28,303.22 11% Hong Kong 3,923.28 3% China 20,650.46 8% Switzerland 13,556.47 7% Singapore 3,467.97 3% 14,933.57 6% Korea 9,623.65 8% 31,182.39 16% Others 21,116.79 17% 43,053.47 22% 44,469.45 17% Total 121,815.93 100.00% 196,068.63 100% 256,113.37 100% Source: National Statistical and Coordination Board. BOI Approved FDIs
In terms of sectors, Japan has consistently invested most heavily in the manufacturing sector of the Philippines, followed by some investment in the financial and real estate markets (Table 14).
Table 14. Approved Japan FDI by Sector in Million Pesos 2005 – 1st Quarter 2010
Industry 2005 2006 2007 2008 2009 1Q2010 Agriculture 25.2 15.9 Communication 0.1 Construction 3.1 1.1 2.2 14.6 14.6 Electricity, Gas and Water 1,032.5 0.0 78.0 1.0 Finance and Real Estate 120 159.8 259.6 53.5 1,560.50 429 Manufacturing 27,115.8 19,511.1 36,797.0 15,922.9 68,775.4 57,507.5 Mining 44.7 Private Services 173.4 356 200.40 101.6 59.6 256.1 Storage 0.4 0.0 149.5 12.3 Trade 46.0 15.8 0.0 5.6 131.6 Transportation 89.4 12.3 85.6 10.6 227.7 8.0 Sub-Total 27,548.1 20,065.7 38,587.3 16,115.6 70,737.1 58,333.2
Source of basic data: Board of Investments (BOI), Philippine Economic Zone Authority (PEZA), Subic Bay Metropolitan Authority (SBMA) and Clark Development Corp. (CDC)
17
Foreign direct investments from Japan to the Philippine may be increasing but the country still lags behind its ASEAN neighbors in receiving FDI from Japan, an indication perhaps of the still limited role of the Philippines in regional production networks. Table 15 shows Japanese FDI to the Philippines were at $ 4.5 billion in 2006-2010, 80% higher than in the previous five-year period 2001-2005. Although this is a significant increase, the total amount is just a quarter of the value of Japanese FDI to Thailand in the same period at $ 17.6 billion. In terms of growth rate, Malaysia and Vietnam have seen higher growth rates of FDI from Japan in 2006-2010 compared to the Philippines, registering increases of 596% and 510% from 2001-2005, respectively.
Improving the investment climate is crucial for the Philippines to unlock greater potential investments from Japan. Japanese investors comment that the country’s natural advantages -considerable natural resources, proximity to Japan as well as China and South Korea, and the English-speaking proficiency of Filipinos - are best complemented by better infrastructure and lower electricity costs. Insufficient road and infrastructure networks hamper the free movement of goods and people and raise production and distribution costs. Electricity rates in the Philippines continue to surpass those of neighboring ASEAN countries, effectively discouraging prospective investors.
Table 15. Japanese Outward FDI to ASEAN in Million USD
Thailand
Indonesia
Malaysia
Philippines Vietnam 2001 1,594 481 570 275 139 2002 528 307 257 1,074 203 2003 678 484 -504 114 230 2004 1,867 498 163 6 128 2005 2,125 1,185 524 442 153 2006 1,984 744 2,941 369 467 2007 2,608 1,030 325 1,045 475 2008 2,016 731 591 705 1,098 2009 1,632 483 616 809 563 2010 2,248 490 1,058 514 748 2011 7,133 3,611 1,441 1,019 1,859
2001-2005 6,793 2,955 1,010 1,910 853
2006-2010 17,621 7,089 6,973 4,461 5,210
Source: Japan Ministry of Finance
Recent news about investments from Japan appear promising. President Noynoy Aquino secured P1.4 billion in investment pledges during his visit to Japan in September 2011. These investments are targeted for the energy, manufacturing and service sectors. In January 2012,
18
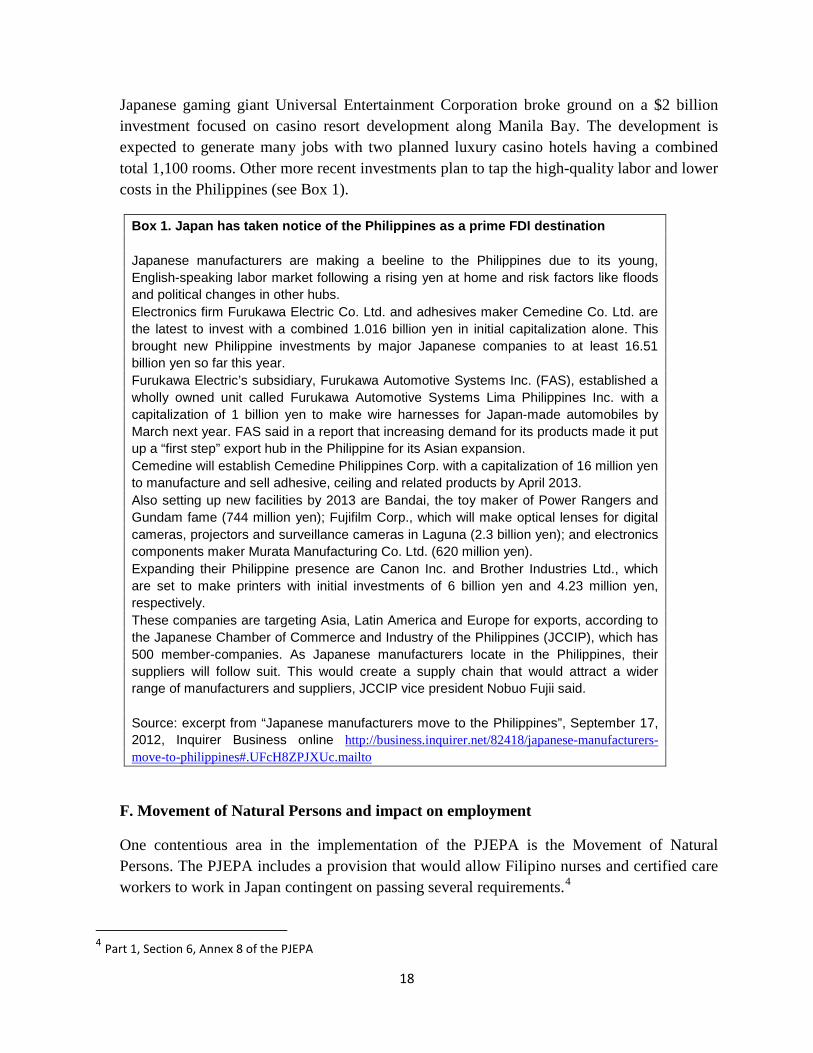
Japanese gaming giant Universal Entertainment Corporation broke ground on a $2 billion investment focused on casino resort development along Manila Bay. The development is expected to generate many jobs with two planned luxury casino hotels having a combined total 1,100 rooms. Other more recent investments plan to tap the high-quality labor and lower costs in the Philippines (see Box 1).
Box 1. Japan has taken notice of the Philippines as a prime FDI destination Japanese manufacturers are making a beeline to the Philippines due to its young, English-speaking labor market following a rising yen at home and risk factors like floods and political changes in other hubs. Electronics firm Furukawa Electric Co. Ltd. and adhesives maker Cemedine Co. Ltd. are the latest to invest with a combined 1.016 billion yen in initial capitalization alone. This brought new Philippine investments by major Japanese companies to at least 16.51 billion yen so far this year. Furukawa Electric’s subsidiary, Furukawa Automotive Systems Inc. (FAS), established a wholly owned unit called Furukawa Automotive Systems Lima Philippines Inc. with a capitalization of 1 billion yen to make wire harnesses for Japan-made automobiles by March next year. FAS said in a report that increasing demand for its products made it put up a “first step” export hub in the Philippine for its Asian expansion. Cemedine will establish Cemedine Philippines Corp. with a capitalization of 16 million yen to manufacture and sell adhesive, ceiling and related products by April 2013. Also setting up new facilities by 2013 are Bandai, the toy maker of Power Rangers and Gundam fame (744 million yen); Fujifilm Corp., which will make optical lenses for digital cameras, projectors and surveillance cameras in Laguna (2.3 billion yen); and electronics components maker Murata Manufacturing Co. Ltd. (620 million yen). Expanding their Philippine presence are Canon Inc. and Brother Industries Ltd., which are set to make printers with initial investments of 6 billion yen and 4.23 million yen, respectively. These companies are targeting Asia, Latin America and Europe for exports, according to the Japanese Chamber of Commerce and Industry of the Philippines (JCCIP), which has 500 member-companies. As Japanese manufacturers locate in the Philippines, their suppliers will follow suit. This would create a supply chain that would attract a wider range of manufacturers and suppliers, JCCIP vice president Nobuo Fujii said. Source: excerpt from “Japanese manufacturers move to the Philippines”, September 17, 2012, Inquirer Business online http://business.inquirer.net/82418/japanese-manufacturers-move-to-philippines#.UFcH8ZPJXUc.mailto
F. Movement of Natural Persons and impact on employment
One contentious area in the implementation of the PJEPA is the Movement of Natural Persons. The PJEPA includes a provision that would allow Filipino nurses and certified care workers to work in Japan contingent on passing several requirements.4
4 Part 1, Section 6, Annex 8 of the PJEPA
19
Professional and civil society groups continue to voice concern about the stringent Japanese standards and difficult Japanese language proficiency and national exams. Media reports state that as of May 2011 only two Filipina nurses had passed the licensure exam and 229 caregivers allowed to work in Japan. However, these reports appear to contradict data recently obtained from other sources *(Japanese embassy) which highlight the following:
310 Filipino candidates for nurses and certified care workers (93 nurses, 190 care workers, and 27 care students) were accepted in FY2009. 128 Filipino candidates for nurses and certified care workers (46 nurses, 72 care workers, 10 care students) were accepted in FY2010. 131 Filipino candidates for nurses and certified care workers (70 nurses and 61 care workers) were accepted in FY2011.
It is difficult to verify information related to the Movement of Natural Persons not just in terms of statistics but also on the procedures and programs related to the hiring of qualified Filipino health care workers. There is a clear need for better information dissemination about work opportunities in Japan and the education of the public about workers’ rights and labor protection.
More important than the impact on the Movement of Natural Persons, however, is the impact on employment. The paper benefits from the current study by Lanzona on the impact of free trade agreements on domestic labor markets.5 The study aims to provide an empirical analysis of the effects of FTA provisions on employment using previous FTAs that the Philippines has engaged in recently, namely, the AFTA and the PJEPA. The study uses panel data of workers and a framework of a worker employment model. Preliminary results of the study indicate that the PJEPA has had a positive impact on labor, meaning the PJEPA increases the probability of being employed, controlling for the effects of increased imports from partner countries. Given that the average value of Philippine imports from Japan in the period 2009-2011 are lower than in the period 2006-2008 and that the percentage of imports from Japan to total Philippine imports has been declining since 2006, we can make an initial conclusion that Philippine employment has not had a negative impact from the PJEPA.
H. Cooperation and Capacity-Building Projects
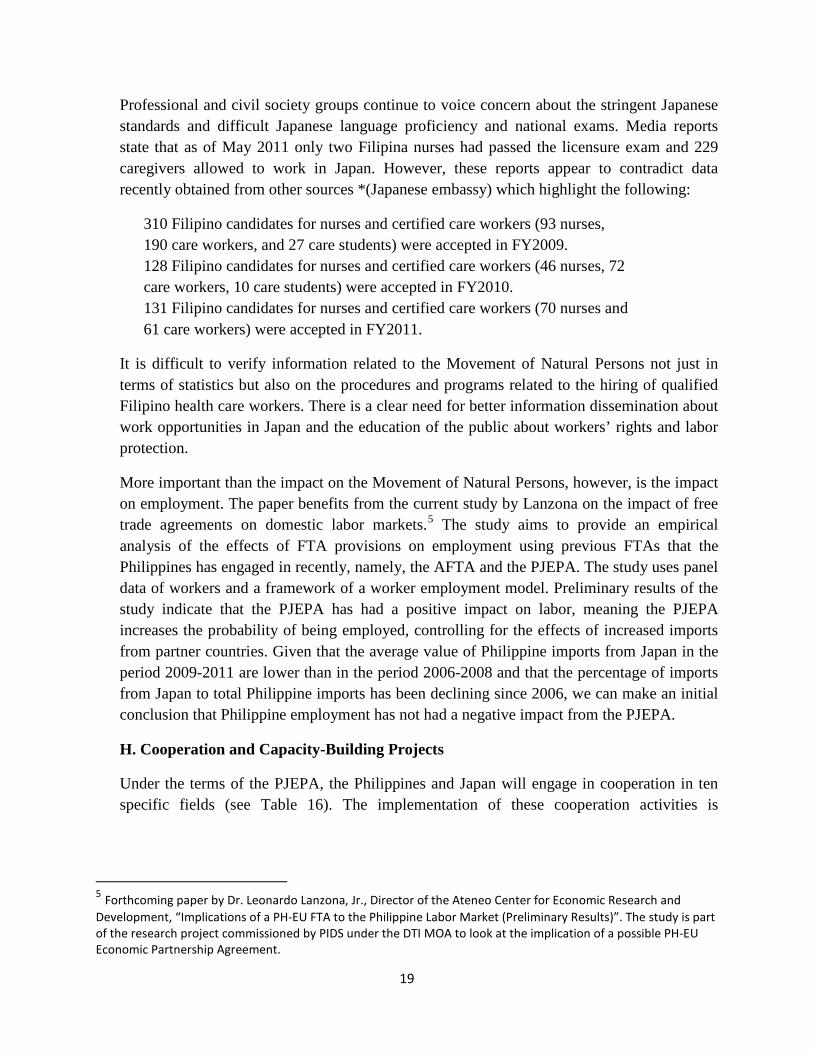
Under the terms of the PJEPA, the Philippines and Japan will engage in cooperation in ten specific fields (see Table 16). The implementation of these cooperation activities is
5 Forthcoming paper by Dr. Leonardo Lanzona, Jr., Director of the Ateneo Center for Economic Research and Development, “Implications of a PH-EU FTA to the Philippine Labor Market (Preliminary Results)”. The study is part of the research project commissioned by PIDS under the DTI MOA to look at the implication of a possible PH-EU Economic Partnership Agreement.
20
contingent on the availability of appropriated funds, with costs to be shouldered equitably by both parties.6
Table 16. Fields of Cooperation under PJEPA
Field of Cooperation Possible Areas / Forms of Cooperation Human Resource Development Education and training
Harmonization of competency standards Financial Services Promotion of regulatory cooperation in
financial services Improvement of financial market infrastructure
Information and communications Human resource development in the ICT sector Development of ICT infrast5ructure, ICT related services and digital content
Energy and Environment Improvement of utilization of energy Protection and management of the environment
Science and Technology Advance science and technology, agriculture, forestry, fisheries and management of natural resources Human health and nutrition
Trade and Investment Promotion Trade and investment activities, including those conducted by private enterprises
Small and Medium Enterprise (SMEs) Strengthening of management and competitiveness of SMEs Human resource development
Tourism Promotion and development of tourism Human resource development
Transportation Improvement of the technology of transportation Human resource development
Road Development Improvement of the technology of road development Human resource development
Source: Primer on Japan-Philippines Economic Partnership Agreement Capacity building in the form of cooperation and technical assistance programs, especially geared towards domestic initiatives for implementing reforms, are important as they serve as catalysts for positive change. Training and the transfer of technology and skills help secure a more sustainable basis for development, especially for the Philippines where trade in services
6 Primer on Japan-Philippines Economic Partnership Agreement
21
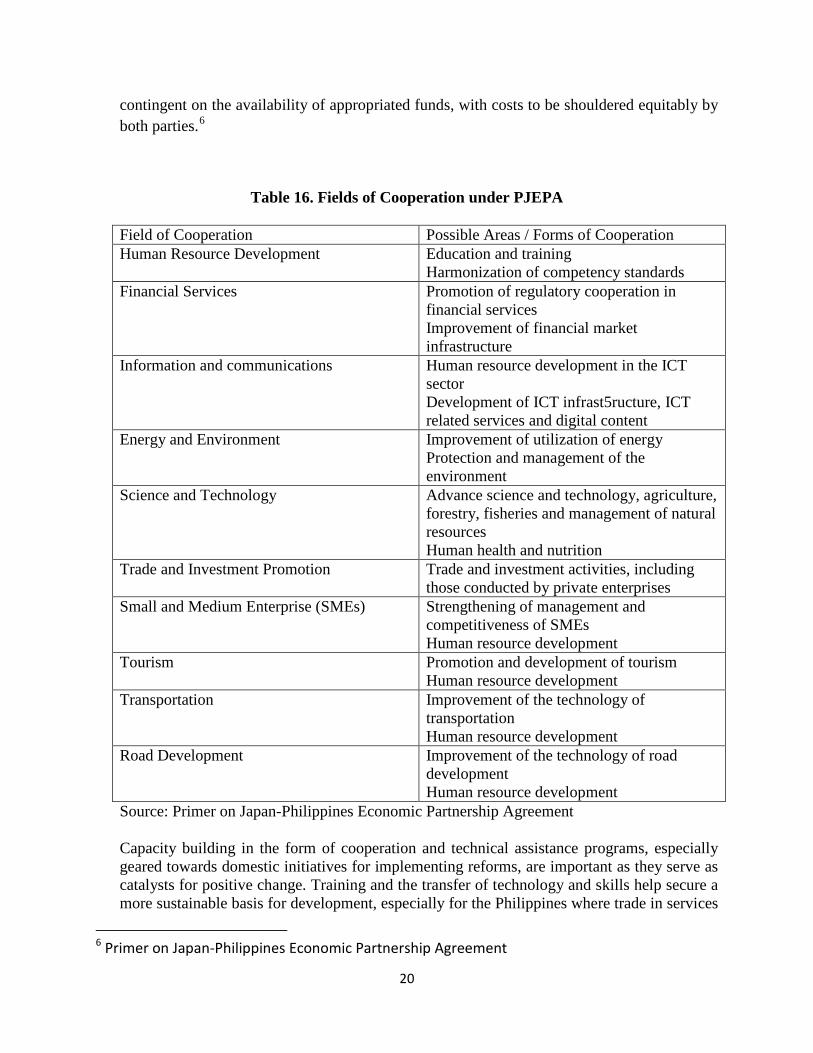
rather than goods constitutes an increasing share of GDP activity. In recent years, there seems to be some encouraging developments in technical cooperation for various areas. Table 17 lists projects undertaken by the Japan International Cooperation Agency in fields such as eco-tourism, environmental protection and disaster risk management. These projects were mainly group trainings held in Japan and accomplished in 2009.
Table 17. JICA Capacity Building Programs
Source: JICA
The various working groups under the PJEPA are also active in cooperation projects. The Human Resources Development, ICT and Energy and Environment working groups have ongoing or completed projects that involve technical training (Table 18). It is very important that the Philippines take advantage of the technical cooperation features of the agreement as well as the inventory and monitoring of cooperation and capability building projects and programs.

22
Table 18. PJEPA Cooperation: Requested, Ongoing or Completed Projects
Source: various
23
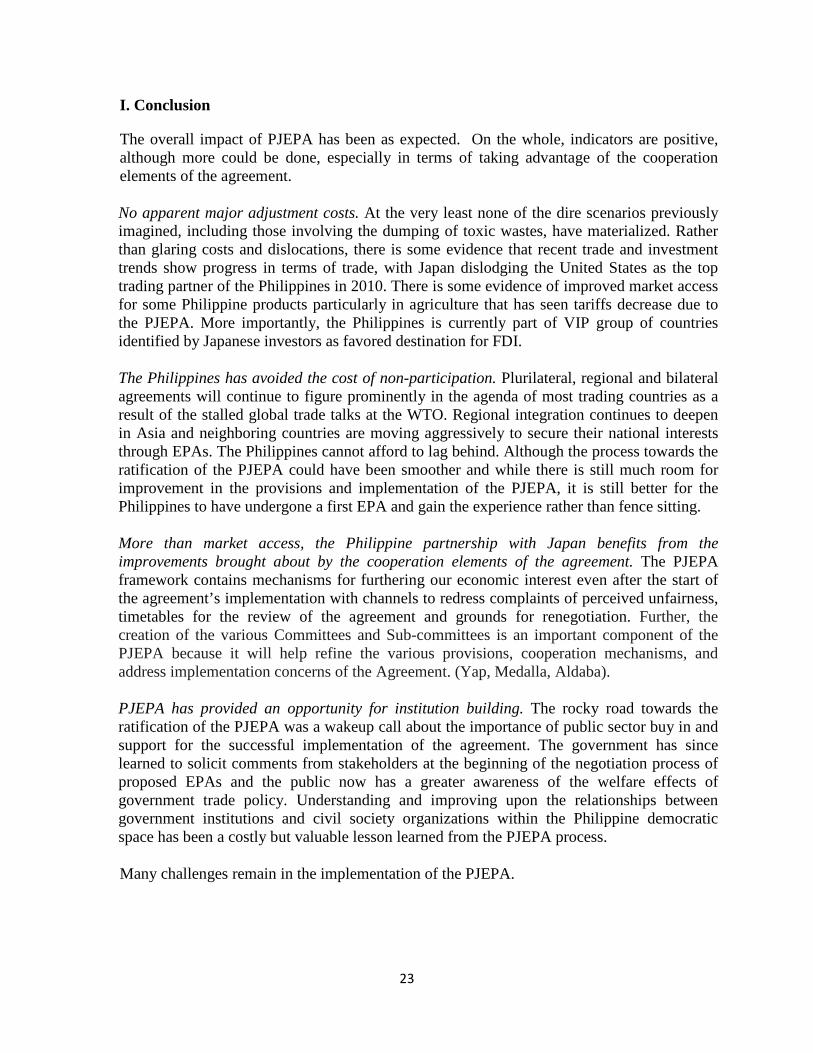
I. Conclusion
The overall impact of PJEPA has been as expected. On the whole, indicators are positive, although more could be done, especially in terms of taking advantage of the cooperation elements of the agreement. No apparent major adjustment costs. At the very least none of the dire scenarios previously imagined, including those involving the dumping of toxic wastes, have materialized. Rather than glaring costs and dislocations, there is some evidence that recent trade and investment trends show progress in terms of trade, with Japan dislodging the United States as the top trading partner of the Philippines in 2010. There is some evidence of improved market access for some Philippine products particularly in agriculture that has seen tariffs decrease due to the PJEPA. More importantly, the Philippines is currently part of VIP group of countries identified by Japanese investors as favored destination for FDI.
The Philippines has avoided the cost of non-participation. Plurilateral, regional and bilateral agreements will continue to figure prominently in the agenda of most trading countries as a result of the stalled global trade talks at the WTO. Regional integration continues to deepen in Asia and neighboring countries are moving aggressively to secure their national interests through EPAs. The Philippines cannot afford to lag behind. Although the process towards the ratification of the PJEPA could have been smoother and while there is still much room for improvement in the provisions and implementation of the PJEPA, it is still better for the Philippines to have undergone a first EPA and gain the experience rather than fence sitting. More than market access, the Philippine partnership with Japan benefits from the improvements brought about by the cooperation elements of the agreement. The PJEPA framework contains mechanisms for furthering our economic interest even after the start of the agreement’s implementation with channels to redress complaints of perceived unfairness, timetables for the review of the agreement and grounds for renegotiation. Further, the creation of the various Committees and Sub-committees is an important component of the PJEPA because it will help refine the various provisions, cooperation mechanisms, and address implementation concerns of the Agreement. (Yap, Medalla, Aldaba).
PJEPA has provided an opportunity for institution building. The rocky road towards the ratification of the PJEPA was a wakeup call about the importance of public sector buy in and support for the successful implementation of the agreement. The government has since learned to solicit comments from stakeholders at the beginning of the negotiation process of proposed EPAs and the public now has a greater awareness of the welfare effects of government trade policy. Understanding and improving upon the relationships between government institutions and civil society organizations within the Philippine democratic space has been a costly but valuable lesson learned from the PJEPA process. Many challenges remain in the implementation of the PJEPA.

24
Labor Protection. The strong labor standards negotiated in the PJEPA call for measures to protect Filipino workers. A Communication Plan should be put in place to educate the public to prevent them from being deceived by illegal recruiters.
Need for monitoring. The ongoing review process of the PJEPA is the next step in the education of the Philippines in “EPA 101”, and close monitoring if country is achieving the objectives it set for itself when it signed the PJEPA.
Need for more information campaigns. The benefits of PJEPA need to be more widely disseminated, especially those that positively impact on businesses.
Need to design projects and programs for cooperation and capacity building. In line with labor protection, setting up Japanese language institutions in the Philippines could be part of the solution for hurdling the high entry barriers in Japan for qualified Filipino nurses and health workers. Forming and engaging subcommittees for cooperation could increase the number of joint training and cooperation projects. It cannot be overstressed that the Philippines take advantage of the opportunities for technical training under the PJEPA. One area that can be looked into is training for Philippine exporters on food quality and safety, which are sensitive considerations for the Japanese market. PJEPA promotes mutual recognition and conformity assessment procedures for products and processes component (including sanitary and phyto-sanitary measures or SPS), which aim to help Philippines exporters meet Japan’s standards and requirements. Technical cooperation and investment cooperation could be explored to address the weaknesses in the agriculture sector and improve capacities on SPS measures and exchange of information and training. Other notable trade facilitation measures include Mutual Recognition Agreements (MRAs), standards and conformance, customs procedures, ODA and the environment.
The PJEPA is a landmark agreement for the Philippines in many respects, with early gainers, untapped opportunities and issues that still need to be addressed. It is also a work in progress with room for revision and appropriate mechanisms to continually further the national interest. The lessons learned from the implementation of the PJEPA could help the country negotiate succeeding economic partnership agreements with more savvy, knowledge and skill.
25
References:
Aldaba, Rafaelita M., “Globalization and the Need for Strategic Government-Industry Cooperation in the Philippine Automotive Industry”, PIDS Discussion Paper Series No. 2008-21.
Inquirer Business online, “Japanese manufacturers move to the Philippines”, September 17, 2012.
Lanzona, Leonardo, Jr., “Implications of a PH-EU FTA to the Philippine Labor Market (Preliminary Results), unpublished paper.
Medalla, Erlinda M., Vidar-Vale Catherine and Balboa, Jenny D., “Japan-Philippines Economic Partnership Agreement (JPEPA): Toward a Framework for Regional Economic Integration”, PIDS Discussion Paper Series No. 2010-19.
Primer on the Japan-Philippines Economic Partnership Agreement, Philippine Exporters Confederation Inc., 2007.
Yap, Josef T., Medalla, Erlinda M., Aldaba, Rafaelita M., “The JPEPA: Why Ratify?”, PIDS Discussion Paper Series No. 2007-02.
Yap, Josef T., Medalla, Erlinda M., and Aldaba, Rafaelita M., “Assessing the Japan-Philippines Economic Partnership Agreement”, PIDS Discussion Paper Series No. 2006-10.