phoenix global resources plc annual report and accounts 2020
TRANSCRIPT

Phoenix Global Resources plcAnnual Report and Accounts 2020
Phoenix G
lobal Resources plc A
nn
ual R
eport a
nd
Accounts 20
20

Contents
Phoenix Global Resources plc Annual Report and Accounts 2020
Strategic report
Chairman’s Statement p01
Our Strategy and KPIs p02
Operating Review p06
Financial Review p11
Risk Management p14
Sustainability Review p21
Stakeholder Engagement p23
Governance
Corporate Governance Statement p25
Remuneration Policy Report p36
Annual Remuneration Report p44
Directors’ Report p47
Statement of Directors’ p50 Responsibilities
Financial statements
Independent Auditors’ Report p51
Consolidated Income Statement p58
Consolidated Statement of p59 Comprehensive Income
Consolidated Statement of p60 Financial Position
Consolidated Statement of p61 Changes in Equity
Consolidated Statement of p62 Cash Flows
Notes to the consolidated p63 financial statements
Company Statement of p101 Financial Position
Company Statement of p102 Changes in Equity
Company Statement of Cash Flows p103
Notes to the Company p104 financial statements
Shareholder Information p116
Phoenix Global Resources plc Annual Report and Accounts 2020

Chairman’s Statement
1 Phoenix Global Resources plc Annual Report and Accounts 2020
Dear Shareholders, Whilst the environment continues to be extremely challenging, the directors have taken significant steps to restructure the Company, which the directors believe will put the Company in a stronger position to focus on the continued development of its unconventional assets.
The Company’s major shareholder, Mercuria Group Limited ('Mercuria'), continues to be supportive and the directors, whilst exercising a degree of caution, believes the actions taken put the Company on a stronger financial footing, whilst appreciating this position could change very quickly in these uncertain times.
Overview and current operations 2020 was dominated by Covid-19 and its rapid development as a life-threatening global pandemic. Globally, respective governments’ response has been one of containment through lock-down, social distancing restrictions, quarantine and self-isolation for substantially all citizens, whilst countries strive to roll out vaccination programs. This has resulted in a significant adverse impact on industrial and commercial activity, which led to the shut-down of the Company’s production in April 2020. Consequently, the Company took significant steps to reduce its costs in all areas of the business. Annual general and administration costs were reduced by over 50% and field contracts restructured to reposition the cost base of the Company. The directors believe these cost reduction actions mean the Company is in a better position to produce oil economically at lower oil prices with a positive contribution to cash flow at normalised production levels, which will allow the Company to focus on the continued development of its unconventional assets.
During the year Kevin Dennehy, David Jackson and Javier Alvarez stepped down from the board and we would like to thank them for the significant contributions they have made during their time with the Company.
Our new CEO, Pablo Bizzotto, was appointed in September 2020 and has extensive oil industry experience, particularly in unconventional activities in the Vaca Muerta through his previous role with YPF. With the appointment of Pablo Bizzotto, the Company’s prime focus for 2021 and 2022 is the development of its Mata Mora licences and the exploration of its Corralera licences and a new study and execution team has been hired to facilitate these objectives.
The Company has been in discussions with the Neuquen Province to secure an unconventional exploitation concession for its Mata Mora block and an extension of its Corralera licence commitment obligations. Since the year end, the Province has issued a Decree granting a 35-year unconventional exploitation concession over approximately 43,372 acres in the northern part of Mata Mora and extending for 5 years to April 2026 the exploration rights over approximately 11,918 acres in the southern part of Mata Mora. Furthermore, the Province has issued a Decree approving a one-year extension of the exploration rights for the Corralera Noreste and Corralera Sur blocks to April 2022.
The Mata Mora concession involves a pilot phase, with certain works to be completed by March 2026, which includes a capex commitment of US$110 million, consisting of four pads of three horizontal wells each, with an average lateral length of 2,150 metres. The Corralera exploration commitment includes obligations to execute two horizontal wells by April 2022.
The work program planned for 2021 includes the drilling of the first pad of three wells in Mata Mora and the drilling and completion of the two horizontal wells in Corralera with the second pad of three
wells in Mata Mora to be drilled and completed in 2022 together with the completion of the first pad of three wells.
Funding Our major shareholder, Mercuria continues to be supportive of the Company’s plans and has extended short-term debt facilities to fund operations. Mercuria has written to the Company stating its intention to continue to provide financial support to the Company in order that it may continue to operate and service its liabilities as they fall due in the next 12 months and also fund the planned work programs. Mercuria has also specifically agreed to not demand repayment of the existing loans (principal and interest) within the next 12 months whilst discussions with the Company to restructure these loans continue. This letter, which by its nature is not legally binding, represents a letter of comfort stating Mercuria’s current intention to continue to provide financial support. The directors believe they will be able to agree the renegotiation of the existing debt with Mercuria and formalise an agreement for new funding and that the Group and Company can continue as a going concern for the foreseeable future. The application of the going concern basis of preparation of the financial statements included in this annual report is based on the letter that has been received from Mercuria and the ongoing discussion with the Mercuria principals. Accordingly, the directors continue to adopt the going concern basis for accounting in preparing the 2020 financial statements. However, the directors recognise that if financial support over the next 12 months from Mercuria were not to be available and the Company is unable to restructure the existing loan agreements from Mercuria or obtain funding from alternative sources, this gives rise to a material uncertainty that may cast significant doubt on the Group’s and Company’s ability to continue as a going concern.
Summary Whilst we have seen Covid-19 restrictions gradually lifting and economic and industrial activity increasing, the situation continues to be fluid and can change very quickly as we have seen with a number of countries experiencing 'second and third waves'.
Argentina continues to experience high inflation and a continuous devaluation of the Peso. The country is in its third straight year of recession. Whilst it announced at the end of August 2020 that 99% of the holders of the country’s US$65 billion international bonds had agreed to restructure this debt, giving the country a better chance of recovery, discussions between the Argentine government and the IMF to reschedule US$45 billion of debt are ongoing and the outcome of the 2021 legislative elections in Argentina is uncertain. The current administration continues its intent to provide economic and regulatory support to four key sectors of the economy: agriculture; oil and gas; mining; and intellectual services.
The Company is also conscious of its environmental, social governance responsibilities and is developing policies and procedures to reduce emissions and establish goals that minimise the impact on the environment and our stakeholders.
Whilst these are truly unprecedented times with disruption on the demand and supply side, the directors believe they can leverage this situation and take this opportunity to continue to reduce and optimise the Company’s normalised production cost base. The Company is fundamentally focused on unconventional development and has excellent assets in this space and believes it is now better placed to progress the development of these assets, which is the Company’s core objective. The directors recognise that significant investment will be required in the coming years to develop these assets and enhance value and acknowledges this may include third party partners and local debt providers in the funding mix to support this development.
Sir Michael Rake Non-executive chairman 17 May 2021
Governa
nceF
inancia
l statem
entsS
trateg
ic report
Phoenix Global Resources plc Annual Report and Accounts 2020 01
Strategy and Business Model
Phoenix Global Resources plc Annual Report and Accounts 2020 2
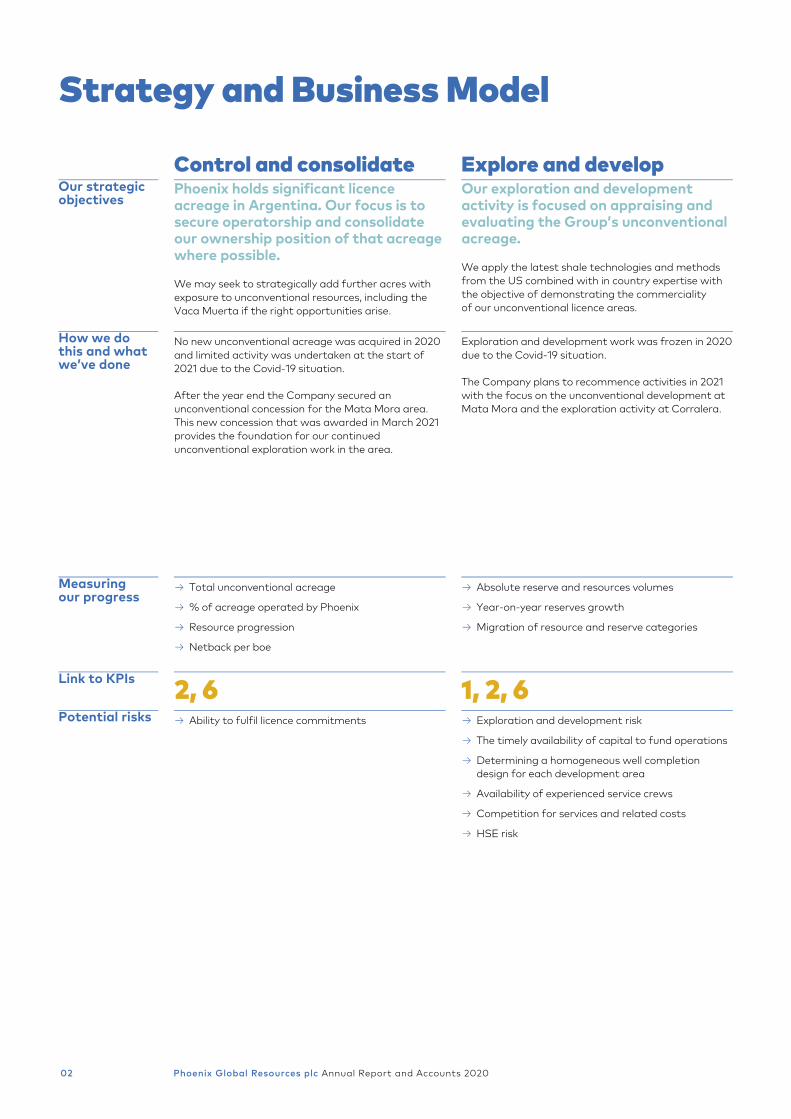
Control and consolidate Explore and develop Our strategic objectives
Phoenix holds significant licence acreage in Argentina. Our focus is to secure operatorship and consolidate our ownership position of that acreage where possible.
We may seek to strategically add further acres with exposure to unconventional resources, including the Vaca Muerta if the right opportunities arise.
Our exploration and development activity is focused on appraising and evaluating the Group’s unconventional acreage.
We apply the latest shale technologies and methods from the US combined with in country expertise with the objective of demonstrating the commerciality of our unconventional licence areas.
How we do this and what we’ve done
No new unconventional acreage was acquired in 2020 and limited activity was undertaken at the start of 2021 due to the Covid-19 situation.
After the year end the Company secured an unconventional concession for the Mata Mora area. This new concession that was awarded in March 2021 provides the foundation for our continued unconventional exploration work in the area.
Exploration and development work was frozen in 2020 due to the Covid-19 situation.
The Company plans to recommence activities in 2021 with the focus on the unconventional development at Mata Mora and the exploration activity at Corralera.
Measuring our progress
→ Total unconventional acreage
→ % of acreage operated by Phoenix
→ Resource progression
→ Netback per boe
→ Absolute reserve and resources volumes
→ Year-on-year reserves growth
→ Migration of resource and reserve categories
Link to KPIs 2, 6 1, 2, 6 Potential risks → Ability to fulfil licence commitments → Exploration and development risk
→ The timely availability of capital to fund operations
→ Determining a homogeneous well completion design for each development area
→ Availability of experienced service crews
→ Competition for services and related costs
→ HSE risk
Phoenix Global Resources plc Annual Report and Accounts 202002

3 Phoenix Global Resources plc Annual Report and Accounts 2020
Profitable production Realise value Phoenix has existing production from conventional oil assets that provides cash flow for reinvestment.
We seek to maintain existing conventional production, where profitable, as a lower cost, lower risk element of the funding mix.
Protecting and realising value for shareholders is fundamental to what we do.
Demonstrating the commerciality of our assets through exploration and evaluation activity and then efficiently and safely developing and producing the resources is key to our value proposition.
Production was lower in 2020 at 4,549 boepd compared to 7,023 boepd in 2019 (excludes 2,200 boepd of production from non-core assets sold).
The lower production reflects primarily the impact of the Covid-19 outbreak that led to the shut-down of production after receiving notice from YPF temporarily suspending the purchase of oil.
We continue to experience normal production decline on conventional assets that is not yet offset by new unconventional production.
Unconventional production is expected to increase through the development phase of our key assets upon completion of paced and successful appraisal programs in 2021 and beyond.
Reserves year on year have fallen due primarily to the disappointing results from the Puesto Rojas drilling activity and an update of the reserves at La Brea where there has been no activity and no activity is planned in the near future.
→ Year-on-year production volumes
→ Opex per boe produced
→ Adjusted EBITDA – earnings before interest, taxes, depreciation, amortisation and non-recurring expenses
→ Total shareholder return
→ Resource conversion
1, 2, 4, 5, 6 1, 2, 3, 4, 5, 6 → Reservoir quality and ability to achieve type-curves
→ Commodity prices and volatility
→ Impact of inflation and foreign exchange risk
→ Availability of refining capacity for offtake
→ Proactively managing HSE exposure
→ Fiscal risk
→ Financing risk
→ Final decommissioning costs and obligations
→ Ability to optimise asset portfolio through acquisition or divestment, participation in licencing rounds and farm-in or farm-out
→ HSE risk
Governa
nceF
inancia
l statem
entsS
trateg
ic report
Phoenix Global Resources plc Annual Report and Accounts 2020 03

Key Performance Indicators
Phoenix Global Resources plc Annual Report and Accounts 2020 4
KPIs are used to measure the performance of the Company. The performance measures used to assess performance may change over time as the Company’s activities develop.
1 HSE metrics
2 Resource and reserve progression
3 Production volumes
LTIR 2020 – 0.0 LTIR 2019 – 0.3 Spill Index 2020 – 217 Spill Index 2019 – 14
37% reduction 2020 – 18,791 Mboe 2P reserves 2019 – 29,786 Mboe 2P reserves (excluding reserves associated with non-core assets sold) No change in resources estimates.
35% reduction 2020 – 4,549 boepd 2019 – 7,023 boepd (excluding production from non-core assets sold)
Definition The measures used by the Company were revised in 2020 to include monitoring of Spill Index (‘SI’) performance in addition to Lost Time Incident Rate (‘LTIR’). These measures are calculated as follows: SI = spill volume (bbls)/oil production on operated fields multiplied by a million. LTIR = (number of LTIs x 200,000)/Total hours worked. For LTIR, the Company calculates total hours worked, including contractor hours, on a monthly basis. Both lost time incidents and spills are reported by line managers or supervisors to the HSE manager and are documented.
Definition The year-on-year growth in reserves and resources is calculated by reference to reserves and resources statements estimates prepared by management with the requisite qualifications and prepared in accordance with generally accepted petroleum engineering and evaluation principles as set out in the Standards Pertaining to the Estimating and Auditing of Oil and Gas Reserves issued by the Society of Petroleum Engineers. There are several measures that can be used to assess resource performance. One measure is to monitor the migration of resources through risked categories into reserves. This demonstrates the physical de-risking of properties as volumes move progressively from technical volumetric resource categories into reserve categories with defined probability of economic production.
Definition Production performance is measured by reference to the absolute and percentage increase or decrease in production year-on-year measured in boepd. Production in 2020 averaged 4,549 boepd compared to 7,023 boepd in 2019 (excluding production from non-core assets sold), a decrease of 35%.
Comment The LTIR fell from 0.3 in 2019 to 0.0 in 2020 against a target of 0.3, resulting in top quartile safety performance. The improvement in safety performance is notable and highlights this as a key focus of the Group even after taking into account the Covis-19 situation. Spill index performance was recorded at 217 compared to 14 in 2019. The Company experienced two major spills in the year, which is accentuated by the lower production volumes due to the shut-in of production during the year. Both incidents were contained at the well site location and clean up remediation work carried out to the satisfaction of the provincial authorities.
Comment 2P reserves estimated fell during 2020 primarily due to the disappointing results from the Puesto Rojas drilling program and a revised estimate of the 2P reserves at La Brea due to delays in progressing the exploration and development activity.
Comment The fall in production in 2020 was primarily due to the shut-down of production during the year but also to the natural production decline in existing well stock not offset by new production. December 2020 average production of 4,549 boepd compares to 7,023 boepd in December 2019.
Phoenix Global Resources plc Annual Report and Accounts 202004

5 Phoenix Global Resources plc Annual Report and Accounts 2020
4 Operating cost per boe
5 Adjusted EBITDA
6 Personal objectives
6% increase 2020 – US$18.7/boe 2019 – US$17.7/boe (excludes depreciation)
-157% 2020 – loss of US$7.2 million 2019 – US$12.6 million
Measured based on individual performance.
Definition Operating cost per boe is an alternative performace measure and Is a measure of production efficiency and is calculated by dividing total cash production costs by the volume of boe produced (see page 11 for more detail). Operating costs include both fixed and variable elements. As production increases the fixed costs are spread over a larger volume base resulting in a lower unit cost. Conversely when production falls, the cost per boe produced typically rises. Process efficiencies, new technologies and optimisation of production infrastructure can also result in cost savings on a per boe produced basis.
Definition EBITDA is defined as earnings before interest, taxation, depreciation and amortisation. Adjusted EBITDA is an alternative performance measure and takes account of non-recurring costs that are often high value and primarily relate to impairment provisions and one-time costs associated with the termination of licences (see note 33 on page 100 for more detail).
Definition Personal and collective performance targets are set for employees and teams by line managers. These performance targets are often qualitative in nature and focused on individual and collective performance in relation to project delivery, system and process improvements and to operational and production performance.
Comment Our target is to continually reduce production costs per boe. There will be instances however where production costs per boe can rise for legitimate reasons. These may include where costs are semi-fixed in nature or in mature areas where the per-unit costs increase as production suffers natural decline and additional workover and other intervention activity is required. In 2020, the average operating cost per boe increased by 6% from US$17.7/boe in 2019 to US$18.7/boe in 2020. However, this average increase is not representative of the actual reduction in operating cost at normal production levels due to the impact of the shut-down of production during the year. When comparing December 2020 average operating cost to December 2019 operating cost, this has fallen from US$20.6/boe to US$14.4/boe (30%), representing the impact of the cost reduction programs implemented during the year.
Comment Adjusted EBITDA fell in the year with a loss of US$7.2 million in 2020 compared to US$12.6 million in 2019. The year-on-year reduction in adjusted EBITDA was caused primarily by the shut-in of production during the year and lower average commodity prices.
Comment Due to the impact of Covid-19 the personal performance targets in 2020 were reassessed with a revised focus on the development and implementation of a plan to significantly reduce both operating and administration costs. The Company successfully achieved cost reductions in all areas of the business, which has put the Company in a stronger position to produce oil economically at lower prices with a positive contribution to cash flow and allow it to focus on the continued development of its unconventional assets.
Governa
nceF
inancia
l statem
entsS
trateg
ic report
Phoenix Global Resources plc Annual Report and Accounts 2020 05

Operating review
Phoenix Global Resources plc Annual Report and Accounts 2020 6
Covid-19 Like many other companies in Argentina, Phoenix has been heavily impacted by the Covid-19 outbreak in the country. Quarantine restrictions introduced in late March 2020 and the resulting drop in the demand for oil, saw most refiners suspending the purchase of oil. Following notice from YPF that it was temporarily suspending the purchase of oil, the Company was faced with no option but to shut-down production of crude oil from its operated licences Puesto Rojas, Atamisqui and Tupungato with production of oil from licences operated by third parties reduced significantly. Production has restarted and is expected to continue if demand in Argentina continues to increase, at its operated licences Puesto Rojas, Tupungato and Atamisqui and its non-operated licence Chachahuen, albeit initially at lower levels than before the Covid-19 pandemic. Production has also recently restarted at the Company’s non-operated licences Rio Cullen/Las Violetas and Cajon de Los Caballos and the Company restarted production at its operated licence Mata Mora in November 2020. The Company is continuing to follow all recommended procedures regarding Covid-19 and take all steps necessary to maintain the safety of its employees and contractors.
.
COMPANY ASSETS
Licence Basin Type Operator Interest
% Acreage
WI
Producing Wells
No. Licence
Expiry
Puesto Rojas Neuquina Production Phoenix 100% 46,921 16 Mar-54
Cerro Mollar Norte Neuquina Production Phoenix 100% 1,188 2 Oct-22
Cerro Mollar Oeste Neuquina Production Phoenix 100% 26,877 0 Jul-27
Mata Mora(*) Neuquina Production Phoenix 90% 49,729 2 Apr-56
Corralera Noreste(**) Neuquina Exploration Phoenix 90% 24,345 0 Apr-22
Corralera Noroeste Neuquina Exploration Phoenix 90% 24,018 0 Aug-23
Corralera Sur(**) Neuquina Exploration Phoenix 90% 26,196 0 Apr-22
Chachahuen Neuquina Production YPF S.A. 20% 35,493 270 Oct-38
Las Violetas Austral Production Roch S.A. 17% 58,562 39 Aug-26
Angostura Austral Production Roch S.A. 17% 18,086 2 Aug-26
Rio Cullen Austral Production Roch S.A. 17% 15,532 0 Aug-26
Cajon de los Caballos Neuquina Production Roch S.A. 38% 7,506 6 Sep-25
Cajon Oriental Neuquina Exploration YPF S.A. 15% 24,790 0 Sep-25
La Paloma Neuquina Exploration Phoenix 100% 605 0 Nov-40
Cerro Alquitran Neuquina Exploration Phoenix 100% 801 0 Nov-40
El Manzano Oeste Neuquina Exploration Phoenix/ YPF S.A. 100%/40%*** 26,179 0 Oct-27
La Brea Neuquina Production Phoenix 100% 35,742 1 Oct-27
Rio Atuel Neuquina Exploration Phoenix 67% 122,931 0 Dec-21
Loma Cortaderal – Cerro Doña Juana Neuquina Exploration Phoenix 100% 75,982 0 Aug-21
La Tropilla I Neuquina Exploration Phoenix 90% 10,825 0 Mar-22
Santo Domingo I Neuquina Exploration Phoenix 90% 24,648 0 Mar-22
Aguada de Castro Oeste I Neuquina Exploration Phoenix 90% 26,212 0 Mar-22
Aguada de Castro Oeste II Neuquina Exploration Phoenix 90% 19,339 0 Mar-22
Refugio Tupungato Cuyana Production Phoenix 100% 6,734 32 Jan-26
Atamisqui Cuyana Production Phoenix 100% 53,260 12 Sep-25
* Unconventional 35-year exploitation concession awarded in March-2021. Expire Apr-2056 ** Government Decrees in April extended the first exploratory phase by twelve months (April 2022) *** 100% Agrio formation and 40% other formations
Phoenix Global Resources plc Annual Report and Accounts 202006

7 Phoenix Global Resources plc Annual Report and Accounts 2020
OPERATED ASSETS – Neuquén Province In the Neuquén Province, the Company has interests in eleven operated assets and four non-operated assets (see figure 1) in the Neuquén Basin, including Mata Mora and Corralera (11 and 15). A brief summary of the assets in the Neuquén Basin is provided below.
Figure 1: Neuquén Basin regional map showing the Company’s operated and non-operated assets.
Mata Mora The MMox-1002 was successfully reactivated in February 2020 after an extended shut-in designed to provide reservoir surveillance regarding reservoir pressures and future well spacing. Both Mata Mora wells were shut-in during May 2020 as there was no market for the oil being produced and remained shut in through November 2020. Both wells are now active and in December producing at a combined rate of approximately 630 barrels of oil per day.
Post year-end highlights: In March 2021, Neuquén Province approved an unconventional exploitation concession for approximately 78% of original Mata Mora’s acreage (43,372 acres), for a term of 35 years.
A pilot phase commitment of 12 horizontal wells consisting of four pads of three wells each with an average lateral length of 2,150m with an estimated capital expenditure of US$110 million is planned to be executed within the next five years.
The first pad is being planned and permitted to be drilled in the fourth quarter of 2021. A complete suite of data acquisition is planned in order to characterise the unconventional reservoir and to start working in stimulation design and further well spacing optimisation.
A full field development of 192 horizontal wells is being considered with an estimated potential of 203 MMboe with a total capital investment of US$2,440 million.
The remaining 22% of the original licence is now the new Mata Mora Sur block (11,918 acres), covering a region that involves agricultural activity and San Patricio del Chañar town, and will remain in the exploration phase for a further five years with a commitment of 3D seismic acquisition covering the region.
Corralera Area The Company was progressing its plans to drill its first well targeting Agrio Formation in the Corralera area until the Covid-19 restrictions resulted in the Company suspending these operations. The well pad location was substantially completed, and the Company evaluated options with GyP and the Neuquen Province regarding the most effective way to fulfil the Company’s licence commitment obligations.
Post year-end highlights: The primary unconventional target has changed from the Agrio to the Vaca Muerta formation based on revised expectation of fluid type given the contrasting thermal maturity, neighbouring well results, and better understanding of landing zones alternatives for the Vaca Muerta formation.
A one-year extension was agreed with GyP (and submitted for provincial approval) for the first exploration period for Corralera Noreste and Corralera Sur to execute the revised two horizontal wells in planning to evaluate Vaca Muerta unconventional oil potential. The proposed wells include the drilling of vertical pilots for data acquisition needed to define the landing zone targets and then the drilling of horizontal sidetracks with 2,000 m of lateral length. A decree approving the extension was issued by the Province on 13 April 2021.
It is expected to drill the committed wells in the third quarter of 2021 and complete them by the first quarter of 2022, with a total investment of US$29 million.
A new office has been inaugurated in the capital city of Neuquén Province to handle the increasing activity that is being planned for this region’s assets and increased activity related to exploration and pilot phases of Corralera, Mata Mora, and the additional commitments to delineate the Vaca Muerta play as an unconventional target.
Governa
nceF
inancia
l statem
entsS
trateg
ic report
Phoenix Global Resources plc Annual Report and Accounts 2020 07

Operating review continued
Phoenix Global Resources plc Annual Report and Accounts 2020 8
OPERATED ASSETS – Mendoza Province In the Mendoza Province, the Company has interest in eleven operated assets including nine in the Neuquén Basin (see figure 1 above) and two in the Cuyo Basin (see figure 2 below). A brief summary of these assets is provided below.
Figure 2: Cuyo Basin regional map showing the Company’s operated assets.
After a three-month period of general well shut down, in July 2020 oil sales were re-established, wells were restarted with lower production losses than previously estimated.
The main contracts were revised, such as the ones related with operations and maintenance, oil transport and pulling rigs, allowing an OPEX/boe reduction of 34% (from 26.4 US$/boe to 17.4 US$/boe comparing Q1 2020 and Q4 2020).
Post year-end: With the objective of identifying and assessing the risks in our facilities and implementing controls to avoid incidents, we are planning to execute a risk assessment at seven facilities in our operated assets (Tupungato oil treatment plant, Tupungato water injection plant, Atamisqui oil treatment plant, Cerro Mollar oil treatment plant, Cerro del Medio Separation unit, Cerro Pencal 1006 battery and Malargüe delivery plant).
Puesto Rojas Area First quarter activity included a workover of CP-1014 and workover jobs on older wells to maintain production levels. Like other assets, Puesto Rojas was shut-in in April 2020 following notice from YPF that they were suspending oil purchases in Mendoza Province. The field was subsequently re-activated with minimal well damage apart from wells CDM-3004, CDM-3007, CP-1003, PR-53 and CP-1014, Wells CDM-3004, CP1003 and CP1014 have now been remediated but remedial work is still due to be completed on wells CDM-3007 and PR-53, which currently remain offline. Wells CP-1006 and CP-1008 remain shut-in for gas handling limits in the field.
In accordance with decree N°485/2019, in July 2020 the Company advised the Mendoza Province Direction of Hydrocarbons that it would be exercising its right to extend the 'Pilot Plan' phase until 30 June 2022, in order to continue the Company’s planning of a horizontal well in the area, contingent on the results of a new study of the region currently being undertaken. During this period, 12% royalties will be maintained on the production of the unconventional wells.
Post year-end highlights: Based on the variable results of the Vaca Muerta vertical wells, related with the structural complexity of the area and the variable hydrocarbon quality, an integrated post-mortem study is under execution to define the next steps in the unconventional project.
To date, most of the evaluated structures show at least some amount of compartmentalisation, fault planes, low API oils, or a combination of these factors that negatively affects hydraulic fractures efficiency, well performance, and the ability to execute unconventional 'factory mode' type development. We expect to complete this initial study in the second quarter of 2021.
Rio Atuel The evaluation of the MLx-1001 drilled in 2019 was completed and based on the results it has been determined not to be commercial and the costs were expensed in the second quarter. No other 2020 physical activity was planned while studies are ongoing of the well results and other subsurface data previously collected.
Due to the constraints generated by the strict quarantine defined by national authorities, in July 2020 a request was made to the Mendoza Province Direction of Hydrocarbons for a one-year extension until 18 December 2021 to execute the committed activity within the third exploration period. The outstanding commitment currently consists of drilling a vertical well in the block. This request for an extension was approved in April 2021.
Four different well locations are under study for the remaining commitment well with environmental impact studies recently completed and approved for all the potential locations. Planning and selection of the well location to be drilled is ongoing with drilling planned for the second half of 2021.
La Paloma The LP-9 and LP-7 wells were drilled in the La Paloma/Cerro Alquitran area targeting the Grupo Neuquén formation in 2019 and were planned for completion in the first half of 2020 prior to the Covid-19 restrictions, causing us to suspend this activity. The Company is currently evaluating options as to when it is best to complete these wells.
LP-7 and LP-9 completions are still pending. In September 2020, an extension to 30 July 2021 was requested to the authorities in respect of which we are still awaiting a response.
Phoenix Global Resources plc Annual Report and Accounts 202008

9 Phoenix Global Resources plc Annual Report and Accounts 2020
Cerro Doña Juana-Loma Cortaderal In the context of the commitment fulfillment date of 17 August 2021, the technical and subsurface teams continue to evaluate the characteristics that will determine the scope and the timeframe of the work to be performed in the licence.
Cuyana Basin Like the Puesto Rojas area, the Company’s Cuyana Basin fields of Atamisqui and Tupungato were shut-in in April 2020 following notice from YPF that they were suspending oil purchases in the Mendoza Province. The field was subsequently re-activated with minimal well damage.
NON-OPERATED ASSETS Chachahuen Area In the Chachahuen Sur area, the focus for 2020 was to improve the water flooding projects and start a Polymer Pilot Project. However, given the market conditions, most of this work was postponed. At Cerro Morado Este, the focus for 2020 was on the water flooding pilot plan, with three water injection patterns, and performing production facilities improvements. In the first quarter, three workovers were performed on injector wells (ChuS-158; ChuS293 and ChuS-294). At Cerro Morado Este, the focus for 2020 was on the water flooding pilot plan, with three water injection patterns, and performing production facilities improvements. During the first quarter of the year completion of five wells on backlog from 2019 was performed on CMoE-20; CMoE-54; CMoE-61; CMoE-66 and CMoE-67. Since April 2020, activity was reduced to a minimum in this area due to the market situation and Covid-19 restrictions and in May 2020, the Company’s share of the production was shut-in due to YPF’s notice of suspension of oil purchases. The Company’s share of oil production has restarted, with oil initially sold to a different off-taker and subsequently to YPF.
Post year-end highlights: Four Polymer Injection Units will be installed between the last quarter 2021 and first quarter of 2022, to begin an Enhanced Oil Recovery project. Also, additional efforts are being made in order to increase water injection in the secondary recovery project, improve the water distribution system, and re-establish water injection in wells currently shut-in due to integrity issues.
The operator continues a legal process to include 104km² of the Chachahuen Sur evaluation area in the Cerro Morado Este concession. This application is currently awaiting the authority’s response to the latest administrative appeal filed recently.
Tierra del Fuego Area In the Terra del Fuego Province the Company has interests in three non-operated assets in the Austral Basin in a joint venture with Roch S.A. and others (see figure 3 below).
Figure 3: Austral Basin regional map showing the Company’s non-operated assets.
In January 2020, the water cut in the SM.x-1001 increased rapidly to more than 50% of total production and the well was shut-in. In March 2020, a workover job was performed on this well with production tests in the middle and upper Tobifera as part of the further evaluation of the well. A test in the upper Tobifera section, above current productive perforations, showed an average production rate of 1,576 bpd over seven days with lower water cut and production was subsequently restored in this well. However, as of January 2021 the water cut has increased again, and oil production has fallen to below 300 bpd from this well.
Since the second half of 2019, the buoy at the YPF terminal has been out of service and oil production has been trucked to the Chilean ENAP terminal with an increased transportation cost. Following a Covid-19 outbreak at the ENAP terminal, cross-border sales were closed, causing most oil wells to be shut-in. Only gas production continued with a small light associated oil volume. However, the YPF buoy was subsequently repaired in August 2020 and oil production was restarted in late September 2020. Due to reservoir performance concerns and the market situation and Covid-19 restrictions, planned drilling activity and facilities improvements were postponed, leaving only HSE related activities to continue where possible.
Governa
nceF
inancia
l statem
entsS
trateg
ic report
Phoenix Global Resources plc Annual Report and Accounts 2020 09

Operating review continued
Phoenix Global Resources plc Annual Report and Accounts 2020 10
2P Reserves Summary
Area
2019 Production 2019 Reserves Estimate 2020 Production 2020 Reserves Estimate 2020 YE Revision
Oil Mbbls
Gas MMcf
BOE Mboe
Oil Mbbls
Gas MMcf
BOE Mboe
Oil Mbbls
Gas MMcf
BOE Mboe
Oil Mbbls
Gas MMcf
BOE Mboe
Oil Mbbls
Gas MMcf
BOE Mboe
Atamisqui 115 – 115 644 – 644 74 – 74 400 – 400 (170) – (170)
Cajon de los Caballos 37 28 42 191 – 191 25 7 26 139 – 139 (27) 7 (26)
Cerro Alquitran – La Paloma – – – 1,013 – 1,013 0 – 0 583 – 583 (429) – (429)
Cerro Mollar Norte – – – 77 – 77 20 – 20 38 – 38 (20) – (20)
Cerro Mollar Oeste – – – 143 – 143 22 – 22 101 – 101 (20) – (20)
Cerro Morado Este – – – 2,462 – 2,462 81 11 83 4,222 – 4,222 1,841 11 1,843
Chachahuen 728 – 728 3,311 – 3,311 520 144 544 3,679 – 3,679 888 144 912
El Manzano – – – 411 – 411 6 51 15 0 – 0 (405) 51 (396)
La Brea 13 – 13 3,870 6,886 5,018 16 – 16 76 – 76 (3,778) (6,886) (4,925)
Mata Mora 151 – 151 225 – 225 86 38 93 26 – 26 (113) 38 (106)
Puesto Rojas 457 601 557 10,744 6,276 11,790 171 302 222 6,269 6,074 7,282 (4,303) 101 (4,287)
Tierra del Fuego 245 1,273 457 1,382 4,217 2,085 95 1,048 270 389 3,003 890 (898) (165) (925)
Tupungato 329 – 329 2,416 – 2,416 229 36 235 1,355 – 1,355 (832) 36 (826)
Phoenix Global Resources plc Annual Report and Accounts 202010

Financial review
11 Phoenix Global Resources plc Annual Report and Accounts 2020
Financial overview
2020 US$ mm
2019 US$ mm
Revenue 54.0 129.4
Gross loss (27.4) (15.4)
Operating loss (219.7) (110.2)
Loss for the year (197.0) (113.8)
Net assets 26.1 222.7
Investment in fixed assets and intangibles 8.1 96.5
Net cash from operations (6.4) (16.4)
Adjusted EBITDA (7.2) 12.6
Revenue and gross margin Revenue for the year was US$54.0 million (2019: US$129.4 million), comprising revenue from oil sales of US$52.2 million (2019: US$114.7 million) and revenue from gas sales of US$1.8 million (2019: US$14.8 million).
The reduction in oil revenue between years resulted from a combination of the shut-in of production due to Covid-19, a reduction in the realised price per barrel and lower sales volumes year-on-year.
The average realised oil sales price in 2020 was US$37.74/bbl, a 21% decline on the average price of US$47.96/bbl in 2019. Realised prices achieved by the Company are indirectly linked to Brent.
The emergence of Covid-19 as a global pandemic and the resulting fall in the demand for oil has had a significant impact on the operations of the Company. The over-supply of crude in the market resulted in YPF, the state-controlled Argentine energy company, giving notice to its customers of the suspension of the purchase of oil until further notice. This resulted in refineries stopping the acceptance of deliveries, leaving the Company with no option but to shut-down production in April 2020.
Crude oil prices dropped to historic lows with the average Brent crude price falling year-on-year by 33%, from an average of US$64/bbl in 2019 to an average of US$43/bbl in 2020.
In May 2020, Argentina’s Government issued a decree establishing a fixed realised Medanito price of $45/bbl ('Barril Criollo'), subject to certain conditions, demonstrating the intention of the government to support the industry where possible. This pricing support remained in place until September 2020 when the Brent crude benchmark price exceeded US$45/bbl for 10 consecutive days, which was one of the conditions that would cause the support to expire. It has not been reinstated and prices were subject to the Brent crude benchmark.
Average daily oil sales in the year was 3,776 bopd compared to 6,059 bopd in 2019 (excluding sales from non-core assets sold).
Gas revenues arise mostly in the non-operated segment and declined by US$12.9 million in the year compared to 2019, mainly due to the sale in 2019 of the Santa Cruz Sur asset and a reduction of 40.4% in the realised price from an average of US$3.32/MMcf in 2019 to an average of US$1.98/MMcf in 2020. In addition, the shut-in of some of the gas producing wells on the non-operated assets, Rio Cullen and Las Violetas, due to the impact of Covid-19, resulted in lower volumes produced and sold.
Operating costs Average operating costs increased year-on-year from US$17.7/boe in 2019 (excluding non-core assets sold) to US$18.7/boe in 2020, primarily due to the reduced production levels resulting in the fixed element of production costs being allocated over lower volumes. However, average operating cost for December 2020 had fallen to US$14.4/boe by the end of 2020 reflecting the impact of the cost reduction programs implemented during the year.
Depreciation decreased by US$24.8 million in the year from US$66.1 million (including depreciation of assets sold of US$9 million) to US$41.3 million 2020, primarily due to the fall in production volumes.
Other operating costs An exploration expense of US$2.7 million has been recognised in the year, primarily relating to the write-off of the US$2.5 million cost of the Rio Atuel exploratory well.
At the year-end, management’s impairment assessment considers potential triggers for impairment including, inter-alia, adverse results from drilling programs, changes in oil and gas prices and other market conditions, cost of future development and licence periods. Following this assessment, the Company has recognised an impairment loss of US$15.2 million relating to the write down of goodwill attributable to our interest in Chachahuen recognised at the time of the business combination in 2017.
In addition, our assessment indicated that the carrying value of certain licences had been potentially impaired and a charge for impairment of US$149.3 million has been recognised, reflective of lower reserves, lower oil price environment and higher discount factor being applied to the DCF calculations (Chachahuen US$17.7 million, Puesto Rojas US$114.7 million, La Paloma US$5.6 million, El Manzano US$8.6 million, Atamisqui US$1.8 million and Cajon Oriental US$0.8 million, Rio Atuel and Vega Grande US$0.1 million).
Furthermore, an additional US$6.6 million charge has been recognised against an asset held for sale (see note 13 on page 77 for more details).
Governa
nceF
inancia
l statem
entsS
trateg
ic report
Phoenix Global Resources plc Annual Report and Accounts 2020 11

Financial Review continued
Phoenix Global Resources plc Annual Report and Accounts 2020 12
2020 US$’000 Operated Non-
operated Corporate Total
Oil revenue 24,130 28,029 – 52,159
Gas revenue 2 1,840 – 1,842
Gross revenue 24,132 29,869 – 54,001
Loss for the year (155,759) (49,054) 7,789 (197,024)
Add: DD&A 27,569 12,149 1,628 41,346
Less: finance income – – (6,905) (6,905)
Add: finance costs 458 306 21,512 22,276
Less: taxation – – (38,005) (38,005)
EBITDA (127,732) (36,599) (13,981) (178,312)
Add: Loss on termination of licences and other impairment charges 127,501 43,628 – 171,129
Add: Loss on sale of non-current assets 6 – – 6
Adjusted EBITDA (225) 7,029 (13,981) (7,177)
2019 US$’000 Operated Non-
operated Corporate Total
Oil revenue 49,341 65,311 – 114,652
Gas revenue 14 14,751 – 14,765
Gross revenue 49,355 80,062 – 129,417
Loss for the year (32,952) (50,611) (30,247) (113,810)
Add: DD&A 32,470 31,954 1,633 66,057
Less: finance income – – (1,577) (1,577)
Add: finance costs 381 465 25,401 26,247
Less: taxation – – (21,011) (21,011)
EBITDA (101) (18,192) (25,801) (44,094)
Add: Loss on termination of licences and other impairment charges 11,938 15,815 – 27,753
Add: Loss on sale of non-current assets – 29,041 (70) 28,971
Adjusted EBITDA 11,837 26,664 (25,871) 12,630
Finance income and costs Net finance costs decreased by US$9.3 million to US$15.4 million in 2020 compared to US$24.7 million in 2019. The decrease in cost was primarily driven by the benefit on transfers of US$ into Argentina under the 'contado con liquidacion' mechanism, a reduction in the foreign exchange losses on Peso denominated balances held by the Company and a reduction in other finance costs.
Taxation A US$38.0 million tax credit was recognised in 2020, compared to a US$21.0 million tax credit in 2019. The increase in the deferred tax credit in the year primarily resulted from the reduction in the book value of fixed assets when compared to the tax-deductible value following the provision for impairment together with the deferred tax benefit of the increase in net operating losses, which the respective companies expect to recover in future periods.
Balance Sheet At 31 December 2020 the Group had net assets of US$26.1 million, a decrease of US$196.6 million compared to 31 December 2019.
During the year, intangible assets and property, plant and equipment decreased by US$200.5 million primarily due to charges for impairment of US$149.3 million, DD&A of US$41.3 million offset by US$8.1 million of additions, the write down of goodwill of US$15.2 million and the write-off of an unsuccessful exploration well of US$2.8 million.
Current and non-current trade and other receivables decreased from US$39.3 million to US$29.5 million at 31 December 2020 principally due to the lower oil volumes sold in at the end of the year. Inventories increased from US$18.2 million to US$18.3 million at 31 December 2020. Net deferred tax liabilities decreased from US$69.1 million to US$33.57 million at 31 December 2020 primarily due to an increase in the deferred tax credit in the year resulting from the reduction in the book value of fixed assets when compared to the tax deductible value following the write down of goodwill and the provision for impairment and the deferred tax credit resulting from the net operating loss for the year. Trade and other payables decreased from US$44.8 million to US$26.2 million at 31 December 2020 due to the reduced costs resulting from the lower oil volumes sold.
Phoenix Global Resources plc Annual Report and Accounts 202012

13 Phoenix Global Resources plc Annual Report and Accounts 2020
Funding status and going concern Total borrowings in the year increased by US$28.6 million from US$303.6 million at 31 December 2019 to US$332.2 million at 31 December 2020. The increase resulted primarily from the drawdown of an additional US$14.3 million of funds from the revolving convertible credit facility and bridging facility with Mercuria and a total of US$15.2 million of accrued interest. Funds advanced under the credit facilities have been used to satisfy working capital needs.
The Group principally generates cash from its existing conventional oil and gas production operations. Nevertheless, it was formed with the stated intention of undertaking a significant exploration, evaluation and development program focused on the Group’s unconventional oil and gas assets in Argentina, including the Vaca Muerta formation.
2020 has been dominated by Covid-19 and its rapid development as a life-threatening global pandemic. Globally, respective governments’ response has been one of containment through lock-down, social distancing restrictions, quarantine and self-isolation for substantially all citizens, whilst countries strive to roll out vaccination programs. This has resulted in a significant adverse impact on industrial and commercial activity, which led to the shut-down of the Company’s production in April 2020. Consequently, the Company took significant steps to reduce its costs in all areas of the business. The directors believe these cost reduction actions mean the Company is in a better position to produce oil economically at lower oil prices with a positive contribution to cash flow at normalised production levels, which will allow the Company to focus on the continued development of its unconventional assets. This situation is compounded by the political and economic uncertainty in Argentina. The country is in its third straight year of recession and whilst it announced at the end of August 2020 that 99% of the holders of the country’s US$65 billion international bonds had agreed to restructure this debt discussions between the Argentine government and the IMF to reschedule US$45 billion of debt are ongoing and the outcome of the 2021 legislative elections in Argentina is uncertain.
Notwithstanding, our major shareholder, Mercuria, continues to be supportive of the Company’s plans and continues to extend short-term debt facilities to fund operations. Mercuria has written to the Company stating its intention to continue to provide financial support to the Company in order that it may continue to operate and service its liabilities as they fall due in the next 12 months and also fund the planned work programs. Mercuria has also specifically agreed to not demand repayment of the existing loans (principal and interest) within the next 12 months whilst discussions with the Company to restructure these loans continue. This letter, which by its nature is not legally binding, represents a letter of comfort stating Mercuria’s current intention to continue to provide financial support.
The directors believe they will be able to agree the renegotiation of the existing debt with Mercuria and formalise an agreement for new funding and that the Group and Company can continue as a going concern for the foreseeable future. The application of the going concern basis of preparation of the financial statements included in this annual report is based on the letter that has been received from Mercuria and the ongoing discussion with the Mercuria principals. Accordingly, the directors continue to adopt the going concern basis for accounting in preparing the 2020 financial statements.
However, the directors recognise that if financial support over the next 12 months from Mercuria were not to be available and the Company is unable to restructure the existing loan agreements from Mercuria or obtain funding from alternative sources, this gives rise to a material uncertainty that may cast significant doubt on the Group’s and Company’s ability to continue as a going concern.
At 31 December 2020 the Group had cash and cash equivalents of US$5.4 million (2019: US$11.0 million).
Governa
nceF
inancia
l statem
entsS
trateg
ic report
Phoenix Global Resources plc Annual Report and Accounts 2020 13

Risk management
Phoenix Global Resources plc Annual Report and Accounts 2020 14
Managing business risks Understanding our principal risks and ensuring that we have the appropriate controls in place to manage those risks is critical to our growth and success. Managing business risks and opportunities is a key consideration in determining and then delivering against the Group’s strategy. The Group’s approach to risk management is not intended to eliminate risk entirely, but provides the means to identify, prioritise and manage risks and opportunities. This, in turn, enables the Group to effectively deliver on its strategic objectives in line with its appetite for risk.
The board’s responsibility for risk management The board has overall responsibility for ensuring the Group’s risk management and internal control frameworks are appropriate and are embedded at all levels throughout the organisation. Principal risks are reviewed by the board and are specifically discussed in relation to setting the Group strategy, developing the business plan to deliver that strategy and in agreeing annual work programs and budgets. See Principal Risks and Uncertainties on page 15 and the mitigation steps taken to minimise these risks.
A focus on risk management at the board level The composition of the board has evolved in recent years as the Company has increased its focus on unconventional activity in its licence areas.
The board has two independent directors with extensive unconventional activity experience; Tim Harrington and Martin Bachmann. Tim Harrington joined the board in November 2018 bringing significant experience of unconventional oil and gas operations in the United States. Martin Bachmann joined the board as a non-executive director in September 2019. Martin brings international experience and recent experience of having worked in Argentina from his time at Wintershall AG where he was responsible for both conventional and unconventional operations in-country.
Whilst the unconventional sector has transformed the industry and the oil and gas market in a relatively short period of time it remains a specialist area that, to date, has largely been driven by innovation in the US independent E&P sector that has focused on technology to reduce operating costs. The sector is being further transformed as big oil companies continue to move into the unconventional oil and gas, particularly in prospective basins such as the Neuquina basin in Argentina.
The role of the audit and risk committee The audit and risk committee assists the board in monitoring risk and in discharging its risk management responsibilities. Several performance measures are set to assist in objectively assessing business performance and risk management. Performance measures are specific and are defined in relation to the business operation or activity to which they relate. Periodic management reports provided to management and to the board contain an assessment of these performance measures. Several business performance measures have been established as key performance indicators for the Group.
The five steps in dealing with risk are:
1) Identify
2) Assess
3) Mitigation Options
4) Manage and execute
5) Review
Phoenix Global Resources plc Annual Report and Accounts 202014

15 Phoenix Global Resources plc Annual Report and Accounts 2020
Principal Risks and Uncertainties The principal risks facing the Group together with a description of the potential impacts, mitigation measures and the appetite for the risk are presented below. The analysis includes an assessment of the potential likelihood of the risks occurring and their potential impact. Identified risks are segregated between those that we can influence and those which are outside our control. Where we can influence risks, we have more control over outcomes. Where risks are external to the business, we focus on how we control the consequences of those risks materialising.
There has been no significant change in the risk profile since last year.
1 Health, safety and environment (‘HSE’)
Oil and gas exploration, development and production activities are complex and physical in nature. HSE risks cover many areas including major accidents, personal health and safety, compliance with regulations and potential environmental harm.
Potential impact – High Probability – Low
Risk appetite The Group strives to ensure the safety of its employees, contractors and visitors. We are very conscious of the natural environment that we operate in and seek to minimise our environmental impact and footprint.
We actively promote strict adherence to regulations that govern our operations and the robust application of our own HSE policies and procedures. There is no reason for anyone associated with our business to take unnecessary risks related to their personal safety, the safety of others or the environment that we work in.
The Group has a very low appetite for risks associated with HSE and strives to achieve a zero-incident rate.
Link to strategy Control and consolidate Profitable production Explore and develop Realise value
Mitigation The Group maintains a program of HSE, asset integrity, upgrade and maintenance activity. This activity is supported by a core group of specialist contractors and has hired a dedicated HSE Manager.
The risk of physical injury or fatalities increases as physical operations such as drilling and completion activity increases. Whilst activity has primarily been limited to workovers there has been no deterioration in our HSE metrics with the Company delivering top quartile performance in 2020.
Relevant KPI by priority/significance
1
2 Exploration, development and production
The ultimate success of the Group is based on its ability to develop its assets, create value and to produce oil and gas profitably from its unconventional asset base.
The ability to develop a consistent, repeatable and cost-efficient method for drilling and completing horizontal wells is core to the successful development of unconventional oil and gas assets.
Potential impact – High Probability – Medium
Risk appetite The initial development of new unconventional assets is complex and technically challenging. This can expose the Group to higher levels of risk, particularly in the early stages of exploration appraisal and into initial development.
The Group has some tolerance for this risk and acknowledges the need to have effective controls in place in this area.
Link to strategy Profitable production Explore and develop Realise value
Mitigation Technology and operational experience are fundamental in developing unconventional resources.
We completed the initial two horizontal wells at Mata Mora in 2019 and since completion, we have undertaken extended well tests on both laterals including examining the performance of individual frac stages. This information will be used to design the wells that will be needed in the pilot development phase and, later, in full development.
We consult and share information with other operators in the industry in order that, as a Group, we benefit from experience of others to broaden our collective operational knowledge. We have carried out benchmark analysis of nearby assets for well performance, linking frac design strategies and subsurface main characteristics.
We include specialist expert consultants in the design and evaluation of our drilling and completions work.
Relevant KPI by priority/significance
2, 4, 6
Governa
nceF
inancia
l statem
entsS
trateg
ic report
Phoenix Global Resources plc Annual Report and Accounts 2020 15
Risk management continued
Phoenix Global Resources plc Annual Report and Accounts 2020 16
Principal Risks and Uncertainties continued
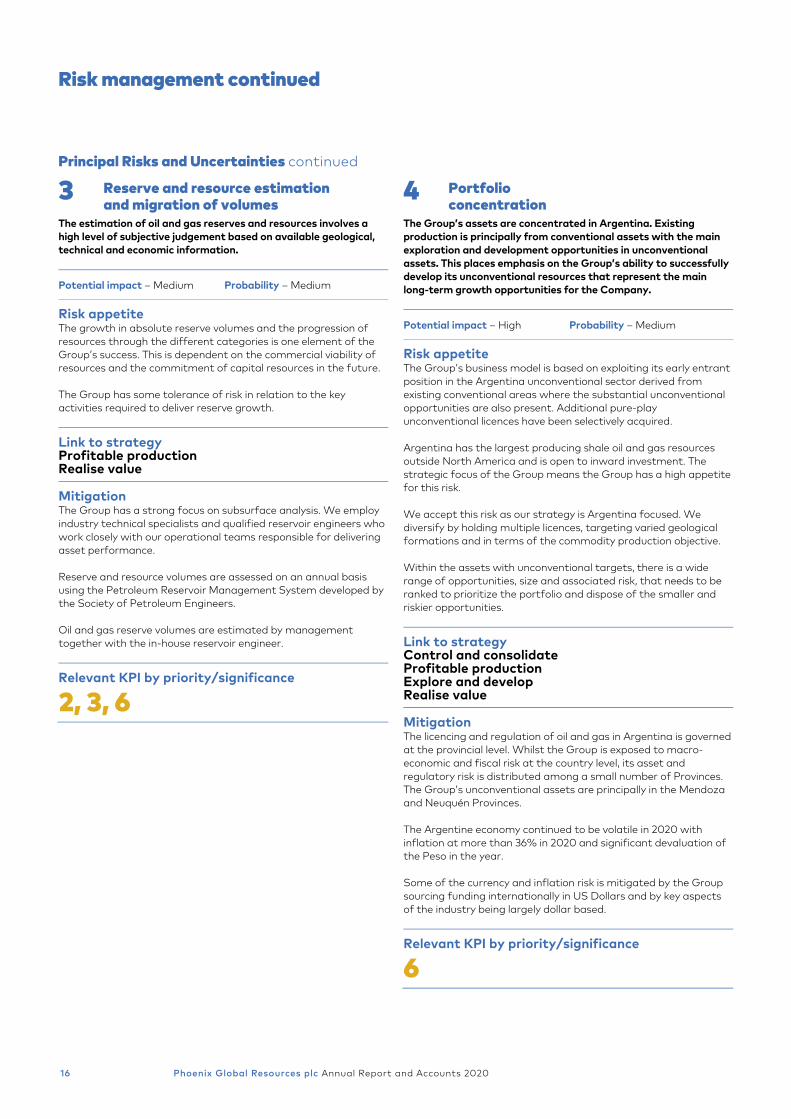
3 Reserve and resource estimation and migration of volumes
The estimation of oil and gas reserves and resources involves a high level of subjective judgement based on available geological, technical and economic information.
Potential impact – Medium Probability – Medium
Risk appetite The growth in absolute reserve volumes and the progression of resources through the different categories is one element of the Group’s success. This is dependent on the commercial viability of resources and the commitment of capital resources in the future.
The Group has some tolerance of risk in relation to the key activities required to deliver reserve growth.
Link to strategy Profitable production Realise value
Mitigation The Group has a strong focus on subsurface analysis. We employ industry technical specialists and qualified reservoir engineers who work closely with our operational teams responsible for delivering asset performance.
Reserve and resource volumes are assessed on an annual basis using the Petroleum Reservoir Management System developed by the Society of Petroleum Engineers.
Oil and gas reserve volumes are estimated by management together with the in-house reservoir engineer.
Relevant KPI by priority/significance
2, 3, 6
4 Portfolio concentration
The Group’s assets are concentrated in Argentina. Existing production is principally from conventional assets with the main exploration and development opportunities in unconventional assets. This places emphasis on the Group’s ability to successfully develop its unconventional resources that represent the main long-term growth opportunities for the Company.
Potential impact – High Probability – Medium
Risk appetite The Group’s business model is based on exploiting its early entrant position in the Argentina unconventional sector derived from existing conventional areas where the substantial unconventional opportunities are also present. Additional pure-play unconventional licences have been selectively acquired.
Argentina has the largest producing shale oil and gas resources outside North America and is open to inward investment. The strategic focus of the Group means the Group has a high appetite for this risk.
We accept this risk as our strategy is Argentina focused. We diversify by holding multiple licences, targeting varied geological formations and in terms of the commodity production objective.
Within the assets with unconventional targets, there is a wide range of opportunities, size and associated risk, that needs to be ranked to prioritize the portfolio and dispose of the smaller and riskier opportunities.
Link to strategy Control and consolidate Profitable production Explore and develop Realise value
Mitigation The licencing and regulation of oil and gas in Argentina is governed at the provincial level. Whilst the Group is exposed to macro-economic and fiscal risk at the country level, its asset and regulatory risk is distributed among a small number of Provinces. The Group’s unconventional assets are principally in the Mendoza and Neuquén Provinces.
The Argentine economy continued to be volatile in 2020 with inflation at more than 36% in 2020 and significant devaluation of the Peso in the year.
Some of the currency and inflation risk is mitigated by the Group sourcing funding internationally in US Dollars and by key aspects of the industry being largely dollar based.
Relevant KPI by priority/significance
6
Phoenix Global Resources plc Annual Report and Accounts 202016

17 Phoenix Global Resources plc Annual Report and Accounts 2020
5 Financing
The inability to fund financial commitments, including licence obligations, could significantly delay the development of the Group’s assets and consequent value creation. Financial or operational commitments are often a pre-condition to the grant of a licence. The Group’s inability to satisfy these could result in financial penalty and/or termination of licences.
Potential impact – High Probability – High
Risk appetite The development of unconventional oil and gas assets is capital intensive and production returns from new development activity are not immediate. The Group has primarily used debt to fund the development of its assets and has benefited from the support of its major shareholder in doing so.
The Group continues to evaluate debt and equity financing options.
Link to strategy Profitable production Explore and develop Realise value
Mitigation The credit facility extended to the Company by Mercuria was increased during 2020 and stood at US$323 million at the year-end including capitalised interest. See note 22 on page 87 for more detail.
As the Group moves toward the development of its core unconventional assets, the capital requirements of the Group will increase substantially. Mercuria has indicated its intention to support the next phase of this development but the Group may not in the future be able to secure suitable funding either through existing arrangements, additional debt instruments, the farm-out of assets or through the issuance of equity. See note 2 on page 63 for more detail.
Relevant KPI by priority/significance
2, 3, 4, 5
6 Bribery and corruption
Risk that third parties or staff could be encouraged to become involved in corrupt or questionable practices.
Potential impact – Medium Probability – Medium
Risk appetite The oil and gas industry, in common with other extractive industries, has a higher than average perception of risk related to bribery and corruption. Argentina has historically been perceived as having a medium to high risk of bribery and corruption with high-profile cases or allegations regularly appearing in the media.
We have zero tolerance of bribery and corruption.
Link to strategy Profitable production Explore and develop Realise value
Mitigation The Group has an established anti-bribery and corruption policy that requires all new hires to confirm that they have read and understood the contents and personal requirements of the policy. The Group ensures that our third-party contractors and advisers follow our procedure and policy. The Group periodically asks all employees and third-party contractors to certify continued compliance.
The Group, its board and management have a zero-tolerance policy towards bribery and corruption.
Relevant KPI by priority/significance
n/a
Governa
nceF
inancia
l statem
entsS
trateg
ic report
Phoenix Global Resources plc Annual Report and Accounts 2020 17

Risk management continued
Phoenix Global Resources plc Annual Report and Accounts 2020 18
Principal Risks and Uncertainties continued
7 Realised commodity prices
A material decline in oil and gas prices adversely affects the Group’s profitability, cash flow, financial position, and ability to invest.
Potential impact – High Probability – High
Risk appetite Considerable exposure to commodity price risk is inherent in the business and is accepted by the Company.
Link to strategy Control and consolidate Profitable production Explore and develop Realise value
Mitigation Theoretically the Argentine domestic price is linked to the Brent price; however, prices in Argentina are fixed monthly on a 29-day average based on prior-month and in-month Brent prices. Furthermore, the Argentine government has historically intervened in the local oil price market, in both a positive and negative way. Most recently, the government issued a decree in May 2020 establishing a fixed realised Medanito price of $45/bbl (‘Barril Criollo’), subject to certain conditions, demonstrating the intention of the government to support the industry where possible.
This intervention does result in an imperfect relationship to Brent that makes designing effective hedging strategies difficult.
Relevant KPI by priority/significance
4, 5
8 Fluctuating demand and limited sales routes for some production.
Demand can be negatively affected by economic conditions in Argentina and globally. Some assets have a single sales route and effectively a single customer.
Potential impact – High Probability – High
Risk appetite The Argentine economy has been historically volatile and subject to periods of rapid and sustained inflation that can affect demand for oil and oil products.
For certain assets, the primary or only sales route is through a single refinery and single customer. In addition, the government has historically intervened in the market both in terms of capping domestic prices to delay the impact of rising Brent crude benchmarks on refined products. The government has also previously provided price support in times of low crude prices.
The Company accepts this risk as fluctuations in demand resulting from economic uncertainty are a feature of the industry.
Link to strategy Profitable production Realise value
Mitigation 2020 saw continued devaluation of the Peso and rising inflation. Further, the impact of the Covid-19 virus in 2020 exposed potential structural weaknesses in the market in that a significant number of fields in the Mendoza and Neuquén Provinces ultimately share a single sales route, being the YPF-operated refinery at Lujan de Cuyo. When demand for fuel and oil products dropped, the refinery was reduced to operating at less than 60% of capacity, causing several producing fields to be shut in due to the lack of alternate sales routes. The group continues to look at alternative routes to access other refineries.
Relevant KPI by priority/significance
4, 5
Phoenix Global Resources plc Annual Report and Accounts 202018

19 Phoenix Global Resources plc Annual Report and Accounts 2020
9 Covid-19 virus
The emergence of Covid-19 as a global pandemic has had a significant effect on economies worldwide.
Potential impact – High Probability – High
Risk appetite The Covid-19 virus that was first identified in China in late 2019 spread rapidly in early 2020, becoming prevalent in Europe and Asia initially, followed by North America, South America and Africa. Almost all countries have now been affected by the virus that is extremely contagious and has a significant mortality rate. The governmental response enacted almost universally has been one of social distancing, self-isolation and quarantine combined with aggressive vaccination programs.
Many businesses have significantly reduced activity with 'stay at home' working recommended for most employees. It is hoped that the rollout of global vaccination programs will gradually contain the spread of the virus and reduce fatalities and allow some sense of normality to return.
However, this is an inherent risk that the Company must continue to address in terms of personal safety and business continuity.
Link to strategy Profitable production Explore and develop Realise value
Mitigation The response to the pandemic initially resulted in a significant and rapid reduction in demand for energy including oil and gas. Many industrial facilities were not operating, and substantially all non-essential travel has ceased, be that by road, rail or air. The near record low prices for oil as a result of a severe drop-off in demand resulted in the Company shutting production in April 2020 and implementing a significant cost reduction program and a deferral of all non-essential capex programs. Demand and oil prices subsequently improved with the Company restarting production in July 2020 with normal production restored by the end of the year.
The Company has followed government policy and advice in respect of the safety of employees and consequential revised operational guidance.
Relevant KPI by priority/significance
4, 5, 6
10 Fiscal and political
Argentina has a history of political instability and economic uncertainty that has been characterised by high inflation and significant currency devaluation.
Potential impact – High Probability – High
Risk appetite The Macri administration was voted into government in 2015 on pro-business policy agenda focused on economic reform. His win was welcomed internationally; however, issues in the domestic economy persisted with high levels of inflation and devaluation resulting in increasing poverty among large parts of the population. In the October 2019 presidential elections, the opposition Peronist party ousted the Macri administration, returning the country to a centre-left policy agenda, albeit a potentially more moderate one than under previous Peronist administrations.
Given the nature and location of its operations, this country specific transition risk is intrinsic to the Group.
Link to strategy Control and consolidate
Mitigation The Company employs appropriately qualified and experienced staff across all disciplines (operational, commercial and administrative) in Argentina and works with reputable and high-quality advisers in order to anticipate and comply with changes in the legislative or fiscal environment.
We also participate in industry groups and forums that seek to provide feedback to governmental departments, provincial governments, unions, and other legislative bodies.
Relevant KPI by priority/significance
n/a
Governa
nceF
inancia
l statem
entsS
trateg
ic report
Phoenix Global Resources plc Annual Report and Accounts 2020 19
Risk management continued
Phoenix Global Resources plc Annual Report and Accounts 2020 20
Principal Risks and Uncertainties continued
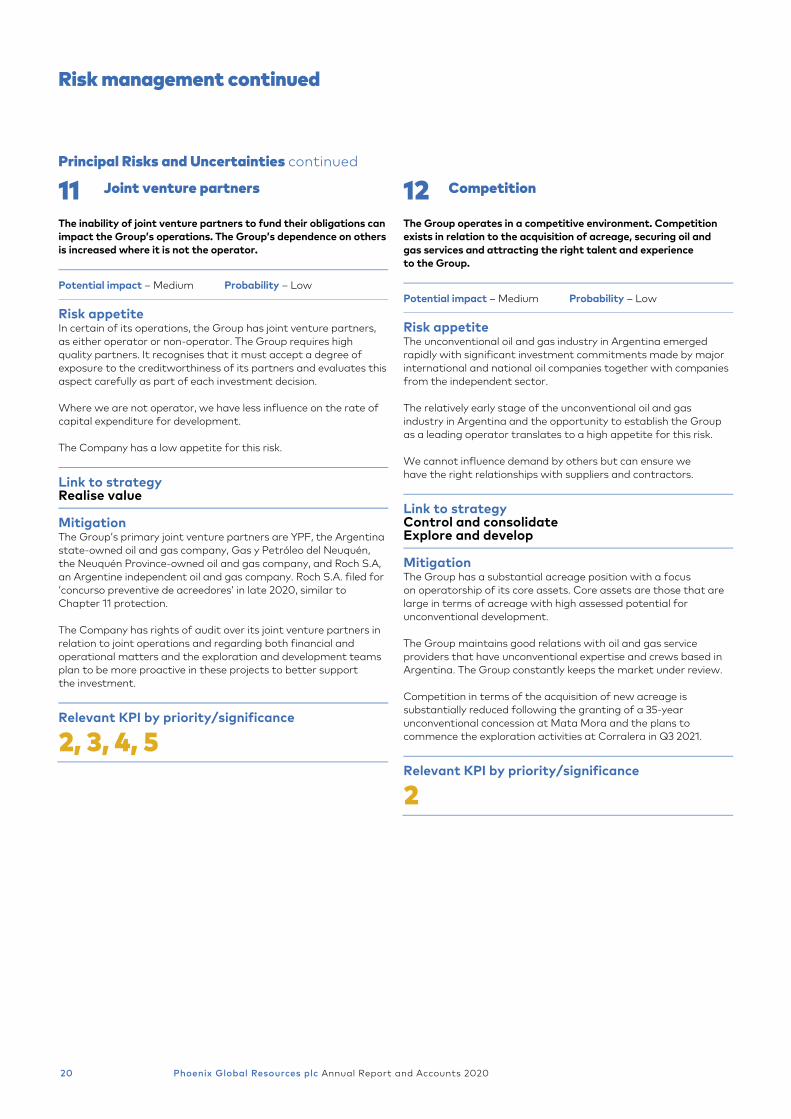
11 Joint venture partners
The inability of joint venture partners to fund their obligations can impact the Group’s operations. The Group’s dependence on others is increased where it is not the operator.
Potential impact – Medium Probability – Low
Risk appetite In certain of its operations, the Group has joint venture partners, as either operator or non-operator. The Group requires high quality partners. It recognises that it must accept a degree of exposure to the creditworthiness of its partners and evaluates this aspect carefully as part of each investment decision.
Where we are not operator, we have less influence on the rate of capital expenditure for development.
The Company has a low appetite for this risk.
Link to strategy Realise value
Mitigation The Group’s primary joint venture partners are YPF, the Argentina state-owned oil and gas company, Gas y Petróleo del Neuquén, the Neuquén Province-owned oil and gas company, and Roch S.A, an Argentine independent oil and gas company. Roch S.A. filed for ‘concurso preventive de acreedores’ in late 2020, similar to Chapter 11 protection.
The Company has rights of audit over its joint venture partners in relation to joint operations and regarding both financial and operational matters and the exploration and development teams plan to be more proactive in these projects to better support the investment.
Relevant KPI by priority/significance
2, 3, 4, 5
12 Competition
The Group operates in a competitive environment. Competition exists in relation to the acquisition of acreage, securing oil and gas services and attracting the right talent and experience to the Group.
Potential impact – Medium Probability – Low
Risk appetite The unconventional oil and gas industry in Argentina emerged rapidly with significant investment commitments made by major international and national oil companies together with companies from the independent sector.
The relatively early stage of the unconventional oil and gas industry in Argentina and the opportunity to establish the Group as a leading operator translates to a high appetite for this risk.
We cannot influence demand by others but can ensure we have the right relationships with suppliers and contractors.
Link to strategy Control and consolidate Explore and develop
Mitigation The Group has a substantial acreage position with a focus on operatorship of its core assets. Core assets are those that are large in terms of acreage with high assessed potential for unconventional development.
The Group maintains good relations with oil and gas service providers that have unconventional expertise and crews based in Argentina. The Group constantly keeps the market under review.
Competition in terms of the acquisition of new acreage is substantially reduced following the granting of a 35-year unconventional concession at Mata Mora and the plans to commence the exploration activities at Corralera in Q3 2021.
Relevant KPI by priority/significance
2
Phoenix Global Resources plc Annual Report and Accounts 202020

Sustainability review
21 Phoenix Global Resources plc Annual Report and Accounts 2020
ESG The Company has a stated objective in 2021 to develop a clear policy and road map to ensure the Company has in place procedures and policies to manage its environmental, social and corporate governance responsibilities and established clear goals that minimise the impact of our operations on all stakeholders and the environment. Our first step in this process is to establish the baseline against which this will be measured and report our achievement against these targets.
Our people Phoenix has responsibility for and owes a duty of care to the people who work for us and the contractors and suppliers that work alongside us in our operations. We are responsible for the health, wellbeing and personal safety of our people when they are with us as we deliver our complex operational projects.
We are responsible for the personal and professional development of our people in the roles that they perform for us. Our objective is to create a working environment that supports our people while challenging them to deliver their best and to develop their own skills and experiences.
We recognise the importance of diversity to our business. Diversity may relate to gender, nationality, faith, personal background or any other factor. We understand and value how diversity benefits our business and how the individual experiences of our people contribute to a positive environment in our Company. We are committed to promoting an environment where our people learn and develop in a collaborative manner regardless of who they are.
Gender diversity Male – 45 staff representing 71% of the total work force
Female – 18 staff representing 29% of the total work force
Modern slavery Personal freedom is a fundamental human right. The UK Modern Slavery Act was brought into law in 2015. Phoenix fully supports the principles it promotes and the personal rights and freedoms it protects.
We have zero tolerance for any form of slavery or any practices that could constitute or be perceived as slavery, whether they be in our own business or those of our suppliers, partners or consultants.
Anti-bribery and corruption (‘ABC’) We have zero-tolerance for bribery, corruption or unethical conduct in our business. Our policies require compliance across our businesses with all applicable ABC laws, in particular, the UK Bribery Act, the US FCPA and the Argentinian Foreign Corrupt Practices Act.
Substantially all our operations and people are based in Argentina. For 2020, Transparency International’s Corruption Perception Index (‘CPI’) ranked Argentina 74 out of 179 participating countries worldwide with a score of 42/100, down from 66 in 2019. By comparison the UK is ranked at 11 out of 179 with a score of 77/100.
The CPI index assesses corruption perception in the public sector when ranking different countries. The perceived potential for public sector corruption increases where democratic institutions are weakened, for instance, where political candidates and campaigns focus on public disillusionment and corruption scandals to advance their agenda.
As a business, Phoenix operates in a competitive market and faces competition in securing and maintaining licence interests with Provinces, attracting and retaining the best service providers, and dealing with unions to secure and retain the right people for our business.
We are very aware of the pressures and challenges that we face. However, we are committed to upholding the highest levels of corporate and operational behavior.
We have a system of documented ABC policies and procedures that provide a consistent policy framework across the Group to ensure awareness of potential threats among our employees and help to ensure appropriate governance of ABC matters.
Our documented policies and supporting procedures are maintained in both Spanish and English, and cover:
→ anti-bribery and corruption;
→ gifts and entertainment;
→ third-party representatives;
→ whistleblowing.
We also maintain training materials in Spanish and English. The reporting processes, including whistleblowing, are dual language. We provide our staff the opportunity to report concerns or potential non-compliant behavior through our external legal counsel as an alternative to reporting internally.
Governa
nceF
inancia
l statem
entsS
trateg
ic report
Phoenix Global Resources plc Annual Report and Accounts 2020 21

Sustainability review continued
Phoenix Global Resources plc Annual Report and Accounts 2020 22
Tendering and supply chain Our focus on our tendering process and supplier management has increased as our high-value evaluation and development activity increased in the year. We have appointed a professional head of procurement who will review and revise our tendering policies, processes and procedures as deemed necessary.
We place contracts with local suppliers where possible and where we can be sure that the quality of service and delivery meets our standards – as with any supplier we work with.
Streamlined Energy and Carbon Reporting (‘SECR’) As a low energy user in the United Kingdom, the Company has taken advantage of the available exemption for low energy users and is, therefore, not required to make the detailed disclosures of energy and carbon information under the SECR guidelines.
Environment We are very conscious of the natural environment that we operate in and work hard to minimise our impact on that environment. The Company is committed to the responsible stewardship of the environment and, on the conclusion of our operations, to return our sites to the condition in which we found them.
Most of our exploration and production operations are in high-altitude desert areas. Site preparation is mainly clearing scrub and levelling off ground to allow safe access. We seek to operate from compact drill sites to minimise disruption to the natural habitat and plan multiple wells from single well-pads, thereby reducing the number of locations that we prepare.
Water usage and conservation Significant amounts of water are used in unconventional oil and gas operations. Together with our service providers, we have developed a fracture fluid system that recycles produced water that is a natural by-product of oil and gas production. This produced water is separated out and stored in tanks for use in unconventional operations. This system has meant we can reduce the use of fresh water in our completion operations.
We are subject to strict operating procedures imposed on us by the Provinces in which we work and related to our in-field pipeline networks and river crossings. We are required to maintain a system of pressure gauges to monitor pressure across the pipeline network because a drop in pressure is one of the main indicators that a line may have been breached. Automatic shut-off valves are installed at points where our lines cross rivers to automatically shut off the line when a drop in pressure is detected.
Health and safety The health and safety of our employees, contractors and visitors to our sites is paramount. Anyone working at, or visiting, a Phoenix operational site is provided with personal protective equipment appropriate to the location and will also be allocated to a supervisor who is responsible for their safety while on site. When there are active operations taking place, such as drilling or facilities upgrade, we establish clear boundaries to limit access to operational areas.
We have also established a system for the regular monitoring of noxious or flammable gases at our gathering or loading facilities and at our operational sites and regularly check lines and transmission networks for leaks.
Our objective is for zero lost time injuries/incidents and zero spills or leaks.
Taxation Phoenix is a responsible operator and corporate citizen and is committed to adhering to all relevant tax laws in all our jurisdictions. This includes compliance at the national, provincial or municipal level. Our operations in Argentina are subject to a complex fiscal system that includes corporate income taxes, royalties, sales taxes, VAT, payroll taxes and certain banking taxes amongst others. In addition, we are required to deduct and remit withholding taxes in respect of contractor payments direct to the Argentine tax authorities. Compliance with tax laws and regulations is fundamental to our licence to operate and is an obligation that we take seriously. In 2020 we paid more than US$11.3 million in cash taxes in Argentina with US$23.4 million paid at the Federal level and the balance in the Provinces where we work.
Phoenix Global Resources plc Annual Report and Accounts 202022

Stakeholder engagement
23 Phoenix Global Resources plc Annual Report and Accounts 2020
Engaging effectively with and understanding the objectives of our diverse stakeholder groups is key to the long-term success of Phoenix in Argentina. The board ensures that the interests and views of stakeholders are considered as part of its decision-making process.
A director of a company must act in the way they consider, in good faith, would most likely promote the success of the company for the benefit of the members as a whole, taking into account the factors listed in section 172 of the Companies Act 2006. The board has not allocated this responsibility to a specific board member but uses its board meetings as a mechanism for discharging its duties under section 172.
Engagement with our shareholders and wider stakeholder groups plays a vital role throughout the business. Our directors are conscious of their responsibilities to act in the way that they consider, in good faith, would most likely promote the near and longer term success of the company for the benefit of its members as a whole, taking into account the factors as listed in section 172 of the Companies Act 2006.
The key stakeholder groups identified by the board are set out here together with a summary of why and how we seek to engage with our wider stakeholder group to obtain feedback that is used to inform our strategic decision making.
Our purpose To help develop Argentina’s unconventional oil and gas resources, safely and responsibly whilst making a positive contribution to the economies, communities and creating stakeholder value.
Workforce Why it is important to engage? A motivated and professional workforce is vital to deliver complex operational projects and to meet our strategic goals.
Important considerations: → Sense of ownership in the business
→ Open collaboration
→ Development of skills and capabilities
→ Corporate culture and consistent behaviour
How do we engage? Internal communication, individual performance measurement and feedback reviews.
Actions: → Regular Group updates by senior
management
→ Individual performance feedback and corporate scorecard
→ Board interaction with teams
→ Clearly defined Company objectives
→ Implementation of an Operational Excellence Policy
→ Implementation of a Stop Work Policy
Our partners Why it is important to engage? We partner with other industry players on certain projects to share knowledge, opportunity and risk.
Important considerations: → Sharing of knowledge
→ Access to diverse experience
→ Maintain competitive advantage
→ Foster trust and collaboration
→ Understanding of each other’s objectives and values
How do we engage? Maintenance of open dialogue at all times.
Actions: → Regular joint operating and technical
committee meetings
→ Senior management pre-project and post project reviews
→ Participation in industry bodies and initiatives
→ Discussions with oil and gas companies with activities in areas with similar geological characteristics
Governa
nceF
inancia
l statem
entsS
trateg
ic report
Phoenix Global Resources plc Annual Report and Accounts 2020 23

Stakeholder engagement continued
Phoenix Global Resources plc Annual Report and Accounts 2020 24
Our investors Why it is important to engage? We provide regular detailed and transparent information to aid understanding of our strategy, business model and performance.
Important considerations: → Building investor base support
→ Assisting investors in their decision making
→ Enhancement of long-term shareholder value
How do we engage? Maintenance of regular dialogue with the markets and shareholders.
Actions: → Periodic investor meetings
→ Regular news announcements
→ Annual General Meeting open to all shareholders
→ Dedicated investor relations email address
→ Shareholder representation on Covid-19 restructuring committee
Communities and Provinces Why it is important to engage? We operate in many locations providing employment and paying royalties that support the social infrastructure in the communities in which we work.
Important considerations: → Maintenance of our social licence
to operate
→ Delivery of projects that exceed the environmental and safety expectations of the Provinces
→ Building trust in the communities that we work in and are part of
How do we engage? Working with Provincial governments and provincial departments.
Actions: → Regular meetings with Provincial
governments, particularly when planning new projects
→ Working with Provincial departments including water, HSE, fire and emergency
→ Participation in multi-discipline safety drills with municipal authorities
→ Look back review with Provincial governments and departments following completion of a project
Our suppliers Why it is important to engage? We work closely with and seek to build effective relationships with suppliers of specialised drilling, completion and other services that are critical to the delivery of our complex projects.
Important considerations: → Maintenance of our social licence
to operate
→ Delivery of projects that exceed the environmental and safety expectations of the Provinces
→ Building trust in the communities that we work in and are part of
How do we engage? Proactive and responsive dialogue with suppliers.
Actions: → Contract tendering and negotiating
processes
→ Joint working teams on complex projects
→ Project debrief sessions
→ External benchmarking
→ Implementation of a Stop Work Policy
The Strategic Report from pages 1 to 24 was approved by the board and signed by order of the board by Nigel Duxbury, Company Secretary, on 17 May 2021.
Phoenix Global Resources plc Annual Report and Accounts 202024

Corporate Governance Statement
25 Phoenix Global Resources plc Annual Report and Accounts 2020
Chairman’s statement on corporate governance In 2018, a change to the AIM Rules required companies to formally adopt a recognised governance framework. At that time, it felt appropriate that we continue to work within the framework of the UK Corporate Governance Code (the ‘Code’) that is widely recognised to be most comprehensive for UK listed companies, whilst recognising that there may be areas where full compliance is not yet possible or practical when considering the size of the Company and the relatively early stage of its unconventional operations in Argentina.
The market for oil and gas companies became very challenging in 2020 and as part of our response and to safeguard the future of the Company, we had to make changes to the size of the board and reduce headcount. Recognising this reduced capacity in the business, the board agreed to adopt and report against the provisions of the Quoted Companies Alliance Corporate Governance Code (the ‘QCA Code’) as opposed to the Code, which is considered appropriate for a Company of our nature and size. The QCA code provisions cover many of the same areas as the UK Corporate Governance Code but provides additional flexibility in the manner of reporting and the application of certain provisions.
The QCA has ten principles of corporate governance that the Company, as far as possible and practicable, has applied within the business. These principles are listed below and the board and employees across the business work to ensure that these principles are adhered to and any departure from these principals is detailed below, together with the reasons for non-compliance, our views on mitigating factors and our plans to move to compliance where appropriate and as much as the Company is able.
The board not only sets expectations for the business but also works towards ensuring that strong values are set and carried out by the directors across the business. A strong corporate culture is paramount to the success of a business and the board strives to ensure that the objectives of the business, the principles and risks are underpinned by values of good governance that are fed down throughout the organisation. Effective engagement with and understanding the objectives of our shareholder groups is key to the long-term success of the Company and the board ensures that the interests and views of all shareholders and other stakeholders are considered as part of the decision-making process. This includes regular engagement with minority shareholders as well as the major shareholder.
Unfortunately, during the year, as part of the plan to significantly reduce both operating and administrative costs, we have had to restructure the board, resulting in Kevin Dennehy, David Jackson and Javier Alvarez stepping down. We are sorry to see them go and wish them all the best for the future.
Sir Michael Rake Non-executive Chairman 17 May 2021
Governa
nceF
inancia
l statem
entsS
trateg
ic report
Phoenix Global Resources plc Annual Report and Accounts 2020 25

Corporate Governance Statement continued
Phoenix Global Resources plc Annual Report and Accounts 2020 26
The principles of the QCA Code The QCA has ten principles of corporate governance that the Company, as far as possible and practicable, has committed to apply within the business. The table below sets out the principles and how the Company applies them. Further information can also be viewed on our website at www.phoenxiglobalresources .com
QCA Code Principle Disclosure Comments
1. Establish a strategy and business model which promote long-term value for shareholders
The Company’s strategic objectives are laid out in detail on page 2 of this report.
2. Seek to understand and meet shareholder needs and expectations
The board ensures that the interests and views of shareholders are considered as part of its decision-making process and is laid out in more detail on page 23 of this report.
3. Take into account wider stakeholder and social responsibilities and their implications for long-term success
The board ensures that the interests and views of stakeholders are considered as part of its decision-making process and is laid out in more detail on page 23 of this report.
4. Embed effective risk management, considering both opportunities and threats, throughout the organisation
Understanding our principal risks and ensuring that we have the appropriate controls in place to manage those risks is critical to our growth and success. The Group’s approach to risk management is laid out in detail on pages 14 to 20 of this report.
5. Maintain the board as a well-functioning, balanced team led by the chair
The board comprises the Non-Executive Chairman who was independent at the time of his appointment to the board and five non-executive directors, three who the board considers independent. Each of the non-executive directors commit up to four days per month to the Company but are expected to devote additional time in periods of increased activity. The number of board and committee meetings attended by members is detailed on pages 27 to 35 of this report.
6. Ensure that between them the directors have the necessary up-to-date experience, skills and capabilities
Information about the directors and their relevant experience and skills can be found on pages 27 to 28 of this report.
7. Evaluate board performance based on clear and relevant objectives, seeking continuous improvement
There has been no formal evaluation of board performance to date. See page 29 for a more detailed explanation.
8. Promote a corporate culture that is based on ethical values and behaviours
The board recognises the need to develop a corporate culture consistent with the ethical values and behaviours that are expected and ensures its corporate governance policies and principles reflect this goal. The Company operates a performance scorecard to align individual objectives with KPIs and stakeholder interests.
9. Maintain governance structures and processes that are fit for purpose and support good decision-making by the board
Details of the Company’s governance structures are set out in the governance report on pages 25 to 50 and are available on the Company website.
10. Communicate how the Company is governed and is performing by maintaining a dialogue with shareholders and other relevant stakeholders
The board ensures that the interests and views of stakeholders are considered as part of its decision-making process and is laid out in more detail on pages 23 to 24 of this report.
Phoenix Global Resources plc Annual Report and Accounts 202026

The board
27 Phoenix Global Resources plc Annual Report and Accounts 2020
Overview and experience The board consists of six members with diverse backgrounds, with each director bringing different experience to bear for the benefit of the Company, its shareholders and other stakeholders. The primary collective experience of the board is focused on oil and gas industry experience and of operating in Argentina. However, the board also includes individuals with significant financial, legal and public company experience.
Sir Michael Rake serves as the chairman of the board and was independent of Phoenix on his appointment in September 2016. John Bentley is the senior independent director to whom shareholders can raise any issues or concerns or provide feedback to the board.
A summary of the experience of each of the directors is provided below.
Sir Michael Rake (age 73) Non-executive chairman and chairman and member of the nomination committee and member of the audit and risk and remuneration committees. Appointed on 19 September 2016.
Skills and experience Sir Michael Rake is the former chairman of BT Group plc, EasyJet plc, Worldpay Group plc and a director of S&P Global. Sir Michael was president of the CBI from 2013 to 2015; a member of the Prime Minister’s Business Advisory Group from 2010 to 2015; non-executive director of Barclays plc from 2008, becoming deputy chairman from 2012 to 2015; chairman of the private equity oversight group, the Guidelines Monitoring Committee, from 2008 to 2013; and the first chairman of the UK Commission for Employment and Skills from 2007 to 2010. He was a director of the Financial Reporting Council from 2004 to 2007. From May 2002 to September 2007, Sir Michael was international chairman of KPMG. Prior to his appointment as international chairman, he was chairman of KPMG in Europe and senior partner of KPMG in the UK. Sir Michael was knighted in 2007. In 2011 he received the British American Business UK Transatlantic Business Award in recognition of outstanding business leadership. In 2013, he received the Channing Award for Corporate Citizenship, was voted the FTSE 100 non-executive director of the year and received the ICAEW outstanding achievement award.
External appointments → Chairman of Great Ormond Street Hospital
→ Chairman of New Day Ltd
→ Chairman of Wireless Logic
→ Chairman of Majid Al Futtaim Holdings LLC
Qualifications → Chartered accountant
John Bentley (age 73) Senior independent director and chairman and member of the remuneration committee and member of the audit and risk and nomination committees. Appointed on 10 August 2017.
Skills and experience John has over 40 years’ experience in the natural resources sector. He is an experienced board member, being a past managing director of Gencore’s Brazilian mining company, Sea Bento Mineracao and chief executive of Engen’s exploration and production division. In 1996, John was instrumental in floating Energy Africa Ltd on the Johannesburg stock exchange and became chief executive for the following five years. More recently he was executive chairman of First Africa Oil plc and served on the boards of Rift Oil plc, Adastra Minerals Ltd, Caracal Energy Inc and Scotgold Resources Limited. He is currently senior independent director of Wentworth Resources Ltd and a non-executive director of Africa Energy Corp. John holds a degree in Metallurgy from Brunel University.
External appointments → Senior independent director of Wentworth Resources Ltd
→ Non-executive director of Africa Energy Corp.
Qualifications → B.Tech (Hons) Metallurgy, Brunel University
Martin Bachmann (age 62) Independent non-executive director and chairman of the audit and risk committee and member of the remuneration and nomination committees. Appointed on 1 September 2019.
Skills and experience Martin, a trained geophysicist, has more than 35 years’ executive experience across the global oil and gas business. Most recently he was a member of Wintershall’s board of executive directors for 10 years. At Wintershall his responsibilities included managing its 70,000 boepd production company in Argentina where he gained experience in the unconventional space. Previously he had a 25-year career with Shell, managing various businesses in the FSU, Spain, the Netherlands, the North Sea and the Middle East. Martin is Swiss and speaks German, English, Dutch, French and Spanish.
External appointments → Non-executive chairman of NEO Energy Group Ltd
→ Non-executive director of Point Resources Holding AS
Qualifications → MSc (Geophysics) from the Swiss Federal Institute
of Technology (ETH)
Governa
nceF
inancia
l statem
entsS
trateg
ic report
Phoenix Global Resources plc Annual Report and Accounts 2020 27

The board continued
Phoenix Global Resources plc Annual Report and Accounts 2020 28
Tim Harrington (age 62) Independent non-executive director. Appointed on 14 November 2018.
Skills and experience Tim Harrington has over 39 years of oil and gas experience and spent 31 years with BP plc in various commercial, financial and operating leadership positions around the globe including postings in Houston, Anchorage, London and Bogota. In his final two roles with BP, he served as CFO and then later as president of BP America Production Company, BP’s onshore L48 E&P business focused on unconventional resources. Since leaving BP, he has been working with private equity and various start-ups in the United States and currently serves as a senior energy advisor to Trilantic Capital Partners. Additionally, Tim sits on the board of directors for DJR Energy LLC, TRP Energy LLC and EnergyFlo Chemical Applications LLC, three privately funded oil and gas industry related start-ups operating in the onshore United States. He is also a member of the National Association of Corporate Directors (‘NACD’) in the United States and was a past director and executive committee member for the Texas Oil and Gas Association (‘TXOGA’). Tim Harrington holds a B.S. in Accounting from Miami University (Ohio), an MBA from Xavier University, and previously earned his CPA in Texas.
External appointments → Non-executive director of DJR Energy LLC
→ Non-executive director of TRP Energy LLC
→ Non-executive director of EnergyFlo Chemical Applications LLC
Qualifications → BSc, Accounting, Miami University (Ohio) MBA,
Xavier University
→ Certified Public Accountant, Texas (inactive)
Daniel Jaeggi (age 60) Non-executive director. Appointed on 14 November 2018.
Skills and experience Daniel is co-founder and president of Mercuria Energy Group Limited. Daniel is the nominated majority shareholder representative to the board.
Nicolás Mallo Huergo (age 51) Non-executive director. Appointed on 2 October 2007.
Skills and experience Nicolás was chairman of Andes Energia plc until August 2017 and is a director of both Integra Investment S.A. and Integra Capital S.A.. Nicolás is the nominated minority shareholder representative to the board.
Board independence Excluding the chairman, who was independent on his appointment, more than 50% of the board comprises independent non-executive directors.
In addition to Martin Bachmann’s fee as an independent non-executive director, a consulting agreement is in place between the Company and Martin Bachmann pursuant to which he receives an additional fixed monthly retainer for providing industry expertise, support and advice to the Company. The consulting agreement has no variable or incentive compensation element in its terms. The board is of the opinion that the consulting agreement does not impair Martin’s independence.
Tenure of directors and nominations All directors are proposed for reappointment annually at the Company’s AGM. The date of original appointment is shown in the table below. Apart from Nicolás Mallo Huergo, the minority shareholder representative to the board, no director, including the chairman, has served on the board for a period of longer than nine years.
Director Considered
Independent Date of
Appointment Length of
Service
Sir Michael Rake No 19 September 2016
4 years 6 months
John Bentley Yes 10 August 2017
3 years 8 months
Martin Bachmann Yes 1 September 2019
1 years 7 months
Tim Harrington Yes 14 November 2018
2 years 4 months
Daniel Jaeggi No 14 November 2018
2 years 4 months
Nicolás Mallo Huergo No 2 October 2007
13 years 6 months
Access to advice All directors have access to the advice and services of the Company Secretary who is responsible to the board for ensuring compliance with laws and regulations applicable to the Company. The Company Secretary is also responsible for ensuring that board procedures are followed. The directors, collectively or individually, are able to take independent professional advice if they believe such advice is required in the furtherance of their duties. Where such advice is taken, it is at the Company’s expense. During the year, no independent professional advice was required on significant matters.
Phoenix Global Resources plc Annual Report and Accounts 202028

29 Phoenix Global Resources plc Annual Report and Accounts 2020
Directors’ other commitments The chairman and non-executive directors have other external commitments, including directorships of other companies as disclosed in the individual director biographies. The Company is satisfied that these associated commitments have no measurable impact on the ability of directors to discharge their responsibilities to Phoenix effectively. Additional external commitments held by directors provide a benefit in terms of diverse experience that can be brought to bear for the benefit of the Company. The external commitments of the directors also assist with keeping their skills up to date along with them engaging in external training for this purpose. The directors are also members of relevant professional bodies that also assists with keeping them abreast of market and regulatory changes.
Responsibilities of the board The responsibilities of the board:
Role Principal responsibilities
Chairman → Manages and provides leadership to the board → Acts as a direct liaison between the board and
management, working with the CEO to assist the flow of information that the directors have sufficient information to enable them to make informed judgements
→ Sets the agendas for board meetings working with the CEO, the CFO and Company Secretary
→ Recommends an annual schedule of board and committee meetings
→ Ensures effective communication with shareholders and other stakeholders
Senior independent director
→ An independent non-executive director → Provides a sounding board for the chairman
and the CEO → Serves as an intermediary for the other
directors as necessary → Is available to shareholders should they have
concerns
Non-executive directors
→ Provide constructive challenge to the executives
→ Help develop proposals on strategy → Scrutinise management’s performance in
meeting agreed goals and objectives → Monitor performance reports → Satisfy themselves on the integrity of financial
information and that controls and risk management systems are robust and defensible
→ Determine appropriate levels of remuneration for executive directors
→ Appoint and remove executive directors as required and review succession planning
Company* Secretary
→ Provides advice and services to the board → Ensures compliance with laws and regulations
applicable to the Company → Responsible for effective governance and that
board procedures are followed
* The CFO and Company Secretary roles are currently combined but the capacity in which these roles are performed and advice provided are clearly communicated at all times
Evaluation of board performance The board will implement a process for the evaluation of its own performance, its committees and individual directors, including the Chairman. The board has considered it appropriate, given the size and early stage of development of the Company, that the evaluation of performance is undertaken on an informal basis when it is considered appropriate and in the best interests of the Company. At that time, the board will also review the structure of its committees. The board considers that it has the necessary mix of experience, skills, personal qualities, and capabilities to deliver the strategy of the Company for the benefit of the shareholders over the medium to long-term. This will be assessed further at the same time performance is assessed.
Board changes During 2020, Kevin Dennehy, David Jackson and Javier Alvarez stepped down from the board.
Meetings The directors’ attendance at scheduled meetings during 2020 is detailed below:
Board attendance Role Meetings attended
Sir Michael Rake Non-executive chairman 4/4
John Bentley Independent non-executive director
4/4
Kevin Dennehy1 Chief financial officer 2/2
Martin Bachmann Independent non-executive director
4/4
David Jackson2 Independent non-executive director
2/2
Javier Alvarez2 Independent non-executive director
2/2
Tim Harrington Independent non-executive director
4/4
Daniel Jaeggi Non-executive director 1/4
Nicolás Mallo Huergo Non-executive director 4/4
1 Resigned 21 May 2020 2 Resigned 30 June 2020
Governa
nceF
inancia
l statem
entsS
trateg
ic report
Phoenix Global Resources plc Annual Report and Accounts 2020 29

Executives
Phoenix Global Resources plc Annual Report and Accounts 2020 30
Overview and Experience The CEO and CFO, whilst not members of the board, regularly attend board meetings and committee meetings. The CEO, Pablo Bizzotto, is based in Buenos Aires, Argentina and has over 20 years’ experience in the oil industry. The CFO, Nigel Duxbury, is based in London and has extensive experience with quoted companies in the UK and in other jurisdictions and has significant experience in the oil industry.
A summary of the experience of each of the senior executives is provided below.
Pablo Bizzotto, CEO Pablo was the Upstream Executive Vice President at YPF and prior to that the Unconventional Resource Executive Manager at YPF leading operations on the Vaca Muerta formation in the Neuquen basin and some of Argentina’s most significant tight gas development such as Rincon del Mangrullo. He previously worked for more than 12 years with Pan American Energy, where he held various positions, gaining experience in all basins in Argentina. Pablo graduated from Comahue University in Neuquen City with a degree in Petroleum Engineering and holds an MBA from Barcelona University.
Qualifications → Degree in Petroleum Engineering from Comahie University and
MBA from Barcelona University.
Nigel Duxbury, CFO and Company Secretary Nigel has over 10 years of experience in the oil and gas industry which began with the reverse takeover of the Company in 2007. He has a background in finance and accountancy, having qualified as a chartered accountant with Touche Ross, London. Nigel has extensive experience both as a finance director, company secretary and senior executive in small and large, quoted and unquoted, companies within Europe, Asia and the Americas.
Qualifications → BSc Reading University and Chartered Accountant.
Pablo Bizzotto, the CEO and Nigel Duxbury, the CFO and Company Secretary, whilst not members of the board do not hold any external appointments.
Responsibilities of the Senior Executives Role Principal responsibilities
Chief Executive Officer
→ Provides broad leadership and promote collaboration across the organisation
→ Provides individual and collective coaching to the senior management team
→ Works with the senior management team to maintain a robust HSE and operating management system
→ Works with the senior management team on effective performance management processes
→ Assists the senior management team in development and implementation of strategy
→ Provides enhanced insights, learnings and challenges regarding successfully appraising and developing unconventional resources
→ Advises and assists the senior management team and board in business development opportunities and activity
→ Interfaces with the chairman, stakeholders and board on matters of strategy and material events
Chief Financial Officer
→ Overall management of the financial risks of the Group
→ Is responsible for financial planning and record keeping as well as financial reporting to the board and shareholders
→ Ensures effective financial compliance and control, while responding to regulatory developments, including financial reporting, capital requirements and corporate responsibility
Phoenix Global Resources plc Annual Report and Accounts 202030

Board Committees
31 Phoenix Global Resources plc Annual Report and Accounts 2020
Overview The board has established audit and risk, remuneration and nominations committees. The reports from each of these committees are provided below.
Audit, risk and internal control Responsibility for the annual report The board has charged the audit and risk committee with the responsibility for reviewing the contents of the 2020 annual report to assess, when taken as a whole, if it is fair, balanced and understandable. The audit and risk committee considers if the annual report provides all the necessary information for shareholders and other stakeholders to assess the financial position of the Group and its performance in the context of the business model and strategy that is articulated in the annual report.
Internal control The board has responsibility for the overall system of internal control and for reviewing its effectiveness. In making its determination of effectiveness, the board has carried out a robust review of the principal risks facing the Group, including those that would threaten its business model, future performance, solvency or liquidity.
Internal audit The Group does not currently have a dedicated internal audit function. Because of the relatively small size of the Group and the single focus of operations in terms of industry and location, the directors consider it appropriate to consult with competent, recognised consultants and specialists in relation to subjective or complex areas of operations, accounting or specific transactions.
Risk assessment and risk management The directors have undertaken a robust assessment of the Company’s emerging and principal risks. The assessment includes a quantification of the likelihood, impact and potential financial exposure related to each identified risk together with mitigation factors or actions that can be taken to reduce the Company’s HSE, operational or financial exposure.
The Company’s risk management procedures are assessed annually, primarily as part of the annual report process. Risk assessments are also updated periodically during the year, for instance in advance of major field operations such as drilling and completion operations, construction, or seismic acquisition.
Audit and risk committee report Membership and attendance at scheduled meetings: Members Date appointed Date resigned
David Jackson (chair) August 2017 June 2020
Javier Alvarez August 2017 June 2020
Sir Michael Rake August 2017
Martin Bachmann (chair) September 2020
John Bentley September 2020
Audit committee attendance Role Meetings attended
David Jackson Chair/member 2/2
Javier Alvarez Member 2/2
Sir Michael Rake Member 3/3
Martin Bachmann Chair/member 1/1
John Bentley Member 1/1
Purpose The main function of the audit and risk committee is to assist the board in fulfilling its financial oversight responsibilities by reviewing and monitoring the integrity of the financial information provided to shareholders and the Group’s system of internal control and risk management.
These systems have been established for the purpose of providing relevant, accurate and timely information for both external reporting and internal management purposes. As part of this role, the committee is also responsible for the internal and external audit processes and the Group’s compliance with laws, regulations and other ethical codes of practice.
Membership The terms of reference for the committee require that it has at least three members, the majority of whom are independent. The members are all appointed by the board on the recommendation of the nominations committee and in consultation with the audit and risk committee chair. The chair of the board may be a member of the committee, though only where he or she is considered independent on appointment as chair of the board. Where the chair of the board sits on the audit and risk committee, he or she cannot chair the committee. Sir Michael Rake is currently a member of the audit and risk committee.
Meetings are normally attended by the chief financial officer and key members of the finance team as appropriate and at the invitation of the committee. In addition, representatives of the external auditors are invited to attend meetings and particularly those related to the external reporting cycle. The committee chair maintains an ongoing dialogue with key individuals involved in the Company’s governance, including the external auditors. The chair also meets privately with the external auditors at least once per year, though will meet more frequently as circumstances dictate.
Governa
nceF
inancia
l statem
entsS
trateg
ic report
Phoenix Global Resources plc Annual Report and Accounts 2020 31

Board Committees continued
Phoenix Global Resources plc Annual Report and Accounts 2020 32
Responsibilities The principal responsibilities of the audit and risk committee are:
→ to monitor the integrity of the financial statements, including the annual and interim financial statement reporting required by both the London and Buenos Aires stock exchanges;
→ to review any other formal or informal reporting regarding the Company’s financial position or communications, such as analyst and investor presentations, annual results presentations and financial information contained in press releases and other communications;
→ to report to the board on financial reporting issues and significant areas of judgement, including matters discussed with the external auditors;
→ to provide oversight of the work of the external auditors and make recommendations to the board in relation to their appointment or reappointment. Such oversight includes that related to any re‑tendering or termination of the external audit contract;
→ to provide oversight of the relationship with the external auditors, including agreeing terms of reference, scope and remuneration (including both audit and non-audit fees);
→ the maintenance of internal controls and risk management systems together with arrangements for internal audit; and
→ to monitor policies and procedures related to ethics, fraud and whistleblowing.
Meeting frequency The committee will usually meet at least three times per year with the calendar of meetings designed around the key phases of the external financial reporting cycle, including audit planning, interim results, preliminary announcement and the conclusion of the annual financial statement audit.
The significant issues considered by the audit and risk committee in 2020 in relation to the financial statements and how each of these were addressed are detailed below:
Going concern assessment – 2020 has been dominated by Covid-19 and its rapid development as a life-threatening global pandemic. Globally, respective governments’ response has been one of containment through lock-down, social distancing restrictions, quarantine and self-isolation for substantially all citizens, whilst countries strive to roll out vaccination programs. This has resulted in a significant adverse impact on industrial and commercial activity, which led to the shut-down of the Company’s production in April 2020. Consequently, the Company took significant steps to reduce its costs in all areas of the business. The directors believe these cost reduction actions mean the Company is in a better position to produce oil economically at lower oil prices with a positive contribution to cash flow at normalised production levels, which will allow the Company to focus on the continued development of its unconventional assets.
This situation is compounded by the political and economic uncertainty in Argentina. The country is in its third straight year of recession and whilst it announced at the end of August 2020 that 99% of the holders of the country’s US$65 billion international bonds had agreed to restructure this debt discussions between the Argentine government and the IMF to reschedule US$45 billion of debt are ongoing and the outcome of the 2021 legislative elections in Argentina is uncertain.
Notwithstanding, our major shareholder, Mercuria continues to be supportive of the Company’s plans and continues to extend short-term debt facilities to fund operations. Mercuria has written to the Company stating its intention to continue to provide financial support to the Company in order that it may continue to operate and service its liabilities as they fall due in the next 12 months and also fund the planned work programs. Mercuria has also specifically agreed to not demand repayment of the existing loans (principal and interest) within the next 12 months whilst discussions with the Company to restructure these loans continue. This letter, which by its nature is not legally binding, represents a letter of comfort stating Mercuria’s current intention to continue to provide financial support.
Impairment assessment – The Group’s accounting policy for long-lived assets gives examples of potential triggers for impairment that management will consider when assessing if a particular asset may be impaired.
These include:
→ Exploration drilling that has not resulted in the discovery of reserves in potentially commercial quantities;
→ Changes in oil and gas prices or other market conditions that indicate discoveries may not be commercial;
→ The anticipated cost of development indicates that it is unlikely the carrying value of the exploration and evaluation asset will be recovered in full;
→ There are no plans to conduct further exploration activities in an area; or
→ The exploration licence or concession period has expired or is due to expire.
In 2020 the primary method used in assessing impairment triggers for producing assets, was an economic evaluation based on fair values using the NPV15 of post-tax cash flows generated from the 2P reserves of producing assets of the associated cash generating unit. Factors considered in this evaluation include:
→ Historic and expected production
→ EUR and type curve analysis
→ Capex
→ Opex
→ Discount factors
→ Price deck
Phoenix Global Resources plc Annual Report and Accounts 202032

33 Phoenix Global Resources plc Annual Report and Accounts 2020
For exploration assets, management considered risked fair values based on post-tax NPV15 of P3 reserves and contingent resources in conjunction with fair values assessed on a per acreage basis. Fair values attributed on a per acreage basis have been assessed by reference to values attributed to precedent transactions by comparing the following characteristics of the Company’s licences with comparable characteristics of licences the subject of precedent transactions:
→ °API
→ %TOC
→ Landing zones
→ Formation depth
→ DFIT (Psi)
→ Pressure gradient (Psi/ft)
→ Geohazards
Where the calculated fair values are less than the carrying values an impairment test is performed.
The 2020 impairment assessment review resulted in an impairment charge of US$35.9 million in respect of intangible assets and an impairment charge of US$ 128.6 million in respect of property, plant and equipment. See notes 13 and 14 on pages 77 to 81 for more details.
Internal audit and partner audit activity As referenced above, the Group does not currently have an internal audit function and no internal audit reviews were undertaken in 2020. The board had not commissioned any specific internal audit reviews in 2019 either.
Given the current size of the Group and its level of activity, it is likely that any operational or financial reviews that either management or the board consider appropriate during 2021 will be undertaken using a specialist provider of internal audit services.
External audit Pricewaterhouse Coopers LLP (‘PwC’) is the external auditors to the Group in respect of the 2020 annual report and financial statements. The committee’s terms of reference require the Group to consider whether to put the audit out to tender after five years and annually thereafter. PwC was first appointed as external auditors for the year ended 31 December 2012 and its appointment was reconsidered in light of the tendering requirements after each audit since and including 2016 and will be considered again on conclusion of the 2020 audit.
Non-audit services The audit and risk committee has established a policy for the provision of non-audit services by the external auditors to ensure that these services do not impair the auditors' independence or objectivity. The policy identifies those services that the auditors may provide, services that are precluded in normal circumstances and sets guidance around the level of non-audit fees that the committee considers to be acceptable. Fees for specific pieces of work are dependent on the type of service being proposed, the seniority of the consultants considered appropriate to deliver work and the circumstances related to the provision of the service. No significant non-audit work was undertaken by PwC in 2020.
Nominations Committee Report Membership and attendance at scheduled meetings: Members Date appointed Date resigned
Sir Michael Rake (chair) August 2017
Javier Alvarez August 2017 June 2020
John Bentley August 2017
Martin Bachmann September 2020
Nominations Committee attendance Role Meetings attended*
Sir Michael Rake Chair/member 1/1
Javier Alvarez Member 1/1
John Bentley Member 1/1
Martin Bachmann Member 0/0
* A second meeting was scheduled but cancelled due to the Covid-19 situation
Purpose The nominations committee is formed with the purpose of monitoring the balance of skills, knowledge, experience, independence and diversity of the board and its committees. Consideration of diversity includes gender diversity as well as diversity of nationality, background, skills and experience. The committee is charged with ensuring that there is a formal, rigorous and transparent procedure for the nomination and appointment of new directors and that appropriate procedures are in place for the nomination, selection and training of directors.
Responsibilities The principal responsibilities of the nominations committee are to:
→ review the structure, size and composition of the board, taking account of the Group’s strategic objectives, and make recommendations in regard to any changes required;
→ plan for the succession of directors and other senior executives;
→ identify, and nominate for board approval, candidates to fill board vacancies as they arise;
→ annually review the time commitment required of non-executive directors together with the number and type of external appointments held by those directors;
→ make recommendations to the board in regard to the membership of both the audit and risk committee and the remuneration committee in consultation with the relevant committee chair; and
→ assist the board with the periodic evaluation of the performance of individual directors and of the board as a whole.
Governa
nceF
inancia
l statem
entsS
trateg
ic report
Phoenix Global Resources plc Annual Report and Accounts 2020 33

Board Committees continued
Phoenix Global Resources plc Annual Report and Accounts 2020 34
Diversity When considering board composition, the Group policy continues to be to recruit the best candidate available for any position based on merit and against objective criteria in order to achieve the most effective board. The application of this policy is delegated to the nominations committee and applied throughout the Group. The experience of the board is very diverse and covers not only a wealth of oil and gas operational experience, but also extensive technical, operational, financial, governance, legal and commercial expertise.
The board recognises the strength that comes with diversity and the different viewpoints and innovative thinking that can come from a combination of diverse life experiences. We are committed to continue to work hard to ensure that we recruit the very best candidates throughout our business regardless of gender, nationality or background.
Activity in 2020 Kevin Dennehy, the CFO, stepped down from the board in May 2020 and non-executive directors, David Jackson and Javier Alvarez stepped down from the board in June 2020 as part of the mitigating cost saving actions taken by the Company. Together with administrative support from the major shareholder, a search process for a new CEO was initiated and culminated with the appointment of Pablo Bizzotto and Nigel Duxbury, the Company Secretary, was appointed CFO to replace Kevin Dennehy.
Priorities for the coming year In 2021, the committee will continue to assess the skills present on and the effectiveness of the board and will make additional appointments as determined appropriate. Due to the board changes during the year, the Company decided to defer a performance evaluation of its board, committees and individual directors including the Chairman. This will be kept under review in the coming year.
Over-boarding We are aware of, and have considered, recent guidance from proxy organisations recommending that shareholders vote against the re-election of directors where they consider that a director is attempting to undertake too many roles in addition to the responsibilities that come with being a member of the Company’s board. We are satisfied that the current members of the board do have sufficient time to fulfil their duties, we recognise that some directors hold a number of external appointments.
Conflicts of interest The board operates a policy to identify and, where appropriate, manage conflicts or potential conflicts with the Group’s interests. In accordance with the directors’ interest provisions in the Companies Act 2006, all of the directors are required to submit to the Company Secretary details of any situations that might give rise to an actual or potential conflict of interest. The board monitors and reviews potential conflicts of interest on a regular basis.
Remunerations Committee Report Membership and attendance at scheduled meetings: Members Date appointed Date resigned
John Bentley (chair) August 2017
David Jackson August 2017 June 2020
Sir Michael Rake August 2017
Martin Bachmann September 2020
Remunerations Committee attendance Role
Meetings attended*
John Bentley Chair/member 2/2
David Jackson Member 1/1
Sir Michael Rake Member 2/2
Martin Bachmann Member 1/1
* A third meeting was scheduled but cancelled due to the Covid-19 situation
Purpose The primary functions of the committee are to assist the board in relation to developing and implementing the remuneration policy and practices of the Company for the chairman, the executive directors and senior management. It is the committee’s responsibility to ensure that the chairman, executive directors and senior management are fairly and appropriately rewarded for their individual contributions to its overall performance having due regard to the financial and commercial position of the Group and statutory and regulatory requirements. The committee operates within agreed terms of reference, which are available on our website.
The CEO. CFO and Company Secretary attend meetings of the committee by invitation. The members of the committee and any persons attending its meetings do not participate in any discussion or decision on their own remuneration.
Overview Although Phoenix is currently quoted on the London Stock Exchange’s Alternative Investment Market (‘AIM’), the board recognises the importance of shareholder transparency and standards of governance. In 2017, the board decided to follow the principal provisions of the UK Corporate Governance Code on a comply or explain basis, commensurate with the standards expected by stakeholders of companies listed on the Premium Segment of the London Stock Exchange’s Main Market. However, recent events have caused the Company to reassess its position and whilst continuing to recognise the importance of standards of governance, the Company now applies the principles of the Quoted Companies Alliance Corporate Governance Code (‘QCA code’).
The Company has had to deal with the uncertainties and challenges presented by the coronavirus (‘Covid-19’), which together with the implementation of a cost reduction program has seen a large number of staff leave the Company.
As a result, the committee, in these difficult times, has had to exercise judgement in applying discretion in relation to 2020 remuneration levels, which it will continue to monitor throughout 2021.
Phoenix Global Resources plc Annual Report and Accounts 202034

35 Phoenix Global Resources plc Annual Report and Accounts 2020
2020 and Phoenix’s remuneration policy The aim is for executive remuneration at Phoenix to:
→ attract, retain and motivate individuals of a high calibre and appropriate experience;
→ align incentives with the Company’s strategic goals and business plans;
→ deliver rewards for strong and sustainable business performance whilst avoiding reward for failure; and
→ align the interests of the executive directors with those of shareholders.
The committee continues to regularly review its approach to remuneration and its continued appropriateness considering market practice, regulatory requirements and corporate governance best practice as may be applicable to the Company over time. Whilst target bonuses for 2020 were based on a combination of quantitative and subjective key performance indicators including corporate, operational, financial and personal performance, it was agreed, in these difficult times, that it was not appropriate to award any bonuses under the 2020 plan. In addition, it was decided not to grant any awards under its Long-Term Incentive Plan (‘LTIP’) in 2020.
The remuneration policy set out on pages 36 to 43 was developed to reinforce the above objectives, but in light of recent events and the stage of the Company’s development, its appropriateness is currently under review.
Key decisions and pay outcomes in 2020 During the year Kevin Dennehy resigned from the board with effect from 21 May 2020 and resigned as CFO with effect from 30 November 2020. The committee applied the directors’ remuneration policy and exit payment policy when determining the appropriate termination arrangement for Kevin who was determined by the committee to be a ‘good leaver’.
Additionally, as referred above:
→ No annual bonuses were awarded for 2020
→ No awards were granted under the Company’s LTIP in 2020
Looking ahead to 2021 → The positions of CEO and CFO have been filled but the
individuals have not been appointed to the board.
→ In the current environment any bonuses will primarily be determined on a discretionary basis.
→ The committee and board are reviewing the terms of the LTIP and awards are likely to be granted in 2021.
→ Following the reduction of non-executive fees in 2020, these will be reviewed in 2021.
Workforce remuneration The committee’s main focus is to ensure that the Company’s remuneration policy is implemented and applied in such a way as to attract, retain and motivate the Company’s leadership to promote the long-term success of the Company. However, when making decisions the committee takes into consideration the impact on the wider workforce, in particular in the current economic environment, the committee recognises the need to continually consider and take, as appropriate, actions to mitigate the impact of the Covid-19 crisis.
Use of discretion The committee may apply its discretion when agreeing remuneration outcomes, to help ensure that the implementation of our remuneration policy is consistent with the guiding principles for Phoenix remuneration. For the year ended 31 December 2020, the committee’s discretion was used, in line with the Company’s exit payment policy, in determining the payment to be made to Kevin Dennehy who resigned from the board. Further details on the use of committee discretion are provided on page 40. Given the high level of uncertainty created in the current environment, it is important to understand that the committee will need to apply discretion when applying and implementing a remuneration policy that is in the best interests of the Company and all its shareholders.
Advisers The committee has replaced Mercer with Ellason as its independent adviser to support the Group on remuneration-related matters. Fees are determined on a time and material basis. No fees were paid to Ellason in 2020 and US$1,271 was paid to Mercer in 2020 (2019:US$55,263).
Governa
nceF
inancia
l statem
entsS
trateg
ic report
Phoenix Global Resources plc Annual Report and Accounts 2020 35

Remuneration Policy Report
Phoenix Global Resources plc Annual Report and Accounts 2020 36
Remuneration policy report Although the Company (being AIM quoted) is not subject to the Directors’ Remuneration Regulations 2008 in the past the remuneration committee prepared this report largely in accordance with the provisions of the Companies Act 2006 and Schedule 8 of the Large and Medium-sized Companies and Groups (Accounts and Reports) Regulations 2013, as though the Company were listed on the London Stock Exchange Main Market.
However, recent events have caused the Company to reassess its position and whilst continuing to recognise the importance of standards of governance, the Company now applies the principals of the QCA code.
Notwithstanding, in recognition of the importance of transparency and these standards of governance, the basic principles of the remuneration policy below, that were applied in previous years, were in general applied in 2020 and will still, in general, be applied by the committee in 2021.
Remuneration policy for the executive directors Purpose and link to strategy Operation Opportunity Performance measures
Base salary To attract and retain talented executive directors to deliver the Group’s strategy by ensuring base salaries and the implied total package are competitive in relevant talent markets, while not overpaying.
Base salaries will be reviewed by the committee annually and benchmarked periodically against comparable roles at international Exploration & Production peers, as well as UK-listed companies of similar size and complexity.
In deciding base salary levels, the committee considers personal performance including the individual’s contribution to the achievement of the Group’s strategic objectives. The committee will also consider employment conditions and salary levels across the Group and prevailing market conditions.
Salaries are set on a case-by‑case basis to reflect the role and the experience and qualifications of the individual.
Base salary increases for the executive directors will not normally exceed the average increase awarded to the wider workforce, other than in exceptional circumstances such as a material change in responsibilities, size or complexity of the role, or if a director was intentionally appointed on a below-market salary.
Base salaries are disclosed in the annual report on remuneration.
n/a
Phoenix Global Resources plc Annual Report and Accounts 202036

37 Phoenix Global Resources plc Annual Report and Accounts 2020
Purpose and link to strategy Operation Opportunity Performance measures
Pension To provide an appropriate structure and level of post‑retirement benefit for executive directors in a cost-efficient manner that reflects local market norms in the relevant jurisdiction.
Executive directors may receive a contribution to a personal pension plan, a cash allowance in lieu, or a combination thereof.
Salary is the only element of remuneration that is pensionable.
Executive directors are eligible for a Company contribution from the Group of up to 10% of base salary and to participate in the 401k plan offered to employees based in the United States.
Details of the pension contributions made to executive directors during the year are disclosed in the annual report on remuneration.
n/a
Other benefits
To provide non-cash benefits which are competitive in the market in which the executive director is employed.
The Group may provide benefits in kind including, but not limited to, a company car or car allowance, private medical insurance (or allowance in lieu) for the executive directors and their family, permanent health insurance and life insurance. Executive directors may also be provided certain other benefits to take account of individual circumstances such as, but not limited to, payment of tax, financial and/or legal adviser fees, expatriate allowance, relocation expenses, housing allowance and tax equalisation (including associated interest, penalties or fees plus, in certain circumstances or where the committee considers it appropriate, any tax incurred on such benefits). Executive directors may also be offered any other future benefits made available either to all senior employees globally or in the region in which the executive director is employed.
Benefits for executive directors are set at a level which the committee considers appropriate compared to wider employee benefits, as well as competitive practices in relevant markets.
It is not anticipated that the costs of benefits provided will increase significantly in the financial years over which this policy will apply, although the committee retains discretion to approve non-material increases in cost. In addition, the committee retains discretion to approve a higher cost in exceptional circumstances (e.g. to facilitate recruitment, relocation, expatriation, etc.) or in circumstances where factors outside the Group’s control have changed (e.g. market increases in insurance costs).
Benefits in respect of the year under review are disclosed in the annual report on remuneration.
n/a
Governa
nceF
inancia
l statem
entsS
trateg
ic report
Phoenix Global Resources plc Annual Report and Accounts 2020 37

Remuneration policy report continued
Phoenix Global Resources plc Annual Report and Accounts 2020 38
Purpose and link to strategy Operation Opportunity Performance measures
Annual bonus To incentivise executive directors to deliver strong financial and operational performance on an annual basis and reward the delivery of the Group’s strategic aims that will underpin the longer-term health and growth of the business.
Deferral into shares enhances alignment with shareholders.
Performance measures, targets and weightings are set by the committee at the start of the year. After the end of the financial year, the committee determines the level of bonus to be paid, taking into account the extent to which these targets have been achieved.
To the extent that the performance criteria have been met, one-third of the annual bonus earned will normally be compulsorily deferred into shares under the Deferred Bonus Plan. Deferred shares vest pro-rata annually over three years. The remainder of the bonus will be paid in cash.
Dividends may accrue on deferred bonus shares over the deferral period and, if so, will be paid (in cash or additional shares) on deferred shares that vest at the time these are released to the executive director.
Malus and clawback provisions apply to the deferred bonus in certain circumstances (as set out in the notes to the policy table).
The maximum annual bonus opportunity is 100% of base salary.
The pay-out for on-target performance is normally 50% of maximum; threshold performance results in zero pay-out.
Bonuses will be based primarily on a combination of stretching annual business and individual objectives. Business objectives (whether financial, operational or non-financial/strategic) will be selected to reflect the Group’s short-term KPIs, financial goals and strategic drivers. The weighting of measures will be determined by the committee but will always include a strong focus on business performance.
The committee may adjust the formulaic annual bonus outcomes (including to zero) to avoid unintended outcomes, align pay outcomes with underlying Group performance and ensure fairness to shareholders and participants.
Further details will be disclosed in the relevant annual report on remuneration. Performance targets set for each year will be disclosed retrospectively (to the extent they are considered not to be commercially sensitive), usually in the annual report on remuneration in respect of the year to which such performance targets relate.
Phoenix Global Resources plc Annual Report and Accounts 202038

39 Phoenix Global Resources plc Annual Report and Accounts 2020
Purpose and link to strategy Operation Opportunity Performance measures
Long-Term Incentive Plan To align the interests of executive directors and shareholders in growing the value of the Group over the long-term.
Executive directors are eligible to receive annual awards over Phoenix shares under the LTIP either in the form of conditional share awards or nil cost options.
Awards granted under the LTIP to executive directors will have a performance period of at least three years. If no entitlement has been earned at the end of the relevant performance period, awards will not vest. Shares received as a result of an award vesting (net of those sold to cover tax liabilities arising on vesting) will normally be subject to an additional two-year holding period.
Dividends may accrue on LTIP awards over the vesting period and, if so, will be paid (in additional shares or in cash) on shares that vest at the end of the vesting period.
LTIP awards granted to executive directors will be subject to malus and clawback provisions, as set out in the notes to the policy table.
The maximum annual LTIP opportunity is 200% of base salary.In exceptional circumstances, the remuneration committee has discretion to make awards of up to 300% of base salary.
25% of an award will vest if performance against each performance condition is at threshold and 100% if it is at maximum, with straight-line vesting in between.
Further details of the LTIP awards granted to each of the executive directors will be disclosed in the relevant annual report on remuneration.
Vesting of the LTIP is subject to continued employment during the performance period and the achievement of performance conditions aligned with the Group’s strategic plan and shareholder value creation.
The performance conditions may include market-based measures, such as total shareholder return and internal measures of financial or operational performance. Performance measures will be selected by the remuneration committee at the start of each cycle.
The committee may adjust the formulaic LTIP outcome to ensure it takes account of any major changes to the Group (e.g. as a result of merger and acquisitions activity) and is a fair reflection of the underlying financial performance of the Group over the performance period.
Further details, including the performance targets attached to the LTIP in respect of each year, will be disclosed in the relevant annual report on remuneration (subject to these being considered not to be commercially sensitive).
Governa
nceF
inancia
l statem
entsS
trateg
ic report
Phoenix Global Resources plc Annual Report and Accounts 2020 39

Remuneration Policy Report continued
Phoenix Global Resources plc Annual Report and Accounts 2020 40
Notes to the policy table Malus and clawback policy Malus and clawback may be applied to the deferred bonus share element of the annual bonus and LTIP awards in cases of gross misconduct by the executive director or material financial misstatement in the audited financial results of the Group. Deferred bonus shares will be subject to malus over the deferral period and LTIP awards will be subject to malus over the vesting period and clawback from the vesting date to the second anniversary of the relevant vesting date.
Share ownership guidelines The committee recognises the importance of aligning executive directors’ and shareholders’ interests through significant shareholdings in the Group. The Group’s policy (as published in the admission document) is to require the CEO to build up a shareholding of 200% of base salary (150% of salary for other executive directors) and to retain these shares until retirement from the board of directors. 50% of any net vested share awards (i.e. after sales to meet tax liabilities) must be retained until the minimum shareholding requirements are met.
Use of discretion The committee may apply its discretion (as set out below) when agreeing remuneration outcomes, to help ensure that the implementation of our remuneration policy is consistent with the guiding principles for Phoenix remuneration.
Payments from outstanding awards The committee reserves the right in certain circumstances to make any remuneration payments and payments for loss of office (including exercising any discretions available to it in connection with such payments) where the terms of the payment were agreed before the policy came into effect; or at a time when the relevant individual was not a director of the Group provided that, in the opinion of the committee, the payment was not agreed in consideration of the individual becoming a director of the Group. For these purposes, payments include the satisfaction of variable remuneration awards previously granted, but not vested, to an individual.
Minor changes to policy The committee retains discretion to make minor, non-significant changes to the policy set out above (for reasons including, but not limited to, regulatory, exchange control, tax or administrative purposes or to take account of a change in legislation) without reverting to shareholders for approval for that amendment, where seeking such shareholder approval would, In the committee's opinion, be disproportionate to the discretion being exercised.
LTIP awards The committee may exercise its discretion as provided for in the LTIP rules. The committee may also adjust the number of shares comprising an LTIP award (or the exercise price if the award comprises options) in the event of a variation of share capital, demerger, special dividend, distribution or any other corporate event which may affect the current or future value of an award. It is intended that any adjustment will be made on a neutral basis, i.e. to not be to the benefit or detriment of participants.
Remuneration policy for the wider workforce The remuneration policy for other employees is based on principles that are broadly consistent with those applied to executive director remuneration, with a common objective of driving financial performance and the achievement of strategic objectives and contributing to the long-term success of the Group.
Remuneration supports our ability to attract, motivate and retain skilled and dedicated individuals, whose contribution continues to be a key factor in the Group’s success.
Annual salary reviews take into account Group performance, local pay and market conditions and salary levels for similar roles in comparable companies. Pension entitlements and other benefits vary according to jurisdiction, to ensure these remain appropriately competitive for the local market. Some employees below executive level are eligible to participate in annual bonus schemes; opportunities and performance measures vary by organisational level, geographical region and an individual’s role.
Employee ownership of Phoenix shares is promoted across the Group. Senior executives are eligible for LTIP awards on similar terms as the executive directors, although award opportunities are lower and vary by organisational level. Other executives are eligible for restricted share awards on a discretionary basis.
In the current economic environment, the committee also recognises the need to continually consider and take actions to mitigate the impact of the Covid-19 crisis, which could, for example, have an impact on bonus and share awards.
Approach to target setting and performance measure selection The committee considers carefully the selection of performance measures at the start of each performance cycle, taking into consideration the Group’s strategic objectives and the macroeconomic environment.
Annual bonus measures are selected to align with the Group’s short-term KPIs (see page 4). LTIP performance measures are selected to ensure they align with the Group’s strategy and long-term shareholder value creation. Measures may change from cycle to cycle (subject to the remuneration policy) and details of the bonus and LTIP measures selected will therefore be disclosed in the relevant annual report on remuneration.
Targets are set to be stretching but achievable over the performance period, taking account of multiple relevant reference points, including typical performance ranges for those measures at other industry peers and FTSE-listed companies of comparable size and complexity.
Exit payments policy The Group’s policy on termination payments is to consider the circumstances on a case-by-case basis, taking into account the relevant contractual terms in the executive’s service contract and the circumstances of termination. Executive directors’ contracts provide for the payment of a pre-determined sum in the event of termination of employment in certain circumstances (but excluding circumstances where the Group is entitled to dismiss without compensation), comprising base salary in respect of the unexpired portion of the notice period. Termination payments may take the form of payments in lieu of notice. Payments would normally be made on a phased basis and subject to mitigation.
In addition to contractual provisions, the table below summarises how awards under each discretionary incentive plan are typically treated in specific circumstances, with the final treatment remaining subject to the committee’s discretion as provided under the rules of the plan. In the event of termination, any outstanding shares or option granted under all-employee schemes will be treated in accordance with the rules of the scheme, which typically do not include discretion.
Phoenix Global Resources plc Annual Report and Accounts 202040

41 Phoenix Global Resources plc Annual Report and Accounts 2020
Treatment of awards on cessation of employment Reason for cessation Calculation of vesting/payment Timing of vesting/payment
Annual bonus
Injury, disability, ill-health, death, redundancy, retirement, or other such event as the committee determines.
The committee may determine that a bonus is payable on cessation of employment (normally pro-rated for the proportion of the performance year worked) and the committee retains discretion to determine that the bonus should be paid wholly in cash. The bonus payable will be determined based on the performance of the Group and of the individual over the relevant period and the circumstances of the director’s cessation of employment.
Following the end of the relevant financial year.
All other reasons (including voluntary resignation).
No bonus will be paid for the financial year.
N/a
Deferred bonus shares
Resignation or dismissal for cause. Awards normally lapse. N/a
All other reasons (e.g. injury, disability, ill-health, death, redundancy, retirement, or other such event as the committee determines).
Awards will normally vest in full (i.e. not pro-rated for time) unless the committee determines that time pro-rating should apply.
At the normal vesting date, unless the committee decides that awards should vest earlier (e.g. in the event of death).
Change of control. Awards will normally be pro-rated for time (unless the committee exercises discretion to disapply time pro-rating). Awards may alternatively be exchanged for equivalent replacement awards, where appropriate.
On change of control.
LTIP awards
Resignation or dismissal for cause. Awards normally lapse. N/a
All other reasons (e.g. injury, disability, ill‑health, death, redundancy, retirement, or other such event as the committee determines).
Awards will normally be pro-rated for time (unless the committee exercises discretion to disapply time pro-rating) and will vest based on performance over the original performance period (unless the committee decides to measure performance to the date of cessation of employment).
At the normal vesting date, unless the committee decides that awards should vest earlier (e.g. in the event of death). Awards subject to a holding period remain subject to this holding period after leaving.
Change of control. LTIP awards will normally be pro-rated for time (unless the committee exercises discretion to disapply time pro-rating) and will vest subject to performance over the period to the change of control.
LTIP awards may alternatively be exchanged for equivalent replacement awards, where appropriate.
On change of control.
Governa
nceF
inancia
l statem
entsS
trateg
ic report
Phoenix Global Resources plc Annual Report and Accounts 2020 41

Remuneration Policy Report continued
Phoenix Global Resources plc Annual Report and Accounts 2020 42
External appointments In cases of hiring or appointing a new executive director from outside the Group, the committee may make use of all existing components of remuneration set out in the policy table, up to the disclosed maximum opportunities (where applicable).
When determining the remuneration package for a new executive director, the committee will take into account all relevant factors based on the circumstances at that time to ensure that arrangements are in the best interests of the Group and its shareholders. This may include factors such as the experience and skills of the individual, internal comparisons and relevant market data.
The committee may also make an award in respect of a new appointment to ‘buy out’ incentive arrangements forfeited on leaving a previous employer, i.e. over and above the maximum limits on incentive opportunities set out in the policy table. In doing so, the committee will consider relevant factors, including any performance conditions attached to these awards, the likelihood of those conditions being met and the time over which they would have vested. The intention is that the expected value of any buy-out award would be no higher than the expected value of the forfeited arrangements and that the structure will replicate (as far as reasonably possible) that of the awards being forfeited. The committee may consider it appropriate to structure ‘buyout’ awards differently from the structure described in the policy table, exercising its discretion under the LTIP rules to structure awards in other forms (including market value options, restricted shares, forfeitable shares or phantom awards) as the remuneration committee may determine in this context.
Internal promotion Where a new executive director is appointed by way of internal promotion, the policy will be consistent with that for external appointees, as detailed above (other than in relation to ‘buyout’ awards). Any commitments made prior to an individual’s promotion will continue to be honoured even if they would not otherwise be consistent with the policy prevailing when the commitment is fulfilled, although the Group may, where appropriate, seek to revise an individual’s existing service contract on promotion to ensure it aligns with other executive directors and good practice.
Disclosure on the remuneration structure of any new executive director, including details of any ‘buyout’ awards, will be disclosed in the annual report on remuneration for the year in which recruitment occurred.
External appointments held by executive directors Executive directors may not accept any external appointment without the consent of the board, there being no conflicts of interest and the appointment not leading to deterioration in the individual’s performance. Executive directors may retain the fees paid for such roles. Details of external appointments will be included in the annual report on remuneration.
Consideration of conditions elsewhere in the Group The committee seeks to promote and maintain good relations with employees as part of its broader employee engagement strategy, considers pay practices across the Group and is mindful of the salary increases applying across the rest of the business in relevant markets when considering any increases to salaries for executive directors. However, whilst the committee does not currently consult with employees on its executive remuneration policy, in 2020 the committee will be looking at ways of increasing and improving the committee’s interaction with the wider workforce, in relation to the Company’s remuneration policy.
Consideration of shareholder views The committee has in 2020 and will continue to take into consideration all shareholder views received during the year and at the annual general meeting each year, as well as guidance from shareholder representative bodies more broadly, in shaping the Group’s implementation of its remuneration policy, as well as any future changes to policy.
Phoenix Global Resources plc Annual Report and Accounts 202042

43 Phoenix Global Resources plc Annual Report and Accounts 2020
Remuneration policy for the non-executive directors Details of the policy on fees paid to our non-executive directors are set out in the table below:
Purpose and link to strategy Operation Opportunity Performance measures
Non-executive director fees To attract and retain non-executive directors of the highest calibre with broad commercial and other experience relevant to the Group.
The fees of the non-executive chairman are determined by the committee. The fees paid to non-executive directors are determined by the non-executive chairman and executive directors. Additional fees may be payable for acting as senior independent director and for chairing or being a member of the audit and risk committee, the remuneration committee and any other board committees.
Fee levels are reviewed annually taking into account external advice on best practice and competitive levels, in particular at FTSE companies of comparable size and complexity. Time commitment and responsibility are also taken into account when reviewing fees.
The non-executive chairman and non-executive director fees are paid in cash.
The committee reimburses the non-executive chairman and non-executive directors for reasonable expenses in performing their duties and may settle any tax incurred in relation to these expenses. Non-executive directors will be reimbursed by the Group for expenses (including travel and accommodation) as required to fulfil their non-executive duties.
The fees paid to the non-executive chairman and non-executive directors are disclosed in the annual report on remuneration.
Fee increases will be applied taking into account the outcome of the annual review.
The maximum aggregate annual fee for all non-executive directors (including the non-executive chairman) as provided in the Group’s articles of association is £750,000.
n/a
Non-executive directors are not eligible to join the Group’s pension, incentives or share schemes or to participate in any of the Group’s other benefit arrangements.
In recruiting a new non-executive director, the committee will use the policy set out above.
Governa
nceF
inancia
l statem
entsS
trateg
ic report
Phoenix Global Resources plc Annual Report and Accounts 2020 43

Annual remuneration report
Phoenix Global Resources plc Annual Report and Accounts 2020 44
This section of the remuneration report provides details of how our remuneration policy was implemented during the year ending 31 December 2020 and how it will be implemented during the year ended 31 December 2021.
Single total figure of remuneration for executive directors The table below sets out a single figure for the total remuneration received by the sole executive director who served during the year. Kevin Dennehy was appointed as an executive director on 1 October 2018 and resigned from the board on 21 May 2020.
Director Base salary1
US$‘000
Taxable benefits2
US$‘000
Annual Bonus
US$‘000 LTIP
US$‘000
Pension Benefit3
US$‘000 Total
US$‘000
Anuj Sharma4 2020 – – – – – –
2019 195 3 – – 29 227
Kevin Dennehy4 2020 156 111 – – 26 293
2019 400 220 – – 67 687
1 The salaries of executive directors was set in the context of salaries for comparable roles at other international E&P companies and FTSE-listed companies of comparable size to Phoenix. For 2019, Anuj Sharma’s base salary figure reflects his annualised salary of US$620,000, pro-rata for the period from the beginning of the year to 23 April 2019 (his date of resignation). For 2020, Kevin Dennehy’s base salary figure reflects his annualised salary of US$400,000, pro-rata for the period from 1 January 2020 to 21 May 2020 (his date of resignation).
2 Consists primarily of private medical insurance, life assurance and permanent health insurance. For 2019 Kevin Dennehy also received an annual foreign living and service allowance of USD$100,000 and an annual housing allowance US$75,360. For 2020 Kevin Dennehy also received an annual foreign living and service allowance of USD$100,000 and an annual housing allowance US$72,000 pro-rated for the period from 1 January 2020 to 21 May 2020 (his date of resignation) plus the reimbursement of repatriation costs.
3 Pension benefits in the year, equivalent to 10% of base salary paid in that year and the Company’s matching contribution to the Company’s 401k plan where applicable. 4 Anuj Sharma resigned as an executive director on 29 April 2019 and his annualised base salary at that time was US$620,000 and he received a pension benefit equivalent to 10% of
his salary. Kevin Dennehy resigned as an executive director on 21 May 2020 and his annualised base salary at that time was US$400,000 and he received a pension benefit equivalent to 10% of his salary.
Single total figure of remuneration for non-executive directors The table below sets out a single figure for the total remuneration received by each non-executive director who served during the year. As an appointee of the Group’s substantial shareholder, Daniel Jaeggi waived his right to receive fees in connection with his appointment.
Director Basic fees US$‘000
Additional fees
US$‘000 Total
US$‘000
Sir Michael Rake 2020 164 – 164
2019 204 – 204
John Bentley1 2020 43 30 73
2019 64 25 89
Javier Alvarez2 2020 32 – 32
2019 64 – 64
David Jackson2,3 2020 32 7 39
2019 64 4 68
Nicolás Mallo Huergo 2020 43 – 43
2019 64 – 64
Daniel Jaeggi4 2020 – – –
2019 – – –
Tim Harrington5 2020 43 230 273
2019 64 – 64
Martin Bachmann6 2020 43 132 175
2019 21 40 61
1 Additional fees paid for his appointment as the senior independent director and chairman of the remuneration committee 2 Resigned 30 June 2020 3 Additional fees paid for his appointment as the chairman of the audit and risk committee 4 Waived right to fees 5 Additional fees paid for consultancy services 6 Additional fees paid for his appointment as the chairman of the audit and risk committee on 1 October 2020 and for consulting services
Phoenix Global Resources plc Annual Report and Accounts 202044
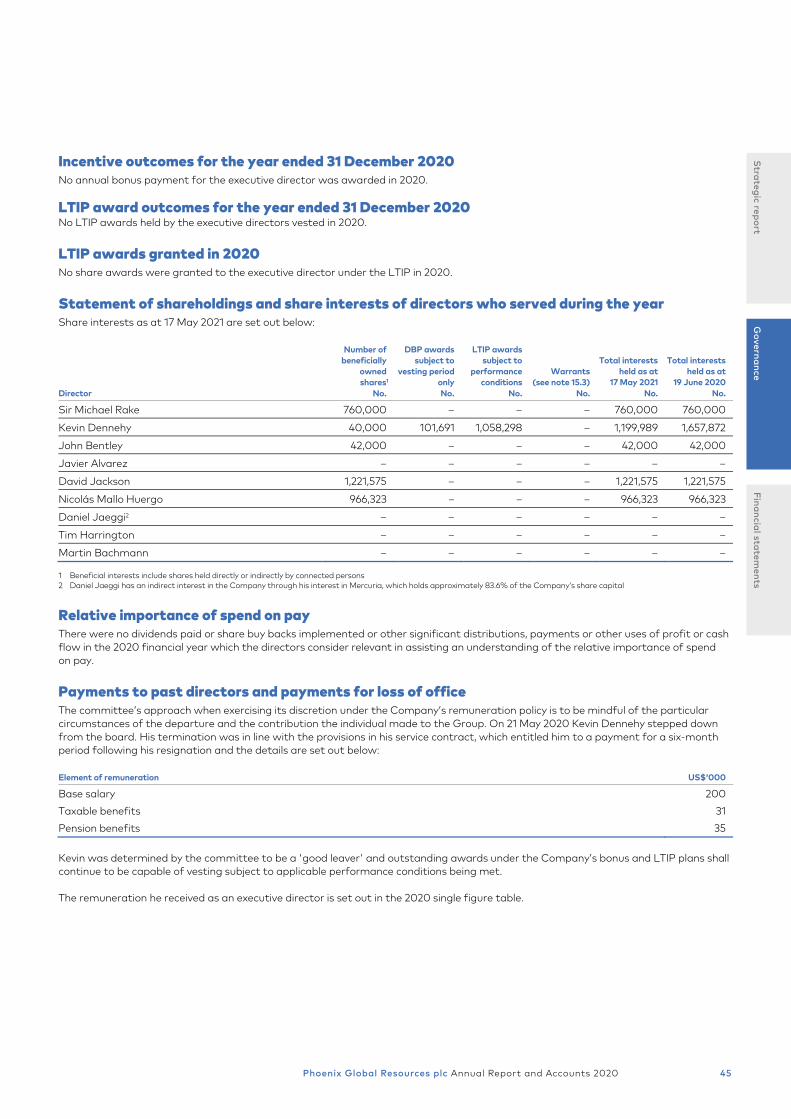
45 Phoenix Global Resources plc Annual Report and Accounts 2020
Incentive outcomes for the year ended 31 December 2020 No annual bonus payment for the executive director was awarded in 2020.
LTIP award outcomes for the year ended 31 December 2020 No LTIP awards held by the executive directors vested in 2020.
LTIP awards granted in 2020 No share awards were granted to the executive director under the LTIP in 2020.
Statement of shareholdings and share interests of directors who served during the year Share interests as at 17 May 2021 are set out below:
Director
Number of beneficially
owned shares1
No.
DBP awards subject to
vesting period only No.
LTIP awards subject to
performance conditions
No.
Warrants (see note 15.3)
No.
Total interests held as at
17 May 2021 No.
Total interests held as at
19 June 2020 No.
Sir Michael Rake 760,000 – – – 760,000 760,000
Kevin Dennehy 40,000 101,691 1,058,298 – 1,199,989 1,657,872
John Bentley 42,000 – – – 42,000 42,000
Javier Alvarez – – – – – –
David Jackson 1,221,575 – – – 1,221,575 1,221,575
Nicolás Mallo Huergo 966,323 – – – 966,323 966,323
Daniel Jaeggi2 – – – – – –
Tim Harrington – – – – – –
Martin Bachmann – – – – – –
1 Beneficial interests include shares held directly or indirectly by connected persons 2 Daniel Jaeggi has an indirect interest in the Company through his interest in Mercuria, which holds approximately 83.6% of the Company’s share capital
Relative importance of spend on pay There were no dividends paid or share buy backs implemented or other significant distributions, payments or other uses of profit or cash flow in the 2020 financial year which the directors consider relevant in assisting an understanding of the relative importance of spend on pay.
Payments to past directors and payments for loss of office The committee’s approach when exercising its discretion under the Company’s remuneration policy is to be mindful of the particular circumstances of the departure and the contribution the individual made to the Group. On 21 May 2020 Kevin Dennehy stepped down from the board. His termination was in line with the provisions in his service contract, which entitled him to a payment for a six-month period following his resignation and the details are set out below:
Element of remuneration US$‘000
Base salary 200
Taxable benefits 31
Pension benefits 35
Kevin was determined by the committee to be a 'good leaver' and outstanding awards under the Company’s bonus and LTIP plans shall continue to be capable of vesting subject to applicable performance conditions being met.
The remuneration he received as an executive director is set out in the 2020 single figure table.
Governa
nceF
inancia
l statem
entsS
trateg
ic report
Phoenix Global Resources plc Annual Report and Accounts 2020 45

Annual remuneration report continued
Phoenix Global Resources plc Annual Report and Accounts 2020 46
Implementation of directors’ remuneration policy for 2021 Directors’ salaries and fees There are currently no executive directors on the board.
In 2020 the non-executive directors accepted a 30% reduction in their fees.
The annual base fees for the non-executive directors at the beginning of the year are detailed below:
Director Base fee
US$
Sir Michael Rake 143,754
John Bentley 64,176
Martin Bachmann 48,132
Tim Harrington 32,088
Nicolás Mallo Huergo 32,088
Daniel Jaeggi –
The committee will carry out a review of the non-executive chairman’s fee early in 2021 and separately, the non-executive chairman and the senior executives will also carry out a review of the non-executive director fees in 2021.
In the current economic environment, the committee will continue to regularly review current salary levels and recommend any adjustments as it considers appropriate to mitigate the impact of the Covid-19 crisis.
Annual bonus and LTIP The committee is reviewing the appropriateness of the Company’s remuneration policy, with the intention of considering recommending a bonus program and awards under the LTIP in 2021.
Remuneration Alignment of remuneration to values and culture The Company has an incentive program that all members of staff participate in. The primary outcome of the program is to provide performance feedback against individual and corporate objectives and determine the level of bonus awarded to each employee for a given year.
An element of individual bonus is set by reference to Company performance against a balanced scorecard that includes corporate goals and targets related to safety, operational and financial performance, as well as qualitative factors aimed at promoting Company values and culture.
Individual’s performance objectives are set and assessed annually and include a mixture of specific goals or target milestones as well as personal and professional development objectives consistent with the Company’s purpose, culture and working practices.
The individual’s objectives are set to align with those of the head of their respective department (operations, finance, HR, etc.) which in turn are set to reflect the overall corporate objectives.
The directors’ remuneration report has been approved by the board and signed on its behalf by:
John Bentley Chairman, remuneration committee 17 May 2021
Where applicable a rate of exchange of US$/£1.2835 has been used for 2020 and a rate of exchange of US$/£1.277 for 2019. Where salaries and fees are denominated in £ changes in annual fees reported in US$, may partly be due to changes in the rate of exchange.
Phoenix Global Resources plc Annual Report and Accounts 202046

Directors’ report
47 Phoenix Global Resources plc Annual Report and Accounts 2020
Group directors’ report for the year ended 31 December 2020 The directors of Phoenix Global Resources plc present their annual report and audited financial statements of the Company and the Group for the year ended 31 December 2020. These will be laid before the shareholders at a general meeting to be held on 30 June 2021.
General information The Company is a public limited company incorporated in England and Wales under the Companies Act 2006 (Registered no. 05083946). The Company operates one overseas branch in Mendoza (Argentina).
Mercuria Energy Group Limited is the ultimate majority shareholder of the Company.
Share capital The Company’s share capital during the year consisted of ordinary shares of £0.10 each (‘ordinary shares’). Each ordinary share carries one vote. On 1 January 2020 there were 2,786,570,787 ordinary shares in issue, excluding 73,922 shares held as treasury shares.
Substantial and significant interests in ordinary shares Based on the last TR-1 notices received, the major shareholders of the Group were as follows:
Name Number of
ordinary shares
As a % of the issued ordinary
shares
Mercuria Energy Group Limited1 2,329,762,468 83.6%
José Luis Manzano and family2 111,446,470 4.0%
1 Mercuria Energy Group Limited holds the above shares in the Company through its subsidiaries Upstream Capital Partners VI Limited (1,924,634,982 shares), Mercuria Asset Holdings (Hong Kong) Limited (340,939,131 shares) and Mercuria Energy Asset Management B.V. (64,188,301 shares)
2 These shares in the Company are held through Vetalir International S.A. (established as a trust, the beneficiaries of which are the family of José Luis Manzano) (79,328,285 shares), Integra Capital USA LLC (12,162,250 shares), Integra Capital S.A.(7,156,625 shares) and directly by José Luis Manzano (12,799,010 shares)
Outstanding warrants to subscribe for ordinary shares At the year-end no warrants to subscribe for ordinary shares were outstanding.
Majority shareholder Mercuria Energy Group Limited is the ultimate majority shareholder of the Group. A relationship agreement is in place between and amongst the Company and certain Mercuria group companies. This relationship agreement restricts shareholder rights with respect to board composition, voting in relation to the appointment or removal of directors and the day to day running of the business by the executive directors. Excluding the chair, more than 50% of the board of directors are independent non-executive directors.
Contracts of significance At 1 January 2019, the Company had in place with Mercuria a ‘new convertible revolving credit facility’ with aggregate value of US$185.0 million. The facility is used to fund the exploration, evaluation and development activities of the Group and for general corporate and working capital purposes. As work progressed during 2019, the amount available under the new convertible rolling credit facility was increased by way of three additional tranches to US$285.0 million. In January 2020, the new convertible rolling credit facility was further extended by an amount of US$6.0 million to an aggregate value of US$291.0 million, with a total of US$281 million drawn down at the year-end. The undrawn balance of US$10 million was made available through a non-convertible bridging facility, which has subsequently been increased to US$31 million, whilst the parties discussed the restructure of all credit facilities.
Significant contracts with related parties are discussed in note 30 to the consolidated financial statements. Further details of the credit facilities and the amount outstanding under these facilities are discussed in note 22 to the consolidated financial statements.
Dividends The directors do not recommend the payment of a dividend for the year (2019: nil).
Directors The directors of the Company who were in office during the year and up to the date of signing the financial statements were:
Name Board role First appointed Resigned
Nicolás Mallo Huergo
Non-executive 2 October 2007
n/a
Javier Alvarez Non-executive (independent)
17 July 2012
30 June 2020
David Jackson Non-executive (independent)
17 July 2012
30 June 2020
Sir Michael Rake Non-executive chairman
19 September 2016
n/a
John Bentley Non-executive (independent)
10 August 2017
n/a
Kevin Dennehy Chief financial officer
1 October 2018
21 May 2020
Daniel Jaeggi Non-executive 14 November 2018
n/a
Tim Harrington Non-executive 14 November 2018
n/a
Martin Bachmann Non-executive (independent)
2 September 2019
n/a
The directors of the Company are re-appointed annually. Accordingly, resolutions to reappoint each of the directors will be proposed at the upcoming AGM.
Governa
nceF
inancia
l statem
entsS
trateg
ic report
Phoenix Global Resources plc Annual Report and Accounts 2020 47

Directors’ report continued
Phoenix Global Resources plc Annual Report and Accounts 2020 48
Directors’ interests in share capital The directors’ interests in the share capital of the Company are shown in the annual report on remuneration on page 45.
Directors’ indemnities As permitted by the articles of association of the Company, the directors have been given the benefit of an indemnity, which is a qualifying third-party indemnity provision as defined in section 234 of the Companies Act 2006. The indemnity was in place throughout the year and also at the date of the approval of the financial statements and continues to be so.
The Company has directors’ and officers' liability insurance in place that provides insurance cover to the directors in the event of a claim or legal action. This insurance was also in place throughout the year and remains in place.
Political and charitable donations No political or charitable donations were made, nor was any political expenditure incurred by any Group company in the year ended 31 December 2020 (year ended 31 December 2019: nil).
Auditors and disclosure of relevant audit information As far as each director is aware, there is no relevant audit information of which the Company’s auditors are unaware. In addition, each director has taken all the steps that ought to have been taken in order to make themselves aware of any relevant audit information and to establish that PwC, the Company’s auditors in the period, is aware of that information.
Following a review of both the independence and the effectiveness of the auditors, and the indication from PricewaterhouseCoopers LLP of its willingness to continue in office, a resolution that PwC be reappointed will be proposed at the annual general meeting.
Corporate governance The Company’s statement on corporate governance can be found in the corporate governance report on pages 25 to 50 of this annual report. The corporate governance report forms part of this directors’ report and is incorporated by reference here.
Annual general meeting The Company’s AGM will be held at the offices of the Company at 6th Floor, King’s House, 10 Haymarket, London SW1Y 4BP on 30 June 2021. Formal notice of the AGM, including details of special business, is set out in the notice of AGM which accompanies this annual report and is available on the Company’s website at www.phoenixglobalresources.com
Going concern The Group principally generates cash from its existing conventional oil and gas production operations. Nevertheless, it was formed with the stated intention of undertaking a significant exploration, evaluation and development program focused on the Group’s unconventional oil and gas assets in Argentina, including the Vaca Muerta formation. To date, the funding required to support the activities of the Group has been provided by Mercuria, the Company’s ultimate majority shareholder.
2020 has been dominated by Covid-19 and its rapid development as a life-threatening global pandemic. Globally, respective governments’ response has been one of containment through lock-down, social distancing restrictions, quarantine and self-isolation for substantially all citizens, whilst countries strive to roll out vaccination programs. This has resulted in a significant adverse impact on industrial and commercial activity, which led to the shut-down of the Company’s production in April 2020. Consequently, the Company took significant steps to reduce its costs in all areas of the business. The directors believe these cost reduction actions mean the Company is in a better position to produce oil economically at lower oil prices with a positive contribution to cash flow at normalised production levels, which will allow the Company to focus on the continued development of its unconventional assets. This situation is compounded by the political and economic uncertainty in Argentina. The country is in its third straight year of recession and whilst it announced at the end of August 2020 that 99% of the holders of the country’s US$65 billion international bonds had agreed to restructure this debt discussions between the Argentine government and the IMF to reschedule US$45 billion of debt are ongoing and the outcome of the 2021 legislative elections in Argentina is uncertain.
Notwithstanding, our major shareholder, Mercuria continues to be supportive of the Company’s plans and continues to extend short-term debt facilities to fund operations. Mercuria has written to the Company stating its intention to continue to provide financial support to the Company in order that it may continue to operate and service its liabilities as they fall due in the next 12 months and also fund the planned work programs. Mercuria has also specifically agreed to not demand repayment of the existing loans (principal and interest) within the next 12 months whilst discussions with the Company to restructure these loans continue. This letter, which by its nature is not legally binding, represents a letter of comfort stating Mercuria’s current intention to continue to provide financial support.
The directors believe they will be able to agree the renegotiation of the existing debt with Mercuria and formalise an agreement for new funding and that the Group and Company can continue as a going concern for the foreseeable future. The application of the going concern basis of preparation of the financial statements included in this annual report is based on the letter that has been received from Mercuria and the ongoing discussion with the Mercuria principals. Accordingly, the directors continue to adopt the going concern basis for accounting in preparing the 2020 financial statements.
However, the directors recognise that if financial support over the next 12 months from Mercuria were not to be available and the Company is unable to restructure the existing loan agreements from Mercuria or obtain funding from alternative sources, this gives rise to a material uncertainty that may cast significant doubt on the Group’s and Company’s ability to continue as a going concern.
Phoenix Global Resources plc Annual Report and Accounts 202048

49 Phoenix Global Resources plc Annual Report and Accounts 2020
Further disclosures Further disclosure requirements as required by the Companies Act 2006, Schedule 7 of the Large and Medium-sized Companies and Groups (Accounts and Reports) Regulations 2008 and the FCA’s Listing Rules and Disclosure and Transparency Rules are found on the following pages of the Company’s annual report and are incorporated into the directors’ report by reference:
Disclosure Page number
Future developments Pages 2 to 3
Stakeholder engagement Pages 23 to 24
Acquisitions and disposals Pages 77 to 82
Anti-slavery disclosure Pages 21 to 22
Corporate governance statement Pages 25 to 50
Gender diversity Pages 21 to 22
Financial risk and financial instruments Pages 89 to 93
Important events subsequent to the year end Page 100
By order of the board
Nigel Duxbury Company Secretary 17 May 2021
Governa
nceF
inancia
l statem
entsS
trateg
ic report
Phoenix Global Resources plc Annual Report and Accounts 2020 49

Statement of directors’ responsibilities
Phoenix Global Resources plc Annual Report and Accounts 2020 50
The directors are responsible for preparing the annual report and the financial statements in accordance with applicable law and regulation.
Company law requires the directors to prepare financial statements for each financial year. Under that law the directors have prepared the Group and Company financial statements in accordance with international accounting standards in conformity with the requirements of the Companies Act 2006.
Under company law, directors must not approve the financial statements unless they are satisfied that they give a true and fair view of the state of affairs of the Group and Company and of the profit or loss of the Group for that period. In preparing the financial statements, the directors are required to:
→ select suitable accounting policies and then apply them consistently;
→ state whether applicable international accounting standards in conformity with the requirements of the Companies Act 2006 have been followed, subject to any material departures disclosed and explained in the financial statements;
→ make judgements and accounting estimates that are reasonable and prudent; and
→ prepare the financial statements on the going concern basis unless it is inappropriate to presume that the Group and Company will continue in business.
The directors are also responsible for safeguarding the assets of the Group and Company and hence for taking reasonable steps for the prevention and detection of fraud and other irregularities.
The directors are responsible for keeping adequate accounting records that are sufficient to show and explain the Group and Company’s transactions and disclose with reasonable accuracy at any time the financial position of the Group and Company and enable them to ensure that the financial statements comply with the Companies Act 2006.
The directors of are responsible for the maintenance and integrity of the of the Company’s website. Legislation in the United Kingdom governing the preparation and dissemination of financial statements may differ from legislation in other jurisdictions.
Directors’ confirmations In the case of each director in office at the date the directors’ report is approved:
→ so far as the director is aware, there is no relevant audit information of which the Group’s and Company’s auditors are unaware; and
→ they have taken all the steps that they ought to have taken as a director in order to make themselves aware of any relevant audit information and to establish that the Group’s and Company’s auditors are aware of that information
Phoenix Global Resources plc Annual Report and Accounts 202050

Independent auditors’ report to the members of Phoenix Global Resources plc
51 Phoenix Global Resources plc Annual Report and Accounts 2020
Report on the audit of the financial statements Opinion In our opinion, Phoenix Global Resources plc’s Group financial statements and Company financial statements (the “financial statements”):
→ give a true and fair view of the state of the Group’s and of the Company’s affairs as at 31 December 2020 and of the Group’s loss and the Group’s and Company’s cash flows for the year then ended;
→ have been properly prepared in accordance with international accounting standards in conformity with the requirements of the Companies Act 2006; and
→ have been prepared in accordance with the requirements of the Companies Act 2006.
We have audited the financial statements, included within the Annual Report and Accounts 2020 (the “Annual Report”), which comprise: the Consolidated and Company Statements of Financial Position as at 31 December 2020; the Consolidated Income Statement and Consolidated Statement of Comprehensive Income, the Consolidated and Company Statements of Cash Flows, and the Consolidated and Company Statements of Changes in Equity for the year then ended; and the notes to the financial statements, which include a description of the significant accounting policies.
Basis for opinion We conducted our audit in accordance with International Standards on Auditing (UK) (“ISAs (UK)”) and applicable law. Our responsibilities under ISAs (UK) are further described in the Auditors’ responsibilities for the audit of the financial statements section of our report. We believe that the audit evidence we have obtained is sufficient and appropriate to provide a basis for our opinion.
Independence We remained independent of the Group in accordance with the ethical requirements that are relevant to our audit of the financial statements in the UK, which includes the FRC’s Ethical Standard, as applicable to listed entities, and we have fulfilled our other ethical responsibilities in accordance with these requirements.
Material uncertainty related to going concern In forming our opinion on the financial statements, which is not modified, we have considered the adequacy of the disclosure made in note 2 to the Group financial statements and note 1 to the Company financial statements concerning the Group’s and the Company’s ability to continue as a going concern.
Oil and gas exploration, evaluation and development activity is capital intensive and requires significant investment in the early stages of the asset lifecycle before yielding production returns and, ultimately, cash from operations. The Directors have already taken significant steps to reduce the cost base of the business and manage its capital structure to ensure the Group will be viable at lower long-term oil prices. A combination of the above risks may require additional measures to be taken such as further cost reductions.
The Group is dependent on the willingness of Mercuria Energy Group Limited (“Mercuria”, who is also the major shareholder of the Company and its primary lender), to continue their support of the Group by providing access to additional financing in future periods to enable the Group to realise its business plan and exploration programme and satisfy the capital expenditure requirements which underpin this.
Mercuria has expressed its current intention to provide financial support, for a period of not less than twelve months from the date of these financial statements to support the business plan for the remainder of 2021 and into 2022. This support is not legally binding. However, the Group has not completed the renegotiation of its current debt repayments to Mercuria, and the funding plan for financial years ending 31 December 2021 and 2022 has not yet been agreed. The ultimate form of this funding could be significantly different to what is currently being discussed with Mercuria. This situation could lead to a lack of future funding for capital and operating expenditures.
If the Company is unable to access sufficient funding from its major shareholder, or from alternative sources, to meet the operational and development capex commitments and requirements, then it may not be able to continue to be a going concern.
The Directors believe that they will be able to complete the renegotiation of the current debt and agree on further funding such that the Group and Company can continue as a going concern for the foreseeable future.
These conditions, along with the other matters explained in those notes to the financial statements, indicate the existence of a material uncertainty which may cast significant doubt about the Group’s and the Company's ability to continue as a going concern. The financial statements do not include the adjustments that would result if the Group and the Company were unable to continue as a going concern.
In auditing the financial statements, we have concluded that the directors’ use of the going concern basis of accounting in the preparation of the financial statements is appropriate.
Governa
nceF
inancia
l statem
entsS
trateg
ic report
Phoenix Global Resources plc Annual Report and Accounts 2020 51

Independent auditors’ report to the members of Phoenix Global Resources plc continued
Phoenix Global Resources plc Annual Report and Accounts 2020 52
Our evaluation of the directors’ assessment of the Group's and the Company’s ability to continue to adopt the going concern basis of accounting included:
→ We obtained management’s cash flow forecast for 2021 and 2022, which supports their use of the going concern basis of accounting for the financial statements. We tested the integrity of the forecast, including mathematical accuracy. The model includes several key assumptions such as sales revenues, operating costs and capital expenditure as well as successful exploration results transforming into production.
→ We held discussions with management and reviewed the key assumptions and have also considered the historical accuracy of management’s forecasting and performed sensitivity testing for reasonable possible changes in the key assumptions.
→ The Company has been provided with a letter of support from Mercuria to provide additional funding as required for a period not less than the 12 months from the date of approval of the financial statements. We read this letter and considered the ability of Mercuria to support the Group from discussions with them and reviewed their financial position. Based on the results of the procedures performed, we are satisfied with their ability to support the Group.
Our responsibilities and the responsibilities of the directors with respect to going concern are described in the relevant sections of this report.
Our audit approach Context In establishing the overall approach to the Group audit, we determined the type of work required to be performed at the statutory reporting unit level by us, as the Group audit team, or through involvement of our component auditors in Argentina. The Group’s assets and operations are located in Argentina. Financial reporting is undertaken in Buenos Aires. Our component audit team in Argentina, under the Group team’s direction and supervision, performed process walkthroughs to understand and evaluate the key financial processes and controls across the Group. Where work was performed by our component auditors in Argentina, we determined the level of involvement required to have in the audit work for the consolidated Group to be able to conclude whether sufficient appropriate audit evidence had been obtained as a basis for our opinion on the Group financial statements as a whole. As part of our year end audit, the Group team’s involvement included conference calls, review of component auditor work papers, attendance at component audit update and key meetings and other forms of communication as considered necessary. We identified four entities which, in our view, required an audit of their complete financial information, either due to their size or risk characteristics. These included the three main operating subsidiaries in Argentina, as well as the parent company in the United Kingdom. The above gave us coverage of 97% over consolidated revenue, 97% of consolidated total assets and 98% of absolute consolidated net assets. This, together with additional procedures performed at the consolidated level, gave us the evidence we needed for our opinion on the Group financial statements as a whole.
Overview Audit scope
→ We conducted a full scope audit at four significant components based on their size and risk characteristics; three operating entities in Argentina and the parent company in London. Our scope enabled us to obtain 97% coverage of consolidated revenue, 97% of consolidated total assets and 98% of absolute consolidated net assets for the Group.
Key audit matters
→ Material uncertainty related to going concern
→ Impairment of long-term assets and goodwill (Group)
→ Impairment of investments (Company)
→ Impact of COVID-19 (Group and Company)
Materiality
→ Overall Group materiality: US$2.3m (2019: US$3.3m) based on 0.5% of Total Assets.
→ Overall Company materiality: US$2.2m (2019: US$2.3m) based on 0.5% of Total Assets but capped at 95% of overall Group materiality.
→ Performance materiality: US$1.7m (Group) and US$1.6m (Company).
The scope of our audit As part of designing our audit, we determined materiality and assessed the risks of material misstatement in the financial statements.
Key audit matters Key audit matters are those matters that, in the auditors’ professional judgement, were of most significance in the audit of the financial statements of the current period and include the most significant assessed risks of material misstatement (whether or not due to fraud) identified by the auditors, including those which had the greatest effect on: the overall audit strategy; the allocation of resources in the audit; and directing the efforts of the engagement team. These matters, and any comments we make on the results of our procedures thereon, were addressed in the context of our audit of the financial statements as a whole, and in forming our opinion thereon, and we do not provide a separate opinion on these matters.
Phoenix Global Resources plc Annual Report and Accounts 202052

53 Phoenix Global Resources plc Annual Report and Accounts 2020
In addition to going concern, described in the Material uncertainty related to going concern section above, we determined the matters described below to be the key audit matters to be communicated in our report. This is not a complete list of all risks identified by our audit.
The key audit matters below are consistent with last year.
Key audit matter How our audit addressed the key audit matter
Impairment of long-term assets and goodwill (Group) Refer to Note 4 (Critical Accounting Estimates and Judgements), Note 5 (Accounting policies) and Notes 13 and 14 of the Group financial statements.
Impairment assessments require significant judgement and there is the risk that the valuation of the assets may be incorrect, and any potential impairment charge or reversal miscalculated. As such, this was a key focus for our audit due to the material nature of the asset balances.
The Group had pre impairment carrying values of property, plant and equipment of US$287 million, exploration and evaluation assets of US$212.1 million and goodwill of US$35.8 million at 31 December 2020 allocated to 15 CGUs. The goodwill was allocated between the Chachahuen, Mata Mora and Corralera cash generating units (“CGUs”) and is required to be tested for impairment on an annual basis. We focused on these CGUs as well as the Puesto Rojas CGU as this was the most affected by drilling results, changes in reserves estimates and the long-term oil prices.
The recoverable amount of the Group’s assets is calculated using fair value less costs of disposal calculations, which are based on future cash flow forecasts for producing CGUs and acreage values for unconventional non-producing CGUs.
New reserve estimates have been obtained for all CGUs and have been used by management as part of their impairment assessment.
Management’s impairment test determined that the recoverable amount of the Chachahuen, Puesto Rojas, La Paloma, El Manzano and other smaller CGUs, including the goodwill, was lower than the carrying value. As a result, a pre-tax impairment charge of US$164.5 million (2019: US$2.5 million) was recognised in the Consolidated Income Statement.
We compared the forecasts used in the impairment model to the latest Board approved budget and management forecasts and compared prior year budget to actual results in order to assess historical estimation uncertainty and factor this into our challenge of current year projections.
For the operating CGUs, we assessed the reasonableness of management’s future forecasts of capital and operating expenses, included in the cash flow forecasts, in light of the historical accuracy of such forecasts and the current operational results.
For non-producing CGUs, we have assessed the expected well economics in the business plan based on drilling results to date as well as comparable transactions on a per acre basis and consider these to be reasonable.
In assessing the valuation of all CGUs, we challenged the key assumptions used by management such as commodity prices, reserves and discount rates.
We obtained management’s internal reserve reports and assessed the competence and objectivity of the internal experts who estimated the reserves by considering factors including professional qualifications and experience. We held discussions with the experts regarding the key judgements and estimates taken during the preparation of the reserve estimates.
We concur with management’s view that there were impairment triggers and that the impairments recorded were supportable.
We evaluated management’s sensitivities disclosed within the accounts in note 14 and have confirmed these are appropriate.
Governa
nceF
inancia
l statem
entsS
trateg
ic report
Phoenix Global Resources plc Annual Report and Accounts 2020 53

Independent auditors’ report to the members of Phoenix Global Resources plc continued
Phoenix Global Resources plc Annual Report and Accounts 2020 54
Impairment of investments (Company) Refer to Note 2 (Critical Accounting Estimates and Judgements), Note 3 (Significant accounting policies) and Note 4 (Investments) of the Company financial statements.
Impairment assessments require significant judgement and there is the risk that the valuation of the assets may be incorrect, and any potential impairment charge or reversal miscalculated. As such, this was a key focus for our audit due to the material nature of the balance.
The total carrying value of investments presented within the Company financial statements as at 31 December 2020 is US$428 million after current year impairment charges of US$477 million at 31 December 2020 (2019: US$169.4 million).
In line with IAS 36, at the reporting date, management assessed whether there was any indication that the investments in subsidiaries may be impaired. Where an impairment trigger was identified, management performed an exercise to determine the recoverable amount of the underlying investments. The recoverable amount of each investment was determined using the assumptions consistent with the Group impairment analysis.
This resulted in an impairment charge of US$477 million across a number of different investments as the fair value of the underlying assets did not support the carrying value of the investment.
We challenged management’s assessment of the carrying value of the investments in the Company and compared each investment to its fair value. We considered this assessment to be consistent with the approach taken for the Group impairment assessment and therefore reasonable.
We obtained management’s impairment of investment in subsidiaries assessment with supporting computations and:
→ Verified that the inputs to the assessment were mathematically accurate and, where appropriate, consistent with the goodwill impairment test set out in the key audit matter above;
→ Recalculated the charge based on consistent assumptions used within the Group’s impairment assessment; and
→ Compared the carrying value of the investment to the recoverable amount and confirmed that the shortfall agrees to the impairment recognised.
Based on our analysis of management’s assessment of the recoverable amount of each investment, we concur that the remaining investments are recoverable. We consider management’s impairment conclusions, the impairment charges recognised and the associated disclosures to be appropriate.
Impact of COVID-19 (Group and Company) Disclosure of the risk to the Group of COVID-19 has been included within the Strategic Report and Note 2 (Basis of Preparation).
The COVID-19 pandemic has had a significant impact on the global economy and the operations of the Group. We considered this an area of focus, with respect to future cash flow projections in the context of impairment assessments, the appropriateness of the going concern basis of preparation and consideration of other key items such as recoverability of accounts receivable and long-term assets. Given the spread of COVID-19, the range of the potential outcomes are both uncertain and difficult to predict.
The directors have considered the impact of the pandemic on the Group’s cash flows, day to day operations, and the carrying amount of long-term assets and goodwill, and receivables, as well as a need to recognise additional liabilities. As part of its going concern assessment, management has performed an assessment of the potential impact on the business. Furthermore, the Directors implemented capital and operational expenditure saving programmes.
Having taken into account these scenarios and a robust assessment of planned and possible mitigating actions, the directors have concluded that the Group remains a going concern, however a material uncertainty exists in relation to the support provided by Mercuria Energy Group Limited and the ability to renegotiate the debt held.
We obtained the assessment of the impact of COVID-19 on the Group’s operations, the recoverability of its long-term assets and goodwill, liabilities and its ability to continue as a going concern.
We undertook the following procedures:
→ We considered the potential impact on the balance sheet, specifically around the valuation of long-term assets and goodwill as well as the recoverability of trade receivables;
→ Indicators of impairment were identified and as a result a significant impairment has being recognised as discussed in the key audit matter ‘Impairment of long-term assets and goodwill’ above;
→ No provisions or additional liabilities were deemed necessary in respect of COVID-19 and as such none have been recorded; and
→ We reviewed the disclosures relating to the impact in the year and the potential impact of COVID-19 and found them to be consistent with the analysis performed.
The procedures that we performed to evaluate management’s going concern assessment and our conclusions are included in the “Conclusions relating to going concern” section below.
Overall, we consider the assessment by management in relation to COVID-19 to be appropriate.
Phoenix Global Resources plc Annual Report and Accounts 202054

55 Phoenix Global Resources plc Annual Report and Accounts 2020
How we tailored the audit scope We tailored the scope of our audit to ensure that we performed enough work to be able to give an opinion on the financial statements as a whole, taking into account the structure of the Group and the Company, the accounting processes and controls, and the industry in which they operate.
In establishing the overall approach to the Group audit, we determined the type of work that needed to be performed by us, as the Group audit team, or by our PwC network component team in Argentina. The Group’s assets and operations are all based in Argentina and all financial reporting is undertaken in Buenos Aires. Where the work was performed by the Argentina component team, we determined the level of involvement we needed to ensure sufficient appropriate audit evidence had been obtained as a basis for our opinion on the Group financial information as a whole. As COVID-19 prevented travel to Argentina, we were unable to make site visits as planned; we instead conducted our oversight of our component team through regular dialogue via conference calls, video conferencing and other forms of communication as considered necessary as well as remote working paper reviews to satisfy ourselves as to the appropriateness of audit work performed by our component team. We also attended key meetings virtually with local management and our component team. We reviewed the audit work of our component team, which included file reviews, participation in key audit discussions with local management and participation in the audit clearance meeting. Further specific audit procedures over the Group consolidation and review procedures over the Annual Report were directly performed by the Group audit team.
Materiality The scope of our audit was influenced by our application of materiality. We set certain quantitative thresholds for materiality. These, together with qualitative considerations, helped us to determine the scope of our audit and the nature, timing and extent of our audit procedures on the individual financial statement line items and disclosures and in evaluating the effect of misstatements, both individually and in aggregate on the financial statements as a whole.
Based on our professional judgement, we determined materiality for the financial statements as a whole as follows:
Financial statements - Group Financial statements - Company
Overall materiality US$2.3m (2019: US$3.3m) US$2.2m (2019: US$2.3m)
How we determined it 0.5% of Total Assets 0.5% of Total Assets but capped at 95% of overall Group materiality
Rationale for benchmark applied
We have concluded that total assets is the most appropriate benchmark, given the size and nature of the current operations and the fact that the Group is largely in an investment stage. In these circumstances a profit-based measure, such as EBIT, would not be an appropriate benchmark to use.
We have assessed that the most appropriate benchmark for the Company, which is primarily a holding Company, is total assets. Materiality has been capped at 95% of overall Group materiality.
For each component in the scope of our Group audit, we allocated a materiality that is less than our overall Group materiality. The range of materiality allocated across components was between US$1.0m and US$2.3m. Certain components were audited to a local statutory audit materiality that was also less than our overall Group materiality.
We use performance materiality to reduce to an appropriately low level the probability that the aggregate of uncorrected and undetected misstatements exceeds overall materiality. Specifically, we use performance materiality in determining the scope of our audit and the nature and extent of our testing of account balances, classes of transactions and disclosures, for example in determining sample sizes. Our performance materiality was 75% of overall materiality, amounting to US$1.7m for the Group financial statements and US$1.6m for the Company financial statements.
In determining the performance materiality, we considered a number of factors - the history of misstatements, risk assessment and aggregation risk and the effectiveness of controls - and concluded that an amount at the upper end of our normal range was appropriate.
We agreed with those charged with governance that we would report to them misstatements identified during our audit above US$115k (Group audit) (2019: US$165k) and US$109k (Company audit) (2019: US$113k) as well as misstatements below those amounts that, in our view, warranted reporting for qualitative reasons.
Governa
nceF
inancia
l statem
entsS
trateg
ic report
Phoenix Global Resources plc Annual Report and Accounts 2020 55

Independent auditors’ report to the members of Phoenix Global Resources plc continued
Phoenix Global Resources plc Annual Report and Accounts 2020 56
Reporting on other information The other information comprises all of the information in the Annual Report other than the financial statements and our auditors’ report thereon. The directors are responsible for the other information. Our opinion on the financial statements does not cover the other information and, accordingly, we do not express an audit opinion or, except to the extent otherwise explicitly stated in this report, any form of assurance thereon.
In connection with our audit of the financial statements, our responsibility is to read the other information and, in doing so, consider whether the other information is materially inconsistent with the financial statements or our knowledge obtained in the audit, or otherwise appears to be materially misstated. If we identify an apparent material inconsistency or material misstatement, we are required to perform procedures to conclude whether there is a material misstatement of the financial statements or a material misstatement of the other information. If, based on the work we have performed, we conclude that there is a material misstatement of this other information, we are required to report that fact. We have nothing to report based on these responsibilities.
With respect to the Strategic report and directors' report, we also considered whether the disclosures required by the UK Companies Act 2006 have been included.
Based on our work undertaken in the course of the audit, the Companies Act 2006 requires us also to report certain opinions and matters as described below.
Strategic report and directors' report In our opinion, based on the work undertaken in the course of the audit, the information given in the Strategic report and directors' report for the year ended 31 December 2020 is consistent with the financial statements and has been prepared in accordance with applicable legal requirements.
In light of the knowledge and understanding of the Group and Company and their environment obtained in the course of the audit, we did not identify any material misstatements in the Strategic report and directors' report.
Responsibilities for the financial statements and the audit Responsibilities of the directors for the financial statements As explained more fully in the Statement of Directors' Responsibilities, the directors are responsible for the preparation of the financial statements in accordance with the applicable framework and for being satisfied that they give a true and fair view. The directors are also responsible for such internal control as they determine is necessary to enable the preparation of financial statements that are free from material misstatement, whether due to fraud or error.
In preparing the financial statements, the directors are responsible for assessing the Group’s and the Company’s ability to continue as a going concern, disclosing, as applicable, matters related to going concern and using the going concern basis of accounting unless the directors either intend to liquidate the Group or the Company or to cease operations, or have no realistic alternative but to do so.
Auditors’ responsibilities for the audit of the financial statements Our objectives are to obtain reasonable assurance about whether the financial statements as a whole are free from material misstatement, whether due to fraud or error, and to issue an auditors’ report that includes our opinion. Reasonable assurance is a high level of assurance, but is not a guarantee that an audit conducted in accordance with ISAs (UK) will always detect a material misstatement when it exists. Misstatements can arise from fraud or error and are considered material if, individually or in the aggregate, they could reasonably be expected to influence the economic decisions of users taken on the basis of these financial statements.
Irregularities, including fraud, are instances of non-compliance with laws and regulations. We design procedures in line with our responsibilities, outlined above, to detect material misstatements in respect of irregularities, including fraud. The extent to which our procedures are capable of detecting irregularities, including fraud, is detailed below.
Based on our understanding of the Group and industry, we identified that the principal risks of non-compliance with laws and regulations related to compliance with UK and Argentine tax legislation, employment law and environmental legislation, and we considered the extent to which non-compliance might have a material effect on the financial statements. We also considered those laws and regulations that have a direct impact on the financial statements such as the Companies Act 2006. We evaluated management’s incentives and opportunities for fraudulent manipulation of the financial statements (including the risk of override of controls), and determined that the principal risks were related to posting inappropriate journal entries and management bias in accounting estimates. The Group engagement team shared this risk assessment with the component auditors so that they could include appropriate audit procedures in response to such risks in their work. Audit procedures performed by the Group engagement team and/or component auditors included:
→ Enquiries of Directors, management and the Group's legal counsel, including consideration of known or suspected instances of non-compliance with laws and regulations and fraud.
→ Challenging assumptions and judgements made by management in relation to the Group’s accounting judgements and estimates including the valuation of exploration and evaluation, development and production assets and reserve estimates.
→ Review of significant and/or unusual transactions during the year. → Identifying and testing journal entries based on our risk assessment.
Phoenix Global Resources plc Annual Report and Accounts 202056

57 Phoenix Global Resources plc Annual Report and Accounts 2020
There are inherent limitations in the audit procedures described above. We are less likely to become aware of instances of non-compliance with laws and regulations that are not closely related to events and transactions reflected in the financial statements. Also, the risk of not detecting a material misstatement due to fraud is higher than the risk of not detecting one resulting from error, as fraud may involve deliberate concealment by, for example, forgery or intentional misrepresentations, or through collusion.
Our audit testing might include testing complete populations of certain transactions and balances, possibly using data auditing techniques. However, it typically involves selecting a limited number of items for testing, rather than testing complete populations. We will often seek to target particular items for testing based on their size or risk characteristics. In other cases, we will use audit sampling to enable us to draw a conclusion about the population from which the sample is selected.
A further description of our responsibilities for the audit of the financial statements is located on the FRC’s website at: www.frc.org.uk/auditorsresponsibilities. This description forms part of our auditors’ report.
Use of this report This report, including the opinions, has been prepared for and only for the Company’s members as a body in accordance with Chapter 3 of Part 16 of the Companies Act 2006 and for no other purpose. We do not, in giving these opinions, accept or assume responsibility for any other purpose or to any other person to whom this report is shown or into whose hands it may come save where expressly agreed by our prior consent in writing.
Other required reporting Companies Act 2006 exception reporting Under the Companies Act 2006 we are required to report to you if, in our opinion:
→ we have not obtained all the information and explanations we require for our audit; or
→ adequate accounting records have not been kept by the Company, or returns adequate for our audit have not been received from branches not visited by us; or
→ certain disclosures of directors’ remuneration specified by law are not made; or
→ the Company financial statements are not in agreement with the accounting records and returns.
We have no exceptions to report arising from this responsibility.
Richard Spilsbury (Senior Statutory Auditor) for and on behalf of PricewaterhouseCoopers LLP Chartered Accountants and Statutory Auditors London 17 May 2021
Governa
nceF
inancia
l statem
entsS
trateg
ic report
Phoenix Global Resources plc Annual Report and Accounts 2020 57

Consolidated Income Statement For the year ended 31 December 2020
58 Phoenix Global Resources plc Annual Report and Accounts 2020
Note 2020
US$’000 2019
US$’000
Revenue 7 54,001 129,417
Cost of sales 8 (81,401) (144,813)
Gross loss (27,400) (15,396)
Selling and distribution expenses (1,958) (5,230)
Exploration expenses 13, 14 (2,746) (4,240)
Loss on termination of licences and other impairment charges 13, 14 (171,129) (27,753)
Loss on sale of non-current assets 15 (6) (28,971)
Administrative expenses 9 (14,892) (27,144)
Other operating income/(expenses) 10 (1,527) (1,417)
Operating loss (219,658) (110,151)
Finance income 16 6,905 1,577
Finance costs 16 (22,276) (26,247)
Loss before taxation (235,029) (134,821)
Taxation 17 38,005 21,011
Loss for the year (197,024) (113,810)
Loss per ordinary share
Basic and diluted loss per share 31 (0.07) (0.04)
The above Consolidated Income Statement should be read in conjunction with the accompanying notes on pages 63 to 100.
Phoenix Global Resources plc Annual Report and Accounts 202058

Consolidated Statement of Comprehensive Income For the year ended 31 December 2020
Phoenix Global Resources plc Annual Report and Accounts 2020 59
2020
US$’000 2019
US$’000
Loss for the year (197,024) (113,810)
Translation differences – –
Total comprehensive loss for the year (197,024) (113,810)
The above items will not be subsequently reclassified to profit and loss. There are no impairment losses on revalued assets recognised directly in equity.
The above Consolidated Statement of Comprehensive Income should be read in conjunction with the accompanying notes on pages 63 to 100.
.
Governa
nceF
inancia
l statem
entsS
trateg
ic report
Phoenix Global Resources plc Annual Report and Accounts 2020 59

Consolidated Statement of Financial Position At 31 December 2020
60 Phoenix Global Resources plc Annual Report and Accounts 2020
Note 2020
US$’000 2019
US$’000
Non-current assets
Property, plant and equipment 13 158,357 324,249
Intangible assets and goodwill 14 211,974 246,540
Other receivables 19 4,124 4,744
Deferred tax assets 26 20,116 18,534
Total non-current assets 394,571 594,067
Current assets
Assets held for sale 13 11,965 18,208
Inventories 27 18,349 18,202
Trade and other receivables 19 25,399 34,527
Cash and cash equivalents 20 5,386 11,002
Total current assets 61,099 81,939
Total assets 455,670 676,006
Non-current liabilities
Trade and other payables 21 299 5,370
Borrowings 22 6,641 146,751
Deferred tax liabilities 26 53,682 87,636
Provisions 28 15,965 15,784
Total non-current liabilities 76,587 255,541
Current liabilities
Liabilities held for sale 13 447 447
Trade and other payables 21 25,909 39,446
Income tax liability 920 870
Borrowings 22 325,592 156,865
Provisions 28 121 120
Total current liabilities 352,989 197,748
Total liabilities 429,576 453,289
Net assets 26,094 222,717
Equity
Share capital and share premium 457,183 456,734
Other reserves (112,150) (112,150)
Retained deficit (318,939) (121,867)
Total equity 26,094 222,717
The above Consolidated Statement of Financial Position should be read in conjunction with the accompanying notes. The financial statements on pages 58 to 100 were approved by the board of directors and authorised for issue on 17 May 2021 and were signed on its behalf by:
Sir Michael Rake Director Company registration number 05083946
Phoenix Global Resources plc Annual Report and Accounts 202060
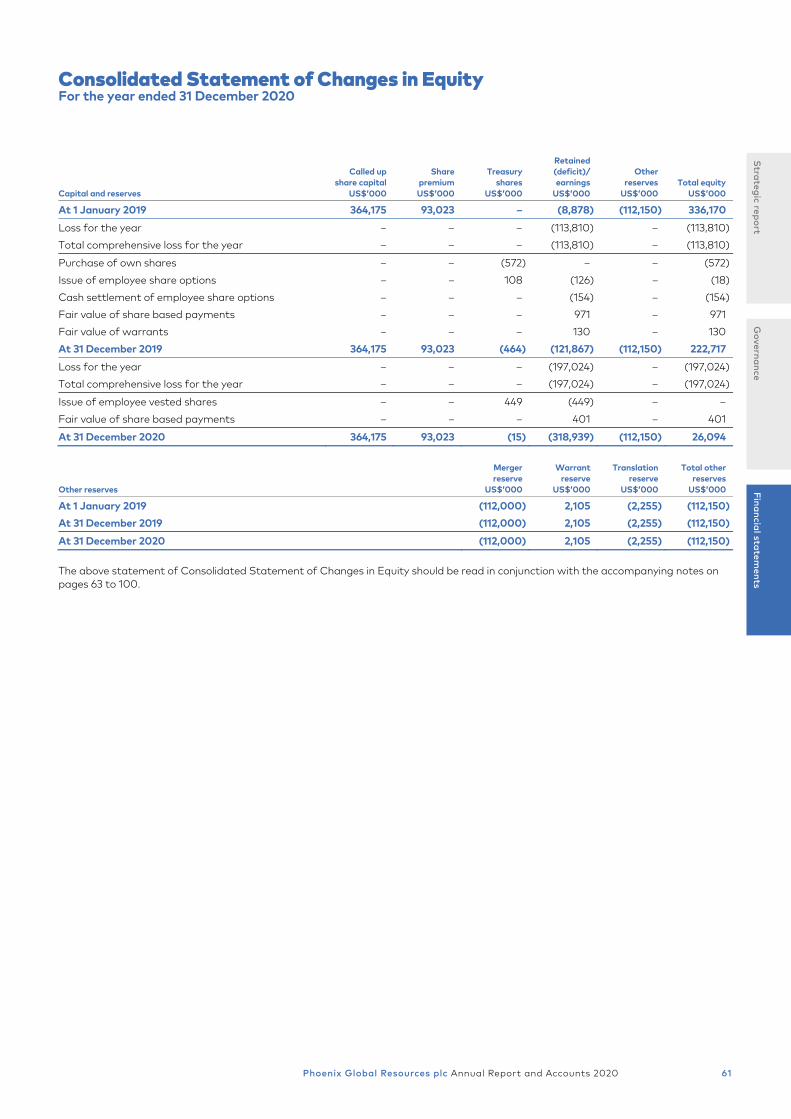
Consolidated Statement of Changes in Equity For the year ended 31 December 2020
Phoenix Global Resources plc Annual Report and Accounts 2020 61
Capital and reserves
Called up share capital
US$’000
Share premium US$’000
Treasury shares
US$’000
Retained (deficit)/ earnings
US$’000
Other reserves
US$’000 Total equity
US$’000
At 1 January 2019 364,175 93,023 – (8,878) (112,150) 336,170
Loss for the year – – – (113,810) – (113,810)
Total comprehensive loss for the year – – – (113,810) – (113,810)
Purchase of own shares – – (572) – – (572)
Issue of employee share options – – 108 (126) – (18)
Cash settlement of employee share options – – – (154) – (154)
Fair value of share based payments – – – 971 – 971
Fair value of warrants – – – 130 – 130
At 31 December 2019 364,175 93,023 (464) (121,867) (112,150) 222,717
Loss for the year – – – (197,024) – (197,024)
Total comprehensive loss for the year – – – (197,024) – (197,024)
Issue of employee vested shares – – 449 (449) – –
Fair value of share based payments – – – 401 – 401
At 31 December 2020 364,175 93,023 (15) (318,939) (112,150) 26,094
Other reserves
Merger reserve
US$’000
Warrant reserve
US$’000
Translation reserve
US$’000
Total other reserves
US$’000
At 1 January 2019 (112,000) 2,105 (2,255) (112,150)
At 31 December 2019 (112,000) 2,105 (2,255) (112,150)
At 31 December 2020 (112,000) 2,105 (2,255) (112,150)
The above statement of Consolidated Statement of Changes in Equity should be read in conjunction with the accompanying notes on pages 63 to 100.
Governa
nceF
inancia
l statem
entsS
trateg
ic report
Phoenix Global Resources plc Annual Report and Accounts 2020 61

Consolidated Statement of Cash Flows For the year ended 31 December 2020
62 Phoenix Global Resources plc Annual Report and Accounts 2020
Note 2020
US$’000 2019
US$’000
Cash flows from operating activities
Cash used in operations 32 (6,318) (16,280)
Income taxes paid (73) (144)
Net cash outflow from operating activities (6,391) (16,424)
Cash flows from investing activities
Payments for property, plant and equipment (4,099) (46,375)
Payments for intangibles (998) (38,852)
Payments for held for sale assets (371) –
Proceeds from sale of non-current assets 15 – 7,563
Net cash outflow from investing activities (5,468) (77,664)
Cash flows from financing activities
Proceeds from borrowings 23 14,260 96,000
Repayment of borrowings 23 (801) (8,000)
Interest paid 23 (709) (1,548)
Principle lease payments 25 (5,327) (1,419)
Net cash inflow from financing activities 7,423 85,033
Net decrease in cash and cash equivalents (4,436) (9,055)
Cash and cash equivalents at the beginning of the year 11,002 21,085
Effects of exchange rates on cash and cash equivalents (1,180) (1,028)
Cash and cash equivalents at end of year 20 5,386 11,002
The above Consolidated Statement of Cash Flows should be read in conjunction with the accompanying notes on pages 63 to 100.
Phoenix Global Resources plc Annual Report and Accounts 202062

Notes to the consolidated financial statements
Phoenix Global Resources plc Annual Report and Accounts 2020 63
1. General information The Company is a Public Limited Company (‘plc’) incorporated in England and Wales and is domiciled in the United Kingdom. The Registered Office address is 6th Floor, King’s House, 10 Haymarket, London SW1Y 4BP. The Company is listed on the AIM market of the London Stock Exchange and maintains a secondary listing on the Buenos Aires Stock Exchange.
The principal activities of the Company and its subsidiaries (together ‘the Group’) are the exploration for and the development and production of oil and gas in Argentina.
2. Basis of preparation These consolidated financial statements have been prepared in accordance with international accounting standards in conformity with the requirements of the Companies Act 2006.
The significant accounting policies applied in preparing these consolidated financial statements are set out below. These policies have been consistently applied throughout the period and to each subsidiary of the Group.
The financial statements have been prepared under the historical cost convention except as where stated.
Going concern The Group generates cash from its existing conventional oil and gas production operations. However, it was formed with the stated intention of undertaking a significant exploration, evaluation and development program focused on the Group’s unconventional oil and gas assets in Argentina, including the Vaca Muerta formation, which requires significant investment. To date, the funding required to support these activities has been provided by Mercuria.
2020 has been dominated by Covid-19 and its rapid development as a life-threatening global pandemic. Globally, respective governments’ response has been one of containment through lock-down, social distancing restrictions, quarantine and self-isolation for substantially all citizens, whilst countries strive to roll out vaccination programs. This has resulted in a significant adverse impact on industrial and commercial activity, which led to the shut-down of the Company’s production in April 2020. Consequently, the Company took significant steps to reduce its costs in all areas of the business. The directors believe these cost reduction actions mean the Company is in a better position to produce oil economically at lower oil prices with a positive contribution to cash flow at normalised production levels, which will allow the Company to focus on the continued development of its unconventional assets. This situation is compounded by the political and economic uncertainty in Argentina. The country is in its third straight year of recession and whilst it announced at the end of August 2020 that 99% of the holders of the country’s US$65 billion international bonds had agreed to restructure this debt discussions between the Argentine government and the IMF to reschedule US$45 billion of debt are ongoing and the outcome of the 2021 legislative elections in Argentina is uncertain.
Notwithstanding, our major shareholder, Mercuria continues to be supportive of the Company’s plans and continues to extend short-term debt facilities to fund operations. Mercuria has written to the Company stating its intention to continue to provide financial support to the Company in order that it may continue to operate and service its liabilities as they fall due in the next 12 months and also fund the planned work programs. Mercuria has also specifically agreed to not demand repayment of the existing loans (principal and interest) within the next 12 months whilst discussions with the Company to restructure these loans continue. This letter, which by its nature is not legally binding, represents a letter of comfort stating Mercuria’s current intention to continue to provide financial support.
The directors believe they will be able to agree the renegotiation of the existing debt with Mercuria and formalise an agreement for new funding and that the Group and Company can continue as a going concern for the foreseeable future. The application of the going concern basis of preparation of the financial statements included in this annual report is based on the letter that has been received from Mercuria and the ongoing discussion with the Mercuria principals. Accordingly, the directors continue to adopt the going concern basis for accounting in preparing the 2020 financial statements.
However, the directors recognise that if financial support over the next 12 months from Mercuria were not to be available and the Company is unable to restructure the existing loan agreements from Mercuria or obtain funding from alternative sources, this gives rise to a material uncertainty that may cast significant doubt on the Group’s and Company’s ability to continue as a going concern.
The financial statements do not include any adjustments that would be required if the Group and Company were unable to continue as a going concern.
Governa
nceF
inancia
l statem
entsS
trateg
ic report
Phoenix Global Resources plc Annual Report and Accounts 2020 63

Notes to the consolidated financial statements continued
64 Phoenix Global Resources plc Annual Report and Accounts 2020
2. Basis of preparation (continued) Foreign currency Presentation currency – the consolidated financial statements are presented in US Dollars rounded to the nearest thousand (US$’000), except where otherwise indicated.
Functional currency – items included in the financial information of the individual companies that comprise the Group are measured using the currency of the primary economic environment in which the entity operates (its functional currency). The primary economic environment is often related to the country of operation or, in some circumstances, it can be determined by other key factors, such as when significant contracts (sales, services, funding, etc.) are denominated in or by reference to a currency. For instance, in the oil and gas industry many sales and service contracts are denominated in or priced by reference to the US Dollar given that the benchmark prices for crude oil (Brent, WTI, etc.) are quoted in US Dollars. There is no concept of a group functional currency and therefore individual entities within a group may have functional currencies that are different to each other.
Foreign currency transactions – transactions in currencies other than an entity’s functional currency (foreign currencies) are translated using the exchange rate on the date of the transaction. Foreign exchange gains and losses resulting from the settlement of such transactions and from the translation at the balance sheet date of monetary assets and liabilities denominated in foreign currencies are recognised in the consolidated statement of comprehensive income within either finance income (gains) or finance costs (losses).
Consolidation The consolidated financial statements include the financial information of Phoenix Global Resources plc as well as its subsidiary undertakings made up to 31 December each year. A list of the Group’s subsidiaries is included on page 107.
Non-controlling interests There is no non-controlling interest at either 31 December 2019 or 2020.
Subsidiaries Subsidiaries are all entities over which the Company has control. The Company controls an entity when it is exposed to, or has rights over, variable returns from its involvement with the entity and has the ability to affect those returns through its ability to exercise control over the entity. Subsidiaries are consolidated in the Group financial statements from the date at which control is transferred to the Company. They are deconsolidated from the date that control ceases.
Joint arrangements Oil and gas operations are often conducted by the Group as co-licencees in unincorporated joint operations with other companies. The Group’s financial statements reflect the relevant proportion of production, assets, liabilities, income and expenses of the joint operation applicable to the Group’s interests. The Group’s current interests in joint operations are detailed in the operating review on pages 6 to 10 and typically represent a percentage-based working interest in the joint operation.
3. Significant accounting policies 3.1 New standards, amendments and interpretations effective and adopted by the Group in 2020 There are no new standards, amendments or interpretations effective and adopted by the Group in 2020.
3.2 New accounting standards issued but not yet effective or adopted by the Group in 2020 There are no new and amended accounting standards and interpretations published that are not mandatory for the year ended 31 December 2020.
Phoenix Global Resources plc Annual Report and Accounts 202064

Phoenix Global Resources plc Annual Report and Accounts 2020 65
4. Critical accounting estimates and judgements The preparation of the financial statements in conformity with generally accepted accounting practice requires management to make estimates and assumptions that affect the reported amounts of assets and liabilities as well as the disclosure of contingent assets and liabilities at the balance sheet date and the reported amounts of revenues and expenses during the reporting period. Actual outcomes could differ from those estimates.
Estimates and judgements are continually evaluated and are based on historical experience and other factors, including expectations of future events that are believed to be reasonable under the circumstances.
4.1 Critical judgements Determination of functional currency The determination of a company’s functional currency can require significant judgement. There is no concept of a group-wide functional currency but rather functional currency is assessed on an entity-by-entity basis by examining the specific circumstances of each entity. A company’s functional currency is defined as the currency of the primary economic environment in which the entity operates. In this regard the default assumption is that a company’s functional currency will be that in which it is registered or that where the majority of its operations are located.
This assumption can be challenged or rebutted where it can be demonstrated that a currency other than that of the country of registration or operations can be shown to have a greater influence over the revenue, costs, assets and liabilities of a company. For instance, in the oil and gas industry contracts for the sale of production and for the provision of operational services are often priced in or by reference to the US Dollar. This is because the main international benchmark prices used for pricing crude cargoes, such as Brent and WTI, are quoted in US Dollars. With industry-wide revenues being heavily influenced by the US Dollar, service contracts, particularly those for services provided by international service companies, are often also priced by reference to the US Dollar.
Care must be taken when examining holding companies and intermediate holding companies to determine if their activity is an extension of that of their holding company or subsidiary or if the company operates independently in its own right.
The assessment of functional currency can be complex and requires the application of a number of criteria and indicators proscribed by IAS 21 ‘The Effects of Changes in Foreign Exchange Rates’. In certain circumstances the evaluation of the criteria in IAS 21 does not result in a clear answer one way or another and hence judgement is applied in determining the functional currency of an entity. The assessment of functional currency can have a significant effect on both the income statement and the statement of financial position of a company and of the group of which it is a member.
The impact of foreign exchange gains and losses on net income, as calculated by reference to the functional currency of each company within the Group, is presented in the statement of comprehensive income as part of finance income and finance costs.
The functional currency of the Company and its subsidiaries in Argentina was determined to be the US Dollar. The functional currency of the Company’s subsidiaries domiciled outside of Argentina is the US Dollar, Euro or Swiss Franc and is assessed based on the main operating cash flows to which the subsidiary is exposed. The Group presents its financial statements in US Dollars.
Determination of joint control Judgement is required to determine when joint control exists over an arrangement or business activity. Such judgement requires the assessment of the relevant activities of the arrangement or of the business activity and when decisions in relation to those activities require unanimous consent. The requirement for unanimous consent means that each participant has an equal say in relation to the activities of the arrangement and, hence, joint control exists.
The Group has determined that the relevant activities for its joint arrangements are those related to the operating and capital decisions of the arrangement. These will include the approval of the annual capital and operating expenditure work program and budget for the joint arrangement. This will also relate to matters such as the approval of chosen service providers for major capital activity as required by the joint operating agreements that govern the joint arrangement. These considerations are similar to those necessary to determine control over subsidiaries.
Classifying an arrangement or business activity requires assessment of the rights and obligations arising from the arrangement and may include:
→ the structure of the joint arrangement, including whether or not a legal entity exists and the terms of a contractual arrangement; → the rights and obligations arising from ownership; → contractual rights and obligations; and → other facts and circumstances on a case-by-case basis.
This assessment often requires significant judgement. A different conclusion about both joint control and whether an arrangement represents a joint venture or a joint operation may materially affect the accounting for a joint arrangement. For instance, the determination of an arrangement as a joint venture or joint operation results in a line-by-line inclusion of the Group’s proportionate interest in the assets, liabilities, revenues and costs of the arrangement. Conversely, where joint control is determined not to exist, the Group’s interest in the net income and net assets of the arrangement are presented in a single line in each of the Consolidated Income Statement and Consolidated Statement of Financial Position.
Governa
nceF
inancia
l statem
entsS
trateg
ic report
Phoenix Global Resources plc Annual Report and Accounts 2020 65

Notes to the consolidated financial statements continued
66 Phoenix Global Resources plc Annual Report and Accounts 2020
4. Critical accounting estimates and judgements (continued) 4.2 Critical estimates Future oil and gas prices The estimation of future oil and gas prices has a significant impact throughout the financial statements. Future prices for oil and gas have a direct impact on the estimation of the recoverable value of property, plant and equipment and intangible assets associated with oil and gas assets.
Details of the oil and gas prices achieved in the years ended 31 December 2020 and 2019 are included in the segment information in note 6.
Estimation of oil and gas reserve volumes Oil and gas reserves are the quantities of oil and gas that management considers are commercially recoverable in the future from known accumulations within the Group’s licence areas and under defined economic and operating conditions.
Commercial viability is assessed by reference to the point at which the cash cost to produce a barrel of oil (or equivalent) is greater than the sales price that can be achieved for that barrel. This point is generally referred to as the ‘economic limit’. No reserves are recorded in respect of the period after which the economic limit is estimated to occur.
The estimation of reserve volumes is inherently imprecise, requires the application of judgement and is subject to future revision. Variations in future sales prices, cost estimates or actual production volumes can cause actual results to differ from the estimates and affect the absolute quantity of estimated commercial reserve volumes from one period to the next. Variations can be positive or negative. Subsurface conditions and other engineering factors can also affect estimated reserve volumes.
Oil and gas reserve volumes are estimated by management together with the in-house reservoir engineer.
The prospective value of oil and gas reserves is not recorded in the statement of financial position. Intangible oil and gas assets and associated property, plant and equipment included in the statement of financial position relate to the cost of acquisition of those properties together with cumulative exploration or development expenditure.
The estimation of reserve volumes primarily influences the depreciation, depletion and amortisation charge for the year. This is included in the analysis of property, plant and equipment in note 13. Reserve volumes are also used to assess fair value in business combinations and in calculating whether an impairment charge should be recorded where an impairment indicator exists.
Provision for asset retirement and decommissioning obligations The Group has an obligation to plug and abandon wells at the end of their productive life. In addition, the Group is required to remove any surface field infrastructure and equipment, and to remediate or re-cultivate land that has been affected by the Group’s activities and return it to its natural state.
A provision is made for such obligations at the time at which the obligation is incurred. This is normally as wells are drilled or infrastructure is put in place. Provisions are based on cost estimates of the remediation activity that will be needed. These estimates require judgement. Inflation is applied to cost estimates and these estimates are then discounted at a rate that reflects the time value of money. The application of both inflation and discount rates represent significant estimates.
Where licence terms do not require the Group to remediate wells on rescission of a licence then no provision is made. This can occur when the relevant Province that issued the licence considers that wells could be remediated or that they may be of geological interest to future licence holders.
Details of provisions held for asset retirement obligations together with movements recognised in the year are included in the analysis of provisions in note 28.
Recognition of deferred tax assets Assumptions about the generation of future taxable profits depend on management’s estimates of cash flows and taxable income. These estimates are primarily based on forecast cash flows from operations (which are impacted by production and sales volumes, oil and gas prices, oil and gas reserves and operating costs), as well as decommissioning estimates, forecast future capital expenditure and the expected capital structure of the Group. The critical estimates applied to management’s cash flow and taxable income estimates are discussed in the section below.
Should future cash flows and/or taxable income differ significantly from these estimates, the ability of the Group to realise the deferred tax assets recorded at the reporting date could be impacted. Management is therefore required to apply significant judgement in assessing the extent to which future taxable profits are included in the assessment of recoverability.
Details of the deferred tax asset together with movements recognised in the year are included in the analysis of deferred tax in note 26.
Impairment The Group assesses capitalised exploration, appraisal, development and production assets and goodwill for impairment where there is an indication that an impairment may exist. This process includes management’s estimates of the key assumptions used in the assessment review as detailed in notes 13 and 14 on pages 77 to 81.
Phoenix Global Resources plc Annual Report and Accounts 202066

Phoenix Global Resources plc Annual Report and Accounts 2020 67
5. Accounting policies 5.1 Revenue Revenue represents the proceeds, excluding VAT and sales taxes, earned from the sale of oil and gas. Revenue from oil and gas sales is calculated by multiplying actual delivery volume by the contracted price of the specific commodity on the day of delivery.
Revenue from contracts with customers is recognised when or as the Group satisfies its performance obligation by transferring control of a promised good or service to a customer. The transfer of control of oil and gas usually coincides with title passing to the customer and the customer taking physical possession. Sales contracts usually define a specific delivery point where physical custody is transferred and title passes. This is typically at the point at which the product passes into the customer’s pipeline, truck or refinery. There is therefore a single performance obligation being physical delivery at a specified point.
Revenue is recognised to the extent that it is probable that sales proceeds will be received and the revenue can be reliably measured. Contracts for the sale of oil and gas are typically priced by reference to quoted benchmark prices.
5.2 Finance costs and income Finance income comprises interest income on cash invested, foreign currency gains and the unwind of discount on any assets held at amortised cost. Interest income is recognised as it accrues using the effective interest rate method.
Finance cost comprises interest expense on borrowings, foreign currency losses and the unwind of discount on any liabilities held at amortised cost, which is principally the unwind of the discount related to the asset retirement obligation.
Borrowing costs Borrowing costs that are directly attributable to the acquisition or construction of a qualifying asset are capitalised as a part of that asset. This reduces the finance charge in the income statement and results in a corresponding increase to the asset cost. Capitalisation of borrowing costs stops when the asset is substantially ready for its intended use. The time at which an asset is substantially ready for its intended use may be earlier than the time at which it is actually put into use.
5.3 Employee benefits Short-term benefits Benefits given to employees that are short-term in nature are recognised as expenses in the statement of comprehensive income as the related service is provided. The principal short-term benefits are salaries, associated holiday pay and other periodic benefits such as healthcare and pension contributions made by the Company for the benefit of the employee. A liability is recognised for the amount expected to be paid under short-term cash bonus plans if there is either a present legal or constructive obligation to pay the amount and the amount can be reliably estimated.
Share-based payments The Group operates a number of equity-settled share-based compensation plans, under which the entity receives services from employees as consideration for equity instruments, deferred share awards or options to subscribe for ordinary shares of the Company. The fair value of the employee services received in exchange for the grant of the equity instruments, shares or options is recognised as an expense. The total amount to be expensed is determined by reference to the fair value of the options granted:
→ including any market performance conditions (for example, an entity’s share price); → excluding the impact of any service and non-market performance vesting conditions (for example, profitability, sales growth targets
and remaining an employee of the entity over a specified time period); and → including the impact of any non-vesting conditions (for example, the requirement for employees to save).
Non-market performance and service conditions are included in assumptions about the number of options that are expected to vest. The total expense is recognised over the vesting period, which is the period over which all of the specified vesting conditions are to be satisfied.
In some circumstances employees may provide services in advance of the grant date and therefore the grant date fair value is estimated for the purposes of recognising the expense during the period between service commencement and the grant date.
At the end of each reporting period, the Group revises its estimates of the number of options that are expected to vest based on the non-market vesting conditions. It recognises the impact of the revision to original estimates, if any, in the income statement, with a corresponding adjustment to equity.
The grant by the Company of equity instruments to the employees of subsidiary undertakings in the Group is treated as an intercompany transaction. The fair value of employee services received, measured by reference to the grant date fair value, is recognised over the vesting period as an intercompany loan, with a corresponding credit to equity in the parent entity financial statements.
Any social security contributions payable in connection with the grant of the share options is considered an integral part of the grant itself, and the charge will be treated as a cash-settled transaction.
Governa
nceF
inancia
l statem
entsS
trateg
ic report
Phoenix Global Resources plc Annual Report and Accounts 2020 67

Notes to the consolidated financial statements continued
68 Phoenix Global Resources plc Annual Report and Accounts 2020
5. Accounting policies (continued) 5.4 Taxes The total tax charge or credit recognised in the statement of comprehensive income is made up of both current and deferred taxes.
The current tax charge or credit is based on the taxable profit or loss for the year. Taxable profit or loss is different to the profit or loss reported in the statement of comprehensive income because it excludes items of income or expense that are taxable or deductible in other years and it further excludes items that are neither taxable nor deductible.
Deferred tax is the tax that is expected to be payable or recoverable on differences between the carrying value of assets and liabilities in the financial statements and the corresponding tax amounts for those assets and liabilities used to calculate taxable profit or loss.
Deferred tax assets are recognised for deductible temporary differences that exist only where it is probable that taxable profits will be generated against which the carrying value of the deferred tax asset can be recovered. Deductible temporary differences exist where there is a difference in the timing of the recognition of an item of income or expense between the income statement and the calculation of taxable profit or loss.
Deferred tax assets and liabilities are recognised using the liability method, for all taxable temporary differences except in respect of taxable temporary differences associated with investments in subsidiaries, associates and interests in joint operations. Deferred tax liabilities are not recorded for these items where the timing of the reversal of the temporary difference can be controlled and it is probable that the temporary difference will not reverse in the foreseeable future.
A deferred tax asset or liability is not recognised if a temporary difference arises on initial recognition of an asset or liability in a transaction that is not a business combination and, at the time of the transaction, affects neither the accounting profit nor taxable profit or loss.
Current and deferred tax is calculated using tax rates and laws that have been enacted or substantively enacted at the balance sheet date.
5.5 Intangible assets – goodwill The Group allocates the fair value of the purchase consideration on the acquisition of a subsidiary to the assets acquired and liabilities assumed based on an assessment of fair value at the acquisition date. Any excess of the purchase consideration (the ‘cost’ of the acquisition) over the fair value of those assets and liabilities is recognised as goodwill. Where goodwill is recognised, it is allocated to cash generating units (‘CGU’) in a systematic manner reflective of how the Group expects to recover the value of the goodwill and how it will be monitored. The Group’s policy is to monitor goodwill at an operating segment level before combining segments for reporting.
Any goodwill arising is recognised as an asset and is subject to annual review for impairment. Goodwill is written off or impaired where circumstances indicate that the recoverable amount of the underlying CGU including the asset may no longer support the carrying value of the goodwill. Any such impairment is recognised in the income statement for the period. Impairment losses related to goodwill are permanent and cannot be reversed in future periods.
5.6 Exploration and appraisal assets Capitalisation The Group follows an accounting policy for exploration and appraisal assets that is based on the successful-efforts accounting method.
Costs incurred prior to obtaining the legal right to explore an area are expensed as incurred in the income statement. This includes all costs that pre-date the award of a licence.
Expenditure incurred on the acquisition of a licence interest is initially capitalised on a licence-by-licence basis. Costs are held within intangible assets and are not depreciated until the exploration phase on the licence area is complete or commercial reserves have been discovered. Exploration and evaluation costs may include the costs of initial licence acquisition; geological and geophysical studies (such as seismic studies); and direct labour, equipment and service costs associated with drilling exploratory wells. Costs incurred are capitalised by well, field or exploration area based on the nature of the cost. Where the results of exploration drilling do not indicate that hydrocarbon reserves exist or indicate the presence of hydrocarbons which are ultimately not considered commercially viable, all related costs are written off to the income statement as exploration cost.
On conclusion of a successful evaluation phase where commercial reserves have been established, the associated exploration and evaluation costs are tested for impairment and their carrying value adjusted if necessary. The exploration and evaluation costs are then transferred to the property, plant and equipment category ‘development and production assets’ and are held within a single field cost centre.
Phoenix Global Resources plc Annual Report and Accounts 202068

Phoenix Global Resources plc Annual Report and Accounts 2020 69
5. Accounting policies (continued) 5.6 Exploration and appraisal assets (continued) Impairment Capitalised exploration and evaluation costs are reviewed regularly for indicators of impairment and are tested for impairment where these indicators exist. Indicators of impairment for exploration and appraisal assets may include:
→ exploration drilling that has not resulted in the discovery of commercial volumes of hydrocarbons; → changes in oil and gas prices or other market conditions that indicate the discoveries may not be commercial; → the anticipated cost of development indicates that it is unlikely the carrying value of the exploration and evaluation asset will be
recovered in full; → there are no plans to conduct further exploration activities in the area; or → the exploration licence period has expired or is due to expire.
Where an indicator of impairment has been identified, the intangible exploration and evaluation asset is allocated to its CGU and the recoverable amount of the CGU is determined. The recoverable amount of the CGU is based on the higher of its fair value less costs of disposal or value in use. Value in use is calculated by reference to the expected future cash flows from the CGU after discounting to take account of the time value of money. Fair value less costs to sell can be based on a similar cash flow measure adjusted for disposal costs or can be estimated by reference to similar comparable reference transactions.
The key assumptions in assessing cash flows are the sensitivity to market fluctuations, such as commodity prices, and the success of future exploration drilling programs. The most likely factor that will result in a material change to the recoverable amount of the CGU is the result of future exploration drilling, which will ultimately determine the licence area’s future economic potential.
5.7 Property, plant and equipment – development and production assets Capitalisation The costs associated with determining the existence of commercial reserves are capitalised in accordance with the preceding policy and transferred to property, plant and equipment as development assets following impairment testing.
All costs incurred after the technical feasibility and commercial viability of producing hydrocarbons have been demonstrated are capitalised within development assets on a field-by-field basis. Subsequent expenditure is only capitalised where it either enhances the economic benefits of the development asset or replaces part of the existing development asset (where the remaining cost of the original part is expensed through the income statement).
Costs of borrowing related to the ongoing construction of development and production assets and facilities are capitalised during the construction phase. Capitalisation of interest ceases once an asset is ready for production.
Depreciation Capitalised oil and gas assets are not subject to depreciation until commercial production starts. Depreciation is calculated on a unit-of-production basis in order to write off the cost of an asset as the reserves that it represents are produced and sold. Any periodic reassessment of reserves will affect the depreciation rate on a prospective basis.
The unit-of-production depreciation rate is calculated on a field-by-field basis using proved, developed reserves as the denominator and capitalised costs as the numerator. The numerator includes an estimate of the costs expected to be incurred to bring proved, developed, not-producing reserves into production.
Infrastructure that is common to a number of fields, such as gathering systems, treatment plants and pipelines, is depreciated on a unit-of-production basis using an aggregate measure of reserves or on a straight-line basis depending on the expected pattern of use of the underlying asset.
Governa
nceF
inancia
l statem
entsS
trateg
ic report
Phoenix Global Resources plc Annual Report and Accounts 2020 69
Notes to the consolidated financial statements continued
70 Phoenix Global Resources plc Annual Report and Accounts 2020
5. Accounting policies (continued) 5.7 Property, plant and equipment – development and production assets (continued) Impairment The Group assesses development and production assets for impairment where there is an indication that an impairment may exist. Indicators of impairment may include:
→ a significant fall in realised prices for oil and gas; → a significant downward movement in the forward curve for quoted oil price benchmarks such as Brent or WTI; → an increase in cash operating costs; → a significant downward revision to the estimated reserve volumes or values; → an increase in rates calculated for depreciation, depletion and amortisation (‘DD&A’); or → unforeseen engineering subsurface problems that cannot be overcome satisfactorily.
An impairment review of development and production assets is undertaken on a CGU basis and involves comparing the carrying value of an asset with its recoverable amount. The CGU is typically applied at the field or licence level, unless a number of field interests are determined to be interdependent. The recoverable amount of an asset is determined as the higher of its fair value less costs to sell and its value in use. Value in use is determined by reference to expected future net cash flows. Any impairment loss identified is recorded in the income statement.
The calculation of value in use is most sensitive to the following assumptions:
→ production volumes and estimates of recoverable reserves; → quoted commodity benchmark prices and realised sales prices; → the level of fixed and/or variable operating costs; → estimates of capital expenditure required to develop assets; and → discount and inflation rates applied.
5.8 Decommissioning The discounted cost of expected decommissioning activity is recorded when an obligation to rectify the environmental impact of the Group’s oil and gas activity exists. The obligation can arise from contractual licence arrangements, the laws and regulations of the country or Province of operation or be constructive based on established practice.
The amount that is recognised as a provision for decommissioning activities is the present value of the estimated future remediation expenditure that is determined by reference to the nature of the asset, the Group’s operational policy in regard to decommissioning, local conditions and associated regulatory requirements. A corresponding decommissioning asset is recorded within property, plant and equipment at the same discounted value as the provision.
The costs recognised in the income statement in each period comprise two elements:
→ depreciation of the decommissioning asset calculated on a unit-of-production basis consistent with the underlying asset to which it relates, recorded in operating expenses; and
→ the unwind of the discount on the decommissioning provision that is recorded as a finance cost as time passes.
Any change in the present value of the estimated future decommissioning expenditure is reflected as an adjustment to the decommissioning provision and related decommissioning asset.
5.9 Other assets Other assets are capitalised on the basis of purchase price or construction cost. Depreciation on other elements of property, plant and equipment is charged on a straight-line basis at the following rates that reflect the expected useful life of each asset category:
→ Property 10% to 20% → Fixtures and fittings 20% to 33% → Vehicles 20% → Other equipment 20% to 33%
Phoenix Global Resources plc Annual Report and Accounts 202070

Phoenix Global Resources plc Annual Report and Accounts 2020 71
5. Accounting policies (continued) 5.10 Non-current assets held for sale Non-current assets or disposal groups classified as held for sale are measured at the lower of their net book value and fair value less costs to sell. Non-current assets and disposal groups are classified as held for sale if their carrying amount will be recovered through a sale transaction rather than through continuing use.
This condition is regarded as met only when the sale is highly probable and the asset or disposal group is available for immediate sale in its present condition. Management views the trigger for recognition either as signature of a sales and purchase agreement or board approval. Management must be committed to the sale which should be expected to qualify for recognition as a completed sale within one year from the date of classification. Assets classified as held for sale and the corresponding liabilities are classified in current assets and liabilities on a separate line in the balance sheet.
5.11 Business combinations and goodwill Acquired businesses are included in the financial statements from the transaction date which is defined as the date at which the Company achieves control over the assets being acquired and liabilities assumed.
The cost of an acquisition is calculated as the fair value of the consideration given including equity instruments given, contingent or deferred elements of consideration and any liabilities assumed in connection with the transfer of control.
The cost of an acquisition is allocated to the identifiable assets acquired and liabilities assumed on the basis of their relative fair values at the acquisition date. The fair value assessment will include certain assumptions, such as assessment of discount rates, taxation rules, and both the amount and the timing of expected future cash flows from assets and liabilities. In addition, the selection of specific valuation methods for individual assets and liabilities requires judgement. The specific valuation methods applied will be driven by the nature of the asset or liability being assessed.
If the acquisition cost at the time of the acquisition exceeds the fair value of the net assets acquired, goodwill is recognised. Conversely, if the fair value of the net assets acquired exceeds the consideration given, the difference is recognised as gain in the income statement on the acquisition date.
Goodwill may also be recognised as a result of the application of deferred tax accounting to the fair values of assets acquired. The fair value allocation process often results in an increase to the carrying value of depreciable assets. Given that the tax deductible value of such assets does not change, the difference between the book value and the tax value of the asset increases, which results in an additional deferred tax liability. The increased deferred tax liability is recorded in purchase accounting with a corresponding entry to goodwill.
Goodwill is allocated to the CGUs or groups of CGUs that are expected to benefit from the business combination and is subject to annual impairment testing.
5.12 Inventories The Group’s stocks of crude oil on hand that result from its production operations are carried at the lower of cost and net realisable value. Cost is calculated as the per-unit production cost for each barrel of oil held in inventory. Net realisable value is measured by reference to the market price for crude oil prevailing in Argentina plus or minus applicable quality and location premium or discount.
Operational inventory and spare parts are carried at the lower of cost or net realisable value where cost represents the weighted average unit cost for inventory items on a line-by-line basis.
5.13 Investments and other financial assets Classification Financial assets are initially recognised at fair value, usually being the transaction price. In the case of financial assets not at fair value through profit or loss, directly attributable transaction costs are also included. The subsequent measurement of financial assets depends on their classification. The Group classifies its financial assets in the following categories:
→ financial assets measured at amortised cost; → financial assets measured at fair value through other comprehensive income (‘OCI’); and → financial assets measured at fair value through profit or loss (‘FV-P&L’).
The classification depends on the purpose for which the investments were acquired. Management determines the classification of its investments at initial recognition and, in the case of assets classified as held to maturity, re-evaluates this designation at the end of each reporting period.
Governa
nceF
inancia
l statem
entsS
trateg
ic report
Phoenix Global Resources plc Annual Report and Accounts 2020 71

Notes to the consolidated financial statements continued
72 Phoenix Global Resources plc Annual Report and Accounts 2020
5. Accounting policies (continued) 5.13 Investments and other financial assets (continued) Recognition and derecognition Regular-way purchases and sales of financial assets are recognised on the trade date, being the date on which the Group commits to purchase or sell the asset. Financial assets are derecognised when the rights to receive cash flows from the financial assets have expired or have been transferred and the Group has transferred substantially all the risks and rewards of ownership.
Measurement Financial assets measured at amortised cost Financial assets are classified and measured at amortised cost when the objective of the asset is to collect contractual cash flows and the contractual cash flows represent solely payments of principal and interest. Such assets are carried at amortised cost using the effective interest method if the time value of money is significant. Gains and losses are recognised in profit or loss when the assets are derecognised or impaired and when interest is recognised using the effective interest method. This category of financial assets includes trade and other receivables.
Financial assets measured at fair value through other comprehensive income Financial assets are classified and measured at fair value through OCI when the objective of holding the asset is both to collect contractual cash flows and sell the financial assets, and the contractual cash flows represent solely payments of principal and interest. The Group does not have any financial assets classified in this category.
Financial assets measured at fair value through profit or loss Financial assets are classified and measured at fair value through P&L when the asset does not meet the criteria to be measured at amortised cost or fair value through other comprehensive income. Such assets are carried on the balance sheet at fair value with gains or losses recognised in the income statement. Derivatives, other than those designated as effective hedging instruments, and equity instruments are included in this category.
Interest income from financial assets held at fair value through profit or loss is included in net operating gains/(losses). Interest on assets held at amortised cost is calculated using the effective interest method and is recognised in the statement of profit or loss in finance gains/(losses).
Impairment – general Credit risk arises from the Group’s financial assets which are carried at amortised cost, at fair value through OCI and at fair value through P&L, including cash and cash equivalents and outstanding receivables with oil and gas customers. The Group assesses at the end of each reporting period whether there is objective evidence that a financial asset or group of financial assets is impaired based on the credit loss model set out in IFRS 9.
Impairment – assets carried at amortised cost For loans and receivables, the Group applies the IFRS 9 simplified approach to measuring expected credit losses that uses a lifetime expected loss allowance. The expected loss rates are based on the payment profiles of sales over a period of 36 months prior to the reporting date. These historical loss rates are adjusted to reflect current and forward-looking information on macroeconomic factors affecting the ability of customers to settle the receivables as they fall due.
Loans and receivables are written off where there is no reasonable expectation of recovery. Indicators that there is no reasonable expectation of recovery include, amongst others, the failure of a debtor to engage in a repayment plan with the Group, and a failure to make contractual payments for a period of greater than 120 days past due. Impairment losses are presented as net impairment losses within operating profit/(loss). Subsequent recoveries of amounts previously written off are credited against the same line item.
Impairment – other short-term investments All of the Group’s other short-term investments are considered to have low credit risk, and the loss allowance recognised during the period is therefore limited to 12 months’ expected losses. Any loss allowance determined for the period is recognised in profit or loss and reduces the fair value loss otherwise recognised in OCI.
Phoenix Global Resources plc Annual Report and Accounts 202072

Phoenix Global Resources plc Annual Report and Accounts 2020 73
5. Accounting policies (continued) 5.14 Trade and other receivables Trade receivables and other receivables are initially recognised at fair value and subsequently measured at amortised cost using the effective interest rate method less provision for impairment. The Group applies the IFRS 9 simplified approach to measuring expected credit losses to calculate impairment, which uses a lifetime expected loss allowance based on a 36 month assessment period. Any resulting impairment loss is recognised immediately in the income statement.
Trade and other receivables are classified as current assets if receipt is due within one year or less. If not, they are presented as non-current assets.
5.15 Cash and cash equivalents Cash and cash equivalents include cash on hand, deposits held with financial institutions that can be called on demand together with other short-term, highly liquid investments with original maturities of three months or less that are readily convertible into known amounts of cash. Cash equivalents also include restricted amounts pledged as securities for work commitments. Cash equivalents are classified as financial assets measured at amortised cost or fair value through profit or loss.
5.16 Trade and other payables Trade and other payables are initially recognised at fair value and are subsequently measured at amortised cost using the effective interest rate method. Trade and other payables are obligations to pay for goods or services that have been acquired in the ordinary course of business from suppliers. Trade payables are classified as current liabilities if payment is due within one year or less. If not, they are presented as non-current liabilities.
Accruals are recognised in respect of goods or services delivered but not yet invoiced.
5.17 Provisions Provision is made for asset retirement obligations and legal claims when the Group has a present legal or constructive obligation as a result of past events, it is probable that an outflow of resources will be required to settle the obligation and the amount can be reliably estimated.
Provisions are measured at the present value of the expenditures expected to be incurred in settling the obligation using a pre-tax discount rate that reflects current market assessments of the time value of money and the risks specific to the obligation. The increase in the provision as the discount unwinds due to the passage of time is recognised in the income statement as interest expense.
5.18 Leases On inception of a contract the Group assesses whether it contains a lease. The contract is, or contains, a lease if it conveys the right to control the use of an identified asset for a period of time in exchange for consideration. The right to control the use of an identified asset is determined based on whether the Group has the right to obtain all of the economic benefits from the use of the asset throughout the period of use, and if the Group has the right to direct the use of the asset.
Lease obligations are recognised as a liability with a corresponding right-of-use asset at the commencement date.
The lease liability is initially measured at the present value of the lease payments that are not paid at the lease commencement date, discounted using the interest rate implicit in the lease or, if that rate cannot be readily determined, the Group’s incremental borrowing rate.
The corresponding right-of-use asset is initially measured at cost, which comprises the initial amount of the lease liability plus any lease payments made at or before the commencement date, any initial direct costs incurred and an estimate of costs required to remove or restore the underlying asset, less any lease incentives received. The right-of-use asset is depreciated over the shorter of the asset’s useful life and the lease term on a straight-line basis.
The lease liability is subsequently measured at amortised cost using the effective interest method. It is remeasured when there is a change in future lease payments arising from a change in an index or rate, if there is a change in the Group’s estimate of the amount expected to be payable under a residual value guarantee or if the Group changes its assessment of whether it will exercise a purchase, extension or termination option. When the lease liability is remeasured in this way, a corresponding adjustment is made to the carrying amount of the right-of-use asset or is recorded in profit or loss if the carrying amount of the right-of-use asset has been reduced to zero.
The Group has elected not to recognise right-of-use assets and lease liabilities for short-term leases that have a lease term of 12 months or less, those leases with a remaining lease term of less than 12 months as at 1 January 2020 and leases of low-value assets with an annual cost of US$5,000 or less. The Group recognises the lease payments associated with these leases as an expense on a straight-line basis over the lease term.
Governa
nceF
inancia
l statem
entsS
trateg
ic report
Phoenix Global Resources plc Annual Report and Accounts 2020 73

Notes to the consolidated financial statements continued
74 Phoenix Global Resources plc Annual Report and Accounts 2020
6. Segment information The Group’s executive management team comprising the chief executive officer and the chief financial officer has been determined collectively as the chief operating decision maker for the Group. The information reported to the Group’s executive management team for the purposes of resource allocation and assessment of segment performance is split between those assets which are operated by the Group and those which are not.
The strategy of the Group is focused on the development of its unconventional operated assets in the Vaca Muerta and other unconventional opportunities in Argentina, while optimising its operated conventional production assets. The Group also participates in joint arrangements as a non-operated partner. Operated and non-operated assets of the Group have therefore been determined to represent the reportable segments of the business. The third segment ‘corporate’, primarily relates to administrative costs, financing costs and taxation incurred in running the business which are not directly attributable to one of the identified segments.
The Group’s executive management primarily uses a measure of earnings before interest, tax, depreciation, loss on termination of licences and other impairment charge and loss on sale of non-current assets (‘EBITDA’) to assess the performance of the operating segments. However, the executive management team also receives information about segment revenue and capital expenditure on a monthly basis.
2020 Operated US$’000
Non-operated US$’000
Corporate US$’000
Total US$’000
Revenue 24,132 29,869 – 54,001
(Loss)/profit for the year (155,759) (49,054) 7,789 (197,024)
Add: Depreciation, depletion and amortisation 27,569 12,149 1,628 41,346
Less: Finance income – – (6,905) (6,905)
Add: Finance costs 458 306 21,512 22,276
Less: Taxation – – (38,005) (38,005)
EBITDA (127,732) (36,599) (13,981) (178,312)
Non-recurring expenses:
Add: Loss on termination of licences and other impairment charge 127,501 43,628 – 171,129
Add: Loss on sale of non-current assets 6 – – 6
Adjusted EBITDA (225) 7,029 (13,981) (7,177)
Oil revenues 24,130 28,029 – 52,159
bbls sold 605,476 776,435 – 1,381,911
Realised price (US$/bbl) 39.85 36,10 – 37.74
Gas revenues 2 1,840 – 1,842
MMcf sold 0.90 928.63 – 929.53
Realised price (US$/MMcf) 2.22 1.98 – 1.98
Capital expenditure
Property, plant and equipment 2,627 1,475 98 4,200
Intangible exploration and evaluation assets 2,934 1,015 – 3,949
Total capital expenditure 5,561 2,490 98 8,149
Total assets 315,784 60,281 79,605 455,670
Total liabilities (7,010) (10,885) (411,681) (429,576)
Phoenix Global Resources plc Annual Report and Accounts 202074

Phoenix Global Resources plc Annual Report and Accounts 2020 75
6. Segment information (continued) 2019
Operated US$’000
Non-operated US$’000
Corporate US$’000
Total US$’000
Revenue 49,355 80,062 – 129,417
Loss for the year (32,952) (50,611) (30,247) (113,810)
Add: Depreciation, depletion and amortisation 32,470 31,954 1,633 66,057
Less: Finance income – – (1,577) (1,577)
Add: Finance costs 381 465 25,401 26,247
Add: Taxation – – (21,011) (21,011)
EBITDA (101) (18,192) (25,801) (44,094)
Non-recurring expenses:
Add: Loss on termination of licences and other impairment charge 11,938 15,815 – 27,753
Add: Loss on sale of non-current assets – 29,041 (70) 28,971
Adjusted EBITDA* 11,837 26,664 (25,871) 12,630
Oil revenues 49,341 65,311 – 114,652
bbls sold 1,050,157 1,340,561 – 2,390,718
Realised price (US$/bbl) 46.98 48.72 – 47.96
Gas revenues 14 14,751 – 14,765
MMcf sold 5.43 4,448.47 – 4,453.90
Realised price (US$/MMcf) 2.58 3.32 – 3.32
Capital expenditure
Property, plant and equipment 34,630 19,015 3,774 57,419
Intangible exploration and evaluation assets 36,915 2,139 – 39,054
Total capital expenditure 71,545 21,154 3,774 96,473
Total assets 482,453 115,547 78,006 676,006
Total liabilities (6,774) (7,786) (438,729) (453,289)
* Reclassified on basis consistent with 2020 disclosure
There are no intersegment revenues in either year presented. The significant majority of oil and gas sales are made to the Argentina state-owned oil company, YPF.
7. Revenue
2020
US$’000 2019
US$’000
Crude oil revenue 52,159 114,652
Gas revenue 1,842 14,765
Total revenue 54,001 129,417
The Group makes all sales to external customers located mainly within Argentina. Substantially all of its oil production is sold to the Argentina state-owned oil company, YPF. Approximately 49% of gas production (2019: 70%) was sold to three separate external customers in the year.
Governa
nceF
inancia
l statem
entsS
trateg
ic report
Phoenix Global Resources plc Annual Report and Accounts 2020 75

Notes to the consolidated financial statements continued
76 Phoenix Global Resources plc Annual Report and Accounts 2020
8. Cost of sales
2020
US$’000 2019
US$’000
Production costs 39,404 78,960
Depreciation of oil and gas assets 41,346 66,057
Movements in crude inventory 651 (204)
Total cost of sales 81,401 144,813
9. Administrative expenses
2020
US$’000 2019
US$’000
Staff costs 8,321 14,722
Professional fees 2,713 5,265
Other general and administrative expenses 3,858 7,157
Total administrative expenses 14,892 27,144
10. Other operating income and expenses
2020
US$’000 2019
US$’000
Income
Staff seconded to joint operations 371 780
Reversed provisions – 572
Other income 17 –
Expense
Fair value of investments (823) –
Argentine bank transaction taxes (992) (2,285)
Other expenses (100) (484)
Total other operating income or expense (1,527) (1,417)
11. Auditors’ remuneration
2020
US$’000 2019
US$’000
Fees payable to the Company’s auditors and its associates for the audit of the parent company and consolidated financial statements 214 239
Fees payable to the Company’s auditors and its associates for other services:
The audit of the Company’s subsidiaries 220 235
Review of the interim financial statements – 62
Total auditors' remuneration 434 536
The Group has a policy in place for the award of non-audit work to the auditors which requires audit committee approval (refer to the audit committee report on pages 31 to 33). No non-audit services were provided in 2020 (2019: none).
Phoenix Global Resources plc Annual Report and Accounts 202076

Phoenix Global Resources plc Annual Report and Accounts 2020 77
12. Staff costs and headcount
Staff costs 2020
US$’000 2019
US$’000
Wages and salaries 9,484 16,563
Social security costs 1,341 2,428
Other benefits 875 1,592
Share-based payments 401 893
Total staff costs 12,101 21,476
Average headcount 2020
No. 2019
No.
Argentina 73 104
United Kingdom 4 4
United States of America 3 6
80 114
Key management compensation¹ 2020
US$’000 2019
US$’000
Short-term employee benefits 988 1,713
Post-employment benefits 61 36
Termination benefits 737 850
Total key management compensation 1,786 2,599
1 Includes PDMRs (CEO, CFO and COO)
Detailed remuneration disclosures are provided in the remuneration report on pages 44 to 46.
Share based payment disclosures are included in note 15.2 on page 112.
13. Property, plant and equipment
Property, plant and equipment
Other assets
US$’000
Development and
production assets
US$’000
Assets under construction
US$’000 Total
US$’000
At 1 January 2020
Cost 13,072 539,100 7,290 559,462
Accumulated depreciation and impairment (7,159) (228,054) – (235,213)
Net book amount 5,913 311,046 7,290 324,249
Year ended 31 December 2020
Opening net book amount 5,913 311,046 7,290 324,249
Additions 19 2,398 1,783 4,200
Transfers – 107 (107) –
Exploration costs written off – (116) – (116)
Depreciation charge (1,637) (39,709) – (41,346)
Impairment charge – (128,630) – (128,630)
Closing net book amount 4,295 145,096 8,966 158,357
Cost 13,091 541,489 8,966 563,546
Accumulated depreciation and impairment (8,796) (396,393) – (405,189)
Net book amount 4,295 145,096 8,966 158,357
Governa
nceF
inancia
l statem
entsS
trateg
ic report
Phoenix Global Resources plc Annual Report and Accounts 2020 77

Notes to the consolidated financial statements continued
78 Phoenix Global Resources plc Annual Report and Accounts 2020
13. Property, plant and equipment (continued) Additions Additions to property, plant and equipment in the year ended 31 December 2020 do not include any interest capitalised in respect of qualifying assets (2019: US$0.3 million). The total amount of interest capitalised within property, plant and equipment at 31 December 2020 is US$3.1 million (2019: US$3.1 million).
Exploration costs Exploration costs written off in 2020 include US$0.1 million related to Laguna El Loro and Chachahuen.
Assets held for sale Assets held for sale relates to certain non-core development and production assets in the non-operated segment with a net book value of US$12.0 million. An amount of US$0.5 million is also recognised as held for sale in current liabilities in relation to the ARO provision associated with these assets. In 2020 management engaged in an active program for the sale of these assets and expected to conclude discussions with interested parties before the end of the year. However, the Covid-19 pandemic meant these discussions had to be deferred as the Company focused on other priorities. It is still the intention of management to sell these non-core assets and management has now re-engaged with interested parties and is actively pursuing the sale of these assets, which it looking to complete in 2021. For this reason, the Company continues to recognise these assets as assets held for sale but has recognised an impairment of US$6.6 million in 2020 in recognition of management’s estimate of the fall in the net realisable value of these assets. The asset is included with non-operated assets in the segment analysis in note 6 on page 74.
Property, plant and equipment
Other assets
US$’000
Development and
production assets
US$’000
Assets under construction
US$’000 Total
US$’000
At 1 January 2019
Cost 9,431 694,747 6,070 710,248
Accumulated depreciation and impairment (5,680) (338,377) – (344,057)
Net book amount 3,751 356,370 6,070 366,191
Year ended 31 December 2019
Opening net book amount 3,751 356,370 6,070 366,191
Additions 3,990 18,078 35,351 57,419
Transfers – 34,131 (34,131) –
Transfers from intangible assets – 43,287 – 43,287
Transfers to assets held for sale – cost (349) (67,233) – (67,582)
Disposal of assets – cost – (126,950) – (126,950)
Termination of licences – cost – (53,334) – (53,334)
Exploration costs written off – (3,626) – (3,626)
Depreciation charge (1,788) (64,269) – (66,057)
Impairment charge – (2,500) – (2,500)
Transfers to assets held for sale – accumulated DD&A 309 49,682 – 49,991
Disposal of assets – accumulated DD&A – 89,922 – 89,922
Termination of licences – accumulated DD&A – 37,488 – 37,488
Closing net book amount 5,913 311,046 7,290 324,249
Cost 13,072 539,100 7,290 559,462
Accumulated depreciation and impairment (7,159) (228,054) – (235,213)
Net book amount 5,913 311,046 7,290 324,249
Exploration costs Exploration costs written off in 2019 include US$3.4 million related to the unsuccessful exploration well in the operated segment that was previously being held as suspended.
Phoenix Global Resources plc Annual Report and Accounts 202078

Phoenix Global Resources plc Annual Report and Accounts 2020 79
13. Property, plant and equipment (continued) Termination of licences In May 2019, the Province of Mendoza issued a decree terminating the concession for the Chañares Herrados block held by the Company’s joint venture partner, Chañares Energía S.A., as a result of its failure to fulfil work commitments. The decree took immediate effect and the Company has no intention of participating in the re-tender process. The carrying value of the asset was written off at 31 December 2019, causing a US$15.8 million loss to be realised in the non-operated segment.
Disposals In November 2019, the Company sold its 70% working interest in the Santa Cruz Sur (‘SCS’) licences to Echo Energy plc (‘Echo’). SCS forms part of the Group’s non-operated asset portfolio, being conventional oil production operated by ROCH S.A. On sale, the net non-current assets related to SCS of US$34.2 million were written off to the gain/loss on sale calculation. Details of the sale transaction are described in note 15 on page 82.
Impairment The Company defines the key indicators of impairment in relation to its oil and gas assets within its accounting policies. When a specific impairment trigger is identified during a period, the Company will complete an impairment review of the associated CGU. There has been no change in the CGU asset classification year-on-year. The Group’s accounting policy for long-lived assets gives examples of potential triggers for impairment that management will consider when assessing if a particular asset may be impaired. Climate change is another factor to be considered and this is reflected in the assumptions used to calculate the discount factor, in particular the beta factor and the country risk.
These include:
→ Exploration drilling that has not resulted in the discovery of reserves in potentially commercial quantities; → Changes in oil and gas prices or other market conditions that indicate discoveries may not be commercial; → The anticipated cost of development indicates that it is unlikely the carrying value of the exploration and evaluation asset will be
recovered in full; → There are no plans to conduct further exploration activities in an area; or → The exploration licence or concession period has expired or is due to expire.
In 2020, the primary method used in assessing impairment triggers for producing assets, was an economic evaluation based on fair values (level 3) less costs of disposal using the NPV15 (2019: NPV10) of post-tax cash flows generated from the 2P reserves of producing assets of the associated cash generating unit over the life of the concession. Factors considered in this evaluation include:
→ Historic and expected production → EUR and type curve analysis → Capex → Opex → Discount factors → Price deck
For exploration assets, management considered risked fair values based on post-tax NPV15 of P3 reserves and contingent resources in conjunction with fair values assessed on a per acreage basis (in 2019 impairment was assessed by comparing book value to its respective NPV12 value). Fair values attributed on a per acreage basis have been assessed by reference to values attributed to precedent transactions by comparing the following characteristics of the Company’s licences with comparable characteristics of licences the subject of precedent transactions:
→ °API → %TOC → Landing zones → Formation depth → DFIT (Psi) → Pressure gradient (Psi/ft) → Geohazards
Where the calculated fair values are less than the carrying values an impairment test is performed.
Prices used in the assessment were based on an average of prices sourced from various banks and analysts at the year-end increasing from a forecast Brent price of US$50.16/bbl in 2021 to US$66.38/bbl in 2030 and thereafter (2019: US$65/bbl with a 1.5% per annum increase over time).
The impairment assessment review resulted in a pre-tax impairment charge of US$128.6 million (2019: US$2.5 million) in respect of property, plant and equipment, primarily resulting from a revision in reserves associated with one CGU following poor results from a drilling program and changes to the price deck assumptions.
Management also carried out sensitivity analysis to determine the impact of changes in the price and discount factor assumptions. A summary of this sensitivity analysis is included at the end of note 14 below.
Governa
nceF
inancia
l statem
entsS
trateg
ic report
Phoenix Global Resources plc Annual Report and Accounts 2020 79

Notes to the consolidated financial statements continued
80 Phoenix Global Resources plc Annual Report and Accounts 2020
14. Intangible assets and goodwill Exploration and evaluation assets are primarily the Group’s licence interests in exploration and evaluation assets located in Argentina. The exploration and evaluation assets consist of both conventional and unconventional oil and gas properties.
Intangible assets Goodwill
US$’000
Exploration and evaluation
assets US$’000
Total US$’000
At 1 January 2020
Cost 260,007 215,759 475,766
Accumulated amortisation and impairment charges (224,169) (5,057) (229,226)
Net book amount 35,838 210,702 246,540
Year ended 31 December 2020
Opening net book amount 35,838 210,702 246,540
Additions – 3,949 3,949
Exploration cost written off – (2,630) (2,630)
Impairment charge (15,223) (20,662) (35,885)
Closing net book amount 20,615 191,359 211,974
At 31 December 2020
Cost 260,007 217,078 477,085
Accumulated amortisation and impairment charges (239,392) (25,719) (265,111)
Net book amount 20,615 191,359 211,974
Additions Additions to intangible assets during the year predominately relate mainly to work programs carried out on the Mata Mora, Corralera and El Manzano concessions.
Intangible assets
Goodwill US$’000
Exploration and evaluation
assets US$’000
Total US$’000
At 1 January 2019
Cost 260,007 225,172 485,179
Accumulated amortisation and impairment charges (224,169) – (224,169)
Net book amount 35,838 225,172 261,010
Year ended 31 December 2019
Opening net book amount 35,838 225,172 261,010
Additions – 39,054 39,054
Transfers from property, plant and equipment – (43,287) (43,287)
Transfers to assets held for sale – (616) (616)
Exploration cost written off – (230) (230)
Impairment charge – (5,057) (5,057)
Disposal of assets – cost – (4,334) (4,334)
Closing net book amount 35,838 210,702 246,540
At 31 December 2019
Cost 260,007 215,759 475,766
Accumulated amortisation and impairment charges (224,169) (5,057) (229,226)
Net book amount 35,838 210,702 246,540
Phoenix Global Resources plc Annual Report and Accounts 202080

Phoenix Global Resources plc Annual Report and Accounts 2020 81
14. Intangible assets and goodwill (continued) Additions Additions to intangible assets during 2019 related to the conclusion of the drilling of the MMx-1001 well, the drilling of the MMx-1002 well and subsequent flowback and other testing and completion works completed at Mata Mora. Additions also included costs associated with securing the Group’s interest in the Corralera Noroeste concession.
The costs associated with the MMx-1001 and MMx-1002 wells were transferred to development and production assets within property, plant and equipment on completion of flowback and determination of commercial reserves. The remaining exploration and evaluation costs associated with the Mata Mora licence will be held as intangibles until the licence area is commercially developed.
Impairment tests for exploration and evaluation assets Exploration and evaluation assets are subject to impairment testing prior to reclassification as tangible fixed assets where commercially viable reserves are confirmed. Where commercially viable reserves are not encountered at the end of the exploration phase for an area the accumulated exploration costs are written off in the income statement.
Impairment tests for goodwill Goodwill is monitored by management at the level of the operating segments identified in note 6. A segment level summary of goodwill allocation is presented below.
At acquisition Operated US$’000
Non-operated US$’000
Corporate US$’000
Total US$’000
Chachahuen & Cerro Morado Este – 15,223 – 15,223
Corralera 16,780 – – 16,780
Mata Mora 3,835 – – 3,835
Total goodwill 20,615 15,223 – 35,838
No goodwill was recognised prior to 2017. All goodwill presented relates to the allocation of technical goodwill arising as a result of accounting for deferred tax on the business combination on 10 August 2017. Goodwill of US$224.2 million that was related to the excess of the purchase consideration given over the fair value of assets acquired and liabilities assumed at the acquisition date was impaired in full on completion of the business combination in 2017.
Impairment The carrying value of goodwill has been assessed for impairment at the year-end on basis detailed in note 13 on page 77. Where the calculated fair values are less than the carrying values an impairment test is performed.
The impairment assessment review resulted in an impairment charge of US$15.2 million (2019: US$0 million) in respect of goodwill and US$20.7 million (2019: US$5.1 million) in respect of exploration and evaluation assets.
Sensitivity – property, plant, equipment and intangible assets Management carried out sensitivity analysis to determine the impact of changes in the price and discount factor assumptions in the impairment charge recognised on property, plant and equipment (see note 13 above) and intangible assets. A +US$5/bbl/-US$5/bbl per annum price change reduced/increased the total impairment charge by approximately US$16.8 million and US$18.2 million respectively and -5%/+5% per annum change in the discount rate reduced/increased the total impairment charge by approximately US$21 million and US$22.9 million respectively.
At year end the goodwill is presented below:
At December 2020 Operated US$’000
Non-operated US$’000
Corporate US$’000
Total US$’000
Corralera 16,780 – – 16,780
Mata Mora 3,835 – – 3,835
Total goodwill 20,615 – – 20,615
Governa
nceF
inancia
l statem
entsS
trateg
ic report
Phoenix Global Resources plc Annual Report and Accounts 2020 81

Notes to the consolidated financial statements continued
82 Phoenix Global Resources plc Annual Report and Accounts 2020
15. Disposal of non-current assets Loss on sale of non-current assets in the year was US$0.01 million (2019: US$29.0 million) and is broken down in the table below.
Gain/(loss) on sale of non-current assets 2020
USD $’000 2019
USD $’000
Disposal of Santa Cruz Sur – (29,609)
Disposal of Sur Rio Desde licence – 550
Disposal of vehicles – 88
Other disposals (6) –
Loss on sale of non-current assets (6) (28,971)
In November 2019, the Company sold its 70% working interest in the Santa Cruz Sur (‘SCS’) licences to Echo Energy plc (‘Echo’). SCS forms part of the Group’s non-operated asset portfolio, being conventional oil production operated by ROCH S.A.
Consideration received from Echo for the SCS assets was US$8.5 million, spilt between cash receipts of US$7.0 million plus an additional US$1.5 million settled through the issue of 39,958,443 new ordinary shares in Echo at a price of 2.9 pence per share. The realised loss on sale recognised in the Consolidated Income Statement is US$29.6 million, which is broken down per the table below:
Loss on sale 2019
USD $’000
Consideration 8,500
Costs to sell (1,410)
Fair value less costs to sell of total consideration 7,090
Net assets of SCS at sale date (34,248)
Working capital outstanding at the sale date (2,658)
Other adjustments 207
Loss on sale of Santa Cruz Sur (29,609)
Costs to sell included US$1.2 million in relation to the expected future cost to the Company of the Campo Limite work commitment. This commitment relates to the drilling of the Campo Limite well which forms part of the work commitment pursuant to the licence clauses for the SCS area held with the Province of Santa Cruz. Under the terms of the sales and purchase agreement (‘SPA’), it was agreed that the Company would be liable to pay, pro-rated to its 70% WI, for the costs of drilling the commitment well. Echo will then reimburse the Company for 60% of the total incurred cost, up to a maximum value of US$1.1 million. The US$1.2 million cost included in the loss on sale calculation represents the total cost which the Company estimates that it will be liable to pay in relation to the work commitment after the US$1.1 million cost reimbursement has been recovered from Echo. Works had begun on the commitment and at December 2020 there are a total of US$0.2 million pending to be completed.
Phoenix Global Resources plc Annual Report and Accounts 202082

Phoenix Global Resources plc Annual Report and Accounts 2020 83
16. Finance income and costs
2020
US$’000 2019
US$’000
Finance income
Interest income 186 370
Income from short-term investments 461 753
Net exchange gains on foreign currency borrowings 37 12
Other finance gains 6,221 442
Total finance income 6,905 1,577
Finance costs
Interest on borrowings (15,904) (16,627)
Accretion of discount on asset retirement obligation (764) (846)
Loan arrangement fees (90) (1,500)
Other finance costs (2,036) (2,117)
Exchange differences (3,482) (5,157)
Total finance cost (22,276) (26,247)
Net finance cost (15,371) (24,670)
The net decrease in cost was primarily driven by the benefit on transfers of US$ into Argentina under the 'contado con liquidacion' mechanism (recognised in other finance gains above), a reduction in the foreign exchange losses on Peso denominated balances held by the Company and a reduction in other finance costs.
Capitalised borrowing costs The capitalisation rate used to determine the amount of borrowing costs to be capitalised is the weighted average interest rate applicable to the entity’s general borrowings during the year, in this case there are nil for 2020 and for 2019 a total of 6.9% for US Dollar denominated secured bank loans.
In the year to 31 December 2020, no interest expense in respect of qualifying assets was capitalised as part of additions to property, plant and equipment (2019: US$0.3 million).
Governa
nceF
inancia
l statem
entsS
trateg
ic report
Phoenix Global Resources plc Annual Report and Accounts 2020 83

Notes to the consolidated financial statements continued
84 Phoenix Global Resources plc Annual Report and Accounts 2020
17. Taxation
2020
US$’000 2019
US$’000
Current tax
Current tax credit/(expense) on loss for the year 2,469 (260)
Total current tax credit /(expense) 2,469 (260)
Deferred income tax
Movement in deferred tax 35,536 21,271
Total deferred tax credit 35,536 21,271
Income tax benefit 38,005 21,011
Reconciliation of income tax expense to notional tax credit calculated using corporate tax rate:
2020
US$’000 2019
US$’000
Loss from continuing operations before income tax expense (235,029) (134,821)
Tax at the Argentina tax rate of 30% (2019: 30%) 70,509 40,446
Tax effect of amounts which are not deductible (taxable) in calculating taxable income:
Effect of currency translation on tax values (6,071) (7,875)
Effect of change in tax rate (10,649) (7,989)
Disposal of assets (1,315) 12,028
Expenses not deductible for taxation (1,960) (523)
Deferred tax assets not recognised (6,784) (6,308)
Inflation adjustment (4,883) (7,481)
Other (842) (1,287)
Total income tax benefit 38,005 21,011
The corporate income tax rate in Argentina in 2020 was 30% (2019: 30%) and applies to profits earned and losses suffered in the year to 31 December 2020.
Under the December 2017 tax reform plan implemented by the Argentina tax authorities, (the Administración Federal de Ingresos Públicos or ‘AFIP’), the corporate income tax rate was to be further reduced to 25% for years ending 31 December 2020 and forward. In December 2019 however, new tax reforms were implemented by the incoming government under Law 27,541. Under the new legislation, it was established that the reduced corporate rate of 25% would not be applicable until the year ending 31 December 2021 and forward.
An additional tax rate of 7% is applied to dividends when the corporate income tax rate is 30%. This additional dividend tax will be increased to 13% when the corporate tax rate is reduced to 25% in 2021.
Phoenix Global Resources plc Annual Report and Accounts 202084

Phoenix Global Resources plc Annual Report and Accounts 2020 85
18. Financial assets and liabilities
Financial assets 2020
Assets at FV-P&L
US$’000
Assets at amortised cost
US$’000 Total
US$’000
Trade and other receivables 1,812 15,597 17,409
Cash and cash equivalents – 5,386 5,386
Total financial assets 1,812 20,983 22,795
Financial assets 2019
Assets at FV-P&L
US$’000
Assets at amortised cost
US$’000 Total
US$’000
Trade and other receivables 2,648 19,950 22,598
Cash and cash equivalents – 11,002 11,002
Total financial assets 2,648 30,952 33,600
The maximum exposure to credit risk at the end of the reporting period is the carrying amount of each class of financial assets mentioned above.
Financial liabilities 2020
Derivatives: hedging
US$’000
Liabilities at amortised
cost US$’000
Total US$’000
Trade and other payables – 23,135 23,135
Borrowings – 332,233 332,233
Total financial liabilities – 355,368 355,368
Financial liabilities 2019
Derivatives: hedging
US$’000
Liabilities at amortised cost
US$’000 Total
US$’000
Trade and other payables – 44,616 44,616
Borrowings – 303,616 303,616
Total financial liabilities – 348,232 348,232
Recognised fair value measurements The Group uses the following hierarchy for determining and disclosing the fair value of financial instruments by valuation technique:
Level 1: The fair value of financial instruments traded in active markets (such as publicly traded derivatives, and trading securities) is based on quoted market prices at the end of the reporting period. The quoted market price used for financial assets held by the Group is the current bid price. These instruments are included in Level 1.
Level 2: The fair value of financial instruments that are not traded in an active market (for example, over-the-counter derivatives) is determined using valuation techniques which maximise the use of observable market data and rely as little as possible on entity-specific estimates. If all significant inputs required to fair value an instrument are observable, the instrument is included in Level 2.
Level 3: If one or more of the significant inputs is not based on observable market data, the instrument is included in Level 3. This is the case for unlisted equity securities.
At 31 December 2020, the Group held US$0.5 million of financial assets related to equity instruments whose fair value is assessed by reference to Level 1 inputs in the fair value hierarchy. There are no transfers to Level 2 or Level 3. All other financial instruments held by the Group at 31 December 2020 were assessed by reference to Level 3 inputs. At 31 December 2019, the Group held US$ 1.3 million of financial assets related to equity instruments whose fair value is assessed by reference to Level 1 inputs in the fair value hierarchy. All other financial instruments held by the Group at 31 December 2019 were assessed by reference to Level 3 inputs.
The Group’s maximum exposure to various risks associated with the financial instruments is discussed in note 24.
Governa
nceF
inancia
l statem
entsS
trateg
ic report
Phoenix Global Resources plc Annual Report and Accounts 2020 85

Notes to the consolidated financial statements continued
86 Phoenix Global Resources plc Annual Report and Accounts 2020
19. Trade and other receivables 2020 2019
Current
US$’000 Non-current
US$’000 Total
US$’000 Current
US$’000 Non-current
US$’000 Total
US$’000
Equity investments 467 – 467 1,303 – 1,303
Contingent consideration 1,345 – 1,345 1,345 – 1,345
Financial assets at fair value through profit and loss 1,812 – 1,812 2,648 – 2,648
Trade receivables 9,578 – 9,578 17,255 – 17,255
Less: provision for impairment (101) – (101) (447) – (447)
9,477 – 9,477 16,808 – 16,808
Other receivables 5,132 988 6,120 1,962 1,180 3,142
Financial assets at amortised cost 14,609 988 15,597 18,770 1,180 19,950
Prepayments and other receivables 1,478 – 1,478 1,587 68 1,655
Tax credits 7,500 3,136 10,636 11,522 3,496 15,018
Total trade and other receivables 25,399 4,124 29,523 34,527 4,744 39,271
Trade receivables are amounts due from customers for sales of crude oil and natural gas in the ordinary course of business. Trade receivables are non-interest bearing and generally have 30 day terms and are therefore all classified as current. Due to their short maturities, the book value of trade receivables approximates fair value. Taxation, prepayments and other receivables are non-derivative financial assets with fixed or determinable payments that are not quoted in an active market. If collection of amounts is expected in one year or less they are classified as current assets.
The lifetime expected credit loss rate of the Group’s trade receivables was assessed based on the payment profiles of sales over a period of 36 months before 31 December 2020 and 1 January 2020 respectively and the corresponding historical credit losses experienced within this period. No material adjusting macroeconomic factors were identified for either assessment period. The actual credit loss over 2020 was determined to be 0% of total sales (2019: 0.4% of total sales), which is immaterial to the Group financial statements. No loss allowance has therefore been recognised in either period presented.
Other receivables include primarily amounts due for the surrender of Company tax losses (see note 30 on page 98) and non-operated joint venture balances and are determined to be low credit risk and no loss allowance has been recorded against this balance in the period.
Contingent consideration was recognised on the sale of AEA S.A. in November 2018 and represents the fair value attributed to restricted cash held in escrow in respect of licence guarantees in Colombia and held in favour of the ANH, the Colombian regulator, in respect of which the Company has a right of recovery.
20. Cash and cash equivalents
2020
US$’000 2019
US$’000
Cash at bank and in hand 773 8,832
Short-term investments 4,613 2,170
Total cash and cash equivalents 5,386 11,002
Short-term investments Term deposits are presented as cash equivalents if they have a maturity of three months or less from the date of acquisition and are repayable with 24 hours’ notice with no loss of interest.
Phoenix Global Resources plc Annual Report and Accounts 202086

Phoenix Global Resources plc Annual Report and Accounts 2020 87
21. Trade and other payables 2020 2019
Current
US$’000 Non-current
US$’000 Total
US$’000 Current
US$’000 Non-current
US$’000 Total
US$’000
Trade payables 7,166 – 7,166 16,869 – 16,869
Accrued staff costs 1,035 – 1,035 3,271 – 3,271
Social security and other taxes 2,774 299 3,073 2,922 1,278 4,200
Royalties 973 – 973 1,172 – 1,172
Lease obligations 195 – 195 1,281 4,092 5,373
Accrued expenses 8,732 – 8,732 9,901 – 9,901
Other payables 5,034 – 5,034 4,030 – 4,030
Total trade and other payables 25,909 299 26,208 39,446 5,370 44,816
Trade payables are unsecured and are usually paid within 30 days of recognition.
The carrying amounts of trade and other payables are considered to be the same as their fair values, due to their short-term nature. Lease obligations have decreased in 2020 as a result of the Company reaching agreement with the supplier of power generators to buy-out the lease, which was subsequently cancelled (see note 25 on page 93).
Social security and other taxes include amounts related to tax plans agreed with the AFIP, the Argentine federal tax authority.
Under tax plan arrangements, taxes due are paid in instalments with interest charged on the outstanding principal. The Group historically participated in tax plans on a selective basis and where the level of currency depreciation and the interest rate on outstanding amounts resulted in an acceptable finance cost. Obligations falling due from tax plans within the next 12 months have been presented within current liabilities at 31 December 2020, with the remaining obligations presented as non-current.
22. Borrowings 2020 2019
Current
US$’000 Non-current
US$’000 Total
US$’000 Current
US$’000 Non-current
US$’000 Total
US$’000
Secured
Bank loans 2,598 6,641 9,239 10,055 – 10,055
Total secured borrowings 2,598 6,641 9,239 10,055 – 10,055
Unsecured
Bank loans – – – – – –
Loans from related parties 322,973 – 322,973 146,782 146,751 293,533
Other loans 21 – 21 28 – 28
Total unsecured borrowings 322,994 – 322,994 146,810 146,751 293,561
Total borrowings 325,592 6,641 332,233 156,865 146,751 303,616
Secured liabilities and assets pledged as security Secured liabilities relate to US Dollar denominated loans at an interest rate of Libor + 700 points for Dollar loans and Badlar + 700 points for Peso loans (2019: interest fixed rate of 8.0%). At 31 December 2020 the Group held US$ 2.7 million loans in Argentine Peso (2019: US$nil).
Loans from related parties The related party loan at 31 December 2020 relates to a convertible rolling credit facility (‘RCF’) and non-convertible bridging facility ('BF') provided to the Group by Mercuria Energy Netherlands B.V., a subsidiary of the Mercuria group.
As part of the business combination in 2017, Mercuria advanced a bridging and working capital facility to the Group for the amount of US$160.0 million. In February 2018, US$100.0 million of the facility was converted to equity of the Company at a price of £0.37 per share. At the same time the facility was restructured as a new convertible RCF in the amount of US$160.0 million with an additional US$100.0 million of new funds made available to the Company. In December 2018, Mercuria advanced an additional US$25.0 million as a Facility B element to the RCF.
Governa
nceF
inancia
l statem
entsS
trateg
ic report
Phoenix Global Resources plc Annual Report and Accounts 2020 87

Notes to the consolidated financial statements continued
88 Phoenix Global Resources plc Annual Report and Accounts 2020
22. Borrowings (continued) In February 2019, a further US$50.0 million was made available under this Facility B element. The original loan of US$160.0 million became Facility A.
In May 2019, the amended convertible RCF was further extended to add a Facility C commitment of US$40 million. Facility C was extended in November 2019 by an additional US$10.0 million and in March 2020 by an additional US$ 6 million.
At 31 December 2020, a total facility of US$291.0 million was available to the Company, with a total of US$281.0 million drawn down under the facility, with the undrawn balance of US$ 10 million made available through the BF, which was subsequently increased to US$ 11.5 million, with US$ 11.26 million drawn down at the year end.
All funds drawn down under the RCF and BF bear interest at three-month LIBOR+4%. The RCF provides for a grace period for repayments (interest and principal) from 1 January 2019 to 30 June 2021 with a maturity date of 31 December 2021 amortised in equal quarterly repayment instalments from and including 30 June 2021 until maturity. The BF, principal and interest, is repayable by 30 June 2021. At the year-end US$30.7 million of interest had been capitalised.
Mercuria has the right to convert all or part of the outstanding principal of Facility A into additional new ordinary shares of the Company at a price of £0.45 per share. This conversion right can be exercised at any time from 30 June 2018 until 10 business days prior to the maturity of Facility A. A similar conversion feature exists in relation to Facility B at a price of £0.28 per share exercisable from 30 June 2019 until 10 business days prior to the maturity date and in relation to Facility C at a price of £0.23 per share exercisable from 30 June 2020 until 10 business days prior to the maturity date.
Fair value Differences identified between the fair values and carrying amounts of borrowings are as follows:
2020 2019
Carrying amount
US$’000 Fair value US$’000
Carrying amount
US$’000 Fair value US$’000
Bank loans 9,239 8,981 10,055 10,018
Other loans 21 21 28 28
Loans from related parties 322,973 301,844 293,533 288,668
Total 332,233 310,846 303,616 298,714
The fair values of non-current borrowings are based on discounted cash flows using a current borrowing rate. They are classified as Level 3 fair values in the fair value hierarchy due to the use of unobservable inputs, including own credit risk.
23. Changes in liabilities arising from financing activities Non-cash changes
1 January 2020
US$’000 Cash flows
US$’000 Interest paid
US$’000
Movements from
non-current to current US$’000
Interest charge
US$’000
Capitalised interest
US$'000
Foreign exchange US$’000
31 December 2020
US$’000
Current liabilities
Borrowings 156,865 13,459 (709) 140,110 15,904 – (37) 325,592
Non-current liabilities
Borrowings 146,751 – – (140,110) – – – 6,641
Total borrowings 2020 303,616 13,459 (709) – 15,904 – (37) 332,233
Total borrowings 2019 200,284 88,000 (1,548) – 16,627 265 (12) 303,616
Phoenix Global Resources plc Annual Report and Accounts 202088

Phoenix Global Resources plc Annual Report and Accounts 2020 89
24. Financial risk management The Group’s exposure to financial risks and how those risks could affect the Group’s future financial performance is summarised below.
Risk Exposure arising from Measurement Management
Market risk – foreign exchange
Future commercial transactions
Cash flow forecasting and budgeting
The majority of the Group’s cash is held in US Dollars. The Group draws progressively on available facilities as cash is needed to fund development.
Financial assets and liabilities recognised in the balance sheet that are not denominated in US Dollars
Sensitivity analysis Due to the influence of the US Dollar on the companies within the Group, the US Dollar has been determined to be the functional currency of the operating subsidiaries and the parent. This determination also reduces the exposure to foreign exchange gains and losses.
Market risk – commodity prices
Future revenue transactions Cash flow forecasting and budgeting
The Group considers the use of hedging instruments and enters into hedge arrangements where appropriate in order to protect downside price exposure and, particularly, to support budgeted capex requirements.
Market risk – interest rate
Long-term borrowings held at variable rates
Sensitivity analysis The Group has an active treasury management function and places excess cash on hand on overnight or term deposit.
Credit risk Cash and cash equivalents and trade receivables
Aging analysis Credit checks and credit ratings
The Group actively monitors outstanding receivables. Where a customer shows risk of default then no credit is extended and all sales are made on a prepaid basis.
Liquidity risk Borrowings and other liabilities
Rolling cash flow forecasts The Group maintains an active treasury management function.
Market risk – foreign exchange risk and commodity price risk The Group’s operations are solely focused on Argentina and wholly relate to the exploration for and the development and production of oil and gas reserves. The foreign currency that has the most influence on the financial performance of the Group is the Argentine Peso (or ‘Peso’). The Group is exposed to quoted prices for oil and gas which are both traded commodities, the prices of which can also significantly influence financial performance.
Argentina has historically been subject to exchange and commodity controls that have prevented effective currency and commodity price management.
Historic exchange controls were lifted in December 2015; however, following significant devaluation of the Peso during 2020 the government has re-introduced some exchange controls restricting the repayment of financial debt outside Argentina, the sale of securities with foreign currency settlement by non-residents and the settlement of securities transactions entered into or acquired outside Argentina. These new regulations do not have a direct impact on the Group’s operations.
Overall, although the Group is exposed to the Peso the foreign exchange risk is determined to be low. Despite being priced by reference to the US Dollar, oil sales invoices are physically settled in Pesos. Therefore, the Company typically generates enough Pesos from oil sales contracts to enable it to settle all its operating costs in Argentina and to contribute toward the cost of capex activity.
The Group did not use derivative financial instruments to manage currency risk in the year ended 31 December 2020 or in the prior year.
Capped commodity pricing was removed in August 2018, following which an export retention tax was implemented, which resulted in a downward impact of approximately 10% on crude prices throughout 2019, with the well-head realisable price linked to Brent.
During 2019 Brent crude prices continued to rise, averaging US$66.1/bbl in H1 2019 and US$62.6/bbl in H2 2019. The continued upward pressure on prices combined with the devaluation of the Peso resulted in the Argentinian government further intervening in H2 2019, issuing a number of decrees that fixed the Brent reference price for sales at US$59.0/bbl and the Dollar to Peso exchange rate at 45.2 rising to 51.2 in three dated stages.
Governa
nceF
inancia
l statem
entsS
trateg
ic report
Phoenix Global Resources plc Annual Report and Accounts 2020 89

Notes to the consolidated financial statements continued
90 Phoenix Global Resources plc Annual Report and Accounts 2020
24. Financial risk management (continued) The emergence of Covid-19 as a global pandemic in 2020 resulted in the average Brent crude price falling year-on-year by 33%, from an average of US$64/bbl in 2019 to an average of US$43/bbl In 2020. In May 2020, Argentina’s Government issued a decree establishing a fixed realised Medanito price of $45/bbl (‘Barril Criollo’), subject to certain conditions, demonstrating the intention of the government to support the industry where possible. This pricing support remained in place until September when the Brent crude benchmark price exceeded US$45/bbl for 10 consecutive days, which was one of the conditions that would cause the support to expire.
The continued government intervention in crude pricing has meant that the relationship between realised prices and the Brent crude benchmark has remained imperfect, and as such the design of effective hedge protection against commodity risk is difficult. The Group therefore did not take out any derivative commodity contracts during the year.
The Group is primarily exposed to foreign exchange risk related to bank deposits, debtors or creditors that are denominated in Argentine Pesos or Pounds Sterling. The Group’s exposure to foreign exchange risk at the end of the reporting period, expressed in US Dollars, was as follows:
Denominated in:
US$’000 £GBP AR$
Trade and other receivables 222 23,140
Cash and cash equivalents 11 5,200
Trade and other payables (1,171) (17,288)
Borrowings – (21)
(938) 11,031
Sensitivity – exchange rates As shown in the table above, the Group is primarily exposed to changes in the US$/AR$ exchange rate. The sensitivity of profit and loss to changes in the exchange rates arises mainly from AR$ denominated financial instruments. There is no impact on other components of equity as the Group is not party to any derivative financial instruments, such as hedging instruments, where currency gains and losses would be recognised in other comprehensive income (2019: none).
Impact on post-tax
profit and loss Impact on other
components of equity
2020
US$’000 2019
US$’000 2020
US$’000 2019
US$’000
US$/AR$ exchange rate increase by 10%1 1,009 1,508 – –
US$/AR$ exchange rate decrease by 10%1 (1,009) (1,508) – –
1 Assumes all other variables held constant
Sensitivity – commodity prices The impact of an increase or decrease in commodity prices on the Group’s oil and gas revenues is as follows:
Impact on revenue – crude oil prices
Impact on revenue – natural gas prices
2020
US$’000 2019
US$’000 2020
US$’000 2019
US$’000
Increase by 10%1 5,216 11,465 184 1,477
Decrease by 10%1 (5,216) (11,465) (184) (1,477)
1 Assumes all other variables held constant
Market risk – interest rate risk The Group’s main interest rate risk arises from long-term borrowings with fixed or semi fixed interest rates that expose the Group to fair value risk on the underlying borrowing instrument. The material portion of the Group’s borrowings are in US Dollar.
Argentina has historically been subject to high levels of currency devaluation as well as high inflation. The Group therefore maintains the majority of its borrowings in US Dollar and only translates borrowings into Argentine Peso when the Group has an operating cash need for this currency. This allows the Group to manage its exposure to the combination of inflation, currency devaluation and interest rate risk.
The Group does not currently use swap instruments or other derivatives to manage its interest rate or fair value risk exposure.
Phoenix Global Resources plc Annual Report and Accounts 202090

Phoenix Global Resources plc Annual Report and Accounts 2020 91
24. Financial risk management (continued) Market risk – interest rate risk (continued) The exposure of the Group’s borrowings to interest rate changes is as follows:
2020
US$’000
% of total loans
US$’000 2019
US$’000
% of total loans
US$’000
Variable rate borrowings 332,213 100 293,502 97
Sensitivity – interest rate risk Profit or loss is sensitive to higher/lower interest income from cash and cash equivalents or higher/lower interest expense on borrowings resulting from movements in the interest rate. The following table demonstrates the sensitivity of the Group’s financial instruments to reasonably possible movements in interest rates:
Impact on post-tax
profit and loss Impact on other
components of equity
2020
US$’000 2019
US$’000 2020
US$’000 2019
US$’000
Interest rate increase by 100 basis points1 1,618 1,689 – –
Interest rate decrease by 100 basis points1 (1,618) (1,689) – –
1 Assumes all other variables held constant
Credit risk Credit risk arises from cash and cash equivalents, deposits with banks and financial institutions. The Group is also exposed to credit risk related to its customers and outstanding receivables with them.
Credit risk on cash and cash equivalents is managed by only maintaining bank accounts or placing funds on deposit with recognised, reputable financial institutions. The Group aims to only place funds on deposit with institutions with a minimum credit rating of B2 (Moody’s). At 31 December 2020, US$4.6 million was held on deposit with institutions in Argentina. During 2020 the Argentine economy experienced high volatility, with significant devaluation of the Peso and full-year price inflation exceeding 36%. Moody’s Latin America assigned a new domestic rating for Argentina´s entities as there are not globally comparable with the full universe of Moody's rated entities. The new rating ends with AR and these deposits relate solely to amounts held on deposit with financial institutions in Argentina.
The Group continues to monitor this situation and aims to only hold cash deposits in Argentina which are needed to cover operating costs for a specific month. Monthly cash calls are completed whereby the Argentine entities request US Dollars from the parent company based on an assessment of expected cash inflows and outflows for that month. This helps the Group to manage credit risk.
The Group sells substantially all of its oil production to the Argentina state-owned oil company, YPF. At 31 December 2020 YPF had a credit rating of A+.ar (Moody’s Latin America, a new domestic rating from the credit rating from Argentina´s entities), in 2019 was Caa2 in the global rating. The credit rating of A+.ar would indicate that the Company has a low credit risk in respect of sales made to YPF; also, there is no recent history of credit loss, non-payment or default by YPF in relation to oil and gas sales. The calculated amount of the potential 12-month credit risk loss is therefore not material and no credit loss were recorded at 31 December 2020.
The Group undertakes credit and other checks before accepting new customers. Where there are concerns about creditworthiness of a counterparty, the Group requires that the full amount/substantially all of any sale be paid in full before delivery.
Governa
nceF
inancia
l statem
entsS
trateg
ic report
Phoenix Global Resources plc Annual Report and Accounts 2020 91

Notes to the consolidated financial statements continued
92 Phoenix Global Resources plc Annual Report and Accounts 2020
24. Financial risk management (continued) Credit risk (continued) The credit quality of financial assets that are neither past due or impaired can be assessed by reference to external credit ratings (where available) or to historical information about default rates.
Trade receivables – counterparty without external credit rating1 2020
US$’000 2019
US$’000
Group 1 2 33
Group 2 3,059 3,047
3,061 3,080
1 Group 1 – new customers (less than six months) Group 2 – existing customers (more than six months) with no past default
Cash at bank and short-term deposits (Moody’s) 2020
US$’000 2019
US$’000
Aa2 – 3,540
Aa3 510 1,991
A1 – 369
Baa1 – 8
Baa3 – 88
Baa2 4 –
Caa1 – 115
Caa2 – 4,888
AA+.ar 4,758 –
AA.ar 1 –
A+.ar 1 –
B1.ar 99 –
Other 13 3
Total cash and cash equivalents 5,386 11,002
At 31 December 2020, trade receivables of US$0.6 million were past due but not impaired (2019: US$3.6 million). The aging analysis of these trade receivables is as follows:
2020
US$’000 2019
US$’000
Up to 3 months 112 2,499
3 to 6 months 42 411
Over 6 months 406 674
560 3,584
Liquidity risk Liquidity risk relates to the Group’s ability to meet its obligations as they fall due. The Group generates cash from its operations. Management monitors investment plans, and in particular, those in relation to exploration expenditure that may not be cash generative in the short term, against available cash and cash equivalents, forecast cash from operations and maturity dates of financial liabilities before final sanction and deployment of cash to a project. Undrawn borrowing capacity, where available, is also taken into account.
The following table shows the Group’s financial liabilities by relevant maturity groupings based on contractual maturities. The amounts included in the analysis are the contractual undiscounted cash flows.
Phoenix Global Resources plc Annual Report and Accounts 202092
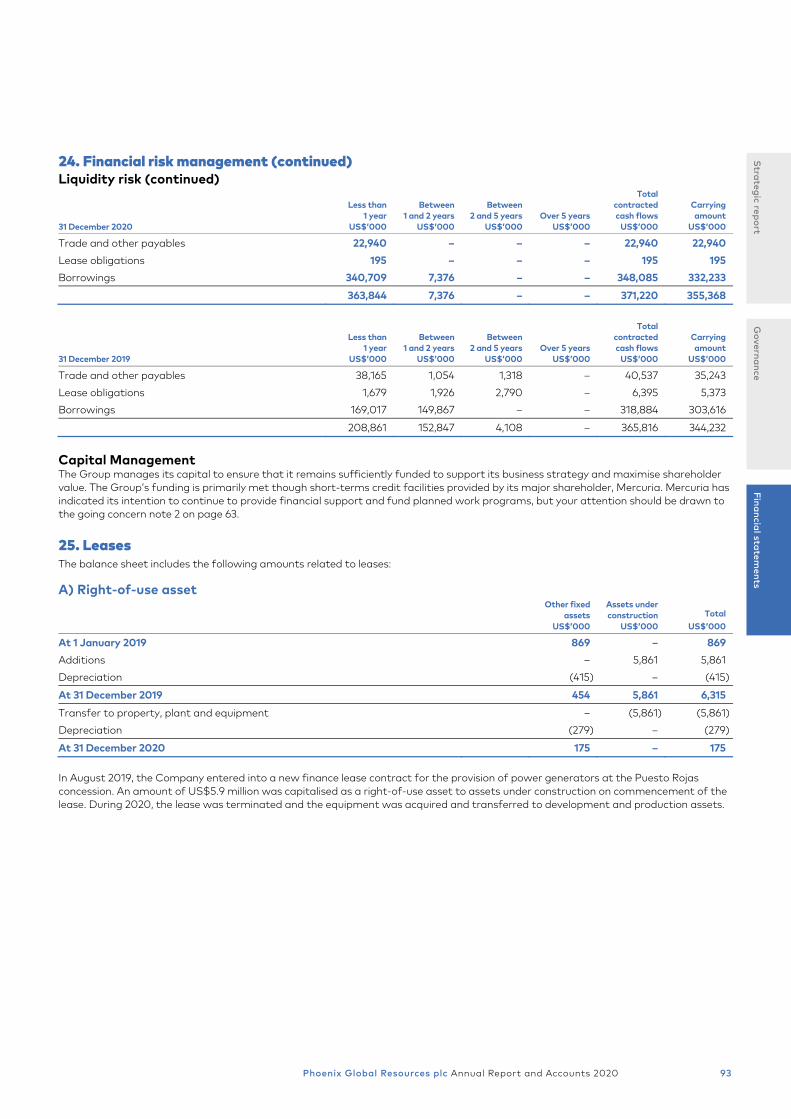
Phoenix Global Resources plc Annual Report and Accounts 2020 93
24. Financial risk management (continued) Liquidity risk (continued)
31 December 2020
Less than 1 year
US$’000
Between 1 and 2 years
US$’000
Between 2 and 5 years
US$’000 Over 5 years
US$’000
Total contracted cash flows
US$’000
Carrying amount
US$’000
Trade and other payables 22,940 – – – 22,940 22,940
Lease obligations 195 – – – 195 195
Borrowings 340,709 7,376 – – 348,085 332,233
363,844 7,376 – – 371,220 355,368
31 December 2019
Less than 1 year
US$’000
Between 1 and 2 years
US$’000
Between 2 and 5 years
US$’000 Over 5 years
US$’000
Total contracted cash flows
US$’000
Carrying amount
US$’000
Trade and other payables 38,165 1,054 1,318 – 40,537 35,243
Lease obligations 1,679 1,926 2,790 – 6,395 5,373
Borrowings 169,017 149,867 – – 318,884 303,616
208,861 152,847 4,108 – 365,816 344,232
Capital Management The Group manages its capital to ensure that it remains sufficiently funded to support its business strategy and maximise shareholder value. The Group’s funding is primarily met though short-terms credit facilities provided by its major shareholder, Mercuria. Mercuria has indicated its intention to continue to provide financial support and fund planned work programs, but your attention should be drawn to the going concern note 2 on page 63.
25. Leases The balance sheet includes the following amounts related to leases:
A) Right-of-use asset
Other fixed assets
US$’000
Assets under construction
US$’000 Total
US$’000
At 1 January 2019 869 – 869
Additions – 5,861 5,861
Depreciation (415) – (415)
At 31 December 2019 454 5,861 6,315
Transfer to property, plant and equipment – (5,861) (5,861)
Depreciation (279) – (279)
At 31 December 2020 175 – 175
In August 2019, the Company entered into a new finance lease contract for the provision of power generators at the Puesto Rojas concession. An amount of US$5.9 million was capitalised as a right-of-use asset to assets under construction on commencement of the lease. During 2020, the lease was terminated and the equipment was acquired and transferred to development and production assets.
Governa
nceF
inancia
l statem
entsS
trateg
ic report
Phoenix Global Resources plc Annual Report and Accounts 2020 93

Notes to the consolidated financial statements continued
94 Phoenix Global Resources plc Annual Report and Accounts 2020
25. Leases (continued) B) Lease liability
Other fixed assets
US$’000
Assets under construction
US$’000 Total
US$’000
At 1 January 2019 869 – 869
New leases – 5,861 5,861
Cash payments of principal and interest (449) (970) (1,419)
Interest charged 62 – 62
At 31 December 2019 482 4,891 5,373
Cash payments of principal (436) (4,891) (5,327)
Interest charged 149 – 149
At 31 December 2020 195 – 195
Of which:
Current 195 – 195
Non-current – – –
195 – 195
In 2019 a lease liability of US$5.9 million was recognised on commencement of the power generation lease at Puesto Rojas. In 2020 the Company reached agreement with the supplier to buy-out the lease, which was subsequently cancelled.
26. Deferred tax balances Argentina tax law does not contain the concept of tax groups and therefore deferred tax assets and liabilities cannot be offset between and among companies registered in Argentina and falling under the control of the same shareholder. Outside of Argentina, the Group does not have sufficient concentration of subsidiaries in a single tax jurisdiction to warrant seeking tax group status to allow the offset of assets and liabilities.
The corporate income tax rate in Argentina in 2020 was 30% (2019: 30%). In December 2019, tax reforms were implemented by the incoming Argentine government. Under the new legislation, it was established that the reduced corporate tax rate of 25% would not be applicable until the year ended 31 December 2021 and forward. An additional tax rate of 7% will be applied to dividends when the corporate income tax rate is 30%. This additional dividend tax will be increased to 13% when the corporate tax rate is reduced to 25% in 2021.
Deferred tax assets and liabilities are calculated at the rate of 25% or 30% taking into consideration the expected time of recovery.
Deferred tax assets
2020
US$’000 2019
US$’000
Tax losses 19,757 14,468
Provisions 1,898 1,723
Others - Foreign exchange and interest 3,900 7,064
Total deferred tax assets 25,555 23,255
Deferred tax assets are recognised only to the extent that it is probable that future taxable profits will be available against which the asset can be utilised. The Company did not recognise deferred income tax assets of US$6.8 million (2019: US$6.3 million) in respect of tax losses amounting to US$22.6 million (2019: US$14.1 million) as there is insufficient evidence that the potential assets will be recovered and wrote off a US$4.0 million deferred tax asset recognised at the time of the reverse takeover and not considered recoverable.
Assessed tax losses amounting to US$20.4 million (2019: US$14.5 million) will expire between 2023 to 2025 (2019: 2020 to 2024).
Phoenix Global Resources plc Annual Report and Accounts 202094

Phoenix Global Resources plc Annual Report and Accounts 2020 95
26. Deferred tax balances (continued) Deferred tax assets (continued)
Movements Tax losses US$’000
Provisions US$’000
Other US$’000
Total US$’000
At 1 January 2019 2,525 3,055 7,151 12,731
Credited/(charged) to profit and loss 11,943 (1,332) (87) 10,524
At 31 December 2019 14,468 1,723 7,064 23,255
Movements Tax losses US$’000
Provisions US$’000
Other US$’000
Total US$’000
At 1 January 2020 14,468 1,723 7,064 23,255
Credited/(charged) to profit and loss 5,289 175 (3,164) 2,300
At 31 December 2020 19,757 1,898 3,900 25,555
The timeframe for expected recovery or settlement of deferred tax assets is as follows:
2020
US$’000 2019
US$’000
No more than 12 months after the reporting year 5,798 8,802
More than 12 months after the reporting year 19,757 14,453
25,555 23,255
Deferred tax liabilities The balance comprises temporary differences attributable to:
2020
US$’000 2019
US$’000
Property, plant and equipment and intangible assets (48,402) (84,463)
Inventories (1,322) (1,861)
Inflation adjustments (9,397) (6,033)
Total deferred tax liabilities (59,121) (92,357)
Argentine tax law has introduced provisions for inflationary adjustments to be made for tax purposes in the event that the increases in the 36-month cumulative CPI index for the preceding closing year exceed 100%, considering for the first three periods assessed an increase in excess of 55% in 2018, 30% in 2019 or 15% in 2020. Where an inflationary adjustment for tax is triggered, the law requires an adjustment to taxes in the period with one sixth of the calculated value booked to current income taxes in the year and the remaining five sixths included within deferred tax and recognised through current tax in equal parts in the following five years.
During the year an amount of US$1.5 million (FY19: US$ 1.5 million) has been included in current taxes, with an additional US$9.4 million (FY19: US$ 6.0 million) included within deferred tax liabilities in relation to this adjustment.
Governa
nceF
inancia
l statem
entsS
trateg
ic report
Phoenix Global Resources plc Annual Report and Accounts 2020 95

Notes to the consolidated financial statements continued
96 Phoenix Global Resources plc Annual Report and Accounts 2020
26. Deferred tax balances (continued) Deferred tax liabilities (continued)
Movements
Property, plant and
equipment and intangible
assets US$’000
Inventories US$’000
Inflation adjustments
US$’000 Other
US$’000 Total
US$’000
At 1 January 2019 (101,310) (42) – (1,751) (103,103)
(Charged)/credited to profit and loss 4,819 (1,819) (6,033) 1,751 (1,282)
Disposal of assets 12,028 – – – 12,028
At 31 December 2019 (84,463) (1,861) (6,033) – (92,357)
Movements
Property, plant and
equipment and intangible
assets US$’000
Inventories US$’000
Inflation adjustments
US$’000 Other
US$’000 Total
US$’000
At 1 January 2020 (84,463) (1,861) (6,033) – (92,357)
(Charged)/credited to profit and loss 36,061 539 (3,364) – 33,236
At 31 December 2020 (48,402) (1,322) (9,397) – (59,121)
The above presentation of deferred tax assets and liabilities is prepared showing the aggregate of the gross asset and liability position on a company by company basis.
2020
US$’000 2019
US$’000
Deferred tax assets 25,555 23,255
Deferred tax liabilities (59,121) (92,357)
Net deferred income tax liability (33,566) (69,102)
Deferred tax assets and liabilities presented in the balance sheet reflect the offset of deferred tax assets and liabilities where permissible. The deferred tax assets and liabilities, after legal offset, are shown in the table below.
2020
US$’000 2019
US$’000
Deferred tax assets 20,116 18,534
Deferred tax liabilities (53,682) (87,636)
Net deferred income tax liability (33,566) (69,102)
27. Inventories
2020
US$’000 2019
US$’000
Crude oil 1,147 1,798
Spare parts and equipment 17,202 16,404
Total 18,349 18,202
The costs of individual items of inventory are determined using weighted average costs. Crude oil inventory is recorded using the per-barrel weighted average cost of production for the year. Weighted average cost is determined by dividing the total production costs for the year by the volume of barrels produced in the year.
Inventories recognised as an expense in the year relate to the change in crude inventory year-on-year reflecting the timing of the actual sale of the crude as opposed to being expensed based on production volumes in the year. For certain fields, inventory is accumulated in storage pending tanker collection. Depending on the timing of collection, crude produced in one year can be sold in the following year resulting in inventory at the year end.
Phoenix Global Resources plc Annual Report and Accounts 202096

Phoenix Global Resources plc Annual Report and Accounts 2020 97
28. Provisions and contingent liabilities 2020 2019
Current
US$’000 Non-current
US$’000 Total
US$’000 Current
US$’000 Non-current
US$’000 Total
US$’000
Decommissioning and site restoration – 11,555 11,555 – 11,385 11,385
Legal claims 121 4,030 4,151 120 4,199 4,319
Other – 380 380 – 200 200
Total 121 15,965 16,086 120 15,784 15,904
Decommissioning and site restoration The Group has an obligation to remove its oil and gas production equipment from a field at the end of its useful life. The Group is required to securely plug wells that will no longer be used in order to make them environmentally and physically safe. In addition, all land must be returned to its natural state at the cessation of production operations. A provision is established representing the present value of the estimated future cost of this obligation with a corresponding depreciable ‘decommissioning’ asset recorded in property, plant and equipment using a discount rate of 7% and inflation of 2%.
The key assumptions applied in calculating the decommissioning provision relate to the extent of the physical decommissioning activity required on a licence-by-licence area, the cost of performing that activity and the timing of when that activity is due to take place. The estimate of the quantum of the provision is most sensitive to the extent of the activity required, which may change over time due to legislation. In addition, the estimate of the provision is sensitive to the timing of the decommissioning activity which is determined by the economically productive life of the related asset.
Provinces may not require remediation of wells prior to the relinquishment of licences. This can occur where the Province considers wells may be of geologic interest to future licence holders or could be remediated in the future. In these circumstances no provision is made.
Provision for legal claims Legal claims mainly relate to disputes arising related to payments for services rendered and the nature of the service rendered. Provisions are recorded for such claims where the Company has determined it to be probable that an outflow of resources will be required to settle a claim, or where it is uncertain whether any action by a third party would be successful. Provisions are assessed on a case-by-case basis.
Other provision These are contractual obligations contingent on certain events occurring.
Movements in provisions Movements in each class of provisions during the financial year are set out below:
Decommissioning and site
restoration US$’000
Legal claims US$’000
Other US$’000
Total US$’000
At 1 January 2019 13,382 4,587 – 17,969
Additional provisions recognised 115 1,519 200 1,834
Unwinding of discount 846 – – 846
Amounts used during the year – (1,787) – (1,787)
Disposal of assets (2,511) – – (2,511)
Classified as held for sale at year end (447) – – (447)
At 1 January 2020 11,385 4,319 200 15,904
Additional provisions recognised – 488 180 668
Unwinding of discount 764 – – 764
Amounts used during the year (100) (146) – (246)
Exchange differences – (385) – (385)
Revision of abandonment cost provision (494) (125) – (619)
At 31 December 2020 11,555 4,151 380 16,086
Governa
nceF
inancia
l statem
entsS
trateg
ic report
Phoenix Global Resources plc Annual Report and Accounts 2020 97

Notes to the consolidated financial statements continued
98 Phoenix Global Resources plc Annual Report and Accounts 2020
29. Commitments At 31 December, the Group had the following licence commitments:
2020
US$’000 2019
US$’000
Operated 120,335 124,081
Non-operated 4,340 7,940
Total 124,675 132,021
Most licence commitments relate to exploration commitments that are typically required to be satisfied within the exploration period, which is normally 2–3 years from the date of grant of the licence. The Group does not have any significant contingencies. In the case commitments are not met, authorities could execute the performance bonds provided as surety that do not in total exceed US$6.0 million and could also apply contractual fines up to a total of US$10.0 million.
Classification 2020
US$’000 2019
US$’000
Not later than one year 12,401 51,919
Later than one year and not later than five years 112,274 80,102
Total 124,675 132,021
30. Related party transactions Significant shareholder Mercuria Energy Group Limited is the ultimate majority shareholder of the group. A relationship agreement is in place between the Company and certain Mercuria group companies. The relationship agreement has been put in place to protect the rights of minority shareholders and limits the control that Mercuria can exercise over the Group, primarily through restricting the number of Mercuria appointed directors on the board. Mercuria is also prevented from removing directors from the board. By maintaining a minority of Mercuria appointed directors on the board, those directors cannot carry a majority vote individually or in concert. The relationship agreement also requires directors nominated by Mercuria to excuse themselves from certain board decisions.
Transactions with owners On 22 October 2020 entered into an agreement with Mercuria Energy Limited, a subsidiary of the Mercuria group, pursuant to which the Company could surrender Company tax losses to Mercuria Energy Limited by way of group relief and receive as consideration 50% of the product of losses surrendered and the effective rate of tax. During 2020, the Company received US$ 2.8 million as consideration for losses surrendered under this agreement.
Subsidiaries Interests in subsidiaries are set out in note 4 to the Company financial statements.
Loan from Mercuria Group The loan from Mercuria at 31 December 2020 relates to a convertible rolling credit facility (‘RCF’) and non-convertible bridging facility ('BF') provided to the Group by Mercuria Energy Netherlands B.V., a subsidiary of the Mercuria Group.
As part of the business combination in 2017, Mercuria advanced a bridging and working capital facility to the Group for the amount of US$160.0 million. In February 2018, US$100.0 million of the original Mercuria facility was converted to equity of the Company at a price of £0.37 per share. At the same time the facility was restructured as a new convertible RCF in the amount of US$160.0 million with an additional US$100.0 million of new funds made available to the Company. In December 2018, Mercuria advanced an additional US$25.0 million as a Facility B element to the RCF. In February 2019, a further US$50.0 million was made available under this Facility B element. The original loan of US$160.0 million became Facility A.
In May 2019, the amended convertible RCF was further extended to add a Facility C commitment of US$40 million. Facility C was extended in November 2019 by an additional US$10.0 million and in March 2020 by an additional US$ 6 million.
At 31 December 2020, a total facility of US$291.0 million was available to the Company, with a total of US$281.0 million drawn down under the facility, with the undrawn balance of US$ 10 million made available through the BF, which was subsequently increased to US$ 11.5 million, with US$ 11.26 million drawn down at the year end.
All funds drawn down under the RCF and BF bear interest at three-month LIBOR+4%. The RCF provides for a grace period for repayments (interest and principal) from 1 January 2019 to 30 June 2021 with a maturity date of 31 December 2021 amortised in equal quarterly repayment instalments from and including 30 June 2021 until maturity. The BF, principal and interest, is repayable by 30 June 2021.
Phoenix Global Resources plc Annual Report and Accounts 202098

Phoenix Global Resources plc Annual Report and Accounts 2020 99
30. Related party transactions (continued) Loan from Mercuria Group (continued) Refer to note 22 for further details.
Analysis of amounts advanced and interest paid are shown in the table below:
Loan from Mercuria 2020
US$’000 2019
US$’000
Beginning of the year 293,533 182,009
Loans advanced 14,260 96,000
Interest charged 15,242 15,773
Interest paid (62) (249)
At 31 December 322,973 293,533
31. Loss per share
Basic and diluted loss per share 2020 US$
2019 US$
From continuing operations attributable to the ordinary equity holders of the Company (0.07) (0.04)
Total basic loss per share attributable to the ordinary equity holders of the Company (0.07) (0.04)
Basic and diluted loss per share 2020
US$’000 2019
US$’000
Loss attributable to the ordinary equity holders of the Company used in calculating basic earnings per share:
From continuing operations (197,024) (113,810)
(197,024) (113,810)
Weighted average number of shares used as the denominator
Number of shares 2020 ‘000
2019 ‘000
Adjustments for calculation of diluted earnings per share:
At 1 January 2,785,024 2,786,645
At 31 December 2,786,571 2,785,024
Potential dilutive ordinary shares 3,386 3,989
Weighted average number of shares used as the denominator in calculating diluted earnings per share 2,788,956 2,785,791
Governa
nceF
inancia
l statem
entsS
trateg
ic report
Phoenix Global Resources plc Annual Report and Accounts 2020 99

Notes to the consolidated financial statements continued
100 Phoenix Global Resources plc Annual Report and Accounts 2020
32. Cash used in operations
2020
US$’000 2019
US$’000
Loss for the year before taxation (235,029) (134,821)
Finance costs 16,916 19,361
Finance income (5,796) (824)
Accretion of discount on asset retirement obligation 764 846
Accretion of discount on lease obligation 152 62
Net unrealised exchange gains 1,386 3,862
Interest received on short term investments (462) –
Exploration cost written off 2,746 3,856
Impairment charge 171,129 7,557
Loss of disposal of non-current assets – 28,971
Loss on termination of licences – 20,196
Share-based payments 401 893
Depreciation and amortisation 41,346 66,057
Change in operating assets and liabilities:
Increase in inventories (147) (1,233)
Decrease/(increase) in trade and other receivables 12,341 (22,745)
(Decrease) in trade and other payables (12,120) (8,165)
Increase/(decrease) in provisions 55 (153)
Cash used in operations (6,318) (16,280)
33. Adjusted EBITDA The adjusted EBITDA is calculated as follows:
2020
US$’000 2019
US$’000
Loss for the year from continuing operations (197,024) (113,810)
Add: Depreciation, depletion and amortisation 41,346 66,057
Add: Finance costs (6,905) (1,577)
Add: Finance income 22,276 26,247
Add: Taxation (38,005) (21,011)
EBITDA (178,312) (44,094)
Non-recurring expenses:
Add: Loss on termination of licences and other impairment charge 171,129 27,753
Add: Loss on sale of non-current assets 6 28,971
Adjusted EBITDA (7,177) 12,630
34. Post balance sheet events Credit facilities On 31 January 2021, the non-convertible bridging facility provided by Mercuria was increased to US$20 million and subsequently further increased to US$21 million on 30 March 2021, to US$26 million on 12 April 2021, to US$31 million on 19 April 2021 and to US$41 million on 7 May 2021. The convertible facility grace period for repayments (interest and principal) was extended to 30 June 2021 with a loan maturity date of 31 December 2021 with the non-convertible bridging facility, principal and interest, repayable by 30 June 2021.
Phoenix Global Resources plc Annual Report and Accounts 2020100

Company Statement of Financial Position At 31 December 2020
Phoenix Global Resources plc Annual Report and Accounts 2020 101
Note 2020
US$’000 2019
US$’000
Non-current assets
Property, plant and equipment 5 63 204
Intangible assets 6 21,380 21,380
Investments in subsidiaries 4 427,980 894,759
Other receivables 8 141,305 132,772
Total non-current assets 590,728 1,049,115
Current assets
Cash and cash equivalents 9 21 3,539
Equity investments 7 467 1,303
Trade and other receivables 8 36,874 31,056
Total current assets 37,362 35,898
Total assets 628,090 1,085,013
Non-current liabilities
Trade and other payables 10 18,263 17,854
Borrowings 11 – 146,751
Provisions 17 1,060 –
Total non-current liabilities 19,323 164,605
Current liabilities
Trade and other payables 10 5,200 5,533
Income tax liability 524 600
Borrowings 11 322,973 146,782
Provisions 17 180 1,060
Total current liabilities 328,877 153,975
Total liabilities 348,200 318,580
Net assets 279,890 766,433
Equity
Share capital and share premium 14 457,183 456,734
Other reserves 329,155 329,155
Retained deficit (506,448) (19,456)
Total equity 279,890 766,433
The Company made a loss for the year of US$486.9 million (2019: US$ 184.5 million).
The above Company Statement of Financial Position should be read in conjunction with the accompanying notes. The financial statements on pages 101 to 115 were approved by the board of directors and authorised for issue on 17 May 2021 and were signed on its behalf by:
Sir Michael Rake Director Company registration number 05083946
Governa
nceF
inancia
l statem
entsS
trateg
ic report
Phoenix Global Resources plc Annual Report and Accounts 2020 101

Company Statement of Changes in Equity For the year ended 31 December 2020
102 Phoenix Global Resources plc Annual Report and Accounts 2020
Capital and reserves
Called up share capital
US$’000
Share premium US$’000
Treasury shares
US$’000
Retained earnings
US$’000
Other reserves
US$’000 Total equity
US$’000
At 1 January 2019 364,175 93,023 – 164,212 329,155 950,565
Loss for the year – – – (184,489) – (184,489)
Total comprehensive loss for the year – – – (184,489) – (184,489)
Purchase of own shares – – (572) – – (572)
Issue of employee share options – – 108 (126) – (18)
Cash settlement of employee share options – – – (154) – (154)
Fair value of share-based payments – – – 971 – 971
Fair value of warrants – – – 130 – 130
At 31 December 2019 364,175 93,023 (464) (19,456) 329,155 766,433
Loss for the year – – – (486,944) – (486,944)
Total comprehensive loss for the year – – – (486,944) – (486,944)
Issue of employee vested shares – – 449 (449) – –
Fair value of share-based payments – – – 401 – 401
At 31 December 2020 364,175 93,023 (15) (506,448) 329,155 279,890
Other reserves
Merger reserve
US$’000
Warrant reserve
US$’000
Translation reserve
US$’000
Deferred consideration
US$’000
Total other reserves
US$’000
At 1 January 2019 327,042 2,105 8 – 329,155
At 31 December 2019 327,042 2,105 8 – 329,155
At 31 December 2020 327,042 2,105 8 – 329,155
The above Company Statement of Changes in Equity should be read in conjunction with the accompanying notes.
Phoenix Global Resources plc Annual Report and Accounts 2020102

Company Statement of Cash Flows For the year ended 31 December 2020
Phoenix Global Resources plc Annual Report and Accounts 2020 103
Note 2020
US$’000 2019
US$’000
Cash flows from operating activities
Cash used in operations 13 (6,965) (108,595)
Net cash used in operating activities (6,965) (108,595)
Cash flows from investing activities
Investment in subsidiaries (10,660) –
Net cash outflow from investing activities (10,660) –
Cash flows from financing activities
Proceeds from borrowings 14,260 96,000
Interest paid (62) (368)
Interest received 8 67
Principle lease payments (90) (127)
Net cash inflow from financing activities 14,116 95,572
Net decrease in cash and cash equivalents (3,509) (13,023)
Cash and cash equivalents at the beginning of the financial year 3,539 16,601
Effects of exchange rates on cash and cash equivalents (9) (39)
Cash and cash equivalents at end of year 9 21 3,539
The above Company Statement of Cash Flows should be read in conjunction with the accompanying notes.
Governa
nceF
inancia
l statem
entsS
trateg
ic report
Phoenix Global Resources plc Annual Report and Accounts 2020 103

Notes to the company financial statements
104 Phoenix Global Resources plc Annual Report and Accounts 2020
1. Basis of preparation These Company financial statements have been prepared in accordance with international accounting standards in conformity with the requirements of the Companies Act 2006.
The Company applies consistent accounting policies to those applied by the Group. To the extent that an accounting policy is relevant to both Group and Company financial statements, refer to the Group financial statements for disclosure of the accounting policy. Material policies that apply to the Company only are included in these financial statements as appropriate.
The Company has used the exemption granted under section 408 of the Companies Act 2006 and accordingly has not presented its income statement. The loss attributable to the Company for the year ended 31 December 2020 was US$486.9 million (2019: US$184.5 million loss).
Going concern The Group principally generates cash from its existing conventional oil and gas production operations. Nevertheless, it was formed with the stated intention of undertaking a significant exploration, evaluation and development program focused on the Group’s unconventional oil and gas assets in Argentina, including the Vaca Muerta formation. To date, the funding required to support the activities of the Group has been provided by Mercuria.
2020 has been dominated by Covid-19 and its rapid development as a life-threatening global pandemic. Globally, respective governments’ response has been one of containment through lock-down, social distancing restrictions, quarantine and self-isolation for substantially all citizens, whilst countries strive to roll out vaccination programs. This has resulted in a significant adverse impact on industrial and commercial activity, which led to the shut-down of the Company’s production in April 2020. Consequently, the Company took significant steps to reduce its costs in all areas of the business. The directors believe these cost reduction actions mean the Company is in a better position to produce oil economically at lower oil prices with a positive contribution to cash flow at normalised production levels, which will allow the Company to focus on the continued development of its unconventional assets. This situation is compounded by the political and economic uncertainty in Argentina. The country is in its third straight year of recession and whilst it announced at the end of August 2020 that 99% of the holders of the country’s US$65 billion international bonds had agreed to restructure this debt discussions between the Argentine government and the IMF to reschedule US$45 billion of debt are ongoing and the outcome of the 2021 legislative elections in Argentina is uncertain.
Notwithstanding, our major shareholder, Mercuria continues to be supportive of the Company’s plans and continues to extend short-term debt facilities to fund operations. Mercuria has written to the Company stating its intention to continue to provide financial support to the Company in order that it may continue to operate and service its liabilities as they fall due in the next 12 months and also fund the planned work programs. Mercuria has also specifically agreed to not demand repayment of the existing loans (principal and interest) within the next 12 months whilst discussions with the Company to restructure these loans continue. This letter, which by its nature is not legally binding, represents a letter of comfort stating Mercuria’s current intention to continue to provide financial support.
The directors believe they will be able to agree the renegotiation of the existing debt with Mercuria and formalise an agreement for new funding and that the Group and Company can continue as a going concern for the foreseeable future. The application of the going concern basis of preparation of the financial statements included in this annual report is based on the letter that has been received from Mercuria and the ongoing discussion with the Mercuria principals. Accordingly, the directors continue to adopt the going concern basis for accounting in preparing the 2020 financial statements.
However, the directors recognise that if financial support over the next 12 months from Mercuria were not to be available and the Company is unable to restructure the existing loan agreements from Mercuria or obtain funding from alternative sources, this gives rise to a material uncertainty that may cast significant doubt on the Group’s and Company’s ability to continue as a going concern.
The financial statements do not include any adjustments that would be required if the Group and Company were unable to continue as a going concern.
Phoenix Global Resources plc Annual Report and Accounts 2020104

Phoenix Global Resources plc Annual Report and Accounts 2020 105
2. Critical accounting estimates and judgements Critical judgements Determination of functional currency The determination of a company’s functional currency can require significant judgement. Functional currency is defined as the currency of the primary economic environment in which the company operates, assessed on an entity-by-entity basis. In this regard the default assumption is that a company’s functional currency will be that in which it is registered or that where the majority of its operations are located.
This assumption can be challenged or rebutted where it can be demonstrated that a currency other than that of the country of registration or operations can be shown to have a greater influence over the revenue, costs, assets and liabilities of a company.
The Company receives the majority of its funding from Mercuria Energy Netherlands B.V., a subsidiary of the Mercuria group through a US Dollar denominated convertible rolling credit facility (‘RCF’).
As part of the business combination in 2017, Mercuria advanced a bridging and working capital facility to the Group for the amount of US$160.0 million. In February 2018, US$100.0 million of the original Mercuria facility was converted to equity of the Company at a price of £0.37 per share. At the same time the facility was restructured as a new convertible RCF in the amount of US$160.0 million with an additional US$100.0 million of new funds made available to the Company. In December 2018, Mercuria advanced an additional US$25.0 million as a Facility B element to the RCF. In February 2019, a further US$50.0 million was made available under this Facility B element. The original loan of US$160.0 million became Facility A.
In May 2019, the amended convertible RCF was further extended to add a Facility C commitment of US$40 million. Facility C was extended in November 2019 by an additional US$10.0 million and in March 2020 by an additional US$ 6 million.
At 31 December 2020, a total facility of US$291.0 million was available to the Company, with a total of US$281.0 million drawn down under the facility, with the undrawn balance of US$ 10 million made available through the BF, which was subsequently increased to US$ 11.5 million, with US$ 11.26 million drawn down at the year end.
The RCF predominately provides capex funding for the Group’s exploitation and development activities in Argentina. The Company transfers cash for operations to its subsidiaries in US Dollars.
As a result of the predominance of the US Dollar denominated funding, the functional currency of the Company is determined to be the US Dollar.
Critical estimates Carrying value of investments in subsidiaries The Company assesses its investments in subsidiaries for impairment where an indicator that the investment may be impaired exists. Indicators may include poorer operating performance than budgeted, a decrease in the volume of oil and gas reserves booked by operating subsidiaries or a decrease in the Company’s market capitalisation at period end.
Impairment evaluation is performed by comparing the carrying value of each investment to its recoverable amount, where the recoverable amount of an investment is determined as the higher of its fair value less costs to sell and its value in use. Assessment of the fair value of a subsidiary investment is often based on the expected future net cash flows of the development and production assets and the exploration and appraisal assets and licences which that subsidiary holds (its CGUs), or on the expected future net cash flows of the CGUs of the entities in which that subsidiary holds an investment.
The method used in this assessment review is based on management’s estimates and is consistent with that used to assess the potential impairment of the Group’s property, plant and equipment and intangible assets as detailed in notes 13 and 14 on pages 77 to 81.
At 31 December 2020, the Company performed an assessment of its investments to identify if any impairment indicators existed at the balance sheet date. Refer to note 4 on page 106 for full details.
Amounts due from subsidiary undertakings IFRS 9 ‘Financial Instruments’ (‘IFRS 9’) requires the Company to assess the carrying value of each of the amounts due from subsidiary undertakings in accordance with the expected credit losses impairment model.
Under the IFRS 9 model, the Company is required to assess both the repayment profile of the subsidiary loan and the credit risk of the associated subsidiary for each subsidiary loan held at the balance sheet date. Where the loan is determined to be repayable on demand, or the associated subsidiary is determined to have a high level of credit risk, then the expected credit losses of the subsidiary loan should be determined. In completing this assessment, if the subsidiary has sufficiently liquid assets to repay the loan, if demanded at the reporting date, the expected credit loss is determined to be immaterial. However, if the subsidiary cannot demonstrate the ability to repay the loan, if demanded at the reporting date, the Company has calculated an expected credit loss.
This credit loss calculation considers the loss given default of the amount due from subsidiary undertakings, which involves judgement around how loan amounts would likely be recovered, and over what timeframe they would be recovered. Despite this requirement, the Company does not intend to demand repayment of any amounts due from subsidiary undertakings in the near future.
Governa
nceF
inancia
l statem
entsS
trateg
ic report
Phoenix Global Resources plc Annual Report and Accounts 2020 105
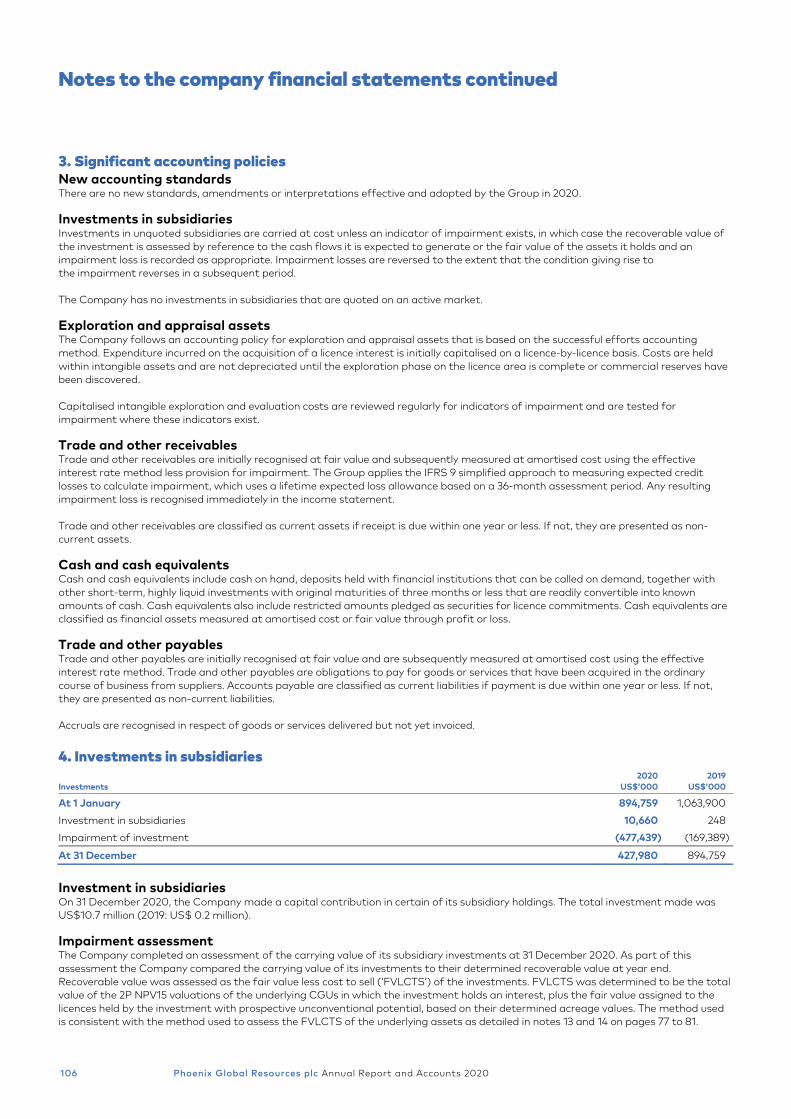
Notes to the company financial statements continued
106 Phoenix Global Resources plc Annual Report and Accounts 2020
3. Significant accounting policies New accounting standards There are no new standards, amendments or interpretations effective and adopted by the Group in 2020.
Investments in subsidiaries Investments in unquoted subsidiaries are carried at cost unless an indicator of impairment exists, in which case the recoverable value of the investment is assessed by reference to the cash flows it is expected to generate or the fair value of the assets it holds and an impairment loss is recorded as appropriate. Impairment losses are reversed to the extent that the condition giving rise to the impairment reverses in a subsequent period.
The Company has no investments in subsidiaries that are quoted on an active market.
Exploration and appraisal assets The Company follows an accounting policy for exploration and appraisal assets that is based on the successful efforts accounting method. Expenditure incurred on the acquisition of a licence interest is initially capitalised on a licence-by-licence basis. Costs are held within intangible assets and are not depreciated until the exploration phase on the licence area is complete or commercial reserves have been discovered.
Capitalised intangible exploration and evaluation costs are reviewed regularly for indicators of impairment and are tested for impairment where these indicators exist.
Trade and other receivables Trade and other receivables are initially recognised at fair value and subsequently measured at amortised cost using the effective interest rate method less provision for impairment. The Group applies the IFRS 9 simplified approach to measuring expected credit losses to calculate impairment, which uses a lifetime expected loss allowance based on a 36-month assessment period. Any resulting impairment loss is recognised immediately in the income statement.
Trade and other receivables are classified as current assets if receipt is due within one year or less. If not, they are presented as non-current assets.
Cash and cash equivalents Cash and cash equivalents include cash on hand, deposits held with financial institutions that can be called on demand, together with other short-term, highly liquid investments with original maturities of three months or less that are readily convertible into known amounts of cash. Cash equivalents also include restricted amounts pledged as securities for licence commitments. Cash equivalents are classified as financial assets measured at amortised cost or fair value through profit or loss.
Trade and other payables Trade and other payables are initially recognised at fair value and are subsequently measured at amortised cost using the effective interest rate method. Trade and other payables are obligations to pay for goods or services that have been acquired in the ordinary course of business from suppliers. Accounts payable are classified as current liabilities if payment is due within one year or less. If not, they are presented as non-current liabilities.
Accruals are recognised in respect of goods or services delivered but not yet invoiced.
4. Investments in subsidiaries
Investments 2020
US$’000 2019
US$’000
At 1 January 894,759 1,063,900
Investment in subsidiaries 10,660 248
Impairment of investment (477,439) (169,389)
At 31 December 427,980 894,759
Investment in subsidiaries On 31 December 2020, the Company made a capital contribution in certain of its subsidiary holdings. The total investment made was US$10.7 million (2019: US$ 0.2 million).
Impairment assessment The Company completed an assessment of the carrying value of its subsidiary investments at 31 December 2020. As part of this assessment the Company compared the carrying value of its investments to their determined recoverable value at year end. Recoverable value was assessed as the fair value less cost to sell (‘FVLCTS’) of the investments. FVLCTS was determined to be the total value of the 2P NPV15 valuations of the underlying CGUs in which the investment holds an interest, plus the fair value assigned to the licences held by the investment with prospective unconventional potential, based on their determined acreage values. The method used is consistent with the method used to assess the FVLCTS of the underlying assets as detailed in notes 13 and 14 on pages 77 to 81.
Phoenix Global Resources plc Annual Report and Accounts 2020106

Phoenix Global Resources plc Annual Report and Accounts 2020 107
4. Investments in subsidiaries (continued) The assessment completed by the Company identified that the carrying value of its investment in its subsidiaries was in excess of the determined FVLCTS of those subsidiaries at 31 December 2020. The carrying value of the Company’s investment in these subsidiaries was therefore written down to the assessed fair value of the respective subsidiary at 31 December 2020. This resulted in a US$477.4 million impairment loss being recorded as a loss of the year (2019: US$ 169.4 million).
Management carried out a sensitivity analysis to determine the impact of changes in the price and discount factor assumptions on this impairment charge. A +US$5/bbl/-US$5/bbl per annum price change reduced/increased the total impairment charge by approximately US$10.8 million and US$11.2 million respectively and -5%/+5% per annum change in the discount rate reduced/increased the total impairment charge by approximately US$14.8 million and US$10.9 million respectively.
At 31 December 2020, the Company had investments in the following subsidiaries, which have not changed since 31 December 2019. The principal activity of all companies relates to oil and gas exploration, development and production.
Principal activity Country of
incorporation
Proportion of issued shares controlled by
the Group
PGR Operating LLC Service company USA 100%
AEN Energy Holdings S.P.C. Dormant Cayman Is. 100%
AEN Energy Cayman Islands Ltd Dormant Cayman Is. 100%
Andes Energy LLC Dormant USA 100%
AEN Netherlands Cooperatief U.A. Intermediate holding company Netherlands 100%
Trefoil Holdings B.V. Intermediate holding company Netherlands 100%
San Enrique Petrolera B.V. Intermediate holding company Netherlands 100%
AEN Energy Latina, S.L. Dormant Spain 100%
Upstream Latino America S.A. Intermediate holding company Spain 99.96%
Trefoil (Switzerland) S.A. Intermediate holding company Switzerland 100%
Trefoil Limited Intermediate holding company Bermuda 100%
Trefoil GmbH Intermediate holding company Austria 100%
Petrolera El Trebol S.A. Oil and gas operations Argentina 100%
MSO Andes Energia S.A.U. Intermediate holding company/services Argentina 100%
Andes Oil S.A.U. Intermediate holding company Argentina 100%
Andes Oil and Gas S.A.U. Intermediate holding company Argentina 100%
Grecoil y Cia. S.A.U. Oil and gas operations Argentina 100%
AEN Energy Mendoza S.A. Intermediate holding company Argentina 100%
AEN Energy Argentina S.A. Intermediate holding company Argentina 100%
Patagonia Oil & Gas S.A. Intermediate holding company Argentina 100%
Andes Hidrocarburos S.A. Intermediate holding company Argentina 100%
Kilwer S.A. Oil and gas operations Argentina 100%
Ketsal S.A. Oil and gas operations Argentina 100%
CHPPC Andes S.R.L Oil and gas operations Argentina 100%
Integra Investment S.A. Intermediate holding company Argentina 100%
Andes Interoil Limited Intermediate holding company UK 100%
Andes Energia Limited Dormant UK 100%
Patagonia Oil & Gas Limited Dormant UK 100%
Patagonia Energy Limited Dormant UK 100%
5. Property, plant and equipment The property, plant and equipment balance of US$0.1 million (2019: US$0.2 million) relates to property leases, leasehold improvements, fixtures and fittings and office equipment. Depreciation is charged on a straight-line basis at rates that reflect the expected useful life of each asset category. Rates applied range between 20% and 35% per annum.
An amount of US$0.2 million was capitalised to property, plant and equipment on 1 January 2019 in relation to the right-of-use asset calculated on the adoption of IFRS 16 in the year. The asset will be depreciated on a straight-line basis over the life of the underlying lease contracts. Depreciation charged against the right-of-use asset in the year was US$0.1 million (2019: US$0.1 million).
Governa
nceF
inancia
l statem
entsS
trateg
ic report
Phoenix Global Resources plc Annual Report and Accounts 2020 107
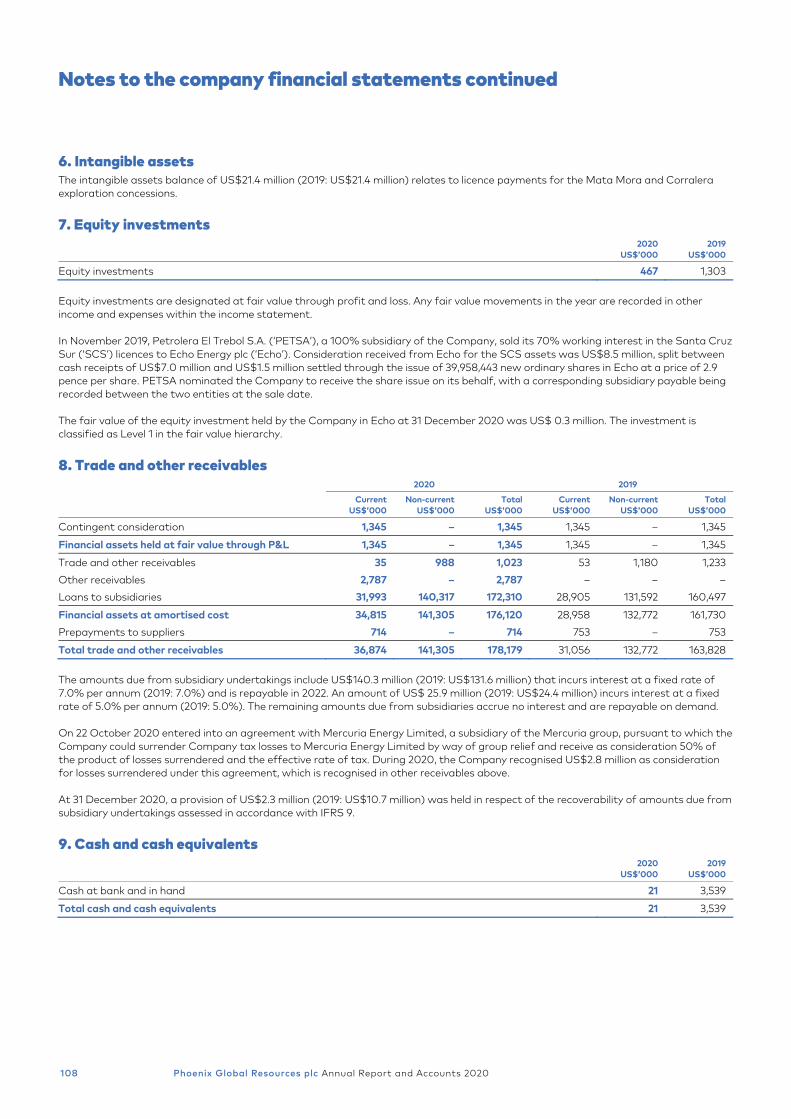
Notes to the company financial statements continued
108 Phoenix Global Resources plc Annual Report and Accounts 2020
6. Intangible assets The intangible assets balance of US$21.4 million (2019: US$21.4 million) relates to licence payments for the Mata Mora and Corralera exploration concessions.
7. Equity investments
2020
US$’000 2019
US$’000
Equity investments 467 1,303
Equity investments are designated at fair value through profit and loss. Any fair value movements in the year are recorded in other income and expenses within the income statement.
In November 2019, Petrolera El Trebol S.A. (‘PETSA’), a 100% subsidiary of the Company, sold its 70% working interest in the Santa Cruz Sur (‘SCS’) licences to Echo Energy plc (‘Echo’). Consideration received from Echo for the SCS assets was US$8.5 million, split between cash receipts of US$7.0 million and US$1.5 million settled through the issue of 39,958,443 new ordinary shares in Echo at a price of 2.9 pence per share. PETSA nominated the Company to receive the share issue on its behalf, with a corresponding subsidiary payable being recorded between the two entities at the sale date.
The fair value of the equity investment held by the Company in Echo at 31 December 2020 was US$ 0.3 million. The investment is classified as Level 1 in the fair value hierarchy.
8. Trade and other receivables 2020 2019
Current
US$’000 Non-current
US$’000 Total
US$’000 Current
US$’000 Non-current
US$’000 Total
US$’000
Contingent consideration 1,345 – 1,345 1,345 – 1,345
Financial assets held at fair value through P&L 1,345 – 1,345 1,345 – 1,345
Trade and other receivables 35 988 1,023 53 1,180 1,233
Other receivables 2,787 – 2,787 – – –
Loans to subsidiaries 31,993 140,317 172,310 28,905 131,592 160,497
Financial assets at amortised cost 34,815 141,305 176,120 28,958 132,772 161,730
Prepayments to suppliers 714 – 714 753 – 753
Total trade and other receivables 36,874 141,305 178,179 31,056 132,772 163,828
The amounts due from subsidiary undertakings include US$140.3 million (2019: US$131.6 million) that incurs interest at a fixed rate of 7.0% per annum (2019: 7.0%) and is repayable in 2022. An amount of US$ 25.9 million (2019: US$24.4 million) incurs interest at a fixed rate of 5.0% per annum (2019: 5.0%). The remaining amounts due from subsidiaries accrue no interest and are repayable on demand.
On 22 October 2020 entered into an agreement with Mercuria Energy Limited, a subsidiary of the Mercuria group, pursuant to which the Company could surrender Company tax losses to Mercuria Energy Limited by way of group relief and receive as consideration 50% of the product of losses surrendered and the effective rate of tax. During 2020, the Company recognised US$2.8 million as consideration for losses surrendered under this agreement, which is recognised in other receivables above.
At 31 December 2020, a provision of US$2.3 million (2019: US$10.7 million) was held in respect of the recoverability of amounts due from subsidiary undertakings assessed in accordance with IFRS 9.
9. Cash and cash equivalents
2020
US$’000 2019
US$’000
Cash at bank and in hand 21 3,539
Total cash and cash equivalents 21 3,539
Phoenix Global Resources plc Annual Report and Accounts 2020108

Phoenix Global Resources plc Annual Report and Accounts 2020 109
10. Trade and other payables 2020 2019
Current
US$’000 Non-current
US$’000 Total
US$’000 Current
US$’000 Non-current
US$’000 Total
US$’000
Trade payables 1,459 – 1,459 1,634 – 1,634
Employee costs, social security and other taxes 314 – 314 386 – 386
Operating lease obligation 5 – 5 86 – 86
Loans from subsidiaries – 18,263 18,263 – 17,854 17,854
Other payables 3,422 – 3,422 3,427 – 3,427
Total trade and other payables 5,200 18,263 23,463 5,533 17,854 23,387
All balances held within trade and other payables are held at amortised cost.
11. Borrowings 2020 2019
Current
US$’000 Non-current
US$’000 Total
US$’000 Current
US$’000 Non-current
US$’000 Total
US$’000
Loans from related parties 322,973 – 322,973 146,782 146,751 293,533
Total borrowings 322,973 – 322,973 146,782 146,751 293,533
The loan balance at 31 December 2020 relates to amounts drawn down under the convertible RCF and non-convertible BF provided by Mercuria. The RCF and BF bears interest at a rate of 4% over three-month LIBOR (2019: 4% over three-month LIBOR) with maturity dates of 31 December 2021 and 30 June 2021, respectively. See note 22 for full details.
12. Related party balances Related party balances relate to loans received from the major shareholder and loans advanced to and receivable from subsidiaries. Amounts outstanding at 31 December include:
2020
US$’000 2019*
US$’000
Related party loans receivable
Amounts advanced to subsidiaries 172,310 160,497
Total related party receivables 172,310 160,497
Related party loans payable
Shareholder loan 292,260 278,000
Interest accrued on shareholder loan 30,713 15.533
Amounts payable to subsidiaries and interest accrued 14,096 17,854
Total related party payables 337,069 311,387
* Re-classified shareholder loan (2019: US$293.50 million) and interest accrued on shareholder loan (2019: US$0.03 million) consistent with 2020 disclosure for loan principal and capitalised interest
The related party loan at 31 December 2020 relates to a convertible RCF and a non-convertible BF provided to the Group by Mercuria Energy Netherlands B.V., a subsidiary of the Mercuria group.
Governa
nceF
inancia
l statem
entsS
trateg
ic report
Phoenix Global Resources plc Annual Report and Accounts 2020 109

Notes to the company financial statements continued
110 Phoenix Global Resources plc Annual Report and Accounts 2020
12. Related party balances (continued) As part of the business combination in 2017, Mercuria advanced a bridging and working capital facility to the Group for the amount of US$160.0 million. In February 2018, US$100.0 million of the facility was converted to equity of the Company at a price of £0.37 per share. At the same time the facility was restructured as a new convertible RCF in the amount of US$160.0 million with an additional US$100.0 million of new funds made available to the Company. In December 2018, Mercuria advanced an additional US$25.0 million as a Facility B element to the RCF. In February 2019, a further US$50.0 million was made available under this Facility B element. The original loan of US$160.0 million became Facility A.
In May 2019, the amended convertible RCF was further extended to add a Facility C commitment of US$40 million. Facility C was extended in November 2019 by an additional US$10.0 million and in March 2020 by an additional US$ 6 million.
At 31 December 2020, a total facility of US$291.0 million was available to the Company, with a total of US$281.0 million drawn down under the facility, with the undrawn balance of US$ 10 million made available through the BF, which was subsequently increased to US$ 11.5 million, with US$ 11.26 million drawn down at the year end.
All funds drawn down under the RCF and BF bear interest at three-month LIBOR+4%. The RCF provides for a grace period for repayments (interest and principal) from 1 January 2019 to 30 June 2021 with a maturity date of 31 December 2021 amortised in equal quarterly repayment instalments from and including 30 June 2021 until maturity. The BF, principal and interest, is repayable by 30 June 2021.
Mercuria Group has the right to convert all or part of the outstanding principal of Facility A into additional new ordinary shares of the Company at a price of £0.45 per share. This conversion right can be exercised at any time from 30 June 2018 until 10 business days prior to the maturity of Facility A. A similar conversion feature exists in relation to Facility B at a price of £0.28 per share exercisable from 30 June 2019 until 10 business days prior to the maturity date and in relation to Facility C at a price of £0.23 per share exercisable from 30 June 2020 until 10 business days prior to the maturity date.
The amounts advanced to subsidiaries consist of amounts advanced for working capital purposes that have no fixed repayment dates and no interest burden. The balance also includes three interest bearing loans to subsidiaries. The primary interest bearing loan relates to a US$90.9 million (2019: US$ 85.2 million) facility advanced to Petrolera el Trebol that carries an interest rate of 7.0% and is repayable in 2022.
Transactions with related parties during the year Group Relief Agreement On 22 October 2020 entered into an agreement with Mercuria Energy Limited, a subsidiary of the Mercuria group, pursuant to which the Company could surrender Company tax losses to Mercuria Energy Limited by way of group relief and receive as consideration 50% of the product of losses surrendered and the effective rate of tax. During 2020, the Company recognised US$ 2.8 million as consideration for losses surrendered under this agreement.
Key management compensation See note 12 on page 77.
13. Cash used in operations
2020
US$’000 2019
US$’000
Loss for the year before taxation (484,156) (184,489)
Depreciation 141 190
Impairment of investments and other non-current assets 479,723 169,389
Finance costs 16,096 17,728
Finance income (283) (7,569)
Share-based payments 401 434
Increase in trade and other receivable (20,297) (101,522)
Increase in provisions 180 19
Increase/(decrease) in trade and other payables 216 (3,543)
Net unrealised exchange gains 1,014 768
Cash used in operations (6,965) (108,595)
Phoenix Global Resources plc Annual Report and Accounts 2020110

Phoenix Global Resources plc Annual Report and Accounts 2020 111
14. Called up share capital The Company’s share capital consists of one class of ordinary share. Each ordinary share carries an equal voting right and right to a dividend.
2020 2019
Ordinary shares of 10 pence No. ’000 US$’000 No. ‘000 US$’000
Allotted, called up and fully paid 2,786,571 364,160 2,785,024 363,711
Held in treasury 74 15 1,621 464
Total ordinary shares of 10 pence 2,786,645 364,175 2,786,645 364,175
Movements in ordinary shares:
2020 2019
No. ’000 US$’000 No. ’000 US$’000
At 1 January 2,786,645 364,175 2,786,645 364,175
At 31 December 2,786,645 364,175 2,786,645 364,175
Treasury shares On 26 June 2019, the Company purchased 2,000,000 of its own ordinary shares with a nominal value of £0.10 per share in accordance with the authority to make an off-market purchase of shares granted to it by shareholders of the Company at the annual general meeting held on 25 June 2019. These acquired shares were held in treasury from acquisition.
On 18 July 2019, the Company transferred 378,928 of the ordinary shares held in treasury to certain participants in the Company’s deferred bonus plan.
On 24 August 2020, the Company transferred from treasury 1,350,570 of the ordinary shares held in treasury to certain participants in the Company’s deferred bonus plan and 196,580 of the ordinary shares directly to certain participants in the Company’s deferred bonus plan.
At 31 December 2020, the total ordinary shares held in treasury was 73,922 shares.
15. Employee benefits 15.1 Staff costs As permitted by section 408 of the Companies Act 2006, no separate profit and loss account or statement of comprehensive income is presented in respect of the Company. The loss attributable to the Company is disclosed in the footnote to the Company’s balance sheet.
The auditors' remuneration for audit and other services is disclosed in note 11 to the consolidated financial statements.
The average monthly number of employees (including executive directors) during the year was three (2019: four).
Staff costs 2020
US$’000 2019
US$’000
Wages and salaries 1,134 1,742
Social security costs 82 135
Other benefits 37 62
Share-based payments 244 434
1,497 2,373
Staff costs incurred include fees paid to seven of the non-executive directors for services provided to the Company. Detailed remuneration disclosures are provided in the annual report on remuneration on pages 44 to 46.
Governa
nceF
inancia
l statem
entsS
trateg
ic report
Phoenix Global Resources plc Annual Report and Accounts 2020 111

Notes to the company financial statements continued
112 Phoenix Global Resources plc Annual Report and Accounts 2020
15. Employee benefits (continued) 15.2 Share-based payments The Group has a Long Term Incentive Plan (‘LTIP’) for directors and a Deferred Bonus Plan (‘DBP’) for management.
For the year ended 31 December 2020, the total cost recognised by the Company for equity-settled share-based payment transactions is US$0.4 million (2019: US$1.1 million). A charge of US$0.5 million (2019: US$0.1 million) has been recorded in retained earnings for all equity-settled payments of the Company in the year.
Details of the various share incentive plans currently in operation are set out below:
Long Term Incentive Plan Under the LTIP, directors can be granted nil cost share awards that vest over three years following grant provided the individual remains in employment. Share awards must be held for two years after vesting. The size of awards under the plan depends on the calculation of Total Shareholder Return (‘TSR’) over the three-year period from the grant date, which is measured 50% on an absolute basis and 50% relative to a group of listed industry comparators. There are no other post-grant performance conditions. No dividends are paid over the vesting period. Refer to the annual report on remuneration on pages 44 to 46.
The following table details the weighted average fair value (‘WA FV’) of awards granted and the assumptions used in the fair value expense calculations. The weighted average remaining contractual life for LTIP awards outstanding at 31 December 2020 was 0.6 years (2019: 1.6 years). The number of share awards expected to vest was reduced by 4.2 million shares in 2020 (2019: 10.0 million) following the resignation of certain directors and performance conditions not being met.
LTIP
WA share price
at grant (pence)
WA FV of awards granted (pence)
Share awards outstanding at 1 January 2020 7,083,684 22.82 8.93
Shares that lapsed in 2020 (4,154,252)
Share awards outstanding at 31 December 2020 2,929,432 23.5 14.95
Key assumptions:
Grant date 2018
Vesting 3 years
Risk free rate of interest 0.93%
PGR TSR Volatility 49%
Comparator TSR Volatility 28%
Deferred Bonus Plan The Company has a DBP through which management is eligible to be granted nil exercise price options as part of their annual bonus. These are exercisable three years following grant. An individual must normally remain in employment for three years from grant for the shares to vest. Awards are not subject to post-grant performance conditions and no dividends are paid over the vesting period.
No awards were granted under the DBP in 2020 (2019: none). The details of the plans in issue at 31 December 2020 are presented in the table below.
2020
FY18 DBP FY17 DBP
Share awards outstanding at 1 January 2020 1,772,358 2,216,928
Shares vested during the year (590,781) (1,108,478)
Share awards outstanding at 31 December 2020 1,181,577 1,108,450
At 31 December
Price at grant date 16.67 18.05
Weighted average remaining contractual life (years) 0.9 0.5
Phoenix Global Resources plc Annual Report and Accounts 2020112

Phoenix Global Resources plc Annual Report and Accounts 2020 113
15. Employee benefits (continued) 15.3 Warrants Warrants – non-share-based payments Details of warrants granted that are not accounted for as share=-based payments are as follows:
1 January 2020
No. Grant
No. Lapsed
No.
31 December 2020
No.
Exercise price
pence
August 2013 – August 2020 10,454,545 – (10,454,545) – 40.0
Movements during the year, together with their associated weighted average exercise price, are as follows:
2020 2019
No. (‘000) WAEP (p) No. (‘000) WAEP (p)
At 1 January 10,454,545 40.0 24,414,915 32.0
Granted – – – –
Exercised – – – –
Lapsed (10,454,545) 40.0 (13,960,370) 26.0
Outstanding at 31 December – 10,454,545
Exercisable at 31 December – 10,454,545
Warrants – share-based payments Details of warrants that are accounted for as share-based payments are as follows:
1 January 2020
No. Grant
No. Lapsed
No.
31 December 2020
No.
Exercise price
pence
November 2013 – November 2020 9,090,909 – (9,090,909) – 40.0
Movements during the year, together with their associated weighted average exercise price, are as follows:
2020 2019
No. ‘000 WAEP (p) No. ‘000 WAEP (p)
At 1 January 9,090,909 40.0 29,372,182 49.7
Granted – – – –
Exercised – – – –
Lapsed (9,090,909) 40.0 (20,281,273) 54.0
Outstanding at 31 December – 9,090,909
Exercisable at 31 December – 9,090,909
The fair value of the warrants accounted for as share-based payments was calculated using the Black-Scholes model. The estimated fair value of options accounted for as share-based payments and the model inputs used to calculate those fair values are as follows:
Date of grant Number
Estimated fair value
pence
Share price at date of
agreement pence
Exercise price
pence
Expected volatility
%
Expected life
Years
Risk free rate
%
Expected dividends
%
November 2013 2,000,000 10 22.50 40 53 5.83 1.80 –
1 January Grant Lapsed 31 December Exercise price
pence Exercise date
Others 2,000,000 – (2,000,000) – 40.0 2020
Governa
nceF
inancia
l statem
entsS
trateg
ic report
Phoenix Global Resources plc Annual Report and Accounts 2020 113

Notes to the company financial statements continued
114 Phoenix Global Resources plc Annual Report and Accounts 2020
16. Financial risk management Where equivalent disclosures for the requirements of IFRS 7 ‘Financial Instruments: Disclosures’ and IFRS 13 ‘Fair Value Measurements’ have been included in the consolidated financial statements of the Group, the Company has adopted the disclosure exemptions available to the Company’s financial statements.
The Company’s exposure to financial risks and how those risks could affect the Group’s future financial performance is summarised below.
Risk Exposure arising from Measurement Management
Market risk – foreign exchange
Future commercial transactions
Cash flow forecasting and budgeting
The majority of the Company’s cash is held in US Dollars. The Company draws progressively on available facilities as cash is needed to fund operating subsidiaries.
Financial assets and liabilities recognised in the balance sheet that are not denominated in US Dollars
Sensitivity analysis Due to the influence of the US Dollar on the Company and the level of funding obtained in US Dollars, the US Dollar has been determined to be the functional currency of the Company. This determination also reduces the exposure to foreign exchange gains and losses.
Market risk – interest rate
Long-term borrowings held at variable rates
Sensitivity analysis The Company has a treasury management function and monitors interest rate movements.
Liquidity risk Borrowings and other liabilities
Rolling cash flow forecasts
The Company maintains an active treasury management function.
Market risk – cash flow and fair value interest rate risk The Company’s main interest rate risk arises from long-term borrowings with floating interest rates that expose the Group to interest rate risk. The Company’s functional currency is the US Dollar and it only holds US Dollar denominated debt, therefore it is not exposed to exchange rate risk.
The Group does not currently use swap instruments or other derivatives to manage its interest rate risk exposure.
The exposure of the Group’s borrowings to interest rate changes at the end of the reporting period were as follows:
2020
US$’000
% of total loans
US$’000 2019
US$’000
% of total loans
US$’000
Variable rate borrowings 322,973 100 293,533 100
Impact on post-tax
profit and loss Impact on other
components of equity
2020
US$’000 2019
US$’000 2020
US$’000 2019
US$’000
Interest rate increase by 100 basis points 3,122 2,935 – –
Interest rate decrease by 100 basis points 3,122 (2,935) – –
Phoenix Global Resources plc Annual Report and Accounts 2020114

Phoenix Global Resources plc Annual Report and Accounts 2020 115
17. Provisions 2020 2019
Current
US$’000 Non-current
US$’000 Total
US$’000 Current
US$’000 Total
US$’000
Legal claims – 1,060 1,060 1,060 1,060
Other provisions 180 – 180 – –
Total 180 1,060 1,240 1,060 1,060
As part of the accounting for the business combination in 2017, provisions were established for certain legal contingencies. An amount of US$1.1 million was provided for in the entity AEA S.A. When AEA S.A. was sold to OES in 2018 by the Company, the terms of the SPA stated that the potential claim would remain the responsibility of PGR plc and consequently, the prior provision held was brought into the Company financial statements.
The Company does not have any significant commitments or contingencies.
18. Post balance sheet events Credit facilities On 31 January 2021, the non-convertible bridging facility provided by Mercuria was increased to US$20 million and subsequently further increased to US$21 million on 30 March 2021, to US$26 million on 12 April 2021, to US$31 million on 19 April 2021 and to US$41 million on 7 May 2021. The convertible facility grace period for repayments (interest and principal) was extended to 30 June 2021 with a loan maturity date of 31 December 2021 with the non-convertible bridging facility, principal and interest, repayable by 30 June 2021.
Governa
nceF
inancia
l statem
entsS
trateg
ic report
Phoenix Global Resources plc Annual Report and Accounts 2020 115

Shareholder information
116 Phoenix Global Resources plc Annual Report and Accounts 2020
Glossary
Mm3 Thousand cubic metres
MMbtu Million British thermal units
MMcf Million standard cubic feet
Tcf Trillion cubic feet
bbl Barrel
boe Barrel of oil equivalent
boepd Barrel of oil equivalent per day
Bn Billion
MM Million
LNG Liquefied natural gas
WTI West Texas Intermediate crude
WI Working interest
Opex Operating expenses
Capex Capital expenditure
1P Proved reserves
2P Proved plus probable reserves
3P Proved plus probable plus possible reserves
HSE Health, safety and the environment
KPI Key performance indicator
Adjusted EBITDA Earnings before interest, taxes, depreciation, amortization and non-recurring expenses
CGU Cash generating unit
bopd Barrels of oil per day
mscfpd thousand standard cubic feet per day
Phoenix Global Resources plc Annual Report and Accounts 2020116

Phoenix Global Resources plc Annual Report and Accounts 2020 117
Registered offices The registered offices of the Group’s subsidiaries are as follows:
Company Registered address
PGR Operating LLC 20 Greenway Plaza, Suite 1075, Houston, Texas 77046-2011, USA
AEN Energy Holdings S.P.C. PO Box 309, Ugland House, Grand Cayman, KY1-1104, Cayman Islands
AEN Energy Cayman Islands Ltd PO Box 309, Ugland House, Grand Cayman, KY1-1104, Cayman Islands
AEN Netherlands Cooperatief U.A. Prins Bernhardplein 200, 1097JB Amsterdam, Netherlands
Trefoil Holdings B.V. Euclideslaan 131, 3584 BR Utrecht, Netherlands
San Enrique Petrolera B.V. Euclideslaan 131, 3584 BR Utrecht, Netherlands
AEN Energy Latina, S.L. Calle Hermosilla 11, 4th Piso, Madrid, Spain
Upstream Latino America S.L. Calle Velazquez 61, Madrid 28001, Spain
Trefoil (Switzerland) S.A. Rue Du Rhône 50, 1204 Geneva, Switzerland
Trefoil Limited Clarendon House, 2 Church Street, Hamilton, HM 11, Bermuda
Trefoil GmbH Schubertring 6, 1010 Vienna, Austria
Petrolera El Trebol S.A. Suipacha 1111, 18th Floor, Ciudad Autonoma de Buenos Aires, Argentina
AEN Energy Argentina S.A. Tiburcio Benegas 843, Mendoza, Argentina
MSO Andes Energia Argentina S.A.U. Suipacha 1111, 18th Floor, Ciudad Autonoma de Buenos Aires, Argentina
Andes Oil S.A.U. Suipacha 1111, 18th Floor, Ciudad Autonoma de Buenos Aires, Argentina
Andes Oil and Gas S.A.U. Suipacha 1111, 18th Floor, Ciudad Autonoma de Buenos Aires, Argentina
Grecoil y Cia. S.A.U. Ceibo Building , 8th Floor, Provincial Route N° 82, Km 54, Luján de Cuyo, Mendoza
AEN Energy Mendoza S.A. Tiburcio Benegas 843, Ciudad de Mendoza, Mendoza, Argentina
Patagonia Oil & Gas S.A. Maipu 1252, Piso 6, Ciudad Autonoma de Buenos Aires, Argentina
Andes Hidrocarburos Investments S.A. Suipacha 1111, 18th Floor, Ciudad Autonoma de Buenos Aires, Argentina
Kilwer S.A. Suipacha 1111, 18th Floor, Ciudad Autonoma de Buenos Aires, Argentina
Ketsal S.A. Ceibo Building , 8th Floor, Provincial Route N° 82, Km 54, Luján de Cuyo, Mendoza
CHPPC Andes S.R.L Suipacha 1111, 18th Floor, Ciudad Autonoma de Buenos Aires, Argentina
Integra Investment S.A. Maipu 1252, Piso 6 Ciudad Autonoma de Buenos Aires, Argentina
Andes Interoil Limited 6th Floor, King’s House, 10 Haymarket, London SW1Y 4BP
Andes Energia Limited 6th Floor, King’s House, 10 Haymarket, London SW1Y 4BP
Patagonia Oil & Gas Limited 6th Floor, King’s House, 10 Haymarket, London SW1Y 4BP
Patagonia Energy Limited 6th Floor, King’s House, 10 Haymarket, London SW1Y 4BP
Governa
nceF
inancia
l statem
entsS
trateg
ic report
Phoenix Global Resources plc Annual Report and Accounts 2020 117

Shareholder information
118 Phoenix Global Resources plc Annual Report and Accounts 2020
Officers and advisers Directors
Sir Michael Rake Non-executive chairman
John Bentley Non-executive director (independent)
Martin Bachmann Non-executive director (independent)
Tim Harrington Non-executive director
Daniel Jaeggi Non-executive director
Nicolás Mallo Huergo Non-executive director
Nigel Duxbury Company secretary
Registered address and corporate office 6th Floor King’s House 10 Haymarket London SW1Y 4BP
Company number 05083946
Offices Buenos Aires Torre Alem Plaza 3rd Floor Av. Leandro N. Alem 855 Buenos Aires 6023 Argentina
Mendoza Ceibo Building, 8th Floor Chacras Park Ruta Porvincial No. 82, Km 54 Luján de Cuyo Mendoza (5505) Argentina
Houston 20 Greenway Plaza Suite 1075 Houston Texas 77046-2011 USA
Phoenix Global Resources plc Annual Report and Accounts 2020118

119 Phoenix Global Resources plc Annual Report and Accounts 2020
Nominated adviser and joint broker Shore Capital and Corporate Limited Cassini House, 57-58 St James Street London SW1A 1LD
Joint broker Panmure Gordon One New Change London EC4M 9AF
Financial PR Camarco 107 Cheapside London EC2V 6DN
Independent auditors PricewaterhouseCoopers LLP 1 Embankment Place London WC2N 6RH
Solicitor Herbert Smith Freehills LLP Exchange House Primrose Street London EC2A 2EG
Registrars Share Registrars The Courtyard 17 West Street Farnham Surrey GU9 7DR
Phoenix Global Resources plc 6th Floor, King’s House 10 Haymarket London SW1Y 4BP United Kingdom
Tel: +44 (0) 20 3912 2800 [email protected]
Governa
nceF
inancia
l statem
entsS
trateg
ic report
Phoenix Global Resources plc Annual Report and Accounts 2020 119

Phoenix Global Resources plc Annual Report and Accounts 2020120

Consultancy, design and productionwww.luminous.co.uk
Design and productionwww.luminous.co.uk
Both the paper manufacturer and printer are Forest Stewardship Council® (FSC) chain-of-custody certified.

Phoenix Global Resources plc 6th Floor, King’s House 10 Haymarket London SW1Y 4BP United Kingdom
Tel: +44 (0) 20 3912 2800 [email protected]
Phoenix G
lobal Resources plc A
nn
ual R
eport a
nd
Accounts 20
20