phosphate fertilizers from morocco and russia
TRANSCRIPT

Phosphate Fertilizers from
Morocco and Russia
Investigation Nos. 701-TA-650-651 (Final)
Publication 5172 March 2021
U.S. International Trade Commission
Washington, DC 20436
U.S. International Trade Commission
COMMISSIONERS
Jason E. Kearns, Chair Randolph J. Stayin, Vice Chair
David S. Johanson Rhonda K. Schmidtlein
Amy A. Karpel
Catherine Defilippo Director of Operations
Staff assigned
Calvin Chang, Investigator Raymond Cantrell, Industry Analyst
Andrew Knipe, Economist Emily Kim, Accountant
Edward Logsdail, Statistician Jane Dempsey, Attorney
Nathanael Comly, Supervisory Investigator
Special Assistance from
Cindy Cohen, Economist
Address all communications to Secretary to the Commission
United States International Trade Commission Washington, DC 20436
U.S. International Trade Commission
Washington, DC 20436
www.usitc.gov
Phosphate Fertilizers from
Morocco and Russia
Investigation Nos. 701-TA-650-651 (Final)
Publication 5172 March 2021

CONTENTS Page
i
Determinations ............................................................................................................................... 1 Views of the Commission ............................................................................................................... 3
Dissenting Views of Commissioner David S. Johanson ............................................................... 45
Introduction .............................................................................................................. I-1
Background ................................................................................................................................ I-1
Statutory criteria ....................................................................................................................... I-2
Organization of report ............................................................................................................... I-3
Market summary ....................................................................................................................... I-3
Summary data and data sources ............................................................................................... I-4
Previous and related investigations .......................................................................................... I-4
Nature and extent of subsidies ................................................................................................. I-4
The subject merchandise .......................................................................................................... I-6
Commerce’s scope ................................................................................................................ I-6
Tariff treatment ..................................................................................................................... I-8
The product ............................................................................................................................... I-8
Description and applications ................................................................................................. I-8
Manufacturing processes .................................................................................................... I-11
Domestic like product issues ................................................................................................... I-15
Part II: Conditions of competition in the U.S. market........................................................... II-1
U.S. market characteristics....................................................................................................... II-1
U.S. purchasers ......................................................................................................................... II-2
Channels of distribution ........................................................................................................... II-3
Geographic distribution ........................................................................................................... II-5
Supply and demand considerations ......................................................................................... II-5
U.S. supply ............................................................................................................................ II-5
U.S. demand ....................................................................................................................... II-11
Substitutability issues ............................................................................................................. II-17
Lead times .......................................................................................................................... II-17
CONTENTS Page
ii
Knowledge of country sources ........................................................................................... II-17
Factors affecting purchasing decisions............................................................................... II-18
Comparisons of domestic products, subject imports, and nonsubject imports ................ II-24
Comparison of U.S.-produced and imported phosphate fertilizers ................................... II-26
Elasticity estimates ................................................................................................................. II-30
U.S. supply elasticity ........................................................................................................... II-30
U.S. demand elasticity ........................................................................................................ II-30
Substitution elasticity ......................................................................................................... II-31
Part III: U.S. producers’ production, shipments, and employment ...................................... III-1
U.S. producers ......................................................................................................................... III-1
U.S. production, capacity, and capacity utilization ................................................................. III-5
Alternative products ............................................................................................................ III-8
U.S. producers’ U.S. shipments and exports ........................................................................... III-9
U.S. producers’ inventories ................................................................................................... III-12
U.S. producers’ imports and purchases ................................................................................ III-13
U.S. employment, wages, and productivity .......................................................................... III-14
Part IV: U.S. imports, apparent U.S. consumption, and market shares ............................... IV-1
U.S. importers.......................................................................................................................... IV-1
U.S. imports ............................................................................................................................. IV-2
Negligibility .............................................................................................................................. IV-8
Cumulation considerations ..................................................................................................... IV-9
Fungibility ............................................................................................................................ IV-9
Geographical markets ....................................................................................................... IV-11
Presence in the market ..................................................................................................... IV-12
Apparent U.S. consumption .................................................................................................. IV-16
U.S. market shares ................................................................................................................ IV-18
Part V: Pricing data ............................................................................................................. V-1
Factors affecting prices ............................................................................................................ V-1

CONTENTS Page
iii
Raw material costs ............................................................................................................... V-1
Transportation costs to the U.S. market .............................................................................. V-3
U.S. inland transportation modes and costs ........................................................................ V-4
Pricing practices ....................................................................................................................... V-4
Pricing methods .................................................................................................................... V-4
Types of sale ......................................................................................................................... V-7
Sales terms and discounts .................................................................................................... V-8
Price leadership .................................................................................................................... V-8
Price data .................................................................................................................................. V-9
Price trends ......................................................................................................................... V-17
Price comparisons .............................................................................................................. V-21
Lost sales and lost revenue .................................................................................................... V-21
Part VI: Financial experience of U.S. producers .................................................................. VI-1
Background .............................................................................................................................. VI-1
Operations on phosphate fertilizers ....................................................................................... VI-1
Net sales .............................................................................................................................. VI-7
Cost of goods sold and gross profit or loss .......................................................................... VI-8
SG&A expenses and operating income or loss .................................................................. VI-10
Other expenses and net income or loss ............................................................................ VI-10
Variance analysis ............................................................................................................... VI-12
Capital expenditures and research and development expenses .......................................... VI-13
Assets and return on assets .................................................................................................. VI-14
Capital and investment ......................................................................................................... VI-15
Threat considerations and information on nonsubject countries .......................... VII-1
The industry in Morocco ........................................................................................................ VII-3
Changes in operations ........................................................................................................ VII-3
Operations on phosphate fertilizers................................................................................... VII-5
Alternative products ........................................................................................................... VII-7
CONTENTS Page
iv
Exports ................................................................................................................................ VII-7
The industry in Russia .......................................................................................................... VII-10
Changes in operations ...................................................................................................... VII-11
Operations on phosphate fertilizers................................................................................. VII-11
Alternative products ......................................................................................................... VII-14
Exports .............................................................................................................................. VII-15
Subject countries combined ................................................................................................. VII-16
U.S. inventories of imported merchandise .......................................................................... VII-18
U.S. importers’ outstanding orders ...................................................................................... VII-20
Antidumping or countervailing duty orders in third-country markets ................................ VII-20
Information on nonsubject countries .................................................................................. VII-21
Appendixes
A. Federal Register notices .................................................................................................. A-1
B. List of hearing witnesses ................................................................................................. B-1
C. Summary data ................................................................................................................. C-1
D. U.S. producers’ and U.S. importers’ end-of-period inventories by quarter ................... D-1
E. U.S. producers’ and U.S. importers’ U.S. shipments by product type ............................ E-1
F. Unit values and quantities of DAP and MAP imported into NOLA from Morocco, Russia, and Saudi Arabia ................................................................................................. F-1
Note.—Information that would reveal confidential operations of individual concerns may not be published. Such information is identified by brackets in confidential reports and is deleted and replaced with asterisks (***) in public reports.
UNITED STATES INTERNATIONAL TRADE COMMISSION
Investigation Nos. 701-TA-650-651 (Final)
Phosphate Fertilizers from Morocco and Russia
DETERMINATIONS
On the basis of the record1 developed in the subject investigations, the United States International Trade Commission (“Commission”) determines, pursuant to the Tariff Act of 1930 (“the Act”), that an industry in the United States is materially injured by reason of imports of phosphate fertilizers from Morocco and Russia, provided for in subheadings 3103.11.00, 3103.19.00, 3103.90.00, 3105.10.00, 3105.20.00, 3105.30.00, 3105.40.00, 3105.51.00, 3105.59.00, 3105.60.00, and 3105.90.00 of the Harmonized Tariff Schedule of the United States, that have been found by the U.S. Department of Commerce (“Commerce”) to be subsidized by the governments of Morocco and Russia.2 3
BACKGROUND
The Commission instituted these investigations effective June 26, 2020, following receipt of petitions filed with the Commission and Commerce by The Mosaic Company, Plymouth, Minnesota. The Commission scheduled the final phase of the investigations following notification of preliminary determinations by Commerce that imports of phosphate fertilizers from Morocco and Russia were being subsidized within the meaning of section 703(b) of the Act (19 U.S.C. 1671b(b)). Notice of the scheduling of the final phase of the Commission’s investigations and of a public hearing to be held in connection therewith was given by posting copies of the notice in the Office of the Secretary, U.S. International Trade Commission, Washington, DC, and by publishing the notice in the Federal Register of December 8, 2020 (85 FR 79033). In light of the restrictions on access to the Commission building due to the COVID–
1 The record is defined in § 207.2(f) of the Commission’s Rules of Practice and Procedure (19 CFR
207.2(f)). 2 86 FR 9479 and 86 FR 9482 (February 16, 2021). 3 Commissioner Johanson dissenting.

19 pandemic, the Commission conducted its hearing through written testimony and video conference on February 9, 2021. All persons who requested the opportunity were permitted to participate.
3
Views of the Commission
Based on the record in the final phase of these investigations, we determine that an industry in the United States is materially injured by reason of phosphate fertilizers from Morocco and Russia found by the U.S. Department of Commerce (“Commerce”) to be subsidized by the governments of Morocco and Russia.1
I. Background
The Mosaic Company (“Mosaic”), a domestic producer of phosphate fertilizers, filed the petitions in these investigations on June 26, 2020.2 Mosaic and another domestic producer of phosphate fertilizers during the January 2017 to September 2020 period of investigation (“POI”), J.R. Simplot Company (“Simplot”), appeared at the hearing accompanied by counsel, and submitted prehearing and posthearing briefs, and final comments.3
Several respondent parties participated in the final phase of these investigations. OCP S.A. (“OCP”) and PhosAgro PJSC (“PhosAgro”), producers and exporters of phosphate fertilizers in Morocco and Russia, respectively, appeared at the hearing with counsel, and submitted prehearing and posthearing briefs. OCP also submitted final comments. Gavilon Fertilizer, LLC (“Gavilon”), International Raw Materials Ltd. (“IRM”), EuroChem North America Corporation (“EuroChem”), and Koch Fertilizer (“Koch”), U.S. importers of subject merchandise, appeared at the hearing with counsel and each submitted prehearing and posthearing briefs, while U.S. importer Archer Daniels Midland Company (“ADM”) appeared at the hearing with counsel and submitted a posthearing brief. IRM and ADM also submitted final comments.
U.S. industry data are based on the questionnaire responses of three firms that accounted for the vast majority of U.S. phosphate fertilizer production in 2019.4 U.S. import data are based on the questionnaire responses of ten importers that accounted for 93.7
1 Commissioner Johanson determined that an industry in the United States is not materially
injured or threatened with material injury by reason of subject imports from Morocco and Russia. See Dissenting Views of Commissioner David S. Johanson. He joins sections I-VI.C. of the Views of the Commission.
2 Confidential Report, Memorandum INV-TT-031 (Feb. 26, 2021) (“CR”); Public Report, Phosphate Fertilizers from Morocco and Russia, Inv. Nos. 701-TA-650-651 (Final), USITC Pub. 5172 at I-1 (March 2021) (“PR”).
3 In light of the restrictions on access to the Commission building due to the COVID-19 pandemic, the Commission conducted the hearing through a video conference, as set forth in procedures provided to the parties and announced on its website.
4 CR/PR at I-4.

4
percent of U.S. imports from Morocco and 68.6 percent of U.S. imports from Russia in 2019.5 Data concerning the subject industries are based on a questionnaire response from one producer of phosphate fertilizers in Morocco whose reported exports accounted for *** U.S. imports of phosphate fertilizers from Morocco in 2019,6 and two producers of phosphate fertilizers in Russia whose reported exports accounted for *** U.S. imports from Russia in 2019.7
III. Domestic Like Product
A. Legal Standard
In determining whether an industry in the United States is materially injured or threatened with material injury by reason of imports of the subject merchandise, the Commission first defines the “domestic like product” and the “industry.”8 Section 771(4)(A) of the Tariff Act of 1930, as amended (“the Tariff Act”), defines the relevant domestic industry as the “producers as a whole of a domestic like product, or those producers whose collective output of a domestic like product constitutes a major proportion of the total domestic production of the product.”9 In turn, the Tariff Act defines “domestic like product” as “a product which is like, or in the absence of like, most similar in characteristics and uses with, the article subject to an investigation.”10
By statute, the Commission’s “domestic like product” analysis begins with the “article subject to an investigation,” i.e., the subject merchandise as determined by Commerce.11 Therefore, Commerce’s determination as to the scope of the imported merchandise that is subsidized and/or sold at less than fair value is “necessarily the starting point of the Commission’s like product analysis.”12 The Commission then defines the domestic like product
5 CR/PR at IV-1. 6 CR/PR at VII-3. 7 CR/PR at VII-10. 8 19 U.S.C. § 1677(4)(A). 9 19 U.S.C. § 1677(4)(A). 10 19 U.S.C. § 1677(10). 11 19 U.S.C. § 1677(10). The Commission must accept Commerce’s determination as to the
scope of the imported merchandise that is subsidized and/or sold at less than fair value. See, e.g., USEC, Inc. v. United States, 34 Fed. App’x 725, 730 (Fed. Cir. 2002) (“The ITC may not modify the class or kind of imported merchandise examined by Commerce.”); Algoma Steel Corp. v. United States, 688 F. Supp. 639, 644 (Ct. Int’l Trade 1988), aff’d, 865 F.3d 240 (Fed. Cir.), cert. denied, 492 U.S. 919 (1989).
12 Cleo Inc. v. United States, 501 F.3d 1291, 1298 (Fed. Cir. 2007); see also Hitachi Metals, Ltd. v. United States, 949 F.3d 710, 715 (Fed. Cir. 2020) (the statute requires the Commission to start with Commerce’s subject merchandise in reaching its own like product determination).

5
in light of the imported articles Commerce has identified.13 The decision regarding the appropriate domestic like product(s) in an investigation is a
factual determination, and the Commission has applied the statutory standard of “like” or “most similar in characteristics and uses” on a case-by-case basis.14 No single factor is dispositive, and the Commission may consider other factors it deems relevant based on the facts of a particular investigation.15 The Commission looks for clear dividing lines among possible like products and disregards minor variations.16
B. Product Description
Commerce defined the imported merchandise within the scope of the investigations as: . . . {P}hosphate fertilizers in all physical forms (i.e., solid or liquid form), with or without coating or additives such as anti-caking agents. Phosphate fertilizers in solid form are covered whether granular, prilled (i.e., pelletized), or in other solid form (e.g., powdered). The covered merchandise includes phosphate fertilizers in the following forms: ammonium dihydrogenorthophosphate or monoammonium phosphate (MAP), chemical formula NH4H2PO4; diammonium hydrogenorthophosphate or diammonium phosphate (DAP), chemical formula (NH4)2HPO4; normal
13 Cleo, 501 F.3d at 1298 n.1 (“Commerce’s {scope} finding does not control the Commission’s
{like product} determination.”); Hosiden Corp. v. Advanced Display Mfrs., 85 F.3d 1561, 1568 (Fed. Cir. 1996) (the Commission may find a single like product corresponding to several different classes or kinds defined by Commerce); Torrington Co. v. United States, 747 F. Supp. 744, 748–52 (Ct. Int’l Trade 1990), aff’d, 938 F.2d 1278 (Fed. Cir. 1991) (affirming the Commission’s determination defining six like products in investigations where Commerce found five classes or kinds).
14 See, e.g., Cleo, 501 F.3d at 1299; NEC Corp. v. Department of Commerce, 36 F. Supp. 2d 380, 383 (Ct. Int’l Trade 1998); Nippon Steel Corp. v. United States, 19 CIT 450, 455 (1995); Torrington Co. v. United States, 747 F. Supp. 744, 749 n.3 (Ct. Int’l Trade 1990), aff’d, 938 F.2d 1278 (Fed. Cir. 1991) (“every like product determination ‘must be made on the particular record at issue’ and the ‘unique facts of each case’”). The Commission generally considers a number of factors including the following: (1) physical characteristics and uses; (2) interchangeability; (3) channels of distribution; (4) customer and producer perceptions of the products; (5) common manufacturing facilities, production processes, and production employees; and, where appropriate, (6) price. See Nippon, 19 CIT at 455 n.4; Timken Co. v. United States, 913 F. Supp. 580, 584 (Ct. Int’l Trade 1996).
15 See, e.g., S. Rep. No. 96-249 at 90–91 (1979). 16 See, e.g., Nippon, 19 CIT at 455; Torrington, 747 F. Supp. at 748–49; see also S. Rep. No.
96-249 at 90–91 (Congress has indicated that the like product standard should not be interpreted in “such a narrow fashion as to permit minor differences in physical characteristics or uses to lead to the conclusion that the product and article are not ‘like’ each other, nor should the definition of ‘like product’ be interpreted in such a fashion as to prevent consideration of an industry adversely affected by the imports under consideration.”).

6
superphosphate (NSP), also known as ordinary superphosphate or single superphosphate, chemical formula Ca(H2PO4)2·CaSO4; concentrated superphosphate, also known as double, treble, or triple superphosphate (TSP), chemical formula Ca(H2PO4)2·H2O; and proprietary formulations of MAP, DAP, NSP, and TSP. The covered merchandise also includes other fertilizer formulations incorporating phosphorous and non-phosphorous plant nutrient components, whether chemically-bonded, granulated (e.g., when multiple components are incorporated into granules through, e.g., a slurry process), or compounded (e.g., when multiple components are compacted together under high pressure), including nitrogen, phosphate, sulfur (NPS) fertilizers, nitrogen, phosphorous, potassium (NPK) fertilizers, nitric phosphate (also known as nitrophosphate) fertilizers, ammoniated superphosphate fertilizers, and proprietary formulations thereof that may or may not include other nonphosphorous plant nutrient components. For phosphate fertilizers that contain non-phosphorous plant nutrient components, such as nitrogen, potassium, sulfur, zinc, or other non-phosphorous components, the entire article is covered, including the non-phosphorous content, provided that the phosphorous content (measured by available diphosphorous pentaoxide, chemical formula P2O5) is at least 5% by actual weight. Phosphate fertilizers that are otherwise subject to this investigation are included when commingled (i.e., mixed or blended) with phosphate fertilizers from sources not subject to this investigation. Phosphate fertilizers that are otherwise subject to this investigation are included when commingled with substances other than phosphate fertilizers subject to this investigation (e.g., granules containing only non-phosphate fertilizers such as potash or urea). Only the subject component of such commingled products is covered by the scope of this investigation. The following products are specifically excluded from the scope of this investigation: (1) ABC dry chemical powder preparations for fire extinguishers containing MAP or DAP in powdered form; (2) industrial or technical grade MAP in white crystalline form with available P2O5 content of at least 60% by actual weight; (3) industrial or technical grade diammonium phosphate in white crystalline form with available P2O5 content of at least 50% by actual weight; (4) liquid ammonium polyphosphate fertilizers; (5) dicalcium phosphate, chemical formula CaHPO4;
7
(6) monocalcium phosphate, chemical formula CaH4P2O8; (7) trisodium phosphate, chemical formula Na3PO4; (8) sodium tripolyphosphate, chemical formula Na5P3O10; (9) prepared baking powders containing sodium bicarbonate and any form of phosphate; (10) animal or vegetable fertilizers not containing phosphate fertilizers otherwise covered by the scope of this investigation; (11) phosphoric acid, chemical formula H3PO4. The Chemical Abstracts Service (CAS) numbers for covered phosphate fertilizers include, but are not limited to: 7722-76-1 (MAP); 7783-28-0 (DAP); and 65996-95-4 (TSP). The covered products may also be identified by Nitrogen-Phosphate-Potash composition, including but not limited to: NP 11-52-0 (MAP); NP 18-46-0 (DAP); and NP 0-46-0 (TSP).17 Phosphate fertilizers contain phosphorus, a chemical element essential to all life on
Earth and a vital component in plant conversion of the sun’s energy into food, fiber, and oilseeds, which in turn, leads to healthy root growth, groundcover, water use efficiency, and quality fruit, vegetable, and grain crops.18 Phosphate fertilizers may contain phosphorus alone or be chemically combined or physically blended in various combinations with nitrogen and potassium, which, along with phosphorus are primary plant nutrients responsible for crop production and bountiful harvests. The four representative types of phosphate fertilizers are: MAP, DAP, TSP, and SSP, each differing somewhat in chemical and physical properties, but all containing phosphorus as the primary nutrient.19 Other types of phosphate fertilizers contain various chemical combinations of nitrogen, phosphorus, potassium or sulfur, such as Mosaic’s MicroEssentials® (“MES”) proprietary line of fertilizers, which contains a combination of nitrogen, phosphorus, and sulfur.20
17 Phosphate Fertilizers from the Kingdom of Morocco: Final Affirmative Countervailing Duty
Determination, 86 Fed. Reg. 9482 (Feb. 16, 2021); Phosphate Fertilizers from the Russian Federation: Final Affirmative Countervailing Duty Determination, 86 Fed. Reg. 9479 (Feb. 16, 2021).
18 CR/PR at I-8. 19 CR/PR at I-8. 20 CR/PR at I-8-9.
8
C. Domestic Like Product Analysis
In the preliminary phase of the investigations, IRM asked the Commission to define nitrogen, phosphorus, and sulfur (NPS) fertilizers, a product category that includes Mosaic’s proprietary MES product, as a domestic like product separate from other fertilizers.21 The Commission found that while NPS fertilizers may have a unique chemical formula, they nonetheless exhibit similarities with other types of fertilizers with regard to the domestic like product factors. Specifically, the Commission found that all phosphate fertilizers share certain basic physical properties, are manufactured in the same domestic facilities using the same basic processes, and are sold through similar channels of distribution. It further found that notwithstanding some limitations in interchangeability for specific end uses, all phosphate fertilizers share a common use of providing phosphate for agriculture, and different formulations may be blended together for use in specific applications.22 Based on the foregoing, the Commission defined a single domestic like product consisting of phosphate fertilizers coextensive with the scope.23
In the final phase of the investigations, Mosaic argues that the Commission should continue to define a single domestic like product, coextensive with the scope,24 and no respondent party contests the definition of the domestic like product from the preliminary determinations. Moreover, the record in the final phase of these investigations does not contain any information calling into question the findings the Commission made in the preliminary phase.25
Accordingly, we continue to define a single domestic like product consisting of phosphate fertilizers coextensive with the scope of the investigations.
21 Phosphate Fertilizers from Morocco and Russia, Inv. Nos. 701-TA-650-651 (Preliminary), USITC
Pub. 5105 at 9-10 (Aug. 2020) (“Preliminary Determinations”). In the preliminary phase of the investigations, OCP argued that the record supported negative determinations with respect to a single domestic like product, but that if the investigations proceeded to a final phase, the Commission should collect data with respect to three distinct domestic like products – NPS, TSP, and all other covered phosphate fertilizers. However, when asked in commenting on the draft questionnaires to identify any proposed domestic like products and specify with particularity the products the Commission should collect separate data, no party, including OCP, did so.
22 Preliminary Determinations, USITC Pub. 5105 at 10-13. 23 Preliminary Determinations, USITC Pub. 5105 at 13. 24 Mosaic Prehearing Br. at 8-19. Simplot agrees that the Commission should define a single
domestic like product consisting of all phosphate fertilizers. Simplot Prehearing Br. at 4-5. 25 CR/PR at I-8-14.
9
IV. Domestic Industry
The domestic industry is defined as the domestic “producers as a whole of a domestic like product, or those producers whose collective output of a domestic like product constitutes a major proportion of the total domestic production of the product.”26 In defining the domestic industry, the Commission’s general practice has been to include in the industry producers of all domestic production of the like product, whether toll-produced, captively consumed, or sold in the domestic merchant market.
In its preliminary determinations, the Commission defined one industry consisting of all domestic producers of phosphate fertilizers, and Mosaic argues that the Commission should continue to define the domestic industry to include all domestic producers of phosphate fertilizers.27 None of the respondents address how the Commission should define the domestic industry.
There are no related party or other domestic industry issues in these investigations.28 Accordingly, and in light of our definition of the domestic like product, we define the domestic industry as all U.S. producers of phosphate fertilizers.
26 19 U.S.C. § 1677(4)(A). 27 Preliminary Determinations, USITC Pub. 5105 at 13; Mosaic Prehearing Br. at 19; see also
Simplot Prehearing Br. at 5. 28 No domestic producer imported subject merchandise during the period of investigation, or
was related to an importer or exporter of subject merchandise. U.S. producer *** purchased subject imports during the period of investigation. CR/PR at Table III-8. The Commission has concluded that a domestic producer that does not itself import subject merchandise or does not share a corporate affiliation with an importer may nonetheless be deemed a related party if it controls large volumes of imports. See, e.g., Certain Seamless Carbon and Alloy Steel Standard, Line, and Pressure Pipe from Argentina, Brazil, Germany, and Italy, Inv. Nos. 701-TA-362 and 731-TA-707-710 (Review), USITC Pub. 3429 at 8-9 (June 2001). The Commission has found such control to exist, for example, where the domestic producer was responsible for a predominant proportion of an importer’s purchases and the importer’s imports were substantial. *** purchases of subject imports purchases were minimal and sporadic, and not of a level high enough, nor does other record evidence support it otherwise establishing control of an importer, for it to qualify as a related party. CR/PR at Table III-8.
10
V. Cumulation29
For purposes of evaluating the volume and effects for a determination of material injury by reason of subject imports, section 771(7)(G)(i) of the Tariff Act requires the Commission to cumulate subject imports from all countries as to which petitions were filed and/or investigations self-initiated by Commerce on the same day, if such imports compete with each other and with the domestic like product in the U.S. market. In assessing whether subject imports compete with each other and with the domestic like product, the Commission generally has considered four factors:
(1) the degree of fungibility between subject imports from different countries and between subject imports and the domestic like product, including consideration of specific customer requirements and other quality related questions;
(2) the presence of sales or offers to sell in the same geographic markets of subject imports from different countries and the domestic like product;
(3) the existence of common or similar channels of distribution for subject imports from different countries and the domestic like product; and
(4) whether the subject imports are simultaneously present in the market.30
While no single factor is necessarily determinative, and the list of factors is not exclusive, these factors are intended to provide the Commission with a framework for
29 Pursuant to Section 771(24) of the Tariff Act, imports from a subject country of merchandise
corresponding to a domestic like product that account for less than 3 percent of all such merchandise imported into the United States during the most recent 12 months for which data are available preceding the filing of the petition shall be deemed negligible. 19 U.S.C. §§ 1671b(a), 1673b(a), 1677(24)(A)(i), 1677(24)(B); see also 15 C.F.R. § 2013.1 (developing countries for purposes of 19 U.S.C. § 1677(36)). In the case of countervailing duty investigations involving developing countries (as designated by the United States Trade Representative (“USTR”)), the statute indicates that the negligibility limits are 4 percent and 9 percent, rather than 3 percent and 7 percent. 19 U.S.C. § 1677(24)(B). USTR has designated Morocco to be a developing country subject to the 4 percent negligibility threshold for countervailing duty investigations. 15 C.F.R. § 2013.1 (1-1-16 edition). U.S. importer questionnaire response data indicate that from June 2019 through May 2020, the most recent 12-month period for which data are available preceding the filing of the petition, subject imports from Morocco accounted for 71.9 percent of total imports and subject imports from Russia accounted for 13.2 percent. CR/PR at Table IV-3. Because imports from each subject country are above the applicable negligibility thresholds, we find that subject imports from Morocco and Russia are not negligible for purposes of the countervailing duty investigations.
30 See Certain Cast-Iron Pipe Fittings from Brazil, the Republic of Korea, and Taiwan, Inv. Nos. 731-TA-278-80 (Final), USITC Pub. 1845 (May 1986), aff’d, Fundicao Tupy, S.A. v. United States, 678 F. Supp. 898 (Ct. Int’l Trade), aff’d, 859 F.2d 915 (Fed. Cir. 1988).
11
determining whether the subject imports compete with each other and with the domestic like product.31 Only a “reasonable overlap” of competition is required.32
Mosaic argues that the Commission should cumulatively assess imports from Morocco and Russia as it did in the preliminary phase of the investigations.33 No respondent argues that the Commission should not cumulate subject imports for its material injury analysis.
We cumulate subject imports from Morocco and Russia for our analysis because the statutory criteria for cumulation are satisfied. As an initial matter, Mosaic filed the countervailing duty petitions with respect to subject imports from both countries on the same day, June 26, 2020.34 Additionally, as discussed below, we find a reasonable overlap of competition among phosphate fertilizers produced in Morocco, Russia, and the United States.
Fungibility. All U.S. producers and most responding purchasers reported that the domestic like product and phosphate fertilizers from Morocco and Russia were always interchangeable in all comparisons. In addition, most U.S. importers reported that the domestic like product and phosphate fertilizers from each subject country were always or frequently interchangeable in all comparisons.35 In comparisons between product from Morocco and Russia, and between the domestic like product and imports from each subject source concerning 16 factors, either a majority or plurality of responding purchasers found the product from all sources to be comparable with respect to every factor except distribution network, the majority of which found the domestic industry’s U.S. distribution network to be superior.36
Moreover, there was substantial product overlap for shipments of the domestic like product and subject imports, and between phosphate fertilizers from Morocco and Russia. Specifically, in 2019, MAP accounted for the largest shares of U.S. shipments of the domestic like product (*** percent) and U.S. shipments of subject imports from Morocco (*** percent)
31 See, e.g., Wieland Werke, AG v. United States, 718 F. Supp. 50 (Ct. Int’l Trade 1989). 32 The Statement of Administrative Action (SAA) to the Uruguay Round Agreements Act (URAA),
expressly states that “the new section will not affect current Commission practice under which the statutory requirement is satisfied if there is a reasonable overlap of competition.” H.R. Rep. No. 103-316, Vol. I at 848 (1994) (citing Fundicao Tupy, 678 F. Supp. at 902); see Goss Graphic Sys., Inc. v. United States, 33 F. Supp. 2d 1082, 1087 (Ct. Int’l Trade 1998) (“cumulation does not require two products to be highly fungible”); Wieland Werke, AG, 718 F. Supp. at 52 (“Completely overlapping markets are not required.”).
33 Mosaic Prehearing Br. at 33-37. Simplot also asserts that the Commission should cumulate subject imports from Morocco and Russia for its material injury analysis. Simplot Prehearing Br. at 5-6.
34 None of the statutory exceptions to cumulation applies. 35 CR/PR at Table II-10. Only one out of nine importers indicated that imports from Morocco
were never interchangeable with imports from Russia. See id. 36 CR/PR at Table II-9.

12
and Russia (*** percent).37 DAP accounted for the next largest shares of U.S. shipments of the domestic like product (*** percent) and U.S. shipments of subject imports from Morocco (*** percent) and Russia (*** percent).38 In light of the foregoing, the record indicates a reasonable level of fungibility between and among the domestic like product and phosphate fertilizers from each subject source.
Channels of Distribution. Both domestic producers and importers reported shipments of phosphate fertilizers primarily to retailers, followed by distributors.39
Geographic Overlap. The domestic like product and subject imports from both Morocco and Russia were sold in every region of the contiguous United States.40 Nearly all subject imports from Morocco and the vast majority of subject imports from Russia entered the United States through the Port of New Orleans (“NOLA”).41 NOLA is also a major transit point for shipments of the domestic like product within the contiguous United States.
Simultaneous Presence in Market. Questionnaire response data show that the domestic like product was present in the U.S. market throughout the period of investigation.42 Official U.S. imports statistics show that imports of phosphate fertilizers from Morocco and Russia have been present in the U.S. market in each full year of the POI and interim 2020.43
Conclusion. In sum, the record shows that subject imports from Morocco and Russia are fungible with the domestic like product and each other, that subject imports from each subject country and the domestic like product are sold in the same channels of distribution, are present in similar geographic markets, and have been simultaneously present in the U.S. market. In light of the foregoing, we find that there is a reasonable overlap of competition between the domestic like product and imports from each subject country and between imports from each subject country. We accordingly analyze subject imports from Morocco and Russia on a cumulated basis.
37 CR/PR at Table IV-4. 38 CR/PR at Table IV-4. 39 CR/PR at II-4, Table II-1. 40 CR/PR at II-5, Table II-2. 41 CR/PR at IV-11 n.16; Table IV-5. 42 CR/PR at Table III-6. 43 CR/PR at Table IV-6. Subject imports from Morocco were present in every month during the
POI except in June 2017, December 2017, and August-September 2020. Subject imports from Russia were present in every month during the POI except in July 2017 and June 2018. See id.
13
VI. Material Injury By Reason of Subject Imports
Based on the record in the final phase of these investigations, we find that an industry in the United States is materially injured by reason of phosphate fertilizers from Morocco and Russia that Commerce has found to be subsidized by the governments of Morocco and Russia.
A. Legal Standards
In the final phase of antidumping and countervailing duty investigations, the Commission determines whether an industry in the United States is materially injured or threatened with material injury by reason of the imports under investigation.44 In making this determination, the Commission must consider the volume of subject imports, their effect on prices for the domestic like product, and their impact on domestic producers of the domestic like product, but only in the context of U.S. production operations.45 The statute defines “material injury” as “harm which is not inconsequential, immaterial, or unimportant.”46 In assessing whether the domestic industry is materially injured by reason of subject imports, we consider all relevant economic factors that bear on the state of the industry in the United States.47 No single factor is dispositive, and all relevant factors are considered “within the context of the business cycle and conditions of competition that are distinctive to the affected industry.”48
Although the statute requires the Commission to determine whether the domestic industry is “materially injured or threatened with material injury by reason of” unfairly traded imports,49 it does not define the phrase “by reason of,” indicating that this aspect of the injury analysis is left to the Commission’s reasonable exercise of its discretion.50 In identifying a causal link, if any, between subject imports and material injury to the domestic industry, the Commission examines the facts of record that relate to the significance of the volume and price effects of the subject imports and any impact of those imports on the condition of the domestic
44 19 U.S.C. §§ 1671d(b), 1673d(b). 45 19 U.S.C. § 1677(7)(B). The Commission “may consider such other economic factors as are
relevant to the determination” but shall “identify each {such} factor ... and explain in full its relevance to the determination.” 19 U.S.C. § 1677(7)(B).
46 19 U.S.C. § 1677(7)(A). 47 19 U.S.C. § 1677(7)(C)(iii). 48 19 U.S.C. § 1677(7)(C)(iii). 49 19 U.S.C. §§ 1671d(b), 1673d(b). 50 Angus Chemical Co. v. United States, 140 F.3d 1478, 1484-85 (Fed. Cir. 1998) (“{T}he statute
does not ‘compel the commissioners’ to employ {a particular methodology}.”), aff’d, 944 F. Supp. 943, 951 (Ct. Int’l Trade 1996).

14
industry. This evaluation under the “by reason of” standard must ensure that subject imports are more than a minimal or tangential cause of injury and that there is a sufficient causal, not merely a temporal, nexus between subject imports and material injury.51
In many investigations, there are other economic factors at work, some or all of which may also be having adverse effects on the domestic industry. Such economic factors might include nonsubject imports; changes in technology, demand, or consumer tastes; competition among domestic producers; or management decisions by domestic producers. The legislative history explains that the Commission must examine factors other than subject imports to ensure that it is not attributing injury from other factors to the subject imports, thereby inflating an otherwise tangential cause of injury into one that satisfies the statutory material injury threshold.52 In performing its examination, however, the Commission need not isolate the injury caused by other factors from injury caused by unfairly traded imports.53 Nor does
51 The Federal Circuit, in addressing the causation standard of the statute, observed that “{a}s
long as its effects are not merely incidental, tangential, or trivial, the foreign product sold at less than fair value meets the causation requirement.” Nippon Steel Corp. v. USITC, 345 F.3d 1379, 1384 (Fed. Cir. 2003). This was further ratified in Mittal Steel Point Lisas Ltd. v. United States, 542 F.3d 867, 873 (Fed. Cir. 2008), where the Federal Circuit, quoting Gerald Metals, Inc. v. United States, 132 F.3d 716, 722 (Fed. Cir. 1997), stated that “this court requires evidence in the record ‘to show that the harm occurred “by reason of” the LTFV imports, not by reason of a minimal or tangential contribution to material harm caused by LTFV goods.’” See also Nippon Steel Corp. v. United States, 458 F.3d 1345, 1357 (Fed. Cir. 2006); Taiwan Semiconductor Industry Ass’n v. USITC, 266 F.3d 1339, 1345 (Fed. Cir. 2001).
52 The Statement of Administrative Action for the Uruguay Round Agreements Act (“SAA”) at 851-52 (“{T}he Commission must examine other factors to ensure that it is not attributing injury from other sources to the subject imports.”); S. Rep. 96-249 at 75 (1979) (the Commission “will consider information which indicates that harm is caused by factors other than less-than-fair-value imports.”); H.R. Rep. 96-317 at 47 (1979) (“in examining the overall injury being experienced by a domestic industry, the ITC will take into account evidence presented to it which demonstrates that the harm attributed by the petitioner to the subsidized or dumped imports is attributable to such other factors;” those factors include “the volume and prices of nonsubsidized imports or imports sold at fair value, contraction in demand or changes in patterns of consumption, trade restrictive practices of and competition between the foreign and domestic producers, developments in technology and the export performance and productivity of the domestic industry”); accord Mittal Steel, 542 F.3d at 877.
53 SAA at 851-52 (“{T}he Commission need not isolate the injury caused by other factors from injury caused by unfair imports.”); Taiwan Semiconductor Industry Ass’n, 266 F.3d at 1345 (“{T}he Commission need not isolate the injury caused by other factors from injury caused by unfair imports ... . Rather, the Commission must examine other factors to ensure that it is not attributing injury from other sources to the subject imports.”); Asociacion de Productores de Salmon y Trucha de Chile AG v. United States, 180 F. Supp. 2d 1360, 1375 (Ct. Int’l Trade 2002) (“{t}he Commission is not required to isolate the effects of subject imports from other factors contributing to injury” or make “bright-line distinctions” between the effects of subject imports and other causes.); see also Softwood Lumber from Canada, Inv.
(continued...)
15
the “by reason of” standard require that unfairly traded imports be the “principal” cause of injury or contemplate that injury from unfairly traded imports be weighed against other factors, such as nonsubject imports, which may be contributing to overall injury to an industry.54 It is clear that the existence of injury caused by other factors does not compel a negative determination.55
Assessment of whether material injury to the domestic industry is “by reason of” subject imports “does not require the Commission to address the causation issue in any particular way” as long as “the injury to the domestic industry can reasonably be attributed to the subject imports.”56 The Commission ensures that it has “evidence in the record” to “show that the harm occurred ‘by reason of’ the LTFV imports,” and that it is “not attributing injury from other sources to the subject imports.” 57 The Federal Circuit has examined and affirmed various Commission methodologies and has disavowed “rigid adherence to a specific formula.”58
The question of whether the material injury threshold for subject imports is satisfied notwithstanding any injury from other factors is factual, subject to review under the substantial
Nos. 701-TA-414 and 731-TA-928 (Remand), USITC Pub. 3658 at 100-01 (Dec. 2003) (Commission recognized that “{i}f an alleged other factor is found not to have or threaten to have injurious effects to the domestic industry, i.e., it is not an ‘other causal factor,’ then there is nothing to further examine regarding attribution to injury”), citing Gerald Metals, 132 F.3d at 722 (the statute “does not suggest that an importer of LTFV goods can escape countervailing duties by finding some tangential or minor cause unrelated to the LTFV goods that contributed to the harmful effects on domestic market prices.”).
54 S. Rep. 96-249 at 74-75; H.R. Rep. 96-317 at 47. 55 See Nippon Steel Corp., 345 F.3d at 1381 (“an affirmative material-injury determination under
the statute requires no more than a substantial-factor showing. That is, the ‘dumping’ need not be the sole or principal cause of injury.”).
56 Mittal Steel, 542 F.3d at 876 &78; see also id. at 873 (“While the Commission may not enter an affirmative determination unless it finds that a domestic industry is materially injured ‘by reason of’ subject imports, the Commission is not required to follow a single methodology for making that determination ... {and has} broad discretion with respect to its choice of methodology.”) citing United States Steel Group v. United States, 96 F.3d 1352, 1362 (Fed. Cir. 1996) and S. Rep. 96-249 at 75. In its decision in Swiff-Train v. United States, 793 F.3d 1355 (Fed. Cir. 2015), the Federal Circuit affirmed the Commission’s causation analysis as comporting with the Court’s guidance in Mittal.
57 Mittal Steel, 542 F.3d at 873 (quoting from Gerald Metals, 132 F.3d at 722), 877-79. We note that one relevant “other factor” may involve the presence of significant volumes of price-competitive nonsubject imports in the U.S. market, particularly when a commodity product is at issue. In appropriate cases, the Commission collects information regarding nonsubject imports and producers in nonsubject countries in order to conduct its analysis.
58 Nucor Corp. v. United States, 414 F.3d 1331, 1336, 1341 (Fed. Cir. 2005); see also Mittal Steel, 542 F.3d at 879 (“Bratsk did not read into the antidumping statute a Procrustean formula for determining whether a domestic injury was ‘by reason’ of subject imports.”).
16
evidence standard.59 Congress has delegated this factual finding to the Commission because of the agency’s institutional expertise in resolving injury issues.60
B. Conditions of Competition and the Business Cycle
The following conditions of competition inform our analysis of whether there is material injury by reason of subject imports.
1. Demand Conditions
U.S. demand for phosphate fertilizers is primarily driven by agricultural plantings, particularly acres planted for crops that consume the most fertilizer (i.e., corn, soybeans, and wheat). Weather volatility, cropping practices and crop rotation, and agricultural commodity prices also affect U.S. demand.61
Due to its relationship to agricultural plantings, U.S. demand for phosphate fertilizers is subject to seasonal business cycles, with most market participants reporting peak demand in the spring (second quarter, prior to planting) and fall (fourth quarter, after harvest).62 Mosaic states that to meet the two seasonal surges in demand, producers manufacture phosphate fertilizers throughout the year, and the supply chain including wholesalers and retailers move product into position during the off seasons.63 According to respondents, it takes time for distributors to obtain fertilizers and move it through the supply chain into warehouses in the off seasons for use by farmers, and that distributors therefore rely on demand projections in obtaining product.64
59 We provide in our discussion below a full analysis of other factors alleged to have caused any
material injury experienced by the domestic industry. 60 Mittal Steel, 542 F.3d at 873; Nippon Steel Corp., 458 F.3d at 1350, citing U.S. Steel Group, 96
F.3d at 1357; S. Rep. 96-249 at 75 (“The determination of the ITC with respect to causation is ... complex and difficult, and is a matter for the judgment of the ITC.”).
61 CR/PR at II-11; Mosaic Prehearing Br. at 20; OCP Prehearing Br. at 6, 33; Gavilon Prehearing Br. at 10; PhosAgro Prehearing Br. at 6; PhosAgro Posthearing Br. at 3, 6.
62 CR/PR at II-15. 63 Mosaic Prehearing Br. at 24. U.S. producers reported that *** percent of their commercial
shipments in 2019 came from inventory with lead times averaging *** days. CR/PR at II-17. 64 OCP Prehearing Br. at 6, 37-39; Koch Prehearing Br. at 6-7; OCP Posthearing Br. at Responses
to Questions pp. 27-28, 39; IRM Posthearing Br. at 7; Koch Posthearing Br. at 11-12; EuroChem Posthearing Br. at 8. U.S. importers reported that *** percent of their commercial shipments in 2019 came from inventory with lead times averaging *** days. Importers also reported *** percent of their commercial shipments came from foreign producers’ inventories, with lead times averaging *** days.

17
Most responding U.S. producers, importers, and purchasers reported that U.S. demand for phosphate fertilizers either fluctuated or did not change during the period of investigation.65 The parties agree that while U.S. demand increased between 2017 and 2018, the U.S. market experienced unusually wet weather conditions that impacted three consecutive planting seasons beginning in the fall of 2018. Consequently, crop plantings fell and U.S. demand for phosphate fertilizers declined in 2019. U.S. demand, however, rebounded in interim 2020 with increased crop plantings.66
Data from the U.S. Department of Agriculture’s (“USDA”) Farm Service Agency confirm that total planted acres increased from 2017 and 2018, decreased between 2018 and 2019, then increased again between 2019 and 2020.67 Overall, total acres planted was 3.6 percent lower in 2019 compared to total acres planted in 2017 and 0.6 percent lower in 2020 compared to total acres planted in 2017.68 Apparent U.S. consumption for phosphate fertilizers followed the same trends. Specifically, it increased from *** short tons in 2017 to *** short tons in 2018, then decreased to *** short tons in 2019 for an overall decline of *** percent between 2017 and 2019; it was *** percent lower in interim 2020 at *** short tons than in interim 2019 at *** short tons.69
2. Supply Conditions
The domestic industry was the largest supplier of phosphate fertilizers to the U.S. market throughout the POI. Its share of apparent U.S. consumption declined from *** percent in 2017 to *** percent in 2018 and *** percent in 2019, representing an overall decrease of *** percentage points between 2017 and 2019.70 The domestic industry’s share of apparent U.S. consumption was *** percent in interim 2019 and *** percent in interim 2020.71
In addition to supplying the majority of the U.S. market, the domestic industry also
65 CR/PR at Table II-4. Specifically, two of three responding domestic producers, seven of 10 U.S.
importers, and 14 of 28 U.S. purchasers indicated that U.S. demand fluctuated since January 1, 2017 while one domestic producer, two U.S. importers, and eight purchasers reported that demand did not change. See id.
66 Mosaic Prehearing Br. at 20-21; OCP Prehearing Br. at 6, 34-36, 43-51; IRM Prehearing Br. at 15-17; Gavilon Prehearing Br. at 11-12, 14-16; PhosAgro Prehearing Br. at 6-7.
67 The USDA reported that acres planted for corn, soybeans, and wheat were 226.4 million in 2017, 225.9 million in 2018, 211.3 million in 2019, 218.4 million in 2020. It projected the acres planted for these crops to be 227.0 million in 2021. CR/PR at II-11 n.23.
68 CR/PR at II-11, Figure II-1. 69 CR/PR at Tables IV-7, C-1. 70 CR/PR at Tables IV-8, C-1. 71 CR/PR at Tables IV-8, C-1.
18
exported substantial volumes of phosphate fertilizers to third country markets. The domestic industry’s export shipments accounted for *** percent of its total shipments in 2017, *** percent in 2018, and *** percent in 2019; its export shipments accounted for a lower share of its total shipments in interim 2020 at *** percent than in interim 2019 at *** percent.72 *** largest export market was *** while *** largest export market was Canada.73
During the POI, three firms – Mosaic, Nutrien, and Simplot – accounted for the vast majority of all known U.S. production of phosphate fertilizers, with Mosaic serving as the leading producer in the United States.74 Mosaic reported changes in operations during the POI. Specifically, in December 2017, Mosaic idled its 2 million ton production facility in Plant City, Florida for 18 months and then permanently shuttered the facility in June 2019.75 In March 2019, Mosaic also announced a 300,000 short ton curtailment in production, and in September 2019, Mosaic temporarily idled operations at its facilities in Saint James (Faustina) and Uncle Sam, Louisiana, curtailing production by 500,000 short tons. It restarted operations at these facilities in December 2019, but idled its plant in Bartow, Florida that same month, curtailing production by 165,000 tons per month. Mosaic resumed production at its Bartow facility in February 2020.76
Nutrien increased its capacity and production from 2017 to 2018 at its Aurora, North
72 CR/PR at Table III-6. U.S. producers’ export shipments declined from *** short tons in 2017 to
*** short tons in 2018, before increasing in 2019 to *** short tons. Their export shipments were lower in interim 2020 at *** short tons that in interim 2019 at *** short tons. See id.
73 CR/PR at III-11 n.26. *** accounted for *** percent of *** export shipments between 2017 and 2019. *** also shipped product to ***. At least *** percent of *** exports and *** percent of *** exports went to Canada during 2017-2019 and interim 2020. They also exported product to ***. See id.
74 CR/PR at I-3, Table III-1. In 2019, Mosaic accounted for *** percent of domestic production. CR/PR at Table III-1. Over the past several decades, the domestic industry experienced significant contraction in the number of producers and production facilities. Mosaic Prehearing Br. at 22; OCP Prehearing Br. at 6-16; Gavilon Prehearing Br. at 17-19; IRM Prehearing Br. at 4-6. According to respondents, depleting U.S. phosphate ore reserves (from which the primary raw material phosphate rock is refined), caused this consolidation of the domestic industry. OCP Prehearing Br. at 6-16; Gavilon Prehearing Br. at 17-19; IRM Prehearing Br. at 4-6. Mosaic and Simplot maintain, however, that the United States has plenty of remaining and untapped phosphate rock reserves and that mining capacity currently exceeds production capacity. Hearing Tr. at 139-143 (Stone, O’Rourke). Indeed, Mosaic reports that its phosphate rock production and quality have remained consistent over the POI. Mosaic Prehearing Br. at 92-93; Mosaic Postconference Br. at Exhibit 31. OCP itself acknowledges that U.S. annual phosphate rock production represents nearly 15 percent of global production, rendering the United States the world’s third largest producer. OCP Prehearing Br. at 11.
75 CR/PR at III-3. 76 Mosaic Prehearing Br. at 2; Mosaic Posthearing Br. at Responses to Questions pp. 22-23.

19
Carolina and White Springs, Florida phosphate facilities.77 In May 2019, Nutrien converted its phosphate operation in Redwater, Canada to an ammonium sulfate plant.78 Nutrien’s CEO stated at the time that the increase in production in North Carolina and Florida was expected to offset the reduction in supply from its Redwater facility.79 Nutrien’s U.S. production *** by *** percent from 2018 to 2019 and its production and production capacity *** of the POI.80
As a result of these operational changes and curtailments, and notwithstanding that *** increased its production capacity by *** short tons from 2017 to 2018, the domestic industry’s capacity decreased from *** short tons in 2017 to *** short tons in 2018 and *** short tons in 2019.81 The domestic industry’s capacity was higher in interim 2020 at *** short tons than in interim 2019 at *** short tons.82 The domestic industry’s production and U.S. shipments also decreased each full year of the POI, and the domestic industry consequently had available excess capacity throughout the POI.83
Subject imports accounted for the second largest source of supply. Their share of apparent U.S. consumption rose from *** percent in 2017 to *** percent in 2018 and *** percent in 2019, representing an increase of *** percentage points over the POI.84 Subject imports’ share of apparent U.S. consumption was *** percent in interim 2019 and *** percent in interim 2020.85
Nonsubject imports were the smallest source of supply to the U.S. phosphate fertilizer market. Their share of apparent U.S. consumption increased from *** percent in 2017 to *** percent in 2018, before declining to *** percent in 2019.86 Nonsubject imports’ share of apparent U.S. consumption was *** percent in interim 2019 and *** percent in interim 2020.87 According to official import statistics, the largest nonsubject source of phosphate fertilizers to the U.S. market in 2019 was Saudi Arabia, which accounted for *** percent of total phosphate
77 CR/PR at III-3 and Table III-3. *** production capacity increased by *** short tons, from ***
short tons in 2017 to *** short tons in 2018, due to ***. CR/PR at III-5 n.18. 78 CR/PR at Table III-3. 79 CR/PR at III-3. 80 CR/PR at Table III-3. 81 CR/PR at Table III-3. 82 CR/PR at Tables III-4, C-1. 83 The domestic industry’s capacity utilization rate was *** percent in 2017, *** percent in 2018,
and *** percent in 2019; it was lower in interim 2020 at *** percent than in interim 2019 at *** percent. CR/PR at Tables III-5, C-1.
84 CR/PR at Tables IV-8, C-1. 85 CR/PR at Tables IV-8, C-1. 86 CR/PR at Tables IV-8, C-1. 87 CR/PR at Tables IV-8, C-1.

20
fertilizer imports.88 *** U.S. producers, five of ten importers, and 16 of 28 purchasers reported experiencing
supply constraints during the POI. The parties disagree on the extent of any supply shortages. Respondents generally argue that the shuttering of Mosaic’s Plant City facility in 2017 and Nutrien’s announcement and subsequent closure of its Redwater, Canada facility in 2019 left a “gaping hole in supply,” and that imports were “pulled into” the market as a result.89 Ten purchasers reported experiencing delays, shortages, and/or allocations from Mosaic, and *** elaborated that Mosaic has refused to supply the firm *** and that this caused delays in its ability to supply its customers.90 U.S. producer ***, while Mosaic acknowledged that after its decision to idle its Plant City facility in December 2017, it reduced its phosphate sales volume targets with certain larger customers – specifically, with CHS by 200,000 tons and with Gavilon by 100,000 tons relative to the prior year.91 ***92 Mosaic asserts, however, that idling Plant City resulted in approximately 700,000 short tons of reduced supply to the U.S. market between 2017 and 2018,93 but that subject imports increased by a greater amount – more than one million short tons – during this time.94 Mosaic, observing that the increase in subject import volumes exceeded any gap created by the idling of Plant City, argues that respondents’ theory that subject imports were entirely “pulled” into the market was contradicted by the
88 CR/PR at IV-2, Table IV-2. Nonsubject imports from Saudi Arabia increased from *** short
tons in 2017 to *** short tons in 2018 and *** short tons in 2019; they were *** short tons in interim 2019 and *** short tons in interim 2020. In 2014, Mosaic acquired a 25 percent equity interest in Ma’aden Wa’ad Al Shamal Phosphate Company (“MWSPC”), a joint venture that began to produce phosphate fertilizers in Saudi Arabia in 2017. MWSPC currently has an annual capacity of 3.3 million short tons. CR/PR at VII-21; Mosaic Prehearing Br. at Exhibit 7 p.3.
89 See e.g., OCP Posthearing Brief at 2-8 and Responses to Questions at 7-26, 29-32, and 74-82; PhosAgro Posthearing Brief at 3; Koch’s Posthearing Brief at 14; IRM Posthearing Brief at 4-7, and 9-11.
90 CR/PR at II-8-9. 91 Mosaic Posthearing Br. at Responses to Questions p. 83. 92 *** U.S. Producer Questionnaire Response at IV-16. 93 Hearing Tr. at 39 (McLellan) (“Plant City…produced about 1.4 million short tons when it was
idled in 2017. We sold about 700,000 short tons of that production into the U.S. market.”). We observe that in 2017, Mosaic exported *** percent of its total shipments; in 2017 its U.S. shipments accounted for *** percent of its total shipments. Mosaic U.S. Producer Questionnaire Response at II-7.
94 Mosaic Posthearing Br. at 2, 13, Responses to Questions pp. 19-20; Hearing Tr. at 111 (McLellan) (“We shipped into the U.S. market from Plant City approximately 700,000 short tons. What came in was a million short tons of imports.”). Subject imports increased from 1,971,222 short tons in 2017 to 2,978,803 short tons in 2018. CR/PR at Table IV-2. Mosaic contends that this oversupply resulted in U.S. importers’ ending inventories of subject imports increasing by *** short tons or *** percent from 2017 to 2018. Mosaic Posthearing Br. at 2-3.
21
record.95 96 As further discussed below, Mosaic asserts, and the record reflects, that significant volumes of subject imports entered the U.S. market between 2017 and 2018 and remained at elevated levels in 2019 despite a significant demand decline due to “Black Swan” weather events occurring in late 2018 and into 2019. Mosaic added that following a reduction in subject imports resulting from filing of the CVD petition, some ***.97
3. Substitutability and Other Conditions
We find that there is a high degree of substitutability between the domestic like product and phosphate fertilizers from subject sources that are of the same chemical formulations,98 and that phosphate fertilizers with different chemical formulations are broadly interchangeable, particularly when used in blends.99 The record shows the vast majority of the domestic industry’s U.S. shipments and U.S. importers’ U.S. shipments of subject imports were of the same types of phosphate fertilizers – specifically, MAP and DAP.100 Moreover, all three
95 Mosaic Prehearing Br. at 49. Mosaic, however, concedes that when it idled Plant City, that
“there would be some new imports coming in to satisfy the short-term need” because it “takes time for us to adjust.” Hearing Tr. at 128 (O’Rourke). Simplot asserts that the domestic industry’s excess capacity and U.S. importers’ increasing end of period inventories demonstrate that there was no need for subject imports to increase by one million short tons from 2017 to 2018. Simplot Prehearing Br. at 10.
96 Commissioner Johanson does not join the remainder of this supply discussion and includes in his dissent a discussion of the significant supply issues created by the domestic industry during the POI and the effect of bad weather conditions in late 2018 and 2019 on the U.S. market.
97 CR/PR at II-8-9. 98 CR/PR at II-17. 99 CR/PR at I-8-10; Mosaic Prehearing Br. at 30-31; Hearing Tr. at 32-33 (Jung). Respondents
argue that TSP fertilizers, which do not contain nitrogen, and NPS fertilizers, which contain sulfur and zinc, translate into limited interchangeability between these fertilizers and MAP/DAP. OCP Prehearing Br. at 52-60; Gavilon Prehearing Br. at 29-30; PhosAgro Prehearing Br. at 12; IRM Prehearing Br. at 17-18. As an initial matter, the domestic industry produced and sold NPS fertilizers that contained the same chemical elements as imported NPS fertilizers during the POI. CR/PR at Table IV-4. In any event, to the extent that TSP or NPS fertilizers are not readily interchangeable with MAP and DAP in direct applications, the record shows that fertilizers are sold in bulk and easily blended, resulting in considerable flexibility for farmers to switch between different types of fertilizers to obtain a blend with the desired nutrient content. Mosaic Prehearing Br. at 31. For instance, TSP, as well as MAP and DAP, not only are used for direct applications, but are also used in multi-nutrient NPK blends. CR/PR at I-9. MAP or DAP in combination with an S-fertilizer can be also be blended together resulting in the same chemical combination as an NPS fertilizer. Mosaic Prehearing Br. at 31; Hearing Tr. at 32-33 (Jung).
100 CR/PR at Table IV-4. Specifically, MAP and DAP accounted for *** percent of the domestic industry’s U.S. shipments, *** percent of U.S. shipments of subject imports from Morocco, and *** percent of U.S. shipments of subject imports from Russia. CR/PR at I-9, Table IV-4; Mosaic Prehearing Br. at 31.

22
responding U.S. producers and most purchasers (17 of 25 firms) reported that the domestic like product and phosphate fertilizers from Morocco and Russia were always interchangeable in all comparisons; and most U.S. importers (8 of 10 firms regarding Morocco and 8 of 9 firms regarding Russia) reported that the domestic like product and phosphate fertilizers from each subject country were always or frequently interchangeable in all comparisons.101 The vast majority of responding purchasers also indicated that both domestically produced and subject imports always or usually met minimum quality specifications,102 and only one of 27 responding purchasers reported that a domestic or foreign supplier had failed in its attempt to qualify phosphate fertilizers or had lost its approved status since 2017.103
We further find that price along with availability and quality are important considerations in purchasing decisions. When asked to report the top three factors considered in their purchasing decisions, U.S. purchasers most often cited price (23 firms), and availability and quality (17 firms each) as their top three factors. Purchasers most frequently cited price (11 firms) as their first-most important factor, followed by availability (9 firms),104 and the majority of purchasers (17 of 28 firms) reported that they usually purchased the lowest-priced product.105 When asked to rate the importance of 16 factors in their purchasing decisions, U.S. purchasers most frequently cited availability and quality meets industry standards (27 firms each), followed by price and reliability of supply (26 firms).106 Pluralities of U.S. producers, importers, and purchasers reported that differences other than price between the domestic like product and subject imports from Morocco were sometimes significant and pluralities of U.S. importers and purchasers also reported that differences other than price between the domestic like product and subject imports from Russia were sometimes significant, while two of three U.S. producers reported that they were never significant.107 In addition, majorities or pluralities of purchasers reported that the domestic like product and subject imports from each subject country were comparable on all factors (including price, availability, quality, and reliability of
101 CR/PR at Table II-10. 102 CR/PR at Table II-11. Twenty-six of 27 responding purchasers reported that domestically
produced phosphate fertilizers always or usually met minimum quality specifications, 22 of 23 responding purchasers indicated that subject imports from Morocco always or usually met minimum quality specifications, and 20 of 23 responding purchasers indicated that subject imports from Russia always or usually met minimum quality specifications. Id.
103 CR/PR at II-20. Specifically, *** reported that it “typically do{es} not handle Moroccan or *** fertilizer because it does not meet {its} product specifications in available Sulfur, and water solubility.” It also added that “***.” *** U.S. Purchaser Questionnaire Response at III-20; CR/PR at II-20.
104 CR/PR at Table II-6. 105 CR/PR at II-19. 106 CR/PR at Table II-7. 107 CR/PR at Table II-12.

23
supply) but one – U.S. distribution network – the majority of which reported that the U.S. product was superior.108
We also find that U.S. prices of phosphate fertilizers are highly transparent. Phosphate fertilizer prices are reported in trade publications such as Argus Phosphates (“Argus”), CRU Phosphate Fertilizer Market Outlook (“CRU”), and Green Markets.109 These trade publications gather market intelligence for sales transactions, including in the NOLA region, and publish the collected range of prices on a daily or weekly basis.110 This price information is then quickly transmitted throughout the U.S. market.111 Two of three U.S. producers (***), two of nine U.S. importers (***), and 16 of 28 purchasers reported that they refer to and use prices published in trade publications when negotiating prices.112
As previously noted, both domestically produced and imported phosphate fertilizers are primarily sold from inventories.113 U.S. producers reported that *** percent of their commercial shipments in 2019 came from inventory with lead times averaging *** days, and importers reported that *** percent of their commercial shipments in 2019 came from inventory with lead times averaging *** days.114 The *** of U.S. producers’ U.S. commercial shipments and *** half of U.S. importers’ U.S. commercial shipments were made on a spot sales basis in 2019.115
108 CR/PR at Table II-9. Twenty of 24 responding purchasers reported that domestically
manufactured phosphate fertilizers and subject imports from Morocco were comparable on price, as did 20 of 23 responding purchasers with respect to subject imports from Russia. No purchaser reported that the U.S. product was superior on price (i.e., lower priced) to subject imports from Morocco or Russia. Sixteen of 24 responding purchasers reported that the U.S. product was superior or comparable on availability and reliability of supply to subject imports from Morocco, as did 20 of 23 responding purchasers with respect to subject imports from Russia. Id.
109 CR/PR at V-5-6; Mosaic Prehearing Br. at 29; OCP Posthearing Br. at 6; Koch Prehearing Br. at 2; Koch Posthearing Br. at 1; Hearing Tr. at 195-196 (McGinn).
110 CR/PR at V-5; Hearing Tr. at 147 (O’Rourke). Two of three U.S. producers, six of ten importers, and 12 of 27 purchasers reported their own prices to trade publications. CR/PR at V-6.
111 Simplot Posthearing Br. at Responses to Questions pp. 60-61. 112 Purchasers reported using Green Markets (9 firms); Profercy (6 firms); Argus and Fertecon (3
firms); ICIS (2 firms); and CRU, FIS Index, and FMB (1 firm each), and several reported using NOLA barge or NOLA f.o.b. prices, but did not specify a particular publication. CR/PR at V-6.
113 CR/PR at II-17. 114 CR/PR at II-17. Importers also reported that *** percent of their commercial shipments in
2019 came from the foreign manufacturers’ inventories, with lead times averaging *** days, and *** percent were produced-to-order, with lead times averaging *** days.
115 CR/PR at Table V-3. U.S. producers reported that *** percent of their U.S. sales were made on a spot basis, *** percent on a short-term contract basis, and *** percent on a long-term contract basis. U.S. importers reported that *** percent of their U.S. sales were made on a spot basis, ***
(continued...)

24
During the POI, phosphate fertilizers from all sources were shipped through the same channels of distribution (mainly to retailers, followed by distributors)116 primarily by either barge, rail, or truck.117 Specifically, U.S. importers reported that 61.6 percent of their 2019 sales of subject fertilizers were shipped by barge, 10.8 percent by rail, and 27.7 percent by truck.118 U.S. producers reported that 12.4 percent of their U.S. shipments were by barge, 47.1 percent by rail, 24.7 percent by truck, and 15.8 percent by another method (including by vessel or title transfer).119
As discussed above, most U.S. purchasers reported that the domestic like product’s U.S. distribution network was superior to that of subject imports.120 Respondents state that most imports of phosphate fertilizers from Morocco and Russia were shipped to NOLA, loaded on barges, and transported up the Mississippi River and its tributaries.121 Mosaic reports that like subject imports, it transloads product onto river barges at NOLA that are moved up the Mississippi River to warehouse positions located on the inland U.S. waterways.122 Mosaic explains that its U.S. distribution network is expansive, comprising nearly *** with approximately *** short tons in storage capacity, which allows it to reach customers located throughout the United States. Specifically, its network includes: ***.123 In addition, Simplot, whose production facilities are located in Pocatello, Idaho and Rock Spring Wyoming, states that it ships product to and has warehouses in the West and Midwest regions of the United States.124
In addition to possessing an extensive distribution network, the domestic industry is vertically integrated with respect to the main raw material inputs used to produce phosphate
percent on a short-term contract basis, and *** percent on an annual contract basis. See id. Furthermore, more than half of the responding purchasers (15 of 29 firms) reported that they purchase phosphate fertilizers on a daily or weekly basis. CR/PR at V-7.
116 CR/PR at Table II-1. 117 CR/PR at V-4. 118 CR/PR at V-4. 119 CR/PR at V-4. 120 CR/PR at Table II-9. 121 CR/PR at IV-11 n.16, V-4; Gavilon Prehearing Br. at 28-29; PhosAgro Prehearing Br. at 3; IRM
Prehearing Br. at 14-15; Koch Posthearing Br. at 3-4. 122 Mosaic Prehearing Br. at 32; Mosaic Posthearing Br. at Responses to Questions, pp. 91-93. 123 Mosaic Posthearing Br. at Responses to Questions pp. 91-93. 124 CR/PR at Table III-1; Simplot Posthearing Br. at Responses to Question pp. 24-25. Simplot
explains that it has supply chain operations and warehouses *** and that it has sold product not only to the West, but also Midwest, regions of the United States for years. Simplot Posthearing Br. at Responses to Question pp. 24-25.

25
fertilizers – sulfur, ammonia, and phosphate rock.125 *** produce sulfur and mine and beneficiate phosphate rock, although these raw materials are sometimes purchased.126 Moreover, *** and Mosaic produces and purchases ammonia.127 During the period of investigation, prices of phosphate rock reported in CRU was relatively stable, while prices of ammonia fluctuated widely from January 2017 to January 2020, stabilized, then decreased between April and July 2020.128 Prices for sulfur increased from January 2017 to the end of 2018, decreased through January 2020, stabilized, then increased and remained stable through July 2020.129 Consistent with this, *** and five of nine importers reported that raw material costs fluctuated with no clear trend over the POI.130 Domestic producers’ raw material costs as a share of cost of goods sold (“COGS”) increased by *** percentage points from *** percent in 2017 to *** percent 2019 and was *** percent in interim 2020.131
C. Volume of Subject Imports
Section 771(7)(C)(i) of the Tariff Act provides that the “Commission shall consider whether the volume of imports of the merchandise, or any increase in that volume, either in absolute terms or relative to production or consumption in the United States, is significant.”132
The volume of cumulated subject imports increased from 2.0 million short tons in 2017 to 3.0 million short tons in 2018, before decreasing to 2.7 million short tons in 2019, for an overall increase of 37.4 percent between 2017 and 2019.133 Cumulated subject imports were
125 CR/PR at V-1. U.S. producers reported that sulfur comprised approximately *** percent of
their total raw material costs in 2019, ammonia *** percent, phosphate rock *** percent, and other raw material inputs *** percent. See id.
126 CR/PR at V-1. *** reported purchasing sulfur, and respondent OCP states that ***. CR/PR at V-1; OCP Prehearing Br. at 14-15.
127 CR/PR at V-1. Mosaic states that it produces one-third of its ammonia, purchases another third on the open market, and acquires a third through a long-term contract with CF Industries. Mosaic Posthearing Br. at Responses to Questions p. 95.
128 CR/PR at Figure V-1. 129 CR/PR at Figure V-1. 130 CR/PR at Table V-1. 131 CR/PR at V-1. 132 19 U.S.C. § 1677(7)(C)(i). 133 CR/PR at IV-3, Table IV-2. OCP and IRM argue that the Commission should disregard imports
of *** in its volume analysis. OCP Prehearing Br. at 74-75; IRM Prehearing Br. at 22. Those products, however, fall within the investigation’s scope. Moreover, as previously discussed, notwithstanding some limitations in interchangeability in direct applications, all phosphate fertilizers share a common use of providing phosphate for agriculture, and different formulations may be blended together for use
(continued...)

26
lower in interim 2020 at 1.2 million short tons than in interim 2019 at 2.0 million short tons.134 U.S. importers’ U.S. shipments of subject imports increased from 1.8 million short tons in 2017 to 2.4 million short tons in 2018, and increased again to 2.5 million short tons in 2019. U.S. shipments of subject imports declined over the interim periods, from 1.9 to 1.3 million short tons.135
The share of apparent U.S. consumption held by cumulated subject imports also increased from 2017 to 2019. The market share of U.S. shipments of subject imports increased from *** percent in 2017 to *** percent in 2018. Although cumulated imports of subject phosphate fertilizers decreased in volume between 2018 and 2019, the volume of U.S. shipments of subject imports increased by *** percent while apparent U.S. consumption declined by *** percent during the same period.136 Consequently, cumulated subject imports continued to gain market share, which increased from *** percent in 2018 to *** percent in 2019, for an overall *** percentage point increase in market share between 2017 and 2019 as
in end use applications. In any event, during the POI, the vast majority of U.S. shipments of the domestic like product and subject imports were of the same types of phosphate fertilizers, i.e., MAP and DAP. CR/PR at Table IV-4.
134 CR/PR at Table IV-2. The parties acknowledge that the filing of the petitions at the end of June 2020 resulted in a large decrease of subject imports to the U.S. market. Mosaic Prehearing Br. at 43-44, 91; Simplot Prehearing Br. at 29-30, 34; Simplot Posthearing Br. at Responses to Questions pp. 53-54; Mosaic Posthearing Br. at Responses to Questions pp. 69-70; OCP Posthearing Br. at 12, Responses to Questions p. 33, 67-73; EuroChem Posthearing Br. at 11; IRM Posthearing Br. at 8-9; PhosAgro Posthearing Br. at 12-13, Responses to Questions. Some U.S. importers indicated that they stopped bringing in subject imports “because the buyers and the sellers agreed that the risk of 75 percent countervailing duties was higher than either of them wanted to take.” Hearing Tr. at 337 (Aranoff); see also EuroChem Posthearing Br. at 11 (stating that as a result of the filing of the petitions, it shifted its purchases of phosphate fertilizers from Morocco and Russia to other global sources); *** U.S. Purchaser Questionnaire Response at III-11 (reporting that Koch and IRM will not quote or import material until the countervailing duty decision is issued); *** U.S. Purchaser Questionnaire Response at III-11 (reporting that Helm, Koch, and OCP “cut off” supplying imported product to the U.S. market in the summer of 2020). Monthly import data also confirm that subject import volume from Morocco and Russia showed notable declines after the petitions were filed at the end of June 2020, and subject import end-of-quarter inventories also declined. CR/PR at Tables IV-6 and D-1.
135 CR/PR at Table C-1. End-of-period inventories of subject imports held by U.S. importers *** percent between 2017 and 2018, from *** short tons to *** short tons, before a decline to *** short tons in 2019.
136 CR/PR at Tables IV-2, IV-7-8, C-1.

27
the domestic industry lost *** percentage points of market share over the same period.137 138 We find that the volume of cumulated subject imports and the increase in that volume
were significant in absolute terms and relative to apparent consumption in the United States during the period of investigation.
D. Price Effects of the Subject Imports
Section 771(7)(C)(ii) of the Tariff Act provides that, in evaluating the price effects of subject imports, the Commission shall consider whether –
(I) there has been significant price underselling by the imported merchandise as compared with the price of domestic like products of the United States, and
(II) the effect of imports of such merchandise otherwise depresses prices to a
significant degree or prevents price increases, which otherwise would have occurred, to a significant degree.139
As previously discussed, there is a high degree of substitutability between subject
imports and the domestic like product that are of the same chemical formulation, and price is an important consideration in purchasing decisions, along with availability and quality.
In the final phase of these investigations, the Commission collected monthly pricing data from U.S. producers and importers for the total quantity and f.o.b. value of two phosphate fertilizer products shipped in bulk (i.e., barge-load) from NOLA to unrelated U.S. agricultural
137 CR/PR at Tables IV-8, C-1. The domestic industry’s market share declined from *** percent in
2017 to *** percent in 2018 and *** percent in 2019. See id. 138 Subject imports decreased substantially after the filing of the petitions at the end of June
2020. CR/PR at Table IV-6. As a result, subject imports’ market share was lower in interim 2020 at *** percent than in interim 2019 at *** percent. CR/PR at Tables IV-8, C-1. At the same time, the domestic industry’s U.S. shipments and market share increased. Mosaic diverted shipments that had been destined for export markets and drew down inventories, for a total of *** short tons in additional sales in interim 2020 compared to interim 2019. Mosaic Posthearing Br. at Responses to Questions p. 84; Mosaic U.S. Producer Questionnaire Response at IV-16. *** also reported more U.S. shipments in interim 2020 than in interim 2019. *** U.S. Producer Questionnaire Responses at II-7; *** U.S. Producer Questionnaire Responses at II-7. Consequently, the domestic industry’s market share was higher in interim 2020 at *** percent than in interim 2019 at *** percent.
139 19 U.S.C. § 1677(7)(C)(ii).
28
customers.140 141 One U.S. producer (***) and seven importers provided usable pricing data, although not all firms reported pricing for both products for all months of the POI.142 Pricing data reported by these firms accounted for approximately *** percent of U.S. producers’ U.S. commercial shipments, *** percent of U.S. shipments of subject imports from Morocco, and *** percent of U.S. shipments of subject imports from Russia in 2019.143
The pricing data show that cumulated subject imports undersold the domestic like product in 34 of 170 instances (involving 381,132 short tons) at underselling margins ranging from 0.02 to 4.4 percent and an average underselling margin of 1.7 percent. Subject imports oversold the domestic like product in the remaining 136 instances (involving 2.0 million short tons) at overselling margins between 0.02 and 17.6 percent with an average overselling margin of 3.7 percent.144
We observe that underselling and overselling margins were small and prices of the
140 CR/PR at V-9. The two pricing products were: (1) Standard-grade monoammonium
phosphate (MAP), chemical formula NH4H2PO4, granular, excluding high-purity MAP; and (2) Standard-grade diammonium phosphate (DAP), chemical formula (NH4)2(HPO4), granular. See id.
141 OCP asserts that the Commission’s collection of f.o.b. prices of shipments from NOLA resulted in understated frequency and margins of overselling because Mosaic’s reported sales included the cost of freight transported from its plants in Florida to NOLA while import prices did not include such inland transportation costs. OCP Prehearing Br. at 85-86; OCP Final Comments at 7. The record, however, indicates that the “f.o.b. NOLA price” is a universal price benchmark denoting a loaded barge at a dock/fleeting point in New Orleans irrespective of where the product originated, and is used as a primary point of reference in price negotiations in the U.S. market. Mosaic Posthearing Br. at Responses to Questions pp. 28-30; Simplot Posthearing Br. at Responses to Questions pp. 60-62; Hearing Tr. at 33-34 (Jung), 287 (Groden). In their daily or weekly price listings, trade publications Argus and Green Markets include “f.o.b. from NOLA” or “NOLA Barge” phosphate fertilizer prices. CR/PR at V-5 n.5. Domestic producers, therefore, compete with subject imports upon the f.o.b. NOLA price in selling product, and Mosaic states that to compete against subject imports at NOLA from its plants in Florida, it has to absorb the $20 per short ton cross-Gulf freight costs. Mosaic Posthearing Br. at Responses to Questions pp. 29-30; Simplot Posthearing Br. at Responses to Questions pp. 60-62. Thus, “for a selling price of $300/ST fob NOLA to be competitive with subject imports, it would have to be priced at $280/ST fob Florida plant.” Mosaic Posthearing Br. at Responses to Questions p.30.
142 CR/PR at V-9. ***. CR/PR at V-9 n.12. 143 CR/PR at V-9. 144 CR/PR at Table V-7. Mosaic argues that the pricing data, as collected, conceal the full extent
of underselling by subject imports because: (1) the prices reported by *** were not on an f.o.b. NOLA basis; and (2) the pricing data did not capture competition at the first level of trade between subject imports and the domestic like product (i.e., U.S. importer purchase cost data). However, Commission Staff contacted *** as requested by the questionnaire. EDIS Document 735889. Moreover, the Commission Staff collected monthly import data entry AUVs for MAP and DAP and requested supplemental pricing data ***, which Mosaic acknowledges “at least address the level of trade issues.” EDIS Document 735870. These additional data corroborate the comprehensive pricing data, which show prices for subject imports and the domestic like product closely tracking each other.
29
domestic like product and subject imports tracked each other closely over the POI.145 That subject imports and the domestic like product were similarly priced is consistent with the high degree of substitutability between the domestic like product and subject imports, as well as the price transparency that existed in the U.S. phosphate fertilizer market. All purchasers reported that prices of the domestic like product were comparable or inferior (i.e., higher priced) to prices of subject imports from Morocco and Russia.146 Some purchasers also confirmed purchasing subject imports instead of the domestic like product due to their lower prices. Seventeen of 28 U.S. purchasers reported that they had purchased imported phosphate fertilizers from Morocco and/or Russia instead of the domestic like product. Nine of these 17 purchasers reported that subject imports were lower priced than the domestic product, and 5 of these 9 purchasers reported that price was a primary reason for purchasing subject imports rather than the domestic like product.147 Four U.S. purchasers confirmed lost sales totaling 733,895 short tons over the POI. The reported lost sales volume equates to approximately 97.3 percent of the increase in U.S. shipments of subject imports, which increased by 753,938 short tons, from 2017 to 2019.148 In addition, as discussed further below, the record indicates that
145 CR/PR at Tables V-4-5, V-7. On average, the underselling margin was *** for product 1 and
*** for product 2 while the overselling margin was *** percent for product 1 and *** percent for product 2. CR/PR at Table V-7. A Mosaic representative testified at the hearing that “{t}he Commission's price data show more instances of overselling than underselling. The Commission should not construe this as evidence of the absence of adverse price effects to the domestic industry. First, prices are close, with average over- or underselling margins within {what} one would expect for a commodity industry with transparent pricing. But the price trends between U.S. producers and importers were very highly correlated over time.” Hearing Tr. at 61 (Klett).
146 CR/PR at Table II-9. Twenty of 24 firms reported that the domestic like product and subject imports from Morocco were comparable on price; 20 of 23 did so for the domestic like product and subject imports from Russia. Four and three purchasers reported prices of the domestic like product to be inferior (i.e., higher priced) to prices of subject imports from Morocco and Russia, respectively, while no purchaser reported prices of the domestic like product to be superior (i.e., lower priced) to prices of subject imports from Morocco or Russia. Id.
147 CR/PR at Table V-9. 148 CR/PR at Table V-9. Respondents argue that ***, which accounted for *** percent of the
total quantity of reported lost sales, directly contradicted its lost revenue response submitted in the preliminary phase of the investigations, and upon this basis, request that *** reported amount be discounted. OCP Prehearing Br. at 96-97; Gavilon Prehearing Br. at 50. We find, however, that the record does not support disregarding the *** short tons of subject imports that *** reported purchasing instead of the domestic like product due at least primarily in part to the lower price of subject imports. In these final phase investigations, Growmark reported that subject imports were priced lower than the domestic product, and that price was a primary reason for purchasing subject imports instead of domestic product. *** CR/PR at V-23 n.14 (emphasis provided). Thus, while some portion of the reported quantity of lost sales may also have been influenced by non-price reasons, *** clarified that *** and that ***.
30
importers of subject merchandise in instances offered lower prices than domestic producers during 2019 in a declining market.149 Thus, while we recognize the prevalence of overselling in the pricing data, the record also demonstrates that, consistent with the high degree of price transparency in this market, the prices of the domestic product and subject imports tracked each other closely and were generally comparable with small margins of underselling and overselling, that subject imports were in some instances lower priced, and the domestic industry lost sales to subject imports because of lower prices.
We have also considered price trends for the domestic like product and subject imports. During the POI, prices for both the domestic like product and subject imports increased between 2017 and most of 2018, and then declined between 2018 and 2019.150 Prices in interim 2020 increased, but remained below levels in January 2017 until after the filing of the petitions at the end of June 2020, after which prices experienced dramatic increases as subject import volumes to the U.S. market decreased and subject import end-of-period inventory levels decreased.151
The record shows that significant volumes of subject imports entered the U.S. market between 2017 and 2018 and remained at elevated levels in 2019 despite a significant demand decline due to what an OCP witness characterized as “Black Swan” level rainfall beginning in the fall of 2018 and lasting through 2019.152 As respondents acknowledge, heavy precipitation in the fall of 2018, a polar vortex in the winter of 2018-2019, and record setting precipitation in the spring of 2019 caused massive flooding and prolonged river closures along the Mississippi River system that stranded fertilizer barges and resulted in delayed, destroyed, or abandoned plantings, especially in the Midwest and Great Plains regions.153 OCP observed that the USDA’s
149 Mosaic Posthearing Brief at Responses to Questions, pp. 44-46 and Exhibits 50 and 51. 150 CR/PR at Tables V-4-5. 151 CR/PR at Tables V-4-5. Between 2017 to 2019, prices for the domestic like product decreased
overall by *** percent for pricing product 1 and by *** percent for pricing product 2. Prices for subject imports decreased overall by *** percent for pricing product 1 and by *** percent for pricing product 2. Derived from CR/PR at Tables V-4-5. U.S. importers’ inventories of subject imports declined from *** short tons at the end of the interim 2019 period to *** short tons at the end of the interim 2020 period. CR/PR at Table C-1.
152 Hearing Tr. at 220-22 (Rahm); see also Mosaic Prehearing Br. at 88-91; Mosaic Posthearing Br. at 3, 13, Responses to Questions pp. 20-21.
153 OCP Prehearing Br. at 35-36, 46-48; Gavilon Prehearing Br. at 11-12; PhosAgro Prehearing Br. at 6-7; IRM Prehearing Br. at 15-16; PhosAgro Posthearing Br. at 3-4. As further detailed below, the trade publication Argus repeatedly referenced oversupply conditions in early 2019, as follows: “The ‘polar vortex’ in the US midwest saw temperatures plummet. The US domestic market followed suit. Put simply, the US market ‘tanked’ on cold weather, a full pipeline and heavy imports (January 31,
(continued...)

31
Farm Service Agency, which tracks agricultural acreage that farmers did not use in a particular season, reported that the volume of “prevented planting acreage” in 2019 set a U.S. record – by a wide margin – at 19.6 million acres.154 Apparent U.S. consumption of phosphate fertilizers declined by *** percent from 2018 to 2019, more than *** short tons, to below 2017 apparent consumption levels.155
Yet notwithstanding these market conditions, subject imports continued to enter the market, and U.S. shipments of subject imports increased by 300,000 short tons (6.2 percent) between 2018 and 2019. As a result, U.S. shipments of subject imports exceeded demand,156 and shipments of subject imports increased their share of the market at the expense of the domestic industry and nonsubject imports.157 U.S. importers’ inventories of subject imports in 2018 and 2019 remained at elevated levels compared to 2017.158 Trade publications contemporaneously reported about oversupply conditions caused by “heavy imports” in a “tank{ing}” U.S. market,159 and record data confirm the significant build-up of subject
2019); “{T}he US is awash with imports . . . Pushing so much DAP/MAP to the US has led to oversupply” (February 7, 2019); “The US has a record surplus of phosphates entering the spring season, boosted by weak sales, terrible weather conditions and heavy 1Q imports, which reached a record 1.2mn t of DAP/MAP, up 27pc yoy” (March 28, 2019). Petition, Volume I, Exhibits I-29, I-30, I-33.
154 OCP Prehearing Br. at 47-48. 155 U.S. apparent consumption declined by *** percent from 2018 to 2019, reflecting a ***
percent decline in U.S. producers’ U.S. shipments, an 11.8 percent decline in U.S. shipments of nonsubject imports, and a 6.2 percent increase in U.S. shipments of subject imports. CR/PR at Table C-1. We observe that this decline in apparent U.S. consumption likely does not fully reflect the decline in actual demand in 2019, given the extent and nature of the demand shocks reviewed above and the oversupply of subject imports as explained below.
156 While subject import volumes declined from the previous year and were lower in most months, the increase in subject imports’ end-of-quarter inventories from March through September 2019 indicate that these levels continued to exceed demand. CR/PR at Tables IV-6 and D-1.
157 CR/PR at Table C-1. 158 CR/PR at Tables C-1, D-1. 159 Petition, Volume I, Exhibit I-33; see also Mosaic Prehearing Br. at 59-63; Mosaic Posthearing
Br. at 10-11; Simplot Prehearing Br. at 24-25, 27; Simplot Posthearing Br. at 10-11, Responses to Questions pp. 16, 5-51. Trade publication Argus reported:
• January 31, 2019: “The ‘polar vortex’ in the US midwest saw temperatures plummet. The US domestic market followed suit. Put simply, the US market ‘tanked’ on cold weather, a full pipeline and heavy imports. US DAP barges fell $10/st in a week. MAP prices are now in the mid/high-$360s/st fob Nola. . . .” Petition, Volume I, Exhibit I-33.
• February 7, 2019: “{T}he US is awash with imports . . . Pushing so much DAP/MAP to the US has led to oversupply.” Petition, Volume I, Exhibit I-29.
(continued...)
32
• February 28, 2019: “The heavy import line-up and ‘polar vortex’ in the US has resulted
in Nola DAP barges trading at $330-338/st – down by $14/st this week. . . .” Petition, Volume I, Exhibit I-34.
• March 28, 2019: “The US has a record surplus of phosphates entering the spring season, boosted by weak sales, terrible weather conditions and heavy 1Q imports, which reached a record 1.2mn t of DAP/MAP, up 27pc yoy.” Petition, Volume I, Exhibit I-30.
• April 18, 2019: “DAP/MAP supply for 1Q is estimated at 2.3mn t. The US DAP barge price fell again by $5/st on oversupply amid heavy imports.” Petition, Volume I, Exhibit I-35.
• July 18, 2019: “Ample spot availability has driven US phosphate values down this week to $304-310/st fob Nola DAP/MAP on confirmed trade. . . . Price pressure is poised to persist in the near-term with continued imports scheduled for July discharge.” Petition, Volume I, Exhibit 36.
• August 4, 2019: “Rather than maintain prices, OCP appears to be gunning for volume. . . . Downward price pressure persisted along the US Gulf coast this week, with DAP barge values assessed at $298-300/st fob Nola – the lowest price level in nearly two years on a midpoint basis, according to Argus data. . . . A slate of three additional cargoes from Morocco for August arrival is anticipated to keep a lid on near-term prices, which have been steered by imports following spring applications. DAP imports during the 2018-19 fertilizer year reached an all-time high of 1.26mn/t on increased shipments from Morocco and Russia, according to customs data.” Petition, Volume I, Exhibit I-37.
• August 15, 2019: “In the US, two DAP barges traded in a $288-294/st fob range for September – a 10-year low. . . . The driver is a substantial domestic carryover from spring, plus heavy imports and lower grain prices.” Petition, Volume I, Exhibit I-38.
• September 26, 2019: “Mosaic has sold three October-loading DAP barges at $288/st fob Nola. But the slight firmness in the US DAP market exhibited after the Mosaic production cut subsided this week as barge values slipped below $290/st fob Nola for October shipment. DAP traded at $286-288/st fob Nola – the lowest price level since early-September. Market sentiment . . . remained bearish for near-term price movement, especially as imports continue to discharge at the US Gulf coast at the current pace. The 500,000t of lost production at Mosaic’s Faustina plant during the fourth quarter is poised to be replaced by offshore volumes, likely minimizing upward momentum to Nola values.” Petition, Volume I, Exhibit I-39.
• November 7, 2019: “US producer Nutrien called further US production cuts a ‘futile game’ this week. Nutrien argues that the market is weak because of fundamental structural oversupply and that further cuts simply signal to OCP, Russian and other producers to ship more to the US. . . . Phosphate barge values continued to fall this week as high buyer inventories and delays to fall application season weighed on market sentiment. . . . With inventories still full from two lackluster application seasons and more phosphate fertilizer shipments on the way, many doubt fall demand will be enough to rebalance the domestic phosphates market.” Petition, Volume I, Exhibit I-43.
*** also reported on the oversupply condition in the U.S. market due to a poor application season in the fall of 2018 and a “surge in imports in recent months.” Mosaic Posthearing Br. at Exhibits 3, 6, 14. *** discussed the ***. Simplot Posthearing Br. at Exhibits 6, 17-19. We note that subject imports from Morocco and Russia accounted for 84.1 percent of total import volume in 2019, up from
(continued...)
33
inventories.160 161 Meanwhile, record evidence shows that subject imports were being offered at low prices during this time.162 163
The record therefore demonstrates that subject imports – through their significant volumes that created oversupply conditions in a declining market and low prices – exerted downward pricing pressure on the domestic like product and significantly depressed U.S. prices in 2019. Moreover, these prices remained at lower levels in 2020 before the petitions were filed. Indeed, of the 28 responding purchasers, seven reported that U.S. producers had reduced
83.0 percent in 2018. CR/PR at Table IV-2. The volume of cumulated subject imports declined by 9.5 percent between 2018 and 2019, while the volume of nonsubject imports declined by 16.0 percent. CR/PR at Table IV-2. U.S. shipments of subject imports increased by 6.2 percent between 2018 and 2019, while shipments of nonsubject imports decreased by 11.8 percent. CR/PR at Table C-1. Moreover, respondents’ witness even testified that NOLA prices were lower than prices in Brazil due to a market imbalance, and that inventory build-up was due to excessive rainfall and was not worked down “until the end of the strong fall 2020 application season.” Hearing Tr. at 192-193 (Rahm).
160 CR/PR at Tables C-1, D-1. U.S. importers’ ending inventories of subject imports in 2018 and 2019 were *** percent and *** percent higher, respectively, than ending inventories in 2017. CR/PR at Table C-1. In 2019 as weather conditions resulted in reduced crop plantings, subject imports’ end-of-quarter inventories were higher in March, June, and September than in equivalent quarters in prior years. Subject import inventory levels remained at elevated levels at the end of the first and second quarters of 2020, but dropped at the end of the third quarter of 2020 as subject imports to the U.S. market decreased after the petitions were filed at the end of June 2020. CR/PR at Table D-1.
161 Respondents blame the oversupply conditions on demand projections that failed to materialize. OCP Prehearing Br. at 70-73; Koch Prehearing Br. at 6-7; EuroChem Prehearing Br. at 8-9; EuroChem Posthearing Br. at 8-9; OCP Posthearing Br. at Responses to Questions pp. 27-30; Gavilon Posthearing Br. at Responses to Questions pp. 5-6; IRM Posthearing Br. at 7. Regardless of the reasonableness of any demand projections, the record supports that importers’ import levels and inventories exceeded demand and contributed to an oversupply of the U.S. market. U.S. importers continued to import subject phosphate fertilizers because it was more “economical” to do so rather than pay U.S. inland freight to move their existing inventories. Hearing Tr. at 227 (Lambert). Moreover, as U.S. importers informed, they were ***. See, e.g., ADM Posthearing Br. at 8-9 (stating that ***); Hearing Tr. at 227 (Lambert) (stating that “{t}hose vessels were coming. And once they’re on their way, they’re coming here”); 223-224 (Niederer).
162 Mosaic submitted communications from purchasers showing that low priced subject imports were being offered during this time. Mosaic Posthearing Br. at Responses to Questions pp. 36-37, Exhibits 41-46. For instance, in January 2019, ***. Mosaic Posthearing Br. at Exhibit 44. U.S. purchaser *** reported that ***. *** U.S. Purchaser Questionnaire Response at III-29(b). Simplot also claims that lower-priced imports forced it to lower its prices. Simplot Posthearing Br. at Responses to Questions pp. 35-37, Exhibit 4.
163 We also note that record information shows that *** was the lowest priced in the U.S. market ***. Mosaic Posthearing Br. at Responses to Questions pp. 45-46, Exhibit 51 (exhibit data sourced from responses to Commission questionnaires). In addition, although not specific to 2019, as noted above, purchasers confirmed lost sales totaling 733,895 short tons over the POI.

34
prices in order to compete with lower-priced imports from the subject countries.164 U.S. purchasers also reported about the adverse effects caused by subject imports during 2019. For instance, U.S. purchaser *** informed how ***.165 U.S. purchaser *** reported that ***.166 U.S. purchaser *** explained that ***.167 Notwithstanding that some purchasers were unable to obtain supply from Mosaic at times during the POI,168 we find that the record as a whole shows that subject imports contributed significantly to oversupply conditions in a declining market and had significant price-depressing effects on prices in the U.S. market in 2019.
Respondents argue that rather than subject imports, the price declines were attributable to declines in global prices and U.S. demand.169 Although those factors may have contributed to price movements in the U.S. market, they do not negate the significant role that subject imports played in depressing domestic prices, as shown by the evidence discussed above. Respondents’ arguments also fail to account for the fact that prices in other global markets were also affected by exports from subject producers in Morocco and Russia, collectively, the world’s largest exporters of phosphate fertilizers.170 Moreover, in 2019 as subject imports remained at elevated levels in an oversupplied and declining market, U.S. prices were lower than global prices.171 Although U.S. prices began to increase in the beginning of 2020 as weather conditions improved, they remained at levels lower than those that existed in 2017 and 2018 until after the filing of the petitions at the end of June 2020, at which point they sharply increased to levels above other global markets, which supports the price-depressing
164 CR/PR at Table V-11. Seven purchasers reported that U.S. producers had not reduced prices
in order to compete with lower-priced imports from the subject countries, and 14 reported that they did not know. Five firms estimated domestic price reductions to compete with product imported from Morocco, and four estimated domestic price reductions to compete with product imported from Russia. The reported estimated price reductions ranged from *** percent to *** percent, for an average of 16.0 percent. CR/PR at V-25.
165 *** U.S. Purchaser Questionnaire Response at III-8(b). *** also reported that *** CR/PR at Table V-11.
166 *** U.S. Purchaser Questionnaire Response at II-2. In reporting that U.S. producers lowered prices by an estimated *** percent in order to compete with lower-priced subject imports, *** stated that *** CR/PR at Table V-11.
167 CR/PR at Table V-11; *** U.S. Purchaser Questionnaire Response at III-29. 168 See, e.g., Gavilon Prehearing Br. at 20-24, Exhibit 7; IRM Prehearing Br. at 12-15, 18-19; IRM
Posthearing Br. at Exhibit 4; ADM Posthearing Br. at Exhibit 1; Hearing Tr. at 205-206 (Coppess); Response of ***, CR/PR at Table V-11.
169 OCP Prehearing Br. at 77, 88; PhosAgro Prehearing Br. at 26; Koch Prehearing Br. at 2; EuroChem Prehearing Br. at 2; OCP Posthearing Br. at 9-11; PhosAgro Posthearing Br. at 12-13; Koch Posthearing Br. at 1, 4-7.
170 CR/PR at Table VII-14. 171 Derived from CR/PR at Tables V-4-5; see also OCP Posthearing Br. at 11, Responses to
Questions pp. 67-69.

35
effects of subject imports on U.S. prices over this time.172 Thus, for the foregoing reasons, we find that subject imports from Morocco and Russia
depressed prices to a significant degree. We have also considered whether subject imports prevented price increases of the domestic like product, which otherwise would have occurred to a significant degree. The record indicates the domestic industry’s ratio of COGS to net sales decreased from *** percent in 2017 to *** percent in 2018 and then increased to *** percent in 2019; it was higher in interim 2020 at *** percent than in interim 2019 at *** percent.173
Between 2017 and 2018, the domestic industry’s total COGS decreased by *** percent. The domestic industry’s net sales volume, however, also decreased, resulting in the industry’s unit COGS increasing from $*** per short ton in 2017 to $*** per short ton in 2018. Specifically, the domestic industry’s unit raw material costs increased from $*** per short ton in 2017 to $*** per short ton in 2018, and the industry’s unit other factory costs increased from $*** per short ton in 2017 to $*** per short ton in 2018, while the industry’s unit direct labor costs remained the same at $*** per short ton in 2017 and 2018.174 Notwithstanding this, the domestic industry’s COGS to net sales ratio declined because the domestic industry’s unit net sales value, which increased from $*** per short ton in 2017 to $*** per short ton in 2018, exceeded the increase in the domestic industry’s unit COGS.175
Between 2018 and 2019, the domestic industry’s total COGS decreased by another *** percent, while the domestic industry’s net sales volume declined by *** percent and net sales value declined by *** percent, resulting in an increase in the industry’s COGS to net sales ratio.176 The domestic industry’s unit COGS increased from $*** per short ton in 2018 to $*** per short ton in 2019, with its unit raw material costs increasing from $*** per short ton in 2018 to $*** per short ton in 2019, and the industry’s unit other factory costs increasing from $*** per short ton in 2018 to $*** per short ton in 2019, while the industry’s unit direct labor costs decreased from $*** per short ton in 2017 and 2018 to $*** per short ton in 2019.177 While unit COGS increased, the domestic industry’s unit net sales value declined from $*** per
172 CR/PR at Tables V-4-5. Cumulated subject imports declined substantially after the filing of
the petitions, and subject imports from Morocco ceased entirely beginning in August 2020. CR/PR at Table IV-6. Total import volumes of phosphate fertilizers were lower in the third quarter of 2020 than in the third quarters of every other year in the POI. See id.
173 CR/PR at Tables IV-2, VI-1, and C-1. 174 CR/PR at Table VI-1. 175 CR/PR at Table VI-1. 176 CR/PR at Table VI-1. 177 CR/PR at Table VI-1.
36
short ton in 2018 to $*** per short ton in 2019,178 resulting in a *** percentage point increase in the domestic industry’s COGS to net sales ratio.179 This occurred as poor weather conditions led to a decline in U.S. demand in 2019, and a significant volume of low priced subject imports continued to enter the U.S. market, causing oversupply conditions and prices to decline. Although the domestic industry attempted to offset the collapse in U.S. prices by idling capacity and curtailing production,180 the record as a whole indicates that subject imports contributed significantly to the market imbalance between supply and demand that occurred in the latter half of the POI and, as found above, depressed prices to a significant degree.181 182
In sum, for the foregoing reasons, we find that subject imports from Morocco and Russia depressed prices to a significant degree. We accordingly conclude that subject imports had significant price effects.
E. Impact of the Subject Imports
Section 771(7)(C)(iii) of the Tariff Act provides that the Commission, in examining the impact of the subject imports on the domestic industry, “shall evaluate all relevant economic factors which have a bearing on the state of the industry.”183 These factors include output, sales, inventories, capacity utilization, market share, employment, wages, productivity, profits, cash flow, return on investment, ability to raise capital, research and development, and factors affecting domestic prices. No single factor is dispositive and all relevant factors are considered “within the context of the business cycle and conditions of competition that are distinctive to the affected industry.”184
178 CR/PR at Table VI-1. 179 CR/PR at Table C-1. 180 CR/PR at Table III-3; Mosaic Prehearing Br. at 2, Mosaic Posthearing Br. at Responses to
Questions pp. 10-23, Exhibits 17-19. 181 Mosaic Prehearing Br. at 59-63; Mosaic Posthearing Br. at 10-11. Mosaic states that in
addition to idling facilities and curtailing production, it also increased exports because the U.S. market could not absorb additional supply. Mosaic Posthearing Br. at 11.
182 Although the domestic industry’s unit raw material costs, unit other factory costs, and unit direct labor costs were lower in interim 2020 than in interim 2019, its unit net sales values were also lower, resulting in a higher COGS to net sales ratio in interim 2020 than in interim 2019.
183 19 U.S.C. § 1677(7)(C)(iii); see also SAA at 851 and 885 (“In material injury determinations, the Commission considers, in addition to imports, other factors that may be contributing to overall injury. While these factors, in some cases, may account for the injury to the domestic industry, they also may demonstrate that an industry is facing difficulties from a variety of sources and is vulnerable to dumped or subsidized imports.”).
184 19 U.S.C. § 1677(7)(C)(iii). This provision was amended by the Trade Preferences Extension Act of 2015, Pub. L. 114-27.
37
The domestic industry’s output indicators declined from 2017 to 2019, but were higher in interim 2020 than in interim 2019.185 Specifically, the domestic industry’s share of apparent U.S. consumption declined from *** percent in 2017 to *** percent in 2018 and *** percent in 2019; its market share was higher in interim 2020 at *** percent than in interim 2019 at *** percent.186 Its production decreased by *** percent between 2017 and 2019 from *** short tons in 2017 to *** short tons in 2018 to *** short tons in 2019; its production was higher in interim 2020 at *** short tons than in interim 2019 at *** short tons.187 Its capacity declined by *** percent from 2017 to 2019, from *** short tons in 2017 to *** short tons in 2018 and *** short tons in 2019,188 and its capacity utilization increased by *** percentage points from *** percent in 2017 to *** percent in 2018 to *** percent in 2019.189 The domestic industry’s capacity was higher in interim 2020 at *** short tons than in interim 2019 at *** short tons, while its capacity utilization was lower in interim 2020 at *** percent than in interim 2019 at *** percent.190
The domestic industry’s U.S. shipments declined by *** percent between 2017 and 2019, from *** short tons in 2017 to *** short tons in 2018 and *** short tons in 2019; its U.S. shipments were higher in interim 2020 at *** short tons than in interim 2019 at *** short tons.191 The domestic industry’s end-of-period inventories increased by *** percent from 2017 to 2019, from *** short tons in 2017 to *** short tons in 2018 and 2019; its end-of-period inventories were lower in interim 2020 at *** short tons than in interim 2019 at *** short
185 As previously noted, after the petitions were filed at the end of June 2020, subject imports
decreased in the U.S. market. Mosaic restarted production at previously idled facilities, diverted shipments that had been destined for export markets, and drew down inventories, for a total of *** short tons in additional sales in interim 2020 compared to interim 2019. Mosaic U.S. Producer Questionnaire Response at IV-16. *** also reported more U.S. shipments in interim 2020 than in interim 2019. *** U.S. Producer Questionnaire Responses at II-7; *** U.S. Producer Questionnaire Responses at II-7. Consequently, the domestic industry’s market share, capacity, production, and U.S. shipments were higher in interim 2020 at *** percent than in interim 2019 at *** percent in interim 2019.
186 CR/PR at Tables IV-8, C-1. 187 CR/PR at Tables III-4, C-1. 188 CR/PR at Tables III-4, C-1. 189 CR/PR at Tables III-4, C-1. 190 CR/PR at Tables III-4, C-1. 191 CR/PR at Tables III-6, C-1.
38
tons.192 The domestic industry’s ratio of end-of-period inventories to total shipments increased steadily from 2017 to 2019; but was lower in interim 2020 than in interim 2019.193
Employment indicators for the domestic industry also declined between 2017 and 2019. The domestic industry’s number of production and related workers (“PRWs”) fell from *** in 2017 to *** in 2018 and *** in 2019; its number of PRWs was lower in interim 2020 at *** than in interim 2019 at ***.194 Total hours worked,195 wages paid,196 and productivity197 also fell from 2017 to 2019. Total hours worked and wages paid were lower in interim 2020 than in interim 2019 while productivity was higher between the interim periods.198
The domestic industry’s net sales, gross profit, operating income, and net income increased between 2017 and 2018, but deteriorated in 2019. Most of the industry’s financial indicators were lower in interim 2020 than in interim 2019.199 Specifically, the domestic industry’s net sales by value increased from $*** in 2017 to $*** in 2018, then declined to $*** in 2019; its net sales by value was lower in interim 2020 at $*** than in interim 2019 at $***.200 Its gross profit increased from $*** in 2017 to $*** in 2018, then declined to ***; its gross profit was lower in interim 2020 at *** than in interim 2019 at ***.201 The industry’s operating income increased from $*** in 2017 to $*** in 2018, then declined to *** in 2019; its operating income was lower in interim 2020 at *** than in interim 2019 at ***.202 The ratio of operating income to net sales increased from *** percent in 2017 to *** percent in 2018, then declined to *** percent in 2019; it was lower in interim 2020 at *** percent than in
192 CR/PR at Tables III-7, C-1. 193 CR/PR at Tables III-7, C-1. The ratio of end-of-period inventories to U.S. shipments was ***
percent in 2017, *** percent in 2018, and *** percent in 2019. It was lower in interim 2020 at *** percent than in interim 2019 at *** percent. Id.
194 CR/PR at Tables III-9; C-1. 195 CR/PR at Tables III-9; C-1. Total hours worked decreased from *** hours in 2017 to ***
hours in 2018 and *** hours in 2019. See id. 196 CR/PR at Tables III-9; C-1. Wages paid decreased from $*** in 2017 to $*** in 2018 to $***
in 2019. See id. 197 CR/PR at Tables III-9; C-1. Productivity per 1,000 hours decreased from *** short tons in
2017 to *** short tons in 2018 and *** short tons in 2019. See id. 198 Total hours worked were *** hours in interim 2019 and *** hours in interim 2020. Wages
paid were $*** in interim 2019 and $*** in interim 2020. Productivity was *** short tons in interim 2019 and *** short tons in interim 2020. CR/PR at Tables III-9; C-1.
199 U.S. prices at the beginning of 2019 were higher than later in the year. Consequently, interim 2020 prices, although precipitously increasing in the last three months of the POI after the petitions were filed, remained at lower levels than in interim 2019, which, in turn resulted in lower gross profit levels despite increasing net sales quantity and lower COGS. CR/PR at VI-9, Tables V-4-5, VI-1-2.
200 CR/PR at Tables VI-1, C-1. 201 CR/PR at Tables VI-1, C-1. 202 CR/PR at Tables VI-1, C-1.
39
interim 2019 at *** percent.203 The domestic industry’s net income increased from $*** in 2017 to $*** in 2018, then declined to ***; its net income was higher in interim 2020 at *** than in interim 2019 at ***.204
Domestic producers’ capital expenditures increased from $*** in 2017 to $*** in 2018 and $*** in 2019,205 206 while research and development expenses decreased each year from $*** in 2017 to $*** in 2018 and $*** in 2019.207 *** also reported negative effects on investment and growth and development that *** attributed to subject imports.208
As discussed above, we have found that the volume of cumulated subject imports and the increase in the volume were significant during the period of investigation. Subject imports poured into the U.S. market over the POI and gained *** percentage points in market share from the domestic industry. Subject imports continued to enter the U.S. market at elevated levels in 2019 even as demand declined in the second half of 2018 through 2019, causing an oversupply in the U.S. market and significantly depressing U.S. prices.209 Due to the downward pricing pressure exerted by the oversupply of subject imports on U.S. prices, the domestic industry was forced to reduce prices, which in turn, caused its revenues to be lower than they would have been otherwise. The domestic industry’s sales revenues declined between 2018 and 2019 along with its profitability as its COGS to net sales ratio rose above *** percent.210 Sales revenues and profitability continued to be weak and the industry’s COGS to net sales ratio remained above *** percent into interim 2020.211 As a consequence, we find that subject imports had a significant impact on the domestic industry.
We have considered the role of other factors so as not to attribute injury from other factors to the subject imports. In doing so, we have considered respondents’ arguments that
203 CR/PR at Tables VI-1, C-1. 204 CR/PR at Tables VI-1, C-1. The ratio of net income to net sales increased from *** percent in
2017 to *** percent in 2018, then declined to *** percent in 2019; it was slightly higher in interim 2020 at *** percent than in interim 2019 at *** percent. Id.
205 CR/PR at Tables VI-6, C-1. The domestic producers’ capital expenditures were higher in interim 2020 at $*** than in interim 2019 at $***. See id.
206 All three U.S. producers reported ***. Specifically, *** explained that ***. *** reported that its capital expenditures related to ***. *** reported that ***. CR/PR at Table VI-7.
207 CR/PR at Tables VI-6, C-1. The domestic producers’ research and development expenses were lower in interim 2020 at $*** than in interim 2019 at $***. See id.
208 CR/PR at Tables VI-9-10. 209 U.S. importers’ U.S. shipments of subject imports increased by 6.2 percent from 2018 to 2019
despite a *** percent decline in apparent U.S. consumption. U.S. producers’ U.S. shipments declined to a greater degree (*** percent) between 2018 and 2019. U.S. importers’ inventories of subject imports in 2018 and 2019 remained at elevated levels compared to 2017. CR/PR at Tables C-1, D-1.
210 CR/PR at Table IV-3. 211 CR/PR at Table IV-3.
40
the domestic industry’s poor performance was not caused by subject imports, but rather was the result of other factors. Specifically, we considered the role of declining U.S. demand in 2019 due to unusually poor weather conditions.212 Subject imports increased their U.S. shipment volume even as demand declined significantly in 2019 and gained *** percentage points of market share between 2018 and 2019, and, as discussed above, subject imports also depressed U.S. prices. The downward force of demand declines in 2019 on the domestic industry’s condition therefore does not rebut that the industry’s performance would have been stronger in the absence of the significant volume of subject imports from Morocco and Russia that exerted downward pricing pressure on the domestic industry.
Respondents argue that subject imports merely filled a supply gap created by Mosaic’s decision to idle its Plant City facility in December 2017,213 which was exacerbated by Nutrien’s announcement in February 2018 to close its Redwater facility in Canada.214 Although Mosaic
212 OCP Prehearing Br. at 108-116; Gavilon Prehearing Br. at 64-65; PhosAgro Prehearing Br. at
21-22; IRM Prehearing Br. at 31; PhosAgro Posthearing Br. at 9-10. 213 OCP Prehearing Br. at 7, 24-32, 62-63; Gavilon Prehearing Br. at 20, 24-25, 34; IRM
Prehearing Br. at 6-9, 19-20, 24-25; OCP Posthearing Br. at 2, 4, Responses to Questions pp. 14-15, 77-78; IRM Posthearing Br. at 5. Respondents, referring to Mosaic’s public statements regarding giving up “1 million tonnes of market here in the U.S. intentionally,” argue that idling the facility was part of Mosaic’s global strategy to invest in lower-cost production facilities overseas and bring in product from its joint venture in Saudi Arabia. Mosaic firmly denies that it deliberately idled Plant City – which it states had accounted for 700,000 short tons of phosphate fertilizer sold into the U.S. market in 2017 – for this purpose, and we observe that Mosaic *** import from its joint venture in Saudi Arabia during the POI, and that imports from Saudi Arabia remained at much lower levels than subject imports or the “1 million tonnes” hole in the U.S. market that respondents claim the Plant City closure created. CR/PR at IV-6 & Table C-1. Mosaic claims that the increasing volumes of subject imports played a significant role in driving prices to levels that made it uneconomical for it to operate its Plant City, Florida facility in 2017 in the first instance, and that its decision to idle Plant City ultimately helped balance global phosphate supply and demand, and tightened U.S. supply, which caused U.S. prices to increase in 2018. This price increase, Mosaic asserts, was temporary as subject imports increased, causing a supply glut and declining prices. Mosaic Prehearing Br. at 58-59; Mosaic Posthearing Br. at Responses to Questions pp. 10-17, Exhibit 14. Incurring tens of millions of dollars in costs to idle Plant City, Mosaic states that it preserved the option of reopening the facility in the event of a significant, sustained improvement in market conditions, which did not occur due to subject imports. It ultimately was forced to close the facility in June 2019. Mosaic Posthearing Br. at Responses to Questions pp. 22-23.
214 OCP Posthearing Br. at 3, Responses to Questions pp. 15-16; IRM Posthearing Br. at 3; Koch Posthearing Br. at 2. In May 2019, Nutrien converted its phosphate operation in Redwater, Canada (***) to an ammonium sulfate plant. CR/PR at III-3 and Table III-3. As Nutrien announced at the time, it increased production at its U.S. facilities in Aurora, North Carolina and White Springs, Florida in order to offset the reduction in supply from Redwater and ensure a continued supply of phosphate fertilizers to customers in Canada. CR/PR at III-3; Mosaic Prehearing Br. at Exhibit 13. ***, Nutrien *** its U.S.
(continued...)
41
concedes that after it had idled Plant City, it reduced its phosphate sales volume targets with certain larger customers – specifically, with CHS by 200,000 tons and with Gavilon by 100,000 tons relative to the prior year – as well as to some ***,215 we find that subject imports eclipsed any reduction in U.S. production between 2018 and 2019 when U.S. demand declined.216 Indeed, as record-setting precipitation impacted three planting seasons in a row beginning in the fall of 2018, the volume of subject imports persisted beyond levels demanded, resulting in a substantial buildup of U.S. importer inventories of subject imports and an oversupply condition in the U.S. market.217 218
Respondents further claim that Mosaic deliberately refused to supply U.S. customers in
production between 2018 and 2019 as demand declined. CR/PR at Table III-4. The record also shows that between 2017 and 2018, Nutrien had increased its capacity by 400,000 short tons due to ***. CR/PR at Table III-4 and III-5, n.18.
215 *** U.S. Producer Questionnaire Response at IV-16. 216 Mosaic Posthearing Br. at Responses to Questions p. 83. According to Mosaic, in 2017 the
Plant City facility produced roughly 700,000 short tons of phosphate fertilizers that were sold into the U.S. market. Hearing Tr. at 39, 111 (McLellan). Subject imports, however, increased by 1 million short tons from 2017 to 2018. CR/PR at Table IV-2. Mosaic further states that ***. Moreover, Mosaic states that it ***. Mosaic Posthearing Br. at Responses to Questions, p. 85. Mosaic also disputes other allegations of its refusal or inability to supply product during the POI. Specifically, Mosaic disputes ADM’s testimony that Mosaic “categorically refuses to sell to us.” Mosaic asserts that ***. Mosaic Posthearing Br. at Responses to Questions at pp. 86-87. Mosaic also contends that some of the supply issues identified by respondent parties are with broker/traders such as ADM and Koch that compete with the domestic industry for sales and rely on a small margin, high volume business model. Mosaic Final Comments at 6; Simplot Posthearing Br. at Exhibit 1 pp. 9-10, 21, 64 and Exhibit 5. Mosaic further contends that it has never had a sales relationship with IRM, and that it ***. Mosaic Posthearing Br. at Responses to Questions, pp. 87-88. Mosaic argues that many of the other alleged instances identified by respondents dealt with post-petition supply issues experienced by U.S. importers after their Moroccan and Russian suppliers largely and abruptly exited the U.S. market. Mosaic asserts that there was a supply shock, and Mosaic responded by diverting shipments headed to export markets and drawing down inventories. Mosaic Posthearing Br. at Responses to Questions p. 84; Mosaic Final Comments at 6.
217 Respondents argue that product was necessary to serve demand in U.S. regions unaffected by the poor weather conditions. However, this argument fails to explain why U.S. importers could not supply U.S. customers from its building inventories or from product that sat on barges on the Mississippi River system. Indeed, as U.S. importers acknowledged, it was possible for the U.S. importers to do so, but that it was costly to move product by rail or back down the Mississippi River. Consequently, they chose to import more product. Moreover, some U.S. importers were contractually obligated to import more product into an oversupplied market. EuroChem Posthearing Br. at 9-10; IRM Posthearing Br. at 7, Responses to Questions pp. 7-8; Koch Posthearing Br. at 12; ADM Posthearing Br. at 7-9; Gavilon Posthearing Br. at Responses to Questions pp. 5-6.
218 Moreover, while demand as measured by apparent U.S. consumption declined by *** short tons between 2018 and 2019, U.S. shipments of subject imports increased by *** short tons. CR/PR at Table C-1.

42
favor of exporting product.219 The record, however, does not support a finding that domestic producers prioritized export shipments to U.S. shipments. To the contrary, after subject imports declined in the U.S. market after the petitions were filed, the domestic industry increased production and U.S. shipments, and also diverted export shipments to make additional product available to U.S. customers.220 Mosaic explains that its export markets, such as India and Brazil, help support year-round capacity utilization rates during the “off-season” periods in the United States221 and are also used for “risk management” and to retain flexibility to ship product to third country markets during times when U.S. demand is low, such as in 2019.222 Further undermining respondents’ assertions of widespread or problematic issues with supply from domestic sources compared to subject sources, we observe that the majority of purchasers reported that the domestically produced product was either comparable or superior to product from Morocco (16 of 24 firms) and Russia (20 of 23 firms) in availability and reliability of supply.223
We also find that the record does not support respondents’ arguments that the domestic industry’s financial challenges were due to its cost challenges.224 As previously
219 Koch Prehearing Br. at 3-5; PhosAgro Prehearing Br. at 3; Koch Prehearing Br. at 2; EuroChem
Prehearing Br. at 5; OCP Posthearing Br. at 6-7. Although respondents argue that the Jones Act has made domestic vessel freight going from one U.S. port to another U.S. port to be a cost barrier for Mosaic, Mosaic disputes that the Jones Act results in prohibitive cross-Gulf freight costs from Tampa to NOLA. According to Mosaic, its cross-Gulf barge costs are lower than OCP’s freight costs from Morocco to NOLA, and that once product is loaded on barges at NOLA, subject imports and the domestic like product face the same costs to ship product. Mosaic Posthearing Br. at Responses to Questions, p. 90.
220 CR/PR Tables III-5, IV-7; Mosaic Posthearing Br. at Responses to Questions p. 84; Mosaic Final Comments at 6. Mosaic states that due to the abrupt departure of subject imports after the filing of the petitions and because facilities need time to ramp up production, it also had to import product from Saudi Arabia for the first time in late 2020. Hearing Tr. at 103-104 (Jung); Mosaic Posthearing Br. at Response to Questions p. 17 n.165.
221 Mosaic Prehearing Br. at 54. 222 Mosaic Posthearing Br. at 14; Hearing Tr. at 118-120 (O’Rourke). 223 CR/PR at Table II-9. Although 16 of 28 purchasers reported experiencing supply constraints,
we note that three of those purchasers (***, ***, and ***) specifically implicated U.S. importers only. Moreover, three other purchasers (***, ***, ***) pointed to experiencing constraints from both U.S. importers and domestic producers. And one purchaser (***) pointed to ***. ***, ***, ***, ***, ***, ***, and *** U.S. Purchaser Questionnaire Responses at III-11. Consequently, only nine of 28 responding purchasers – three of which were U.S. importers (***, ***, and ***) of subject phosphate fertilizers and *** – reported supply constraints with respect to the domestic like product only.
224 OCP Prehearing Br. at 113-115; EuroChem Prehearing Br. at 3-4. OCP also argues that Mosaic’s MES faced very little competition from NPS subject imports, and thus, to the extent that the domestic industry’s MES business was suffering losses, it was not by reason of subject imports. OCP
(continued...)

43
discussed, all major U.S. producers are vertically integrated with respect to the main raw material inputs used to produce phosphate fertilizers – sulfur, ammonia, and phosphate rock.225 To the extent domestic producers purchased certain quantities of raw materials,226 this did not adversely impact the domestic industry’s total COGS, which declined over the POI and was lower in interim 2020 than in interim 2019.227
Finally, we have also examined the role of nonsubject imports. Nonsubject imports increased over the POI,228 but they had a small presence in the U.S. phosphate fertilizer market. Their market share fluctuated, increasing from *** percent in 2017 to *** percent in 2018, before declining to *** percent in 2019, for an overall increase of *** percentage points between 2017 and 2019.229 The domestic industry, however, lost *** percentage points in market share between 2017 and 2019.230 Moreover, we have determined that subject imports significantly depressed U.S. prices in 2019. Thus, based on the available data, nonsubject imports cannot explain the magnitude of the domestic industry’s loss of market share or deterioration in performance in 2019.231 Were it not for the significant price depression caused
Prehearing Br. at 106-107. OCP’s argument fails to account for the fact that due to the broad interchangeability of different types of phosphate fertilizers particularly when used in blends, that prices for MAP and DAP can constrain prices for MES. Mosaic Posthearing Br. at Exhibit 12 (“While the MicroEssentials sales price relationships to Map remain consistent, the decline in MAP prices negatively impacted expected MicroEssentials margins in the period”).
225 CR/PR at V-1. 226 For instance, Mosaic states that it produces one-third of its ammonia, purchases another
third on the open market, and acquires a third through a long-term contract with CF Industries. Mosaic Posthearing Br. at Responses to Questions p. 95.
227 CR/PR at VI-1. Raw material costs increased from $*** in 2017 to $*** in 2018, then decreased to $*** in 2018 and were lower in interim 2020 at $*** than in interim 2019 at $***. See id.
228 CR/PR at Tables IV-2. Nonsubject imports increased from *** short tons in 2017 to *** short tons in 2018, then declined to *** short tons in 2019; they were higher in interim 2020 at *** short tons than in interim 2019 at *** short tons. See id.
229 CR/PR at Tables IV-8, C-1. Nonsubject imports’ market share was lower in interim 2020 at *** percent than in interim 2019 at *** percent. See id. Nonsubject imports did not fill the supply vacated when subject imports decreased following the filing of the petitions, as total import volumes of phosphate fertilizers were lower in the third quarter of 2020 than in the third quarters of every other year of the POI. CR/PR at Table IV-6.
230 CR/PR at Table C-1. 231 As noted above, nonsubject imports from Saudi Arabia increased each year of the POI until
Saudi Arabia was the largest source of nonsubject imports by 2019. CR/PR at IV-2. While Mosaic has a 25 percent equity interest in MWSPC, a producer of phosphate fertilizers in Saudi Arabia, it was not the U.S. importer of nonsubject imports from Saudi Arabia until the last quarter of 2020. CR/PR at IV-6; see Mosaic U.S. Importer Questionnaire Response at I-2a, II-2a. It maintains that it had invested in the Saudi facility to serve India and other parts of Asia, not the U.S. market, as evidenced by the fact that after it
(continued...)
44
by subject imports, the domestic industry’s financial performance would not have deteriorated to the extent that it did.
Accordingly, we find that cumulated subject imports had a significant impact on the domestic industry.
VI. Conclusion
For the foregoing reasons, we determine that an industry in the United States is materially injured by reason of subject imports of phosphate fertilizers from Morocco and Russia that are subsidized by the governments of Morocco and Russia.
had idled Plant City, it “imported zero phosphate fertilizer from Saudi Arabia,” but rather “sold *** percent of its offtake from MWSPC in India.” Mosaic Posthearing Br. at Responses to Questions pp. 16-17. The record indicates that India was the largest destination for exports from Saudi Arabia during the POI. CR/PR at Table VII-13. Mosaic’s ***. See id. at Responses to Questions p. 17 n.165. Mosaic did so, rather than utilize its excess capacity because the “nature of phosphate fertilizer production makes it difficult to ramp up production quickly.” See id. at Responses to Questions pp. 14-26.
45
Dissenting Views of Commissioner David S. Johanson
Based on the record in the final phase of this investigation, I determine that an industry in the United States is not materially injured or threatened with material injury by reason of imports of phosphate fertilizers from Morocco and Russia found by the U.S. Department of Commerce (“Commerce”) to be subsidized by the governments of Morocco and Russia. I join Sections I.-VI.C. of the Views of the Commission, except as otherwise noted.
My negative determinations are based on findings that (1) subject imports were pulled into the market by demand that the domestic industry could not or would not meet, all while overselling the domestic like product; (2) subject imports oversold the domestic like product and did not cause price depression or price suppression; (3) any injury experienced by the domestic industry was not caused by subject imports; and (4) the imminent future does not show the domestic industry threatened with material injury by subject imports.
No Material Injury by Reason of Cumulated Subject Imports
A. Volume of Subject Imports
Section 771(7)(C)(i) of the Tariff Act provides that the “Commission shall consider whether the volume of imports of the merchandise, or any increase in that volume, either in absolute terms or relative to production or consumption in the United States, is significant.”1
As noted above, I join in the Views of the Commission through volume (VI.C.).2 The point of departure, however, starts with a supplemental discussion of the volume conclusion because the record from my vantage point warrants emphasizing that the volume of subject imports must be considered in the context of the relevant market conditions. This is not a case of surging imports out to take domestic industry market share. In my view, this is a case of imports having been pulled into the market due to unique supply conditions created by the domestic industry. This is an unusual case in that subject imports were not simply pulled into the U.S. market but were invited in by the domestic industry.
Increases in subject imports were the direct result of the domestic industry’s own actions in closing production facilities, in declining to supply major U.S. purchasers, and in prioritizing export markets. The closures of Plant City and Redwater, neither of which were
1 19 U.S.C. § 1677(7)(C)(i). 2 I therefore apply the same domestic like product and domestic industry definitions and
cumulate subject imports for the present material injury analysis (I cumulate subject imports for purposes of the threat analysis as well, as discussed below). I also use the product and citation shorthands used in the majority Views.
46
related to subject imports,3 created a supply gap that the domestic industry recognized would require new imports to fill. With respect to Plant City, Mosaic immediately recognized that its decision would create a sustained domestic supply shortfall, and supply chains began reacting immediately upon the announcement in late 2017 before the December idling.4 In its last year of operation (2017), Plant City had produced 1.3 million tons of phosphates.5 Mosaic informed U.S. customers that it would reduce their supply or be unable to supply them entirely.6 At the time, Mosaic indicated that the closure would cut availability by 1.5 million tons, creating a projected 2.7 million ton hole in the market given projected demand for 2018.7 In 2019, with more hindsight, Mosaic’s CEO explained the decision as follows: “When we shut down – sorry, idled Plant City, that opened a hole for some imports to increase. . . . So we gave up 1 million tonnes {i.e., 1.1 million short tons (ST)} of market here in the U.S. intentionally.”8 Mosaic therefore recognized the supply gap created by the Plant City closure to be 1.1 million ST.9
The subsequent closure of Nutrien’s Redwater facility in Canada, announced in early 2018 and implemented in May 2019,10 exacerbated domestic supply constraints. Redwater’s annual capacity was 730,000 ST of MAP and average annual production was 600,000 ST.11 This closure eliminated Redwater as a source of supply in the United States; it also created opportunities to make export sales from the United States into Redwater’s former market in Western Canada, thereby restricting availability in the United States.12 Specifically, Nutrien assured customers that it would continue to serve the Western Canadian market with its U.S.
3 The business rationale for the Plant City closure is discussed further under Impact below. 4 See, e.g., Gavilon Staff Conference Testimony at para. 10 (Mr. Harlander) (“{T}he closure of
Plant City left a massive supply gap in the market beginning in late 2017. . . . Mosaic’s decision to close this large U.S. plant caused increased imports to close the supply gap, not the other way around. Mosaic’s official closing of the plant and recording the losses on its books in 2019 was a mere formality – the market effects from the closure took place beginning in 2017, not 2019.”); OCP Prehearing Br., Ex. 9 (Mosaic, 2017 10-K Annual Report) at 5.
5 CR/PR at III-3. 6 See, e.g., Tr. at 197-98 (Mr. McGinn), 270 (Mr. Wessel); *** Questionnaire at IV-16. 7 OCP Prehearing Br., Ex. 16 (Mosaic, Q4 2017 Earnings Call (February 20, 2018)) at 11. 8 OCP Prehearing Br., Ex. 11 (Mosaic, Analyst Day (March 28, 2019) at 30-31 (emphasis supplied). 9 This figure is corroborated by a document Mosaic included post-hearing that shows ***.
Mosaic Posthearing Br., Ex. 19 at 5 (***). 10 See, e.g., OCP Prehearing Br., Exs. 38, 89, 106. 11 OCP Posthearing Br., Att. C (Mr. Rahm Decl.) at paras. 3.3-3.4. 12 OCP Posthearing Br., Att. C (Mr. Rahm Decl.) at paras. 3.3-3.4; Tr. at 209-10 (Mr. Niederer).

47
production facilities.13 Distributors thus expected a U.S. supply shortfall given increased exports to Canada and reduced imports from Canada.14
Mosaic recognized these domestic supply constraints and stated the solution: imports. In August 2018, Mosaic invited imports to fill the supply gap created by the Plant City idling and the Redwater closure:
{C}learly the import requirements into the US are increasing by {the closings of} both Red Water and Plant City there’s no question of that . . . it certainly indicates that there will be a need for more imports . . . .15 While encouraging imports, the record shows that the domestic industry also declined
to supply U.S. customers.16 With respect to Mosaic, for example, Gavilon, Eurochem, ADM, and *** submitted correspondence that Mosaic consistently refused to supply product without citing any concerns about price.17 ADM, Koch, and Heartland’s former CEO testified regarding Mosaic’s refusals to supply fertilizer.18 Numerous purchaser questionnaire responses confirm the prevalence of Mosaic’s unwillingness to supply.19 In total, 16 out of 28 purchasers reported experiencing supply constraints during the POI, with several noting specifically that Mosaic and other domestic producers refused, declined, or were unable to supply fertilizer products.20 Mosaic testified that it does not “leave good sales opportunities on the table,”21 and defining “good” is certainly the firm’s prerogative, but this does not help support an injury case when, as here, customers are left with one alternative for non-price reasons, imports.22
13 OCP Prehearing Br., Ex. 38 at 1 (“The increase in production at the two remaining plants {in
Aurora, North Carolina and White Springs, Florida} is expected to offset the reduction in supply from our Redwater facility, and ensure a continued supply of phosphate products to our customers in Western Canadian.”)
14 See Tr. at 241 (Mr. Lambert); OCP Prehearing Br., Ex. 25 at 9. 15 IRM Posthearing Br. at 6 and Ex. 2 (Mosaic, Q2 2018 Earnings Call) (Aug. 7, 2018) (emphasis
supplied); Gavilon Prehearing Br., Ex. 1A; OCP Prehearing Br., Ex. 25. 16 See OCP Posthearing Br., Responses to Q&A at 7-17. 17 Tr. at 244-245 (Mr. Wessell); Gavilon Prehearing Br., Ex. 7; Eurochem Prehearing Br., Att. C at
9-11; ADM Posthearing Br. at 2-6 and Ex. 1; IRM Posthearing Br. Ex. 4 (*** Decl.) at para. 3 and Att. B. 18 Tr. at 196-197 (Mr. McGinn); Tr. at 205-206 (Mr. Coppess); Tr. at 208-210 (Mr. Niederer). See
also Tr. at 244-245 (Mr. Wessell); Tr. at 245 (Mr. Lambert). 19 See Gavilon Prehearing Br. at 20-24; IRM Prehearing Br. at 12-15, 18-19. 20 See, e.g., CR/PR at II-8-II-9. 21 Tr. at 24 (Mr. O’Rourke) (emphasis supplied). 22 See also Tr. at 262 (Mr. Wessel) (“I think there’s a very easy rationale as to why we do see the
overselling. It’s companies like Gavilon not able to buy a U.S. made product and not having the availability and willing to pay a little bit more for a foreign product to meet that availability gap.”); Tr. at 260 (Mr. Lambert) (“If you’re on the Mississippi River there is one domestic supply source and that’s

48
The record includes examples of Simplot and Nutrien refusing to supply customers as well. ***23 ***24 Structurally, Simplot’s and Nutrien’s business models also make them unreliable sources of supply for distributors. During the POI, Nutrien sold ***.25 Simplot ***.26 Simplot itself is a nationwide retailer and testified to purchasing substantial volumes from other producers.27 Domestic producers’ export shipments also decreased the availability of domestic phosphate fertilizer supply, as exports were prioritized over domestic shipments. Throughout the POI, ***.28 Export shipments as a share of total shipments *** from 2017 to 2019 and, although *** when comparing interim 2020 to interim 2019, the share *** than it was at the start of the POI.29 ***.30 Nutrien’s total export shipments *** by quantity from 2017 to 2019, and exports were *** percent higher in interim 2020 than in interim 2019.31 From 2017 to 2019, Simplot’s export shipments as a share of total shipments ***32 The domestic industry’s export shipment volume throughout the POI *** the volume of subject imports.33 It was recognized in the market that the domestic industry was exporting significant and increasing amounts of U.S. production during the POI, leaving less product available for the U.S. market and reinforcing the belief that imports were needed.34
Mosaic. That is the only one that is competitive. But if you can’t purchase from them, your alternative is the importers.”); IRM Posthearing Br., Ex. 5 (*** Decl.) at paras. 4-5.
23 IRM Posthearing Br., Ex. 5 (*** Decl.) at paras. 4, 8. 24 IRM Posthearing Br., Ex. 5 (*** Decl.) at para. 4. 25 Nutrien U.S. Producer Questionnaire Resp. at II-9. 26 Simplot U.S. Producer Questionnaire Resp. at II-9. 27 Tr. at 74 (Mr. Sunderland). See *** U.S. Producer Questionnaire Resp. at II-3 (***). 28 CR/PR at Table III-6. 29 CR/PR at Table III-6. The domestic industry’s export shipments as a share of quantity of total
shipments was *** percent in 2017, *** percent in 2018, and *** percent in 2019. This ratio was *** percent in interim 2019 and *** percent in interim 2020.
30 See *** U.S. Producer Questionnaire at II-7. Mosaic’s export shipments relative to total shipments *** from *** percent in 2017, to *** percent in 2018, and to *** percent in 2019. See id.
31 See Nutrien U.S. Producer Questionnaire at II-7. 32 See Simplot U.S. Producer Questionnaire at II-7. 33 CR/PR at Tables C-1, IV-2. 34 See, e.g., Tr. at 241 (Mr. Lambert) (increasing exports created a “further hole” in supply);
Gavilon Prehearing Br. at 33. Over the long term, Mosaic sees the U.S. market as one with “limited growth opportunities” and has positioned itself to “take advantage of” the “fantastic growth opportunities” in markets such as Brazil, which it views as the “next big breadbasket for the world.” OCP Prehearing Br., Ex. 46 at 7.
49
The bottom line is that subject import volumes did not exceed the supply deficit they were pulled into the U.S. market to fill.35 From 2017 to 2019, subject import shipments increased overall by 753,938 ST,36 substantially less than the *** in U.S. producers’ shipments,37 and also less that the 1.1 million ST in U.S. sales that Mosaic intentionally ceded through its closure of Plant City alone. The U.S. industry’s increasing inability or unwillingness to supply the U.S. market explains the increase in subject import market share and the domestic industry’s decline in market share from 2017 to 2019.38
In short, the context for the volume discussion is that any increases in subject imports were the direct result of the domestic industry’s own actions in closing production facilities, in declining to supply major U.S. purchasers, and in prioritizing export markets. As discussed further below, I do not find that subject imports had significant price effects, nor do I find that subject imports had a significant adverse impact on the domestic industry.
B. Price Effects of the Subject Imports
Section 771(7)(C)(ii) of the Tariff Act provides that, in evaluating the price effects of the subject imports, the Commission shall consider whether –
(I) there has been significant price underselling by the imported merchandise as compared with the price of domestic like products of the United States, and
(II) the effect of imports of such merchandise otherwise depresses prices to a significant degree or prevents price increases, which otherwise would have occurred, to a significant degree.39
I do not find significant underselling by subject imports, nor do I find that subject imports depressed or suppressed domestic prices to a significant degree. As noted above, I have joined the finding on substitutability and that price is an important factor in purchasing decisions. I also note that of the 28 usable questionnaire responses from purchasers, 27 reported that availability is a very important purchasing factor and 26 reported that reliability of supply is also a very important purchasing factor.40 No purchaser responded that availability
35 See, e.g., OCP Posthearing Br., Responses to Q&A at 17-26 (analysis on a POI and year-by-year
basis). 36 CR/PR at Table IV-7. 37 CR/PR at Table IV-7. 38 CR/PR at Table IV-8. 39 19 U.S.C. § 1677(7)(C)(ii). 40 CR/PR at Table II-7.
50
and reliability of supply are not important.41 All but one of the responding purchasers reported that the supply of domestic product had decreased.42 The importance of availability and reliability of supply to purchasers, and the widespread domestic supply constraints discussed above, highlight why imports were necessary during the POI to meet purchasers’ needs.
In the final phase of these investigations, the Commission collected monthly pricing data from U.S. producers and importers for the total quantity and f.o.b. value of two phosphate fertilizer products shipped in bulk (i.e., barge-load) from NOLA to unrelated U.S. agricultural customers.43 One U.S. producer (***) and seven importers provided usable pricing data, although not all firms reported pricing for both products for all months of the POI.44 Pricing data reported by these firms accounted for approximately *** percent of U.S. producers’ U.S. commercial shipments, *** percent of U.S. shipments of subject imports from Morocco, and *** percent of U.S. shipments of subject imports from Russia in 2019.45
The pricing data show that cumulated subject imports undersold the domestic like product in 34 of 170 instances (involving 381,132 short tons) and at underselling margins ranging from 0.02 to 4.4 percent. Subject imports oversold the domestic like product in the remaining 136 instances (involving 2.0 million short tons) and at overselling margins between 0.02 and 17.6 percent.46
In total, therefore, the collected pricing data show that subject imports oversold the domestic product in 136 of 170 quarterly comparisons, amounting to 80 percent by instance
41 CR/PR at Table II-7. 42 CR/PR at II-24. 43 CR/PR at V-9. The two pricing products were (1) standard-grade monoammonium phosphate
(MAP), chemical formula NH4H2PO4, granular, excluding high-purity MAP; and (2) standard-grade diammonium phosphate (DAP), chemical formula (NH4)2(HPO4), granular. CR/PR at V-9.
44 CR/PR at V-9. *** CR/PR at V-9 n.12. 45 CR/PR at V-9. These coverage figures are higher than in the preliminary phase of these
investigations, when reported pricing data accounted for approximately *** percent of U.S. producers’ shipments of phosphate fertilizer, *** percent of U.S. shipments of subject imports from Morocco, and *** percent of U.S. shipments of subject imports from Russia in 2019. Prelim. Staff Report at V-8.
46 CR/PR at Table V-7. Mosaic argues that the pricing data, as collected, conceal the full extent of underselling by subject imports because: (1) the prices reported by *** were not on an f.o.b. NOLA basis; and (2) the pricing data did not capture competition at the first level of trade between subject imports and the domestic like product (i.e., U.S. importer purchase cost data). However, Commission Staff contacted *** as requested by the questionnaire. EDIS Document 735889. Moreover, the Commission Staff collected monthly import data entry AUVs for MAP and DAP and requested supplemental pricing data ***, which Mosaic acknowledges “at least address the level of trade issues” that it alleged. EDIS Document 735870. These additional data, collected late in the investigation for thoroughness to examine any allegation, only corroborate the comprehensive pricing data, showing predominant overselling by subject imports of the domestic like product.
51
and 83.7 percent by quantity.47 In the 80 percent of instances in which subject imports oversold domestic phosphate fertilizers, the average margin by which they oversold was 3.7 percent; in the relatively few instances in which subject imports undersold domestic phosphate fertilizers, the average margin was 1.7 percent.48 Thus, not only did subject imports oversell domestic products in the vast majority of comparisons during the POI, the domestic product also undersold the subject imports by greater margins.
These data do not support finding significant underselling by subject imports, nor do they show a mixed picture. To the contrary, they show pervasive overselling by subject imports. I find the comprehensive pricing data compiled in the staff report reliable and unambiguous.49 The consistency of the overselling over time and across products reinforces the reliability of the pricing data, as do the product-specific AUV comparisons, which support that subject imports consistently oversold domestic fertilizers during the POI.50 Purchaser responses are also not inconsistent with this conclusion, as the vast majority of purchasers reported “comparability” when asked to compare domestic and subject imports based on price.51 These data do not support the claim of significant underselling. In fact, some purchasers reporting comparability on price highlighted the significance of other important factors such as availability and reliability in deciding sales.52 A clear majority of purchasers also reported Mosaic as the price leader in the U.S. market, by a wide margin, which is consistent with the conclusion that subject imports are not price drivers in this market.53
Finally, I decline the domestic producers’ invitation to discount underselling evidence given that subject imports gained market share from 2017 to 2019.54 The increase in subject imports’ market share reflected the inability or unwillingness of the domestic industry to supply the market, including Mosaic’s acknowledgment that the closing of its Plant City facility created a 1.1 million ST hole in the market to be supplied by imports, and its notice to major purchasers that they were going to be shorted on supply. Subject imports gained market share because,
47 CR/PR at Table V-7. 48 CR/PR at Table V-7. 49 See also OCP Posthearing Br., Responses to Q&A at 41-50. 50 Specifically, these data show that subject import shipments of MAP were ***. CR/PR at E-3
and E-6. 51 CR/PR at Table II-9. A small number of purchasers reported that domestic product was
“inferior” to subject imports on price (higher priced), but a similar small number also reported that the domestic product was also “superior” to subject imports in terms of discounts offered. CR/PR at Table II-9.
52 See CR/PR at Table II-9. 53 CR/PR at V-8-V-9. 54 Tr. at 73-74 (Mr. Vaughn).
52
due to the supply gap previously discussed, customers were forced to look for alternative sources.
Given that the subject imports were priced higher than the domestic product in the vast majority of comparisons and that the domestic product actually undersold the subject imports by wider margins, the claims of price depression and suppression lack merit on this record. In general, prices increased during January 2017 to September 2020, with increases in 2017 and most of 2018, decreases in 2019, and increases in interim 2020.55 Domestic and subject import prices generally moved together, in line with global price trends for phosphate fertilizers,56 but domestic prices were *** than subject imports over the vast majority of the POI. Domestic product and subject imports experienced a *** period of price *** in both pricing products between ***, when three seasons of abnormal weather disrupted projected demand in the U.S. market. Whether the Commission’s collected pricing data for the POI are examined on a monthly or a quarterly basis, however, domestic prices -- not subject import prices -- *** in prices in the U.S. market.57 The pricing data thus contradict any claim that subject import prices caused significant price depression during the POI.
Nor do I find that the volume of subject imports in this market during the demand shocks of 2019 provide the requisite causal link to price declines in 2019. Although shipments of subject imports increased by 6.2 percent from 2018 to 2019, the volume of subject imports declined from 2018 to 2019 by nearly 300,000 ST, or by 9.5 percent.58 In fact, the decline in H2 2019 was even greater: 22 percent from H1 2019, and 9.7 percent from H2 2018.59 Although subject imports did decline in 2019, they did not halt amidst record wet weather because the market anticipated improvements in the weather and plantings in spring 2019 and then fall 2019. Despite poor weather during the fall 2018 season, and even because of it, fertilizer demand projections for spring 2019 were high.60
Notwithstanding the historically wet spring of 2019 that reduced fertilization rates and left some inventory in the most affected regions, the market again looked forward to strong demand in the fall of 2019. Applications in the fall of 2019 were expected to be very strong on
55 CR/PR at V-17; CR/PR at Tables V-4-V-5 and Figs. V-2-V-3. 56 See, e.g., CR/PR at Fig. V-7; Koch Posthearing Br. at 6-7. 57 See, e.g., OCP Prehearing Br. at 87-91 and Att. A-2 (monthly basis); IRM Posthearing Br. at 12-
14 and Ex. 6 (quarterly basis). 58 See CR/PR at Table IV-2 (subject imports declined from 2,978,803 ST in 2018 to 2,696,266 ST
in 2019). 59 CR/PR at Table IV-6. In Q1 2020, subject import entries declined 47.8 percent from Q1 2019.
CR/PR at Table IV-6. 60 See, e.g., OCP Prehearing Br. at 45, Ex. 93 at 4, Ex. 94 at 4.

53
account of depleted soil nutrient levels following multiple low-application seasons.61 Moreover, because the post-harvest fall application largely prepares the soil for spring plantings, projections for fall 2019 also reflected expectations for spring 2020 plantings.62 Farmers’ predictions for 2019 turned out to be wrong. The weather did not substantially improve in 2019 as was expected.63
Additional imports were also required for locations where inventories were depleted, particularly for purchasers who testified that the industry would not sell to them.64 As explained at the hearing, inventories were stuck upriver, without the ability to ship back downriver to supply markets closer to the NOLA port, requiring additional imports in the undersupplied locations in 2019.65 These volumes were imported to meet farmers’ demand based on their anticipated planting volumes in 2019.
Against this backdrop, subject import entries declined in 2019. Moreover, the ratio of subject import inventories to U.S. producers’ inventories in 2019 was consistent with the ratios in 2018 for Q1 and Q2 and declined relative to 2018 ratios for Q3 and Q4.66 Subject import
61 See, e.g., OCP Posthearing Br., Responses to Q&A at 28; Koch Prehearing Br., Ex. 6 (*** Decl.)
at para. 5; OCP Prehearing Br., Ex. 80 at 10, 24, Ex. 86, Ex. 99 at 7. 62 See, e.g., OCP Posthearing Br., Responses to Q&A at 28-29; CR/ PR at II-15; Tr. at 269 (Mr.
Rahm) (“And when you’re talking about fall application, you’re really looking at what farmers are intending to plant in the spring of ’20. . . . So farmers were anticipating fertilizing for big acreage in 2020 and as a consequence there was a need for putting in place tons for a fall application season.”)
63 While wet weather significantly reduced demand in 2019, affected areas were more concentrated in specific regions while demand was more normal in other regions. See, e.g., Tr. at 264 (Mr. Lambert), 268 (Mr. Coppess), 269 (Mr. Rahm); IRM Posthearing Br., Ex. 5 (*** Decl.) at para. 7.
64 See, e.g., Hearing Tr. at 264-65, 269-70 (Mr. Lambert) (“If you look at the USDA predictions in terms of planted acres, while there’s no doubt you had a bad fall {2018}, There was still a prediction and there was still anticipation from our buyers and our customers that the acres were going to get planted . . . {because} the product is misplaced. So you had product, it got trapped. It couldn’t get to the right locations and in order to fill in the new needs for new demand, the only way to accurately do it and economically do it is to bring in fresh product”; “{purchasers} do not bring tons in here on a hope and pray strategy . . . If we didn’t have that demand from our customers asking us to bring those tons, we wouldn’t have brought them.”); 223–24 (Mr. Niederer) (“it takes a lot amount of time to stop the imports, the import process, if you will, from the time you procure a vessel, get to port, and bring it here, the contracts that go into making that . . . We felt there was pent-up demand from the fall of 2018, and so you anticipate alleviating your inventories . . . And so the fall of ’19 is what I would call your de-inventorying process where product is now pushed up into the interior and into the marketplace . . . And so you can’t take product that’s now clear up in Minnesota back down into the delta. It makes more sense to begin bringing product back in to supply some of those other terminals”).
65 See, e.g., Hearing Tr. at 264-65, 269-70 (Mr. Lambert), 223-24 (Mr. Niederer). 66 See CR/PR at Table D-1 (ratios calculated by dividing subject import inventories by U.S.
producer inventories; the ratios in 2018 were ***; the ratios in 2019 were ***). See also CR/PR at Table D-2 (year-over-year quarterly comparisons).
54
volumes were needed to fill the supply gap created by the domestic industry. Moreover, they were brought in based on firm demand from customers that needed fertilizer and were not simply overhanging the market waiting for a customer to be found. Market participants rationally continued to rely on projections for future demand rather than estimating lower future demand due to the prior season’s bad weather. On this record, if there was any supply/demand mismatch for subject imports in 2019, the imbalance was temporary, it was comparable for domestic production and subject imports, and it was caused by adverse weather, not aggressive selling or low prices. In fact, subject imports consistently oversold domestic products on this record. Insofar as events in the U.S. market contributed to changes in U.S. prices, those events were demand shocks caused by unforeseeable weather. I decline to blame the effects of the bad weather and demand decline on subject imports, which are in the market in the first place filling a supply gap of the domestic industry’s making. Any declines in domestic producers’ prices on this record are not indicative of price depression attributable to subject imports. I am also unpersuaded that the selected press reports submitted by the domestic producers supply the missing and critical causal link of price-related injury. Instead, as discussed above, I rely upon the comprehensive pricing data gathered in the course of these investigations. Accordingly, I do not find that the volume or prices of subject imports caused significant price depression.
Subject imports also did not cause price suppression on this record. There is a lack of correlation between import volume trends and the domestic industry’s COGS to net sales ratio that further demonstrates that domestic prices are not driven by the presence of subject imports. *** in subject import volume and market share occurred between 2017 and 2018, when the domestic industry’s COGS to net sales ratio ***, from *** percent to *** percent.67 Then, when subject import volume and market share were *** in interim 2020 as compared with interim 2019, the domestic industry’s COGS to net sales ratio *** in interim 2020.68 That the domestic industry’s COGS to net sales ratio *** when subject imports ***, and *** when subject imports *** shows that the volume and prices of subject imports are not suppressing price increases by domestic producers that otherwise would have occurred.
Moreover, the financial data show that the domestic industry’s unit net sales value from 2017 to 2018 ***, which does not support finding a cost-price squeeze or that domestic producers should have been able to raise prices further. In addition, given the demand shocks to the market resulting from bad weather in three consecutive growing seasons, domestic producers likely would not have been able to raise prices regardless of the volume or prices of
67 CR/PR at Table C-1. 68 CR/PR at Tables IV-6 and C-1.

55
subject imports from 2018 to 2019.69 Finally, in the 2020 interim period, the data show that domestic industry unit costs *** compared to interim 2019.70 Coupled with prices recovering in the first half of 2020, before the petitions were filed,71 the record fails to show price suppression, much less price suppression caused by subject imports that oversold domestic product. Accordingly, I do not find that subject imports prevented price increases, which otherwise would have occurred, to a significant degree. The lost sales/lost revenue surveys also do not support finding significant price effects on this record. Most purchasers reported that the domestic industry did not lose sales or revenues to subject imports, and the purchaser -- *** -- that accounted for the vast majority of the reported quantity of lost sales is not credible.72 *** accounted for *** percent of these sales.73 In the preliminary phase, ***74 This purchaser ***75 ***76 ***
In terms of lost revenue allegations, half of the responding purchasers indicated that they do not know whether domestic producers reduced prices in order to compete with lower-priced imports.77 While several purchasers reported that domestic producers reduced prices to compete with subject imports, their narrative responses also indicate that such reductions were in response to *** rather than prices of subject imports.78 For example, *** stated that *** and *** reported that *** was a factor in domestic price reduction.79 Even ***.80
Consequently, the record, when considered as a whole, does not demonstrate significant price effects caused by subject imports. I am also not persuaded that price depression or suppression may be inferred from post-petition price increases, as argued by
69 CR/PR at Table C-1 (apparent U.S. consumption decline of *** percent from 2018 to 2019). 70 CR/PR at Table VI-2. 71 CR/PR at Tables V-4-V-5 and Figs. V-2-V-3. 72 CR/PR at Tables V-9, V-11. 73 CR/PR at V-23 n.14. CR/PR at Table V-9 (*** reported purchasing *** ST of subject imports
instead of domestic product). The total estimated quantity of subject imports purchased “instead of” domestic product was 733,895 ST, which amounts to only *** percent of purchasers’ total reported purchases and imports over the POI, and *** percent of their reported purchases and imports from subject sources over the POI. CR/PR at Tables V-8-V-9. These volumes are too limited to support finding significant price effects on this record even if some fraction of *** allegations were credited.
74 CR/PR at V-23 n.14; *** Lost sales and Lost Revenue Survey at 4. 75 CR/PR at V-23 n.14. 76 CR/PR at V-23 n.14. 77 CR/PR at Table V-11. ***. Confidential Report, Memorandum INV-SS-086 (Aug. 3, 2020),
Public Report, Phosphate Fertilizers from Morocco and Russia, Inv. Nos. 701-TA-650-651 (Preliminary), USITC Pub. 5105 (Aug. 2020) (“Preliminary Phase Staff Report”) at Table V-9a.
78 CR/PR at Table V-11 (tallying 14 do not know and 7 affirmative/7 negative). 79 CR/PR at Table V-11. 80 CR/PR at Table V-11. *** *** Purchaser Questionnaire at IV-3; CR/PR at Table II-9.

56
domestic producers to supply a link between subject imports and significant price effects on this record. As an initial matter, from their Q4 2019 low, U.S. (and global prices) began to recover in the first half of 2020, which contradicts that price recovery could not occur until subject imports left the market.81 Moreover, Mosaic itself attributed the market improvements in 2020 to an increase in demand that began prior to the filing of the petition and was foreseen as continuing.82 Mosaic’s belief seems to have been corroborated by the improvement in Mosaic’s financial condition, which was underway by the second quarter of 2020, before the petition was filed.83 Finally, post-petition developments if anything undermine domestic producers’ pre-petition injury story. The domestic supply gap is real. Without subject imports, and with the domestic industry unwilling or unable to meet customer needs, the U.S. market pulled in nonsubject imports in increasing volumes.84 While subject imports declined in the second half of 2020, as foreign sellers and U.S. buyers faced potential 75 percent countervailing duties,85 nonsubject imports ended the interim 2020 period with a 33.5 percent share of imports, more than doubling their 15.7 percent share in interim 2019, and exports to the United States of phosphate fertilizer from Mosaic’s Saudi joint venture ramped up.86 Accordingly, post-petition price trends do not demonstrate that U.S. prices were depressed or suppressed by subject imports during the POI.
In sum, the record does not support a finding that subject imports significantly undersold the domestic like product. It also does not support a finding that the effect of subject imports was to depress prices to a significant degree or prevent price increases, which otherwise would have occurred, to a significant degree. Accordingly, I do not find that subject imports had significant adverse price effects on the domestic industry.
C. Impact of the Subject Imports
Section 771(7)(C)(iii) of the Tariff Act provides that in examining the impact of subject imports, the Commission “shall evaluate all relevant economic factors which have a bearing on
81 CR/PR at V-17, Tables V-4-V-5, Figs. V-2-V-3, V-7; OCP Prehearing Br. at 91 and Att. A-2; OCP
Posthearing Br. at 9. 82 See IRM Posthearing Br., Ex. 2 at 7-8; Gavilon Prehearing Br. at 15-16; EuroChem Prehearing
Br. at 10. 83 See Tr. at 276-77 (Mr. Wessel). 84 CR/PR at Table IV-6 (increasing in each month of Q3 and reaching a period high of 185,483 ST
in September 2020, the last month of the interim period). 85 See, e.g., Tr. at 337 (Ms. Aranoff); EuroChem Posthearing Br. at 11. 86 See CR/PR at Table IV-2; CR/PR at Table IV-6; OCP Prehearing Br., Ex. 17; Tr. at 103-04 (Mr.
Jung), 104 (Mr. O’Rourke).

57
the state of the industry.”87 These factors include output, sales, inventories, capacity utilization, market share, employment, wages, productivity, gross profits, net profits, operating profits, cash flow, return on investment, return on capital, ability to raise capital, ability to service debts, research and development, and factors affecting domestic prices. No single factor is dispositive and all relevant factors are considered “within the context of the business cycle and conditions of competition that are distinctive to the affected industry.”88
The domestic industry’s output indicators declined from 2017 to 2019, but were higher in interim 2020 than in interim 2019.89 Specifically, the domestic industry’s share of apparent U.S. consumption declined from *** percent in 2017 to *** percent in 2018 and *** percent in 2019; its market share was higher in interim 2020 at *** percent than in interim 2019 at *** percent.90 Its production decreased by *** percent between 2017 and 2019 from *** short tons in 2017 to *** short tons in 2018 to *** short tons in 2019; its production was higher in interim 2020 at *** short tons than in interim 2019 at *** short tons.91 Its capacity declined by *** percent from 2017 to 2019, from *** short tons in 2017 to *** short tons in 2018 and *** short tons in 2019,92 and its capacity utilization increased by *** percentage points from *** percent in 2017 to *** percent in 2018 to *** percent in 2019.93 The domestic industry’s capacity was higher in interim 2020 at *** short tons than in interim 2019 at *** short tons, while its capacity utilization was lower in interim 2020 at *** percent than in interim 2019 at *** percent.94
87 19 U.S.C. § 1677(7)(C)(iii); see also SAA at 851 and 885 (“In material injury determinations, the
Commission considers, in addition to imports, other factors that may be contributing to overall injury. While these factors, in some cases, may account for the injury to the domestic industry, they also may demonstrate that an industry is facing difficulties from a variety of sources and is vulnerable to dumped or subsidized imports.”).
88 19 U.S.C. § 1677(7)(C)(iii). This provision was amended by the Trade Preferences Extension Act of 2015, Pub. L. 114-27.
89 As previously noted, after the petitions were filed at the end of June 2020, subject imports abruptly exited the U.S. market given the threat of substantial duties. See, e.g., Tr. at 337 (Ms. Aranoff); EuroChem Posthearing Br. at 11. The bulk of 2020 is therefore pre-petition. With the post-petition period starting in the last quarter of 2020, expected volume shifts were afoot with nonsubject imports ending the interim 2020 period with a 33.5 percent share of imports, more than doubling their 15.7 percent share in interim 2019, and fertilizer exports from Mosaic’s Saudi joint venture ramping up to help supply the U.S. market. See CR/PR at Tables IV-2 and IV-6; OCP Prehearing Br., Ex. 17; Tr. at 103-04 (Mr. Jung), 104 (Mr. O’Rourke). *** CR/PR at VII-20 n.15. Moreover, ***. CR/PR at Table VII-12.
90 CR/PR at Tables IV-8, C-1. 91 CR/PR at Tables III-4, C-1. 92 CR/PR at Tables III-4, C-1. 93 CR/PR at Tables III-4, C-1. 94 CR/PR at Tables III-4, C-1.

58
The domestic industry’s U.S. shipments declined by *** percent between 2017 and 2019, from *** short tons in 2017 to *** short tons in 2018 and *** short tons in 2019; its U.S. shipments were higher in interim 2020 at *** short tons than in interim 2019 at *** short tons.95 The domestic industry’s end-of-period inventories increased by *** percent from 2017 to 2019, from *** short tons in 2017 to *** short tons in 2018 and 2019; its end-of-period inventories were lower in interim 2020 at *** short tons than in interim 2019 at *** short tons.96 The domestic industry’s ratio of end-of-period inventories to total shipments increased steadily from 2017 to 2019; but was lower in interim 2020 than in interim 2019.97
Employment indicators for the domestic industry also declined between 2017 and 2019. The domestic industry’s number of production and related workers (“PRWs”) fell from *** in 2017 to *** in 2018 and *** in 2019; its number of PRWs was lower in interim 2020 at *** than in interim 2019 at ***.98 Total hours worked,99 wages paid,100 and productivity101 also fell from 2017 to 2019. Total hours worked and wages paid were lower in interim 2020 than in interim 2019 while productivity was higher between the interim periods.102
The domestic industry’s net sales, gross profit, operating income, and net income increased between 2017 and 2018, but deteriorated in 2019; most of the industry’s financial indicators were lower in interim 2020 than in interim 2019.103 Specifically, the domestic industry’s net sales by value increased from $*** in 2017 to $*** in 2018, then declined to $*** in 2019; its net sales by value was lower in interim 2020 at $*** than in interim 2019 at $***.104 Its gross profit increased from $*** in 2017 to $*** in 2018, then declined to ***; its gross profit was lower in interim 2020 at *** than in interim 2019 at ***.105 The industry’s
95 CR/PR at Tables III-6, C-1. 96 CR/PR at Tables III-7, C-1. 97 CR/PR at Tables III-7, C-1. The ratio of end-of-period inventories to U.S. shipments was ***
percent in 2017, *** percent in 2018, and *** percent in 2019. It was lower in interim 2020 at *** percent than in interim 2019 at *** percent. Id.
98 CR/PR at Tables III-9, C-1. 99 CR/PR at Tables III-9, C-1. Total hours worked decreased from *** hours in 2017 to *** hours
in 2018 and *** hours in 2019. See id. 100 CR/PR at Tables III-9, C-1. Wages paid decreased from $*** in 2017 to $*** in 2018 to $***
in 2019. See id. 101 CR/PR at Tables III-9, C-1. Productivity per 1,000 hours decreased from *** short tons in
2017 to *** short tons in 2018 and *** short tons in 2019. See id. 102 Total hours worked were *** hours in interim 2019 and *** hours in interim 2020. Wages
paid were $*** in interim 2019 and $*** in interim 2020. Productivity was *** short tons in interim 2019 and *** short tons in interim 2020. CR/PR at Tables III-9, C-1.
103 CR/PR at Table C-1. 104 CR/PR at Tables VI-1, C-1. 105 CR/PR at Tables VI-1, C-1.
59
operating income increased from $*** in 2017 to $*** in 2018, then declined to *** in 2019; its operating income was lower in interim 2020 at *** than in interim 2019 at ***.106 The ratio of operating income to net sales increased from *** percent in 2017 to *** percent in 2018, then declined to *** percent in 2019; it was lower in interim 2020 at *** percent than in interim 2019 at *** percent.107 The domestic industry’s net income increased from $*** in 2017 to $*** in 2018, then declined to ***; its net income was higher in interim 2020 at *** than in interim 2019 at ***.108
Domestic producers’ capital expenditures increased from $*** in 2017 to $*** in 2018 and $*** in 2019,109 while research and development expenses decreased each year from $*** in 2017 to $*** in 2018 and $*** in 2019.110 *** also reported negative effects on investment and growth and development.111
On this record, I do not find that subject imports had a significant adverse impact on the domestic industry. As discussed above in Volume, context matters, and I return to my closing point there: any increases in subject imports were the direct result of the domestic industry’s own actions in closing production facilities, in declining to supply major U.S. purchasers, and in prioritizing export markets. I need not repeat the discussion above, except to reiterate that subject import volumes did not exceed the supply deficit they were pulled into the market to fill, all while pervasively overselling the domestic product. From 2017 to 2019, subject import shipments increased overall by 753,938 ST, substantially less than the *** in U.S. producers’ shipments,112 and also less that the 1.1 million ST in U.S. sales that Mosaic intentionally ceded through its closure of Plant City alone. The U.S. industry’s increasing inability or unwillingness to supply the U.S. market explains the *** percent increase in subject import market share and the domestic industry’s *** percent decline in market share from 2017 to 2019.113
106 CR/PR at Tables VI-1, C-1. 107 CR/PR at Tables VI-1, C-1. 108 CR/PR at Tables VI-1, C-1. The ratio of net income to net sales increased from *** percent in
2017 to *** percent in 2018, then declined to *** percent in 2019; it was slightly higher in interim 2020 at *** percent than in interim 2019 at *** percent. Id.
109 CR/PR at Tables VI-6, C-1. The domestic producers’ capital expenditures were higher in interim 2020 at $*** than in interim 2019 at $***. See id.
110 CR/PR at Tables VI-6, C-1. The domestic producers’ research and development expenses were lower in interim 2020 at $*** than in interim 2019 at $***. See id.
111 CR/PR at Tables VI-9-VI-10. 112 CR/PR at Table C-1. This decline in U.S. shipments itself is *** the volume ceded with the
Plant City closure and displaced by the Redwater closure, which were the subject of Mosaic’s invitation in 2018, quoted above, to imports to fill the recognized supply gap. IRM Posthearing Br., Ex. 2.
113 CR/PR at Tables IV-8, C-1.

60
The domestic industry contends, however, that Plant City was in fact closed due to subject imports. This contradicts myriad announcements made by the company during the POI. For example, on the day the decision was announced (October 31, 2017), Mr. O’Rourke stated:
We are making the move in Florida for several reasons. First, Plant City is the highest-cost facility amongst our Florida operations and it requires a disproportionate amount of sustaining capital each year. As a consequence of idling Plant City, we will be able to optimize our future capital investments and we can increase production at our most efficient Florida operations to offset a material portion of Plant City’s output should the market need more tonnes. We expect that idling the plant will improve our Phosphates’ gross margin rate. Second, this move demonstrates the benefits of our global footprint. We will continue to deliver to our global customers and we’ll do so with a lower cost profile. As our {Ma’aden} joint venture ramps up, we will be able to serve our distribution business and other Indian customers more effectively from a logistical perspective while generating higher margins. Additionally, we will focus our U.S. production on our customers in the Americas where we have a logistical advantage.114
Mosaic’s CFO Richard Mack summed it up a month later, in November 2017, explaining that Mosaic was simply “applying {its} potash playbook to {its} phosphate business”:
{W}e’re applying our potash playbook to our phosphate business. And if you take a look at what we did in our Potash business a few years ago, we shut down some inefficient capacity or capacity that was not needed in the marketplace, and we tried to optimize our operations at our remaining plants and facilities. And I think the results have been quite remarkable. . . . And so Plant City is our least efficient chemical operation in Florida. It’s got a capacity of 2 million tonnes. We’ve been producing roughly 1.5 million-or-so tonnes at that location in prior years. It’s the least profitable that we have.115
On March 28, 2019, weeks before announcing the decision to close the facility permanently, Mr. O’Rourke told investors:
{W}hen we shut down—sorry, idled Plant City, that opened a hole for some imports to increase, and I think part of the increase, and I think part of the increase you’ve seen has been just a response to that. We went from 55%, 60% market share to a more sustainable 50-ish
114 OCP Prehearing Br., Ex. 23 (Mosaic, Q3 2017 Earning Call (Oct. 31, 2017)) at 3. 115 OCP Prehearing Br., Ex. 40 (Mosaic, Global Chemicals and Agriculture Conference (Nov. 15,
2017)) at 2.

61
percent market share. So we gave up 1 million tonnes of market here in the United States intentionally.116
I am unpersuaded by Mosaic’s post hoc rationale for the Plant City idling when Mosaic stated clearly, repeatedly, and contemporaneously that Plant City was idled for reasons other than imports and that imports were necessary to fill the resulting supply gap.117 Subject imports were pulled into the market by supply conditions of the domestic industry’s own making.
Moreover, I have found no adverse price effects caused by subject imports, as discussed above. Over the POI, the market share loss of the domestic industry is not attributable to price competition with subject imports, given clear evidence of overselling on this record. That loss is instead attributable to the impact of the industry’s capacity closures, the unreliability or unavailability of domestic supply for multiple purchasers, and the domestic industry’s growing commitment to export markets. Nor did subject import prices or volume cause price depression or suppression on this record, as also discussed above. Subject imports did not drive U.S. prices and they oversold domestic product throughout the POI, in 80 percent of quarterly comparisons. The decline in U.S. prices in 2019, amidst weather-related demand shocks, was not attributable to subject imports, and there is no indication that the domestic industry could have raised prices more than it did during other parts of the POI. Prices were also recovering before the petitions were filed and in fact had increased earlier in the POI before the historically wet weather conditions ensued and when subject import volume was growing.
The last point also highlights a fundamental disconnect in data on this record. Fluctuations in the domestic industry’s financial performance during the POI do not correlate with changes in subject import volumes. Between 2017 and 2018, the industry’s operating income *** from $*** to $***, and the industry’s operating income margin *** from *** percent to *** percent.118 These results were achieved at a time when subject import volume and market share increased the most during the POI.119 Subject import volume increased by 51.1 percent (from 1,971,222 ST to 2,978,803 ST), and subject import share of apparent U.S. consumption increased *** percentage points from *** percent to *** percent.120 Between 2018 and 2019, despite a decline in subject import volume (of 9.5 percent) and a smaller
116 OCP Prehearing Br., Ex. 11 (Mosaic, Analyst Day (March 28, 2019)) at 30-31 (emphasis
supplied). 117 See also IRM Posthearing Br., Ex. 2 at 3-4. 118 CR/PR at Table VI-1. 119 CR/PR at Tables IV-2, C-1. 120 CR/PR at Tables IV-2, C-1.
62
increase in market share (*** percentage points), domestic industry profitability *** and an operating income margin of *** percent.121 This disconnect is also apparent in interim 2020, when the domestic industry’s operating income margin *** percent, the lowest of the POI, as the same time that subject import volume and market share *** and domestic industry shipments and market share ***.122 In short, there is a disconnect between the domestic industry’s performance and subject import volume trends that further supports finding a lack of causation on this record.
For all of these reasons, I find that the record does not show a causal nexus between subject imports and any injury experienced by the domestic industry during the POI. I therefore do not find that subject imports had a significant adverse impact on the domestic industry.
Accordingly, based on my consideration of the statutory factors and record, I find that the domestic industry is not materially injured by reason of subject imports of phosphate fertilizers from Morocco and Russia.
No Threat of Material Injury by Reason of Subject Imports
A. Legal Standard
Section 771(7)(F) of the Tariff Act directs the Commission to determine whether the U.S. industry is threatened with material injury by reason of the subject imports by analyzing whether “further dumped or subsidized imports are imminent and whether material injury by reason of imports would occur unless an order is issued or a suspension agreement is accepted.”123 The Commission may not make such a determination “on the basis of mere conjecture or supposition,” and considers the threat factors “as a whole” in making its determination whether dumped or subsidized imports are imminent and whether material injury by reason of subject imports would occur unless an order is issued.124 In making our determination, we consider all statutory threat factors that are relevant to these investigations.125
121 CR/PR at Table VI-1. This same year, Mosaic reported a ***, of which ***. See Mosaic U.S.
Producer Questionnaire at III-11. 122 CR/PR at Table C-1. 123 19 U.S.C. § 1677(7)(F)(ii). 124 19 U.S.C. § 1677(7)(F)(ii). 125 These factors are as follows: (I) if a countervailable subsidy is involved, such information as may be presented to it by the
administering authority as to the nature of the subsidy (particularly as to whether the countervailable
63
B. Cumulation for Threat
Under section 771(7)(H) of the Tariff Act, the Commission may “to the extent practicable” cumulatively assess the volume and price effects of subject imports from all countries as to which petitions were filed on the same day if the requirements for cumulation in the material injury context are satisfied.126
I joined in section IV of the majority Views that there is a reasonable overlap of competition among subject imports from Morocco and Russia and between subject imports from each country and the domestic like product. These considerations also apply to my decision to cumulate subject imports for the purposes of my threat analysis. The record does not indicate that there would likely be any significant difference in the conditions of competition between subject imports from Morocco and Russia. No party has argued to the contrary. Accordingly, I exercise my discretion to cumulate subject imports from Morocco and Russia for the purposes of my threat analysis.
subsidy is a subsidy described in Article 3 or 6.1 of the Subsidies Agreement) and whether imports of the subject merchandise are likely to increase,
(II) any existing unused production capacity or imminent, substantial increase in production capacity in the exporting country indicating the likelihood of substantially increased imports of the subject merchandise into the United States, taking into account the availability of other export markets to absorb any additional exports,
(III) a significant rate of increase of the volume or market penetration of imports of the subject merchandise indicating the likelihood of substantially increased imports,
(IV) whether imports of the subject merchandise are entering at prices that are likely to have a significant depressing or suppressing effect on domestic prices and are likely to increase demand for further imports,
(V) inventories of the subject merchandise, (VI) the potential for product-shifting if production facilities in the foreign country, which can be
used to produce the subject merchandise, are currently being used to produce other products, … (VIII) the actual and potential negative effects on the existing development and production
efforts of the domestic industry, including efforts to develop a derivative or more advanced version of the domestic like product, and
(IX) any other demonstrable adverse trends that indicate the probability that there is likely to be material injury by reason of imports (or sale for importation) of the subject merchandise (whether or not it is actually being imported at the time).
19 U.S.C. § 1677(7)(F)(i). To organize my analysis, I discuss the applicable statutory threat factors using the same volume/price/impact framework that applies to our material injury analysis. Statutory threat factors (II), (III), (V), and (VI) are discussed in the analysis of subject import volume. Statutory threat factor (IV) is discussed in the analysis of subject import price effects. Statutory factors (VIII) and (IX) are discussed in the analysis of impact. Statutory factor (VII) concerning agricultural products is inapplicable to this investigation.
126 19 U.S.C. § 1677(7)(H).

64
C. Analysis
1. Likely Volume
I find that the increase in cumulated subject import volume and market share during the POI, although significant, does not indicate the likelihood of substantially increased imports. As discussed above, subject imports were pulled into the U.S. market by a supply shortage that was intentionally created and recognized by the domestic industry. When Mosaic announced its intention to idle Plant City in late 2017, and Nutrien announce the closure of its Redwater facility in early 2018, they did so fully expecting that the U.S. market would need more imports to fill the supply gap, a gap only widened by the domestic industry’s refusal to supply major U.S. purchasers and its prioritization of export markets.127 U.S. purchasers immediately scrambled to secure volume from alternate sources of supply, including subject imports, in advance of the closures coming into effect, without ever exceeding the supply gap created by the domestic industry during the POI. At present there are no announcements or rumors of domestic facility closures that would cause a further supply shock in the imminent future. Moreover, notwithstanding any increased focus on the U.S. market during the POI, responding subject foreign producers did not increase their exports to the United States to levels sufficient to have significant adverse effects on the domestic industry.
The most recent import volume trends similarly do not support a likelihood of substantially increased imports. In Q1 2020, subject import volumes and market share *** and domestic producers’ shipments and market share ***, as compared to Q1 2019.128 Subject imports were *** ST in Q1 2020, *** percent smaller in quantity than their shipments in interim 2019. Domestic producers’ U.S. shipments were *** ST in Q1 2020, *** percent larger in quantity than their U.S. shipments in interim 2019.129 Subject import market share was lower in Q1 2020 at *** percent than in Q1 2019 to *** percent. Domestic producers’ market share was higher in Q1 2020 at *** percent than in Q1 2019 at *** percent.130 Given that *** of subject import growth occurred early in the POI between 2017 and 2018, and the subject
127 See supra at I.A. (discussion under Volume). 128 See Preliminary Phase Staff Report at Table C-1. The record allows comparisons of Q1 2020
from the preliminary phase data or the first three quarter of 2020 from the final phase data. Shipments in the final phase were not collected on a quarterly basis. Focusing on Q1 comparisons here avoids any post-petition effects in the data.
129 Preliminary Phase Staff Report at Tables IV-8 and C-1. 130 Preliminary Phase Staff Report at Table C-1. In comparing the final phase interim data,
subject import market share was lower in interim 2020 at *** percent than in interim 2019 at *** percent. The domestic industry’s market share was higher in interim 2020 at *** percent than in interim 2019 at *** percent. CR/PR at Table C-1.
65
import volume *** during the most recent part of the POI, the rate of increase of subject imports and trend in the most recent period do not indicate a likelihood of substantially increased imports in the imminent future.
I also find that the excess capacity in Morocco and Russia does not indicate the likelihood of substantially increased imports of the subject merchandise. The Commission received questionnaire responses from foreign producers and/or exporters accounting for the vast majority of the volume of subject imports over the POI.131 The combined capacity of these firms increased in each year during 2017-2019, ending *** percent higher in 2019 than in 2017.132 Their collective production capacity was *** percent higher in interim 2020 than in interim 2019.133 The collective production capacity for full year 2020 is projected to be *** percent higher than in 2019 and *** percent higher in 2021 than in 2020.134
Responding foreign producers’ production in the subject countries also increased in each year during 2017-19, ending *** percent higher in 2019 than in 2017.135 The foreign industries’ capacity utilization was *** high: *** percent in 2017, *** percent in 2018, and *** percent in 2019, and ending interim 2020 at *** percent.136 Projected capacity utilization for full year 2020 is *** percent and *** percent in 2021.137 Moreover, although limited capacity expansion is projected in the imminent future, excess capacity is projected to be lower than it was during the full years of the POI as projected capacity utilization is higher.138
Notwithstanding their excess capacity during the POI, responding subject foreign producers did not increase their exports to the United States to levels sufficient to have significant adverse effects on the domestic industry. Based on these collected data, I do not find that the cumulated excess capacity of subject Moroccan and Russian producers indicates a likelihood of significantly increased imports of subject merchandise.139
131 CR/PR at VII-3, VII-10. 132 CR/PR at VII-16; CR/PR at Table VII-10. 133 CR/PR at VII-16; CR/PR at Table VII-10. 134 CR/PR at VII-16; CR/PR at Table VII-10. 135 CR/PR at VII-17; CR/PR at Table VII-10. 136 CR/PR at Table VII-10. 137 CR/PR at Table VII-10. 138 CR/PR at Table VII-10. 139 OCP has also reported on certain new capacity coming online starting in *** that is being
constructed to address growth in non-U.S. markets, which does not alter my conclusion given its timing and focus. See OCP Prehearing Br. at 120-122 and Att. C (*** Aff.) at para. 7.
Product shifting is not a substantial issue in this investigation, with no producer reporting the ability to shift capacity between fertilizers and other product. CR/PR at Table II-3. See also CR/PR at Table VII-8 (Russian producers reporting *** out-of-scope production on the same equipment).

66
These data also show that the subject foreign industries are highly export-oriented, with exports constituting *** percent, *** percent, and *** percent from 2017-2019 and ending the POI at *** percent.140 However, a large majority of these exports went to non-U.S. markets.141 Exports to the United States decreased steadily beginning in 2018.142 With healthy demand conditions in faster growing third-country markets, there is no incentive to shift sales from those markets to the U.S. market, and such conditions afford the prospect of some sales growth for subject producers in home and third-country markets.143
The inventories of subject merchandise in the United States and in Morocco and Russia also do not indicate the likelihood of substantially increased imports. There was no inventory overhang of subject imports in the United States. End-of-period inventories of subject imports at the end of Q2 2020 were *** ST, their lowest level since ***.144 This continued the overall declining trend from late in 2019.145 Subject foreign producer inventories were lower in interim 2020 as compared to interim 2019 and were projected to be lower in 2020 than in 2019, and declining further in 2021.146
For all of these reasons, I do not find a likelihood of substantially increased subject import volume in the imminent future.147 Instead, absent the orders, subject imports in the
140 CR/PR at Table VII-10. 141 CR/PR at Table VII-10. 142 CR/PR at Table VII-10. Post-petition, there are also very few reported arranged imports from
subject countries to the United States. CR/PR at Table VII-12. 143 See, e.g., OCP Prehearing Br. at 121-122; EuroChem Posthearing Br. at 3. There are
safeguard measures in Vietnam on certain fertilizers, but Vietnam was not a significant export market for either subject foreign industry before their imposition, and these measures were imposed in March 2018. See CR/PR at VII-20-VII-21; CR/PR at Tables VII-4, VII-9.
144 CR/PR at Tables D-1-D-2. These inventories declined further to *** ST at the end of Q3 2020, post-petition, their lowest level in ***.
145 CR/PR at Tables D-1-D-2. 146 CR/PR at Table VII-7. 147 In my analysis, I have also considered the nature of the subsidies Commerce has found to be
countervailable. I note that in its final countervailing duty determination concerning phosphate fertilizers from Morocco, Commerce found six subsidy programs to be countervailable. These include one loan program, one program for provision of goods and services for less than adequate remuneration, three tax benefit programs, and one customs duty exemption program. Issues and Decision Memorandum for the Final Affirmative Determination of the Countervailing Duty Investigation of Phosphate Fertilizers from the Kingdom of Morocco (Feb. 8, 2021) (EDIS Doc. 734944). In its final countervailing duty determination on phosphate fertilizers from Russia, Commerce found eleven subsidy programs to be countervailable. These include one program for provision of goods for less than adequate remuneration, one tax incentive program, seven regional government subsidy programs, one special investment contract, and one preferential debt financing program. Issues and Decision Memorandum for the Final Affirmative Determination of the Countervailing Duty Investigation of
67
U.S. market would simply fill the same need as they did during the POI pre-petition, when they were pulled into the market due to conditions of the domestic industry’s own making.
2. Likely Price Effects
I found above in section I.B. that cumulated subject imports did not engage in significant underselling, or depress prices to a significant degree, or prevent price increases that would otherwise have occurred to a significant degree during the POI. The record provides no indication that the pricing of cumulated subject imports is likely to be different during the imminent future than during the POI. My finding that there is not a likelihood of significantly increased cumulated subject imports in the imminent future further supports a conclusion that pricing patterns for cumulated subject imports are unlikely to change appreciably in the imminent future.
Accordingly, I find that cumulated imports of subject merchandise are unlikely to enter at prices that are likely to have a significant depressing or suppressing effect on domestic prices, or are likely to increase demand for such imports.
3. Likely Impact
I do not find that subject imports are likely to have actual or potential negative effects on the existing development and production efforts of the domestic industry. The domestic industry’s total capital expenditures increased steadily by a substantial *** percent from 2017 to 2019 and were *** percent higher in interim 2020 than in interim 2019. Capital expenditures that increased from $*** in 2017 to $*** in 2019 suggest that the domestic industry’s existing development and production efforts were robust during the POI.148 Large
Phosphate Fertilizers from the Russian Federation (Feb. 8, 2021) (EDIS Doc. 734944). Additionally, I observe that Commerce found one program in Morocco contingent upon export performance, Tax Incentives for Export Operations program, which is among the types of subsidies described in Article 3.1 of the WTO Agreement on Subsidies and Countervailing Measures. See EDIS Doc. 734944 at 5, 72-73. Given that subject imports were pulled into the U.S. market to supply demand unfulfilled by U.S. producers, I do not find that the nature of these subsidy programs makes further subject imports from Morocco and Russia likely in the imminent future absent relief.
148 CR/PR at Tables C-1, VI-6. Research and development expenses were $*** in 2017, $*** in 2018, and *** in 2019. They were $*** in interim 2019 and $*** in interim 2020. CR/PR at Table VI-6.

68
acquisitions of competitors (by Mosaic and Nutrien) or the expansion of *** during the POI indicate an active and competitive industry.149
Mosaic and Nutrien acquired or merged with competing firms, and then closed down or converted redundant high-cost facilities. Increases in subject imports during the POI were the intended result of the domestic industry’s development strategy, which included Mosaic’s closure of Plant City and Nutrien’s closure of the Redwater facility in Canada described above. Imports came in to fill the resulting gap in the U.S. market. Petitioner also invested billions of dollars in facilities located in Brazil, Peru, and Saudi Arabia to serve the U.S. and global markets.150 Mosaic’s joint venture in Saudi Arabia is one of the beneficiaries of the post-petition departure of subject imports, increasing nonsubject supply that the industry could not meet. Domestic producers have also developed proprietary NPS products, such as Mosaic’s MicroEssentials, which sells domestically at a premium above MAP and DAP prices.151 In August 2020, Mr. O’Rourke commented that Mosaic’s long-term transformation efforts are really starting to deliver substantial structural cost savings, and we expect to drive additional savings in the years ahead. Our balance sheet continues to strengthen as we paid down debt and generated strong cash flows. Fertilizer markets continue to improve and prices are rising. We are navigating the COVID-19 situation successfully, with minimal impacts to our business. So in summary, Mosaic is more resilient and competitive than it has ever been.152
Petitioner has blamed subject imports for the domestic industry’s financial performance during the POI, but I have found no causal connection between subject imports and the losses the industry recorded later in the POI. There is a fundamental disconnect between subject import volumes and the domestic industry’s financial performance declines that start in 2019. Domestic prices track global prices but price declines in 2019 were exacerbated by several seasons of historic wet weather that stalled the usual and projected U.S. demand for fertilizers. Subject imports predominantly oversold domestic product throughout the POI, including in 2019 – they can garner a premium for supply reasons – and did not lead prices down. Any demand and supply imbalance in 2019 was temporary, it was comparable for domestic production and subject imports, and it was caused by adverse weather, not aggressive selling or low prices. Demand trends in 2020 are positive and U.S. prices started increasing before the
149 See, e.g., CR/PR at III-2-III-4. 150 See, e.g., OCP Prehearing Br., Ex. 9 (2017 Form 10-K) at 2-3, 27 (Brazil and Peru investments),
and Ex. 43 (Saudi joint venture DAP production starts). 151 CR/PR at I-8-I-9, I-13; Tr. at 120 (Mr. Jung) 152 OCP Prehearing Br., Ex. 69 (Mosaic, Q2 2020 Earnings Call (Aug. 4, 2020)) at 20. As the above
quote suggests, there is no indication that the COVID-19 pandemic has negatively impacted the domestic industry or its future prospects. See also Gavilon Prehearing Br. at 70-71.
69
filing of these petitions. The subject imports did not cause material injury during the POI and there is no likelihood of any change in conditions of competition that will likely cause subject imports to have a different impact on the industry in the imminent future.153
Accordingly, I find that the domestic industry is not threatened with material injury by reason of subject imports.
Conclusion
For the reasons stated above, I determine that an industry in the United States is not materially injured or threatened with material injury by reason of imports of phosphate fertilizers from Morocco and Russia found by Commerce to be subsidized by the governments of Morocco and Russia.
153 I acknowledge that domestic producers reported that they anticipated that subject imports
would have negative effects. CR/PR at Table VI-10. Nevertheless, I cannot accord these perceptions controlling weight in light of other record data indicating that subject imports did not have a significant impact on the domestic industry during the POI, are not likely to increase significantly in the imminent future, and have not caused and are unlikely to cause significant price effects.


I-1
Introduction
Background
These investigations result from petitions filed with the U.S. Department of Commerce (“Commerce”) and the U.S. International Trade Commission (“USITC” or “Commission”) by The Mosaic Company (“Mosaic”), Plymouth, Minnesota, on June 26, 2020, alleging that an industry in the United States is materially injured and threatened with material injury by reason of subsidized imports of phosphate fertilizers1 from Morocco and Russia. The following tabulation provides information relating to the background of these investigations.2 3
Effective date Action
June 26, 2020
Petitions filed with Commerce and the Commission; institution of Commission investigations (85 FR 40319, July 6, 2020)
July 16, 2020 Commerce’s notice of initiation of CVD investigations (85 FR 44505, July 23, 2020)
August 10, 2020 Commission’s preliminary determinations (85 FR 49394, August 13, 2020)
November 23, 2020 Scheduling of final phase of Commission investigations (85 FR 79033, December 8, 2020)
November 30, 2020 Commerce’s preliminary CVD determinations (85 FR 76522 and 85 FR 76524)
February 9, 2021 Commission’s hearing
February 16, 2021 Commerce’s final CVD determinations (86 FR 9479 and 86 FR 9482)
March 11, 2021 Commission’s vote
March 31, 2021 Commission’s views
1 See the section entitled “The subject merchandise” in Part I of this report for a complete
description of the merchandise subject in this proceeding. 2 Pertinent Federal Register notices are referenced in appendix A, and may be found at the
Commission’s website (www.usitc.gov). 3 Appendix B presents a list of witnesses who appeared at the Commission’s hearing.

I-2
Statutory criteria
Section 771(7)(B) of the Tariff Act of 1930 (the “Act”) (19 U.S.C. § 1677(7)(B)) provides that in making its determinations of injury to an industry in the United States, the Commission--
shall consider (I) the volume of imports of the subject merchandise, (II) the effect of imports of that merchandise on prices in the United States for domestic like products, and (III) the impact of imports of such merchandise on domestic producers of domestic like products, but only in the context of production operations within the United States; and. . . may consider such other economic factors as are relevant to the determination regarding whether there is material injury by reason of imports.
Section 771(7)(C) of the Act (19 U.S.C. § 1677(7)(C)) further provides that--4
In evaluating the volume of imports of merchandise, the Commission shall consider whether the volume of imports of the merchandise, or any increase in that volume, either in absolute terms or relative to production or consumption in the United States is significant.. . .In evaluating the effect of imports of such merchandise on prices, the Commission shall consider whether. . .(I) there has been significant price underselling by the imported merchandise as compared with the price of domestic like products of the United States, and (II) the effect of imports of such merchandise otherwise depresses prices to a significant degree or prevents price increases, which otherwise would have occurred, to a significant degree.. . . In examining the impact required to be considered under subparagraph (B)(i)(III), the Commission shall evaluate (within the context of the business cycle and conditions of competition that are distinctive to the affected industry) all relevant economic factors which have a bearing on the state of the industry in the United States, including, but not limited to. . . (I) actual and potential decline in output, sales, market share, gross profits, operating profits, net profits, ability to service debt, productivity, return on investments, return on assets, and utilization of capacity, (II) factors affecting domestic prices, (III) actual and potential negative effects on cash flow, inventories, employment, wages, growth, ability to raise capital, and investment, (IV) actual and potential negative effects on the existing development and production efforts of the domestic industry, including efforts to develop a derivative or more advanced version of the domestic like product, and (V) in {an antidumping investigation}, the magnitude of the margin of dumping.
4 Amended by PL 114-27 (as signed, June 29, 2015), Trade Preferences Extension Act of 2015.

I-3
In addition, Section 771(7)(J) of the Act (19 U.S.C. § 1677(7)(J)) provides that—5 (J) EFFECT OF PROFITABILITY.—The Commission may not determine that there is no material injury or threat of material injury to an industry in the United States merely because that industry is profitable or because the performance of that industry has recently improved.
Organization of report
Part I of this report presents information on the subject merchandise, subsidy margins, and domestic like product. Part II of this report presents information on conditions of competition and other relevant economic factors. Part III presents information on the condition of the U.S. industry, including data on capacity, production, shipments, inventories, and employment. Parts IV and V present the volume of subject imports and pricing of domestic and imported products, respectively. Part VI presents information on the financial experience of U.S. producers. Part VII presents the statutory requirements and information obtained for use in the Commission’s consideration of the question of threat of material injury as well as information regarding nonsubject countries.
Market summary
Phosphate fertilizers are generally used for farm crop growth. The leading U.S. producer of phosphate fertilizers is Mosaic, while leading producers of phosphate fertilizers outside the United States include OCP S.A. (“OCP”) of Morocco and PhosAgro PJSC (“PhosAgro”), and Eurochem of Russia. The leading U.S. importers of phosphate fertilizers from Morocco are ***, while the leading importers of phosphate fertilizers from Russia are ***. Leading importers of phosphate fertilizers from nonsubject countries include ***. U.S. purchasers of phosphate fertilizers are wholesalers, distributors, and retailers that supply agricultural end users; leading purchasers include ***.
5 Amended by PL 114-27 (as signed, June 29, 2015), Trade Preferences Extension Act of 2015.
I-4
Apparent U.S. consumption of phosphate fertilizers totaled approximately *** short tons ($***) in 2019. Currently, five firms are known to produce phosphate fertilizers in the United States. U.S. producers’ U.S. shipments of phosphate fertilizers totaled *** short tons ($***) in 2019, and accounted for *** percent of apparent U.S. consumption by quantity and *** percent by value. U.S. imports from subject sources totaled 2.7 million short tons ($834.7 million) in 2019 and U.S. shipments of such imports accounted for *** percent of apparent U.S. consumption by quantity and *** percent by value. U.S. imports from nonsubject sources totaled 511.2 thousand short tons ($148.0 million) in 2019 and U.S. shipments of such imports accounted for *** percent of apparent U.S. consumption by quantity and *** percent by value.
Summary data and data sources
A summary of data collected in these investigations is presented in appendix C, table C-1. Except as noted, U.S. industry data are based on questionnaire responses of three firms that accounted for the vast majority U.S. production of phosphate fertilizers during 2019. U.S. imports are based on questionnaire responses from ten firms that accounted for the vast majority of U.S. imports from Morocco and from Russia during 2019.6
Previous and related investigations
Phosphate fertilizers have not been the subject to prior countervailing or antidumping duty investigations in the United States.
Nature and extent of subsidies
On February 16, 2021, Commerce published a notice in the Federal Register of its final determination of countervailable subsidies for producers and exporters of phosphate fertilizers from Morocco.7 Table I-1 presents Commerce’s findings of subsidization of phosphate fertilizers in Morocco.
6 As discussed in more detail in Part IV, in the preliminary phase of these investigations, U.S. import
data were compiled using official import statistics. However, one U.S. importer, ***, informed that certain of its imports of out-of-scope merchandise were misclassified under HTS statistical reporting numbers 3103.11.0000, 3103.19.0000, 3105.20.0000, 3105.30.0000, 3105.40.0010, 3105.40.0050, 3105.51.0000, and 3105.59.0000. Consequently for this final phase, U.S. import data are compiled using data submitted in response to Commission questionnaires.
7 86 FR 9482, February 16, 2021.

I-5
Table I-1 Phosphate fertilizers: Commerce’s final subsidy determination with respect to imports from Morocco
Entity Final countervailable subsidy rate
(percent) OCP S.A.1 19.97
All others 19.97 1 The following companies are cross-owned with OCP S.A.: Jorf Fertilizers Company I, Jorf Fertilizers Company II, Jorf Fertilizers Company III, Jorf Fertilizers Company IV, Jorf Fertilizers Company V, and Maroc Phosphore. Source: 86 FR 9482, February 16, 2021.
On February 16, 2021, Commerce published a notice in the Federal Register of its final determination of countervailable subsidies for producers and exporters of phosphate fertilizers from Russia.8 Table I-2 presents Commerce’s findings of subsidization of phosphate fertilizers in Russia. Table I-2 Phosphate fertilizers: Commerce’s final subsidy determination with respect to imports from Russia
Entity Final countervailable subsidy rate
(percent) Industrial Group Phosphorite LLC1 47.05
Joint Stock Company Apatit2 9.19
All others 17.20 1 The following companies are cross-owned with Industrial Group Phosphorite LLC: Mineral and Chemical Company EuroChem, JSC; NAK Azot, JSC; EuroChem Northwest, JSC; Joint Stock Company Kovdorksy GOK; EuroChem-Energo, LLC; EuroChem-Usolsky Potash Complex, LLC; EuroChem-BMU, LLC; JSC Nevinnomyssky Azot; and EuroChem Trading Rus, LLC. 2 The following companies are cross-owned with Joint Stock Company Apatit: PhosAgro PJSC; PhosAgro‐Belgorod LLC; PhosAgro‐Don LLC; PhosAgro‐Kuban LLC; PhosAgro‐Kursk LLC; PhosAgro‐Lipestk LLC; PhosAgro‐Orel LLC; PhosAgro‐ Stavropol LLC; PhosAgro‐Volga LLC; PhosAgro‐SeveroZapad LLC; PhosAgro‐ Tambov LLC; and Martynovsk AgrokhimSnab LLC. Source: 86 FR 9479, February 16, 2021.
8 86 FR 9479, February 16, 2021.
I-6
The subject merchandise
Commerce’s scope
In the current proceeding, Commerce has defined the scope as follows:9
The merchandise covered by this investigation is phosphate fertilizers in all physical forms (i.e., solid or liquid form), with or without coating or additives such as anti-caking agents. Phosphate fertilizers in solid form are covered whether granular, prilled (i.e., pelletized), or in other solid form (e.g., powdered). The covered merchandise includes phosphate fertilizers in the following forms: Ammonium dihydrogenorthophosphate or monoammonium phosphate (MAP), chemical formula NH4H2PO4; diammonium hydrogenorthophosphate or diammonium phosphate (DAP), chemical formula (NH4)2HPO4; normal superphosphate (NSP), also known as ordinary superphosphate or single superphosphate, chemical formula Ca(H2PO4)2·CaSO4; concentrated superphosphate, also known as double, treble, or triple superphosphate (TSP), chemical formula Ca(H2PO4)2·H2O; and proprietary formulations of MAP, DAP, NSP, and TSP. The covered merchandise also includes other fertilizer formulations incorporating phosphorous and non-phosphorous plant nutrient components, whether chemically-bonded, granulated (e.g., when multiple components are incorporated into granules through, e.g., a slurry process), or compounded (e.g., when multiple components are compacted together under high pressure), including nitrogen, phosphate, sulfur (NPS) fertilizers, nitrogen, phosphorous, potassium (NPK) fertilizers, nitric phosphate (also known as nitrophosphate) fertilizers, ammoniated superphosphate fertilizers, and proprietary formulations thereof that may or may not include other nonphosphorous plant nutrient components. For phosphate fertilizers that contain non-phosphorous plant nutrient components, such as nitrogen, potassium, sulfur, zinc, or other non-phosphorous components, the entire article is covered, including the non-phosphorous content, provided that the phosphorous content (measured by available diphosphorous pentaoxide, chemical formula P2O5) is at least 5% by actual weight.
9 86 FR 9482 and 86 FR 9479, February 16, 2021.
I-7
Phosphate fertilizers that are otherwise subject to this investigation are included when commingled (i.e., mixed or blended) with phosphate fertilizers from sources not subject to this investigation. Phosphate fertilizers that are otherwise subject to this investigation are included when commingled with substances other than phosphate fertilizers subject to this investigation (e.g., granules containing only non-phosphate fertilizers such as potash or urea). Only the subject component of such commingled products is covered by the scope of this investigation. The following products are specifically excluded from the scope of this investigation: (1) ABC dry chemical powder preparations for fire extinguishers containing MAP or DAP in powdered form; (2) industrial or technical grade MAP in white crystalline form with available P2O5 content of at least 60% by actual weight; (3) industrial or technical grade diammonium phosphate in white crystalline form with available P2O5 content of at least 50% by actual weight; (4) liquid ammonium polyphosphate fertilizers; (5) dicalcium phosphate, chemical formula CaHPO4; (6) monocalcium phosphate, chemical formula CaH4P2O8; (7) trisodium phosphate, chemical formula Na3PO4; (8) sodium tripolyphosphate, chemical formula Na5P3O10; (9) prepared baking powders containing sodium bicarbonate and any form of phosphate; (10) animal or vegetable fertilizers not containing phosphate fertilizers otherwise covered by the scope of this investigation; (11) phosphoric acid, chemical formula H3PO4. The Chemical Abstracts Service (CAS) numbers for covered phosphate fertilizers include, but are not limited to: 7722-76-1 (MAP); 7783-28-0 (DAP); and 65996-95-4 (TSP). The covered products may also be identified by Nitrogen-Phosphate- Potash composition, including but not limited to: NP 11-52-0 (MAP); NP 18-46-0 (DAP); and NP 0-46-0 (TSP).

I-8
Tariff treatment
Based upon the scope set forth by Commerce, information available to the Commission indicates that the merchandise subject to these investigations would be provided for in subheadings 3103.11.00, 3103.19.00, 3103.90.00 (statistical reporting number 3103.90.0010), 3105.10.00, 3105.20.00, 3105.30.00, 3105.40.00 (3105.40.0010 or 3105.40.0050), 3105.51.00, 3105.59.00, 3105.60.00 or 3105.90.00 (3105.90.0010 or 3105.90.0050) of the Harmonized Tariff Schedule of the United States (“HTS”). The 2021 general rate of duty is free for the above listed subheadings. Decisions on the tariff classification and treatment of imported goods are within the authority of U.S. Customs and Border Protection.
The product
Description and applications
Phosphorus (P) is a chemical element essential to all life on Earth which has no substitute. Phosphate fertilizer in soluble P form is one of the three primary plant nutrients along with nitrogen (N) and potassium (K) responsible for crop production and bountiful harvests over more than 300 million acres of fertile U.S. cropland.10 Phosphate fertilizers may contain phosphorus nutrient alone or be combined chemically or physically blended in solid or liquid forms in various combinations with nitrogen and potassium nutrients. Phosphorus is a vital component in the process of converting the sun’s energy into food, fiber, and oilseeds, where it plays a key role in plant photosynthesis, the metabolism of sugars, energy storage and transfer, cell division, cell enlargement, and transfer of genetic information. These processes lead to healthy root growth, groundcover, water use efficiency, and the quality of fruit, vegetable, and grain crops vital to U.S. and global nutrition. Soluble phosphate is also used in industrial products such as soft drinks, food products, fire retardants and metal treatment.11
There are four fundamentally representative phosphate fertilizer product types, monoammonium phosphate (MAP) and diammonium phosphate (DAP), together with triple superphosphate (TSP), and single superphosphate (SSP), each differing somewhat in chemical and physical properties, but all containing primary phosphorus (P) nutrient designed to fertilize plants.12 Other types of phosphate fertilizers contain various chemical combinations of nitrogen, phosphorus and sulfur (NPS), such as Mosaic’s proprietary MicroEssentials® NPS
10 National Agricultural Statistics Service (NASS), USDA, Acreage, June 30, 2020. 11 Phosphorus, “Essential Elements,” The Fertilizer Institute, www.tfi.org, retrieved July 17, 2020. 12 Petition, volume I, pp. I-9-10.

I-9
specialty line of fertilizers, and nitrogen, phosphorus, and potassium (NPK) chemical combinations.13
Fertilizer nutrient analyses quantify percentages of nitrogen, phosphorus, and potassium in terms of nitrogen (N), and the oxides of phosphorus (P2O5) and potassium (K2O), that are reported in the format (N-P-K). MAP and DAP are large volume ammonium phosphate (NP) fertilizers sharing similar chemical compositions and characteristics, each popularly used for direct application and in multi-nutrient NPK bulk blends. MAP, (11-52-0), is a high-analysis phosphate fertilizer compound containing 11 percent nitrogen (N), and 52 percent plant available phosphorus (P2O5). It is higher in phosphorus content than DAP (52 percent vs. 46 percent) and mildly acidic in soils, while DAP, (18-46-0), is higher in nitrogen (18 percent vs. 11 percent) and mildly alkaline, each type variably used dependent on crop and soil types. Mosaic MicroEssentials® NPS product is also a high volume product composed of various combinations of MAP, ammonium sulfate, elemental sulfur and zinc combined in single granules, for example (12-40-0 10S 1Z). Specialty products of this nature enhance crop yields and fertilizer efficiency through prescription formulation and application methods. TSP is a high-analysis, single nutrient phosphorus fertilizer of phosphate rock mineral and phosphoric acid chemical (0-46-0) finding use in direct application and NPK bulk blends. Single superphosphate (SSP) is a low-analysis product derived from phosphate mineral and sulfuric acid (0-20-0), having limited use in direct application and multi-nutrient NPK blend applications.14
Phosphate fertilizer primary phosphorus nutrient is derived from phosphate rock mineral ores of sedimentary marine origin deposited over various geological periods millions of years ago, now mined in Florida and North Carolina and in the western states of Idaho and Utah.15 Moroccan phosphate rock ore is also of sedimentary origin; Russian phosphate rock ores of igneous (molten rock) origin of the Kola Peninsula are the highest grade globally.16 17 Marketable phosphate rock is an insoluble form of phosphate ore that is refined and transformed into several types of soluble phosphate fertilizers at production plants, of which representative principal forms are the solid granular ammoniated phosphate DAP, and MAP. The various phosphate grades of commercial phosphate rocks are expressed in terms of tricalcium phosphate, Ca3(PO4)2, known in the trade as “Bone Phosphate of Lime,” or BPL.
13 Mosaic, www.cropnutrition.com/microessentials, retrieved July 20, 2020. 14 Petition, volume I, pp. I-9-14. 15 Phosphate Rock, Mineral Commodity Summaries, U.S. Geological Survey, January 2020. 16 Petition, volume II, Morocco, pp. II-1-6. 17 Petition, volume III, Russia, pp. III-2-7.

I-10
Typical BPL contents of marketable U.S. phosphate rock are estimated to average around 61 percent BPL, or 28 percent as phosphorus pentoxide, P2O5.18 19
Standards established for expressing the plant available nutrient analysis of fertilizers and associated labeling in the United States and Canada are coordinated by the Association of American Plant Food Control Officials Organization (AAPFCO).20 Nitrogen, Phosphorus, and Potassium available plant nutrient contents are expressed in terms of nitrogen (N), and the oxides of phosphorus (P2O5), and potassium (K2O). Nitrogen forms are recognized as completely water soluble, phosphate forms mostly soluble in a combination of water or citrate solution, and potassium, in water. Any insoluble portions outside of water or citrate solution, however, are not considered a part of the official nutrient analysis. Fertilizer nutrient analyses are designated simply by the abbreviated term N-P-K. For example, a fertilizer having a plant available nutrient analysis of 15 percent each of nitrogen, P2O5, and K2O, would be labeled simply as 15-15-15, or if an N-P, 15-15-0, or a P-K, 0-15-15.
U.S. phosphate fertilizer use is dependent on demand for domestic crop fertilization.21 Fertilizer consumption is cyclically dependent upon multiple factors including crop distribution and soil types, planted crop acreage and weather during narrow spring and fall seasonal application windows, crop and fertilizer prices, offshore competition and global supply and demand.22 Also, export volumes of DAP and MAP are important sources of demand for U.S. produced phosphate fertilizers.23 Phosphate fertilizers are generally shipped in bulk to wholesales/distributors, retailers or end users (farmers) via barge, rail and truck. There is limited end use of fertilizer materials in industrial fire retardants and food applications. Nonfertilizer uses for animal feeds and certain other products produced from purified phosphoric acid are also present in the U.S. marketplace.24
18 The P2O5 content of tricalcium phosphate or BPL is 45.76 percent; thus, BPL x 0.4576 = P205. 19 U.S. Geological Survey, “Phosphate Rock 2017.” 20 AAPFCO Product Label Guide, 2019, www.aapfco.org, retrieved July 19, 2020. 21 USDA, ERS, Fertilizer use and price, https://www.ers.usda.gov/data-products/fertilizer-use-and-
price.aspx, accessed July 2020. 22 Gavilon conference testimony (Harlander), pp. 1-3, and IRM testimony (O’Neill), pp. 1-5. 23 Phosphate Rock, Mineral Commodity Summaries, U.S. Geological Survey, January 2020. 24 Petitioner responses to Commerce supplemental scope questions, pp. 10-11, July 6, 2020.
I-11
Manufacturing processes
The fundamentals of phosphate fertilizer manufacture are similar across the industry. Phosphate fertilizers are based on refined phosphate rock ore which first must be converted to soluble P form as liquid wet-process phosphoric acid (H3PO4). The major feedstocks required to produce phosphoric acid and thence to finished phosphate fertilizers are phosphate rock, a mineral of calcium, phosphorus and fluorine (calcium fluorapatite), anhydrous ammonia (NH3), and sulfur (S). Refined phosphate rock ore depending on logistics and location may be delivered from mining sites to producer phosphate plants by slurry pipeline, conveyor belt, rail or truck; anhydrous ammonia by pipeline or rail, and molten sulfur by rail. Phosphate rock and phosphate fertilizer production operations are vertically integrated and may use combinations of slurry pipeline and conveyor belt transfer from mine to plant depending upon distances between mining and manufacture. Refined phosphate rock in western states is delivered from mine to plant by cost effective slurry pipeline over distances up to 100 miles.25
Sulfur is first burned to produce sulfur oxides dissolved in water to produce liquid sulfuric acid (H2SO4), while byproduct steam generated in the process may be used to produce cogenerated power for plant operations and for possible surplus sales to local utility firms. This is followed by sulfuric acid acidulation of finely ground phosphate rock in a series of reaction vessels designed to produce liquid phosphoric acid. The major byproduct of this reaction is phosphogypsum (CaSO4) a product of calcium from the phosphate rock and sulfur from the sulfuric acid. Fluorine gas from the phosphate mineral is scrubbed out in water and used as a major municipal water fluoridation agent in the form of hydrofluorosilicic acid.26 Phosphogypsum slurry is filtered out from liquid phosphoric acid and pumped to disposal stacks or backfilled into mined out pits depending upon impurities.27 28
25 Simplot Phosphates, LLC, www.simplot.com, retrieved January 21, 2021. 26 Mosaic, www.mosaicco.com, retrieved July 21, 2020. 27 Petition exhibits, I-11-14. 28 Petition, volume II, p. II-15. Moroccan phosphogypsum is reportedly discharged to ocean waters.
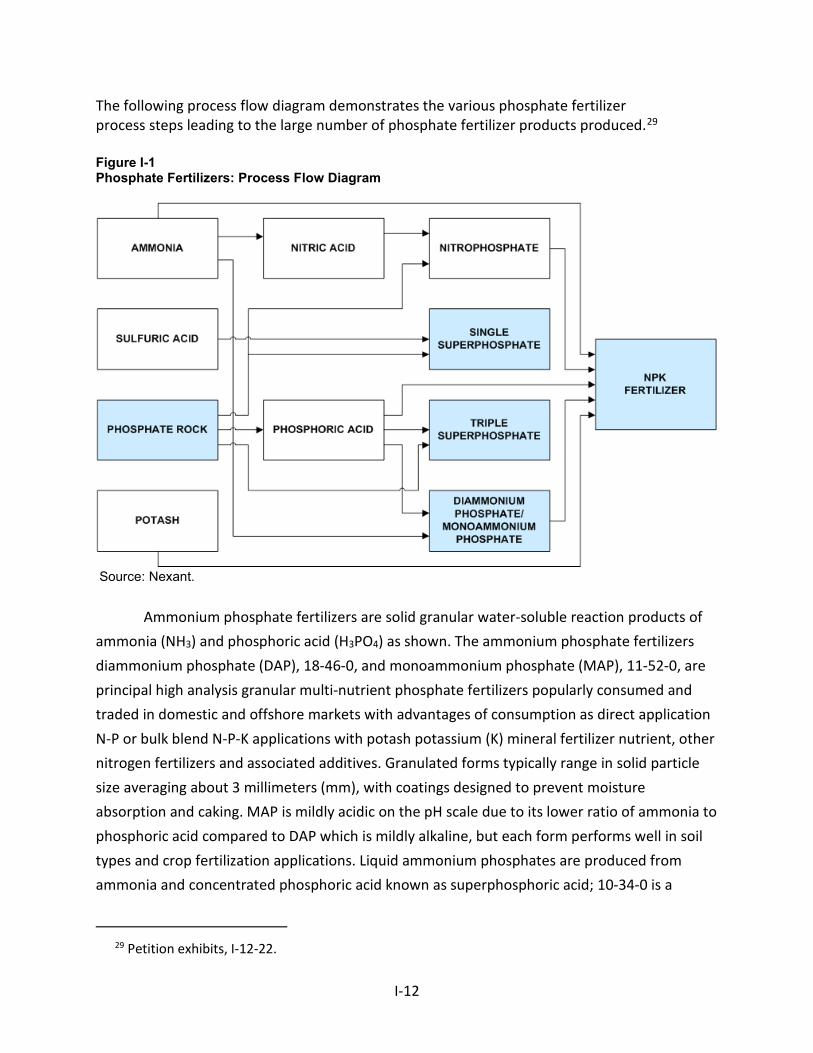
I-12
The following process flow diagram demonstrates the various phosphate fertilizer process steps leading to the large number of phosphate fertilizer products produced.29 Figure I-1 Phosphate Fertilizers: Process Flow Diagram
Source: Nexant.
Ammonium phosphate fertilizers are solid granular water-soluble reaction products of ammonia (NH3) and phosphoric acid (H3PO4) as shown. The ammonium phosphate fertilizers diammonium phosphate (DAP), 18-46-0, and monoammonium phosphate (MAP), 11-52-0, are principal high analysis granular multi-nutrient phosphate fertilizers popularly consumed and traded in domestic and offshore markets with advantages of consumption as direct application N-P or bulk blend N-P-K applications with potash potassium (K) mineral fertilizer nutrient, other nitrogen fertilizers and associated additives. Granulated forms typically range in solid particle size averaging about 3 millimeters (mm), with coatings designed to prevent moisture absorption and caking. MAP is mildly acidic on the pH scale due to its lower ratio of ammonia to phosphoric acid compared to DAP which is mildly alkaline, but each form performs well in soil types and crop fertilization applications. Liquid ammonium phosphates are produced from ammonia and concentrated phosphoric acid known as superphosphoric acid; 10-34-0 is a
29 Petition exhibits, I-12-22.
I-13
popular liquid ammonium polyphosphate fertilizer as this type prevents precipitation of solids in liquid formulations. Liquid polyphosphate fertilizers, although important, have lower volume applications compared to solid fertilizers.30
Various combinations of ammonia N, phosphoric acid P, and potash nutrient K can be reacted to produce granular chemically mixed or compound fertilizers (complex fertilizers) of various nutrient analyses ranging from N-P to N-P-K fertilizers, each chemically combined in a single homogeneous fertilizer granule. Certain types of this nature are also produced by compacting various fertilizer nutrient combinations together into a given fertilizer granule.31 Each of these types is reported to increase the efficiency of fertilizer application and crop yields by providing prescription formulation and application specificity for crops in a single granule. Sulfur and other chemical ingredients, zinc and other micronutrients, can also be added as constituents of these products. Complementary products are also produced in Morocco32 and Russia.33 34
Petitioner produces a series of proprietary MicroEssentials® (MES/MESZ) homogeneous nutrient granule products of N-P sulfur (NPS) and NPS-Zinc reported to account for 20 percent of applied phosphate fertilizer in the United States, and also shipped to other countries.35 36 The products are reportedly based on MAP, ammonium sulfate, elemental sulfur, and zinc having product analyses of MESZ®, 12-40-0 10S 1Z; MES15®, 13-33-0 15S; and MES10®, 12-40-0 10S.37 38 Simplot also produces a similar MAP-based NPS-Zn “40 Rock”™ product, 12-40-0, containing 1 percent of infused Zn and 6 percent S.39
Triple Superphosphate (TSP) is a high analysis single nutrient granular 0-46-0 phosphate fertilizer product containing 46% available P2O5 typically produced by the reaction of phosphoric acid with high analysis, 72-73% BPL (33% P2O5) ground phosphate rock. The product has declined in use over the years due to its limitations as a single nutrient fertilizer along with
30 Petitioner responses to Commerce supplemental scope questions, p. 10, July 6, 2020. 31 Petitioner responses to Commerce supplemental scope questions, pp. 11-13, July 6, 2020. 32 OCP, https://www.ocpgroup.ma/en/our-products/fortified-fertilizers, retrieved, July 26, 2020. 33 PhosAgro, https://www.phosagro.com/production/fertilizer/, retrieved July 26, 2020. 34 EuroChem, https://www.eurochemgroup.com/products/agricultural-products/, retrieved July 26,
2020. 35 Mosaic, www.cropnutrition.com/microessentials, retrieved July 20, 2020. 36 Mosaic, http://www.mosaicco.com/Who_We_Are/4238.htm, retrieved July 25, 2020. 37 Mosaic, http://www.mosaicco.com/products/premium_products.htm, retrieved July 20, 2020. 38 OCP conference testimony (Aranoff), pp. 1-3, and IRM conference testimony (O’Neill), pp. 1-5.
Respondents questioned the inclusion of petitioner proprietary MicroEssentials-type products as a commodity scope product.
39 J.R. Simplot conference testimony (Stone), pp. 1-2.
I-14
a general decline in U.S. phosphate rock grades and its acidic nature in the pH 3 range.40 According to official U.S. fertilizer consumption statistics, TSP consumption peaked circa mid-1975 and has progressively declined thereafter.41 U.S. producer Simplot , Pocatello, ID, advertises TSP as part of its product portfolio as a preferred source of P2O5 in high analysis bulk blends.42 Moroccan shipments of TSP to the United States averaged about 150,000 short tons, valued at $44 million during the period 2017-19.43 44 Israel also shipped similar amounts of TSP to the United States.
Single Superphosphate (SSP) is a low analysis single nutrient granular phosphate fertilizer assaying 20% available P205 produced by the reaction of sulfuric acid with ground phosphate rock. Single Superphosphate was one of the early chemically produced phosphate fertilizers in the United States and is no longer produced or consumed to any degree.
Nitrophosphates are granular phosphate fertilizer products produced from the nitric acid acidulation of phosphate rock designed to produce phosphoric acid and calcium nitrate used for N-P-K production confined principally to European producers who import phosphate rock feedstock. There is no presently known production of nitrophosphates in the United States or in subject countries.45
40 International Raw Materials conference testimony (O’Neill), pp. 1-5. 41 Fertilizer use and price, USDA, ERS, https://www.ers.usda.gov/data-products/fertilizer-use-and-
price.aspx, accessed July 2020. 42 Simplot, http://www.simplot.com/ag_suppliers/ag_crop_nutrition/dry_products, retrieved July 27,
2020. Simplot’s annual TSP capacity is rated at ***. 43 USITC Dataweb import trade data, HTS 3103.11.00, accessed July 25, 2020. 44 OCP, https://www.ocpgroup.ma/en/our-products/fertilizers, retrieved July 26, 2020. 45 Petition, Volume I, pp. I-9-13. and associated Part I exhibits, June 26, 2020.

I-15
Domestic like product issues
In its prehearing brief, the petitioner argued that the Commission should again define the domestic like product as all phosphate fertilizers, coextensive with the scope of these investigations, as it did in the preliminary determinations.46 Respondent Gavilon does not take a position on the domestic like product definition proposed by the petitioner.47 In the preliminary phase of these investigations, respondent International Raw Materials (“IRM”) argued that NPS constitutes a separate like product from MAP and DAP and respondent OCP contended that there are three domestic like products: TSP, NPS, and all other phosphate fertilizers under the scope of these investigations.48 No other party provided comments on the domestic like product definition.
46 Petitioner’s prehearing brief, pp. 9 and 19. 47 Respondent Gavilon’s prehearing brief, p. 8. 48 Respondent IRM’s postconference brief, pp. 5-11 and respondent OCP’s postconference brief, p. 4.

II-1
Part II: Conditions of competition in the U.S. market
U.S. market characteristics
Phosphate fertilizers are used primarily in agricultural applications to provide nutrients to plants.1 The amount and type of fertilizer used by farmers depends on soil conditions, climate conditions, type of crop, targeted yield, and prices of other fertilizers, and farmers will commonly use a custom mixture of fertilizers.2 The main types of phosphate fertilizers include monoammonium phosphate (“MAP”), diammonium phosphate (“DAP”), superphosphate or normal superphosphate (“SSP/NSP”), concentrated phosphate (or double, treble, or triple superphosphate) (“TSP”), and nitrogen-phosphate fertilizer enriched with sulfur (“NPS”); each are primarily characterized by their phosphorus content.3 MAP and DAP, the most common phosphate fertilizers, accounted for the majority of the share of shipments for domestic producers and subject importers during 2017-19.4 The U.S. phosphate fertilizer market is supplied by both domestically-produced and imported phosphate fertilizers, and domestic and foreign producers generally produce multiple types of phosphate fertilizers. Between 2017 and 2019, domestic producers’ share of total reported U.S. shipments decreased, while the share of product from Morocco and Russia increased.5
*** U.S. producers and half (5 of 10) of the responding importers reported that there have been changes to the product mix or marketing of phosphate fertilizers since January 1, 2017. *** reported an increase in the demand and/or supply of NPS in the U.S. market. ***
1 “All phosphate fertilizers contain phosphorus (P), measured in units of available phosphorus pentoxide (P2O5), one of the three primary nutrients for plants along with nitrogen (N) and potash/potassium (K).” Petition, p. I-9–I-10.
2 Retailers work with farmers to develop custom blends of fertilizers to meet their specific requirements. These blended products are typically not sold in bulk because they are specific to a particular end user and lack the stability to be transported over long distances. Petition, pp. I-13-14; Conference testimony of Andy Jung, Mosaic, p. 2.
3 Petition, p. I-9–I-14. 4 DAP and MAP together accounted for between *** percent (2019) and *** percent (2017) of
domestic producers’ U.S. shipments, between *** percent (2017) and *** percent (2019) of shipments of product imported from Morocco, and between *** percent (2017) and *** percent (2019) of shipments of product imported from Russia during 2017-19. For nonsubject imports, DAP and MAP accounted for between *** percent (2017) and *** percent (2019) of such shipments during 2017-19.
5 The share of domestic product decreased from *** percent of total reported U.S. shipments in 2017 to *** percent in 2019, while the share of phosphate fertilizers from Morocco increased from *** percent in 2017 to *** percent in 2019 and the share of phosphate fertilizers from Russia increased from *** percent in 2017 to *** percent in 2019.

II-2
reported that the increased demand for sulfur, zinc, and other additives in phosphate fertilizers have decreased the demand for DAP and MAP. *** also reported that Mosaic, ***, has produced less MAP than in previous years, and is producing more of its MicroEssentials SZ product, which has made domestic MAP less available in the U.S. market.6 *** reported new global production capacities launched in South Arabia and Morocco and a decrease in domestic production capacity. *** also reported that “more cargo containers appear to be arriving to the U.S. on consignment with no price point established up front… {which} can lead to larger drops in price with weak demand.”
Apparent U.S. consumption of phosphate fertilizers decreased during 2017-19. Overall, apparent U.S. consumption decreased by *** percent from 2017 to 2019 and was *** percent lower in January-September 2020 than January-September 2019.
U.S. purchasers
The Commission received 28 usable questionnaire responses from firms that had purchased phosphate fertilizers during January 2017-September 2020.7 8 Nineteen responding purchasers are wholesaler/distributors, 16 are retailers, 7 are importers, *** are producers, 1 is an end user, and 1 is a purchasing agent. Most responding U.S. purchasers were located in the Midwest region (17 firms); four were located in the Southeast region, three in the Central Southwest region, and two each in the Mountains and Pacific Coast regions.9 The responding purchasers mostly represented firms involved in agriculture and farming. The largest
6 MicroEssentials SZ is phosphate fertilizers product in which each granule contains phosphorus, nitrogen, Sulphur (i.e. sulfur), and zinc. See Mosaic website, https://www.cropnutrition.com/microessentials, accessed January 14, 2021; Mosaic website, MicroEssentials SZ Most Asked Questions, https://www.cropnutrition.com/microessentials, accessed January 14, 2021; and Delta Growers Association website, MicroEssentials brochure, https://www.deltagrowers.com/cmsAdmin/uploads/microessentials-sz-mesz-brochure.pdf , accessed January 14, 2021.
In response to this, Mosaic stated that “the domestic industry’s operations are *** MAP and DAP. The domestic industry’s U.S. shipments of MAP and DAP accounted for *** of the domestic industry’s total U.S. shipments over the POI… {and that} U.S. producers like Mosaic have *** capacity and can readily switch between producing MAP or DAP and other types of phosphate fertilizers.” Mosaic’s prehearing brief, p. 55.
7 The following firms provided purchaser questionnaire responses: ***. 8 Of the 28 responding purchasers, 24 purchased domestic phosphate fertilizers, 17 purchased
imports of the subject merchandise from Morocco, 14 purchased imports of the subject merchandise from Russia, 7 purchased imports of phosphate fertilizers from nonsubject country Saudi Arabia, and 12 purchased imports of phosphate fertilizers from other nonsubject sources.
9 No responding firms were located in the Northeast or other regions (including Alaska, Hawaii, Puerto Rico, or the American Virgin Islands).
II-3
purchasers/importers in 2019 were ***, which accounted for ***, respectively, of reported purchases/imports that year.10
Channels of distribution
U.S. producers and importers of phosphate fertilizers from subject and nonsubject sources all sold mainly to retailers, as shown in table II-1. Sales to distributors were the next highest share of shipments for both producers and importers. *** reported selling a small amount to end users.
10 The largest purchasers of domestic phosphate fertilizer in 2019 were ***, which accounted for *** of reported domestic purchases that year. The largest purchasers of phosphate fertilizer imported from Morocco in 2019 were ***, which accounted for *** of reported purchases/imports of phosphate fertilizer from Morocco that year. The largest purchasers of phosphate fertilizer imported from Russia in 2019 were ***, which accounted for *** of reported purchases/imports of phosphate fertilizer from Russia that year.

II-4
Table II-1 Phosphate fertilizers: U.S. producers’ and importers’ U.S. shipments, by sources and channels of distribution, 2017-19, January to September 2019, and January to September 2020
Item
Period Calendar year January-
September 2017 2018 2019 2019 2020
Share of reported shipments (percent) U.S. producers’ U.S. shipments of phosphate fertilizers: Distributors *** *** *** *** *** Retailers *** *** *** *** *** End users *** *** *** *** *** U.S. importers’ U.S. shipments of phosphate fertilizers from Morocco: Distributors *** *** *** *** *** Retailers *** *** *** *** *** End users *** *** *** *** *** U.S. importers’ U.S. shipments of phosphate fertilizers from Russia: Distributors *** *** *** *** *** Retailers *** *** *** *** *** End users *** *** *** *** *** U.S. importers’ U.S. shipments of phosphate fertilizers from subject sources combined: Distributors *** *** *** *** *** Retailers *** *** *** *** *** End users *** *** *** *** *** U.S. importers’ U.S. shipments of phosphate fertilizers from Saudi Arabia: Distributors *** *** *** *** *** Retailers *** *** *** *** *** End users *** *** *** *** *** U.S. importers’ U.S. shipments of phosphate fertilizers from all other countries: Distributors *** *** *** *** *** Retailers *** *** *** *** *** End users *** *** *** *** *** U.S. importers’ U.S. shipments of phosphate fertilizers from nonsubject sources combined: Distributors *** *** *** *** *** Retailers *** *** *** *** *** End users *** *** *** *** ***
Source: Compiled from data submitted in response to Commission questionnaires.
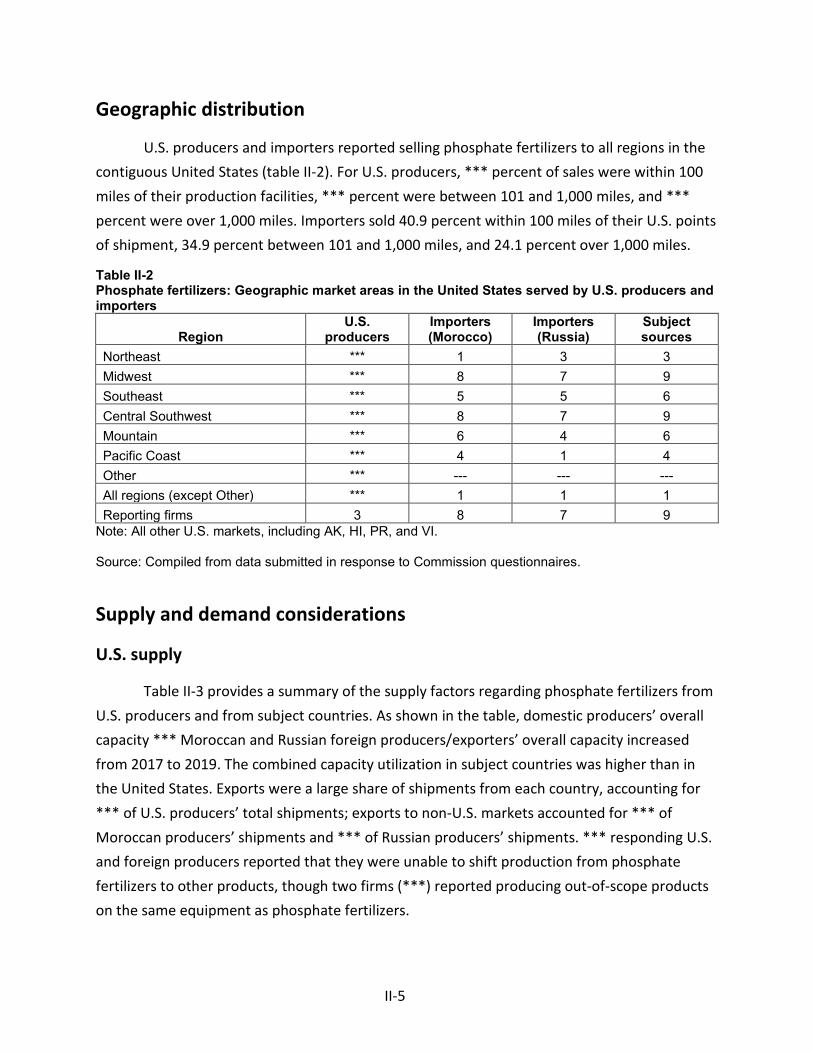
II-5
Geographic distribution
U.S. producers and importers reported selling phosphate fertilizers to all regions in the contiguous United States (table II-2). For U.S. producers, *** percent of sales were within 100 miles of their production facilities, *** percent were between 101 and 1,000 miles, and *** percent were over 1,000 miles. Importers sold 40.9 percent within 100 miles of their U.S. points of shipment, 34.9 percent between 101 and 1,000 miles, and 24.1 percent over 1,000 miles.
Table II-2 Phosphate fertilizers: Geographic market areas in the United States served by U.S. producers and importers
Region U.S.
producers Importers (Morocco)
Importers (Russia)
Subject sources
Northeast *** 1 3 3 Midwest *** 8 7 9 Southeast *** 5 5 6 Central Southwest *** 8 7 9 Mountain *** 6 4 6 Pacific Coast *** 4 1 4 Other *** --- --- --- All regions (except Other) *** 1 1 1 Reporting firms 3 8 7 9
Note: All other U.S. markets, including AK, HI, PR, and VI. Source: Compiled from data submitted in response to Commission questionnaires.
Supply and demand considerations
U.S. supply
Table II-3 provides a summary of the supply factors regarding phosphate fertilizers from U.S. producers and from subject countries. As shown in the table, domestic producers’ overall capacity *** Moroccan and Russian foreign producers/exporters’ overall capacity increased from 2017 to 2019. The combined capacity utilization in subject countries was higher than in the United States. Exports were a large share of shipments from each country, accounting for *** of U.S. producers’ total shipments; exports to non-U.S. markets accounted for *** of Moroccan producers’ shipments and *** of Russian producers’ shipments. *** responding U.S. and foreign producers reported that they were unable to shift production from phosphate fertilizers to other products, though two firms (***) reported producing out-of-scope products on the same equipment as phosphate fertilizers.

II-6
Table II-3 Phosphate fertilizers: Supply factors that affect the ability to increase shipments to the U.S. market
Country
Capacity (1,000 short tons)
Capacity utilization (percent)
Ratio of inventories to
total shipments (percent)
Shipments by market, 2019 (percent)
Able to shift to alternate
products
2017 2019 2017 2019 2017 2019
Home market
shipments
Exports to non-U.S. markets
No. of firms reporting
“yes” United States *** *** *** *** *** *** *** *** *** of 3 Morocco *** *** *** *** *** *** *** *** *** of 1 Russia *** *** *** *** *** *** *** *** *** of 2
Note: Responding U.S. producers accounted for the vast majority of U.S. production of phosphate fertilizers in 2019. Responding foreign producer/exporter firms accounted for all known U.S. imports of phosphate fertilizer from Morocco and Russia in 2019. For additional data on the number of responding firms and their share of U.S. production and of U.S. imports from each subject country, please refer to Part I, “Summary Data and Data Sources.” Source: Compiled from data submitted in response to Commission questionnaires.
Domestic production
Based on available information, U.S. producers of phosphate fertilizers have the ability to respond to changes in demand with large changes in the quantity of shipments of U.S.-produced phosphate fertilizers to the U.S. market. The main contributing factors to this degree of responsiveness of supply are the availability of some unused capacity and inventories and the ability to shift shipments from alternate markets. A factor mitigating U.S. producers’ responsiveness of supply is the limited ability to shift production to or from alternate products.
Overall, domestic producers’ capacity utilization increased *** percentage points between 2017 and 2019, driven by a greater decrease in capacity than in production. Between 2017 and 2019, domestic producers’ capacity decreased *** percent while production decreased by *** percent.11 Domestic producers’ inventories increased between 2017 and 2019 but were lower in January-September 2020 than in January-September 2019. Domestic producers’ U.S. shipments and export shipments both declined between 2017 and 2019; U.S. producers’ U.S. shipments were higher in January-September 2020 compared to January-September 2019, while their exports shipments were lower. Overall, domestic producers’ export shipments represented *** of their total shipments in 2019. U.S. producers reported that their primary export markets were Canada and Mexico (***), ***. *** reported an ability to switch production to other products on the same equipment as phosphate fertilizers, although *** reported producing “***” on the same equipment as phosphate fertilizers. As
11 ***.

II-7
discussed later in this section, Mosaic announced the idling of its Plant City, Florida facility in December 2017, and that plant’s permanent closure in June 2019.
Subject imports from Morocco
Based on available information, the Moroccan producer OCP has the ability to respond to changes in demand with large changes in the quantity of shipments of phosphate fertilizers to the U.S. market. The main contributing factors to this degree of responsiveness of supply are *** overall capacity, the availability of unused capacity and inventories, and the ability to shift shipments from alternate markets. A factor mitigating OCP’s responsiveness of supply is the inability to shift production to or from alternate products.
OCP’s capacity and production *** from 2017 to 2019, with capacity increases outpacing production increases, resulting in decreased capacity utilization. OCP reported exporting *** of its production, with non-U.S. exports comprising *** of its shipments in 2019. OCP reported that its shipments to the U.S. market increased from *** percent of its total shipments in 2017 to *** percent in 2019. OCP reported that its other major export markets were ***. It reported that *** on the same equipment used to produce phosphate fertilizers, and it reported *** on shared equipment.
Subject imports from Russia
Based on available information, producers of phosphate fertilizers from Russia have the ability to respond to changes in demand with moderate changes in the quantity of shipments of phosphate fertilizers to the U.S. market. The main contributing factors to this degree of responsiveness of supply are the ability to shift shipments from alternate markets and the existence of some inventories. Factors mitigating this responsiveness of supply include the limited availability of unused capacity and a limited ability to shift production to or from alternate products.
Russian producers’ capacity and production both increased from 2017 to 2019, with production increases outpacing capacity increases, resulting in an overall increase in capacity utilization. Russian producers reported high rates of capacity utilization during the period (*** percent in 2019). Major export markets reported by Russian producers include ***. Russian producers reported that they are unable to switch production to or from other products on the same equipment used to produce phosphate fertilizers, although *** reported production of “***” using shared equipment.

II-8
Imports from nonsubject sources
Nonsubject imports accounted for 15.9 percent of total U.S. imports in 2019, up from 8.5 percent in 2017. During January-September 2020, nonsubject imports accounted for 33.5 percent of total reported U.S. imports. Saudi Arabia accounted for *** percent of all reported U.S. imports in 2019, and *** percent of all reported U.S. imports during January-September 2020.12 Reported nonsubject sources included Israel and Mexico (reported by 2 importers each), and Australia, Egypt, Jordan, Lebanon, Lithuania, and Saudi Arabia (1 importer each).
Supply constraints
*** U.S. producers, 5 of 10 importers, and 16 of 28 purchasers reported experiencing supply constraints since January 1, 2017. Among U.S. producers, ***. Mosaic reported that following the idling of its Plant City, Florida facility in December 2017,13 ***.14
12 Only one firm, ***, reported imports from Saudi Arabia during January 2017-September 2020. 13 See Mosaic Company’s fourth quarter and full-year 2017 results. Mosaic website,
https://investors.mosaicco.com/financials/quarterly-results/default.aspx, accessed January 13, 2021. In June 2019, Mosaic announced the permanent closure of its Plant City facility. The Ledger, Mosaic
will permanently close idle Plant City facility , https://www.theledger.com/news/20190618/mosaic-will-permanently-close-idle-plant-city-facility, accessed January 13, 2021.
In the fourth quarter of 2019, Mosaic also announced the indefinite idling of its Colonsay potash mine, and that it expected to write off up to $590 million of phosphates segment goodwill. Mosaic website, https://investors.mosaicco.com/press-releases/news-details/2020/Mosaic-Announces-Indefinite-Idling-of-the-Colonsay-Mine-and-Related-Charges-in-the-Fourth-Quarter-of-2019/default.aspx, accessed January 13, 2021.
14 See also Hearing transcript, pp. 100-101 (O’Rourke, McLennan). Respondents generally argue that the shuttering of Mosaic’s Plant City facility in 2017 and closing of Nutrien’s Red Water, Alberta facility in 2019 left a “gaping hole in supply” and that imports were “pulled into” the market as a result. Hearing transcript, p. 229 (“male voice”), 241-242 (Lambert); OCP’s posthearing brief, pp. 2-8, OCP Responses to Q&A, pp. 7-26, 29-32, 74-82; PhosAgro’s posthearing brief, p. 3; Koch’s posthearing brief, p. 14; IRM’s posthearing brief, pp. 4-7, 9-11. Mosaic stated that “to the extent Mosaic’s idling of Plant City resulted in a supply ‘gap’ in 2018, the substantial increase in subject imports over the same period *** exceeded the amount of the alleged gap.” Mosaic’s prehearing brief, p. 49; Mosaic’s posthearing brief, Answers to Commissioner Questions, pp. 9-23 and 83-89.
Mosaic also testified that it did not “specifically spell out the exact cause and effect” for the closure of its Plant City facility, saying “I don't think we referred to any of the reasons why. All we referred to was due to the price pressure, and the oversupply of the overall market, that that is why we idled Plant City.” It added that it closed the Plant City facility “because we could not economically deliver to those customers under the economic conditions that were prevailing at the time” and that it was “going to idle it while this new production was coming in to lessen the impact, and allow growth in the market to catch up to where the supply was, and those statements were made on a global basis, not necessarily in a U.S. context.” Hearing transcript, pp. 66 and 108 (O’Rourke).

II-9
*** reported that “there have been times, most notably since {the CVD} petition was filed, where product availability from domestic producers has been limited due to tight supply and concerns around the ability to meet demand.” *** also reported that product from domestic suppliers is “not always available,” and *** reported that domestic suppliers are not filling warehouses ahead of the season, which indicates “plant and demand issues.” *** reported that both Mosaic and Simplot have at times “claimed that they are sold out and do not have any product to offer due to limited product availability.” Ten purchasers (***) reported experiencing delays, shortages, and or allocations from Mosaic.15 *** elaborated that Mosaic has refused to supply the firm *** and that this causes delays in its ability to supply its customers. “***.”16 On a product specific basis, *** reported that U.S. producers have little to no TSP (triple super phosphate) production capacity.
Regarding supply constraints from other sources, *** reported that in November 2020 it was allocated MAP from ***. Purchaser *** reported that Koch and IRM will not quote or import material until the CVD decision is handed down, and *** reported that Helm, Koch, and OCP (Morocco) “cut off” supplying imported product to the U.S. market in the summer of 2020. *** reported that it “frequently pass{es} on sales opportunities that are less than our desired selling price.” Purchaser *** reported that import partners of Moroccan exporter OCP had limited supply to give to the U.S. market. *** reported that “all suppliers limit us on what we can purchase.”
New suppliers
Most responding purchasers (18 of 28 firms) indicated that no new suppliers entered the U.S. market since January 1, 2017. Among the 10 purchasers that did report new suppliers in the U.S. market, they listed the following firms: Ma’aden Phosphate Company and Saudi Basic Industries Corporation (both of Saudi Arabia) (listed by 3 firms each);17 El Nasr (Egypt), EuroChem (Switzerland), Fertinal (Mexico), Incitec Pivot (Australia), and Jordan Phosphate Mining Company (Jordan) (listed 2 firms each); and Archer-Daniels-Midland (“ADM”) (United
15 Gavilon testified that after the closing of the Plant City facility, Mosaic cut its supply by 100,000 tons. Hearing transcript, p. 270 (Wessel). See also Gavilon’s posthearing brief, Exhibits 1, 1-A, and 1-B.
16 See also Hearing transcript, p. 244 (Niederer); ADM’s posthearing brief, pp. 1-7 and Exhibit 1. ADM also stated that Simplot is unable to supply the firm, and “rather, ADM supplies Simplot, which has purchased the following volumes from ADM, which increased significantly during the POI.”
17 Ma’aden Phosphate Company (MPC) was formed in 2008 as a joint venture between Ma’aden and Saudi Basic Industries Corporation (SABIC). Ma’aden website, https://www.maaden.com.sa/en/business/phosphate, accessed January 8, 2021; and Ma’aden Annual Report, 2019, https://www.maaden.com.sa/en/investor/report, accessed January 8, 2021.

II-10
States), American Plant Food (United States), CSBT (Senegal), Helm (United States), Industries Chimiques du Senegal (Senegal),18 International Raw Materials (United States),19 Itafos (Cayman Islands and the United States),20 Lebanon Chemical (Lebanon), MWSPC (Saudi Arabia),21 NCIC (Egypt), and Oakley Fertilizer (United States) (1 firm each). Two firms also cited unnamed suppliers from suppliers from Australia, Egypt, and Lebanon.
U.S. demand
Based on available information, the overall demand for phosphate fertilizers is likely to experience small to moderate changes in response to changes in price. The main contributing factors are the limited range and lack of viable substitute products and the ability of farmers to adjust the amount of phosphate fertilizer used.
Demand trends
Demand for phosphate fertilizers is driven primarily by agricultural plantings (acres planted), particularly for the crops that consume the most fertilizer: corn, soybeans, and wheat. Changes in weather, agricultural commodity prices, and cropping practices and crop rotation also affect demand.22 As shown in figure II-1, acres planted increased between 2017 and 2018, decreased between 2018 and 2019, then increased again between 2019 and 2020. Overall reported acres planted was 3.6 percent lower in 2019 compared to 2017 and was 0.6 percent
18 Industries Chimiques du Senegal (“ICS”) is a subsidiary of Singapore-based Indorama, and is the largest producer of phosphate fertilizer products in Sub-Saharan Africa. https://www.indorama.com/affiliated-companies/industries-chimiques%20du-senegal, accessed January 8, 2021.
19 Based in Philadelphia, Pennsylvania, “International Raw Materials LTD markets and distributes MAP (11-52-00) manufactured by OCP in Morocco.” International Raw Materials website, https://www.irmteam.com/fertilizer-products/monoammonium-phosphate/, accessed January 8, 2021.
20 In November 2017, Itafos announced that it had signed a definitive agreement to acquire Agrium’s Conda Phosphate Operations. Itafos website, https://www.itafos.com/news/2017/itafos-announces-acquisition-of-conda-phosphate-operations/, accessed January 8, 2021.
21 Ma’aden Wa’ad Al-Shamal Phosphate Company (MWSPC) was formed in 2013 as a joint venture between MPC, SABIC, and The Mosaic Company. Ma’aden website, https://www.maaden.com.sa/en/business/phosphate, accessed January 8, 2021; and Ma’aden Annual Report, 2019, https://www.maaden.com.sa/en/investor/report, accessed January 8, 2021.
22 Petition, p. I-23, Exhibit I-22. Mosaic testified, however, that “demand is relatively unimpacted by lower prices. Demand does not pick up significantly and it's the same thing with relatively high prices – demand does not curb dramatically when prices rise.” Hearing transcript, pp. 93-94 (Jung).
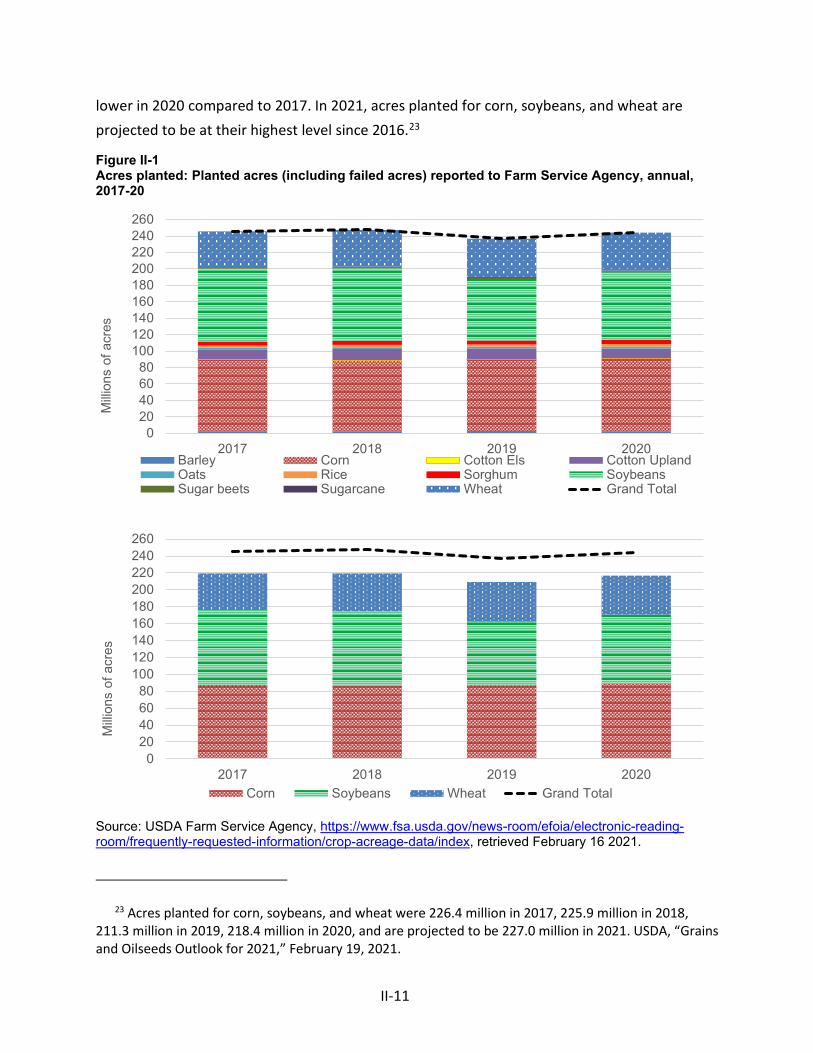
II-11
lower in 2020 compared to 2017. In 2021, acres planted for corn, soybeans, and wheat are projected to be at their highest level since 2016.23
Figure II-1 Acres planted: Planted acres (including failed acres) reported to Farm Service Agency, annual, 2017-20
Source: USDA Farm Service Agency, https://www.fsa.usda.gov/news-room/efoia/electronic-reading-room/frequently-requested-information/crop-acreage-data/index, retrieved February 16 2021.
23 Acres planted for corn, soybeans, and wheat were 226.4 million in 2017, 225.9 million in 2018, 211.3 million in 2019, 218.4 million in 2020, and are projected to be 227.0 million in 2021. USDA, “Grains and Oilseeds Outlook for 2021,” February 19, 2021.
020406080
100120140160180200220240260
2017 2018 2019 2020
Milli
ons
of a
cres
Barley Corn Cotton Els Cotton UplandOats Rice Sorghum SoybeansSugar beets Sugarcane Wheat Grand Total
020406080
100120140160180200220240260
2017 2018 2019 2020
Milli
ons
of a
cres
Corn Soybeans Wheat Grand Total
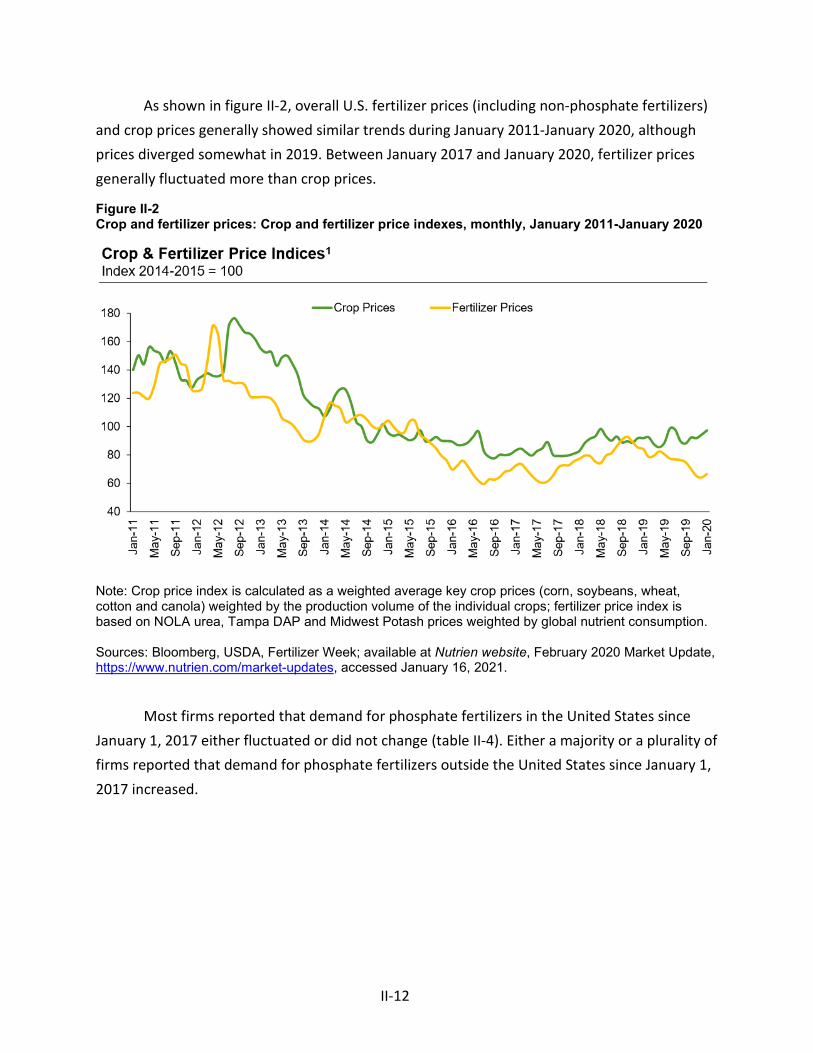
II-12
As shown in figure II-2, overall U.S. fertilizer prices (including non-phosphate fertilizers) and crop prices generally showed similar trends during January 2011-January 2020, although prices diverged somewhat in 2019. Between January 2017 and January 2020, fertilizer prices generally fluctuated more than crop prices.
Figure II-2 Crop and fertilizer prices: Crop and fertilizer price indexes, monthly, January 2011-January 2020
Note: Crop price index is calculated as a weighted average key crop prices (corn, soybeans, wheat, cotton and canola) weighted by the production volume of the individual crops; fertilizer price index is based on NOLA urea, Tampa DAP and Midwest Potash prices weighted by global nutrient consumption. Sources: Bloomberg, USDA, Fertilizer Week; available at Nutrien website, February 2020 Market Update, https://www.nutrien.com/market-updates, accessed January 16, 2021.
Most firms reported that demand for phosphate fertilizers in the United States since January 1, 2017 either fluctuated or did not change (table II-4). Either a majority or a plurality of firms reported that demand for phosphate fertilizers outside the United States since January 1, 2017 increased.

II-13
Table II-4 Phosphate fertilizers: Firms’ responses regarding U.S. demand and demand outside the United States
Item Increase No change Decrease Fluctuate Demand in the United States U.S. producers *** *** *** *** Importers 1 2 --- 7 Purchasers 6 8 --- 14 Demand outside the United States U.S. producers *** *** *** *** Importers 5 1 --- 2 Purchasers 7 3 --- 6
Source: Compiled from data submitted in response to Commission questionnaires.
In explaining these demand trends, several firms indicated that demand for phosphate fertilizers is cyclical and tied to factors such as weather, agricultural commodity prices, producer run rates, farm economics, farm acres planted and cropping practices. Several firms stated that demand for phosphate fertilizers decreased beginning in late 2018 and spanned 2019 due to unusually wet weather conditions.24 IRM stated that demand decreased during the period of investigation, driven by poor weather conditions in major agricultural areas of the United States.25 *** U.S. demand fluctuates 4-5 percent year over year. *** reported that there has been a slight decline in demand due to several factors, including bad weather in the latter part of the period of investigation; improvements in seed hybrid technology, variable rate fertilizer application, and GPS for planting and fertilizing crops precisely; and the negative impact on the U.S. agriculture sector of U.S.-China trade relations. *** reported that demand fluctuated due to severe weather in the Mississippi River system in the fall of 2018 and subsequent inventory carryover into the fall of 2019, but that weather events in 2019 did not reduce its need to purchase product that year.26 It added that “***,” and that “***.”
24 Mosaic prehearing brief, p. 20 and Mosaic’s poshearing brief, Responses to Commissioner Questions, pp. 1-9; J.R. Simplot’s prehearing brief, pp. 32-33 and Simplot’s posthearing brief, Answers to Questions of the Commission, pp. 15, 27-30; OCP’s prehearing brief, pp. 44-45 and OCP’s posthearing brief, OCP Responses to Q&A, pp. 26-29; PhosAgro’s prehearing brief, pp. 6-7 and 21-22 and PhosAgro’s posthearing brief, pp. 2-4 and 9-10; EuroChem’s prehearing brief, pp. 8-9; Gavilon’s prehearing brief, pp. 10-13, and 64-65; IRM’s prehearing brief, p. 31 and IRM’s poshearing brief, pp. 7-8. Respondents generally argue that this contributed to downward pricing pressure. Hearing transcript, pp. 226-227 (Lambert), 233-234 (Dougan), 236 (Rosenthal), 237 (Coppess), 237-239 (Rahm).
25 IRM’s prehearing brief, pp. 15-17. IRM added that demand declines due to wet weather were partially offset by plantings in drier areas and attempts to salvage wet areas. IRM’s posthearing brief, p. 7.
26 ***’s posthearing brief, pp. 7-9 and Exhibit 2.
II-14
Business cycles
*** U.S. producers, 9 of 10 importers, and 21 of 28 purchasers indicated that the market was subject to business cycles. Most of the firms that reported business cycles indicated that the market for phosphate fertilizers was seasonal, with several firms indicating that spring (or second quarter, prior to planting) and fall (fourth quarter, after harvest) are peak demand seasons, particularly for the major crops that require phosphate fertilizers, including corn, wheat, and soybeans.27 One firm (***) indicated that the spring season represents 65 percent of its business. A few firms reported that demand still exists in the off-season. *** reported that demand exists at the distribution/retail levels of the value chain in the first and third quarters, “as these participants look to resupply their storage in advance of the next application period.”28 *** reported that production and logistical constraints require manufacturers to produce phosphate fertilizer year-round, and that “***.” *** reported that it markets phosphates *** 9-10 months a year. Several firms also noted that weather plays a large role in the business cycles for phosphate fertilizers, as do agricultural commodity prices and the types of crops being planted.
*** U.S. producers, 4 of 10 importers, and 6 of 28 purchasers indicated that the market was subject to distinct conditions of competition. Several firms again pointed to seasonal demand, weather, agricultural commodity prices, supply availability, and the types of crops being planted as distinct conditions of competition. *** cited increased competition from imports as a condition of competition, and *** cited “vessels on consignment pricing programs.” *** reported that “Mosaic struggles with the phosphate rock quality to make some of the phosphate products provided from Morocco and Russia.” *** distinct conditions of competition in the phosphate fertilizers market, including a refusal by Mosaic to supply it with product, market dominance and monopolistic pricing power by Mosaic, and the unavailability and/or inferiority of certain products by domestic producers compared to subject imports. ***, reporting that phosphate fertilizers are primarily sold in the U.S. market in bulk by barge, railcar, truck, or ton, primarily to wholesalers/distributors and retailers, and that product sold in this way are “generally indistinguishable from one another, provided they have the same chemical formulation, and any differences in product characteristics or quality are relatively minor.” *** reported that in some limited circumstances, smaller quantities may be sold directly to end users (i.e. farmers), and that such sales are of typically of custom blends specific to the customer.
27 See also OCP’s posthearing brief, OCP Responses to Q&A, pp. 26-29, 38. 28 See also ***.
II-15
Substitute products
The vast majority of responding firms, including *** reported that there are no substitutes for phosphate fertilizers.29 The reported substitutes included organic fertilizer such as manure or sewage, liquid phosphates, ammonium polyphosphates, struvite (magnesium ammonium phosphate), and phosphate rock.
*** reported that organic fertilizers containing manure (or sewage) can be a substitute. *** reported that the use of these organize fertilizers is regional in nature and can be dependent upon local laws/regulations. *** reported that there is an inherently limited supply of organic manure fertilizer and that its comparatively low nutrient content is not typically cost effective to transport over long distances.
Purchaser *** reported that liquid phosphates can be used as a starter fertilizer and that the price of liquid phosphates was highly correlated to MAP and DAP pricing. *** stated that ammonium polyphosphates are a type of liquid phosphate that can be used as a starter fertilizer or as the base to produce other liquid fertilizers formulations, but that it is “a fairly niche product, ***.” *** added that “***.”
Finally, *** reported that direct application phosphate rock can sometimes be used as a substitute for chemical phosphate fertilizer, but that it is typically used in home gardening since it is not water soluble and “may not become available to the plant for a period of years.” *** added that it is “unaware of commercially meaningful volumes being utilized in the United States in production agriculture.” *** also reported that struvite can be used as a granular fertilizer, but the market for this substitute is “extremely small.”
Substitutability issues
The degree of substitution between domestic and imported phosphate fertilizers depends upon such factors as relative prices, quality (e.g., grade standards, defect rates, etc.), and conditions of sale (e.g., price discounts/rebates, lead times between order and delivery dates, reliability of supply, product services, etc.). Based on available data, staff believes that there is a high degree of substitutability between domestically produced phosphate fertilizers and phosphate fertilizers imported from subject sources.
29 ***.

II-16
Lead times
Phosphate fertilizers are primarily sold from inventory. U.S. producers reported that *** percent of their commercial shipments in 2019 came from inventory with lead times averaging *** days, and importers reported that *** percent of their commercial shipments in 2019 came from inventory with lead times averaging *** days. Importers also reported that *** percent of their commercial shipments in 2019 came from the foreign manufacturers’ inventories, with lead times averaging *** days, and *** percent were produced-to-order, with lead times averaging *** days. Importers Eurochem and IRM stated that their import decisions are made 3 to 6 months in advance of importation based on forecasted demand.30
Knowledge of country sources
Twenty-seven purchasers indicated they had marketing/pricing knowledge of domestic product, 17 of product from Morocco, 18 of product from Russia, and 12 of product from Saudi Arabia. Eleven purchasers also indicated they had marketing/pricing knowledge of phosphate fertilizers from other nonsubject countries, including Mexico (7 firms), Australia (6 firms), China (5 firms), Israel (4 firms), Jordan (3 firms), Egypt and Tunisia (2 firms each), and Brazil, Canada, India, Lebanon, and South Africa (1 firm each).31 As shown in table II-5, most purchasers and their customers either sometimes or never make purchasing decisions based on the producer or country of origin. Of the three purchasers that reported that they always make decisions based on the manufacturer, one firm indicated that it wanted to know the producer for product quality reasons, and the other stated that logistics and supply reliability are important.32 For the five firms that reported usually making purchasing decisions based on the producer, three mentioned quality as a driving factor, while two mentioned supply, and one indicated that it prefers domestic product. The five firms that reported usually making purchasing decisions based on the country or origin indicated that they did so for reasons related to quality (2 firms), a preference for domestic product, and a domestic preference for “dark” phosphates (1 firm each).33 34
30 Eurochem’s posthearing brief, p. 8, and IRM’s posthearing brief, p. 7. 31 Petitioner Mosaic reported that it “***.” 32 The third firm that reported it always makes decisions based on the manufacturer did not
elaborate. 33 The firm that reported a domestic preference for dark phosphates (***) did not indicate which of
the sources it purchases from provides dark phosphates. 34 The sole firm that reported always making decisions based on the country of origin (***) did not
elaborate.
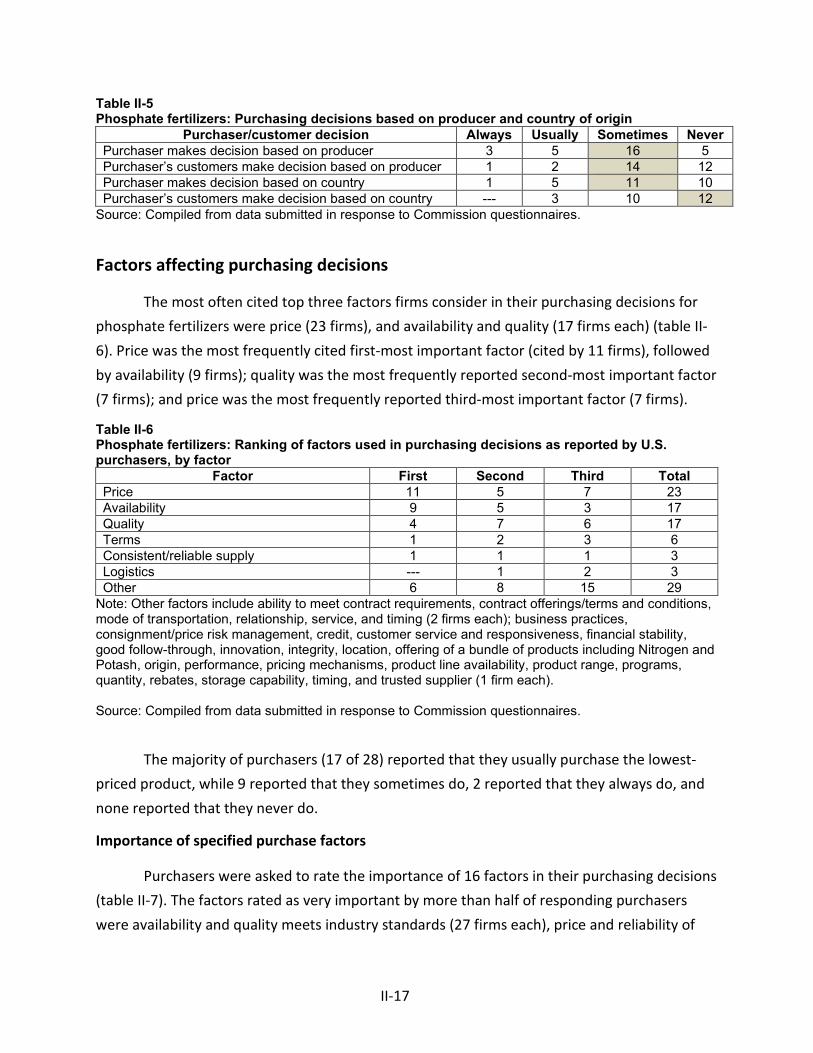
II-17
Table II-5 Phosphate fertilizers: Purchasing decisions based on producer and country of origin
Purchaser/customer decision Always Usually Sometimes Never Purchaser makes decision based on producer 3 5 16 5 Purchaser’s customers make decision based on producer 1 2 14 12 Purchaser makes decision based on country 1 5 11 10 Purchaser’s customers make decision based on country --- 3 10 12
Source: Compiled from data submitted in response to Commission questionnaires.
Factors affecting purchasing decisions
The most often cited top three factors firms consider in their purchasing decisions for phosphate fertilizers were price (23 firms), and availability and quality (17 firms each) (table II-6). Price was the most frequently cited first-most important factor (cited by 11 firms), followed by availability (9 firms); quality was the most frequently reported second-most important factor (7 firms); and price was the most frequently reported third-most important factor (7 firms).
Table II-6 Phosphate fertilizers: Ranking of factors used in purchasing decisions as reported by U.S. purchasers, by factor
Factor First Second Third Total Price 11 5 7 23 Availability 9 5 3 17 Quality 4 7 6 17 Terms 1 2 3 6 Consistent/reliable supply 1 1 1 3 Logistics --- 1 2 3 Other 6 8 15 29
Note: Other factors include ability to meet contract requirements, contract offerings/terms and conditions, mode of transportation, relationship, service, and timing (2 firms each); business practices, consignment/price risk management, credit, customer service and responsiveness, financial stability, good follow-through, innovation, integrity, location, offering of a bundle of products including Nitrogen and Potash, origin, performance, pricing mechanisms, product line availability, product range, programs, quantity, rebates, storage capability, timing, and trusted supplier (1 firm each). Source: Compiled from data submitted in response to Commission questionnaires.
The majority of purchasers (17 of 28) reported that they usually purchase the lowest-priced product, while 9 reported that they sometimes do, 2 reported that they always do, and none reported that they never do.
Importance of specified purchase factors
Purchasers were asked to rate the importance of 16 factors in their purchasing decisions (table II-7). The factors rated as very important by more than half of responding purchasers were availability and quality meets industry standards (27 firms each), price and reliability of

II-18
supply (26 firms each), delivery time and product consistency (24 firms each), U.S. transportation costs (18 firms), and delivery terms (15 firms). The factors rated as not important by a majority of responding purchasers were packaging (24 firms) and minimum quantity requirements (18 firms).
Table II-7 Phosphate fertilizers: Importance of purchase factors, as reported by U.S. purchasers, by factor
Factor Very
important Somewhat important
Not important
Availability 27 1 --- Delivery terms 15 12 1 Delivery time 24 4 --- Discounts offered 5 14 8 Minimum quantity requirements 3 7 18 Packaging --- 4 24 Payment terms 10 12 6 Price 26 2 --- Product consistency 24 4 --- Product range 5 12 9 Quality meets industry standards 27 1 --- Quality exceeds industry standards 6 11 11 Reliability of supply 26 2 --- Technical support/service 4 13 11 U.S. distribution network 12 10 6 U.S. transportation costs 18 5 5
Source: Compiled from data submitted in response to Commission questionnaires.
Supplier certification
Most responding purchasers (18 of 27 firms) do not require their suppliers to become certified or qualified to sell phosphate fertilizers to their firm. Among the nine firms that do, the reported time to qualify a new supplier ranged from 1 to 30 days, for an average of 11 days. Only one of 27 responding purchasers reported that a domestic or foreign supplier had failed in its attempt to qualify phosphate fertilizers or had lost its approved status since 2017; *** reported that it typically does not handle Moroccan or *** fertilizer because it does not meet its product specifications in available sulfur and water solubility. It added that “***.”
Changes in purchasing patterns
Purchasers were asked about changes in their purchasing patterns from different sources since 2017 (table II-8). No firm reported that they did not purchase domestic product, while pluralities of responding firms reporting that they did not purchase product from Morocco or Russia, and majorities of responding firms reporting that they did not purchase product from Saudi Arabia and other nonsubject sources. For the purchasers that reported purchasing from a given source, pluralities of these firms reported decreasing domestic

II-19
purchases, increasing purchases of Moroccan and Saudi product, and fluctuating purchases of Russian product and product from other sources.
Table II-8 Phosphate fertilizers: Changes in purchase patterns from U.S., subject, and nonsubject countries
Source of purchases Did not
purchase Decreased Increased Constant Fluctuated United States --- 10 6 1 7 Morocco 8 2 6 3 5 Russia 8 3 3 2 7 Saudi Arabia 13 1 3 --- 3 All other sources 11 --- 4 1 5 Sources unknown 5 2 5 3 7
Source: Compiled from data submitted in response to Commission questionnaires.
Reasons reported for decreasing domestic purchases included a decrease in the availability of domestic product, a decrease in price competitiveness among domestic producers, greater supply availability from “non-North American producers,” better agronomics of Croplex (EuroChem) compared to Mosaic, and Mosaic closing its Plant City, Florida production facility and cutting and/or cancelling firms’ contracts. Three firms elaborated on their reasons for increasing domestic purchases, with one stating that it just started marketing phosphate in fall 2019, another stating that it “further aligned with domestic production since 2019,” and another stating that “Mosaic had more to offer.”
Reasons reported for increasing purchases from Morocco included a need to add other suppliers, more competitive offerings via distributors, and “better selection, quality, and availability” from Moroccan suppliers. Reasons reported for increasing purchases from Russia included the closure of Mosaic’s Plant City operation and Nutrien’s Redwater production, a new Russian entrant into the U.S. market that allowed for “competitive offerings,” and “better selection, quality, and availability” from Russian suppliers. The only reason reported for decreasing purchases from Morocco and Russia was the preliminary CVD duties.
Fifteen of 27 responding purchasers reported that they had changed suppliers since January 1, 2017; 12 reported that they had not. Specifically, firms dropped or reduced purchases from Mosaic because of noncompetitive pricing or limited or inconsistent supply. One firm reported being dropped by Mosaic because it was “not supporting their specialty products line-up.” Firms added or increased purchases from domestic producers due to business growth. Firms reported dropping or reducing purchases of imports (including PhosAgro (Russia) and Moroccan and Russian suppliers generally) because of the preliminary CVD duties. One firm reported being dropped by PhosAgro because “They claimed better netback alternatives elsewhere.” Firms added importers (including subject country suppliers
II-20
PhosAgro, SABIC, and International Raw Materials35 and nonsubject country suppliers Incitec Pivot Limited (Australia), Jordan Phosphate Mining Company (Jordan), and Fertinal (Mexico)) due to the closure of the Mosaic Plant City and Nutrien Redwater production facilities, the desire to diversify supply networks, an inability to purchase Moroccan or Russian product due to the CVD investigations, and general business growth. One firm added that it is “all about cost + inbound freight. As long as the product meets the analysis guarantee ***, we will purchase.”
Importance of purchasing domestic product
All responding purchasers (28 firms) reported that all or most of their purchases had no domestic requirement, for a total of 92.6 percent of all reported purchases. Five purchasers reported that domestic product was required by their customers (for a range of 5 to 30 percent of these firms’ purchases and a total of 5.1 percent of all reported purchases). Two purchasers reported other preferences for domestic product (for 25 percent of these firms’ purchases and a total of 2.3 percent of all reported purchases); the other reasons for preferring domestic product were quality and a preference for “dark” phosphates. No firm reported that domestic product was required by law.
When asked if they or their customers ever specifically ordered phosphate fertilizers from one country in particular over other possible sources of supply, most (15 of 27) purchasers reported that they did not, while 12 reported that they did. Most of the firms that reported a preference listed import sources. Specifically, six firms cited a preference for Moroccan product (with two identifying Moroccan producer OCP), for reasons related to quality, reliability of supply, and ability to ship to the Gulf of Mexico. One firm reported a preference for TSP from Israel due to quality and reliability of supply. One firm reported a preference for Lithuanian product because “they have the only homogenous phosphate fertilizer that contains boron.” Another firm reported a preference for product from EuroChem (Switzerland) and Phosagro (Russia) due to reliability of supply and the superior quality form these sources compared to product from China, Mexico and import sources. Two firms reported a preference for domestic product for reasons related to quality and history. One firm indicated that some growers prefer MAP and 40 Rock (a combination of sulfate sulfur and zinc sulfate) from Simplot. Another firm indicated that there are “a few small pockets in North America where growers request certain color of product and quality.” Lastly, one firm reported an increase in demand for NPS/NPSZ
35 “International Raw Materials LTD markets and distributes MAP (11-52-00) manufactured by OCP in Morocco.” International Raw Materials website, Monoammonium Phosphate, https://www.irmteam.com/fertilizer-products/monoammonium-phosphate/, accessed January 12, 2021.
II-21
(nanoparticle/zinc oxide nanoparticle) homogenized fertilizers but did not indicate a source preference.
When asked if certain types of phosphate fertilizers were only available from certain country sources, most purchasers (17 of 27 firms) reported that there were. Several firms reported that TSP fertilizers were only available from import sources, with firms specifying Morocco, Egypt, Israel, Jordan, Lebanon, and Mexico as the available source countries. For subject countries, one firm reported that “new sulfur enhanced” product was only available from Morocco, while another firm reported that product type 12-45-0-5-1 was only available from Morocco and product type 12-45-0-7-1 was only available from Russia. *** also reported that “customers in the United States cannot purchase a high grade P content Micro Nutrient homogenous pellet like Morocco can make, and customers who purchase the Russian NPSZ equivalent do so for low Cadmium content material, which Mosaic does not make.” *** also reported that “Mosaic struggles with the phosphate rock quality to make some of the phosphate products provided from Morocco and Russia.” For nonsubject countries, one firm reported that GTSP (granular triple super-phosphate) is only available from Israeli producers, and another firm reported that Croplex (a homogenous phosphate fertilizer) is only available from Lithuania. For U.S. producers, one firm reported that SPA (super phosphoric acid) is only available from domestic sources.
Several firms reported that the most common forms of phosphate fertilizers were available from several sources, including domestic producers and imports. *** reported that “DAP/MAP exist nearly everywhere, but colors of the product can vary based on the phosphate rock used to produce the material,” and that “Phosago/Eurochem are the only sources for blonde colored MAP.” *** reported that DAP and MAP were available from domestic producers, both subject countries, and several nonsubject countries; TSP was available from Morocco and several nonsubject countries; and that “other NP” was available from both subject countries and several nonsubject countries.36 Similarly, *** reported that certain source
36 *** reported that DAP was available from Morocco, Russia, Australia, Bangladesh, Bulgaria, China, Egypt, India, Iran, Jordan, Lithuania, Mexico, Pakistan, Poland, Saudi Arabia, Senegal, South Korea, Tunisia, Turkey, Vietnam, and the United States. *** reported that MAP was available from Morocco, Russia, Australia, Belgium, Brazil, Bulgaria, China, Egypt, Israel, Lithuania, Mexico, the Netherlands, Poland, Saudi Arabia, South Africa, Tunisia, Ukraine, and the United States. *** reported that TSP was available from Morocco, Algeria, Bangladesh, Brazil, Bulgaria, China, Egypt, Indonesia, Israel, Jordan, Lebanon, Mexico, the Netherlands, Poland, Syria, Tunisia, and Turkey. *** reported that other NP was available from Morocco, Russia, Belarus, Belgium, Bulgaria, China, Croatia, Finland, Greece, India, Italy, Kazakhstan, Norway, Pakistan, Poland, Saudi Arabia, South Korea, Tunisia, Turkey, Uzbekistan, and Vietnam.
II-22
countries have historically supplied particular types of product, including DAP, MAP, NPS, NPKs, TSP, and NSP, but that each of these product types were available from several different sources.37
When asked if the availability of supply had changed from various sources since January 1, 2017, most purchasers reported that it had; twenty-one of 28 responding purchasers reported that the availability of U.S.-produced product had changed, 21 of 27 reported that the availability of subject imports had changed, and 14 of 25 reported that the availability of nonsubject imports had changed. Regarding the availability of U.S.-produced phosphate fertilizers, all but one firm reported that the supply of domestic product had decreased. Several firms reported that the idling or closing of plants in Plant City, Florida (Mosaic), Faustina/Saint James, Louisiana (Mosaic ammonia production facility), and Redwater (Nutrien), as well as the sale of Agrifos’ Pasadena, Texas facility and the closure of Mississippi Phosphates, had reduced the overall availability, decreased the consistency of supply, and increased prices of domestic product. Among the firms reporting a change in availability of subject imports, responses were mixed; some firms reported that subject imports were less available, with most citing the imposition of the preliminary CVD duties as the reason, while some reported that subject imports were more available. However, some of the firms reporting an increase in the availability of subject imports also indicated that these imports decreased with the imposition of the preliminary CVD duties. Among the firms reporting a change in availability of nonsubject imports, almost all reported that the availability of nonsubject product had increased as a result of the diminished availability domestic product and imposition of the preliminary CVD duties on subject imports.
Comparisons of domestic products, subject imports, and nonsubject imports
Purchasers were asked a number of questions comparing phosphate fertilizers produced in the United States, subject countries, and nonsubject countries. First, purchasers were asked for a country-by-country comparison on the same 16 factors (table II-9) for which they were asked to rate the importance.
37 *** reported that DAP was available from Morocco (OCP), Russia, Australia, China, Egypt, Jordan, Lithuania, Mexico, Saudi Arabia (MPC and MWSPC), Senegal, and Tunisia. *** reported that MAP was available from Morocco (OCP), Russia, Australia, China, Jordan, Mexico, and Saudi Arabia (MPC). *** reported that NPS was available from Morocco (OCP), Russia, Australia, Egypt, Lithuania, and Saudi Arabia (MPC and MWSPC). *** reported that NPKs was available from Morocco (OCP), Russia, China, Saudi Arabia (MPC and MWSPC), and Senegal. *** reported that TSP was available from Morocco (OCP), China, Israel, Mexico, and Tunisia. *** reported that NSP was available from Egypt and Israel.
II-23
Either a majority or a plurality of purchasers reported that U.S. and subject phosphate fertilizers were comparable on all factors but one: U.S. distribution network, which was rated as very important by less than half of responding purchasers (see table II-7). For this factor, U.S. product was rated as superior to all other comparison sources. For availability, purchaser responses were divided with a plurality reporting that U.S. and Morocco product were comparable on this factor but almost equal numbers reporting that the U.S. product was superior or inferior to that from Morocco. A slight majority of firms reported that U.S. and Russian were comparable on availability, but eight firms reported that the U.S. product was superior. When comparing phosphate fertilizers from Morocco with that from Russia, most purchasers rated them as comparable for all factors.

II-24
Table II-9 Phosphate fertilizers: Purchasers’ comparisons between U.S.-produced and imported product
Factor
U.S. vs. Morocco
U.S. vs. Russia
Morocco vs. Russia
S C I S C I S C I Availability 7 9 8 8 12 3 9 12 --- Delivery terms 4 18 2 4 17 1 1 20 --- Delivery time 4 15 5 5 15 3 2 18 1 Discounts offered 3 21 --- 4 18 1 2 19 --- Minimum quantity requirements 3 20 --- 4 17 1 1 18 1 Packaging --- 21 --- --- 20 --- --- 19 --- Payment terms 1 22 --- 1 21 --- 1 20 --- Price --- 20 4 --- 20 3 1 20 --- Product consistency 3 21 --- 2 19 2 3 18 --- Product range 3 18 4 4 19 --- 3 17 1 Quality meets industry standards --- 24 --- --- 23 --- 2 19 --- Quality exceeds industry standards 1 23 --- 1 20 2 2 19 --- Reliability of supply 6 10 8 6 14 3 5 16 --- Technical support/service 11 12 1 9 13 1 1 19 1 U.S. distribution network 14 7 3 13 8 2 1 16 3 U.S. transportation costs 2 18 4 2 16 5 --- 19 1
Factor
U.S. vs. Nonsubject
Morocco vs. Nonsubject
Russia vs. Nonsubject
S C I S C I S C I Availability 7 6 4 12 3 1 8 6 1 Delivery terms 5 10 --- 5 11 --- 4 11 --- Delivery time 7 7 2 8 7 1 7 7 1 Discounts offered 4 12 --- 2 13 --- 1 13 --- Extension of credit 3 12 --- 1 13 1 2 12 --- Minimum quantity requirements --- 15 --- 1 13 --- 1 13 --- Packaging 1 15 --- 1 15 --- 1 14 --- Price 1 13 2 4 12 --- 3 12 --- Product consistency 5 10 --- 5 10 --- 3 11 --- Product range 5 11 --- 6 9 --- 4 11 --- Quality meets industry standards 3 12 --- 4 11 --- 3 11 --- Quality exceeds industry standards 3 12 --- 4 11 --- 3 11 --- Reliability of supply 7 8 1 9 6 1 6 8 1 Technical support/service 9 6 1 3 12 1 3 11 1 U.S. distribution network 9 5 2 2 12 1 3 10 1 U.S. transportation costs 3 10 2 2 12 1 2 11 1
Note: A rating of superior means that price/U.S. transportation cost is generally lower. For example, if a firm reported “U.S. superior,” it meant that the U.S. product was generally priced lower than the imported product. Note: S=first listed country’s product is superior; C=both countries’ products are comparable; I=first list country’s product is inferior. Source: Compiled from data submitted in response to Commission questionnaires.
Comparison of U.S.-produced and imported phosphate fertilizers
In order to determine whether U.S.-produced phosphate fertilizers can generally be used in the same applications as imports from Morocco and Russia, U.S. producers, importers, and purchasers were asked whether the products can always, frequently, sometimes, or never be used interchangeably. As shown in table II-10, *** U.S. producers and most purchasers reported that U.S. and subject countries product was always interchangeable, and most
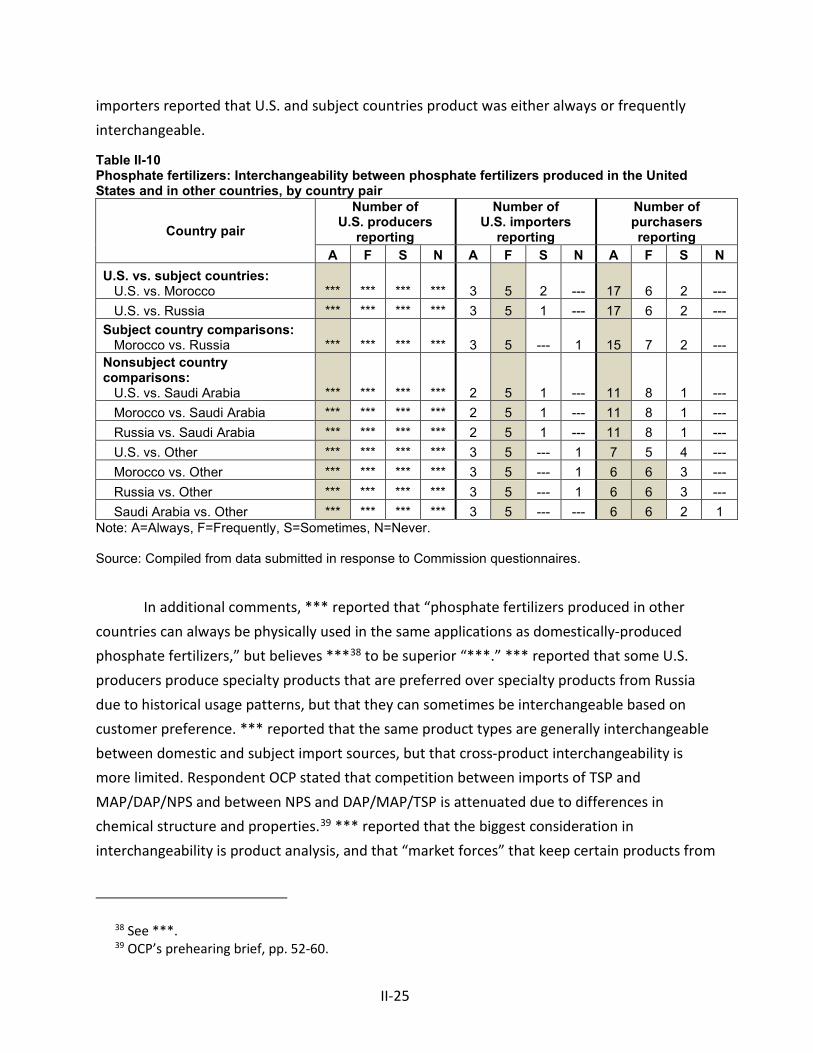
II-25
importers reported that U.S. and subject countries product was either always or frequently interchangeable.
Table II-10 Phosphate fertilizers: Interchangeability between phosphate fertilizers produced in the United States and in other countries, by country pair
Country pair
Number of U.S. producers
reporting
Number of U.S. importers
reporting
Number of purchasers reporting
A F S N A F S N A F S N U.S. vs. subject countries: U.S. vs. Morocco *** *** *** *** 3 5 2 --- 17 6 2 --- U.S. vs. Russia *** *** *** *** 3 5 1 --- 17 6 2 --- Subject country comparisons: Morocco vs. Russia *** *** *** *** 3 5 --- 1 15 7 2 --- Nonsubject country comparisons: U.S. vs. Saudi Arabia *** *** *** *** 2 5 1 --- 11 8 1 --- Morocco vs. Saudi Arabia *** *** *** *** 2 5 1 --- 11 8 1 --- Russia vs. Saudi Arabia *** *** *** *** 2 5 1 --- 11 8 1 --- U.S. vs. Other *** *** *** *** 3 5 --- 1 7 5 4 --- Morocco vs. Other *** *** *** *** 3 5 --- 1 6 6 3 --- Russia vs. Other *** *** *** *** 3 5 --- 1 6 6 3 --- Saudi Arabia vs. Other *** *** *** *** 3 5 --- --- 6 6 2 1
Note: A=Always, F=Frequently, S=Sometimes, N=Never. Source: Compiled from data submitted in response to Commission questionnaires.
In additional comments, *** reported that “phosphate fertilizers produced in other countries can always be physically used in the same applications as domestically-produced phosphate fertilizers,” but believes ***38 to be superior “***.” *** reported that some U.S. producers produce specialty products that are preferred over specialty products from Russia due to historical usage patterns, but that they can sometimes be interchangeable based on customer preference. *** reported that the same product types are generally interchangeable between domestic and subject import sources, but that cross-product interchangeability is more limited. Respondent OCP stated that competition between imports of TSP and MAP/DAP/NPS and between NPS and DAP/MAP/TSP is attenuated due to differences in chemical structure and properties.39 *** reported that the biggest consideration in interchangeability is product analysis, and that “market forces” that keep certain products from
38 See ***. 39 OCP’s prehearing brief, pp. 52-60.
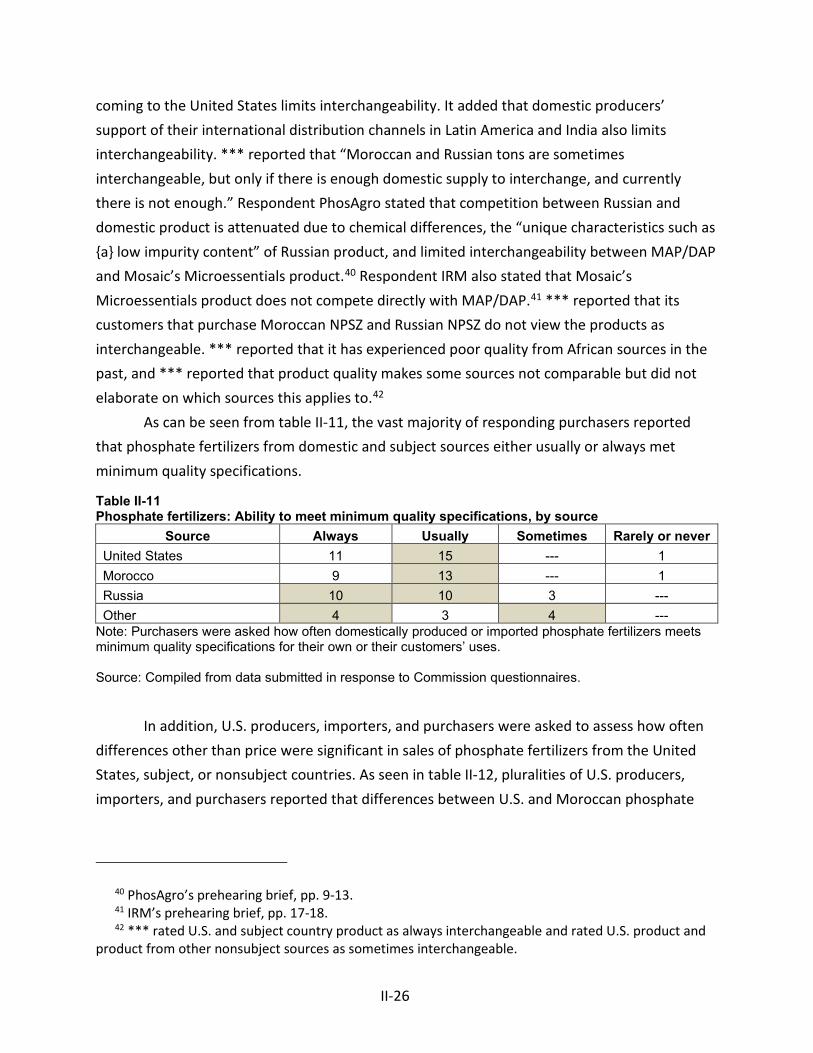
II-26
coming to the United States limits interchangeability. It added that domestic producers’ support of their international distribution channels in Latin America and India also limits interchangeability. *** reported that “Moroccan and Russian tons are sometimes interchangeable, but only if there is enough domestic supply to interchange, and currently there is not enough.” Respondent PhosAgro stated that competition between Russian and domestic product is attenuated due to chemical differences, the “unique characteristics such as {a} low impurity content” of Russian product, and limited interchangeability between MAP/DAP and Mosaic’s Microessentials product.40 Respondent IRM also stated that Mosaic’s Microessentials product does not compete directly with MAP/DAP.41 *** reported that its customers that purchase Moroccan NPSZ and Russian NPSZ do not view the products as interchangeable. *** reported that it has experienced poor quality from African sources in the past, and *** reported that product quality makes some sources not comparable but did not elaborate on which sources this applies to.42
As can be seen from table II-11, the vast majority of responding purchasers reported that phosphate fertilizers from domestic and subject sources either usually or always met minimum quality specifications.
Table II-11 Phosphate fertilizers: Ability to meet minimum quality specifications, by source
Source Always Usually Sometimes Rarely or never United States 11 15 --- 1 Morocco 9 13 --- 1 Russia 10 10 3 --- Other 4 3 4 ---
Note: Purchasers were asked how often domestically produced or imported phosphate fertilizers meets minimum quality specifications for their own or their customers’ uses. Source: Compiled from data submitted in response to Commission questionnaires.
In addition, U.S. producers, importers, and purchasers were asked to assess how often differences other than price were significant in sales of phosphate fertilizers from the United States, subject, or nonsubject countries. As seen in table II-12, pluralities of U.S. producers, importers, and purchasers reported that differences between U.S. and Moroccan phosphate
40 PhosAgro’s prehearing brief, pp. 9-13. 41 IRM’s prehearing brief, pp. 17-18. 42 *** rated U.S. and subject country product as always interchangeable and rated U.S. product and
product from other nonsubject sources as sometimes interchangeable.
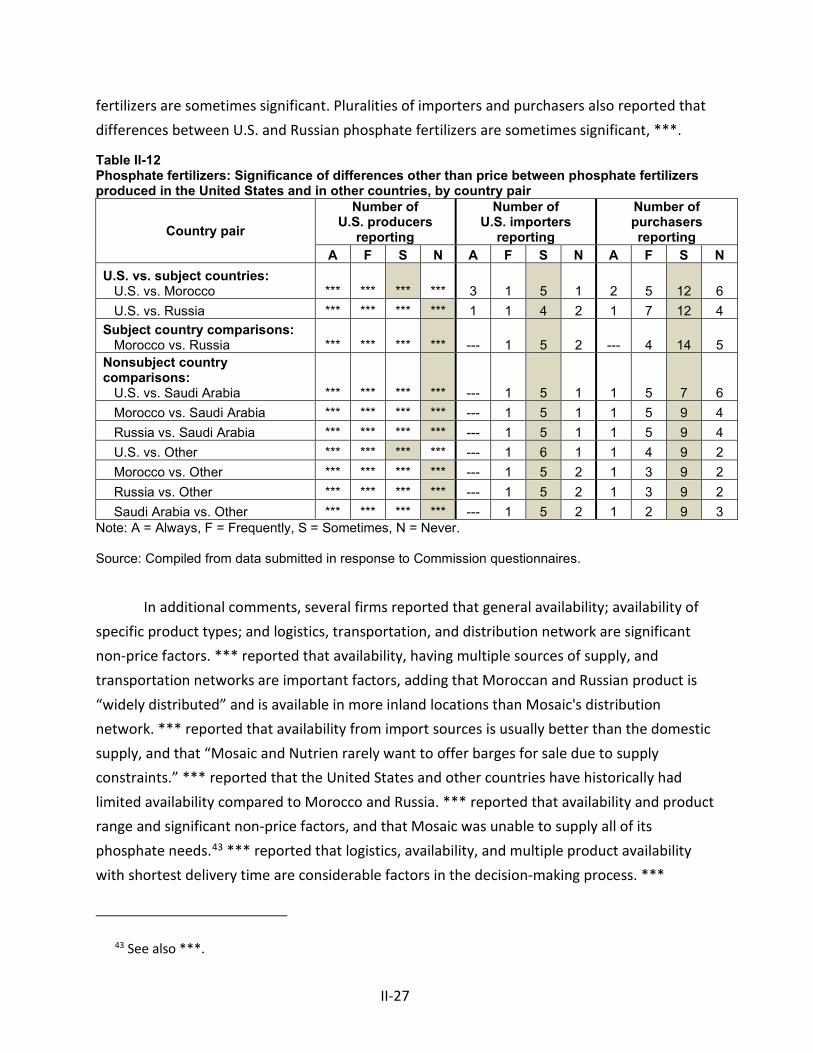
II-27
fertilizers are sometimes significant. Pluralities of importers and purchasers also reported that differences between U.S. and Russian phosphate fertilizers are sometimes significant, ***.
Table II-12 Phosphate fertilizers: Significance of differences other than price between phosphate fertilizers produced in the United States and in other countries, by country pair
Country pair
Number of U.S. producers
reporting
Number of U.S. importers
reporting
Number of purchasers reporting
A F S N A F S N A F S N U.S. vs. subject countries: U.S. vs. Morocco *** *** *** *** 3 1 5 1 2 5 12 6 U.S. vs. Russia *** *** *** *** 1 1 4 2 1 7 12 4 Subject country comparisons: Morocco vs. Russia *** *** *** *** --- 1 5 2 --- 4 14 5 Nonsubject country comparisons: U.S. vs. Saudi Arabia *** *** *** *** --- 1 5 1 1 5 7 6 Morocco vs. Saudi Arabia *** *** *** *** --- 1 5 1 1 5 9 4 Russia vs. Saudi Arabia *** *** *** *** --- 1 5 1 1 5 9 4 U.S. vs. Other *** *** *** *** --- 1 6 1 1 4 9 2 Morocco vs. Other *** *** *** *** --- 1 5 2 1 3 9 2 Russia vs. Other *** *** *** *** --- 1 5 2 1 3 9 2 Saudi Arabia vs. Other *** *** *** *** --- 1 5 2 1 2 9 3
Note: A = Always, F = Frequently, S = Sometimes, N = Never. Source: Compiled from data submitted in response to Commission questionnaires.
In additional comments, several firms reported that general availability; availability of specific product types; and logistics, transportation, and distribution network are significant non-price factors. *** reported that availability, having multiple sources of supply, and transportation networks are important factors, adding that Moroccan and Russian product is “widely distributed” and is available in more inland locations than Mosaic's distribution network. *** reported that availability from import sources is usually better than the domestic supply, and that “Mosaic and Nutrien rarely want to offer barges for sale due to supply constraints.” *** reported that the United States and other countries have historically had limited availability compared to Morocco and Russia. *** reported that availability and product range and significant non-price factors, and that Mosaic was unable to supply all of its phosphate needs.43 *** reported that logistics, availability, and multiple product availability with shortest delivery time are considerable factors in the decision-making process. ***
43 See also ***.

II-28
reported that TSP is only available from Morocco and in very limited quantities from Lebanon and Israel, and *** reported that Morocco is the only country that produces TSP. *** reported that the quality of the MAP and 40 rock that Simplot produces is needed in the drill for planting wheat.
*** reported that it believes that “factors other than price are generally not significant in customer's purchasing decisions,” but that “***.”
Elasticity estimates
U.S. supply elasticity
The domestic supply elasticity for phosphate fertilizers measures the sensitivity of the quantity supplied by U.S. producers to changes in the U.S. market price of phosphate fertilizers. The elasticity of domestic supply depends on several factors, including the level of excess capacity, the ease with which producers can alter capacity, producers’ ability to shift to production of other products, the existence of inventories, and the availability of alternate markets for U.S.-produced phosphate fertilizers. Analysis of these factors above indicates that the U.S. industry has the ability to greatly increase or decrease shipments to the U.S. market; an estimate in the range of 5 to 8 is suggested.
U.S. demand elasticity
The U.S. demand elasticity for phosphate fertilizers measures the sensitivity of the overall quantity demanded to a change in the U.S. market price of phosphate fertilizers. This estimate depends on factors discussed above such as the existence, availability, and commercial viability of substitute products, as well as the component share of the phosphate fertilizers in the production of any downstream products. Based on the available information, the aggregate demand for phosphate fertilizers is likely to be moderately inelastic; a range of -0.5 to -1.0 is suggested.
II-29
Substitution elasticity
The elasticity of substitution depends upon the extent of product differentiation between the domestic and imported products.44 Product differentiation, in turn, depends upon such factors as quality (e.g., chemistry, appearance, etc.) and conditions of sale (e.g., availability, sales terms/discounts/promotions, etc.). Based on available information, the elasticity of substitution between U.S.-produced phosphate fertilizers and imported phosphate fertilizers is likely to be in the range of 4 to 6.45
44 The substitution elasticity measures the responsiveness of the relative U.S. consumption levels of the subject imports and the domestic like products to changes in their relative prices. This reflects how easily purchasers switch from the U.S. product to the subject products (or vice versa) when prices change.
45 Mosaic provided an economic analysis in its prehearing brief that utilized the midpoint of this estimate, though indicated that it believes the elasticity of substitution “to be at the upper end of that range... given the commodity nature of the product and the transparency of prices in the market.” Mosaic’s prehearing brief, Exhibit 2, pp. 4, 11.
OCP argues that this elasticity is “based on theoretical considerations of the likely interchangeability of domestic and subject import merchandise, not on empirical analysis of actual data from the marketplace, which is especially problematic in a case where in reality the availability of domestic production is limited. The ITC’s Office of Economics’ most recent estimate of the elasticity of substitution for NAICS code 3253 (Pesticides and fertilizers), under which phosphate fertilizer production is classified, was 2.09, which is one-half to one-third the elasticity estimated in the Prehearing Report. While there may be variations in the elasticity of substitution among the industries covered by the 4-digit NAICS code listed above, this figure nonetheless provides a helpful context for Staff’s estimate, and is an important consideration when deciding how much analytical weight to place on Petitioner’s calculations using an elasticity of 5. It also has a significant impact on the outcome and reasonableness of Petitioner’s analysis, which is sensitive to the assumed substitution elasticity.” OCP’s posthearing brief, OCP Responses to Q&A, p. 56, Exhibit 11.

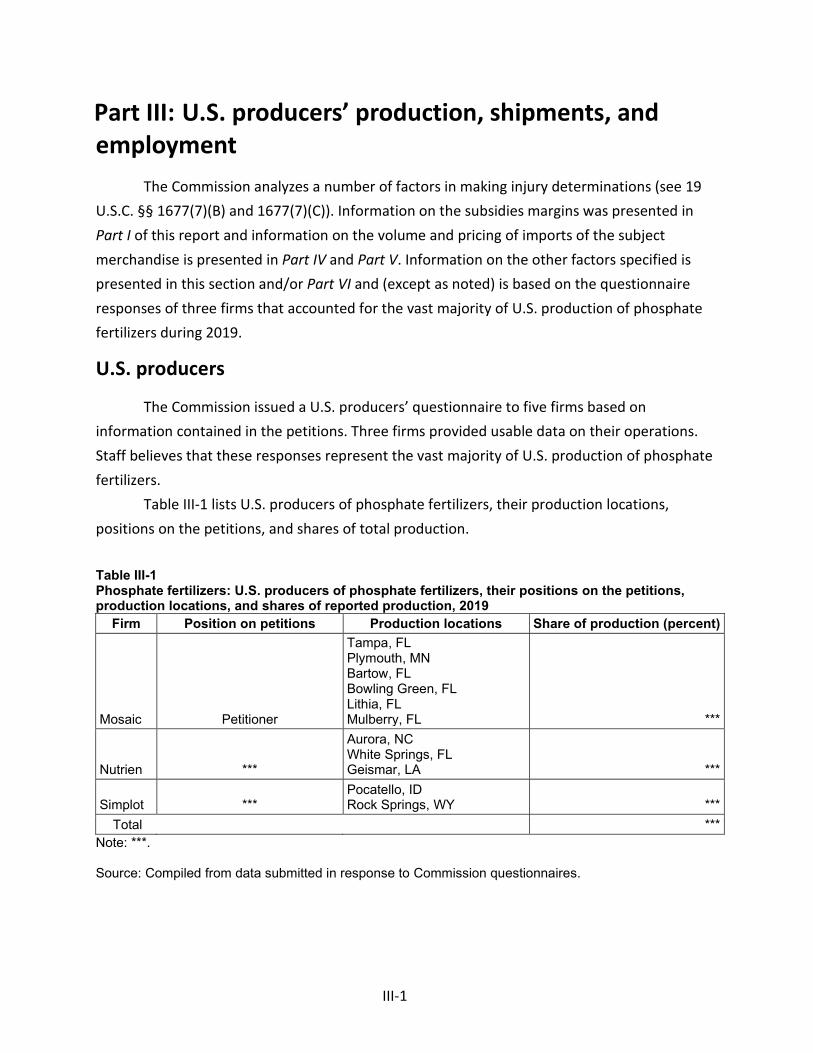
III-1
Part III: U.S. producers’ production, shipments, and employment
The Commission analyzes a number of factors in making injury determinations (see 19 U.S.C. §§ 1677(7)(B) and 1677(7)(C)). Information on the subsidies margins was presented in Part I of this report and information on the volume and pricing of imports of the subject merchandise is presented in Part IV and Part V. Information on the other factors specified is presented in this section and/or Part VI and (except as noted) is based on the questionnaire responses of three firms that accounted for the vast majority of U.S. production of phosphate fertilizers during 2019.
U.S. producers
The Commission issued a U.S. producers’ questionnaire to five firms based on information contained in the petitions. Three firms provided usable data on their operations. Staff believes that these responses represent the vast majority of U.S. production of phosphate fertilizers.
Table III-1 lists U.S. producers of phosphate fertilizers, their production locations, positions on the petitions, and shares of total production.
Table III-1 Phosphate fertilizers: U.S. producers of phosphate fertilizers, their positions on the petitions, production locations, and shares of reported production, 2019
Firm Position on petitions Production locations Share of production (percent)
Mosaic Petitioner
Tampa, FL Plymouth, MN Bartow, FL Bowling Green, FL Lithia, FL Mulberry, FL ***
Nutrien ***
Aurora, NC White Springs, FL Geismar, LA ***
Simplot *** Pocatello, ID Rock Springs, WY ***
Total *** Note: ***. Source: Compiled from data submitted in response to Commission questionnaires.

III-2
Table III-2 presents information on U.S. producers’ ownership, related and/or affiliated firms. No responding U.S. producer is related to a producer/exporter of phosphate fertilizers in Morocco or Russia or to a U.S importer. Nutrien is related to Agrium, Inc., (“Agrium”) a producer in Canada.1 Nutrien was formed from a merger between Agrium and Potash Corp. on January 1, 2018.2 At the time of the merger, Agrium was North America’s largest farm retailer and Potash Corp. was the world’s largest crop nutrient producer by capacity.3 Mosaic is related to several foreign producers of the subject merchandise in Saudi Arabia and Brazil.4 Mosaic holds a 25 percent stake in the Ma’aden Wa’ad Al Shamal Fertilizer Production Complex located in the Northern Province of Saudi Arabia.5 No responding U.S. producer reported imports of the subject merchandise during the period for which data were collected. However, *** reported purchases of phosphate fertilizers from U.S. importers.
Table III-2 Phosphate fertilizers: U.S. producers’ ownership, related and/or affiliated firms, 2019 Item / Firm Firm Name Affiliated/Ownership Ownership: *** *** *** Related producers: *** *** *** *** *** *** *** *** ***
Source: Compiled from data submitted in response to Commission questionnaires.
1 About Us, https://www.nutrienagsolutions.com/about-us, retrieved July 28, 2020. 2 Agrium and PotashCorp Merger Completed Forming Nutrien, a Leader in Global Agriculture,
https://www.nutrien.com/investors/news-releases/2018-agrium-and-potashcorp-merger-completed-forming-nutrien-leader-global, retrieved July 23, 2020 and Agrium and PotashCorp Merger Completed Forming Nutrien, a Leader in Global Agriculture, https://www.nutrien.com/investors/news-releases/2018-agrium-and-potashcorp-merger-completed-forming-nutrien-leader-global, retrieved July 23, 2020.
3 Potash Corp, Agrium to merge to create $36 billion company, https://www.cnbc.com/2016/09/12/agrium-and-potash-corp-to-merge.html, retrieved July 23, 2020.
4 Who We Are, http://www.mosaicco.com/Who_We_Are/overview.htm, retrieved July 28, 2020. “Partnerships”, https://www.maaden.com.sa/en/about/saf, retrieved July 28, 2020.
5 Ibid.

III-3
Table III-3 presents U.S. producers’ reported changes in operations since January 1, 2017. At the end of 2018, Nutrien closed its phosphate facility in Geismar, Louisiana and increased production of MAP and other products at its phosphate facilities in Aurora, North Carolina and White Springs, Florida.6 In May 2019, Nutrien converted its phosphate operation in Redwater, Alberta, Canada to an ammonium sulfate plant, which was expected to double the site’s annual ammonium sulfate production capacity to 700,000 tons by the third quarter of 2019.7 According to Nutrien’s CEO of Nitrogen and Phosphate, Raef Sully, “This increase in production {in North Carolina and Florida} is expected to offset the reduction in supply from our Redwater facility, and ensure a continued supply of phosphate products to our Western Canadian market. These actions are also expected to reduce our per-tonne phosphate costs.”8 The closure of the Geismar facility eliminated Nutrien’s need to offshore phosphate rock imports starting in 2019.9
In June 2019, Mosaic permanently shut down its fertilizer plant in Plant City, Florida, which had been idled since late 2017.10 According to Mosaic, the plant was idled because it was the highest cost manufacturing plant in Florida and due to global phosphate market conditions.11 Additionally, Mosaic’s CEO, Joe O’Rourke stated, “Our decision to close the Plant City phosphate facility reaffirms our commitment to low-cost operation. We will continue to meet global demand for high-quality phosphate fertilizers with production from our low-cost facilities in Florida, Louisiana, Brazil and Peru, and through our joint venture in Saudi Arabia.”12 The Plant City facility produced 1.3 million tons of finished phosphates in 2017, its last year of operation.13
6 Revamping Nutrien’s Phosphate Operations, Now Self-Sufficient in Phosphate Rock, https://www.nutrien.com/what-we-do/stories/revamping-nutriens-phosphate-operations, accessed December 22, 2020.
7 Ibid. 8 Ibid. 9 Nutrien's 2nd Quarter and 1st Half Results Demonstrate Strength in a Compressed Season,
https://www.nutrien.com/investors/news-releases/2018-nutriens-2nd-quarter-and-1st-half-results-demonstrate-strength, retrieved December 22, 2020.
10 Hearing transcript, p. 14 (McClain). 11 The Mosaic Company Announces Closure of Plant City Phosphates Manufacturing Facility,
https://investors.mosaicco.com/press-releases/news-details/2019/The-Mosaic-Company-Announces-Closure-of-Plant-City-Phosphates-Manufacturing-Facility/default.aspx, retrieved July 23, 2020.
12 Mosaic testified that due to EPA regulations, it cannot indefinitely idle a plant, which in part forced Mosaic to close the facility in 2019. Ibid and hearing transcript, p. 123 (O’Rourke).
13 Ibid.

III-4
Table III-3 Phosphate fertilizers: U.S. producers’ reported changes in operations, since January 1, 2017
Item / Firm Reported changed in operations Plant closings: *** *** *** *** Expansions: *** *** Prolonged shutdowns or curtailments: *** *** Weather / force majeure: *** *** Other: *** ***
Source: Compiled from data submitted in response to Commission questionnaires.
III-5
In October 2019, Mosaic temporarily idled its phosphate operations in Saint James (Faustina) and Uncle Sam, Louisiana, which cut production by 500,000 tons.14 Mosaic made this decision to “accelerate the reduction of high phosphate fertilizer inventories and in anticipation of a more balanced global supply and demand in 2020.”15 Mosaic restarted its operations in Saint James and Uncle Sam in December 2019.16 Additionally, Mosaic idled its operations in Barstow, Florida in December 2019, which ***.17
U.S. production, capacity, and capacity utilization
Table III-4 and figure III-1 present U.S. producers’ production, capacity, and capacity utilization. The collective annual production capacity of the responding U.S. producers decreased in each year during 2017-19, ending *** percent lower in 2019 than in 2017. *** reported more production capacity in 2019 than in 2017 while *** reported less.18 *** production capacity remained unchanged during 2017-19. Responding U.S. producers’ production capacity was *** percent higher in January-September (“interim”) 2020 than in interim 2019. *** had higher production capacity in interim 2020 than in interim 2019, while *** had the same production capacity in both interim periods.19
14 The Mosaic Company Discloses Strategic Decisions Prior to Planned Investor Meetings, https://investors.mosaicco.com/press-releases/news-details/2019/The-Mosaic-Company-Discloses-Strategic-Decisions-Prior-to-Planned-Investor-Meetings/default.aspx, retrieved July 28, 2020. The Uncle Sam, Louisiana facility produced phosphoric and sulfuric acid.
15 Ibid. 16 Mosaic Fertilizer restarting production at St. James Parish plants after two-month idling,
https://www.theadvocate.com/baton_rouge/news/business/article_1f7e5ad0-1b49-11ea-8edf-f3e0db08cb72.html, retrieved February 11, 2021.
17 Hearing transcript, p. 22 (O’Rourke). 18 *** production capacity decreased by *** percent from 2017 to 2019 and was due in part to ***.
*** production capacity increased by *** percent from 2017 to 2018 and was due to ***. *** production capacity *** from 2018 to 2019.
19 The difference in *** production capacity between the interim periods can be attributed to ***.
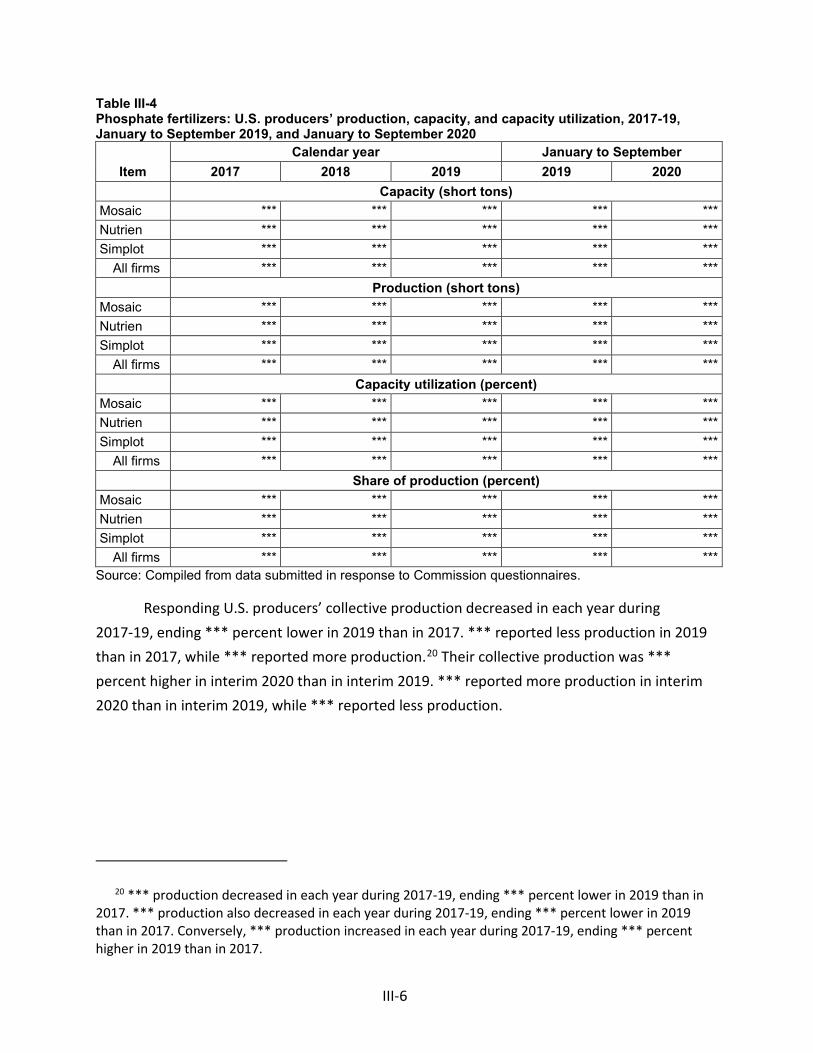
III-6
Table III-4 Phosphate fertilizers: U.S. producers’ production, capacity, and capacity utilization, 2017-19, January to September 2019, and January to September 2020
Item Calendar year January to September
2017 2018 2019 2019 2020 Capacity (short tons) Mosaic *** *** *** *** *** Nutrien *** *** *** *** *** Simplot *** *** *** *** ***
All firms *** *** *** *** *** Production (short tons) Mosaic *** *** *** *** *** Nutrien *** *** *** *** *** Simplot *** *** *** *** ***
All firms *** *** *** *** *** Capacity utilization (percent) Mosaic *** *** *** *** *** Nutrien *** *** *** *** *** Simplot *** *** *** *** ***
All firms *** *** *** *** *** Share of production (percent) Mosaic *** *** *** *** *** Nutrien *** *** *** *** *** Simplot *** *** *** *** ***
All firms *** *** *** *** *** Source: Compiled from data submitted in response to Commission questionnaires.
Responding U.S. producers’ collective production decreased in each year during 2017-19, ending *** percent lower in 2019 than in 2017. *** reported less production in 2019 than in 2017, while *** reported more production.20 Their collective production was *** percent higher in interim 2020 than in interim 2019. *** reported more production in interim 2020 than in interim 2019, while *** reported less production.
20 *** production decreased in each year during 2017-19, ending *** percent lower in 2019 than in 2017. *** production also decreased in each year during 2017-19, ending *** percent lower in 2019 than in 2017. Conversely, *** production increased in each year during 2017-19, ending *** percent higher in 2019 than in 2017.

III-7
Responding U.S. producers’ capacity utilization increased from *** percent in 2017 to *** percent in 2019. *** reported higher capacity utilization in 2019 than in 2017, while *** reported lower capacity utilization. However, since *** accounts for *** of responding U.S. producers production capacity and production, the trend in capacity utilization largely reflects *** operations. Capacity utilization was *** percentage points lower in interim 2020 than in interim 2019. *** reported higher capacity utilization in interim 2020 than in interim 2019, while *** reported lower capacity utilization. Constraints on production reported by responding firms include ***. Figure III-1 Phosphate fertilizers: U.S. producers’ production, capacity, and capacity utilization, 2017-19, January to September 2019, and January to September 2020
* * * * * * *
Source: Compiled from data submitted in response to Commission questionnaires.

III-8
Alternative products
As shown in table III‐5, phosphate fertilizers accounted for the vast majority of total production on shared equipment in each year during 2017-19 and in both interim periods. *** was the only responding U.S. producer to report production of out-of-scope merchandise on the same machinery used to produce phosphate fertilizers during 2017-19 and interim 2020. ***. *** as a constraint on its ability to switch production. Table III-5 Phosphate fertilizer: U.S. producers’ overall plant capacity and production on the same equipment as subject production, 2017-19, January to September 2019, and January to September 2020.
Item Calendar year January to September
2017 2018 2019 2019 2020 Quantity (short tons) Overall capacity *** *** *** *** *** Production: Phosphate fertilizers *** *** *** *** ***
Out-of-scope production *** *** *** *** *** Total production on same
machinery *** *** *** *** *** Ratios and shares (percent) Overall capacity utilization *** *** *** *** *** Share of production: Phosphate fertilizers *** *** *** *** ***
Out-of-scope production *** *** *** *** *** Total production on same
machinery *** *** *** *** *** Source: Compiled from data submitted in response to Commission questionnaires.
III-9
U.S. producers’ U.S. shipments and exports
Table III-6 presents U.S. producers’ U.S. shipments, export shipments, and total shipments. U.S. shipments accounted for a minority share of total shipments in each year during 2017-19 and in both interim periods.21 The collective quantity of responding U.S. producers’ U.S. shipments decreased in each year during 2017-19, ending *** percent lower in 2019 than in 2017.22 The collective quantity of responding U.S. producers’ U.S. shipments was *** percent higher in interim 2020 than in interim 2019. *** reported more U.S. shipments in interim 2020 than in interim 2019. The collective value of U.S. producers’ U.S. shipments fluctuated year to year, increasing by *** percent from 2017 to 2018, but then decreasing by *** percent from 2018 to 2019, ending *** percent lower in 2019 than in 2017. It was *** percent higher in interim 2020 than in interim 2019.
The average unit value of responding U.S. producers’ U.S. shipments increased from $*** per short ton in 2017 to $*** per short ton in 2018, but then decreased to $*** per short ton in 2019.23 It was $*** per short ton in interim 2020, compared with $*** per short ton in interim 2019.24 The average unit value of U.S. shipments is largely a reflection of
21 All responding U.S. producers reported commercial U.S. shipments during 2017-19 and in both interim periods, while *** reported internal consumption in 2018, 2019, and in both interim periods. None of the responding U.S. producers reported transfers to related firms during the period for which data were collected.
22 *** U.S. shipments each decreased every year during 2017-19, ending *** percent and *** percent lower, respectively, in 2019 than in 2017. *** U.S. shipments fluctuated year to year, increasing by *** percent from 2017 to 2018, but then decreasing by *** from 2018 to 2019, ending *** percent higher in 2019 than in 2017. Appendix E presents U.S. producers’ U.S. shipments by product type during 2017-19, interim 2019, and interim 2020.
23 The unit value of Mosaic’s, Nutrien’s, and Simplot’s U.S. shipments ***. However, the unit values of *** U.S. shipments were lower in 2019 than in 2017, while the unit value of *** U.S. shipments was higher. As shown in appendix E, the average unit value of U.S. shipments of MAP, DAP, and NPS each exhibited the same trend as the average unit value of total U.S. shipments, increasing from 2017 to 2018, but then decreasing in 2019, ending lower in 2019 than in 2017.
24 According Mosaic, the difference in the average unit value between the two interim periods is due to the timing of the price decreases during calendar year 2019. Mosaic maintains that prices were higher in the beginning of 2019 than at the end of the year, while prices in interim 2020 continued to be depressed compared with calendar year 2019. Mosaic notes that although prices increased after the filing of the petitions in June 2020, those increases did not offset the lower prices in the first half of 2020 in the aggregate data for interim 2020. Petitioner’s posthearing brief, pp. 60-61.

III-10
*** U.S. shipments since it accounted for the *** of responding U.S. producers’ U.S. shipments during 2017-19 and interim 2020.25 Table III-6 Phosphate fertilizers: U.S. producers’ U.S. shipments, exports shipments, and total shipments, 2017-19, January to September 2019, and January to September 2020
Item Calendar year January to September
2017 2018 2019 2019 2020 Quantity (short tons) U.S. shipments *** *** *** *** *** Export shipments *** *** *** *** ***
Total shipments *** *** *** *** *** Value (1,000 dollars) U.S. shipments *** *** *** *** *** Export shipments *** *** *** *** ***
Total shipments *** *** *** *** *** Unit value (dollars per short ton) U.S. shipments *** *** *** *** *** Export shipments *** *** *** *** ***
Total shipments *** *** *** *** *** Share of quantity (percent) U.S. shipments *** *** *** *** *** Export shipments *** *** *** *** ***
Total shipments *** *** *** *** *** Share of value (percent) U.S. shipments *** *** *** *** *** Export shipments *** *** *** *** ***
Total shipments *** *** *** *** *** Source: Compiled from data submitted in response to Commission questionnaires.
25 The unit value of *** U.S. shipments was higher than *** in each year during 2017-19 and in both interim periods, while the unit value of *** U.S. shipments was lower than ***. Email from ***, January 22, 2021.
III-11
By quantity, export shipments accounted for a majority of responding U.S. producers’ total shipments in each year during 2017-19 and in both interim periods. All three responding U.S. producers reported export shipments during 2017-19 and in both interim periods.26 The collective quantity of responding U.S. producers’ export shipments fluctuated year to year, decreasing by *** percent from 2017 to 2018, but then increasing by *** percent from 2018 to 2019, ending *** percent lower in 2019 than in 2017. It was *** percent lower in interim 2020 than in interim 2019. The collective value of responding U.S. producers’ export shipments decreased irregularly by *** percent during 2017-19 and was *** percent lower in interim 2020 than in interim 2019. While the average unit value of responding U.S. producers’ export shipments followed a similar pattern to those of the U.S. producers’ U.S. shipments, it was lower than the average unit value of their U.S. shipments in each year during 2017-19 and in both interim periods.27
26 Export shipments accounted for a majority of *** total shipments in each year during 2017-19 and in both interim periods (*** percent in 2017, *** percent in 2018, *** percent in 2019, *** percent in interim 2019, and *** percent in interim 2020). Conversely, export shipments accounted for a minority share of *** total shipments during 2017-19 and in both interim periods, accounting for no more than *** percent in any period. *** principal export markets were ***. *** principal export markets were ***. At least *** percent of *** exports and *** percent of *** exports went to Canada during 2017-19 and in interim 2020. *** was the largest export market for ***, accounting for approximately *** percent of its exports during 2017-19. Email from ***, January 5, 2021; email from ***, January 5, 2021; and email from ***, January 6, 2021.
27 Since *** accounts for *** of responding U.S. producers’ export shipments, the average unit value of exports shipments largely reflects the unit value of *** exports. ***. Email from ***, January 22, 2021. Additionally, Mosaic testified that the MicroEssential products that it primarily exports to Brazil sells at a lower price than MAP and DAP while the MicroEssentials SV product it primarily sells to the U.S. market sells at a higher price than MAP and DAP. Hearing transcript, p. 120 (Jung).

III-12
U.S. producers’ inventories
Table III-7 presents U.S. producers’ end-of-period inventories and the ratio of inventories to their production, U.S. shipments, and total shipments.28 Responding U.S. producers’ end-of-period inventories increased by *** percent from 2017 to 2019 and were *** percent lower in interim 2020 than in interim 2019.29 The ratio of the responding U.S. producers’ end-of-period inventories to their production ranged from *** percent in 2017 to *** percent in 2019 and was *** percent in interim 2020, compared with *** percent in interim 2019. The ratio of responding U.S. producers’ end-of-period inventories to their U.S. shipments ranged from *** percent in 2017 to *** percent in 2019 and was *** percent in interim 2020, compared with *** percent in interim 2019. Table III-7 Phosphate fertilizers: U.S. producers’ end-of-period inventories, 2017-19, January to September 2019, and January to September 2020
Item Calendar year January to September
2017 2018 2019 2019 2020 Quantity (short tons) U.S. producers' end-of-period inventories *** *** *** *** *** Ratio (percent) Ratio of inventories to.-- U.S. production *** *** *** *** ***
U.S. shipments *** *** *** *** *** Total shipments *** *** *** *** ***
Source: Compiled from data submitted in response to Commission questionnaires.
28 U.S. producers’ end-of-period inventories by quarter are presented in appendix D. In its response to the Commission’s U.S. producers’ questionnaire, ***.
In their responses to the Commission’s U.S. producers’ questionnaire, ***. 29 Mosaic maintained that after the Moroccan and Russian producers withdrew from the market,
Mosaic met U.S. demand by drawing down inventories. Hearing transcript, p. 41 (McLellan).
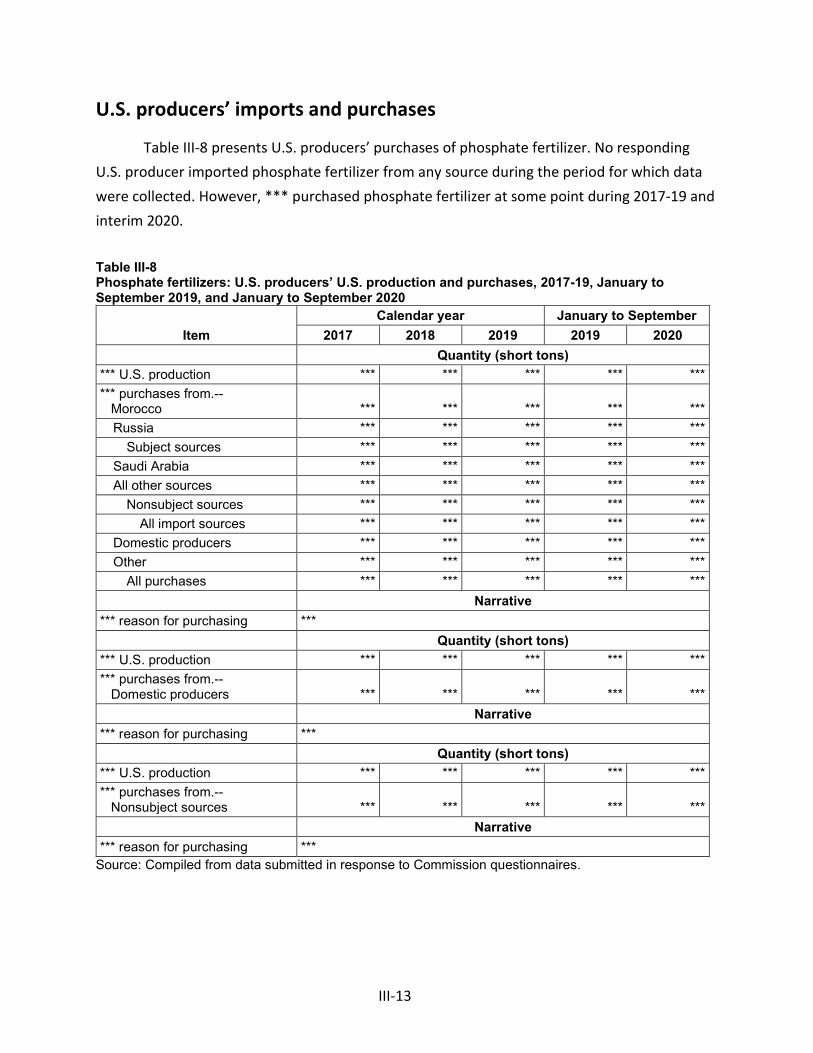
III-13
U.S. producers’ imports and purchases
Table III-8 presents U.S. producers’ purchases of phosphate fertilizer. No responding U.S. producer imported phosphate fertilizer from any source during the period for which data were collected. However, *** purchased phosphate fertilizer at some point during 2017-19 and interim 2020.
Table III-8 Phosphate fertilizers: U.S. producers’ U.S. production and purchases, 2017-19, January to September 2019, and January to September 2020
Item Calendar year January to September
2017 2018 2019 2019 2020 Quantity (short tons) *** U.S. production *** *** *** *** *** *** purchases from.-- Morocco *** *** *** *** ***
Russia *** *** *** *** *** Subject sources *** *** *** *** ***
Saudi Arabia *** *** *** *** *** All other sources *** *** *** *** ***
Nonsubject sources *** *** *** *** *** All import sources *** *** *** *** ***
Domestic producers *** *** *** *** *** Other *** *** *** *** ***
All purchases *** *** *** *** *** Narrative
*** reason for purchasing *** Quantity (short tons) *** U.S. production *** *** *** *** *** *** purchases from.-- Domestic producers *** *** *** *** ***
Narrative *** reason for purchasing *** Quantity (short tons) *** U.S. production *** *** *** *** *** *** purchases from.-- Nonsubject sources *** *** *** *** ***
Narrative *** reason for purchasing ***
Source: Compiled from data submitted in response to Commission questionnaires.

III-14
*** purchased phosphate fertilizer from subject and nonsubject sources in 2017 and 2019, and from nonsubject sources in both interim periods.30 *** purchased phosphate fertilizer from nonsubject sources in 2018, 2019, and in both interim periods, while *** purchased phosphate fertilizer from domestic producers in 2018, 2019, and in both interim periods.31
U.S. employment, wages, and productivity
Table III-9 presents U.S. producers’ employment-related data. The number of production related works (“PRWs”) decreased by *** percent from 2017 to 2019 and was *** percent lower in interim 2020 than in interim 2019. *** reported fewer PRWs in 2019 than in 2017, while *** reported more PRWs. Productivity decreased by *** percent during 2017-19. However, it was *** percent higher in interim 2020 than in interim 2019. Unit labor costs increased by *** percent during 2017-19. However, it was *** percent lower in interim 2020 than in interim 2019. Total hours worked and wages paid were lower in 2019 than in 2017 and lower in interim 2020 than in interim 2019. Hourly wages were higher in 2019 than in 2017, but were lower in interim 2020 than in interim 2019.
Table III-9 Phosphate fertilizers: U.S. producers’ employment-related data, 2017-19, January to September 2019, and January to September 2020
Item Calendar year January to September
2017 2018 2019 2019 2020 Production and related workers (PRWs) (number) *** *** *** *** *** Total hours worked (1,000 hours) *** *** *** *** *** Hours worked per PRW (hours) *** *** *** *** *** Wages paid ($1,000) *** *** *** *** *** Hourly wages (dollars per hour) *** *** *** *** *** Productivity (short tons per 1,000 hours) *** *** *** *** *** Unit labor costs (dollars per short ton) *** *** *** *** ***
Source: Compiled from data submitted in response to Commission questionnaires.
30 Purchases of subject and nonsubject imports were *** of *** production in each year during 2017-19 and in interim 2020. *** purchased phosphate fertilizer from ***.
31 *** purchased phosphate fertilizer from U.S. producer, ***, and *** purchased phosphate fertilizer from ***.
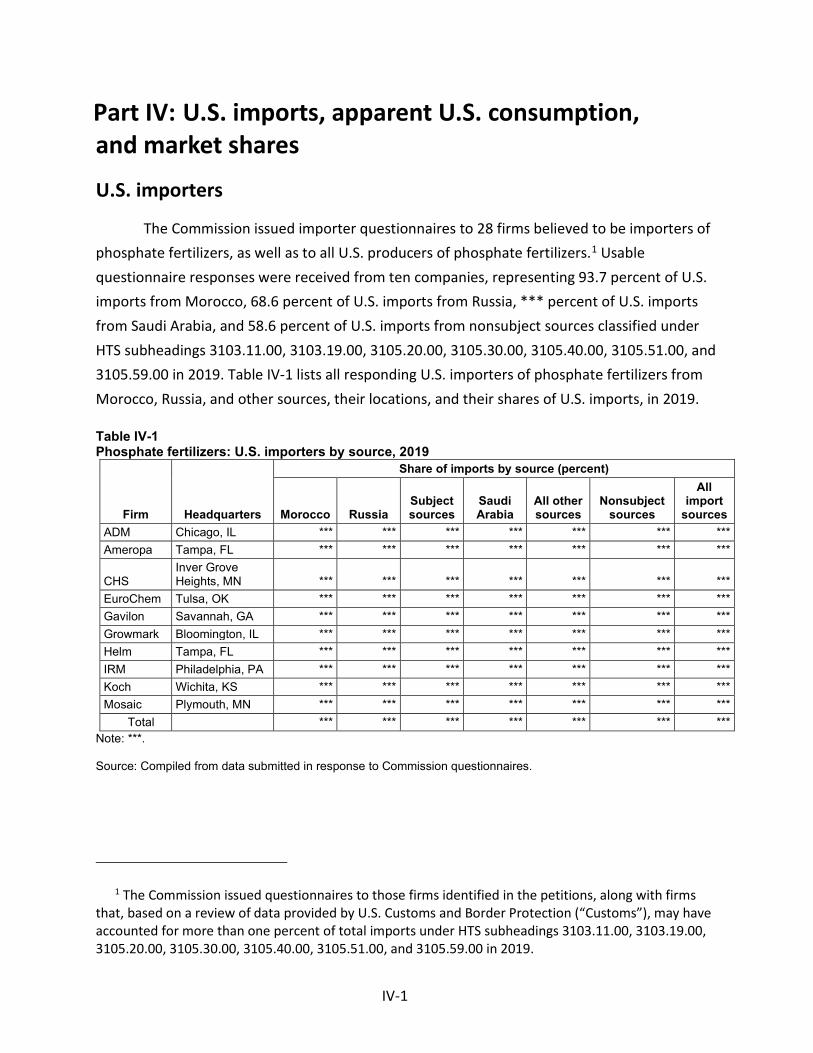
IV-1
Part IV: U.S. imports, apparent U.S. consumption, and market shares
U.S. importers
The Commission issued importer questionnaires to 28 firms believed to be importers of phosphate fertilizers, as well as to all U.S. producers of phosphate fertilizers.1 Usable questionnaire responses were received from ten companies, representing 93.7 percent of U.S. imports from Morocco, 68.6 percent of U.S. imports from Russia, *** percent of U.S. imports from Saudi Arabia, and 58.6 percent of U.S. imports from nonsubject sources classified under HTS subheadings 3103.11.00, 3103.19.00, 3105.20.00, 3105.30.00, 3105.40.00, 3105.51.00, and 3105.59.00 in 2019. Table IV-1 lists all responding U.S. importers of phosphate fertilizers from Morocco, Russia, and other sources, their locations, and their shares of U.S. imports, in 2019. Table IV-1 Phosphate fertilizers: U.S. importers by source, 2019
Firm Headquarters
Share of imports by source (percent)
Morocco Russia Subject sources
Saudi Arabia
All other sources
Nonsubject sources
All import
sources ADM Chicago, IL *** *** *** *** *** *** *** Ameropa Tampa, FL *** *** *** *** *** *** ***
CHS Inver Grove Heights, MN *** *** *** *** *** *** ***
EuroChem Tulsa, OK *** *** *** *** *** *** *** Gavilon Savannah, GA *** *** *** *** *** *** *** Growmark Bloomington, IL *** *** *** *** *** *** *** Helm Tampa, FL *** *** *** *** *** *** *** IRM Philadelphia, PA *** *** *** *** *** *** *** Koch Wichita, KS *** *** *** *** *** *** *** Mosaic Plymouth, MN *** *** *** *** *** *** ***
Total *** *** *** *** *** *** *** Note: ***. Source: Compiled from data submitted in response to Commission questionnaires.
1 The Commission issued questionnaires to those firms identified in the petitions, along with firms that, based on a review of data provided by U.S. Customs and Border Protection (“Customs”), may have accounted for more than one percent of total imports under HTS subheadings 3103.11.00, 3103.19.00, 3105.20.00, 3105.30.00, 3105.40.00, 3105.51.00, and 3105.59.00 in 2019.
IV-2
U.S. imports
Table IV-2 and figure IV-1 presents data for U.S. imports of phosphate fertilizers from Morocco, Russia, and all other sources.2 By quantity, U.S. imports from Morocco accounted for the largest share of total imports in each calendar year during 2017-19. It accounted for a smaller share in interim 2020 (51.3 percent) than in interim 2019 (66.3 percent). U.S. imports from Russia accounted for a smaller share of total imports than U.S. imports from Morocco during 2017-19 (20.0 percent in 2017, 27.3 percent in 2018, and 18.1 percent in 2019). It accounted for a smaller share in interim 2020 (15.2 percent) than in interim 2019 (18.0 percent). Overall, subject imports accounted for at least 83.0 percent of total U.S. imports during 2017-19. It accounted for a smaller share in interim 2020 (66.5 percent) than in interim 2019 (84.3 percent). By quantity, U.S. imports from Saudi Arabia, the largest nonsubject source in 2019, accounted for a smaller share of total U.S. imports during 2017-19 than U.S. imports from Morocco or from Russia, though its share increased in each year. It accounted for a larger share in interim 2020 (*** percent) than in interim 2019 (*** percent). Overall, nonsubject imports accounted for no more than 17.0 percent of total imports during 2017-19 and accounted for a larger share in interim 2020 (33.0 percent) than in interim 2019 (15.7 percent).3
2 In the preliminary phase of these investigations, U.S. import data were presented using official import statistics for HTS statistical reporting numbers 3103.11.0000, 3103.19.0000, 3105.20.0000, 3105.30.0000, 3105.40.0010, 3105.40.0050, 3105.51.0000, and 3105.59.0000. However, in its response to the Commission’s U.S. importers’ questionnaire in this final phase proceeding, one U.S. importer, ***, reported that imports of out-of-scope merchandise from Morocco, Russia, and other sources had been misclassified under the above listed HTS statistical reporting numbers. Consequently for this final phase proceeding, U.S. import data are presented using data submitted in response to Commission questionnaires. Appendix F presents data for U.S. imports of MAP and DAP from Morocco, Russia, and Saudi Arabia into NOLA.
3 ***. Consequently, the quantity of nonsubject imports presented in the official import statistics from the preliminary phase of these investigations may be overstated and that responding U.S. importers may represent a larger share of all nonsubject imports in 2017 classified under HTS statistical reporting numbers 3103.11.0000, 3103.19.0000, 3105.20.0000, 3105.30.0000, 3105.40.0010, 3105.40.0050, 3105.51.0000, and 3105.59.0000 than what the official import statistics would indicate.
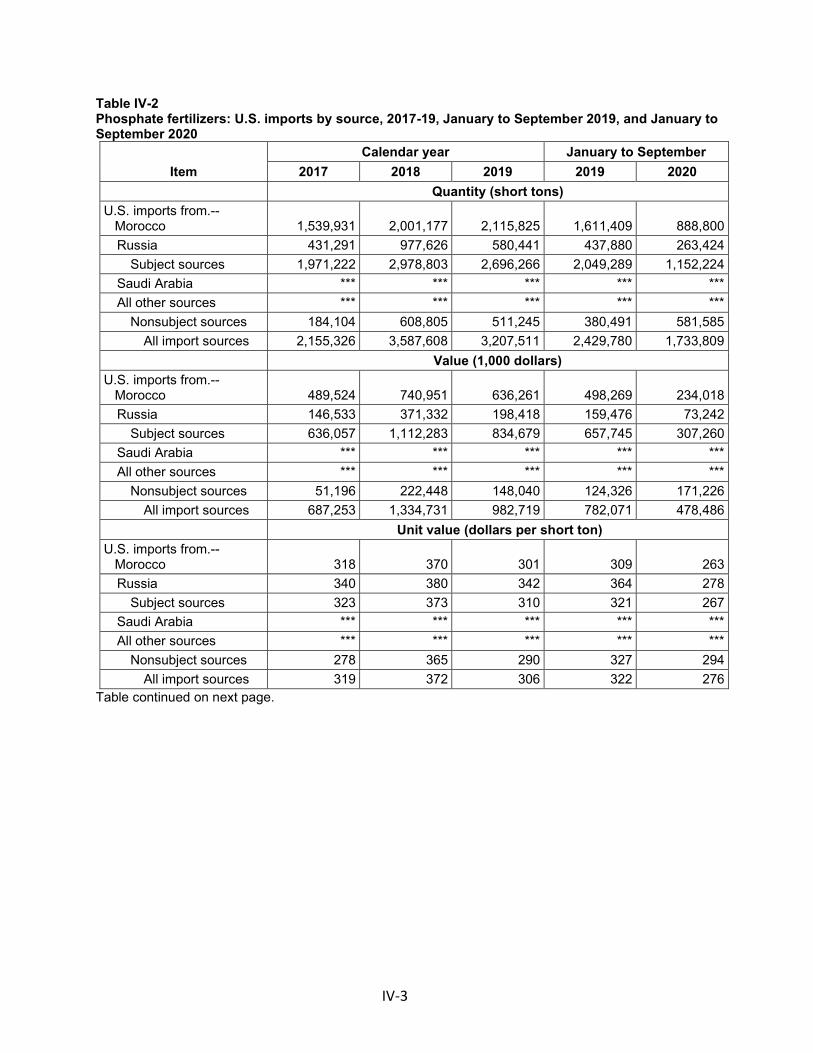
IV-3
Table IV-2 Phosphate fertilizers: U.S. imports by source, 2017-19, January to September 2019, and January to September 2020
Item Calendar year January to September
2017 2018 2019 2019 2020 Quantity (short tons) U.S. imports from.-- Morocco 1,539,931 2,001,177 2,115,825 1,611,409 888,800
Russia 431,291 977,626 580,441 437,880 263,424 Subject sources 1,971,222 2,978,803 2,696,266 2,049,289 1,152,224
Saudi Arabia *** *** *** *** *** All other sources *** *** *** *** ***
Nonsubject sources 184,104 608,805 511,245 380,491 581,585 All import sources 2,155,326 3,587,608 3,207,511 2,429,780 1,733,809
Value (1,000 dollars) U.S. imports from.-- Morocco 489,524 740,951 636,261 498,269 234,018
Russia 146,533 371,332 198,418 159,476 73,242 Subject sources 636,057 1,112,283 834,679 657,745 307,260
Saudi Arabia *** *** *** *** *** All other sources *** *** *** *** ***
Nonsubject sources 51,196 222,448 148,040 124,326 171,226 All import sources 687,253 1,334,731 982,719 782,071 478,486
Unit value (dollars per short ton) U.S. imports from.-- Morocco 318 370 301 309 263
Russia 340 380 342 364 278 Subject sources 323 373 310 321 267
Saudi Arabia *** *** *** *** *** All other sources *** *** *** *** ***
Nonsubject sources 278 365 290 327 294 All import sources 319 372 306 322 276
Table continued on next page.

IV-4
Table IV-2—Continued Phosphate fertilizers: U.S. imports by source, 2017-19, January to September 2019, and January to September 2020
Item Calendar year January to September
2017 2018 2019 2019 2020 Share of quantity (percent) U.S. imports from.-- Morocco 71.4 55.8 66.0 66.3 51.3
Russia 20.0 27.3 18.1 18.0 15.2 Subject sources 91.5 83.0 84.1 84.3 66.5
Saudi Arabia *** *** *** *** *** All other sources *** *** *** *** ***
Nonsubject sources 8.5 17.0 15.9 15.7 33.5 All import sources 100.0 100.0 100.0 100.0 100.0
Share of value (percent) U.S. imports from.-- Morocco 71.2 55.5 64.7 63.7 48.9
Russia 21.3 27.8 20.2 20.4 15.3 Subject sources 92.6 83.3 84.9 84.1 64.2
Saudi Arabia *** *** *** *** *** All other sources *** *** *** *** ***
Nonsubject sources 7.4 16.7 15.1 15.9 35.8 All import sources 100.0 100.0 100.0 100.0 100.0
Ratio to U.S. production U.S. imports from.-- Morocco *** *** *** *** ***
Russia *** *** *** *** *** Subject sources *** *** *** *** ***
Saudi Arabia *** *** *** *** *** All other sources *** *** *** *** ***
Nonsubject sources *** *** *** *** *** All import sources *** *** *** *** ***
Source: Compiled from data submitted in response to Commission questionnaires.

IV-5
Figure IV-1 Phosphate fertilizers: U.S. imports by source, 2017-19, January to September 2019, and January to September 2020
Source: Compiled from data submitted in response to Commission questionnaires.
During 2017-19, the quantity of U.S. imports from Morocco increased every year, ending 37.4 percent higher in 2019 than in 2017. It was 44.8 percent lower in interim 2020 than in interim 2019. Among the five firms that reported imports from Morocco in every year during 2017-19, two reported more imports in 2019 than in 2017, with the increase in *** imports more than offsetting the decrease in *** imports.4 Six of eight firms reported either less imports in interim 2020 than in interim 2019 or did not import from Morocco in interim 2020.
4 ***.
0
50
100
150
200
250
300
350
400
0
500
1,000
1,500
2,000
2,500
3,000
3,500
4,000
2017 2018 2019 2019 2020
Calendar year January to September
Average unit value(dollars per short ton)
Qua
ntity
(1,0
00 s
hort
tons
)
Subject quantities (left-axis) Nonsubject quantities (left-axis)
Subject AUVs (right-axis) Nonsubject AUVs (right-axis)
IV-6
By quantity, U.S. imports from Russia fluctuated year to year, more than doubling from 2017 to 2018, but then decreasing by 40.6 percent from 2018 to 2019, ending 34.6 percent higher in 2019 than in 2017. Among the four firms that reported imports from Russia in each year during 2017-19, two reported more imports in 2019 than in 2017 while two reported less imports.5 U.S. imports from Russia were 39.8 percent lower in interim 2020 than in interim 2019. All six firms that reported imports in 2019 either reported less imports in interim 2020 than in interim 2019 or did not import from Russia in interim 2020. Overall, the quantity of U.S. imports from subject sources fluctuated year to year, increasing by 51.1 percent from 2017 to 2018, but then decreasing by 9.5 percent from 2018 to 2019, ending 36.8 percent higher in 2019 than in 2017. It was 43.8 percent lower in interim 2020 than in interim 2019.
The quantity of U.S. imports from Saudi Arabia increased in each year during 2017-19, ending *** higher in 2019 than in 2017. It was *** percent lower in interim 2020 than in interim 2019. Only one firm, ***, reported imports from Saudi Arabia during the period for which data were collected.6 Overall, U.S. imports from nonsubject sources fluctuated year to year, more than tripling from 2017 to 2018, but then decreasing by 16.0 percent from 2018 to 2019, ending more than two times higher in 2019 than in 2017.7 It was 52.9 percent higher in interim 2020 than in interim 2019.
5 ***. The increase in ***. 6 ***. Email from ***, January 6, 2021 and email from ***, January 22, 2021. 7 ***. Four of those six firms either reported less imports in 2019 than in 2018 or did not import from
nonsubject sources in 2019.
IV-7
By value, U.S. imports from Morocco increased irregularly by 30.0 percent during 2017-19 and was 53.0 percent lower in interim 2020 than in interim 2019. The value U.S. imports from Russia increased irregularly by 35.4 percent during 2017-19 and was 54.1 percent lower in interim 2020 than in interim 2019. Overall, U.S. imports from subject sources, by value, increased irregularly by 31.2 percent during 2017-19 and was 53.3 percent lower in interim 2020 than in interim 2019. The value of U.S. imports from Saudi Arabia increased by *** during 2017-19 and was *** percent lower in interim 2020 than in interim 2019. Overall, the value of U.S. imports from nonsubject sources more than doubled during 2017-19 and was 37.7 percent higher in interim 2020 than in interim 2019.
The unit value of U.S. imports from Morocco increased from $318 per short ton in 2017 to $370 per short ton in 2018, but then decreased to $301 per short ton in 2019.8 It was lower in interim 2020 ($263 per short ton) than in interim 2019 ($309 per short ton). The unit value of U.S. imports from Russia exhibited the same trend as the unit value of U.S. imports from Morocco, increasing from $340 per short ton in 2017 to $380 per short ton in 2018, but then decreasing to $342 per short ton in 2019.9 It was also lower in interim 2020 ($278 per short ton) than in interim 2019 ($364 per short ton). Overall, the unit value of U.S. imports from subject sources increased from $323 per short ton in 2017 to $373 per short ton in 2018, but then decreased to $310 per short ton in 2019. It lower in interim 2020 ($267 per short ton), compared with interim 2019 ($321 per short ton).10
Exhibiting the same trend as the unit values of U.S. imports from Morocco and from Russia, the unit value of U.S. imports from Saudi Arabia increased from $*** per short ton in 2017 to $*** per short ton in 2018, but then decreased to $*** per short ton in 2019. It was also lower in interim 2020 ($*** per short ton), compared with interim 2019 ($*** per short ton). Overall, the unit value of U.S. imports from nonsubject sources exhibited the same trend as the unit value of subject imports, increasing irregularly from $278 per short ton in 2017 to
8 Responding U.S. importers reported unit values between $*** per short ton and $*** per short ton during the period for which data were collected.
9 Most responding U.S. importers reported unit values between $*** per short ton and $*** per short ton during the period for which data were collected.
10 According to respondent OCP, the difference in the average unit value between the two interim periods is due to the unit value reaching the lowest point during the period of investigation in the fourth quarter of 2019, which is not captured in the interim period data. OCP notes that the decrease in unit value during 2019 was primarily attributable to weak demand in China, inventory build-up in India, and the increased availability of Chinese exports in the global market. Respondent OCP’s posthearing brief, p. 67.
IV-8
$365 per short ton in 2018, but then decreasing to $290 per short ton in 2019. It was also lower in interim 2020 ($294 per short ton), compared with interim 2019 ($327 per short ton).11
Negligibility
The statute requires that an investigation be terminated without an injury determination if imports of the subject merchandise are found to be negligible.12 Negligible imports are generally defined in the Act, as amended, as imports from a country of merchandise corresponding to a domestic like product where such imports account for less than 3 percent of the volume of all such merchandise imported into the United States in the most recent 12-month period for which data are available that precedes the filing of the petition or the initiation of the investigation. However, if there are imports of such merchandise from a number of countries subject to investigations initiated on the same day that individually account for less than 3 percent of the total volume of the subject merchandise, and if the imports from those countries collectively account for more than 7 percent of the volume of all such merchandise imported into the United States during the applicable 12-month period, then imports from such countries are deemed not to be negligible.13 In the case of countervailing duty investigations involving developing countries (as designated by the United States Trade Representative), the statute indicates that the negligibility limits are 4 percent and 9 percent, rather than 3 percent and 7 percent.14 By quantity, imports from Morocco and Russia accounted for 71.9 percent and 13.2 of total imports of phosphate fertilizer, respectively,
11 Five of the six importers that imported phosphate fertilizer from nonsubject imports reported lower unit values for those imports than their imports from subject sources for the majority of 2017-19. ***. Email from ***, January 22, 2021; email from ***, January 22, 2021; and email from ***, January 22, 2021.
***. Email from ***, January 22, 2021; and email from ***, January 22, 2021. 12 Sections 703(a)(1), 705(b)(1), 733(a)(1), and 735(b)(1) of the Act (19 U.S.C. §§ 1671b(a)(1),
1671d(b)(1), 1673b(a)(1), and 1673d(b)(1)). 13 Section 771 (24) of the Act (19 U.S.C § 1677(24)). 14 Section 771(24)(B) of the Act (19 U.S.C. § 1677(24)(B)).
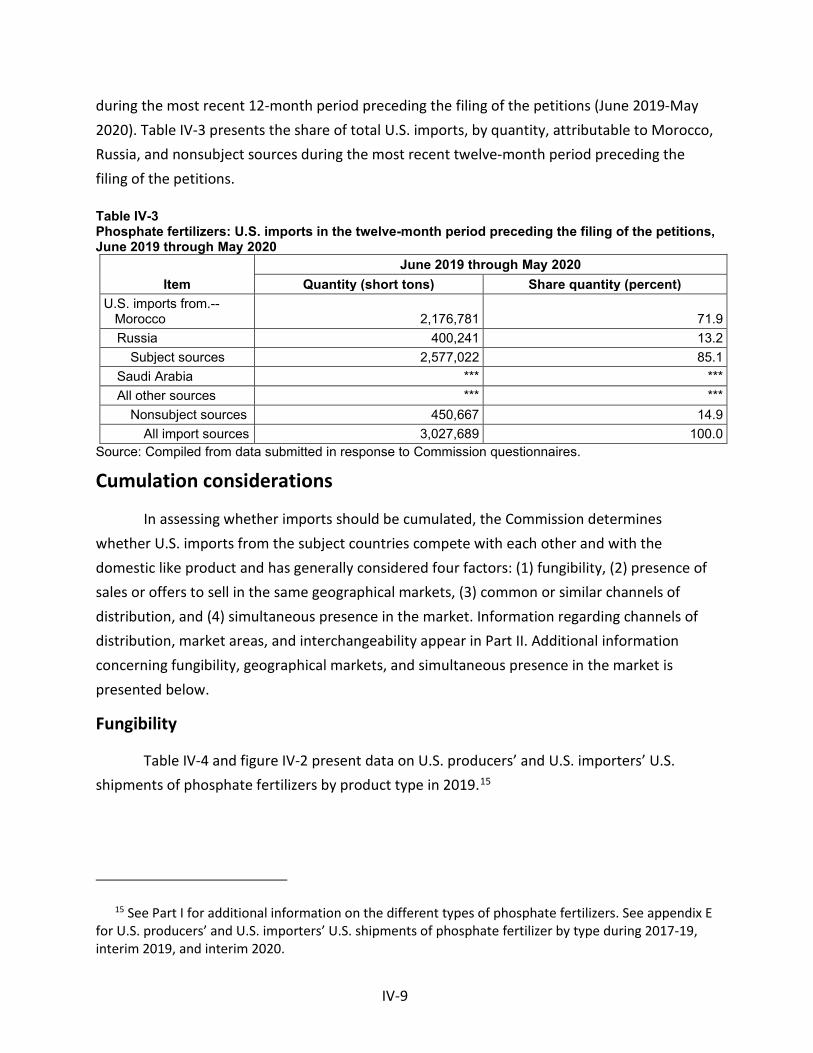
IV-9
during the most recent 12-month period preceding the filing of the petitions (June 2019-May 2020). Table IV-3 presents the share of total U.S. imports, by quantity, attributable to Morocco, Russia, and nonsubject sources during the most recent twelve-month period preceding the filing of the petitions. Table IV-3 Phosphate fertilizers: U.S. imports in the twelve-month period preceding the filing of the petitions, June 2019 through May 2020
Item June 2019 through May 2020
Quantity (short tons) Share quantity (percent) U.S. imports from.-- Morocco 2,176,781 71.9
Russia 400,241 13.2 Subject sources 2,577,022 85.1
Saudi Arabia *** *** All other sources *** ***
Nonsubject sources 450,667 14.9 All import sources 3,027,689 100.0
Source: Compiled from data submitted in response to Commission questionnaires.
Cumulation considerations
In assessing whether imports should be cumulated, the Commission determines whether U.S. imports from the subject countries compete with each other and with the domestic like product and has generally considered four factors: (1) fungibility, (2) presence of sales or offers to sell in the same geographical markets, (3) common or similar channels of distribution, and (4) simultaneous presence in the market. Information regarding channels of distribution, market areas, and interchangeability appear in Part II. Additional information concerning fungibility, geographical markets, and simultaneous presence in the market is presented below.
Fungibility
Table IV-4 and figure IV-2 present data on U.S. producers’ and U.S. importers’ U.S. shipments of phosphate fertilizers by product type in 2019.15
15 See Part I for additional information on the different types of phosphate fertilizers. See appendix E for U.S. producers’ and U.S. importers’ U.S. shipments of phosphate fertilizer by type during 2017-19, interim 2019, and interim 2020.

IV-10
Table IV-4 Phosphate fertilizers: U.S. producers’ and U.S. importers’ U.S. shipments by product type, 2019
Item MAP DAP TSP NPS NPK Other All types Quantity (short tons)
U.S. shipments from.-- U.S. producers *** *** *** *** *** *** ***
Morocco 1,005,493 721,023 *** *** *** *** 1,888,340 Russia 379,836 261,689 *** *** *** *** 647,602
Subject sources 1,385,329 982,712 *** *** *** *** 2,535,942 Saudi Arabia *** *** *** *** *** *** *** All other sources *** *** *** *** *** *** ***
Nonsubject sources *** *** *** *** *** *** 486,003 All import sources *** *** *** *** *** *** 3,021,945
U.S. producers and U.S. importers combined *** *** *** *** *** *** ***
Share across (percent) U.S. shipments from.-- U.S. producers *** *** *** *** *** *** ***
Morocco *** *** *** *** *** *** *** Russia *** *** *** *** *** *** ***
Subject sources *** *** *** *** *** *** *** Saudi Arabia *** *** *** *** *** *** *** All other sources *** *** *** *** *** *** ***
Nonsubject sources *** *** *** *** *** *** *** All import sources *** *** *** *** *** *** ***
U.S. producers and U.S. importers combined *** *** *** *** *** *** ***
Share down (percent) U.S. shipments from.-- U.S. producers *** *** *** *** *** *** ***
Morocco *** *** *** *** *** *** *** Russia *** *** *** *** *** *** ***
Subject sources *** *** *** *** *** *** *** Saudi Arabia *** *** *** *** *** *** *** All other sources *** *** *** *** *** *** ***
Nonsubject sources *** *** *** *** *** *** *** All import sources *** *** *** *** *** *** ***
U.S. producers and U.S. importers combined *** *** *** *** *** *** ***
Source: Compiled from data submitted in response to Commission questionnaires.
In 2019, MAP accounted for the largest share of U.S. producers’ U.S. shipments (*** percent), followed by DAP (*** percent). MAP also accounted for the largest share of U.S. importers’ U.S. shipments of U.S. imports from Morocco and their U.S. shipments of U.S. imports from Russia in 2019 (*** percent and *** percent, respectively), followed by DAP (*** percent and *** percent, respectively). NPS accounted for sizable share of U.S. producers’ U.S. shipments in 2019 (*** percent), but a negligible share of U.S. importers’ U.S. shipments of subject imports (*** percent). TSP accounted for a sizable share of U.S.
IV-11
importers’ U.S. shipments of U.S. imports from nonsubject sources in 2019 (*** percent) and a small share of their U.S. shipments of U.S. imports from Morocco. ***.
Figure IV-2 Phosphate fertilizers: U.S. producers’ and U.S. importers’ U.S. shipments by product type, 2019
* * * * * * *
Source: Compiled from data submitted in response to Commission questionnaires.
Geographical markets
According to official U.S. import statistics, nearly all U.S. imports from Morocco and the vast majority of U.S. imports from Russia (86.4 percent) entered the United States in 2019 through ports located in the South.16 Table IV-5 presents data on U.S. imports of phosphate fertilizers by border of entry in 2019.
16 New Orleans was the port of entry for nearly all U.S. imports of phosphate fertilizers from Morocco and the vast majority of U.S. imports from Russia classified under HTS statistical reporting numbers 3103.11.0000, 3105.20.0000, 3105.30.0000, 3105.40.0010, 3105.40.0050, and 3105.59.0000.
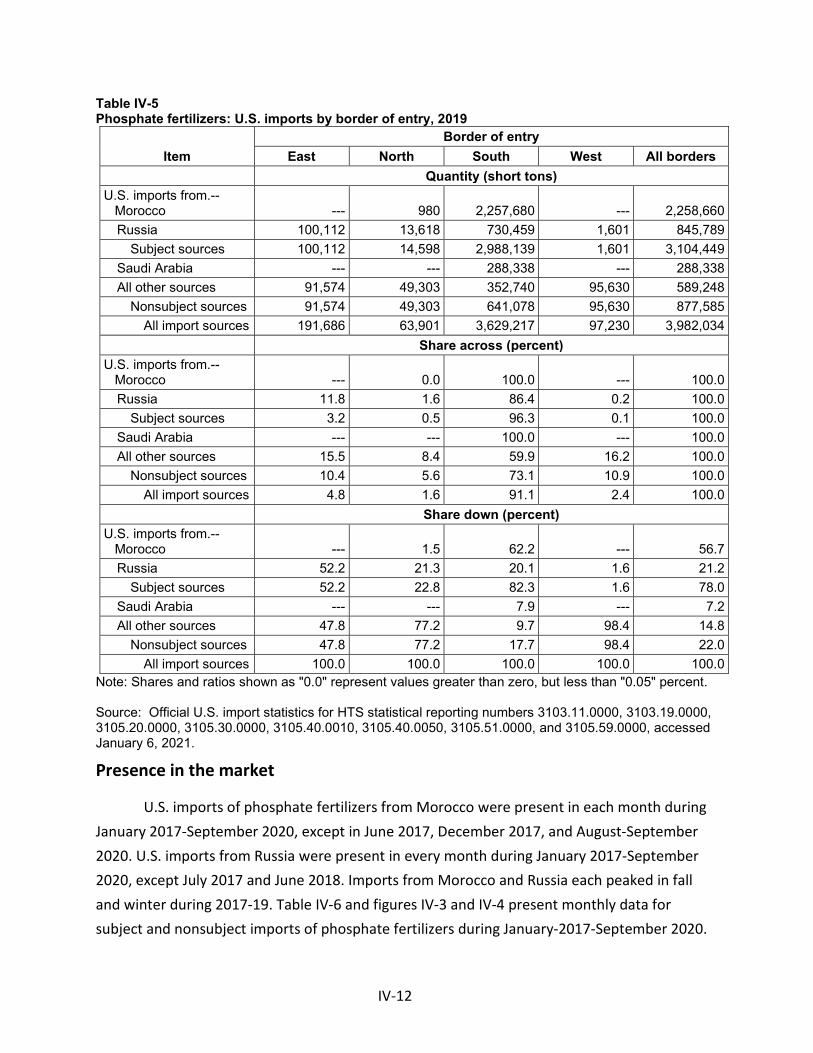
IV-12
Table IV-5 Phosphate fertilizers: U.S. imports by border of entry, 2019
Item Border of entry
East North South West All borders Quantity (short tons)
U.S. imports from.-- Morocco --- 980 2,257,680 --- 2,258,660
Russia 100,112 13,618 730,459 1,601 845,789 Subject sources 100,112 14,598 2,988,139 1,601 3,104,449
Saudi Arabia --- --- 288,338 --- 288,338 All other sources 91,574 49,303 352,740 95,630 589,248
Nonsubject sources 91,574 49,303 641,078 95,630 877,585 All import sources 191,686 63,901 3,629,217 97,230 3,982,034
Share across (percent) U.S. imports from.-- Morocco --- 0.0 100.0 --- 100.0
Russia 11.8 1.6 86.4 0.2 100.0 Subject sources 3.2 0.5 96.3 0.1 100.0
Saudi Arabia --- --- 100.0 --- 100.0 All other sources 15.5 8.4 59.9 16.2 100.0
Nonsubject sources 10.4 5.6 73.1 10.9 100.0 All import sources 4.8 1.6 91.1 2.4 100.0
Share down (percent) U.S. imports from.-- Morocco --- 1.5 62.2 --- 56.7
Russia 52.2 21.3 20.1 1.6 21.2 Subject sources 52.2 22.8 82.3 1.6 78.0
Saudi Arabia --- --- 7.9 --- 7.2 All other sources 47.8 77.2 9.7 98.4 14.8
Nonsubject sources 47.8 77.2 17.7 98.4 22.0 All import sources 100.0 100.0 100.0 100.0 100.0
Note: Shares and ratios shown as "0.0" represent values greater than zero, but less than "0.05" percent. Source: Official U.S. import statistics for HTS statistical reporting numbers 3103.11.0000, 3103.19.0000, 3105.20.0000, 3105.30.0000, 3105.40.0010, 3105.40.0050, 3105.51.0000, and 3105.59.0000, accessed January 6, 2021.
Presence in the market
U.S. imports of phosphate fertilizers from Morocco were present in each month during January 2017-September 2020, except in June 2017, December 2017, and August-September 2020. U.S. imports from Russia were present in every month during January 2017-September 2020, except July 2017 and June 2018. Imports from Morocco and Russia each peaked in fall and winter during 2017-19. Table IV-6 and figures IV-3 and IV-4 present monthly data for subject and nonsubject imports of phosphate fertilizers during January-2017-September 2020.

IV-13
Table IV-6 Phosphate fertilizers: U.S. imports by month, January 2017 through September 2020
U.S. imports Morocco Russia Subject sources
Saudi Arabia
All other sources
Nonsubject sources
All import sources
Quantity (short tons) 2017.-- January 153,868 48,900 202,768 --- 183,713 183,713 386,481
February 30,314 51,817 82,131 --- 39,069 39,069 121,200 March 289,941 157,292 447,233 --- 53,120 53,120 500,353 April 142,016 68,545 210,561 36,792 57,517 94,309 304,870 May 248 1,200 1,448 --- 54,700 54,700 56,148 June --- 78,597 78,597 --- 37,993 37,993 116,590 July 211,943 --- 211,943 --- 63,747 63,747 275,690 August 178,113 383 178,496 --- 36,313 36,313 214,809 September 301,290 121,521 422,811 --- 27,611 27,611 450,422 October 152,989 32,006 184,994 --- 61,435 61,435 246,429 November 58,367 16,449 74,816 --- 30,968 30,968 105,784 December --- 527 527 --- 16,513 16,513 17,040
2018.-- January 210,268 102,692 312,960 --- 73,465 73,465 386,425
February 179,699 184,164 363,863 --- 75,755 75,755 439,618 March 250,768 155,430 406,198 36,386 35,608 71,994 478,192 April 228,551 71,582 300,133 53,863 48,065 101,928 402,061 May 11,660 16,943 28,603 --- 46,511 46,511 75,114 June 118,906 --- 118,906 --- 92,565 92,565 211,472 July 60,796 39,061 99,857 --- 17,645 17,645 117,502 August 206,840 68,816 275,656 --- 87,608 87,608 363,264 September 163,724 91,405 255,129 --- 134,025 134,025 389,154 October 276,875 200,100 476,975 --- 122,004 122,004 598,979 November 51,770 37,756 89,526 --- 20,776 20,776 110,303 December 244,448 64,118 308,566 11,018 91,054 102,072 410,638
Table continued on next page.
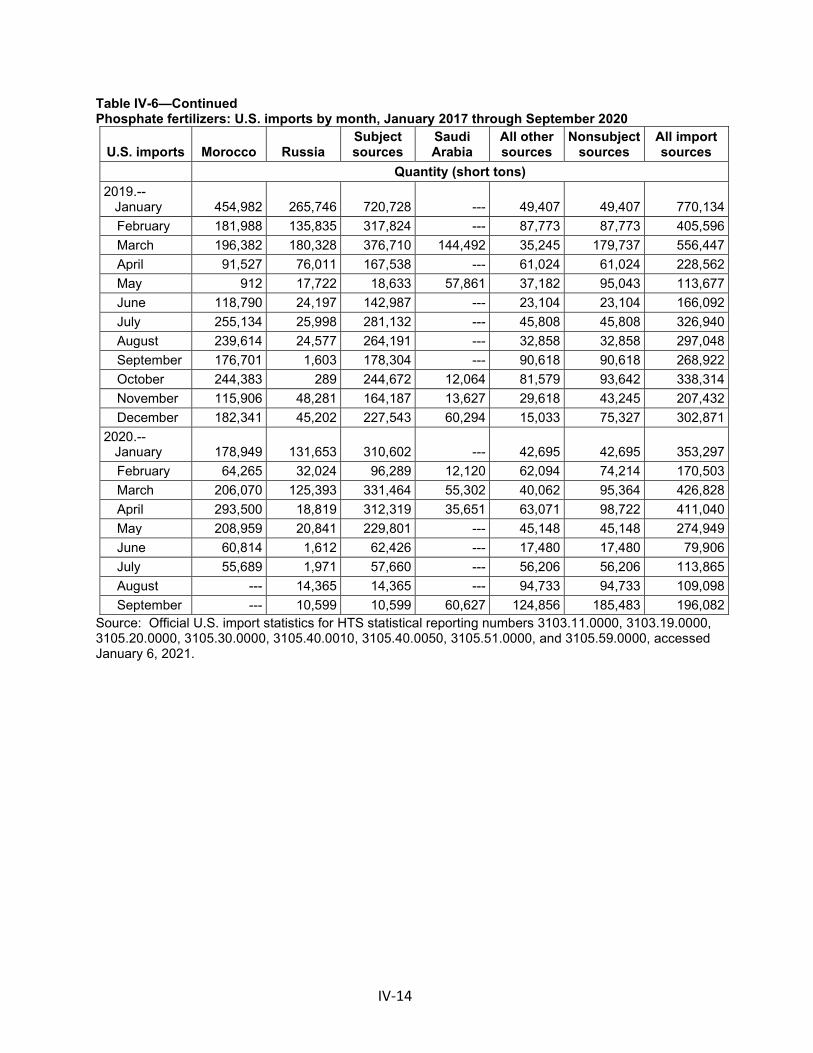
IV-14
Table IV-6—Continued Phosphate fertilizers: U.S. imports by month, January 2017 through September 2020
U.S. imports Morocco Russia Subject sources
Saudi Arabia
All other sources
Nonsubject sources
All import sources
Quantity (short tons) 2019.-- January 454,982 265,746 720,728 --- 49,407 49,407 770,134
February 181,988 135,835 317,824 --- 87,773 87,773 405,596 March 196,382 180,328 376,710 144,492 35,245 179,737 556,447 April 91,527 76,011 167,538 --- 61,024 61,024 228,562 May 912 17,722 18,633 57,861 37,182 95,043 113,677 June 118,790 24,197 142,987 --- 23,104 23,104 166,092 July 255,134 25,998 281,132 --- 45,808 45,808 326,940 August 239,614 24,577 264,191 --- 32,858 32,858 297,048 September 176,701 1,603 178,304 --- 90,618 90,618 268,922 October 244,383 289 244,672 12,064 81,579 93,642 338,314 November 115,906 48,281 164,187 13,627 29,618 43,245 207,432 December 182,341 45,202 227,543 60,294 15,033 75,327 302,871
2020.-- January 178,949 131,653 310,602 --- 42,695 42,695 353,297
February 64,265 32,024 96,289 12,120 62,094 74,214 170,503 March 206,070 125,393 331,464 55,302 40,062 95,364 426,828 April 293,500 18,819 312,319 35,651 63,071 98,722 411,040 May 208,959 20,841 229,801 --- 45,148 45,148 274,949 June 60,814 1,612 62,426 --- 17,480 17,480 79,906 July 55,689 1,971 57,660 --- 56,206 56,206 113,865 August --- 14,365 14,365 --- 94,733 94,733 109,098 September --- 10,599 10,599 60,627 124,856 185,483 196,082
Source: Official U.S. import statistics for HTS statistical reporting numbers 3103.11.0000, 3103.19.0000, 3105.20.0000, 3105.30.0000, 3105.40.0010, 3105.40.0050, 3105.51.0000, and 3105.59.0000, accessed January 6, 2021.

IV-15
Figure IV-3 Phosphate fertilizers: U.S. imports from individual subject sources, by month, January 2017 through September 2020
Source: Official U.S. import statistics for HTS statistical reporting numbers 3103.11.0000, 3103.19.0000, 3105.20.0000, 3105.30.0000, 3105.40.0010, 3105.40.0050, 3105.51.0000, and 3105.59.0000, accessed January 6, 2021.
050
100150200250300350400450500
Jan
Feb
Mar Ap
rM
ay Jun
Jul
Aug
Sep
Oct
Nov
Dec Jan
Feb
Mar Ap
rM
ay Jun
Jul
Aug
Sep
Oct
Nov
Dec Jan
Feb
Mar Ap
rM
ay Jun
Jul
Aug
Sep
Oct
Nov
Dec Jan
Feb
Mar Ap
rM
ay Jun
Jul
Aug
Sep
2017 2018 2019 2020
Qua
ntity
1,00
0 sh
ort t
ons)
Morocco Russia
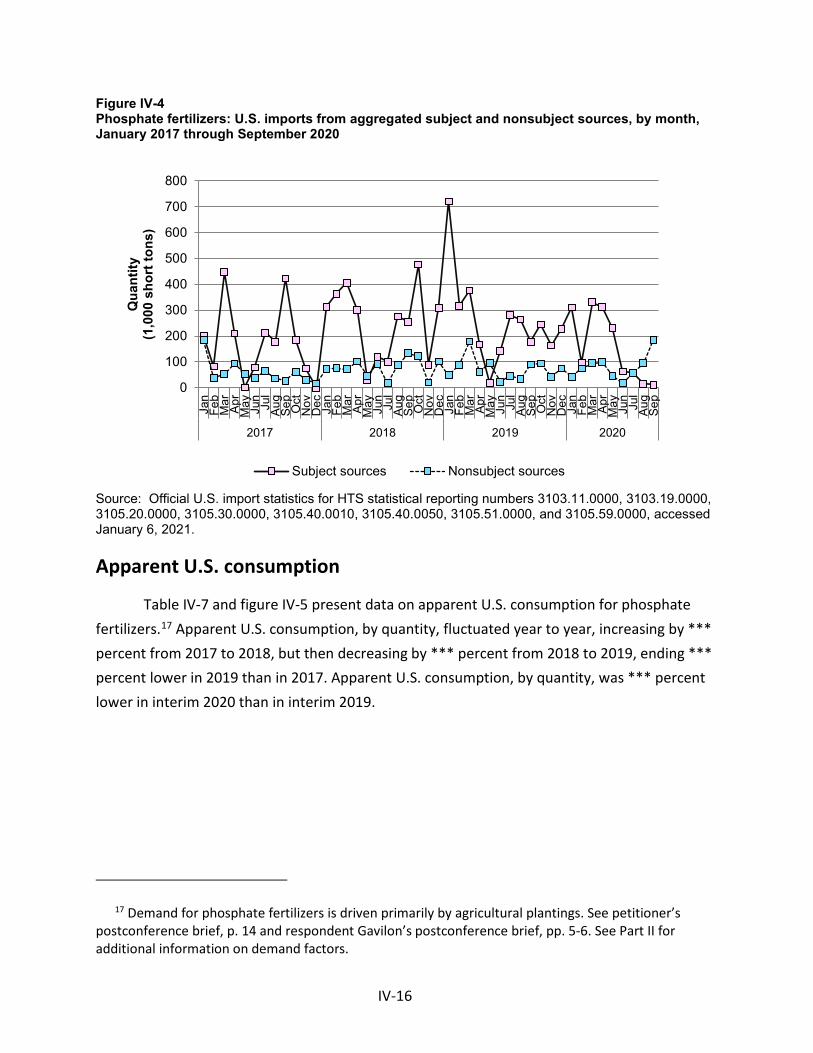
IV-16
Figure IV-4 Phosphate fertilizers: U.S. imports from aggregated subject and nonsubject sources, by month, January 2017 through September 2020
Source: Official U.S. import statistics for HTS statistical reporting numbers 3103.11.0000, 3103.19.0000, 3105.20.0000, 3105.30.0000, 3105.40.0010, 3105.40.0050, 3105.51.0000, and 3105.59.0000, accessed January 6, 2021.
Apparent U.S. consumption
Table IV-7 and figure IV-5 present data on apparent U.S. consumption for phosphate fertilizers.17 Apparent U.S. consumption, by quantity, fluctuated year to year, increasing by *** percent from 2017 to 2018, but then decreasing by *** percent from 2018 to 2019, ending *** percent lower in 2019 than in 2017. Apparent U.S. consumption, by quantity, was *** percent lower in interim 2020 than in interim 2019.
17 Demand for phosphate fertilizers is driven primarily by agricultural plantings. See petitioner’s postconference brief, p. 14 and respondent Gavilon’s postconference brief, pp. 5-6. See Part II for additional information on demand factors.
0
100
200
300
400
500
600
700
800Ja
nFe
bM
ar Apr
May Jun
Jul
Aug
Sep
Oct
Nov
Dec Jan
Feb
Mar Ap
rM
ay Jun
Jul
Aug
Sep
Oct
Nov
Dec Jan
Feb
Mar Ap
rM
ay Jun
Jul
Aug
Sep
Oct
Nov
Dec Jan
Feb
Mar Ap
rM
ay Jun
Jul
Aug
Sep
2017 2018 2019 2020
Qua
ntity
(1,0
00 s
hort
tons
)
Subject sources Nonsubject sources

IV-17
Table IV-7 Phosphate fertilizers: Apparent U.S. consumption, 2017-19, January to September 2019, and January to September 2020
Item Calendar year January to September
2017 2018 2019 2019 2020 Quantity (short tons) U.S. producers' U.S. shipments *** *** *** *** *** U.S. importers' U.S. shipments from.-- Morocco 1,402,481 1,618,042 1,888,340 1,277,590 939,634
Russia 379,523 768,943 647,602 599,066 328,872 Subject sources 1,782,004 2,386,985 2,535,942 1,876,656 1,268,506
Saudi Arabia *** *** *** *** *** All other sources *** *** *** *** ***
Nonsubject sources 188,342 551,265 486,003 370,161 302,800 All import sources 1,970,346 2,938,250 3,021,945 2,246,817 1,571,306
Apparent U.S. consumption *** *** *** *** *** Value (1,000 dollars) U.S. producers' U.S. shipments *** *** *** *** *** U.S. importers' U.S. shipments from.-- Morocco 472,749 667,009 663,289 462,052 280,600
Russia 147,587 323,565 242,485 225,516 100,628 Subject sources 620,336 990,574 905,774 687,568 381,228
Saudi Arabia *** *** *** *** *** All other sources *** *** *** *** ***
Nonsubject sources 57,872 209,374 159,151 123,742 87,563 All import sources 678,208 1,199,948 1,064,925 811,310 468,791
Apparent U.S. consumption *** *** *** *** *** Source: Compiled from data submitted in response to Commission questionnaires.

IV-18
Figure IV-5 Phosphate fertilizers: Apparent U.S. consumption, 2017-19, January to September 2019, and January to September 2020
* * * * * * *
Source: Compiled from data submitted in response to Commission questionnaires.
The decrease in U.S. producers’ U.S. shipments, largely driven by ***, was offset by the increase in U.S. imports from subject and nonsubject sources. The difference in apparent U.S. consumption between the two interim periods largely reflects the difference in U.S. imports from subject sources and nonsubject sources as they each were lower in interim 2020 than in interim 2019. Conversely, U.S. producers’ U.S. shipments were higher in interim 2020 than in interim 2019. Apparent U.S. consumption, by value, decreased irregularly by *** percent during 2017-19 and was *** percent lower in interim 2020 than in interim 2019.
U.S. market shares
Table IV-8 presents data on market share for phosphate fertilizers. U.S. producers’ market share, by quantity, decreased from *** percent in 2017 to *** percent in 2019. It was *** percent in interim 2020, compared with *** percent in interim 2019. Conversely, the market share of U.S. shipments of U.S. imports from Morocco, by quantity, increased in each year during 2017-19 from *** percent to *** percent and the market share of U.S. shipments of U.S. imports from Russia, by quantity, increased irregularly from *** percent in 2017 to *** percent 2019. The market shares of U.S. shipments of U.S. imports from Morocco
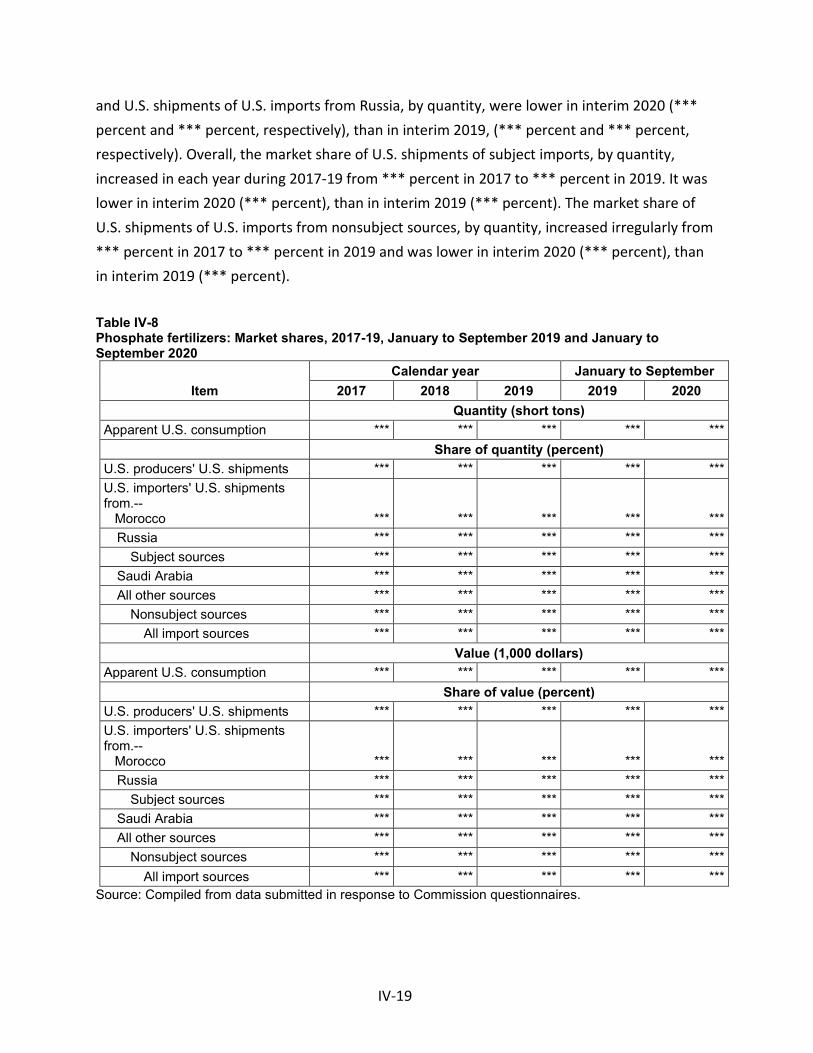
IV-19
and U.S. shipments of U.S. imports from Russia, by quantity, were lower in interim 2020 (*** percent and *** percent, respectively), than in interim 2019, (*** percent and *** percent, respectively). Overall, the market share of U.S. shipments of subject imports, by quantity, increased in each year during 2017-19 from *** percent in 2017 to *** percent in 2019. It was lower in interim 2020 (*** percent), than in interim 2019 (*** percent). The market share of U.S. shipments of U.S. imports from nonsubject sources, by quantity, increased irregularly from *** percent in 2017 to *** percent in 2019 and was lower in interim 2020 (*** percent), than in interim 2019 (*** percent).
Table IV-8 Phosphate fertilizers: Market shares, 2017-19, January to September 2019 and January to September 2020
Item Calendar year January to September
2017 2018 2019 2019 2020 Quantity (short tons) Apparent U.S. consumption *** *** *** *** *** Share of quantity (percent) U.S. producers' U.S. shipments *** *** *** *** *** U.S. importers' U.S. shipments from.-- Morocco *** *** *** *** ***
Russia *** *** *** *** *** Subject sources *** *** *** *** ***
Saudi Arabia *** *** *** *** *** All other sources *** *** *** *** ***
Nonsubject sources *** *** *** *** *** All import sources *** *** *** *** ***
Value (1,000 dollars) Apparent U.S. consumption *** *** *** *** *** Share of value (percent) U.S. producers' U.S. shipments *** *** *** *** *** U.S. importers' U.S. shipments from.-- Morocco *** *** *** *** ***
Russia *** *** *** *** *** Subject sources *** *** *** *** ***
Saudi Arabia *** *** *** *** *** All other sources *** *** *** *** ***
Nonsubject sources *** *** *** *** *** All import sources *** *** *** *** ***
Source: Compiled from data submitted in response to Commission questionnaires.


V-1
Part V: Pricing data
Factors affecting prices
Raw material costs
Sulfur, ammonia, and phosphate rock are the main raw material inputs used to produce phosphate fertilizers. The major U.S. and subject foreign producers are vertically integrated, although phosphate rock can also be purchased on the open market.1 *** U.S. producers are at least partially vertically integrated with respect to sulfur and phosphate rock, and some purchase sulfur and/or ammonia from unrelated U.S. suppliers.2
U.S. producers’ raw materials as a share of cost of goods sold (“COGS”) increased by *** percentage points from 2017 to 2019, from *** percent to *** percent and was *** percent during January-September 2020. U.S. producers reported that sulfur made up approximately *** percent of their total raw material costs in 2019, ammonia made up *** percent, phosphate rock made up *** percent, and other raw material inputs made up *** percent.
As shown in figure V-1, the price of ammonia fluctuated widely from January 2017 to January 2020, although it stabilized somewhat beginning in 2019 and even more so beginning in October 2019. Between April and July 2020, the price of ammonia decreased even more. The price of sulfur increased from January 2017 to the end of 2018, then decreased through January 2020. In March 2020, the price of sulfur increased and remained relatively stable through July 2020. The price of phosphate rock was relatively stable throughout the period of investigation.
1 *** Mosaic reported producing and purchasing ammonia. Mosaic reported producing about one-third of its ammonia itself, buying about one-third on a spot basis, and buying the remaining one-third through a long-term contract with CF Industries. Hearing transcript, p. 162 (O’Rourke), Mosaic’s posthearing brief, Answers to Commissioner Questions, p. 95. *** reported making sulfur, ***. *** mine and beneficiate phosphate rock. See also Mosaic’s prehearing brief, p. 23.
2 Respondent OCP stated that ***. OCP’s prehearing brief, pp. 14-15. Respondent International Raw Materials (“IRM”) argues that depletion of domestic phosphate rock
reserves has resulted in supply shortages in the U.S. market, and that “that was the driving force behind the development of the MES or MicroEssentials product… {which} is a lower grade {with} less phosphate.” IRM’s prehearing brief, pp. 4-6; Hearing transcript, p. 299 (O’Neill). Simplot testified that it “just permitted a new mine in easter{n} Idaho,” and “in regards to the depletion of ore reserves specifically from a Simplot point of view and in the western marketplace, there are generations of ore reserves that are economically accessible and available that we plan to reach and tap into.” Hearing transcript, p. 139 (Stone). Mosaic testified that it “just permitted an area we call our ace extension of our South Fort Meade Mine, and we have 35-plus years of proven reserves and resources that go long beyond that.” Hearing transcript, pp. 139-140 and 142-143 (O’Rourke).

V-2
It increased slightly between November 2018 and June 2019, then decreased slightly, remaining relatively flat until April 2020, when it increased slightly, and remained stable again through July 2020.
Figure V-1 Ammonia, sulfur, and phosphate rock prices: Prices of ammonia (cfr Tampa), sulfur (dry bulk f.o.b. US Gulf), and phosphate rock (69% BPL bulk f.o.b. North Africa), weekly, first week of January 2017-third week of July 2020
Source: CRU, via PhosAgro’s posthearing brief, Exhibit 6.
When U.S. producers and importers were asked how raw material prices have changed since January 1, 2017, most firms, *** 5 of 9 importers, reported that they had fluctuated with no clear trend (table V-1). *** the remaining four importers reported a decrease in raw material prices.
Table V-1 Phosphate fertilizers: Firms’ responses regarding raw material price trends, by number of responding firms
Item Increase No change Decrease Fluctuate U.S. producers *** *** *** *** Importers --- --- 4 5
Source: Compiled from data submitted in response to Commission questionnaires.
0
50
100
150
200
250
300
350
400
U.S
. dol
lars
per
ton
Phospate rock Ammonia Sulfur
V-3
In explaining the factors that influenced these trends, *** reported that market prices for phosphates are exposed to fluctuations in the prices of ammonia and sulfur. *** reported that ammonia and sulfur prices can be cyclical, and several firms reported that ammonia and sulfur prices are influenced by supply and demand trends for those products. *** also indicated that ammonia and sulfur prices are influenced by “the most significant production cost, namely the hydrocarbon feedstock.” However, *** reported that ammonia, sulfur, and phosphate have separate supply and demand cycles and that there is little correlation between these prices.
Among the importers that reported a decrease in raw material prices, *** reported that an increase in global production and subsequent oversupply of ammonia and sulfur has contributed to their price decreases. *** reported that Mosaic has been unable to capitalize on these lower prices ***.3
When purchasers were asked if they were familiar with raw material prices, a majority of firms (20 of 28) reported that they were, but when asked if information on raw material prices has affected their negotiations or contracts, only a minority of firms (5 of 24) reported that it did. *** reported that raw material costs are calculated as reference points before it purchases any material, and *** reported that it monitors ammonia and sulfuric acid costs to evaluate price floors.
Transportation costs to the U.S. market
Transportation costs for phosphate fertilizers shipped from subject countries to the United States averaged 3.0 percent for Morocco and 5.2 percent for Russia during 2019. These estimates were derived from official import data and represent the transportation and other charges on imports.4
U.S. inland transportation modes and costs
*** U.S. producers and 6 of 9 responding importers reported that they typically arrange transportation to their customers. U.S. producers reported that 12.4 percent of their 2019 sales
3 Mosaic testified that it has a contract with CF Industries as a hedge against fluctuating prices, and that has allowed it “to have a relatively stable ammonia price and participate when the market is good and participate when the market is bad.” It indicated that its “risk mitigation program has been to buy a third on the open market, buy a third through long-term contract, and buy a third through our own production or supply a third through our own production.” Hearing transcript, pp. 162-163 (O’Rourke).
4 The estimated transportation costs were obtained by subtracting the customs value from the c.i.f. value of the imports for 2019 and then dividing by the customs value based on the HTS subheadings 3103.11.0000, 3103.19.0000, 3105.20.0000, 3105.30.0000, 3105.40.0010, 3105.40.0050, 3105.51.0000, and 3105.59.0000.

V-4
of domestically produced phosphate fertilizers were shipped by barge, 47.1 percent were shipped by rail, 24.7 percent were shipped by truck, and 15.8 percent were shipped by another method, including by vessel or by title transfer. U.S. producers reported that their U.S. inland transportation costs ranged from *** percent for their product shipped by barge, for a weighted average cost of 1.6 percent; *** percent for their product shipped by rail, for a weighted average cost of 9.3 percent, and *** percent for their product shipped by truck, for a weighted average cost of 1.9 percent.
Importers reported that 61.6 percent of their 2019 sales of subject product were shipped by barge, 10.8 percent were shipped by rail, and 27.7 percent were shipped by truck. Importers reported U.S. inland transportation costs ranging from *** percent for their product shipped by barge, for a weighted average of 6.6 percent; *** percent for their product shipped by rail, for a weighted average cost of 18.1 percent, and *** percent for their product shipped by truck, for a weighted average cost of 22.5 percent.
Pricing practices
Pricing methods
U.S. producers and importers reported using transaction-by-transaction negotiations, contracts, and price lists to set prices for phosphate fertilizers (table V-2).
Table V-2 Phosphate fertilizers: U.S. producers’ and importers’ reported price setting methods, by number of responding firms
Method U.S. producers Importers Transaction-by-transaction *** 9 Contract *** 4 Set price list *** 3 Other *** 1 Responding firms 3 10
Note: The sum of responses down may not add up to the total number of responding firms as each firm was instructed to check all applicable price setting methods employed. Source: Compiled from data submitted in response to Commission questionnaires.
V-5
Price lists
Prices and general market intelligence for phosphate fertilizer are published by trade publications such as Argus, CRU, and Green Markets on a daily or weekly basis.5 When asked if they refer to prices published in trade publications, *** U.S. producers and 2 of 9 responding importers reported that they do. *** reported that publications such as *** provide insight into market pricing conditions across the United States on a weekly basis and often serve as a starting point for its prices. ***.6 ***.7 *** reported using NOLA-based prices published by ***.
Most purchasers (16 of 28) reported that they use prices reported in trade publications to negotiate purchase prices. Purchasers reported using the following publications to negotiate prices: Green Markets (9 firms); Profercy (6 firms); Argus and Fertecon (3 firms each); ICIS (2 firms); and CRU, FIS Index, and FMB (1 firm each). Several firms also reported using NOLA barge or NOLA f.o.b. prices, but did not specify a particular publication.
When asked if they had reported their own prices to any trade publication indices since January 1, 2017, *** U.S. producers, 6 of 10 importers, and 12 of 27 purchasers reported that they had.8 *** reported *** prices to ***, and *** reported its *** prices *** on a weekly basis to ***. Importers reported their prices to the following publications: Argus, CRU, Green Markets, and Profercy (4 firms each); ICIS (2 firms); and Fertecon and IHS Markit (1 firm each). Purchasers reported their prices to the following publications: Green Markets (8 firms); Argus and Fertecon (5 firms each); CRU and Profercy (4 firms each); ICIS (2 firms each); and FMB and IHS Markit (1 firm each).
When asked how prices are typically negotiated, Simplot testified that it “identifies several people who can meet our needs who we rely on, which is a mixture of domestic and
5 In March 2020, Argus announced that it would begin publishing phosphate prices on a daily basis on DAP f.o.b. from China, DAP CFR (cost and freight) from India, MAP CFR from Brazil, DAP barges f.o.b. from NOLA, and MAP barges f.o.b. from NOLA. Argus website, Phosphates: Argus launches daily phosphate pricing, https://www.argusmedia.com/en/news/2087677-phosphates-argus-launches-daily-phosphate-pricing, March 17, 2020 (accessed January 14, 2021). CRU “publish{es} comprehensive phosphate prices from around the world on a weekly basis.” See CRU website, https://www.crugroup.com/analysis/phosphates/ and https://www.crugroup.com/cru-fertilizers/, accessed January 14, 2021. Green Markets publishes weekly price indexes for various regions, “constructed using the fertilizer benchmark prices of U.S. Gulf Coast Urea, U.S. Cornbelt Potash and NOLA Barge DAP.” Green Markets website, https://fertilizerpricing.com/, accessed January 16, 2021. See also Mosaic’s posthearing brief, Responses to Commission Questions, pp. 28-37.
6 “NOLA” refers to the port city of New Orleans, Louisiana. 7 ***. 8 Published price data for DAP and MAP from Argus, FMB, CRU (Fertilizer Week), Bloomberg Green
Markets, and IHS Markit (Ferticon) from January 2017 to May 2020 is presented in figure V-6.

V-6
offshore producers who have the quality, the reputation, and can deliver. At the end of the day, in most cases, you have five or six alternatives… and it's kind of may the best man win when it comes to price when you're in the market to buy.”9 Mosaic testified that it “will receive communications either via phone or email from customers looking to buy and will tell us the quote they have in hand from a foreign supplier or an importer and ask us to match that price or beat that price if we intend to have the business or keep the business, and that's a very common occurrence.”10
Types of sale
U.S. producers reported selling *** of their product in the spot market, while importers reported selling *** half of their product in the spot market (table V-3). U.S. producers reported selling ***, while importers reported selling *** percent under short-term contract. *** and importers reported selling their remaining *** percent through annual contracts.
Table V-3 Phosphate fertilizers: U.S. producers’ and importers’ shares of U.S. commercial shipments by type of sale, 2019
Type of sale U.S. producers Importers Long-term contracts *** *** Annual contracts *** *** Short-term contracts *** *** Spot sales *** ***
Total 100.0 100.0 Note: Because of rounding, figures may not add to the totals shown. Source: Compiled from data submitted in response to Commission questionnaires.
***. It reported that ***. ***. For importers’ short-term contracts, most (***) firms reported that prices could not be
renegotiated during the contract period, and all five reported that the contracts fixed both price and quantity and were not indexed to raw material prices. For their annual contracts, all responding (***) firms reported that prices could be renegotiated during the contract period, and *** reported that the contracts fixed both price and quantity and were not indexed to raw material prices.
9 Hearing transcript, p. 82 (Sunderland). 10 Hearing transcript, pp. 82-83 (Jung). Mosaic stated that “when negotiating price, Mosaic’s
customers often refer to published prices, i.e., the NOLA price, and/or price quotes for imported product in order to force Mosaic to lower its prices.” Mosaic’s posthearing brief, p. 6, Responses to Commissioner Questions, pp. 26-28, and Exhibits 27-36.

V-7
Five purchasers reported that they purchase product daily, 10 purchase weekly, six purchase monthly, two purchase quarterly, none purchase annually, and six purchase with other frequencies. One firm reported that it purchases seasonally, one purchases “whenever we feel it is a good value and meets customer forecasts,” and one purchases at “different times of year” to fill programs. One purchaser reported that its purchase frequency fluctuates depending on grower demand and wholesale cost. Mosaic reported that it “***.”
Most responding purchasers (21 of 28 firms) reported that their purchasing frequency had not changed since 2017. For the seven firms that did report a change in purchase frequency, four reported an increase; two of those reported increasing their purchases to counteract a perceived decrease in supply (2 firms), and two reported increasing purchases due to business growth (2 firms). One (***) reported a decrease in both frequency and volume. Two purchasers reported contacting 1 to 2 suppliers before making a purchase, three reported contacting up to 3, five contact up to 4, nine contact up to 5, four contact up to 6, two contact up to 7, and one firm each reported contacting up to 8, 10, and 15 firms.
Sales terms and discounts
U.S. producers and importers reported various combinations of sales terms, though firms were slightly more likely to quote prices on a delivered basis than on an f.o.b. basis. *** reported quoting prices on both a delivered and f.o.b. basis, while *** reported quoting prices on a delivered basis only and *** reported quoting prices on an f.o.b. basis only.
U.S. producers reported offering a variety of discounts, while *** reported offering discounts. *** offer total volume discounts, and *** offer rebates. ***. *** also reported offering “incentive payments,” ***.
When asked specifically how their rebates were determined and when they are paid to the customer, *** reported that ***, *** reported that ***, and *** reported that ***.
Price leadership
The most frequently cited price leader was Mosaic, which was listed as the industry price leader by 18 purchasers. When asked to elaborate on how this firm exhibits price leadership, firms listed the following: control of North American production; market size; issuance of price lists that other firms follow; supply; pricing programs; and setting the barge market prices for Tampa, Florida and New Orleans, Louisiana by announcing price changes in those regions. Purchasers also reported the following other firms as price leaders: Simplot (cited by 4 firms); ADM and Koch (3 firms each); CHS, EuroChem, Gavilon, Growmark, Helm, Nutrien, and OCP (2 firms each); and Ben-Trei and Oakley (1 firm each).

V-8
Price data
The Commission requested U.S. producers and importers to provide monthly data for the total quantity and f.o.b. value of the following phosphate fertilizers products shipped to unrelated U.S. agricultural customers during January 2017-September 2020.
Product 1.--Standard-grade monoammonium phosphate (MAP), chemical formula NH4H2PO4, granular, excluding high-purity MAP. Barge-loaded, U.S. point of shipment NOLA.
Product 2.--Standard-grade diammonium phosphate (DAP), chemical formula
(NH4)2(HPO4), granular. Barge-loaded, U.S. point of shipment NOLA. One U.S. producer (***) and seven importers provided usable pricing data for sales of
the requested products, although not all firms reported pricing for all products for all months.11 12 Pricing data reported by these firms accounted for approximately *** percent of U.S. producers’ shipments of phosphate fertilizers, *** percent of U.S. shipments of subject imports from Morocco, *** percent of U.S. shipments of subject imports from Russia, and *** percent of U.S. shipments of all subject imports in 2019.13
When asked specifically if they offer rebates based on annual sales volume or any other product or service sold by their firm, one U.S. producer (***) and one importer (***) replied that they do. In explaining how they applied these rebates to their pricing data, ***.
Price data for products 1 and 2 are presented in tables V-4 and V-5 and figures V-2 and V-3. Appendix F presents monthly import unit values and quantities for MAP and DAP imported into NOLA from subject countries and Saudi Arabia.
11 Per-unit pricing data are calculated from total quantity and total value data provided by U.S. producers and importers. The precision and variation of these figures may be affected by rounding, limited quantities, and producer or importer estimates.
12 ***. On a country specific basis, six importers provided usable pricing data for sales of their imports from Morocco, and seven importers provided usable pricing data for sales of their imports from Russia.
13 Pricing coverage is based on U.S. shipments reported in questionnaires.
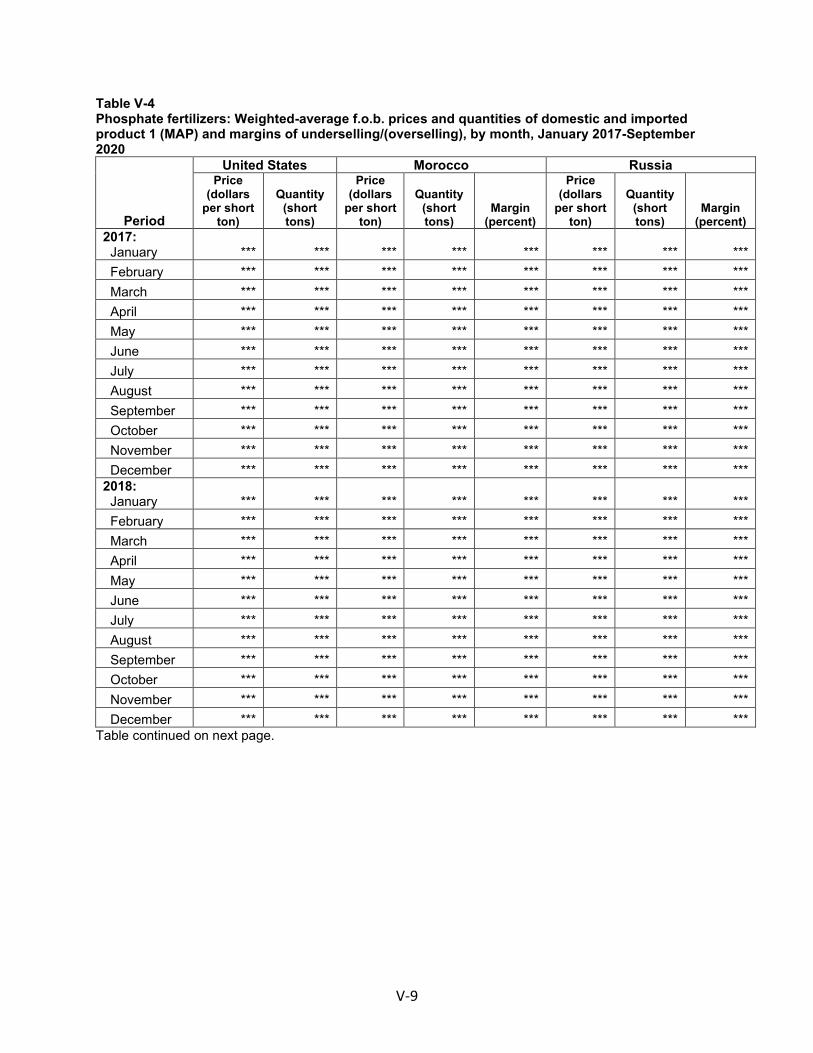
V-9
Table V-4 Phosphate fertilizers: Weighted-average f.o.b. prices and quantities of domestic and imported product 1 (MAP) and margins of underselling/(overselling), by month, January 2017-September 2020
Period
United States Morocco Russia Price
(dollars per short
ton)
Quantity (short tons)
Price (dollars
per short ton)
Quantity (short tons)
Margin (percent)
Price (dollars
per short ton)
Quantity (short tons)
Margin (percent)
2017: January *** *** *** *** *** *** *** *** February *** *** *** *** *** *** *** *** March *** *** *** *** *** *** *** *** April *** *** *** *** *** *** *** *** May *** *** *** *** *** *** *** *** June *** *** *** *** *** *** *** *** July *** *** *** *** *** *** *** *** August *** *** *** *** *** *** *** *** September *** *** *** *** *** *** *** *** October *** *** *** *** *** *** *** *** November *** *** *** *** *** *** *** *** December *** *** *** *** *** *** *** *** 2018: January *** *** *** *** *** *** *** *** February *** *** *** *** *** *** *** *** March *** *** *** *** *** *** *** *** April *** *** *** *** *** *** *** *** May *** *** *** *** *** *** *** *** June *** *** *** *** *** *** *** *** July *** *** *** *** *** *** *** *** August *** *** *** *** *** *** *** *** September *** *** *** *** *** *** *** *** October *** *** *** *** *** *** *** *** November *** *** *** *** *** *** *** *** December *** *** *** *** *** *** *** ***
Table continued on next page.

V-10
Table V-4--Continued Phosphate fertilizers: Weighted-average f.o.b. prices and quantities of domestic and imported product 1 (MAP) and margins of underselling/(overselling), by month, January 2017-September 2020
Period
United States Morocco Russia Price
(dollars per short
ton)
Quantity (short tons)
Price (dollars
per short ton)
Quantity (short tons)
Margin (percent)
Price (dollars
per short ton)
Quantity (short tons)
Margin (percent)
2019: January *** *** *** *** *** *** *** *** February *** *** *** *** *** *** *** *** March *** *** *** *** *** *** *** *** April *** *** *** *** *** *** *** *** May *** *** *** *** *** *** *** *** June *** *** *** *** *** *** *** *** July *** *** *** *** *** *** *** *** August *** *** *** *** *** *** *** *** September *** *** *** *** *** *** *** *** October *** *** *** *** *** *** *** *** November *** *** *** *** *** *** *** *** December *** *** *** *** *** *** *** *** 2020: January *** *** *** *** *** *** *** *** February *** *** *** *** *** *** *** *** March *** *** *** *** *** *** *** *** April *** *** *** *** *** *** *** *** May *** *** *** *** *** *** *** *** June *** *** *** *** *** *** *** *** July *** *** *** *** *** *** *** *** August *** *** *** *** *** *** *** *** September *** *** *** *** *** *** *** ***
Note: Product 1: Standard-grade monoammonium phosphate (MAP), chemical formula NH4H2PO4, granular, excluding high-purity MAP. Barge-loaded, U.S. point of shipment NOLA. Source: Compiled from data submitted in response to Commission questionnaires.

V-11
Table V-5 Phosphate fertilizers: Weighted-average f.o.b. prices and quantities of domestic and imported product 2 (DAP) and margins of underselling/(overselling), by month, January 2017-September 2020
Period
United States Morocco Russia Price
(dollars per short
ton)
Quantity (short tons)
Price (dollars
per short ton)
Quantity (short tons)
Margin (percent)
Price (dollars
per short ton)
Quantity (short tons)
Margin (percent)
2017: January *** *** *** *** *** *** *** *** February *** *** *** *** *** *** *** *** March *** *** *** *** *** *** *** *** April *** *** *** *** *** *** *** *** May *** *** *** *** *** *** *** *** June *** *** *** *** *** *** *** *** July *** *** *** *** *** *** *** *** August *** *** *** *** *** *** *** *** September *** *** *** *** *** *** *** *** October *** *** *** *** *** *** *** *** November *** *** *** *** *** *** *** *** December *** *** *** *** *** *** *** *** 2018: January *** *** *** *** *** *** *** *** February *** *** *** *** *** *** *** *** March *** *** *** *** *** *** *** *** April *** *** *** *** *** *** *** *** May *** *** *** *** *** *** *** *** June *** *** *** *** *** *** *** *** July *** *** *** *** *** *** *** *** August *** *** *** *** *** *** *** *** September *** *** *** *** *** *** *** *** October *** *** *** *** *** *** *** *** November *** *** *** *** *** *** *** *** December *** *** *** *** *** *** *** ***
Table continued on next page.
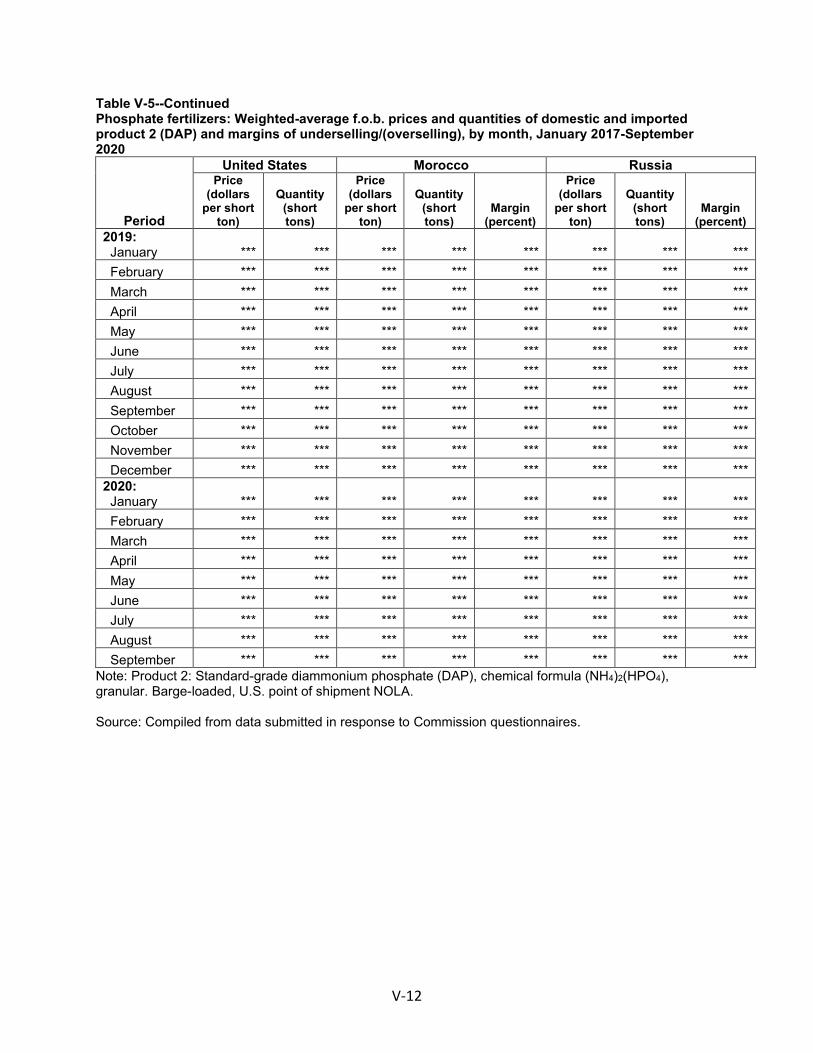
V-12
Table V-5--Continued Phosphate fertilizers: Weighted-average f.o.b. prices and quantities of domestic and imported product 2 (DAP) and margins of underselling/(overselling), by month, January 2017-September 2020
Period
United States Morocco Russia Price
(dollars per short
ton)
Quantity (short tons)
Price (dollars
per short ton)
Quantity (short tons)
Margin (percent)
Price (dollars
per short ton)
Quantity (short tons)
Margin (percent)
2019: January *** *** *** *** *** *** *** *** February *** *** *** *** *** *** *** *** March *** *** *** *** *** *** *** *** April *** *** *** *** *** *** *** *** May *** *** *** *** *** *** *** *** June *** *** *** *** *** *** *** *** July *** *** *** *** *** *** *** *** August *** *** *** *** *** *** *** *** September *** *** *** *** *** *** *** *** October *** *** *** *** *** *** *** *** November *** *** *** *** *** *** *** *** December *** *** *** *** *** *** *** *** 2020: January *** *** *** *** *** *** *** *** February *** *** *** *** *** *** *** *** March *** *** *** *** *** *** *** *** April *** *** *** *** *** *** *** *** May *** *** *** *** *** *** *** *** June *** *** *** *** *** *** *** *** July *** *** *** *** *** *** *** *** August *** *** *** *** *** *** *** *** September *** *** *** *** *** *** *** ***
Note: Product 2: Standard-grade diammonium phosphate (DAP), chemical formula (NH4)2(HPO4), granular. Barge-loaded, U.S. point of shipment NOLA. Source: Compiled from data submitted in response to Commission questionnaires.

V-13
Figure V-2 Phosphate fertilizers: Weighted-average prices and quantities of domestic and imported product 1 (MAP), by month, January 2017-September 2020
* * * * * * *
* * * * * * *
Note: Product 1: Standard-grade monoammonium phosphate (MAP), chemical formula NH4H2PO4, granular, excluding high-purity MAP. Barge-loaded, U.S. point of shipment NOLA. Source: Compiled from data submitted in response to Commission questionnaires.
V-14
Figure V-3 Phosphate fertilizers: Weighted-average prices and quantities of domestic and imported product 2 (DAP), by month, January 2017-September 2020
* * * * * * *
* * * * * * *
Note: Product 2: Standard-grade diammonium phosphate (DAP), chemical formula (NH4)2(HPO4), granular. Barge-loaded, U.S. point of shipment NOLA. Source: Compiled from data submitted in response to Commission questionnaires.

V-15
Price trends
In general, prices increased during January 2017-September 2020, with increases in 2017 and most of 2018, decreases in 2019, and increases in 2020. Table V-6 summarizes the price trends, by country and by product. As shown in the table, domestic price increases were *** percent for product 1 and *** percent for product 2 during January 2017-September 2020, while subject import price increases ranged from 6.6 percent (for ***) to 9.6 percent (for ***). Prices for *** decreased by *** percent during January 2017-September 2020.
Table V-6 Phosphate fertilizers: Summary of weighted-average f.o.b. prices for products 1 and 2 from the United States, Morocco, and Russia
Item Number of quarters
Low price (dollars per short ton)
High price (dollars per short ton)
Change in price (percent)
Product 1: United States *** *** *** *** Morocco *** *** *** *** Russia *** *** *** *** Product 2: United States *** *** *** *** Morocco *** *** *** *** Russia *** *** *** ***
Note: Percentage change from the first quarter in which data were available to the last quarter in which price data were available. Source: Compiled from data submitted in response to Commission questionnaires.
As shown in figure V-4, U.S. producer and subject import prices followed the same general trends and tracked fairly closely. The highest prices for both pricing products from each source occurred during October-November of 2018, while the lowest prices for domestic producers occurred in December 2019 and the lowest prices for subject imports occurred between January 2020 (for product 2) and February 2020 (for product 1).

V-16
Figure V-4 Phosphate fertilizers: Indexed U.S. producer and import prices, January 2017-September 2020
Source: Compiled from data submitted in response to Commission questionnaires.
50.0
60.0
70.0
80.0
90.0
100.0
110.0
120.0
130.0
140.0
150.0Ja
nFe
bM
ar Apr
May Jun
Jul
Aug
Sep
Oct
Nov
Dec Jan
Feb
Mar Apr
May Jun
Jul
Aug
Sep
Oct
Nov
Dec Jan
Feb
Mar Apr
May Jun
Jul
Aug
Sep
Oct
Nov
Dec Jan
Feb
Mar Apr
May Jun
Jul
Aug
Sep
2017 2018 2019 2020
Inde
xed
pric
es(J
an.-M
ar. 2
017
= 10
0.0)
U.S. producers
Product 1 Product 2
50.0
60.0
70.0
80.0
90.0
100.0
110.0
120.0
130.0
140.0
150.0
Jan
Feb
Mar Apr
May Jun
Jul
Aug
Sep
Oct
Nov
Dec Jan
Feb
Mar Apr
May Jun
Jul
Aug
Sep
Oct
Nov
Dec Jan
Feb
Mar Apr
May Jun
Jul
Aug
Sep
Oct
Nov
Dec Jan
Feb
Mar Apr
May Jun
Jul
Aug
Sep
2017 2018 2019 2020
Inde
xed
pric
es(J
an.-M
ar. 2
017
= 10
0.0)
Subject U.S. importers
Product 1 Product 2
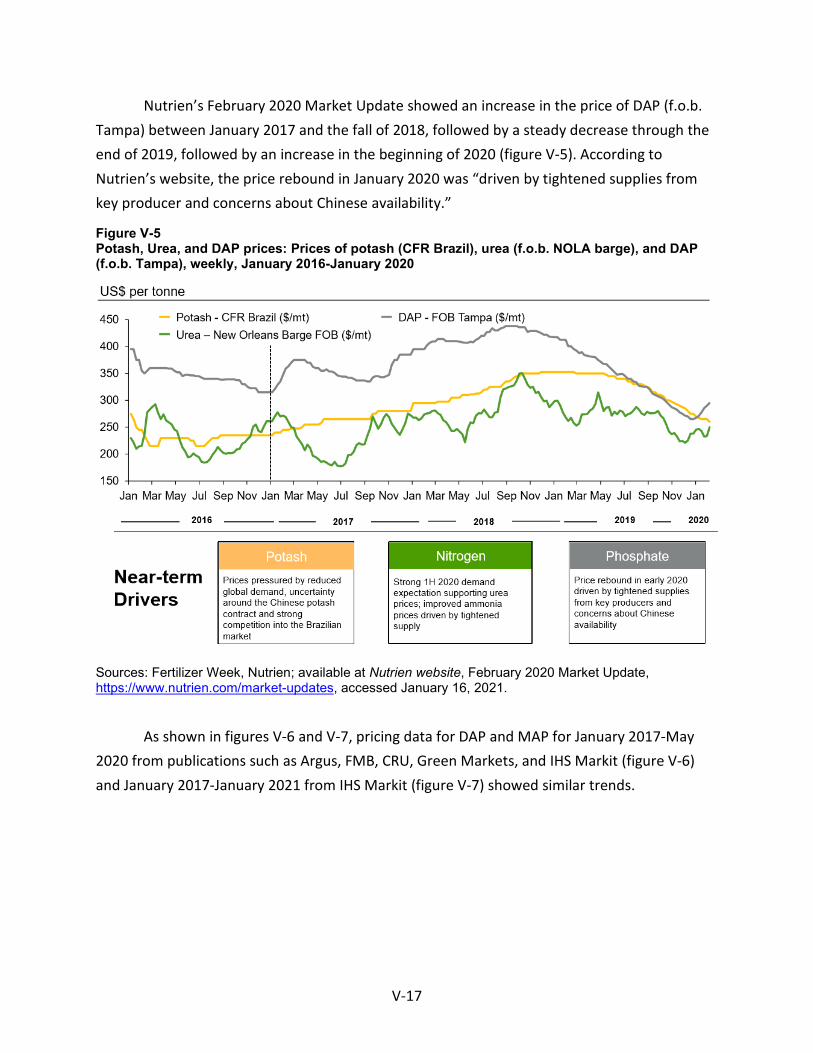
V-17
Nutrien’s February 2020 Market Update showed an increase in the price of DAP (f.o.b. Tampa) between January 2017 and the fall of 2018, followed by a steady decrease through the end of 2019, followed by an increase in the beginning of 2020 (figure V-5). According to Nutrien’s website, the price rebound in January 2020 was “driven by tightened supplies from key producer and concerns about Chinese availability.”
Figure V-5 Potash, Urea, and DAP prices: Prices of potash (CFR Brazil), urea (f.o.b. NOLA barge), and DAP (f.o.b. Tampa), weekly, January 2016-January 2020
Sources: Fertilizer Week, Nutrien; available at Nutrien website, February 2020 Market Update, https://www.nutrien.com/market-updates, accessed January 16, 2021.
As shown in figures V-6 and V-7, pricing data for DAP and MAP for January 2017-May 2020 from publications such as Argus, FMB, CRU, Green Markets, and IHS Markit (figure V-6) and January 2017-January 2021 from IHS Markit (figure V-7) showed similar trends.
V-18
Figure V-6 Phosphate fertilizers: Published prices for DAP and MAP, monthly, January 2017-May 2020
* * * * * * * Source: Petitioner’s postconference brief, exhibit 37, based on Argus, FMB, CRU (Fertilizer Week), Bloomberg Green Markets, and IHS Markit (Ferticon).
Figure V-7 Phosphate fertilizers: Published prices for China, Brazil, India, and NOLA, January 2017-January 2021
Note: “The chart shows market prices for DAP for all areas except for Brazil, which is a MAP market. As MAP generally sells at a $5-10 premium per ST to DAP, the Brazil price is generally above the other regions.” Koch’s posthearing brief, p. 6 Source: IHS Markit Global Trade Atlas, via Koch’s posthearing brief, p. 6.

V-19
Price comparisons
As shown in table V-7, prices for phosphate fertilizers imported from Morocco and Russia were below those for U.S.-produced product in 34 of 170 instances (381,132 short tons); margins of underselling ranged from 0.02 to 4.4 percent. In the remaining 136 instances (2.0 million short tons), prices for product from Morocco and Russia were between 0.02 and 17.6 percent above prices for the domestic product.
Table V-7 Phosphate fertilizers: Instances of underselling/overselling and the range and average of margins, by country and product, January 2017-September 2020
Source Underselling
Number of quarters
Quantity (short tons)
Average margin
(percent)
Margin range (percent) Min Max
Morocco 16 *** *** *** *** Russia 18 *** *** *** *** Total 34 381,132 1.7 0.02 4.4 Product 1 20 *** *** *** *** Product 2 14 *** *** *** *** Total 34 381,132 1.7 0.02 4.4
Source (Overselling)
Number of quarters
Quantity (short tons)
Average margin
(percent)
Margin range (percent) Min Max
Morocco 72 *** *** *** *** Russia 64 *** *** *** *** Total 136 1,960,606 (3.7) (0.02) (17.6) Product 1 64 *** *** *** *** Product 2 72 *** *** *** *** Total 136 1,960,606 (3.7) (0.02) (17.6)
Note: These data include only quarters in which there is a comparison between the U.S. and subject product.
Source: Compiled from data submitted in response to Commission questionnaires.
Lost sales and lost revenue
In the preliminary phase of the investigations, the Commission requested that U.S. producers of phosphate fertilizers report purchasers with which they experienced instances of lost sales or revenue due to competition from imports of phosphate fertilizers from Morocco from January 2017 to March 2020. *** submitted lost sales and lost revenue allegations and
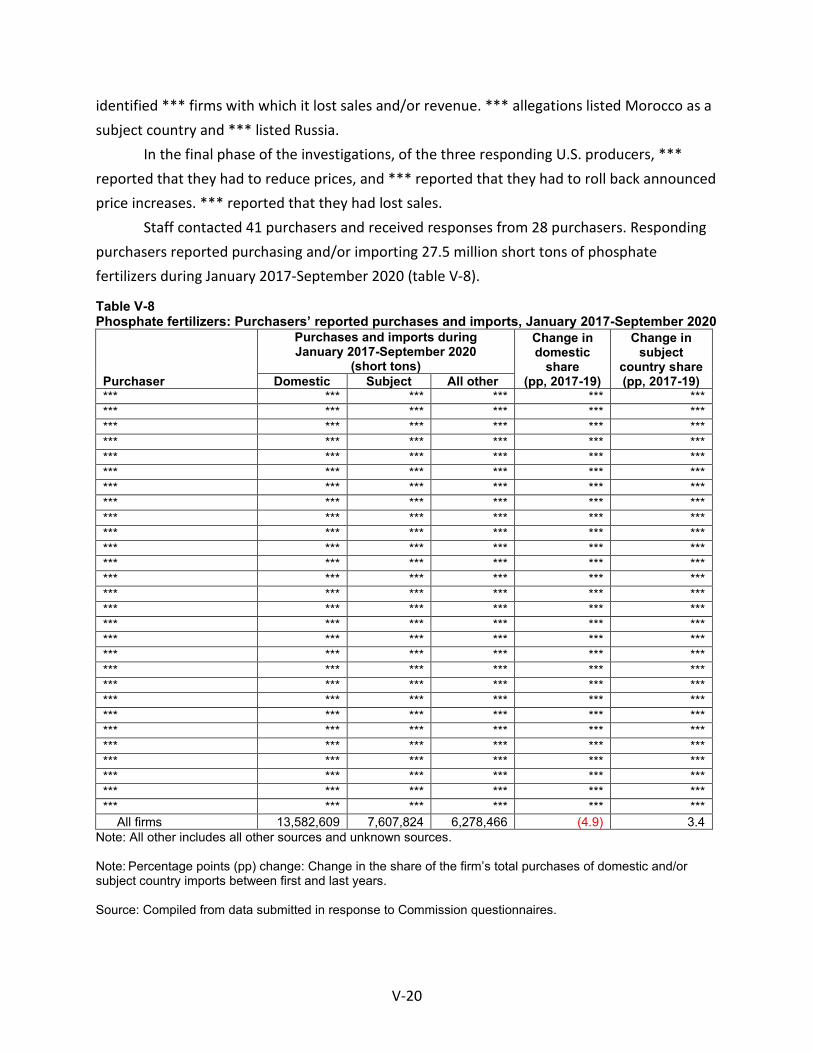
V-20
identified *** firms with which it lost sales and/or revenue. *** allegations listed Morocco as a subject country and *** listed Russia.
In the final phase of the investigations, of the three responding U.S. producers, *** reported that they had to reduce prices, and *** reported that they had to roll back announced price increases. *** reported that they had lost sales.
Staff contacted 41 purchasers and received responses from 28 purchasers. Responding purchasers reported purchasing and/or importing 27.5 million short tons of phosphate fertilizers during January 2017-September 2020 (table V-8).
Table V-8 Phosphate fertilizers: Purchasers’ reported purchases and imports, January 2017-September 2020
Purchaser
Purchases and imports during January 2017-September 2020
(short tons)
Change in domestic
share (pp, 2017-19)
Change in subject
country share (pp, 2017-19) Domestic Subject All other
*** *** *** *** *** *** *** *** *** *** *** *** *** *** *** *** *** *** *** *** *** *** *** *** *** *** *** *** *** *** *** *** *** *** *** *** *** *** *** *** *** *** *** *** *** *** *** *** *** *** *** *** *** *** *** *** *** *** *** *** *** *** *** *** *** *** *** *** *** *** *** *** *** *** *** *** *** *** *** *** *** *** *** *** *** *** *** *** *** *** *** *** *** *** *** *** *** *** *** *** *** *** *** *** *** *** *** *** *** *** *** *** *** *** *** *** *** *** *** *** *** *** *** *** *** *** *** *** *** *** *** *** *** *** *** *** *** *** *** *** *** *** *** *** *** *** *** *** *** *** *** *** *** *** *** *** *** *** *** *** *** *** *** *** *** *** *** *** All firms 13,582,609 7,607,824 6,278,466 (4.9) 3.4
Note: All other includes all other sources and unknown sources. Note: Percentage points (pp) change: Change in the share of the firm’s total purchases of domestic and/or subject country imports between first and last years. Source: Compiled from data submitted in response to Commission questionnaires.
V-21
Of the 28 responding purchasers, 17 reported that they had purchased imported phosphate fertilizers from Morocco and/or Russia instead of U.S.-produced product since 2017 (table V-9); 15 reported purchasing and/or importing phosphate fertilizers from Morocco instead of domestic product, and 14 reported purchasing and/or importing phosphate fertilizers from Russia instead of domestic product. Nine of these purchasers reported that subject import prices were lower than prices of U.S.-produced product, and eight reported that they were not. On a country specific basis, eight firms reported that prices of Moroccan product were lower than domestic product (eight reported that they were not), and seven firms reported that prices of Russian product were lower than domestic product (eight reported that they were not). Five purchasers reported that price was a primary reason for the decision to purchase imported product rather than U.S.-produced product; five reported that this was the case for their purchases/imports of Moroccan product (while 8 reported that it was not), and five reported that this was the case for their purchases/imports of Russian product (while 7 reported that it was not). Four purchasers estimated the quantity of phosphate fertilizers from Morocco and Russia purchased instead of domestic product; quantities ranged from *** short tons to *** short tons, for a total of 733,895 short tons (tables V-9 and V-10).14
Purchasers identified the following as non-price reasons for purchasing phosphate fertilizers imported from subject countries rather than U.S.-produced product: availability, reliability of supply, the supplier of Moroccan product was a trusted supplier, and more factors than price being considered when purchasing phosphate fertilizer. One firm added that sometimes the price of Moroccan product was higher than domestic product and sometimes it was lower depending on market conditions.
14 ***: “***.” Email from ***, February 5, 2021.
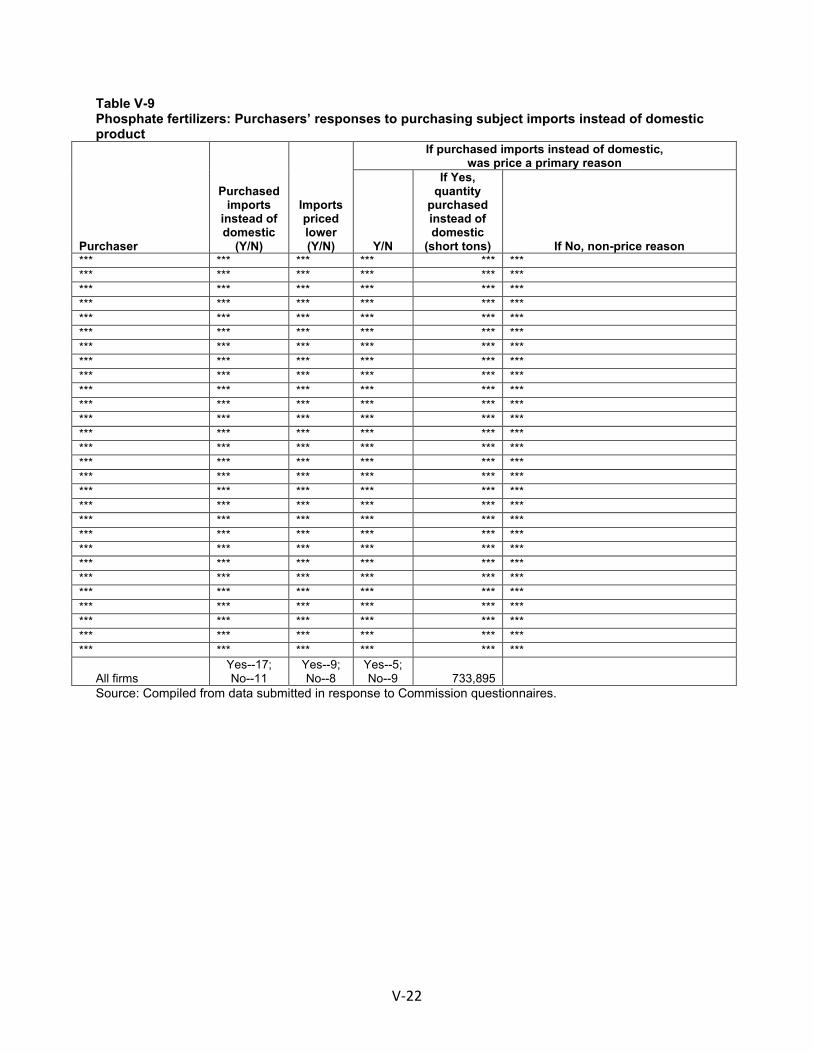
V-22
Table V-9 Phosphate fertilizers: Purchasers’ responses to purchasing subject imports instead of domestic product
Purchaser
Purchased imports
instead of domestic
(Y/N)
Imports priced lower (Y/N)
If purchased imports instead of domestic, was price a primary reason
Y/N
If Yes, quantity
purchased instead of domestic
(short tons) If No, non-price reason *** *** *** *** *** *** *** *** *** *** *** *** *** *** *** *** *** *** *** *** *** *** *** *** *** *** *** *** *** *** *** *** *** *** *** *** *** *** *** *** *** *** *** *** *** *** *** *** *** *** *** *** *** *** *** *** *** *** *** *** *** *** *** *** *** *** *** *** *** *** *** *** *** *** *** *** *** *** *** *** *** *** *** *** *** *** *** *** *** *** *** *** *** *** *** *** *** *** *** *** *** *** *** *** *** *** *** *** *** *** *** *** *** *** *** *** *** *** *** *** *** *** *** *** *** *** *** *** *** *** *** *** *** *** *** *** *** *** *** *** *** *** *** *** *** *** *** *** *** *** *** *** *** *** *** *** *** *** *** *** *** *** *** *** *** *** *** ***
All firms Yes--17; No--11
Yes--9; No--8
Yes--5; No--9 733,895
Source: Compiled from data submitted in response to Commission questionnaires.
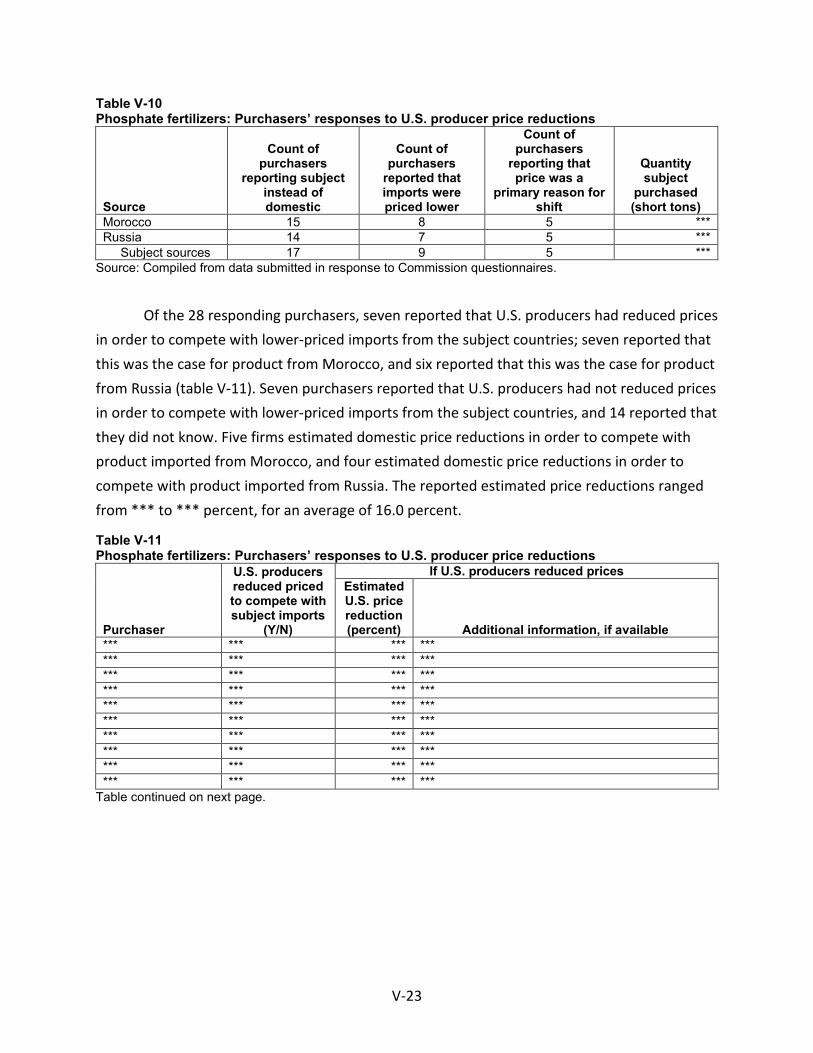
V-23
Table V-10 Phosphate fertilizers: Purchasers’ responses to U.S. producer price reductions
Source
Count of purchasers
reporting subject instead of domestic
Count of purchasers
reported that imports were priced lower
Count of purchasers
reporting that price was a
primary reason for shift
Quantity subject
purchased (short tons)
Morocco 15 8 5 *** Russia 14 7 5 *** Subject sources 17 9 5 ***
Source: Compiled from data submitted in response to Commission questionnaires.
Of the 28 responding purchasers, seven reported that U.S. producers had reduced prices in order to compete with lower-priced imports from the subject countries; seven reported that this was the case for product from Morocco, and six reported that this was the case for product from Russia (table V-11). Seven purchasers reported that U.S. producers had not reduced prices in order to compete with lower-priced imports from the subject countries, and 14 reported that they did not know. Five firms estimated domestic price reductions in order to compete with product imported from Morocco, and four estimated domestic price reductions in order to compete with product imported from Russia. The reported estimated price reductions ranged from *** to *** percent, for an average of 16.0 percent.
Table V-11 Phosphate fertilizers: Purchasers’ responses to U.S. producer price reductions
Purchaser
U.S. producers reduced priced to compete with subject imports
(Y/N)
If U.S. producers reduced prices Estimated U.S. price reduction (percent) Additional information, if available
*** *** *** *** *** *** *** *** *** *** *** *** *** *** *** *** *** *** *** *** *** *** *** *** *** *** *** *** *** *** *** *** *** *** *** *** *** *** *** ***
Table continued on next page.
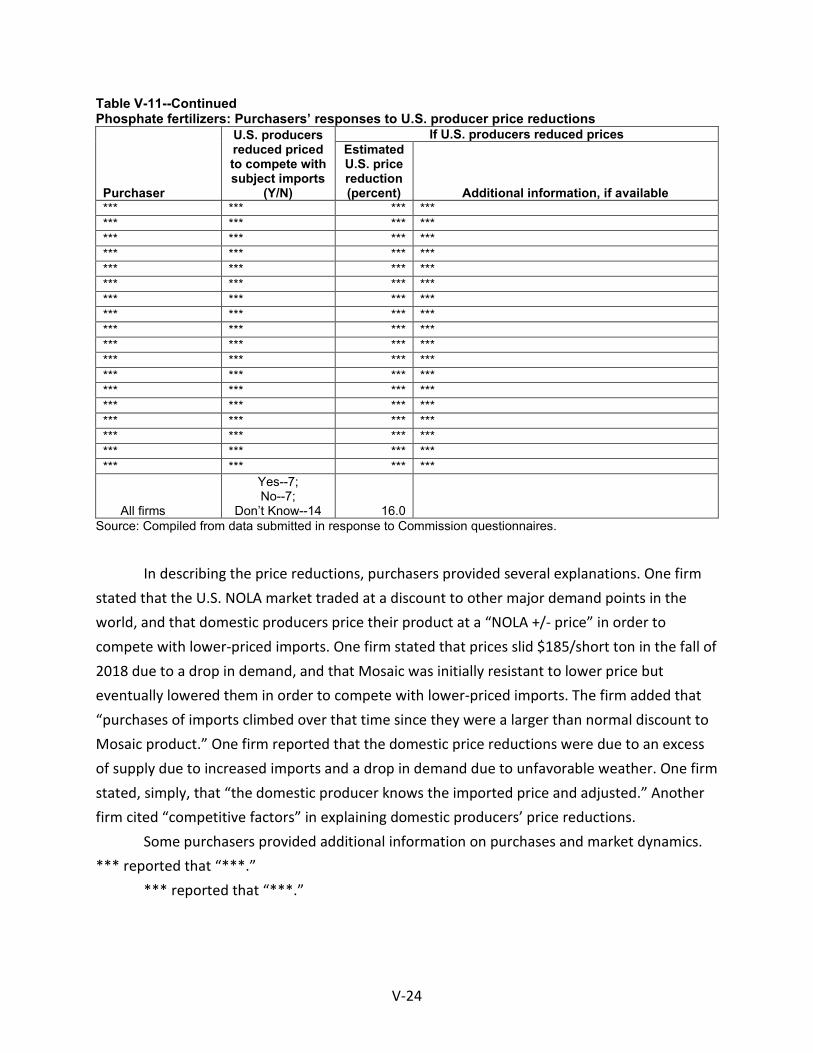
V-24
Table V-11--Continued Phosphate fertilizers: Purchasers’ responses to U.S. producer price reductions
Purchaser
U.S. producers reduced priced to compete with subject imports
(Y/N)
If U.S. producers reduced prices Estimated U.S. price reduction (percent) Additional information, if available
*** *** *** *** *** *** *** *** *** *** *** *** *** *** *** *** *** *** *** *** *** *** *** *** *** *** *** *** *** *** *** *** *** *** *** *** *** *** *** *** *** *** *** *** *** *** *** *** *** *** *** *** *** *** *** *** *** *** *** *** *** *** *** *** *** *** *** *** *** *** *** ***
All firms
Yes--7; No--7;
Don’t Know--14 16.0 Source: Compiled from data submitted in response to Commission questionnaires.
In describing the price reductions, purchasers provided several explanations. One firm stated that the U.S. NOLA market traded at a discount to other major demand points in the world, and that domestic producers price their product at a “NOLA +/- price” in order to compete with lower-priced imports. One firm stated that prices slid $185/short ton in the fall of 2018 due to a drop in demand, and that Mosaic was initially resistant to lower price but eventually lowered them in order to compete with lower-priced imports. The firm added that “purchases of imports climbed over that time since they were a larger than normal discount to Mosaic product.” One firm reported that the domestic price reductions were due to an excess of supply due to increased imports and a drop in demand due to unfavorable weather. One firm stated, simply, that “the domestic producer knows the imported price and adjusted.” Another firm cited “competitive factors” in explaining domestic producers’ price reductions.
Some purchasers provided additional information on purchases and market dynamics. *** reported that “***.”
*** reported that “***.”
VI-1
Part VI: Financial experience of U.S. producers
Background
Three firms provided usable financial results on their phosphate fertilizers operations. Two U.S. producers reported financial data on a GAAP basis and all three firms reported for calendar-year annual periods.1 In 2019, *** accounted for *** percent of the U.S. producers’ net sales by quantity, *** accounted for *** percent, and *** accounted for *** percent.2 Commercial sales accounted for the vast majority of reported phosphate fertilizers revenue, with transfers to related firms representing a relatively small share.3 Accordingly, the tables below present a combined revenue total.
Operations on phosphate fertilizers
Income-and-loss data for U.S. producers’ phosphate fertilizers operations are presented in table VI-1. Table VI-2 presents corresponding changes in average per short ton values (“AUVs”). Table VI-3 presents selected company-specific financial data.
1 *** used International Financial Reporting Standards as its accounting basis. *** has a fiscal year end of ***, however its financial results were provided on a calendar year basis.
2 By value, *** accounted for *** percent of net sales, *** accounted for *** percent, and *** accounted for *** percent in 2019.
3 ***. U.S. producer’s questionnaire response of ***, question II-12.

VI-2
Table VI-1 Phosphate fertilizers: Results of operations of U.S. producers, 2017-19, January to September 2019, and January to September 2020
Item Calendar year January to September
2017 2018 2019 2019 2020 Quantity (short tons) Total net sales *** *** *** *** *** Value (1,000 dollars) Total net sales *** *** *** *** *** Cost of goods sold.-- Raw materials *** *** *** *** ***
Direct labor *** *** *** *** *** Other factory costs *** *** *** *** *** Less: by-product revenue *** *** *** *** ***
Total COGS *** *** *** *** *** Gross profit *** *** *** *** *** SG&A expense *** *** *** *** *** Operating income or (loss) *** *** *** *** *** All other expense, net *** *** *** *** *** Net income or (loss) *** *** *** *** *** Depreciation/amortization *** *** *** *** *** Cash flow *** *** *** *** *** Ratio to net sales (percent) Cost of goods sold.-- Raw materials *** *** *** *** ***
Direct labor *** *** *** *** *** Other factory costs *** *** *** *** *** Less: by-product revenue
Average COGS *** *** *** *** *** Gross profit *** *** *** *** *** SG&A expense *** *** *** *** *** Operating income or (loss) *** *** *** *** *** Net income or (loss) *** *** *** *** *** Ratio to total COGS (percent) Cost of goods sold before byproduct offset.-- Raw materials *** *** *** *** ***
Direct labor *** *** *** *** *** Other factory costs *** *** *** *** ***
Average COGS *** *** *** *** *** Table continued on next page.

VI-3
Table VI-1—Continued Phosphate fertilizers: Results of operations of U.S. producers, 2017-19, January to September 2019, and January to September 2020
Item Calendar year January to September
2017 2018 2019 2019 2020 Unit value (dollars per short ton)
Total net sales *** *** *** *** *** Cost of goods sold.-- Raw materials *** *** *** *** ***
Direct labor *** *** *** *** *** Other factory costs *** *** *** *** *** Less: by-product revenue *** *** *** *** ***
Average COGS *** *** *** *** *** Gross profit *** *** *** *** *** SG&A expense *** *** *** *** *** Operating income or (loss) *** *** *** *** *** Net income or (loss) *** *** *** *** *** Number of firms reporting Operating losses *** *** *** *** *** Net losses *** *** *** *** *** Data *** *** *** *** ***
Source: Compiled from data submitted in response to Commission questionnaires. Table VI-2 Phosphate fertilizers: Changes in AUVs, between calendar years and between partial year periods
Item Between calendar years
Between partial year
period 2017-19 2017-18 2018-19 2019-20
Change in AUVs (percent) Total net sales *** *** *** *** Cost of goods sold.-- Raw materials *** *** *** ***
Direct labor *** *** *** *** Other factory costs *** *** *** ***
Average COGS *** *** *** *** Change in AUVs (dollars per short ton)
Total net sales *** *** *** *** Cost of goods sold.-- Raw materials *** *** *** ***
Direct labor *** *** *** *** Other factory costs *** *** *** ***
Average COGS *** *** *** *** Gross profit *** *** *** *** SG&A expense *** *** *** *** Operating income or (loss) *** *** *** *** Net income or (loss) *** *** *** ***
Source: Compiled from data submitted in response to Commission questionnaires.
VI-4
Table VI-3 Phosphate fertilizers: Select results of operations of U.S. producers, by company, 2017-19, January to September 2019, and January to September 2020
Item Calendar year January to September
2017 2018 2019 2019 2020 Total net sales (short tons) *** *** *** *** *** *** *** *** *** *** *** *** *** *** *** *** *** ***
All firms *** *** *** *** *** Total net sales (1,000 dollars) *** *** *** *** *** *** *** *** *** *** *** *** *** *** *** *** *** ***
All firms *** *** *** *** *** Cost of goods sold (1,000 dollars) *** *** *** *** *** *** *** *** *** *** *** *** *** *** *** *** *** ***
All firms *** *** *** *** *** Gross profit or (loss) (1,000 dollars) *** *** *** *** *** *** *** *** *** *** *** *** *** *** *** *** *** ***
All firms *** *** *** *** *** SG&A expenses (1,000 dollars) *** *** *** *** *** *** *** *** *** *** *** *** *** *** *** *** *** ***
All firms *** *** *** *** *** Operating income or (loss) (1,000 dollars) *** *** *** *** *** *** *** *** *** *** *** *** *** *** *** *** *** ***
All firms *** *** *** *** *** Net income or (loss) (1,000 dollars)
*** *** *** *** *** *** *** *** *** *** *** *** *** *** *** *** *** ***
All firms *** *** *** *** *** Table continued on next page.

VI-5
Table VI-3—Continued Phosphate fertilizers: Select results of operations of U.S. producers, by company, 2017-19, January to September 2019, and January to September 2020
Item Calendar year January to September
2017 2018 2019 2019 2020 COGS to net sales ratio (percent)
*** *** *** *** *** *** *** *** *** *** *** *** *** *** *** *** *** ***
All firms *** *** *** *** *** Gross profit or (loss) to net sales ratio (percent) *** *** *** *** *** *** *** *** *** *** *** *** *** *** *** *** *** ***
All firms *** *** *** *** *** SG&A expense to net sales ratio (percent) *** *** *** *** *** *** *** *** *** *** *** *** *** *** *** *** *** ***
All firms *** *** *** *** *** Operating income or (loss) to net sales ratio (percent) *** *** *** *** *** *** *** *** *** *** *** *** *** *** *** *** *** ***
All firms *** *** *** *** *** Net income or (loss) to net sales ratio (percent) *** *** *** *** *** *** *** *** *** *** *** *** *** *** *** *** *** ***
All firms *** *** *** *** *** Unit net sales value (dollars per short ton)
*** *** *** *** *** *** *** *** *** *** *** *** *** *** *** *** *** ***
All firms *** *** *** *** *** Unit raw materials (dollars per short ton)
*** *** *** *** *** *** *** *** *** *** *** *** *** *** *** *** *** ***
All firms *** *** *** *** *** Table continued on next page.

VI-6
Table VI-3—Continued Phosphate fertilizers: Select results of operations of U.S. producers, by company, 2017-19, January to September 2019, and January to September 2020
Item Calendar year January to September
2017 2018 2019 2019 2020 Unit direct labor (dollars per short ton) *** *** *** *** *** *** *** *** *** *** *** *** *** *** *** *** *** ***
All firms *** *** *** *** *** Unit other factory costs (dollars per short ton) *** *** *** *** *** *** *** *** *** *** *** *** *** *** *** *** *** ***
All firms *** *** *** *** *** Unit COGS (dollars per short ton) *** *** *** *** *** *** *** *** *** *** *** *** *** *** *** *** *** ***
All firms *** *** *** *** *** Unit gross profit or (loss) (dollars per short ton) *** *** *** *** *** *** *** *** *** *** *** *** *** *** *** *** *** ***
All firms *** *** *** *** *** Unit SG&A expenses (dollars per short ton)
*** *** *** *** *** *** *** *** *** *** *** *** *** *** *** *** *** ***
All firms *** *** *** *** *** Unit operating income or (loss) (dollars per short ton)
*** *** *** *** *** *** *** *** *** *** *** *** *** *** *** *** *** ***
All firms *** *** *** *** *** Unit net income or (loss) (dollars per short ton)
*** *** *** *** *** *** *** *** *** *** *** *** *** *** *** *** *** ***
All firms *** *** *** *** *** Source: Compiled from data submitted in response to Commission questionnaires.

VI-7
Net sales
As shown in table VI-1, total net sales by quantity declined from 2017 to 2019 while total net sales value increased from 2017 to 2018, then declined in 2019 to a level below that of 2017. Total net sales quantity was higher in January-September 2020 compared to the same period in 2019, while total net sales value was lower between the comparable interim periods. As shown in table VI-3, ***.4
U.S. producers’ net sales AUV increased from $*** in 2017 to $*** in 2018 but declined to $*** in 2019. U.S. producers’ net sales AUV was lower in January-September 2020 ($***) than in January-September 2019 ($***). ***.5 *** U.S producers reported lower net sales AUVs in January-September 2020 compared to January-September 2019. ***.6
4 Mosaic reported net sales of $8.9 billion and an operating loss of $1.1 billion for its consolidated business in 2019. The phosphates segment reported net sales of $3.2 billion and an operating loss of $1.1 billion in 2019, accounting for approximately 36.4 percent and 103.3 percent of Mosaic’s total sales and operating loss, respectively. Mosaic’s 2019 Annual Report and Form 10K p. 90 (as filed). Operating margins for Mosaic corporate and phosphates segment were negative 12.3 percent and negative 34.9 percent in 2019, respectively.
5 *** U.S producers reported higher net sales AUVs in 2018 compared to 2017. ***. Email from ***, January 12, 2021. ***. Email from ***, January 12, 2021. ***. Email from ***, January 12, 2021.
6 ***. Emails from ***, January 12 and 20, 2021.
VI-8
Cost of goods sold and gross profit or loss
As seen in table VI-1, other factory costs (“OFC”) were the largest component of phosphate fertilizers’ cost of goods sold (“COGS”) throughout 2017-19 and during both interim periods. It accounted for between *** percent (January-September 2019) and *** percent (January-September 2020) of total COGS. The average per unit OFC increased from $*** in 2017 to $*** in 2019 and were lower between the comparable interim periods. ***.7
Raw material costs were the second largest component of COGS representing between *** percent (2017) and *** percent (2018 and January-September 2019). The average per unit raw material costs increased from $*** in 2017 to $*** in 2019 but were lower between the comparable interim periods. ***.8 Raw materials consist of phosphate rock, sulfur, ammonia, and other material inputs such as ***. ***.9 Table VI-4 presents a break-out of the raw material costs, by type, for calendar year 2019.10
7 ***. Email from ***, January 12, 2021. 8 ***. Email from ***, January 12, 2021. ***. Email from ***, January 12, 2021. 9 ***. U.S. producer’s questionnaire responses of ***, question III-7. 10 ***. Email from ***, January 12, 2021.

VI-9
Table VI-4 Phosphate fertilizers: Raw material costs, by type, 2019
Raw materials
Calendar 2019
Value (1,000 dollars)
Unit value (dollars per short ton)
Share of value (percent)
Phosphate rock *** *** *** Sulfur *** *** *** Ammonia *** *** *** Other material inputs *** *** ***
Total, raw materials *** *** *** Source: Compiled from data submitted in response to Commission questionnaires.
Finally, direct labor represented between *** percent (2019) and *** percent (2017) of
total COGS. The average per unit direct labor costs declined from $*** in 2017 and 2018 to $*** in 2019 and were lower between the comparable interim periods.
By-product revenue due to the sale or consumption of *** produced during the course of producing phosphate fertilizers represented *** percent (in January-September 2020) to *** percent (in 2017) of total revenue (net sales value plus by-product revenue) during the reporting period.11
The average COGS to net sales ratio irregularly increased from *** percent in 2017 to *** percent in 2019 and was higher in January-September 2020 compared to January-September 2019 driven by increased and higher raw material costs and other factory costs to net sales ratios.
As shown in table VI-1, the industry’s gross profit increased from $*** in 2017 to $*** in 2018 but declined to *** in 2019 because the decline in net sales value along with the decline in sales volume exceeded the corresponding decline in COGS. The industry’s gross profit was lower in January-September 2020 (***) compared to January-September 2019 (***) which primarily reflects net sales values that declined more than COGS. Gross margin (gross profit as a ratio to net sales) increased from *** percent in 2017 to *** percent in 2018 to but declined to *** percent in 2019. Gross margin was lower in January-September 2020 compared to January-September 2019. ***.
11 *** is the only firm which reported by-product revenue during the reporting period. Email from ***, January 13, 2021.
VI-10
SG&A expenses and operating income or loss
Total SG&A expenses declined from $*** in 2017 to $*** in 2019 but were higher in January-September 2020 compared to January-September 2019. The SG&A expenses ratio (SG&A expenses as a share of sales) declined irregularly from *** percent in 2017 and *** percent 2019 and was higher in January-September 2020 compared to January-September 2019.12
Operating income increased from $*** in 2017 to $*** in 2018 but declined to *** in 2019. It was lower in January-September 2020 (***) compared to the same period in 2019 (***). The operating income ratio (operating income as a share of sales) increased from *** percent in 2017 to *** percent in 2018 but declined to *** percent in 2019. It was lower in January-September 2020 (*** percent) compared to the same period in 2019 (*** percent). Other expenses and net income or loss
Classified below the operating income level are interest expense, other expense, and other income. In table VI-1, these items are aggregated and only the net amount is shown. The industry reported an increase in net “all other expenses” from 2017 to 2019, but lower net “all other expenses” in January-September 2020 compared to January-September 2019. *** accounted for the vast majority of reported net “all other expenses” during the reporting period. ***.13
12 Mosaic reported SG&A expenses of $354.1 million and an SG&A expense ratio of 4.0 percent for its consolidated business in 2019. Mosaic’s 2019 Annual Report and Form 10K p. 5 (as filed).
13 U.S. producer’s questionnaire response of ***, question III-10. ***. Emails from ***, January 14, 2021. Mosaic’s consolidated financial statements listed the following items: $14.0 million related to an increase in its reserve for estimated costs associated with the sinkhole at its New Wales facility in 2017, due to refinements in its estimates as repairs progressed and because a portion of the sinkhole was determined to be wider than previously estimated; $52.0 million of net sales of assets in 2017 related to the sale of land near its Faustina, Louisiana facility; $20.0 million of restructuring expense related to the temporary idling of the Plant City phosphate manufacturing facility in 2017; $341.0 million of Plant City closure costs in 2019; and $589.0 million of goodwill impairment charge based on its annual impairment test. Mosaic’s 2017 Annual Report and Form 10K, pp. 16 and 23 (as filed); and 2019 Annual Report and Form 10K pp. 17 and 95 (as filed). ***. Email from ***, January 21, 2021.

VI-11
Net income increased from $*** in 2017 to $*** in 2018 but declined to *** in 2019. It was higher in January-September 2020 (***) compared to the same period in 2019 (***). Net income ratio (total net income divided by total net sales) increased from *** percent in 2017 to *** percent in 2018 but declined to *** percent in 2019. It was higher in January-September 2020 (*** percent) compared to the same period in 2019 (*** percent).
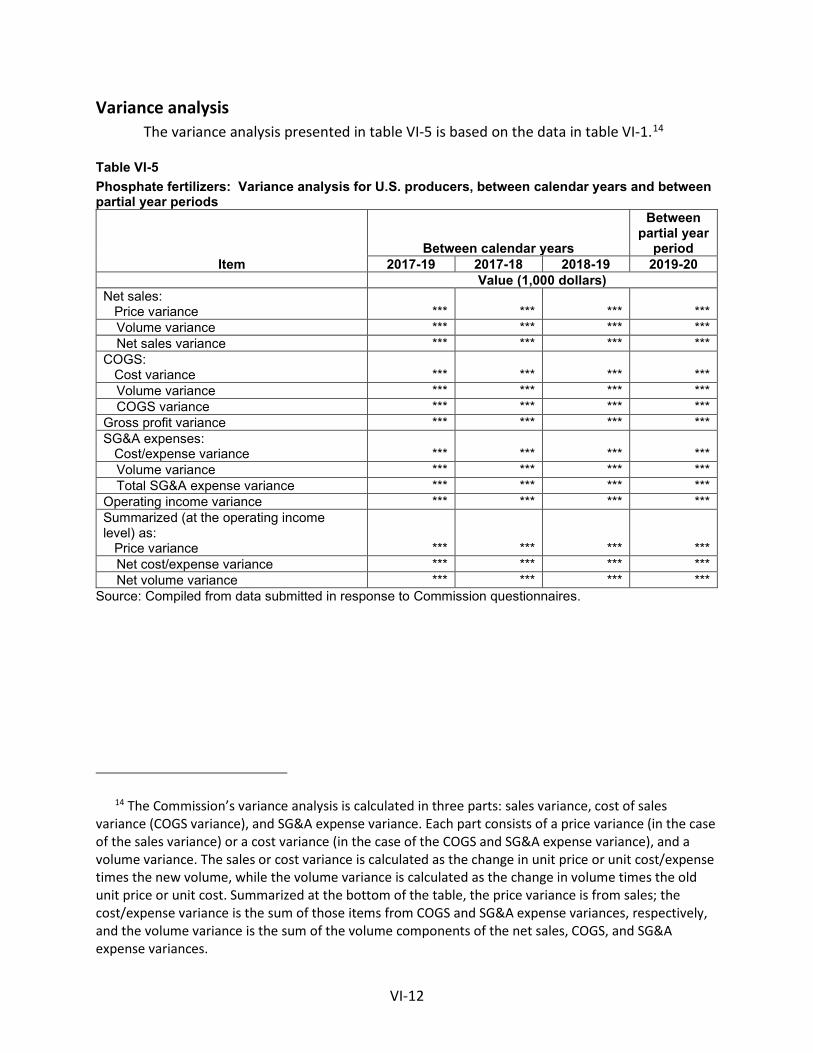
VI-12
Variance analysis The variance analysis presented in table VI-5 is based on the data in table VI-1.14
Table VI-5 Phosphate fertilizers: Variance analysis for U.S. producers, between calendar years and between partial year periods
Item Between calendar years
Between partial year
period 2017-19 2017-18 2018-19 2019-20
Value (1,000 dollars) Net sales: Price variance *** *** *** ***
Volume variance *** *** *** *** Net sales variance *** *** *** ***
COGS: Cost variance *** *** *** ***
Volume variance *** *** *** *** COGS variance *** *** *** ***
Gross profit variance *** *** *** *** SG&A expenses: Cost/expense variance *** *** *** ***
Volume variance *** *** *** *** Total SG&A expense variance *** *** *** ***
Operating income variance *** *** *** *** Summarized (at the operating income level) as: Price variance *** *** *** ***
Net cost/expense variance *** *** *** *** Net volume variance *** *** *** ***
Source: Compiled from data submitted in response to Commission questionnaires.
14 The Commission’s variance analysis is calculated in three parts: sales variance, cost of sales variance (COGS variance), and SG&A expense variance. Each part consists of a price variance (in the case of the sales variance) or a cost variance (in the case of the COGS and SG&A expense variance), and a volume variance. The sales or cost variance is calculated as the change in unit price or unit cost/expense times the new volume, while the volume variance is calculated as the change in volume times the old unit price or unit cost. Summarized at the bottom of the table, the price variance is from sales; the cost/expense variance is the sum of those items from COGS and SG&A expense variances, respectively, and the volume variance is the sum of the volume components of the net sales, COGS, and SG&A expense variances.
VI-13
Capital expenditures and research and development expenses
Table VI-6 presents U.S. producers’ capital expenditures and research and development (“R&D”) expenses related to their phosphate fertilizers operations and table VI-7 presents corresponding narrative descriptions.
Table VI-6 Phosphate fertilizers: Capital expenditures and research and development expenses for U.S. producers, 2017-19, January to September 2019, and January to September 2020
Item
Calendar year January to September 2017 2018 2019 2019 2020
Capital expenditures (1,000 dollars) All firms *** *** *** *** *** Research and development expenses (1,000 dollars) All firms *** *** *** *** ***
Source: Compiled from data submitted in response to Commission questionnaires. Table VI-7 Phosphate fertilizers: Nature and focus of capital expenditures and R&D expenses for U.S. producers, 2017-19, January to September 2019, and January to September 2020
Firm Nature and focus of capital expenditures *** *** *** *** *** *** Nature and focus of R&D expenses *** *** *** *** *** ***
Source: Compiled from data submitted in response to Commission questionnaires.

VI-14
Assets and return on assets
Table VI-8 presents data on the U.S. producers’ total assets and their return on assets (operating income divided by total assets) related to operations on phosphate fertilizers.15 Table VI-8 Phosphate fertilizers: Value of assets used in production, warehousing, and sales, and return on investment for U.S. producers, 2017-2019
Firm Calendar years
2017 2018 2019 Total net assets (1,000 dollars) All firms *** *** *** Operating return on assets (percent) All firms *** *** ***
Source: Compiled from data submitted in response to Commission questionnaires.
15 With respect to a company’s overall operations, staff notes that total asset value (i.e., the bottom line number on the asset side of a company’s balance sheet) reflects an aggregation of a number of assets which are generally not product specific. Accordingly, high level corporate allocations may be required in order to report a total asset value for phosphate fertilizers.

VI-15
Capital and investment
The Commission requested U.S. producers of phosphate fertilizers to describe any actual or potential negative effects of imports of phosphate fertilizers from Morocco and Russia on their firms’ growth, investment, ability to raise capital, development and production efforts, or the scale of capital investments. Table VI-9 presents the number of firms reporting an impact in each category and table VI-10 provides the U.S. producers’ narrative responses.
Table VI-9 Phosphate fertilizers: Actual and anticipated negative effects of imports on investment and growth and development
Item No Yes Negative effects on investment 0 3
Cancellation, postponement, or rejection of expansion projects
3 Denial or rejection of investment proposal 1 Reduction in the size of capital investments 2 Return on specific investments negatively impacted 2 Other 0
Negative effects on growth and development 0 3 Rejection of bank loans
0 Lowering of credit rating 1 Problem related to the issue of stocks or bonds 0 Ability to service debt 0 Other 3
Anticipated negative effects of imports 0 3 Source: Compiled from data submitted in response to Commission questionnaires.

VI-16
Table VI-10 Phosphate fertilizers: Narratives relating to actual and anticipated negative effects of imports on investment and growth and development, since January 1, 2017
Item / Firm Narrative
Cancellation, postponement, or rejection of expansion projects:
*** ***
*** ***
*** ***
Denial or rejection of investment proposal:
*** ***
Reduction in the size of capital investments:
*** ***
*** ***
Return on specific investments negatively impacted:
*** ***
*** ***
Lowering of credit rating:
*** ***
Other effects on growth and development:
*** ***
*** ***
*** ***
Table continued on next page.

VI-17
Table VI-10—Continued Phosphate fertilizers: Narratives relating to actual and anticipated negative effects of imports on investment and growth and development, since January 1, 2017
Anticipated effects of imports:
*** ***
*** ***
*** ***
Source: Compiled from data submitted in response to Commission questionnaires.

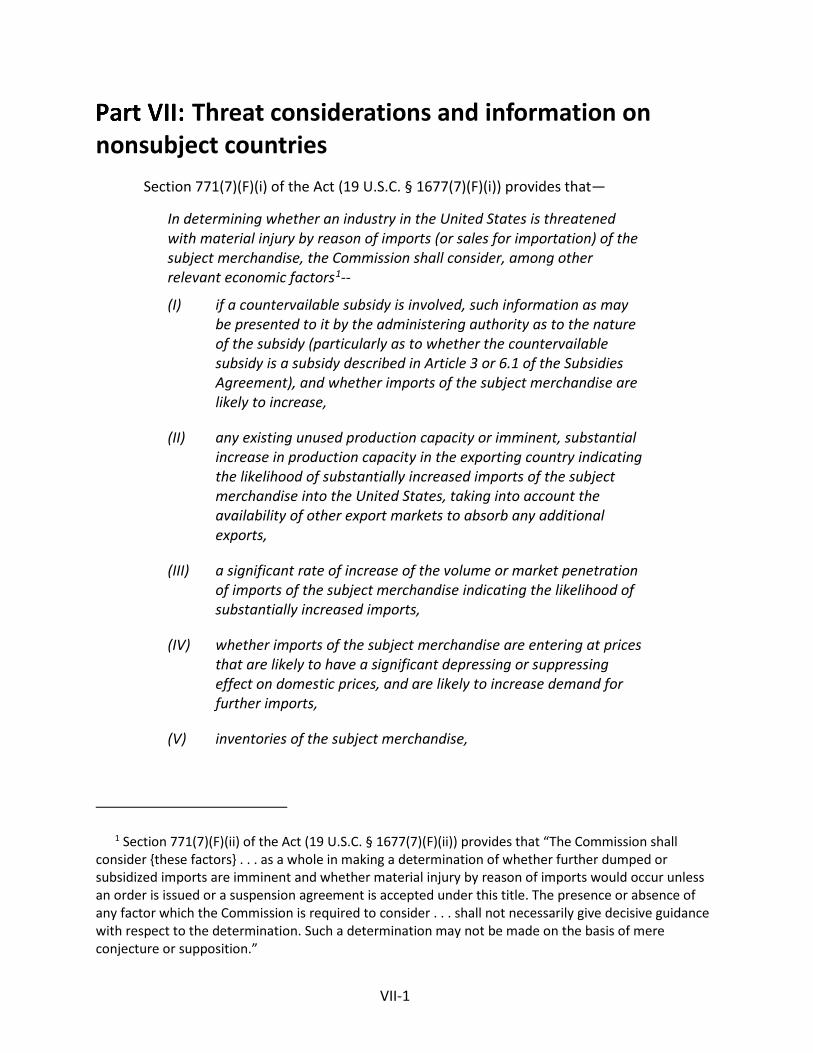
VII-1
Threat considerations and information on nonsubject countries
Section 771(7)(F)(i) of the Act (19 U.S.C. § 1677(7)(F)(i)) provides that—
In determining whether an industry in the United States is threatened with material injury by reason of imports (or sales for importation) of the subject merchandise, the Commission shall consider, among other relevant economic factors1--
(I) if a countervailable subsidy is involved, such information as may be presented to it by the administering authority as to the nature of the subsidy (particularly as to whether the countervailable subsidy is a subsidy described in Article 3 or 6.1 of the Subsidies Agreement), and whether imports of the subject merchandise are likely to increase,
(II) any existing unused production capacity or imminent, substantial increase in production capacity in the exporting country indicating the likelihood of substantially increased imports of the subject merchandise into the United States, taking into account the availability of other export markets to absorb any additional exports,
(III) a significant rate of increase of the volume or market penetration of imports of the subject merchandise indicating the likelihood of substantially increased imports,
(IV) whether imports of the subject merchandise are entering at prices that are likely to have a significant depressing or suppressing effect on domestic prices, and are likely to increase demand for further imports,
(V) inventories of the subject merchandise,
1 Section 771(7)(F)(ii) of the Act (19 U.S.C. § 1677(7)(F)(ii)) provides that “The Commission shall consider {these factors} . . . as a whole in making a determination of whether further dumped or subsidized imports are imminent and whether material injury by reason of imports would occur unless an order is issued or a suspension agreement is accepted under this title. The presence or absence of any factor which the Commission is required to consider . . . shall not necessarily give decisive guidance with respect to the determination. Such a determination may not be made on the basis of mere conjecture or supposition.”

VII-2
(VI) the potential for product-shifting if production facilities in the foreign country, which can be used to produce the subject merchandise, are currently being used to produce other products,
(VII) in any investigation under this title which involves imports of both a raw agricultural product (within the meaning of paragraph (4)(E)(iv)) and any product processed from such raw agricultural product, the likelihood that there will be increased imports, by reason of product shifting, if there is an affirmative determination by the Commission under section 705(b)(1) or 735(b)(1) with respect to either the raw agricultural product or the processed agricultural product (but not both),
(VIII) the actual and potential negative effects on the existing development and production efforts of the domestic industry, including efforts to develop a derivative or more advanced version of the domestic like product, and
(IX) any other demonstrable adverse trends that indicate the probability that there is likely to be material injury by reason of imports (or sale for importation) of the subject merchandise (whether or not it is actually being imported at the time).2
Information on the nature of the subsidies was presented earlier in this report; information on the volume and pricing of imports of the subject merchandise is presented in Parts IV and V; and information on the effects of imports of the subject merchandise on U.S. producers’ existing development and production efforts is presented in Part VI. Information on inventories of the subject merchandise; foreign producers’ operations, including the potential for “product-shifting;” any other threat indicators, if applicable; and any dumping in third-country markets, follows. Also presented in this section of the report is information obtained for consideration by the Commission on nonsubject countries.
2 Section 771(7)(F)(iii) of the Act (19 U.S.C. § 1677(7)(F)(iii)) further provides that, in antidumping investigations, “. . . the Commission shall consider whether dumping in the markets of foreign countries (as evidenced by dumping findings or antidumping remedies in other WTO member markets against the same class or kind of merchandise manufactured or exported by the same party as under investigation) suggests a threat of material injury to the domestic industry.”
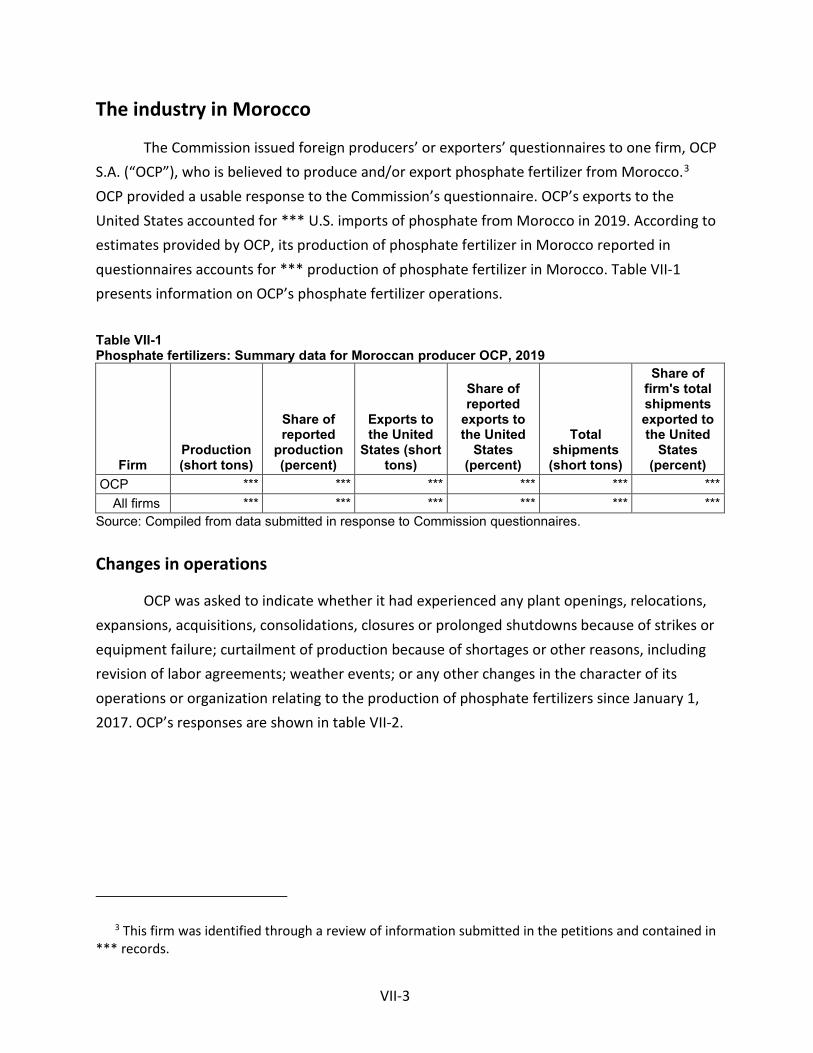
VII-3
The industry in Morocco
The Commission issued foreign producers’ or exporters’ questionnaires to one firm, OCP S.A. (“OCP”), who is believed to produce and/or export phosphate fertilizer from Morocco.3 OCP provided a usable response to the Commission’s questionnaire. OCP’s exports to the United States accounted for *** U.S. imports of phosphate from Morocco in 2019. According to estimates provided by OCP, its production of phosphate fertilizer in Morocco reported in questionnaires accounts for *** production of phosphate fertilizer in Morocco. Table VII-1 presents information on OCP’s phosphate fertilizer operations.
Table VII-1 Phosphate fertilizers: Summary data for Moroccan producer OCP, 2019
Firm Production (short tons)
Share of reported
production (percent)
Exports to the United
States (short tons)
Share of reported
exports to the United
States (percent)
Total shipments
(short tons)
Share of firm's total shipments exported to the United
States (percent)
OCP *** *** *** *** *** *** All firms *** *** *** *** *** ***
Source: Compiled from data submitted in response to Commission questionnaires.
Changes in operations
OCP was asked to indicate whether it had experienced any plant openings, relocations, expansions, acquisitions, consolidations, closures or prolonged shutdowns because of strikes or equipment failure; curtailment of production because of shortages or other reasons, including revision of labor agreements; weather events; or any other changes in the character of its operations or organization relating to the production of phosphate fertilizers since January 1, 2017. OCP’s responses are shown in table VII-2.
3 This firm was identified through a review of information submitted in the petitions and contained in *** records.

VII-4
Table VII-2 Phosphate fertilizers: Reported changes in operations by Moroccan producer OCP, since January 1, 2017
Item / Firm Reported changed in operations Plant openings: *** *** Acquisitions: *** *** Revised labor agreements: *** *** Weather / force majeure: *** ***
Source: Compiled from data submitted in response to Commission questionnaires.

VII-5
Operations on phosphate fertilizers
Table VII-3 presents information on OCP’s phosphate fertilizer operations in Morocco.
Table VII-3 Phosphate fertilizers: Data for Moroccan producer OCP, 2017-19, January to September 2019, January to September 2020, and projection calendar years 2020 and 2021
Item
Actual experience Projections Calendar year January to September Calendar year
2017 2018 2019 2019 2020 2020 2021 Quantity (short tons) Capacity *** *** *** *** *** *** *** Production *** *** *** *** *** *** *** End-of-period inventories *** *** *** *** *** *** *** Shipments: Home market shipments: Internal consumption/ transfers *** *** *** *** *** *** ***
Commercial home market shipments *** *** *** *** *** *** ***
Total home market shipments *** *** *** *** *** *** *** Export shipments to:
United States *** *** *** *** *** *** *** All other markets *** *** *** *** *** *** ***
Total exports *** *** *** *** *** *** *** Total shipments *** *** *** *** *** *** ***
Ratios and shares (percent) Capacity utilization *** *** *** *** *** *** *** Inventories/production *** *** *** *** *** *** *** Inventories/total shipments *** *** *** *** *** *** *** Share of shipments: Home market shipments: Internal consumption/ transfers *** *** *** *** *** *** ***
Commercial home market shipments *** *** *** *** *** *** ***
Total home market shipments *** *** *** *** *** *** *** Export shipments to:
United States *** *** *** *** *** *** *** All other markets *** *** *** *** *** *** ***
Total exports *** *** *** *** *** *** *** Total shipments *** *** *** *** *** *** ***
Source: Compiled from data submitted in response to Commission questionnaires.

VII-6
OCP’s production capacity increased in each year during 2017-19, ending *** percent higher in 2019 than in 2017.4 Its production capacity was *** percent higher in interim 2020 than in interim 2019. OCP’s production capacity is projected to be *** percent higher in 2020 than in 2019 and *** percent higher in 2021 than in 2020.5 OCP’s production also increased in each year during 2017-19, ending *** percent higher in 2019 than in 2017. It was *** percent higher in interim 2020 than in interim 2019. OCP’s production is projected to be *** percent higher in 2020 than in 2019 and *** in 2021 as in 2020.
As a result of production increasing at a lower rate than production capacity during 2017-19, OCP’s capacity utilization decreased from *** percent in 2017 to *** percent in 2019. It was *** percent in interim 2020, compared with *** percent in interim 2019. OCP’s capacity utilization is projected to be *** percent in 2020 and *** percent in 2021.
OCP’s home market shipments fluctuated year to year, decreasing by *** percent from 2017 to 2018, but then increasing by *** percent from 2018 to 2019, ending *** percent lower in 2019 than in 2017. It was *** percent lower in interim 2020 than in interim 2019. OCP’s home market shipments are projected to be *** percent lower in 2020 than in 2019, but *** percent higher in 2021 than in 2020.
OCP reported export shipments in each year during 2017-19, with *** of its exports going to non-U.S. markets. OCP’s exports to the United States fluctuated year to year, increasing by *** percent from 2017 to 2018, but then decreasing by *** percent from 2018 to 2019, ending *** percent higher in 2019 than in 2017. It was *** percent lower in interim 2020 than in interim 2019. OCP’s exports the United States are projected to be *** percent lower in 2020 than in 2019 and *** percent lower in 2021 than in 2020.
4 According to OCP, the increase in its production capacity resulted from ***. Email from ***, January 11, 2021.
5 OCP based its 2020 projections on ***. Its 2021 projections for its operations are based on ***. Email from ***, January 11, 2021.

VII-7
As a result of exports to the United States increasing by a higher rate than exports to non-U.S. markets during 2017-19, the United States’ share of OCP’s total exports increased from *** percent in 2017 to *** percent in 2019. It was lower in interim 2020 (*** percent), than in interim 2019 (*** percent). The United States is projected to account for *** percent of OCP’s total exports in 2020 and *** percent in 2021.
Alternative products
OCP did not report production of other products on the same machinery used to produce phosphate fertilizers.
Exports
Table VII-4 presents data for exports of fertilizers (including phosphate fertilizers) from Morocco in descending order of quantity for 2019. The leading export markets for fertilizers from Morocco, by quantity, in 2019 were Brazil, the United States, Djibouti, and Bangladesh accounting for 23.9 percent, 20.6 percent, 7.0 percent, and 5.0 percent, respectively.

VII-8
Table VII-4 Fertilizers: Exports from Morocco, 2017-19
Destination market Calendar year
2017 2018 2019 Quantity (short tons) United States 1,481,908 2,302,037 2,055,238 Brazil 1,514,179 1,608,629 2,383,712 Djibouti 112,100 367,583 701,035 Bangladesh 59,786 287,900 500,462 Argentina 229,163 285,209 469,459 Spain 318,829 304,073 425,416 Turkey 304,801 121,431 423,939 Pakistan 22,960 249,505 307,742 France 212,995 280,313 264,658 All other destination markets 3,503,636 3,396,904 2,426,157
All destination markets 7,760,356 9,203,583 9,957,819 Value (1,000 dollars) United States 496,828 836,261 582,966 Brazil 579,668 560,844 675,518 Djibouti 29,872 108,018 220,955 Bangladesh 82,490 90,964 137,530 Argentina 76,137 107,511 149,928 Spain 101,908 110,319 124,320 Turkey 94,486 45,429 122,904 Pakistan 7,957 91,869 82,651 France 83,730 101,513 78,180 All other destination markets 980,745 1,095,146 712,131
All destination markets 2,533,820 3,147,872 2,887,081 Table continued on next page.
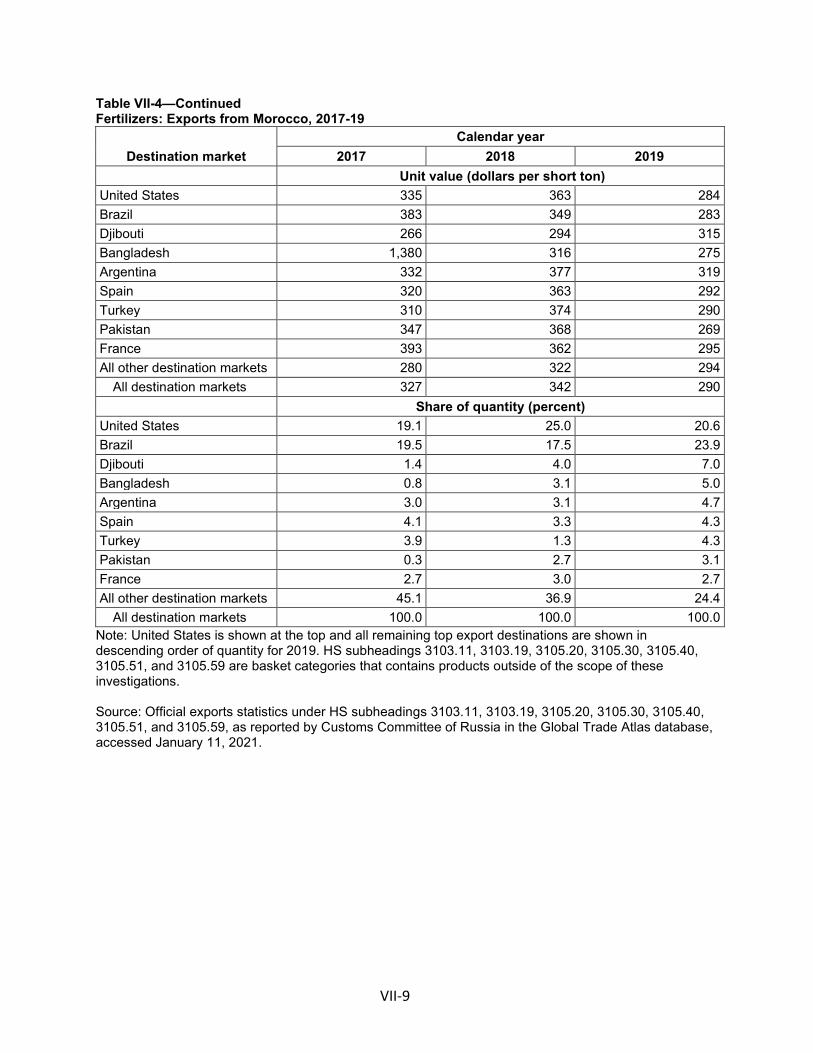
VII-9
Table VII-4—Continued Fertilizers: Exports from Morocco, 2017-19
Destination market Calendar year
2017 2018 2019 Unit value (dollars per short ton) United States 335 363 284 Brazil 383 349 283 Djibouti 266 294 315 Bangladesh 1,380 316 275 Argentina 332 377 319 Spain 320 363 292 Turkey 310 374 290 Pakistan 347 368 269 France 393 362 295 All other destination markets 280 322 294
All destination markets 327 342 290 Share of quantity (percent) United States 19.1 25.0 20.6 Brazil 19.5 17.5 23.9 Djibouti 1.4 4.0 7.0 Bangladesh 0.8 3.1 5.0 Argentina 3.0 3.1 4.7 Spain 4.1 3.3 4.3 Turkey 3.9 1.3 4.3 Pakistan 0.3 2.7 3.1 France 2.7 3.0 2.7 All other destination markets 45.1 36.9 24.4
All destination markets 100.0 100.0 100.0 Note: United States is shown at the top and all remaining top export destinations are shown in descending order of quantity for 2019. HS subheadings 3103.11, 3103.19, 3105.20, 3105.30, 3105.40, 3105.51, and 3105.59 are basket categories that contains products outside of the scope of these investigations. Source: Official exports statistics under HS subheadings 3103.11, 3103.19, 3105.20, 3105.30, 3105.40, 3105.51, and 3105.59, as reported by Customs Committee of Russia in the Global Trade Atlas database, accessed January 11, 2021.

VII-10
The industry in Russia
The Commission issued foreign producers’ or exporters’ questionnaires to two firms, PhosAgro PJSC (“PhosAgro”) and EuroChem, who are believed to produce and/or export phosphate fertilizer from Russia.6 Both firms provided usable responses to the Commission’s questionnaire. Responding Russian producers’ exports to the United States accounted for *** U.S. imports of phosphate from Russia in 2019. According to estimates provided by the responding Russian producers, their production of phosphate fertilizer in Russia reported in questionnaires accounts for *** percent of the total production of phosphate fertilizer in Russia.7 Table VII-5 presents information on the responding Russian producers’ phosphate fertilizer operations.
Table VII-5 Phosphate fertilizers: Summary data for producers in Russia, 2019
Firm Production (short tons)
Share of reported
production (percent)
Exports to the United
States (short tons)
Share of reported
exports to the United
States (percent)
Total shipments
(short tons)
Share of firm's total shipments exported to the United
States (percent)
EuroChem *** *** *** *** *** *** PhosAgro *** *** *** *** *** ***
All firms *** *** *** *** *** *** Source: Compiled from data submitted in response to Commission questionnaires.
6 This firm was identified through a review of information submitted in the petitions and contained in *** records.
7 The other major producer of phosphate fertilizer in Russia is Uralchem, whose total commercial shipments (including phosphate fertilizer) totaled 6.4 million tons in 2018, equivalent to a 2 percent increase from 2017. URALCHEM announces full year IFRS results for the 12 months ending 31 December 2018, https://uralchem.com/press/news/URALCHEMannouncesfullyearIFRSresultsforthe12monthsending31December2018/?SECT=corporate_events, accessed January 21, 2021.

VII-11
Changes in operations
Producers in Russia were asked to indicate whether their firm had experienced any plant openings, relocations, expansions, acquisitions, consolidations, closures or prolonged shutdowns because of strikes or equipment failure; curtailment of production because of shortages of materials or other reasons, including revision of labor agreements; or any other change in character of their operations or organization relating to the production phosphate fertilizers since January 1, 2017. All reported responses are shown in table VII-6. Table VII-6 Phosphate fertilizers: Reported changes in operations by producers in Russia, since January 1, 2017
Item / Firm Reported changed in operations Expansions: *** *** Revised labor agreements: *** *** Other: *** ***
Source: Compiled from data submitted in response to Commission questionnaires.
Operations on phosphate fertilizers
Table VII-7 presents information on the phosphate fertilizer operations of the responding producers and exporters in Russia. Responding Russian producers’ collective production capacity increased in each year during 2017-19, ending *** percent higher in 2019 than in 2017. Both responding firms reported higher production capacity in 2019 than in 2017. Their collective production capacity was *** percent higher in interim 2020 than in interim 2019. Responding Russian producers’ collective production capacity is projected to be *** percent higher in 2020 than in 2019 and *** percent higher in 2021 than in 2020.8
8 In its response to the Commission’s foreign producers’ questionnaire, PhosAgro noted that its projections for 2020 and 2021 are based on ***, while EuroChem’s projections are based on ***. PhosAgro’s production capacity is projected to be *** percent higher in 2020 than in 2019 and *** percent higher in 2021 than in 2020. Conversely, EuroChem’s production capacity is projected to be *** percent lower in 2020 than in 2019 and *** from 2020 to 2021.

VII-12
Table VII-7 Phosphate fertilizers: Data on the industry in Russia, 2017-19, January to September 2019, January to September 2020, and projection calendar years 2020 and 2021
Item
Actual experience Projections Calendar year January to September Calendar year
2017 2018 2019 2019 2020 2020 2021 Quantity (short tons) Capacity *** *** *** *** *** *** *** Production *** *** *** *** *** *** *** End-of-period inventories *** *** *** *** *** *** *** Shipments: Home market shipments: Internal consumption/ transfers *** *** *** *** *** *** ***
Commercial home market shipments *** *** *** *** *** *** ***
Total home market shipments *** *** *** *** *** *** *** Export shipments to:
United States *** *** *** *** *** *** *** All other markets *** *** *** *** *** *** ***
Total exports *** *** *** *** *** *** *** Total shipments *** *** *** *** *** *** ***
Ratios and shares (percent) Capacity utilization *** *** *** *** *** *** *** Inventories/production *** *** *** *** *** *** *** Inventories/total shipments *** *** *** *** *** *** *** Share of shipments: Home market shipments: Internal consumption/ transfers *** *** *** *** *** *** ***
Commercial home market shipments *** *** *** *** *** *** ***
Total home market shipments *** *** *** *** *** *** *** Export shipments to:
United States *** *** *** *** *** *** *** All other markets *** *** *** *** *** *** ***
Total exports *** *** *** *** *** *** *** Total shipments *** *** *** *** *** *** ***
Source: Compiled from data submitted in response to Commission questionnaires.
Responding Russian producers’ collective production also increased in each year during 2017-19, ending *** percent higher in 2019 than in 2017. Both responding firms reported higher production in 2019 than in 2017. Their collective production was *** percent higher in interim 2020 than in interim 2019. Responding Russian producers’ production is projected to be *** percent higher in 2020 than in 2019 and *** percent higher in 2021 than in 2020.9
9 PhosAgro’s production is projected to be *** percent higher in 2020 than in 2019 and *** percent higher in 2021 than in 2020. Conversely, EuroChem’s production is projected to be *** percent lower in 2020 than in 2019 and *** from 2020 to 2021.
VII-13
As a result of their production increasing at a higher rate than their production capacity, responding Russian producers’ collective capacity utilization increased from *** percent in 2017 to *** percent in 2019.10 Their collective capacity utilization was *** percent in interim 2020, compared with *** percent in interim 2019. Responding Russian producers’ collective capacity utilization is projected to be *** percent in 2020 and *** percent in 2021.
Home market shipments accounted for a minority, but increasing, share of responding Russian producers’ total shipments in each year during 2017-19 and in interim 2020. Their collective home market shipments increased in each year during 2017-19, ending *** percent higher in 2019 than in 2017. Both firms reported more home market shipments in 2019 than in 2017. Responding Russian producers’ collective home market shipments were *** percent higher in interim 2020 than in interim 2019. Their collective home market shipments are projected to be *** percent higher in 2020 than in 2019 and *** percent higher in 2021 than in 2020.11
Export shipments accounted for the majority of responding Russian producers’ total shipments in each year during 2017-19 and in interim 2020, with most of those shipments going to non-U.S. markets. Their collective export shipments to the United States fluctuated year to year, *** from 2017 to 2018, but then decreasing by *** percent from 2018 to 2019, ending *** percent higher in 2019 than in 2017. Both firms reported an irregular increase in exports to the United States during 2017-19. Their collective export shipments to the United States were *** percent lower in interim 2020 than in interim 2019. Responding Russian producers’ collective export shipments to the United States are projected to be *** percent lower in 2020 than in 2019 and *** percent lower in 2021 than in 2020.12
10 PhosAgro ***, while EuroChem’s capacity utilization was greater than *** percent over the same period.
11 PhosAgro’s home market shipments are projected to be *** percent higher in 2020 than in 2019 and *** percent higher in 2021 than in 2020. Conversely, EuroChem’s home market shipments are projected to be *** percent lower in 2020 than in 2019 and *** from 2020 to 2021.
12 ***.

VII-14
The United States’ share of responding Russian producers’ total exports increased irregularly from *** percent in 2017 to *** percent in 2019. It was *** percent in interim 2020, compared with *** percent in interim 2019. The United States is projected to account for *** percent of responding Russian producers’ total exports in 2020 and *** percent in 2021.
Alternative products
As shown in table VII-8, *** reported production of out-of-scope merchandise using the same machinery used to produce phosphate fertilizers. This production accounted for a small share of total production on the same machinery used to produce phosphate fertilizers during 2017-19. ***.13
Table VII-8 Phosphate fertilizers: Overall capacity and production on the same equipment as in-scope production by producers in Russia, 2017-19, January to September 2019, and January to September 2020
Item Calendar year January to September
2017 2018 2019 2019 2020 Quantity (short tons) Overall capacity *** *** *** *** *** Production: Phosphate fertilizers *** *** *** *** ***
Out-of-scope production *** *** *** *** *** Total production on
same machinery *** *** *** *** *** Ratios and shares (percent) Overall capacity utilization *** *** *** *** *** Share of production: Phosphate fertilizers *** *** *** *** ***
Out-of-scope production *** *** *** *** *** Total production on
same machinery *** *** *** *** *** Source: Compiled from data submitted in response to Commission questionnaires.
13 EuroChem’s foreign producer questionnaire, section II-3a.

VII-15
Exports
Table VII-9 presents data for exports of fertilizers (including phosphate fertilizers) from Russia in descending order of quantity for 2019. The leading export markets for these fertilizers from Russia, by quantity, in 2019 were Brazil, China, Estonia, and India, accounting for 15.0 percent, 10.8 percent, 9.5 percent, and 5.5 percent, respectively. The United States was the eighth largest export market, by quantity, in 2019 accounting for 3.9 percent. Table VII-9 Fertilizers: Exports from Russia, 2017-19
Destination market Calendar year
2017 2018 2019 Quantity (short tons) United States 426,634 1,039,870 458,799 Brazil 1,740,126 2,386,931 1,758,056 China 1,160,774 1,092,249 1,257,902 Estonia 658,243 1,058,702 1,108,716 India 321,644 493,515 644,426 Ukraine 2,256,967 1,137,408 619,022 Latvia 301,057 456,036 492,722 Romania 275,835 398,216 491,917 UAE 541,073 530,709 421,414 All other destination markets 3,681,454 3,728,231 4,436,240
All destination markets 11,363,807 12,321,866 11,689,213 Value (1,000 dollars) United States 126,073 368,083 160,716 Brazil 402,311 605,846 418,274 China 247,791 259,183 294,662 Estonia 177,487 336,555 322,859 India 78,775 141,823 174,706 Ukraine 509,049 293,928 185,030 Latvia 67,433 107,816 122,833 Romania 67,053 102,108 126,515 UAE 123,151 121,229 96,940 All other destination markets 911,234 1,034,049 1,214,753
All destination markets 2,710,358 3,370,621 3,117,287 Table continued on next page.
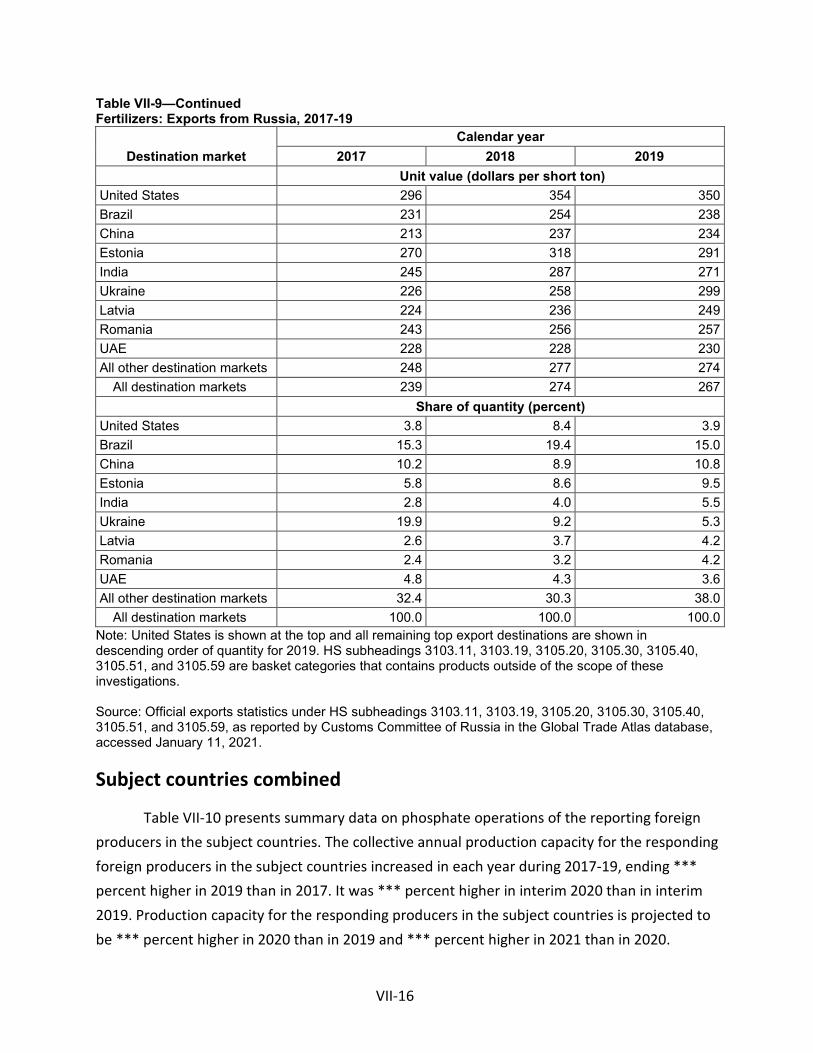
VII-16
Table VII-9—Continued Fertilizers: Exports from Russia, 2017-19
Destination market Calendar year
2017 2018 2019 Unit value (dollars per short ton) United States 296 354 350 Brazil 231 254 238 China 213 237 234 Estonia 270 318 291 India 245 287 271 Ukraine 226 258 299 Latvia 224 236 249 Romania 243 256 257 UAE 228 228 230 All other destination markets 248 277 274
All destination markets 239 274 267 Share of quantity (percent) United States 3.8 8.4 3.9 Brazil 15.3 19.4 15.0 China 10.2 8.9 10.8 Estonia 5.8 8.6 9.5 India 2.8 4.0 5.5 Ukraine 19.9 9.2 5.3 Latvia 2.6 3.7 4.2 Romania 2.4 3.2 4.2 UAE 4.8 4.3 3.6 All other destination markets 32.4 30.3 38.0
All destination markets 100.0 100.0 100.0 Note: United States is shown at the top and all remaining top export destinations are shown in descending order of quantity for 2019. HS subheadings 3103.11, 3103.19, 3105.20, 3105.30, 3105.40, 3105.51, and 3105.59 are basket categories that contains products outside of the scope of these investigations. Source: Official exports statistics under HS subheadings 3103.11, 3103.19, 3105.20, 3105.30, 3105.40, 3105.51, and 3105.59, as reported by Customs Committee of Russia in the Global Trade Atlas database, accessed January 11, 2021.
Subject countries combined
Table VII-10 presents summary data on phosphate operations of the reporting foreign producers in the subject countries. The collective annual production capacity for the responding foreign producers in the subject countries increased in each year during 2017-19, ending *** percent higher in 2019 than in 2017. It was *** percent higher in interim 2020 than in interim 2019. Production capacity for the responding producers in the subject countries is projected to be *** percent higher in 2020 than in 2019 and *** percent higher in 2021 than in 2020.

VII-17
Table VII-10 Phosphate fertilizers: Data on the industry in subject countries, 2017-19, January to September 2019, January to September 2020, and projection calendar years 2020 and 2021
Item
Actual experience Projections Calendar year January to September Calendar year
2017 2018 2019 2019 2020 2020 2021 Quantity (short tons) Capacity *** *** *** *** *** *** *** Production *** *** *** *** *** *** *** End-of-period inventories *** *** *** *** *** *** *** Shipments: Home market shipments: Internal consumption/ transfers *** *** *** *** *** *** ***
Commercial home market shipments *** *** *** *** *** *** *** Total home market shipments *** *** *** *** *** *** ***
Export shipments to: United States *** *** *** *** *** *** ***
All other markets *** *** *** *** *** *** *** Total exports *** *** *** *** *** *** ***
Total shipments *** *** *** *** *** *** *** Ratios and shares (percent) Capacity utilization *** *** *** *** *** *** *** Inventories/production *** *** *** *** *** *** *** Inventories/total shipments *** *** *** *** *** *** *** Share of shipments: Home market shipments: Internal consumption/ transfers *** *** *** *** *** *** ***
Commercial home market shipments *** *** *** *** *** *** *** Total home market shipments *** *** *** *** *** *** ***
Export shipments to: United States *** *** *** *** *** *** ***
All other markets *** *** *** *** *** *** *** Total exports *** *** *** *** *** *** ***
Total shipments *** *** *** *** *** *** *** Source: Compiled from data submitted in response to Commission questionnaires.
Responding foreign producers’ production in the subject countries also increased in each year during 2017-19, ending *** percent higher in 2019 than in 2017. It was *** percent higher in interim 2020 than in 2019. Responding foreign producers’ production in the subject countries is projected to be *** percent higher in 2020 than in 2019 and *** percent higher in 2021 than in 2020. Responding foreign producers’ capacity utilization decreased irregularly from *** percent in 2017 to *** percent in 2019 and was *** percent in interim 2020, compared with *** percent in interim 2019. It is projected to be *** percent in 2020 and *** percent in 2021.

VII-18
Responding foreign producers’ collective home market shipments in the subject countries increased irregularly by *** percent during 2017-19 and was *** percent higher in interim 2020 than in interim 2019. It is projected to be *** percent lower in 2020 than in 2019 and *** percent higher in 2021 than in 2020. Responding foreign producers’ collective exports to the United States increased irregularly by *** percent during 2017-19. It was *** percent lower in interim 2020 than in interim 2019. Responding foreign producers’ collective exports to the United States are projected to be *** percent lower in 2020 than in 2019 and *** percent lower in 2021 than in 2020.
U.S. inventories of imported merchandise
Table VII-11 presents data on responding U.S. importers’ reported end-of-period inventories of phosphate fertilizers. Responding U.S. importers’ end-of-period inventories of imports from Morocco and imports from Russia each *** during 2017-19, with the majority of the increase occurring from 2017 to 2018. Their end-of-period inventories of imports from Morocco and imports from Russia were 58.7 percent and *** percent lower, respectively, in interim 2020 than in interim 2019. Overall, end-of-period inventories of subject imports *** during 2017-19 and were *** percent lower in interim 2020 than in interim 2019. U.S. importers’ end-of-period inventories of imports by source and quarter are presented in appendix D.14
14 As shown in appendix D, inventories of U.S. imports from Morocco peaked at the end of the third quarter in 2017, the end of 2018, and the end of the third quarter in 2019. Inventories of U.S. imports from Russia peaked at the end of the third quarter of 2017, the first quarter of 2018, and the first quarter of 2019. Inventories of U.S. imports from Morocco at the end of each quarter increased from 2017 to 2018 and from 2018 to 2019 while quarterly inventories from Russia fluctuated year to year. The majority of responding U.S. importers cited fall and spring demand as the driving factor behind inventory trends. Some responding U.S. importers noted that the timing of purchases, the market environment, and weather conditions influenced inventory trends.
One U.S. importer, ***, was unable to provide inventory data on a quarterly basis by source as it ***, but did provide end-of-year inventory of phosphate fertilizers from all sources. In the prehearing report *** end-of-year inventories of phosphate fertilizers from all sources were inadvertently classified as inventories of phosphate fertilizer from Morocco. These data have been amended for the staff report.
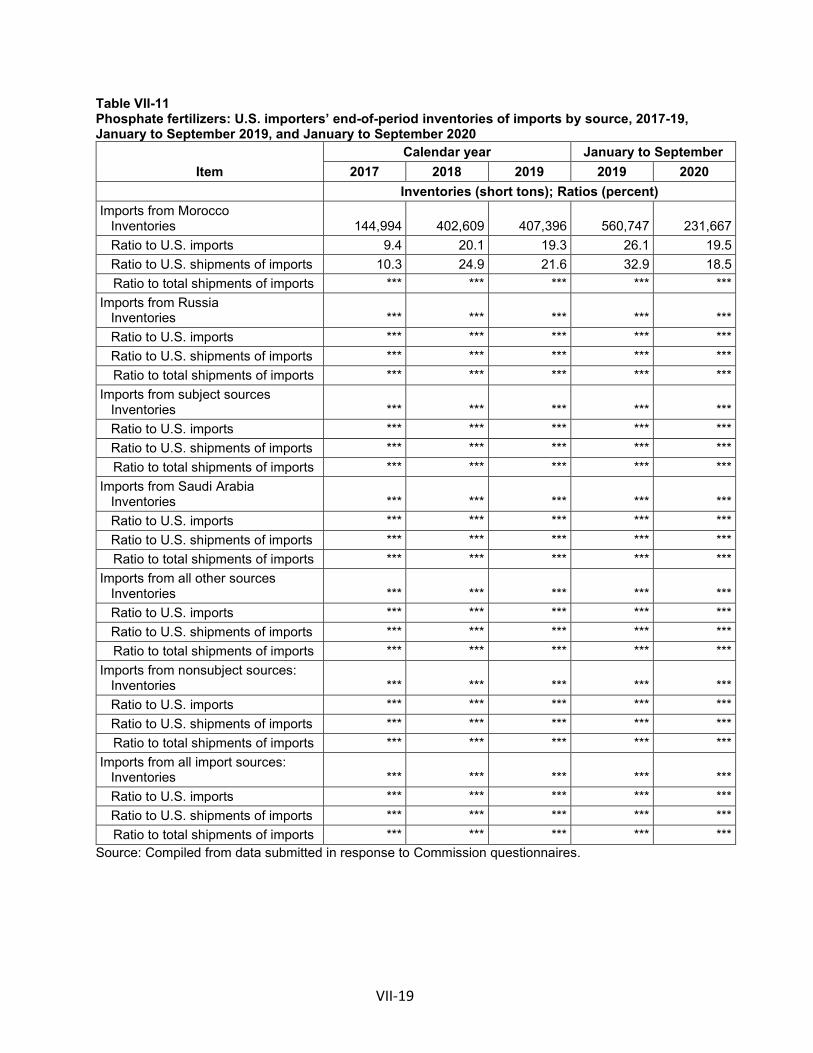
VII-19
Table VII-11 Phosphate fertilizers: U.S. importers’ end-of-period inventories of imports by source, 2017-19, January to September 2019, and January to September 2020
Item Calendar year January to September
2017 2018 2019 2019 2020 Inventories (short tons); Ratios (percent)
Imports from Morocco Inventories 144,994 402,609 407,396 560,747 231,667 Ratio to U.S. imports 9.4 20.1 19.3 26.1 19.5 Ratio to U.S. shipments of imports 10.3 24.9 21.6 32.9 18.5
Ratio to total shipments of imports *** *** *** *** *** Imports from Russia Inventories *** *** *** *** *** Ratio to U.S. imports *** *** *** *** *** Ratio to U.S. shipments of imports *** *** *** *** ***
Ratio to total shipments of imports *** *** *** *** *** Imports from subject sources Inventories *** *** *** *** *** Ratio to U.S. imports *** *** *** *** *** Ratio to U.S. shipments of imports *** *** *** *** ***
Ratio to total shipments of imports *** *** *** *** *** Imports from Saudi Arabia Inventories *** *** *** *** *** Ratio to U.S. imports *** *** *** *** *** Ratio to U.S. shipments of imports *** *** *** *** ***
Ratio to total shipments of imports *** *** *** *** *** Imports from all other sources Inventories *** *** *** *** *** Ratio to U.S. imports *** *** *** *** *** Ratio to U.S. shipments of imports *** *** *** *** ***
Ratio to total shipments of imports *** *** *** *** *** Imports from nonsubject sources: Inventories *** *** *** *** *** Ratio to U.S. imports *** *** *** *** *** Ratio to U.S. shipments of imports *** *** *** *** ***
Ratio to total shipments of imports *** *** *** *** *** Imports from all import sources: Inventories *** *** *** *** *** Ratio to U.S. imports *** *** *** *** *** Ratio to U.S. shipments of imports *** *** *** *** ***
Ratio to total shipments of imports *** *** *** *** *** Source: Compiled from data submitted in response to Commission questionnaires.

VII-20
U.S. importers’ outstanding orders
The Commission requested importers to indicate whether they imported or arranged for the importation of phosphate fertilizer from Morocco, Russia, or nonsubject sources after September 30, 2020. The majority of arranged imports during October 2020-September 2021 reported by responding U.S. importers are from nonsubject sources, particularly Saudi Arabia.15 Table VII-12 presents U.S. importers’ arranged imports after September 30, 2020. Table VII-12 Phosphate fertilizers: Arranged imports, October 2020 through September 2021
Item Period
Oct-Dec 2020 Jan-Mar 2021 Apr-Jun 2021 Jul-Sep 2021 Total Quantity (short tons)
Arranged U.S. imports from.-- Morocco *** *** *** *** ***
Russia *** *** *** *** *** Subject sources *** *** *** *** ***
Saudi Arabia *** *** *** *** *** All other sources *** *** *** *** ***
Nonsubject sources *** *** *** *** *** All import sources *** *** *** *** ***
Source: Compiled from data submitted in response to Commission questionnaires.
Antidumping or countervailing duty orders in third-country markets
Vietnam has imposed safeguard measures on DAP and MAP with a minimum content of 7 percent Nitrogen and 30 percent Phosphorus, under HS Codes: 3105.10.20; 3105.10.90; 3105.20.00; 3105.30.00; 3105.40.00; 3105.51.00; 3105.59.00; 3105.90.00. The measures were imposed in March 2018 for a period of two years and were recently extended for two more years. The safeguard duty on the imported fertilizers stands at VNĐ1.05 million ($46) per ton for one year from March 7, 2020 dropping to VNĐ1.03 million ($45) per ton from March 7,
15 Three firms, ***, arranged imports from Saudi Arabia. *** of all arranged imports from Saudi Arabia for October-December 2020 and *** of arranged imports from Saudi Arabia for January-March 2021. In its response to the Commission’s U.S. importers’ questionnaire, ***. *** importer questionnaire, section II-2a.

VII-21
2021. It will then be VNĐ1.01 million ($44) starting from March 7, 2021 to September 6, 2022. Russia is not part of the excluded product list.16 17 On August 28, 2019, Ukraine initiated two safeguard investigatory processes for mineral fertilizers containing nitrogen, phosphorous, and potassium regardless of country of origin or export.18 These investigations resulted in negative determinations.19
Information on nonsubject countries
Outside of Morocco and Russia, nonsubject Saudi Arabia, Australia, Egypt, Jordan and Mexico, also produce and ship phosphate fertilizers to the United States. The Saudi Arabian Mining Company (Ma’aden) currently has two fully integrated phosphate fertilizer projects onstream with an aggregate annual capacity of 6.6 million short tons of subject DAP, MAP, and NPKs. In addition, Ma’aden has a similar 3.3 million annual ton plant under construction that is expected to be in operation by 2025.20 21 Mosaic has a 25 percent joint-venture partner interest in one of the currently operative 3.3 million annual short ton plants, Ma’aden Wa’ad Al Shamal Phosphate Company (MWSPC).22
16 *** foreign producer questionnaires, section II-7. 17 Safeguard Measures on Imported Fertilizers Extended until 2022,
https://vietnamnews.vn/economy/653368/safeguard-measures-on-imported-fertilisers-extended-until-2022.html, retrieved July, 23, 2020.
18 Ukraine: Initiation of Safeguard Investigation on Imports of Certain Mineral Fertilizers, https://www.globaltradealert.org/intervention/73212/safeguard/ukraine-initiation-of-safeguard-investigation-on-imports-of-certain-mineral-fertilizers, retrieved July 28, 2020.
19 Asters’ International Trade Team has Secured a No-Measures Outcome in Two Safeguard Investigations on Fertilizers Imports, https://www.usubc.org/site/recent-news/asters--039--international-trade-team-has-secured-a-no-measures-outcome-in-two-safeguard-investigations-on-fertilizers-imports, retrieved July 23, 2020.
20 “Phosphates”, https://www.maaden.com.sa/en/business/phosphate/, retrieved February 11, 2021.
21 “Ma’aden News”, https://www.maaden.com.sa/en/news/details/416, retrieved February 12, 2021,
22 “Partnerships”, https://www.maaden.com.sa/en/about/partnerships, retrieved January 14, 2021,

VII-22
Mosaic also has various phosphate fertilizer operations in Brazil under Mosaic Fertilizantes, the largest domestic producer (69 percent), with a total phosphate fertilizer crop nutrient capacity of 5.5 million short tons.23 In 2020, Fertilizantes fertilizer production of 3.8 million tons increased 0.6 million tons (19 percent) over 3.2 million tons in 2019, and domestic producer sales rose 1.3 million tons (45 percent) from 2.9 to 4.2 million tons, indicative of inventory drawdown and market upturn. MAP, TSP, SSP, NPKs and Dical phosphate fertilizer nutrients were produced.24 Fertilizantes primarily serves the Brazilian market and ***.25 26 Jordan and Mexico have reported annual phosphate fertilizer production capabilities of 1.3 million short tons P2O5 and 0.9 million short tons P2O5 respectively,27 Australia and Egypt, *** tons and *** tons respectively.28
Table VII-13 presents data for exports of fertilizers (including phosphate fertilizers) from Saudi Arabia in descending order of quantity for 2019. The leading export markets for these fertilizers from Saudi Arabia, by quantity, in 2019 were India, Brazil, the United States, and Australia, accounting for 56.7 percent, 22.4 percent, 6.1 percent, and 5.2 percent, respectively.
23 “Mosaic”, https://www.mosaicco.com/South-America-Business, retrieved February 17, 2021. 24 Mosaic SEC Form 8-K, February 2021; includes dicalcium phosphate (15 percent of total). 25 Petitioner Mosaic’s postconference brief, pp. 77-78. 26 Mosaic SEC Forms 8-K, February 2021, and 10-K, December 31, 2019; Mosaic bought Fertilizantes
from Brazilian miner Vale for $2.5 billion in 2018, and has a 62 percent ownership in Fospar, a SSP producer. Mosaic has an approximate 25 percent market share in Brazil, where it sold 10.2 million short tons of fertilizer products in 2019, and 11.7 million tons in 2020.
27 Nutrien Fact Book 2020, p. 19, https://www.nutrien.com/resources, retrieved February 17, 2021. 28 ***, August 31, 2018, pp. 87, 131.
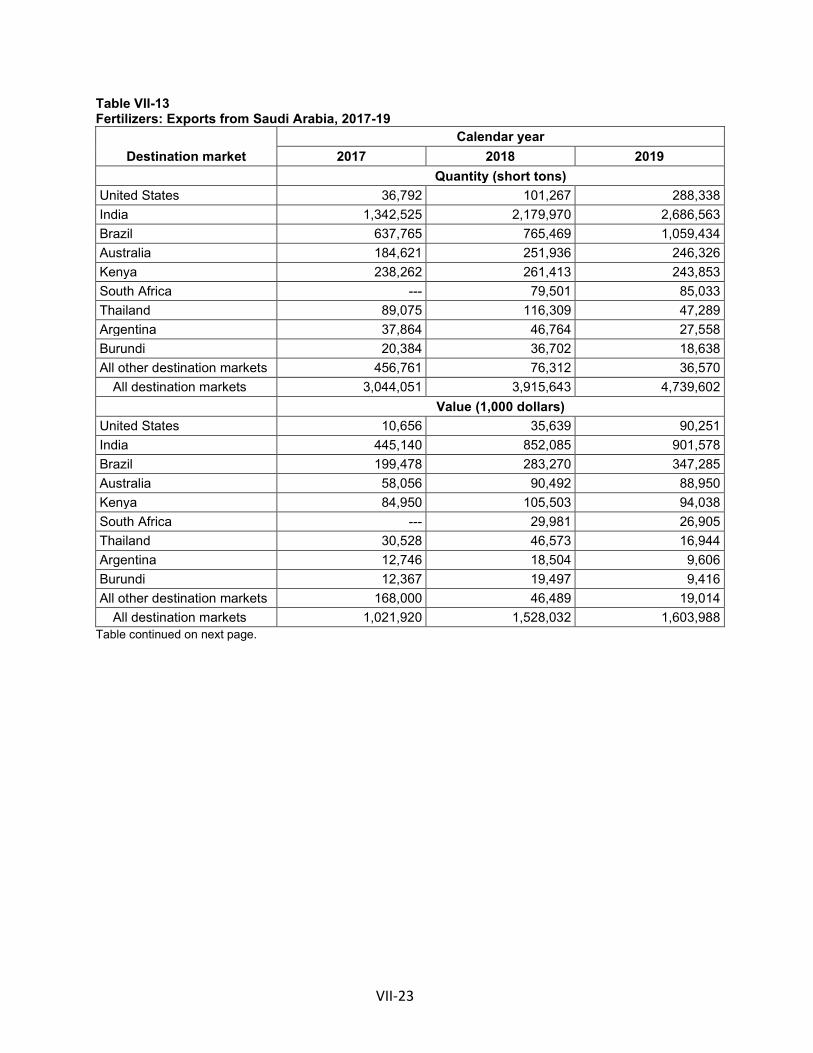
VII-23
Table VII-13 Fertilizers: Exports from Saudi Arabia, 2017-19
Destination market Calendar year
2017 2018 2019 Quantity (short tons) United States 36,792 101,267 288,338 India 1,342,525 2,179,970 2,686,563 Brazil 637,765 765,469 1,059,434 Australia 184,621 251,936 246,326 Kenya 238,262 261,413 243,853 South Africa --- 79,501 85,033 Thailand 89,075 116,309 47,289 Argentina 37,864 46,764 27,558 Burundi 20,384 36,702 18,638 All other destination markets 456,761 76,312 36,570
All destination markets 3,044,051 3,915,643 4,739,602 Value (1,000 dollars) United States 10,656 35,639 90,251 India 445,140 852,085 901,578 Brazil 199,478 283,270 347,285 Australia 58,056 90,492 88,950 Kenya 84,950 105,503 94,038 South Africa --- 29,981 26,905 Thailand 30,528 46,573 16,944 Argentina 12,746 18,504 9,606 Burundi 12,367 19,497 9,416 All other destination markets 168,000 46,489 19,014
All destination markets 1,021,920 1,528,032 1,603,988 Table continued on next page.

VII-24
Table VII-13—Continued Fertilizers: Exports from Saudi Arabia, 2017-19
Destination Market Calendar year
2017 2018 2019 Unit value (dollars per short ton) United States 290 352 313 India 332 391 336 Brazil 313 370 328 Australia 314 359 361 Kenya 357 404 386 South Africa --- 377 316 Thailand 343 400 358 Argentina 337 396 349 Burundi 607 531 505 All other destination markets 368 609 520
All destination markets 336 390 338 Share of quantity (percent) United States 1.2 2.6 6.1 India 44.1 55.7 56.7 Brazil 21.0 19.5 22.4 Australia 6.1 6.4 5.2 Kenya 7.8 6.7 5.1 South Africa --- 2.0 1.8 Thailand 2.9 3.0 1.0 Argentina 1.2 1.2 0.6 Burundi 0.7 0.9 0.4 All other destination markets 15.0 1.9 0.8
All destination markets 100.0 100.0 100.0 Note: United States is shown at the top and all remaining top export destinations are shown in descending order of quantity for 2019. HS subheadings 3103.11, 3103.19, 3105.20, 3105.30, 3105.40, 3105.51, and 3105.59 are basket categories that contains products outside of the scope of these investigations. Source: Official imports statistics of imports from Saudi Arabia (constructed export statistics for Saudi Arabia) under HS subheadings 3103.11, 3103.19, 3105.20, 3105.30, 3105.40, 3105.51, and 3105.59, as reported by various statistical reporting authorities in the Global Trade Atlas database, accessed January 11, 2021.
Table VII-14 presents data for global exports of fertilizers (including phosphate fertilizers) in descending order of quantity for 2019. The leading exporters of fertilizer, by quantity, in 2019 were China, Russia, Morocco, and the United States accounting for 22.8 percent, 19.1 percent, 16.2 percent, and 10.5 percent, respectively. During 2017-19, exports of fertilizer from Morocco and from Russia increased by 28.3 percent and 2.9 percent, respectively.

VII-25
Table VII-14 Fertilizers: Global exports by exporter, 2017-19
Exporter Calendar year
2017 2018 2019 Quantity (short tons) United States 6,399,359 5,921,702 6,444,875 Morocco 7,760,356 9,203,583 9,957,819 Russia 11,363,807 12,321,866 11,689,213 China 13,120,501 14,439,438 14,001,184 Saudi Arabia 3,044,051 3,915,643 4,739,602 Belgium 2,432,327 2,462,182 2,438,405 Lithuania 1,133,285 1,094,404 1,139,811 Belarus 992,060 1,034,769 996,635 Netherlands 811,863 739,595 823,028 Tunisia 567,859 649,184 779,647 Poland 784,027 665,587 757,481 South Korea 724,242 702,118 711,523 All other exporters 9,431,281 8,696,222 6,827,511
All reporting exporters 58,565,019 61,846,290 61,306,735 Value (1,000 dollars) United States 2,030,141 2,121,757 2,247,527 Morocco 2,533,820 3,147,872 2,887,081 Russia 2,710,358 3,370,621 3,117,287 China 3,769,736 4,939,297 4,294,054 Saudi Arabia 1,021,920 1,528,032 1,603,988 Belgium 827,032 890,722 864,354 Lithuania 363,777 413,991 421,686 Belarus 234,580 281,203 300,369 Netherlands 477,642 477,739 511,155 Tunisia 180,070 212,865 235,332 Poland 232,560 234,536 262,106 South Korea 200,167 206,821 205,812 All other exporters 3,212,161 3,353,988 2,593,592
All reporting exporters 17,793,962 21,179,446 19,544,344 Table continued on next page.
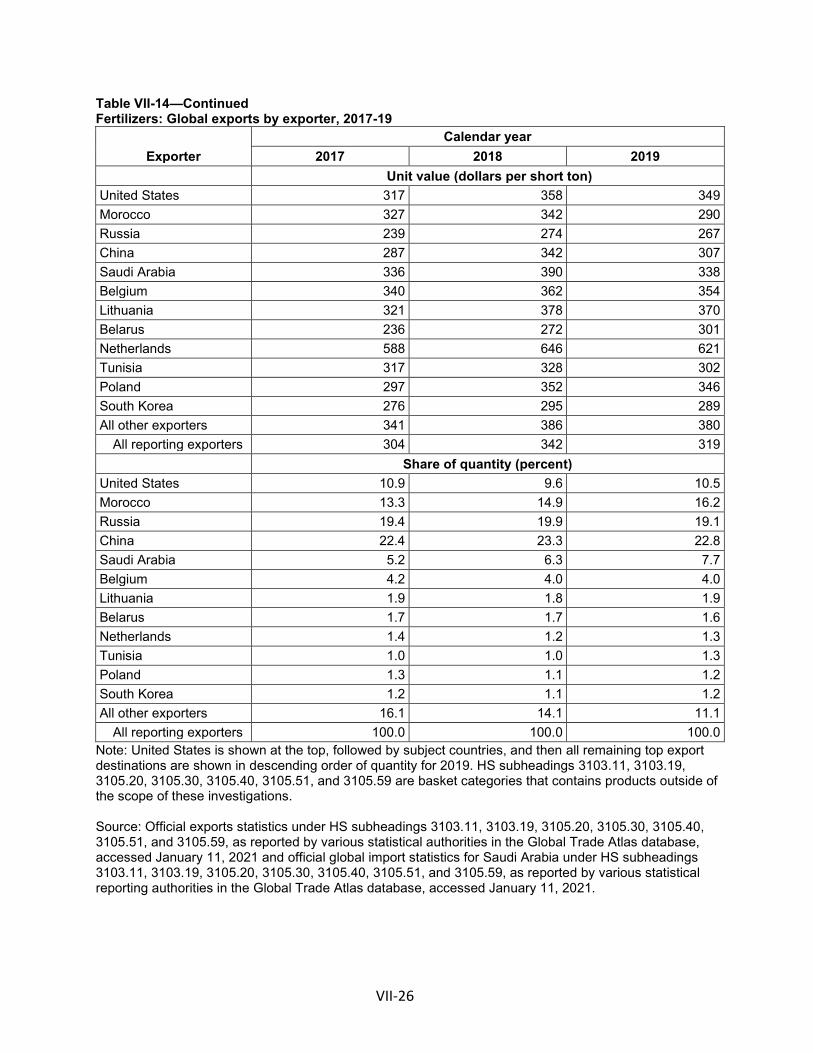
VII-26
Table VII-14—Continued Fertilizers: Global exports by exporter, 2017-19
Exporter Calendar year
2017 2018 2019 Unit value (dollars per short ton) United States 317 358 349 Morocco 327 342 290 Russia 239 274 267 China 287 342 307 Saudi Arabia 336 390 338 Belgium 340 362 354 Lithuania 321 378 370 Belarus 236 272 301 Netherlands 588 646 621 Tunisia 317 328 302 Poland 297 352 346 South Korea 276 295 289 All other exporters 341 386 380
All reporting exporters 304 342 319 Share of quantity (percent) United States 10.9 9.6 10.5 Morocco 13.3 14.9 16.2 Russia 19.4 19.9 19.1 China 22.4 23.3 22.8 Saudi Arabia 5.2 6.3 7.7 Belgium 4.2 4.0 4.0 Lithuania 1.9 1.8 1.9 Belarus 1.7 1.7 1.6 Netherlands 1.4 1.2 1.3 Tunisia 1.0 1.0 1.3 Poland 1.3 1.1 1.2 South Korea 1.2 1.1 1.2 All other exporters 16.1 14.1 11.1
All reporting exporters 100.0 100.0 100.0 Note: United States is shown at the top, followed by subject countries, and then all remaining top export destinations are shown in descending order of quantity for 2019. HS subheadings 3103.11, 3103.19, 3105.20, 3105.30, 3105.40, 3105.51, and 3105.59 are basket categories that contains products outside of the scope of these investigations. Source: Official exports statistics under HS subheadings 3103.11, 3103.19, 3105.20, 3105.30, 3105.40, 3105.51, and 3105.59, as reported by various statistical authorities in the Global Trade Atlas database, accessed January 11, 2021 and official global import statistics for Saudi Arabia under HS subheadings 3103.11, 3103.19, 3105.20, 3105.30, 3105.40, 3105.51, and 3105.59, as reported by various statistical reporting authorities in the Global Trade Atlas database, accessed January 11, 2021.
A-1
APPENDIX A
FEDERAL REGISTER NOTICES


A-3
The Commission makes available notices relevant to its investigations and reviews on its website, www.usitc.gov. In addition, the following tabulation presents, in chronological order, Federal Register notices issued by the Commission and Commerce during the current proceeding.
Citation Title Link
85 FR 40319, July 6, 2020
Phosphate Fertilizers from Morocco and Russia; Institution of Countervailing Duty Investigations and Scheduling of Preliminary Phase Investigations
https://www.govinfo.gov/content/pkg/FR-2020-07-06/pdf/2020-14294.pdf
85 FR 44505, July 23, 2020
Phosphate Fertilizers From the Kingdom of Morocco and the Russian Federation: Initiation of Countervailing Duty Investigations
https://www.govinfo.gov/content/pkg/FR-2020-07-23/pdf/2020-15956.pdf
85 FR 49394, August 13, 2020
Phosphate Fertilizers From Morocco and Russia
https://www.govinfo.gov/content/pkg/FR-2020-08-13/pdf/2020-17726.pdf
85 FR 76522, November 30, 2020
Phosphate Fertilizers From the Kingdom of Morocco: Preliminary Affirmative Countervailing Duty Determination
https://www.govinfo.gov/content/pkg/FR-2020-11-30/pdf/2020-26331.pdf
85 FR 76524, November 30, 2020
Phosphate Fertilizers From the Russian Federation: Preliminary Affirmative Countervailing Duty Determination
https://www.govinfo.gov/content/pkg/FR-2020-11-30/pdf/2020-26332.pdf
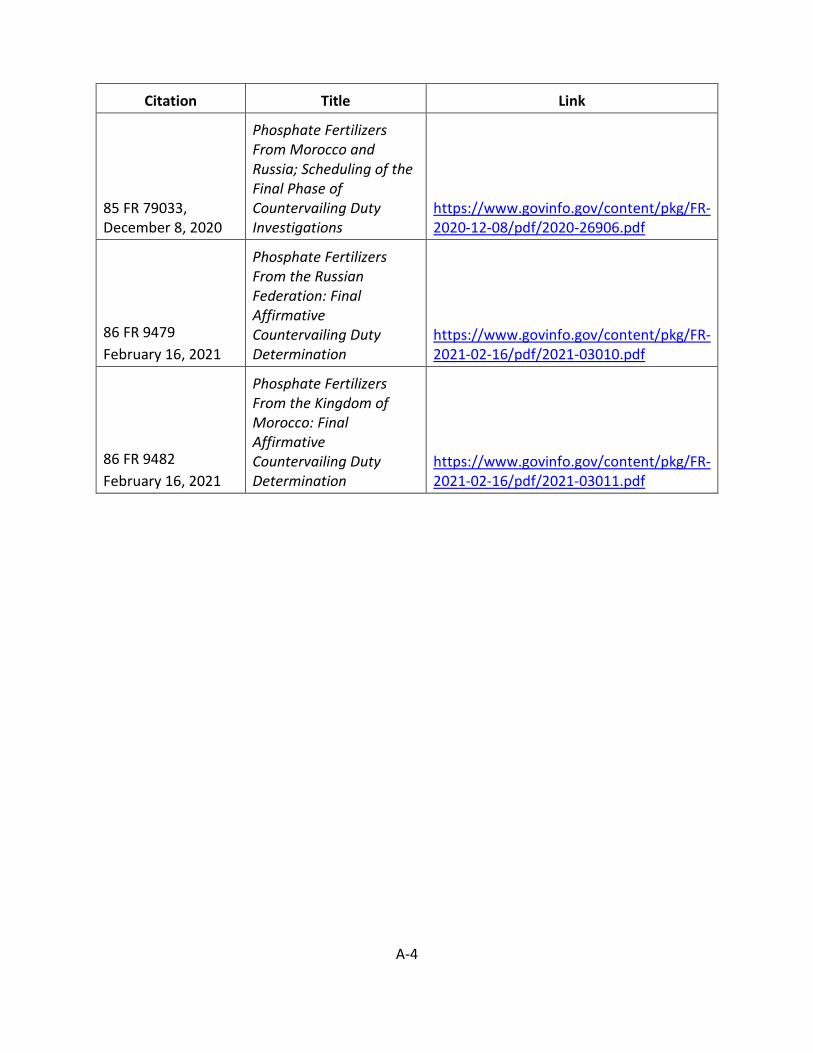
A-4
Citation Title Link
85 FR 79033, December 8, 2020
Phosphate Fertilizers From Morocco and Russia; Scheduling of the Final Phase of Countervailing Duty Investigations
https://www.govinfo.gov/content/pkg/FR-2020-12-08/pdf/2020-26906.pdf
86 FR 9479 February 16, 2021
Phosphate Fertilizers From the Russian Federation: Final Affirmative Countervailing Duty Determination
https://www.govinfo.gov/content/pkg/FR-2021-02-16/pdf/2021-03010.pdf
86 FR 9482 February 16, 2021
Phosphate Fertilizers From the Kingdom of Morocco: Final Affirmative Countervailing Duty Determination
https://www.govinfo.gov/content/pkg/FR-2021-02-16/pdf/2021-03011.pdf

B-1
APPENDIX B
LIST OF HEARING WITNESSES


- 1 -
CALENDAR OF PUBLIC HEARING
Those listed below appeared in the United States International Trade Commission’s hearing via
videoconference:
Subject: Phosphate Fertilizers from Morocco and Russia
Inv. Nos.: 701-TA-650 and 651 (Final) Date and Time: February 9, 2021 - 9:30 a.m.
CONGRESSIONAL APPEARANCE: The Honorable W. Gregory Steube, U.S. Representative, 17th District, Florida
OPENING REMARKS: Petitioners (Patrick J. McLain, Wilmer Cutler Pickering Hale and Dorr LLP) Respondents (Paul C. Rosenthal, Kelley Drye & Warren LLP) In Support of the Imposition of Countervailing Duty Orders: Wilmer Cutler Pickering Hale and Dorr LLP Washington, DC on behalf of The Mosaic Company (“Mosaic”)
James “Joc” O’Rourke, President and Chief Executive Officer, Mosaic
Clint Freeland, Chief Financial Officer, Mosaic
Richard McLellan, Senior Vice President, Commercial, Mosaic
Andy Jung, Vice President, Market and Strategic Analysis, Mosaic
Daniel Klett, Principal, Capital Trade Inc.
David J. Ross ) Patrick J. McLain ) – OF COUNSEL Stephanie Hartmann )
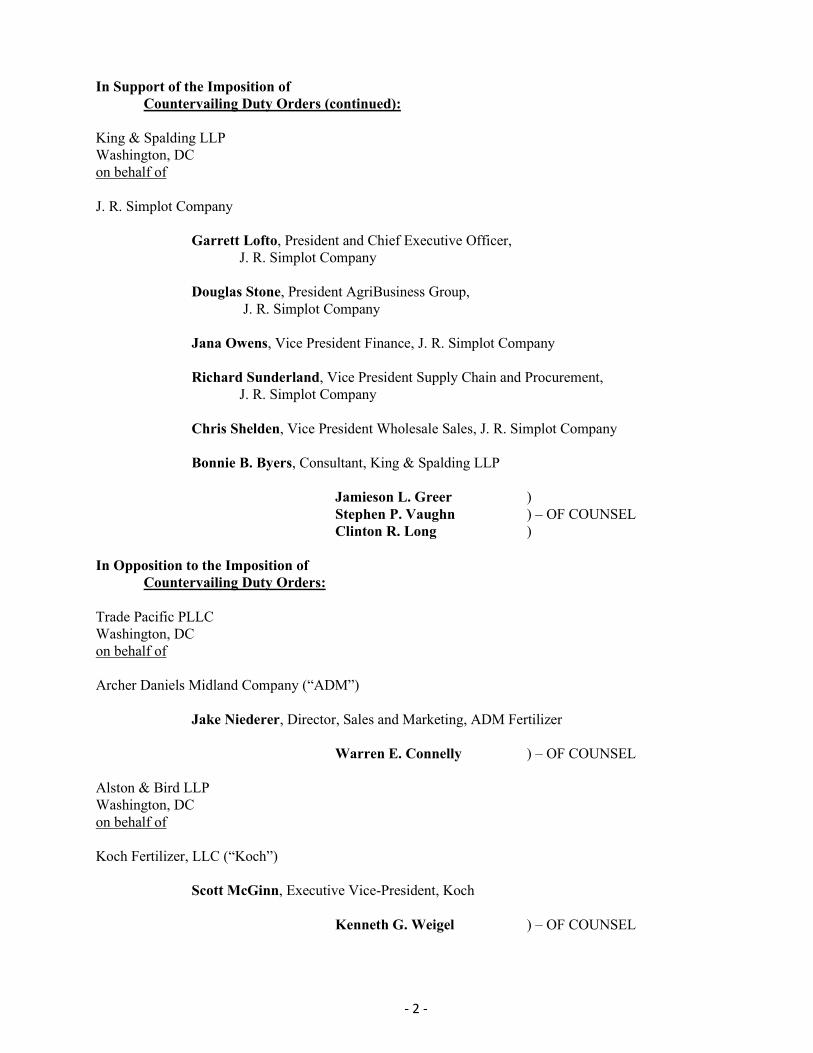
- 2 -
In Support of the Imposition of Countervailing Duty Orders (continued): King & Spalding LLP Washington, DC on behalf of J. R. Simplot Company
Garrett Lofto, President and Chief Executive Officer, J. R. Simplot Company
Douglas Stone, President AgriBusiness Group, J. R. Simplot Company
Jana Owens, Vice President Finance, J. R. Simplot Company
Richard Sunderland, Vice President Supply Chain and Procurement,
J. R. Simplot Company
Chris Shelden, Vice President Wholesale Sales, J. R. Simplot Company
Bonnie B. Byers, Consultant, King & Spalding LLP
Jamieson L. Greer ) Stephen P. Vaughn ) – OF COUNSEL Clinton R. Long )
In Opposition to the Imposition of Countervailing Duty Orders: Trade Pacific PLLC Washington, DC on behalf of Archer Daniels Midland Company (“ADM”)
Jake Niederer, Director, Sales and Marketing, ADM Fertilizer
Warren E. Connelly ) – OF COUNSEL Alston & Bird LLP Washington, DC on behalf of Koch Fertilizer, LLC (“Koch”)
Scott McGinn, Executive Vice-President, Koch
Kenneth G. Weigel ) – OF COUNSEL
- 3 -
In Opposition to the Imposition of Countervailing Duty Orders (continued): Kelley Drye & Warren LLP Washington, DC on behalf of International Raw Materials
William P. O’Neill Jr., President, International Raw Materials Ltd.
Brooke McMullin, Vice President, International Raw Materials Ltd.
David Coppess, Retired Executive Vice President, Sales and Marketing, Heartland Co-Op
Michael T. Kerwin, Assistant Director, Georgetown Economic Services, LLC
Paul C. Rosenthal )
) – OF COUNSEL Melissa M. Brewer )
Covington & Burling LLP Washington, DC on behalf of OCP S.A.
Marouane Ameziane, Executive Vice President, Strategy and Corporate Development, OCP S.A.
Jamal Eddine Bensari, Executive Vice President, Commercial,
OCP S.A.
Michael Rahm, Michael R Rahm Consulting LLC
Jim Dougan, Vice President, Economic Consulting Services LLC
Cara Groden, Senior Economist, Economic Consulting Services LLC
Shara L. Aranoff ) ) – OF COUNSEL
James M. Smith )

- 4 -
In Opposition to the Imposition of Countervailing Duty Orders (continued): Hogan Lovells US LLP Washington, DC on behalf of Gavilon Fertilizer, LLC
Jared R. Wessel ) – OF COUNSEL Crowell & Moring LLP Washington, DC on behalf of PhosAgro PJSC (“PhosAgro”)
Alexander Sharabaiko, Deputy Chief Executive Officer, Finance and International Projects, PhosAgro
Daniel J. Cannistra ) – OF COUNSEL
Squire Patton Boggs (US) LLP Washington, DC on behalf of EuroChem North America Corporation
Donal Lambert, President and Secretary, EuroChem North America Corporation
Jeremy W. Dutra ) – OF COUNSEL
REBUTTAL/CLOSING REMARKS: Petitioners (Patrick J. McLain, Wilmer Cutler Pickering Hale and Dorr LLP; and Jamieson L. Greer, King & Spalding LLP) Respondents (Shara L. Aranoff, Covington & Burling LLP)
-END-
C-1
APPENDIX C
SUMMARY DATA

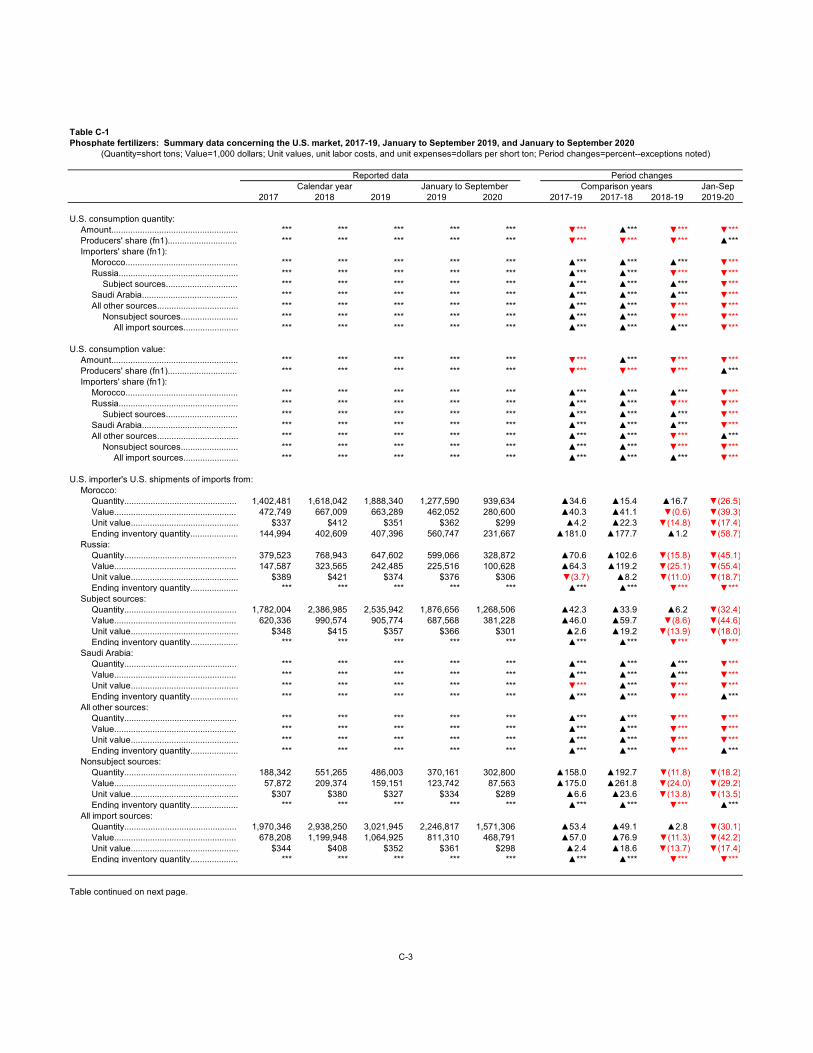
Table C-1Phosphate fertilizers: Summary data concerning the U.S. market, 2017-19, January to September 2019, and January to September 2020
Jan-Sep2017 2018 2019 2019 2020 2017-19 2017-18 2018-19 2019-20
U.S. consumption quantity:Amount..................................................... *** *** *** *** *** ▼*** ▲*** ▼*** ▼*** Producers' share (fn1)............................. *** *** *** *** *** ▼*** ▼*** ▼*** ▲*** Importers' share (fn1):
Morocco............................................... *** *** *** *** *** ▲*** ▲*** ▲*** ▼*** Russia.................................................. *** *** *** *** *** ▲*** ▲*** ▼*** ▼***
Subject sources.............................. *** *** *** *** *** ▲*** ▲*** ▲*** ▼*** Saudi Arabia........................................ *** *** *** *** *** ▲*** ▲*** ▲*** ▼*** All other sources.................................. *** *** *** *** *** ▲*** ▲*** ▼*** ▼***
Nonsubject sources........................ *** *** *** *** *** ▲*** ▲*** ▼*** ▼*** All import sources....................... *** *** *** *** *** ▲*** ▲*** ▲*** ▼***
U.S. consumption value:Amount..................................................... *** *** *** *** *** ▼*** ▲*** ▼*** ▼*** Producers' share (fn1)............................. *** *** *** *** *** ▼*** ▼*** ▼*** ▲*** Importers' share (fn1):
Morocco............................................... *** *** *** *** *** ▲*** ▲*** ▲*** ▼*** Russia.................................................. *** *** *** *** *** ▲*** ▲*** ▼*** ▼***
Subject sources.............................. *** *** *** *** *** ▲*** ▲*** ▲*** ▼*** Saudi Arabia........................................ *** *** *** *** *** ▲*** ▲*** ▲*** ▼*** All other sources.................................. *** *** *** *** *** ▲*** ▲*** ▼*** ▲***
Nonsubject sources........................ *** *** *** *** *** ▲*** ▲*** ▼*** ▼*** All import sources....................... *** *** *** *** *** ▲*** ▲*** ▲*** ▼***
U.S. importer's U.S. shipments of imports from:Morocco:
Quantity............................................... 1,402,481 1,618,042 1,888,340 1,277,590 939,634 ▲34.6 ▲15.4 ▲16.7 ▼(26.5)Value................................................... 472,749 667,009 663,289 462,052 280,600 ▲40.3 ▲41.1 ▼(0.6) ▼(39.3)Unit value............................................. $337 $412 $351 $362 $299 ▲4.2 ▲22.3 ▼(14.8) ▼(17.4)Ending inventory quantity.................... 144,994 402,609 407,396 560,747 231,667 ▲181.0 ▲177.7 ▲1.2 ▼(58.7)
Russia:Quantity............................................... 379,523 768,943 647,602 599,066 328,872 ▲70.6 ▲102.6 ▼(15.8) ▼(45.1)Value................................................... 147,587 323,565 242,485 225,516 100,628 ▲64.3 ▲119.2 ▼(25.1) ▼(55.4)Unit value............................................. $389 $421 $374 $376 $306 ▼(3.7) ▲8.2 ▼(11.0) ▼(18.7)Ending inventory quantity.................... *** *** *** *** *** ▲*** ▲*** ▼*** ▼***
Subject sources:Quantity............................................... 1,782,004 2,386,985 2,535,942 1,876,656 1,268,506 ▲42.3 ▲33.9 ▲6.2 ▼(32.4)Value................................................... 620,336 990,574 905,774 687,568 381,228 ▲46.0 ▲59.7 ▼(8.6) ▼(44.6)Unit value............................................. $348 $415 $357 $366 $301 ▲2.6 ▲19.2 ▼(13.9) ▼(18.0)Ending inventory quantity.................... *** *** *** *** *** ▲*** ▲*** ▼*** ▼***
Saudi Arabia:Quantity............................................... *** *** *** *** *** ▲*** ▲*** ▲*** ▼*** Value................................................... *** *** *** *** *** ▲*** ▲*** ▲*** ▼*** Unit value............................................. *** *** *** *** *** ▼*** ▲*** ▼*** ▼*** Ending inventory quantity.................... *** *** *** *** *** ▲*** ▲*** ▼*** ▲***
All other sources:Quantity............................................... *** *** *** *** *** ▲*** ▲*** ▼*** ▼*** Value................................................... *** *** *** *** *** ▲*** ▲*** ▼*** ▼*** Unit value............................................. *** *** *** *** *** ▲*** ▲*** ▼*** ▼*** Ending inventory quantity.................... *** *** *** *** *** ▲*** ▲*** ▼*** ▲***
Nonsubject sources:Quantity............................................... 188,342 551,265 486,003 370,161 302,800 ▲158.0 ▲192.7 ▼(11.8) ▼(18.2)Value................................................... 57,872 209,374 159,151 123,742 87,563 ▲175.0 ▲261.8 ▼(24.0) ▼(29.2)Unit value............................................. $307 $380 $327 $334 $289 ▲6.6 ▲23.6 ▼(13.8) ▼(13.5)Ending inventory quantity.................... *** *** *** *** *** ▲*** ▲*** ▼*** ▲***
All import sources:Quantity............................................... 1,970,346 2,938,250 3,021,945 2,246,817 1,571,306 ▲53.4 ▲49.1 ▲2.8 ▼(30.1)Value................................................... 678,208 1,199,948 1,064,925 811,310 468,791 ▲57.0 ▲76.9 ▼(11.3) ▼(42.2)Unit value............................................. $344 $408 $352 $361 $298 ▲2.4 ▲18.6 ▼(13.7) ▼(17.4)Ending inventory quantity.................... *** *** *** *** *** ▲*** ▲*** ▼*** ▼***
Table continued on next page.
C-3
(Quantity=short tons; Value=1,000 dollars; Unit values, unit labor costs, and unit expenses=dollars per short ton; Period changes=percent--exceptions noted)
Reported data Period changesCalendar year January to September Comparison years
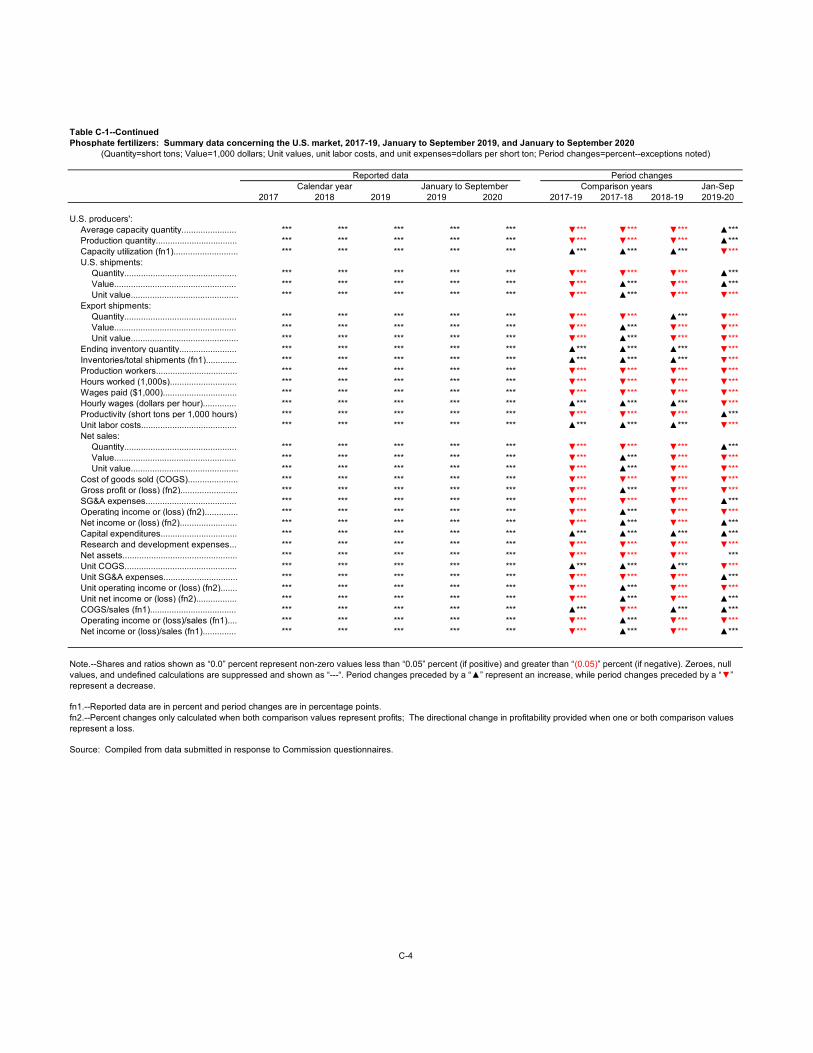
Table C-1--ContinuedPhosphate fertilizers: Summary data concerning the U.S. market, 2017-19, January to September 2019, and January to September 2020
Jan-Sep2017 2018 2019 2019 2020 2017-19 2017-18 2018-19 2019-20
U.S. producers':Average capacity quantity....................... *** *** *** *** *** ▼*** ▼*** ▼*** ▲*** Production quantity.................................. *** *** *** *** *** ▼*** ▼*** ▼*** ▲*** Capacity utilization (fn1)........................... *** *** *** *** *** ▲*** ▲*** ▲*** ▼*** U.S. shipments:
Quantity............................................... *** *** *** *** *** ▼*** ▼*** ▼*** ▲*** Value................................................... *** *** *** *** *** ▼*** ▲*** ▼*** ▲*** Unit value............................................. *** *** *** *** *** ▼*** ▲*** ▼*** ▼***
Export shipments:Quantity............................................... *** *** *** *** *** ▼*** ▼*** ▲*** ▼*** Value................................................... *** *** *** *** *** ▼*** ▲*** ▼*** ▼*** Unit value............................................. *** *** *** *** *** ▼*** ▲*** ▼*** ▼***
Ending inventory quantity........................ *** *** *** *** *** ▲*** ▲*** ▲*** ▼*** Inventories/total shipments (fn1)............. *** *** *** *** *** ▲*** ▲*** ▲*** ▼*** Production workers.................................. *** *** *** *** *** ▼*** ▼*** ▼*** ▼*** Hours worked (1,000s)............................ *** *** *** *** *** ▼*** ▼*** ▼*** ▼*** Wages paid ($1,000)............................... *** *** *** *** *** ▼*** ▼*** ▼*** ▼*** Hourly wages (dollars per hour).............. *** *** *** *** *** ▲*** ▲*** ▲*** ▼*** Productivity (short tons per 1,000 hours) *** *** *** *** *** ▼*** ▼*** ▼*** ▲*** Unit labor costs........................................ *** *** *** *** *** ▲*** ▲*** ▲*** ▼*** Net sales:
Quantity............................................... *** *** *** *** *** ▼*** ▼*** ▼*** ▲*** Value................................................... *** *** *** *** *** ▼*** ▲*** ▼*** ▼*** Unit value............................................. *** *** *** *** *** ▼*** ▲*** ▼*** ▼***
Cost of goods sold (COGS)..................... *** *** *** *** *** ▼*** ▼*** ▼*** ▼*** Gross profit or (loss) (fn2)........................ *** *** *** *** *** ▼*** ▲*** ▼*** ▼*** SG&A expenses...................................... *** *** *** *** *** ▼*** ▼*** ▼*** ▲*** Operating income or (loss) (fn2).............. *** *** *** *** *** ▼*** ▲*** ▼*** ▼*** Net income or (loss) (fn2)........................ *** *** *** *** *** ▼*** ▲*** ▼*** ▲*** Capital expenditures................................ *** *** *** *** *** ▲*** ▲*** ▲*** ▲*** Research and development expenses... *** *** *** *** *** ▼*** ▼*** ▼*** ▼*** Net assets................................................ *** *** *** *** *** ▼*** ▼*** ▼*** *** Unit COGS............................................... *** *** *** *** *** ▲*** ▲*** ▲*** ▼*** Unit SG&A expenses............................... *** *** *** *** *** ▼*** ▼*** ▼*** ▲*** Unit operating income or (loss) (fn2)....... *** *** *** *** *** ▼*** ▲*** ▼*** ▼*** Unit net income or (loss) (fn2)................. *** *** *** *** *** ▼*** ▲*** ▼*** ▲*** COGS/sales (fn1).................................... *** *** *** *** *** ▲*** ▼*** ▲*** ▲*** Operating income or (loss)/sales (fn1).... *** *** *** *** *** ▼*** ▲*** ▼*** ▼*** Net income or (loss)/sales (fn1).............. *** *** *** *** *** ▼*** ▲*** ▼*** ▲***
fn1.--Reported data are in percent and period changes are in percentage points.
Source: Compiled from data submitted in response to Commission questionnaires.
Calendar year January to September Comparison years
Note.--Shares and ratios shown as “0.0” percent represent non-zero values less than “0.05” percent (if positive) and greater than “(0.05)” percent (if negative). Zeroes, null values, and undefined calculations are suppressed and shown as “---“. Period changes preceded by a “▲” represent an increase, while period changes preceded by a “▼” represent a decrease.
fn2.--Percent changes only calculated when both comparison values represent profits; The directional change in profitability provided when one or both comparison values represent a loss.
C-4
(Quantity=short tons; Value=1,000 dollars; Unit values, unit labor costs, and unit expenses=dollars per short ton; Period changes=percent--exceptions noted)
Reported data Period changes
D-1
APPENDIX D
U.S. PRODUCERS’ AND U.S. IMPORTERS’ END-OF-PERIOD INVENTORIES BY QUARTER

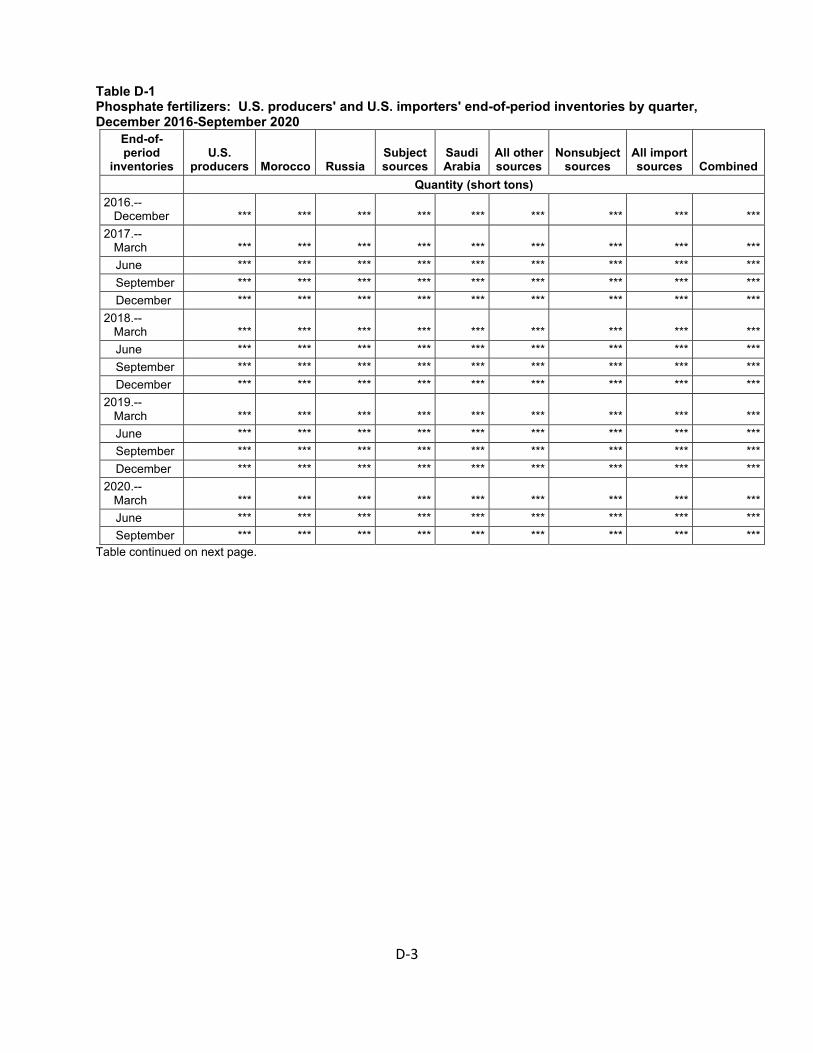
D-3
Table D-1 Phosphate fertilizers: U.S. producers' and U.S. importers' end-of-period inventories by quarter, December 2016-September 2020
End-of-period
inventories U.S.
producers Morocco Russia Subject sources
Saudi Arabia
All other sources
Nonsubject sources
All import sources Combined
Quantity (short tons) 2016.-- December *** *** *** *** *** *** *** *** *** 2017.-- March *** *** *** *** *** *** *** *** ***
June *** *** *** *** *** *** *** *** *** September *** *** *** *** *** *** *** *** *** December *** *** *** *** *** *** *** *** ***
2018.-- March *** *** *** *** *** *** *** *** ***
June *** *** *** *** *** *** *** *** *** September *** *** *** *** *** *** *** *** *** December *** *** *** *** *** *** *** *** ***
2019.-- March *** *** *** *** *** *** *** *** ***
June *** *** *** *** *** *** *** *** *** September *** *** *** *** *** *** *** *** *** December *** *** *** *** *** *** *** *** ***
2020.-- March *** *** *** *** *** *** *** *** ***
June *** *** *** *** *** *** *** *** *** September *** *** *** *** *** *** *** *** ***
Table continued on next page.

D-4
Table D-1—Continued Phosphate fertilizers: U.S. producers' and U.S. importers' end-of-period inventories by quarter, December 2016-September 2020
End-of-period
inventories U.S.
producers Morocco Russia Subject sources
Saudi Arabia
All other sources
Nonsubject sources
All import sources Combined
Share across (percent) 2016.-- December *** *** *** *** *** *** *** *** *** 2017.-- March *** *** *** *** *** *** *** *** ***
June *** *** *** *** *** *** *** *** *** September *** *** *** *** *** *** *** *** *** December *** *** *** *** *** *** *** *** ***
2018.-- March *** *** *** *** *** *** *** *** ***
June *** *** *** *** *** *** *** *** *** September *** *** *** *** *** *** *** *** *** December *** *** *** *** *** *** *** *** ***
2019.-- March *** *** *** *** *** *** *** *** ***
June *** *** *** *** *** *** *** *** *** September *** *** *** *** *** *** *** *** *** December *** *** *** *** *** *** *** *** ***
2020.-- March *** *** *** *** *** *** *** *** ***
June *** *** *** *** *** *** *** *** *** September *** *** *** *** *** *** *** *** ***
Source: Compiled from data submitted in response to Commission questionnaires.

D-5
Table D-2 Phosphate fertilizers: Comparisons between periods of reported quarterly inventory levels, December 31, 2016 through September 30, 2020
End-of-period
inventories U.S.
producers Morocco Russia Subject sources
Saudi Arabia
All other sources
Nonsubject sources
All import sources Combined
Quantity (short tons) EOP inventories Dec 31.-- 2016 *** *** *** *** *** *** *** *** ***
2017 *** *** *** *** *** *** *** *** *** 2018 *** *** *** *** *** *** *** *** *** 2019 *** *** *** *** *** *** *** *** ***
Percent change (percent) EOP inventories Dec 31.-- 2016-19 ▲*** ▲*** ▲*** ▲*** ▲*** ▲*** ▲*** ▲*** ▲***
2016-17 ▼*** ▲*** ▲*** ▲*** *** ▼*** ▼*** ▲*** ▲*** 2017-18 ▲*** ▲*** ▲*** ▲*** ▲*** ▲*** ▲*** ▲*** ▲*** 2018-19 ▲*** ▲*** ▼*** ▼*** ▼*** ▼*** ▼*** ▼*** ▼***
Quantity (short tons) EOP inventories Mar 31.-- 2017 *** *** *** *** *** *** *** *** ***
2018 *** *** *** *** *** *** *** *** *** 2019 *** *** *** *** *** *** *** *** *** 2020 *** *** *** *** *** *** *** *** ***
Percent change (percent) EOP inventories Mar 31.-- 2017-20 ▲*** ▲*** ▲*** ▲*** ▲*** ▲*** ▲*** ▲*** ▲***
2017-18 ▲*** ▲*** ▲*** ▲*** ▼*** ▲*** ▼*** ▲*** ▲*** 2018-19 ▲*** ▲*** ▲*** ▲*** ▲*** ▲*** ▲*** ▲*** ▲*** 2019-20 ▼*** ▲*** ▼*** ▼*** ▲*** ▲*** ▲*** ▼*** ▼***
Table continued on next page.
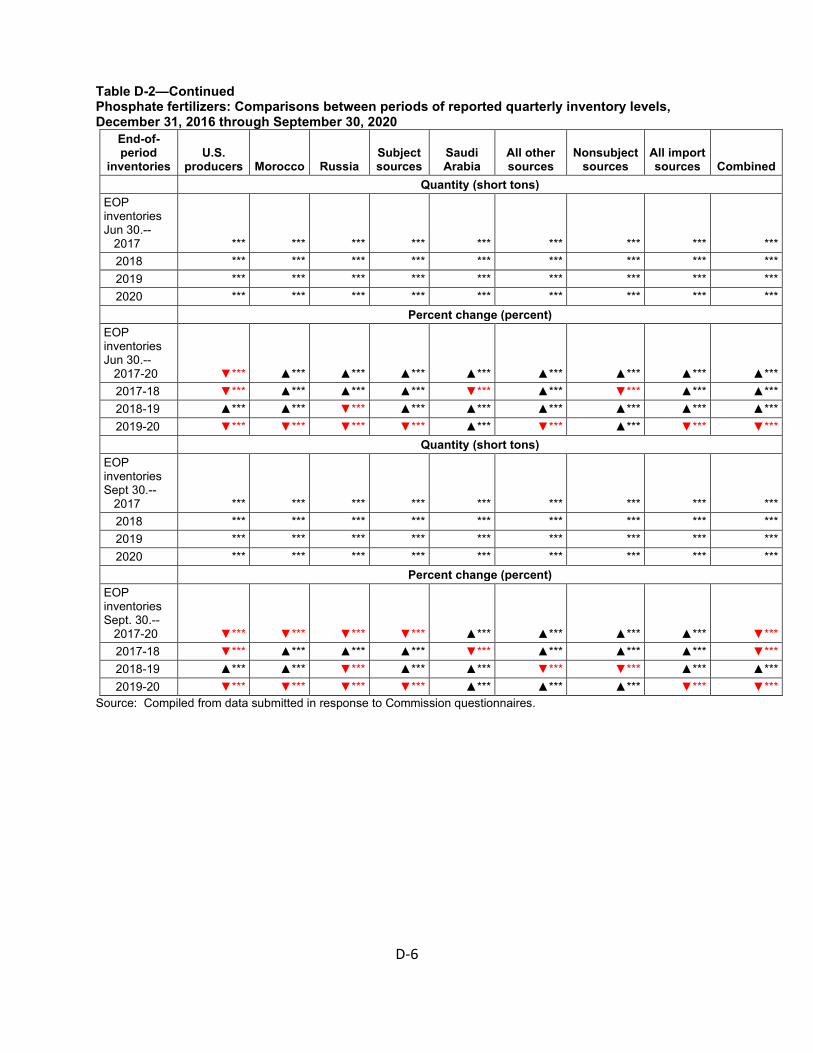
D-6
Table D-2—Continued Phosphate fertilizers: Comparisons between periods of reported quarterly inventory levels, December 31, 2016 through September 30, 2020
End-of-period
inventories U.S.
producers Morocco Russia Subject sources
Saudi Arabia
All other sources
Nonsubject sources
All import sources Combined
Quantity (short tons) EOP inventories Jun 30.-- 2017 *** *** *** *** *** *** *** *** ***
2018 *** *** *** *** *** *** *** *** *** 2019 *** *** *** *** *** *** *** *** *** 2020 *** *** *** *** *** *** *** *** ***
Percent change (percent) EOP inventories Jun 30.-- 2017-20 ▼*** ▲*** ▲*** ▲*** ▲*** ▲*** ▲*** ▲*** ▲***
2017-18 ▼*** ▲*** ▲*** ▲*** ▼*** ▲*** ▼*** ▲*** ▲*** 2018-19 ▲*** ▲*** ▼*** ▲*** ▲*** ▲*** ▲*** ▲*** ▲*** 2019-20 ▼*** ▼*** ▼*** ▼*** ▲*** ▼*** ▲*** ▼*** ▼***
Quantity (short tons) EOP inventories Sept 30.-- 2017 *** *** *** *** *** *** *** *** ***
2018 *** *** *** *** *** *** *** *** *** 2019 *** *** *** *** *** *** *** *** *** 2020 *** *** *** *** *** *** *** *** ***
Percent change (percent) EOP inventories Sept. 30.-- 2017-20 ▼*** ▼*** ▼*** ▼*** ▲*** ▲*** ▲*** ▲*** ▼***
2017-18 ▼*** ▲*** ▲*** ▲*** ▼*** ▲*** ▲*** ▲*** ▼*** 2018-19 ▲*** ▲*** ▼*** ▲*** ▲*** ▼*** ▼*** ▲*** ▲*** 2019-20 ▼*** ▼*** ▼*** ▼*** ▲*** ▲*** ▲*** ▼*** ▼***
Source: Compiled from data submitted in response to Commission questionnaires.
E-1
APPENDIX E
U.S. PRODUCERS’ AND U.S IMPORTERS’ U.S. SHIPMENTS BY PRODUCT TYPE


E-3
Table E-1 Phosphate fertilizers: U.S. producers' U.S. shipments by product type, 2017-19, January to September 2019, and January to September 2020
Item Calendar year January to September
2017 2018 2019 2019 2020 Quantity (short tons) U.S. producers' U.S. shipments.-- MAP *** *** *** *** ***
DAP *** *** *** *** *** TSP *** *** *** *** *** NPS *** *** *** *** *** NSP *** *** *** *** *** All other types *** *** *** *** ***
All types *** *** *** *** *** Value (1,000 dollars) U.S. producers' U.S. shipments.-- MAP *** *** *** *** ***
DAP *** *** *** *** *** TSP *** *** *** *** *** NPS *** *** *** *** *** NSP *** *** *** *** *** All other types *** *** *** *** ***
All types *** *** *** *** *** Unit value (dollars per short ton) U.S. producers' U.S. shipments.-- MAP *** *** *** *** ***
DAP *** *** *** *** *** TSP *** *** *** *** *** NPS *** *** *** *** *** NSP *** *** *** *** *** All other types *** *** *** *** ***
All types *** *** *** *** *** Share of quantity (percent) U.S. producers' U.S. shipments.-- MAP *** *** *** *** ***
DAP *** *** *** *** *** TSP *** *** *** *** *** NPS *** *** *** *** *** NSP *** *** *** *** *** All other types *** *** *** *** ***
All types *** *** *** *** *** Share of value (percent) U.S. producers' U.S. shipments.-- MAP *** *** *** *** ***
DAP *** *** *** *** *** TSP *** *** *** *** *** NPS *** *** *** *** *** NSP *** *** *** *** *** All other types *** *** *** *** ***
All types *** *** *** *** *** Source: Compiled from data submitted in response to Commission questions.

E-4
Table E-2 Phosphate fertilizers: U.S. importers' U.S. shipments by product type, 2017-19, January to September 2019, and January to September 2020
Item Calendar year January to September
2017 2018 2019 2019 2020 Quantity (short tons) U.S. shipments of imports from Morocco.-- MAP 566,394 636,519 1,005,493 626,099 ***
DAP 534,848 700,581 721,023 517,520 379,017 TSP *** *** *** *** *** NPS *** *** *** *** *** NSP *** *** *** *** *** All other types *** *** *** *** ***
All types 1,402,481 1,618,042 1,888,340 1,277,590 939,634 Value (1,000 dollars) U.S. shipments of imports from Morocco.-- MAP 200,720 270,987 359,263 228,533 ***
DAP 181,178 285,565 242,674 183,033 113,428 TSP *** *** *** *** *** NPS *** *** *** *** *** NSP *** *** *** *** *** All other types *** *** *** *** ***
All types 472,749 667,009 663,289 462,052 280,600 Unit value (dollars per short ton) U.S. shipments of imports from Morocco.-- MAP 354 426 357 365 ***
DAP 339 408 337 354 299 TSP *** *** *** *** *** NPS *** *** *** *** *** NSP *** *** *** *** *** All other types *** *** *** *** ***
All types 337 412 351 362 299 Share of quantity (percent) U.S. shipments of imports from Morocco.-- MAP *** *** *** *** ***
DAP *** *** *** *** *** TSP *** *** *** *** *** NPS *** *** *** *** *** NSP *** *** *** *** *** All other types *** *** *** *** ***
All types *** *** *** *** *** Share of value (percent) U.S. shipments of imports from Morocco.-- MAP *** *** *** *** ***
DAP *** *** *** *** *** TSP *** *** *** *** *** NPS *** *** *** *** *** NSP *** *** *** *** *** All other types *** *** *** *** ***
All types *** *** *** *** *** Table continued on next page.
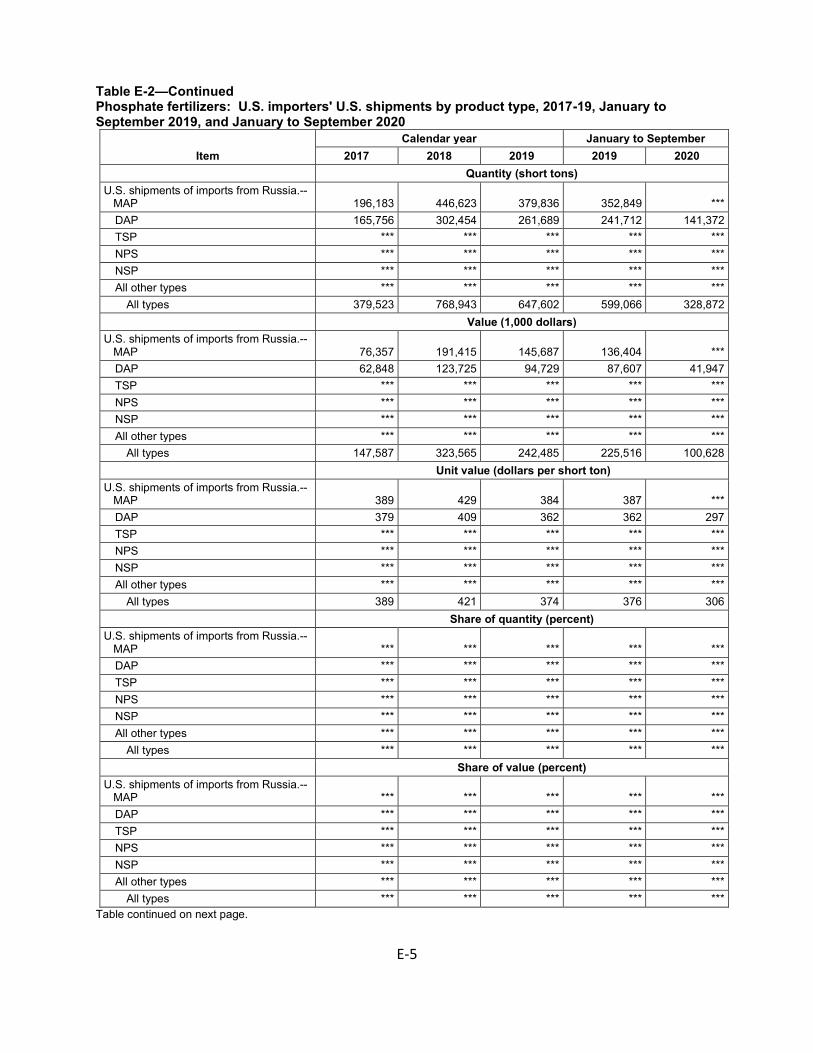
E-5
Table E-2—Continued Phosphate fertilizers: U.S. importers' U.S. shipments by product type, 2017-19, January to September 2019, and January to September 2020
Item Calendar year January to September
2017 2018 2019 2019 2020 Quantity (short tons) U.S. shipments of imports from Russia.-- MAP 196,183 446,623 379,836 352,849 ***
DAP 165,756 302,454 261,689 241,712 141,372 TSP *** *** *** *** *** NPS *** *** *** *** *** NSP *** *** *** *** *** All other types *** *** *** *** ***
All types 379,523 768,943 647,602 599,066 328,872 Value (1,000 dollars) U.S. shipments of imports from Russia.-- MAP 76,357 191,415 145,687 136,404 ***
DAP 62,848 123,725 94,729 87,607 41,947 TSP *** *** *** *** *** NPS *** *** *** *** *** NSP *** *** *** *** *** All other types *** *** *** *** ***
All types 147,587 323,565 242,485 225,516 100,628 Unit value (dollars per short ton) U.S. shipments of imports from Russia.-- MAP 389 429 384 387 ***
DAP 379 409 362 362 297 TSP *** *** *** *** *** NPS *** *** *** *** *** NSP *** *** *** *** *** All other types *** *** *** *** ***
All types 389 421 374 376 306 Share of quantity (percent) U.S. shipments of imports from Russia.-- MAP *** *** *** *** ***
DAP *** *** *** *** *** TSP *** *** *** *** *** NPS *** *** *** *** *** NSP *** *** *** *** *** All other types *** *** *** *** ***
All types *** *** *** *** *** Share of value (percent) U.S. shipments of imports from Russia.-- MAP *** *** *** *** ***
DAP *** *** *** *** *** TSP *** *** *** *** *** NPS *** *** *** *** *** NSP *** *** *** *** *** All other types *** *** *** *** ***
All types *** *** *** *** *** Table continued on next page.

E-6
Table E-2—Continued Phosphate fertilizers: U.S. importers' U.S. shipments by product type, 2017-19, January to September 2019, and January to September 2020
Item Calendar year January to September
2017 2018 2019 2019 2020 Quantity (short tons) U.S. shipments of imports from subject sources.-- MAP 762,577 1,083,142 1,385,329 978,948 580,689
DAP 700,604 1,003,035 982,712 759,232 520,389 TSP *** *** *** *** *** NPS *** *** *** *** *** NSP *** *** *** *** *** All other types *** *** *** *** ***
All types 1,782,004 2,386,985 2,535,942 1,876,656 1,268,506 Value (1,000 dollars) U.S. shipments of imports from subject sources.-- MAP 277,077 462,402 504,950 364,937 176,954
DAP 244,026 409,290 337,403 270,640 155,375 TSP *** *** *** *** *** NPS *** *** *** *** *** NSP *** *** *** *** *** All other types *** *** *** *** ***
All types 620,336 990,574 905,774 687,568 381,228 Unit value (dollars per short ton) U.S. shipments of imports from subject sources.-- MAP 363 427 364 373 305
DAP 348 408 343 356 299 TSP *** *** *** *** *** NPS *** *** *** *** *** NSP *** *** *** *** *** All other types *** *** *** *** ***
All types 348 415 357 366 301 Share of quantity (percent) U.S. shipments of imports from subject sources.-- MAP *** *** *** *** ***
DAP *** *** *** *** *** TSP *** *** *** *** *** NPS *** *** *** *** *** NSP *** *** *** *** *** All other types *** *** *** *** ***
All types *** *** *** *** *** Share of value (percent) U.S. shipments of imports from subject sources.-- MAP *** *** *** *** ***
DAP *** *** *** *** *** TSP *** *** *** *** *** NPS *** *** *** *** *** NSP *** *** *** *** *** All other types *** *** *** *** ***
All types *** *** *** *** *** Table continued on next page.

E-7
Table E-2—Continued Phosphate fertilizers: U.S. importers' U.S. shipments by product type, 2017-19, January to September 2019, and January to September 2020
Item Calendar year January to September
2017 2018 2019 2019 2020 Quantity (short tons) U.S. shipments of imports from Saudi Arabia.-- MAP *** *** *** *** ***
DAP *** *** *** *** *** TSP *** *** *** *** *** NPS *** *** *** *** *** NSP *** *** *** *** *** All other types *** *** *** *** ***
All types *** *** *** *** *** Value (1,000 dollars) U.S. shipments of imports from Saudi Arabia.-- MAP *** *** *** *** ***
DAP *** *** *** *** *** TSP *** *** *** *** *** NPS *** *** *** *** *** NSP *** *** *** *** *** All other types *** *** *** *** ***
All types *** *** *** *** *** Unit value (dollars per short ton) U.S. shipments of imports from Saudi Arabia.-- MAP *** *** *** *** ***
DAP *** *** *** *** *** TSP *** *** *** *** *** NPS *** *** *** *** *** NSP *** *** *** *** *** All other types *** *** *** *** ***
All types *** *** *** *** *** Share of quantity (percent) U.S. shipments of imports from Saudi Arabia.-- MAP *** *** *** *** ***
DAP *** *** *** *** *** TSP *** *** *** *** *** NPS *** *** *** *** *** NSP *** *** *** *** *** All other types *** *** *** *** ***
All types *** *** *** *** *** Share of value (percent) U.S. shipments of imports from Saudi Arabia.-- MAP *** *** *** *** ***
DAP *** *** *** *** *** TSP *** *** *** *** *** NPS *** *** *** *** *** NSP *** *** *** *** *** All other types *** *** *** *** ***
All types *** *** *** *** *** Table continued on next page.

E-8
Table E-2—Continued Phosphate fertilizers: U.S. importers' U.S. shipments by product type, 2017-19, January to September 2019, and January to September 2020
Item Calendar year January to September
2017 2018 2019 2019 2020 Quantity (short tons) U.S. shipments of imports from all other sources.-- MAP *** *** *** *** ***
DAP *** *** *** *** *** TSP *** *** *** *** *** NPS *** *** *** *** *** NSP *** *** *** *** *** All other types *** *** *** *** ***
All types *** *** *** *** *** Value (1,000 dollars) U.S. shipments of imports from all other sources.-- MAP *** *** *** *** ***
DAP *** *** *** *** *** TSP *** *** *** *** *** NPS *** *** *** *** *** NSP *** *** *** *** *** All other types *** *** *** *** ***
All types *** *** *** *** *** Unit value (dollars per short ton) U.S. shipments of imports from all other sources.-- MAP *** *** *** *** ***
DAP *** *** *** *** *** TSP *** *** *** *** *** NPS *** *** *** *** *** NSP *** *** *** *** *** All other types *** *** *** *** ***
All types *** *** *** *** *** Share of quantity (percent) U.S. shipments of imports from all other sources.-- MAP *** *** *** *** ***
DAP *** *** *** *** *** TSP *** *** *** *** *** NPS *** *** *** *** *** NSP *** *** *** *** *** All other types *** *** *** *** ***
All types *** *** *** *** *** Share of value (percent) U.S. shipments of imports from all other sources.-- MAP *** *** *** *** ***
DAP *** *** *** *** *** TSP *** *** *** *** *** NPS *** *** *** *** *** NSP *** *** *** *** *** All other types *** *** *** *** ***
All types *** *** *** *** *** Table continued on next page.
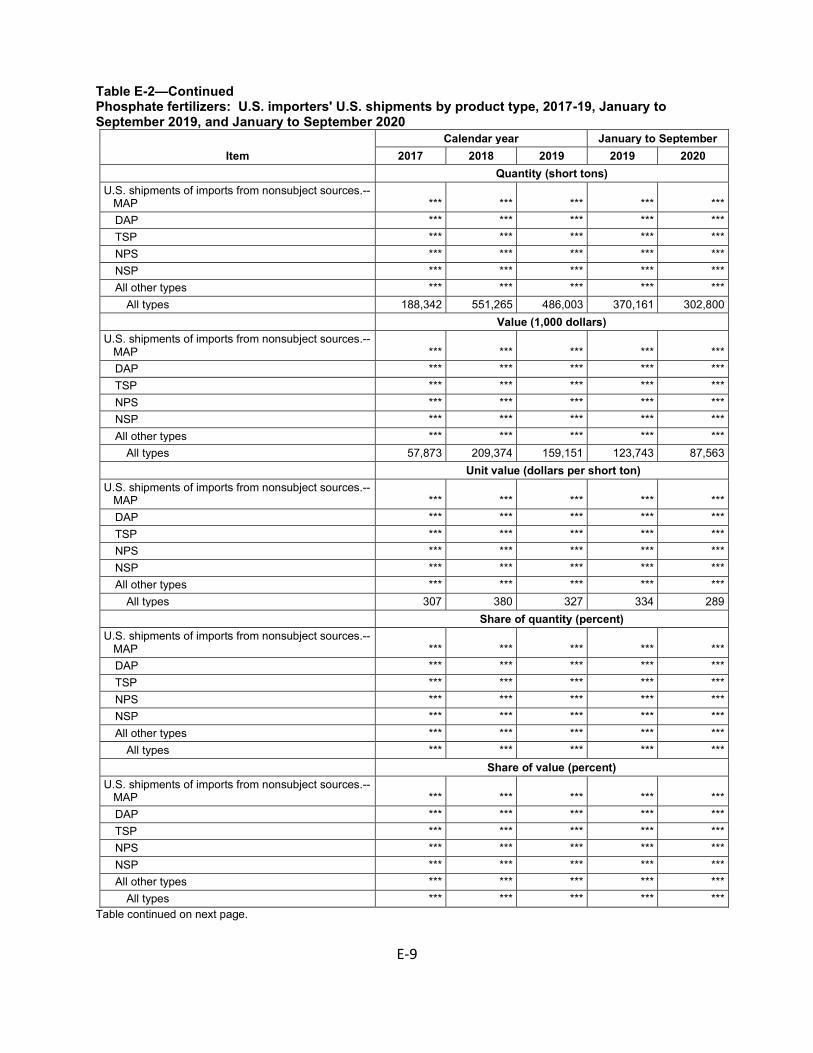
E-9
Table E-2—Continued Phosphate fertilizers: U.S. importers' U.S. shipments by product type, 2017-19, January to September 2019, and January to September 2020
Item Calendar year January to September
2017 2018 2019 2019 2020 Quantity (short tons) U.S. shipments of imports from nonsubject sources.-- MAP *** *** *** *** ***
DAP *** *** *** *** *** TSP *** *** *** *** *** NPS *** *** *** *** *** NSP *** *** *** *** *** All other types *** *** *** *** ***
All types 188,342 551,265 486,003 370,161 302,800 Value (1,000 dollars) U.S. shipments of imports from nonsubject sources.-- MAP *** *** *** *** ***
DAP *** *** *** *** *** TSP *** *** *** *** *** NPS *** *** *** *** *** NSP *** *** *** *** *** All other types *** *** *** *** ***
All types 57,873 209,374 159,151 123,743 87,563 Unit value (dollars per short ton) U.S. shipments of imports from nonsubject sources.-- MAP *** *** *** *** ***
DAP *** *** *** *** *** TSP *** *** *** *** *** NPS *** *** *** *** *** NSP *** *** *** *** *** All other types *** *** *** *** ***
All types 307 380 327 334 289 Share of quantity (percent) U.S. shipments of imports from nonsubject sources.-- MAP *** *** *** *** ***
DAP *** *** *** *** *** TSP *** *** *** *** *** NPS *** *** *** *** *** NSP *** *** *** *** *** All other types *** *** *** *** ***
All types *** *** *** *** *** Share of value (percent) U.S. shipments of imports from nonsubject sources.-- MAP *** *** *** *** ***
DAP *** *** *** *** *** TSP *** *** *** *** *** NPS *** *** *** *** *** NSP *** *** *** *** *** All other types *** *** *** *** ***
All types *** *** *** *** *** Table continued on next page.

E-10
Table E-2—Continued Phosphate fertilizers: U.S. importers' U.S. shipments by product type, 2017-19, January to September 2019, and January to September 2020
Item Calendar year January to September
2017 2018 2019 2019 2020 Quantity (short tons) U.S. shipments of imports from all import sources.-- MAP *** *** *** *** ***
DAP *** *** *** *** *** TSP *** *** *** *** *** NPS *** *** *** *** *** NSP *** *** *** *** *** All other types *** *** *** *** ***
All types 1,970,346 2,938,250 3,021,945 2,246,817 1,571,306 Value (1,000 dollars) U.S. shipments of imports from all import sources.-- MAP *** *** *** *** ***
DAP *** *** *** *** *** TSP *** *** *** *** *** NPS *** *** *** *** *** NSP *** *** *** *** *** All other types *** *** *** *** ***
All types 678,209 1,199,948 1,064,925 811,311 468,791 Unit value (dollars per short ton) U.S. shipments of imports from all import sources.-- MAP *** *** *** *** ***
DAP *** *** *** *** *** TSP *** *** *** *** *** NPS *** *** *** *** *** NSP *** *** *** *** *** All other types *** *** *** *** ***
All types 344 408 352 361 298 Share of quantity (percent) U.S. shipments of imports from all import sources.-- MAP *** *** *** *** ***
DAP *** *** *** *** *** TSP *** *** *** *** *** NPS *** *** *** *** *** NSP *** *** *** *** *** All other types *** *** *** *** ***
All types *** *** *** *** *** Share of value (percent) U.S. shipments of imports from all import sources.-- MAP *** *** *** *** ***
DAP *** *** *** *** *** TSP *** *** *** *** *** NPS *** *** *** *** *** NSP *** *** *** *** *** All other types *** *** *** *** ***
All types *** *** *** *** *** Note: Shares and ratios shown as "0.0" represent values greater than zero, but less than "0.05" percent. Source: Compiled from data submitted in response to Commission questionnaires.
APPENDIX F
UNIT VALUES AND QUANTITIES OF DAP AND MAP IMPORTED INTO NOLA FROM MOROCCO, RUSSIA, AND SAUDI ARABIA


F-3
Table F-1 Phosphate fertilizers: Unit values and quantities of DAP imported into NOLA, by month, January 2017-September 2020
Period
Morocco Russia Saudi Arabia
Quantity (short tons)
LDP value (1,000
dollars)
Unit value
(dollars per
short ton)
Quantity (short tons)
LDP value (1,000
dollars)
Unit value
(dollars per
short ton)
Quantity (short tons)
LDP value (1,000
dollars)
Unit value
(dollars per
short ton)
2017: January 48,310 14,409 298 12,039 7,394 614 0 0 0 February 0 0 0 31,967 8,751 274 0 0 0 March 66,128 22,481 340 55,446 18,015 325 0 0 0 April 47,682 15,177 318 0 0 0 18,443 5,602 304 May 0 0 0 0 0 0 0 0 0 June 0 0 0 11,091 3,679 332 0 0 0 July 52,150 16,132 309 0 0 0 0 0 0 August 63,054 19,859 315 0 0 0 0 0 0 September 136,077 43,962 323 60,562 19,081 315 0 0 0 October 66,309 21,575 325 0 0 0 0 0 0 November 36,224 11,739 324 0 0 0 0 0 0 December 0 0 0 0 0 0 0 0 0 2018: January 72,308 26,342 364 34,113 11,957 351 0 0 0 February 71,301 25,679 360 36,172 12,787 354 0 0 0 March 78,732 29,575 376 47,915 17,433 364 36,386 12,185 335 April 84,298 30,618 363 20,944 7,734 369 18,758 6,924 369 May 0 0 0 0 0 0 0 0 0 June 23,667 4,260 180 0 0 0 0 0 0 July 34,340 13,814 402 0 0 0 0 0 0 August 73,508 29,653 403 60,703 24,604 405 0 0 0 September 96,595 39,503 409 21,729 9,092 418 0 0 0 October 86,194 36,642 425 52,523 21,904 417 0 0 0 November 0 0 0 16,599 6,899 416 0 0 0 December 107,316 43,558 406 12,018 5,201 433 0 0 0
Table continued on next page.

F-4
Table F-1--Continued Phosphate fertilizers: Unit values and quantities of DAP imported into NOLA, by month, January 2017-September 2020
Period
Morocco Russia Saudi Arabia
Quantity (short tons)
LDP value (1,000
dollars)
Unit value
(dollars per
short ton)
Quantity (short tons)
LDP value (1,000
dollars)
Unit value
(dollars per
short ton)
Quantity (short tons)
LDP value (1,000
dollars)
Unit value
(dollars per
short ton)
2019: January 163,036 63,820 391 68,134 26,929 395 0 0 0 February 97,008 36,415 375 44,411 17,990 405 0 0 0 March 48,136 16,897 351 121,842 44,783 368 53,498 20,534 384 April 37,826 20,572 544 22,860 8,119 355 0 0 0 May 0 0 0 0 0 0 27,750 10,248 369 June 35,419 11,099 313 0 0 0 0 0 0 July 57,924 18,329 316 9,370 2,959 316 0 0 0 August 100,495 30,862 307 23,975 7,225 301 0 0 0 September 46,968 13,767 293 0 0 0 0 0 0 October 98,021 29,294 299 0 0 0 0 0 0 November 46,552 12,839 276 0 0 0 0 0 0 December 36,082 9,063 251 0 0 0 30,287 8,096 267 2020: January 54,906 13,131 239 46,414 11,957 258 0 0 0 February 38,033 10,544 277 0 0 0 0 0 0 March 48,546 13,802 284 66,054 18,126 274 25,179 6,534 259 April 65,714 18,451 281 17,915 4,775 267 35,651 10,792 303 May 71,346 20,176 283 0 0 0 0 0 0 June 36,682 9,742 266 0 0 0 0 0 0 July 24,251 6,645 274 0 0 0 0 0 0 August 0 0 0 0 0 0 0 0 0 September 0 0 0 0 0 0 60,627 20,406 337
Source: Official U.S. import statistics for HTS statistical reporting number 3105.30.0000.

F-5
Table F-2 Phosphate fertilizers: Unit values and quantities of MAP imported into NOLA, by month, January 2017-September 2020
Period
Morocco Russia Saudi Arabia
Quantity (short tons)
LDP value (1,000
dollars)
Unit value
(dollars per
short ton)
Quantity (short tons)
LDP value (1,000
dollars)
Unit value
(dollars per short
ton)
Quantity (short tons)
LDP value (1,000
dollars)
Unit value
(dollars per
short ton)
2017: January 69,792 21,366 306 36,397 12,596 346 0 0 0 February 0 0 0 9,921 2,947 297 0 0 0 March 190,166 68,746 362 92,641 30,350 328 0 0 0 April 49,273 21,059 427 35,918 13,046 363 18,349 5,788 315 May 0 0 0 0 0 0 0 0 0 June 0 0 0 66,620 20,987 315 0 0 0 July 127,054 40,324 317 0 0 0 0 0 0 August 78,835 25,344 321 0 0 0 0 0 0 September 120,279 39,241 326 48,549 16,049 331 0 0 0 October 53,940 17,673 328 31,370 10,111 322 0 0 0 November 22,143 7,240 327 15,983 5,013 314 0 0 0 December 0 0 0 0 0 0 0 0 0 2018: January 80,369 31,072 387 47,269 17,503 370 0 0 0 February 108,398 41,382 382 147,586 54,791 371 0 0 0 March 92,014 35,718 388 97,239 35,808 368 0 0 0 April 106,160 41,408 390 50,518 19,115 378 35,105 13,529 385 May 11,023 4,397 399 0 0 0 0 0 0 June 33,328 12,980 389 0 0 0 0 0 0 July 0 0 0 38,581 14,265 370 0 0 0 August 79,068 32,234 408 0 0 0 0 0 0 September 23,104 9,398 407 69,676 27,826 399 0 0 0 October 132,586 56,902 429 147,577 60,527 410 0 0 0 November 0 0 0 21,158 8,909 421 0 0 0 December 100,928 42,079 417 52,100 21,519 413 11,018 4,295 390
Table continued on next page.

F-6
Table F-2--Continued Phosphate fertilizers: Unit values and quantities of MAP imported into NOLA, by month, January 2017-September 2020
Period
Morocco Russia Saudi Arabia
Quantity (short tons)
LDP value (1,000
dollars)
Unit value
(dollars per
short ton)
Quantity (short tons)
LDP value (1,000
dollars)
Unit value
(dollars per
short ton)
Quantity (short tons)
LDP value (1,000
dollars)
Unit value
(dollars per short
ton) 2019: January 198,118 79,641 402 183,685 72,767 396 0 0 0 February 73,306 27,846 380 59,843 24,465 409 0 0 0 March 59,897 21,451 358 48,512 18,084 373 90,993 30,119 331 April 32,086 10,591 330 39,865 14,539 365 0 0 0 May 0 0 0 16,976 5,828 343 30,112 11,310 376 June 42,517 13,189 310 0 0 0 0 0 0 July 62,611 19,733 315 0 0 0 0 0 0 August 126,993 38,755 305 0 0 0 0 0 0 September 129,733 37,374 288 0 0 0 0 0 0 October 135,078 39,856 295 0 0 0 12,064 3,010 250 November 69,354 19,379 279 9,665 2,870 297 13,627 3,534 259 December 97,854 24,941 255 38,581 10,124 262 30,007 8,098 270 2020: January 112,108 25,785 230 63,154 16,323 258 0 0 0 February 16,402 4,548 277 4,594 1,188 258 12,120 2,554 211 March 114,231 32,137 281 46,472 11,881 256 30,123 7,817 259 April 182,331 51,441 282 0 0 0 0 0 0 May 104,229 29,315 281 0 0 0 0 0 0 June 12,217 3,110 255 0 0 0 0 0 0 July 31,438 8,614 274 0 0 0 0 0 0 August 0 0 0 13,517 4,199 311 0 0 0 September 0 0 0 0 0 0 0 0 0
Source: Official U.S. import statistics for HTS statistical reporting number 3105.40.0010.
