phosphorus flagship for stewardship
TRANSCRIPT


Phosphorus a flagship for stewardship: Challenges facing India today, global reserves, opportunities
for nutrient recycling, use efficiency and P-footprint
Abhijit Sarkar Roll No. 10532
Division of soil Science & Agricultural Chemistry Indian Agricultural Research Institute
New Delhi - 110012

CONTENTS

Stewardship:
“responsibility for sustainable
development shared by all those
whose actions affect environmental
performance, economic activity, and
social progress, reflected as both a
value and a practice by individuals,
organisations, communities and
competent authorities.”
International Standard Organization
(ISO 20121) HMS Victory, flagship of the First Sea
Lord of the Royal Navy
Flagship:
A vessel used by the commanding
officer of a group of naval ships,
reflecting the custom of its
commander, characteristically a flag
officer, flying a distinguishing flag.
Introduction

P N Fe C
Limiting nutrient
“The nutrient present in the least relative amount is the limiting nutrient”
The Barrel concept
“even if all but one of the essential elements be present, the absence of that one constituent renders the crop barren”
Liebig’s Law of Minimum
Phosphorus use efficiency not more than 20%

Phosphorus, a limiting nutrient………..Why?
Al3+ Fe3+
Fe3+ Al3+
H2PO4-
AlPO4. 2H2O
FePO4. 2H2O
Ca3(PO4)2 HPO42-
Ca2+
Ca2+
Ca2+
Ca2+
Ca2+

P P
P P
Phosphorus, a limiting nutrient………..Why?
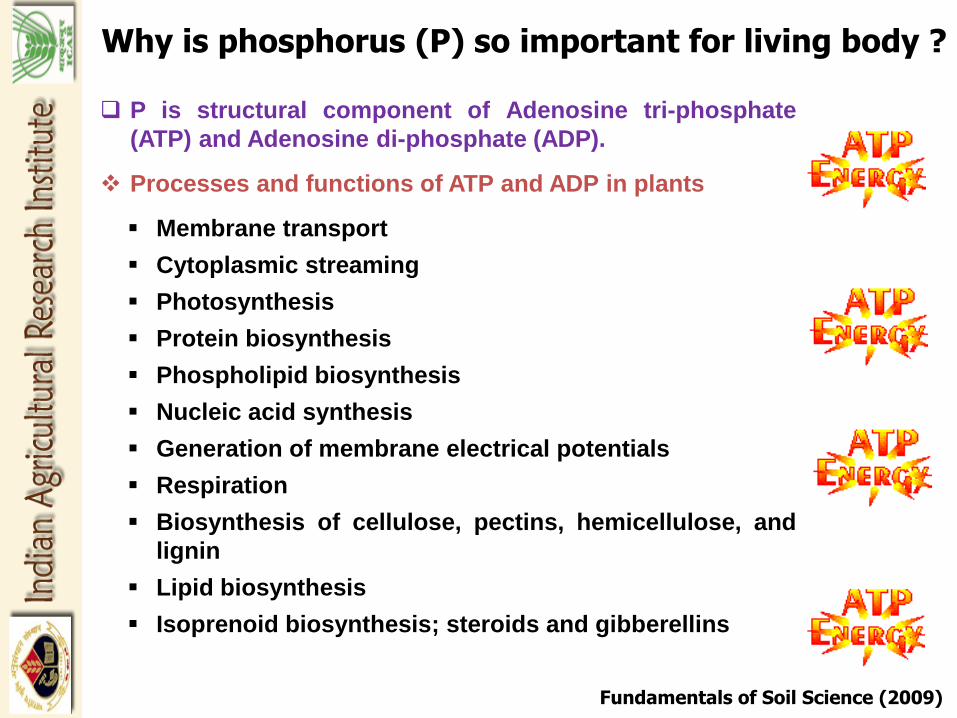
Why is phosphorus (P) so important for living body ?
P is structural component of Adenosine tri-phosphate
(ATP) and Adenosine di-phosphate (ADP).
Processes and functions of ATP and ADP in plants
Membrane transport
Cytoplasmic streaming
Photosynthesis
Protein biosynthesis
Phospholipid biosynthesis
Nucleic acid synthesis
Generation of membrane electrical potentials
Respiration
Biosynthesis of cellulose, pectins, hemicellulose, and
lignin
Lipid biosynthesis
Isoprenoid biosynthesis; steroids and gibberellins
Fundamentals of Soil Science (2009)

Why is rock phosphates (RPs) so important for living body ?
ROCK PHOSPHATE
IFDC (2010)
Limitation confronting India for enhancing her agricultural produce
India as a country having 1.22 billions population but endowed with about 2.4% share of the continental land mass
Has limited land tract not commensurate to the need of the seething mass of humanity settled within the confines of the national boundary
Consequently the country would need in foreseeable future extensive application of NPK fertilizer in a balanced form for enhanced food production
Fortunately the arable land mass of the country is however not so insignificant
Rock phosphate therefore would remain as an essential fertilizer raw material input for sustaining the ever increasing food security of the nation
Unfortunately India as a country with sub-continental dimension has very limited phosphate mining operation
http://agricoop.nic.in/
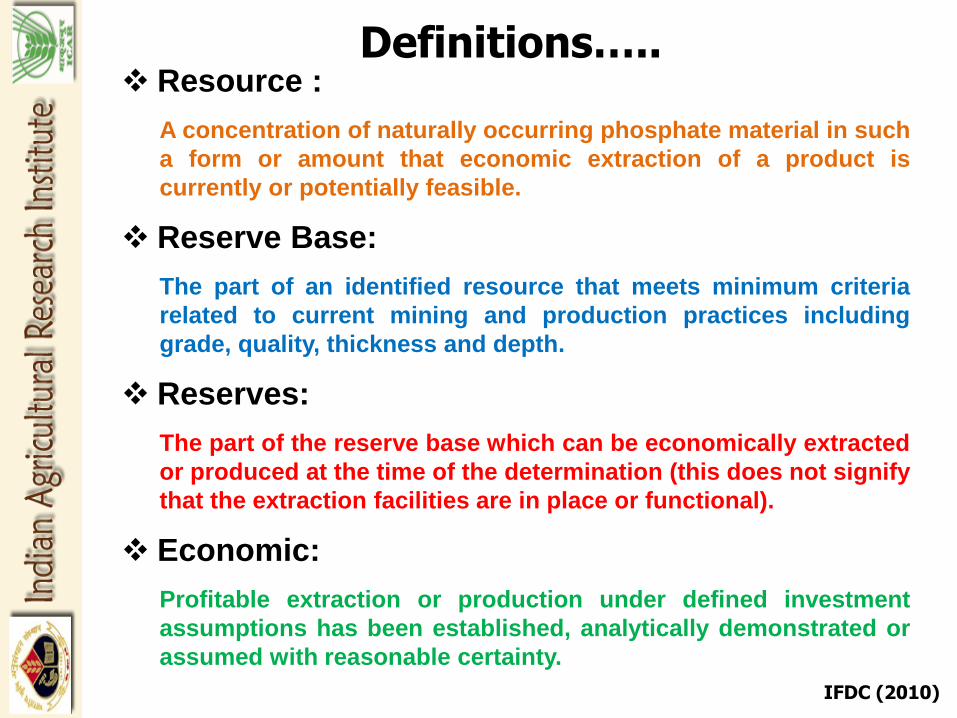
Resource :
A concentration of naturally occurring phosphate material in such
a form or amount that economic extraction of a product is
currently or potentially feasible.
Reserve Base:
The part of an identified resource that meets minimum criteria
related to current mining and production practices including
grade, quality, thickness and depth.
Reserves:
The part of the reserve base which can be economically extracted
or produced at the time of the determination (this does not signify
that the extraction facilities are in place or functional).
Economic:
Profitable extraction or production under defined investment
assumptions has been established, analytically demonstrated or
assumed with reasonable certainty.
Definitions…..
IFDC (2010)

World phosphate reserves and resources of Marine phosphorite (Sedimentary phosphate rock, in mmt of material containing at least 30% P2O5)
IFDC (2010)
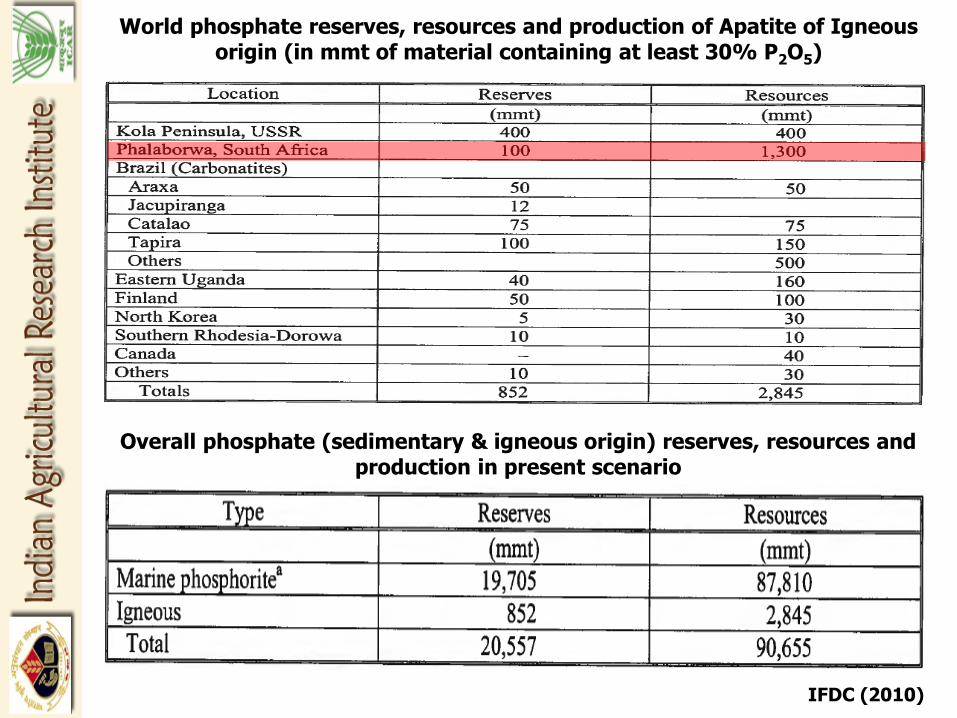
World phosphate reserves, resources and production of Apatite of Igneous origin (in mmt of material containing at least 30% P2O5)
Overall phosphate (sedimentary & igneous origin) reserves, resources and production in present scenario
IFDC (2010)
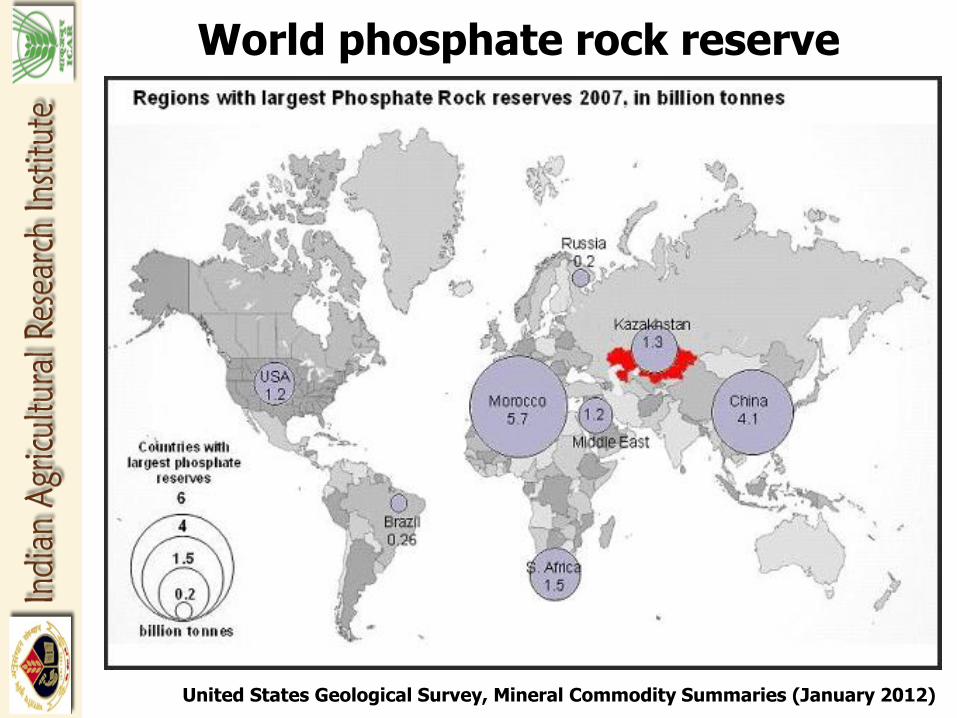
World phosphate rock reserve
United States Geological Survey, Mineral Commodity Summaries (January 2012)

71,000 (mmt)
United States Geological Survey, Mineral Commodity Summaries (January 2012)
World rock phosphate reserves

Morocco/ Western
Sahara
70%
Iraq
8%
China
5%
Algeria
3%
Syria
3%
Jordan
2%
South Africa
2% USA
2%
USSR
2% Brazil
0%
Australia
0%
Peru
0%
Israel
0%
Senegal
0%
Egypt 0%
Tunisia
0%
Others
1%
United States Geological Survey, Mineral Commodity Summaries (January 2012)
World rock phosphate reserve Contd…

Major rock phosphate reserve in India and their properties
Mussoorie RP
Total P % 8.25
WSP % 0.001
CSP % 1.19
CSIP % 7.06
Ca % 12.1
Udaipur RP
Total P % 8.62
WSP % 0.002
CSP % 1.26
CSIP % 7.36
Ca % 6.4
Jhabua RP
Total P % 7.25
WSP % 0.003
CSP % 1.10
CSIP % 6.15
Ca % 9.96
Purulia RP
Total P % 9.87
WSP % 0.004
CSP % 1.25
CSIP % 8.62
Ca % 7.8
240 million tonnes
(Mt) of RP deposits
are available in India
and
About 5.11 Mt meets
the specification of
the fertilizer industry
http://agricoop.nic.in/

Phosphorus footprint The Phosphorus footprint is the accounting methodology framework for
creating a quantified flow chart
Phosphorus declaration illustrates the losses and management improvement
possibilities.
The removal and reuse of phosphorus is the most significant consideration
for wastewater treatment facilities
It is estimated that wastewater contributes approximately 1.5 Tg/yr to the
global phosphorus footprint which is at least 10% of the total based on the
largest estimate for the global phosphorus footprint
Anonymous (2009)

0
0.2
0.4
0.6
0.8
1
1.2
1.4
1.6
No P removal P removal 0.1(mg /L)
P removal 1(mg /L)
P recovery
Glo
ba
l P
fo
otp
rin
t fr
om
wa
ste
wa
ter
tre
atm
en
t (T
g y
ea
r-1)
Eutrophication Phosphorus
Phosphorus footprint
Anonymous (2009)

What is phosphorus recycling?
Phosphorus recycling
Fundamentals of Soil Science (2009)

Watery phase: wastewater (treated) or process water (e.g. sludge liquor)
Crystallization DHV-Crystalator (Giesen and Boer, 2003)
Unitika PHOSNIX (Uneo and Fujii, 2001)
Ostara PEARL (Esemag, 2006)
CSH-process Darmstadt (Petzet, 2009)
P-ROC–process (Berg, 2005)
Precipitation AirPrex (Heinzmann, 2008)
Prisa-process (Pinnekamp and Montag, 2007)
Dewatered (or dried) sewage sludge
Wet chemical
Thermal
Seaborne-process or Gifhorn-process (Muller, 2005)
Mephrec-process, (dried sludge) (Scheidig et al., 2009)
Sewage sludge ash
Wet chemical
Thermal
BioCon-process (Hultman et al., 2003)
SEPHOS process (Cornel and Schaum, 2005)
PASCH process (Montag et al., 2005)
ASH DEC process (Adam, 2009)
Electro thermal P (Cornel, 2002)
Anonymous (2009)
Processes for phosphorus recovery from non-conventional sources
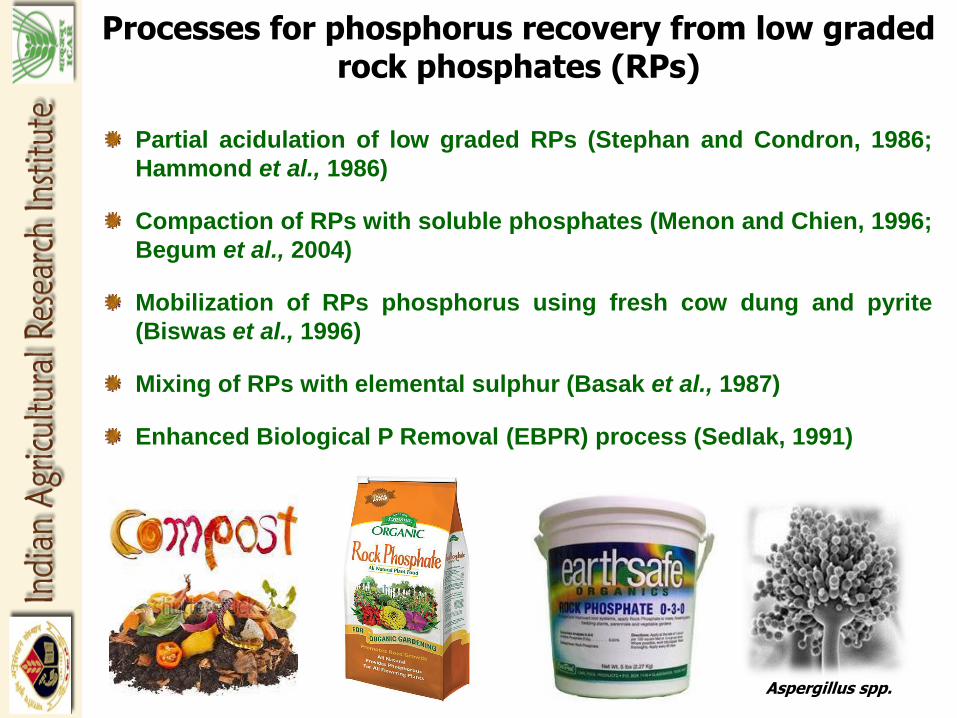
Processes for phosphorus recovery from low graded rock phosphates (RPs)
Partial acidulation of low graded RPs (Stephan and Condron, 1986;
Hammond et al., 1986)
Compaction of RPs with soluble phosphates (Menon and Chien, 1996;
Begum et al., 2004)
Mobilization of RPs phosphorus using fresh cow dung and pyrite
(Biswas et al., 1996)
Mixing of RPs with elemental sulphur (Basak et al., 1987)
Enhanced Biological P Removal (EBPR) process (Sedlak, 1991)
Aspergillus spp.

Phosphorus recovery from municipal solid waste incineration (MSWI) fly ash
Ash leaching
pH <1 1st precipitation
pH = 3
2nd precipitation
pH = 4
leachate filtrate
Residual filtrate
Ash residues Fe rich solids Solid P product
MSWI
ash
2 M NaOH 1 M NaOH 2 M HCl
Ash leaching
pH=4
Alkaline leaching
pH=(11-13)
Ash residues
with P
P rich filtrate
Ca rich leachate Ash residues
MSWI
ash
1 M NaOH 1 M HCl
Recovery Method 1: Acidic leaching and precipitation
Recovery Method 2: Two step acidic alkaline leaching
Kalmykova and Fedge (2013)

Average concentration of P (mg L-1) detected in leachates
Kalmykova and Fedge (2013)
Ash particle size 50-950 µm (median value 340 µm)
Initial P content 5.9 g kg-1
Ca (141 g kg-1),
Fe (19 g kg-1),
Al (32 g kg-1)
P leaching efficiency (%) or PE (%)
PE (%)=𝑷𝒍𝒆𝒄𝒉𝒂𝒕𝒆
𝑷𝒂𝒔𝒉
∗ 𝟏𝟎𝟎
Overall P recovery efficiency (%) or REP(%)
REP(%) =𝑴𝑷𝒔𝒆𝒄𝒐𝒏𝒅 𝒑𝒓𝒆𝒄𝒊𝒑𝒊𝒕𝒂𝒕𝒊𝒐𝒏
𝒎𝑷𝒍𝒆𝒄𝒉𝒂𝒕𝒆
∗ 𝟏𝟎𝟎
Phosphorus recovery from municipal solid waste incineration (MSWI) fly ash
Contd……
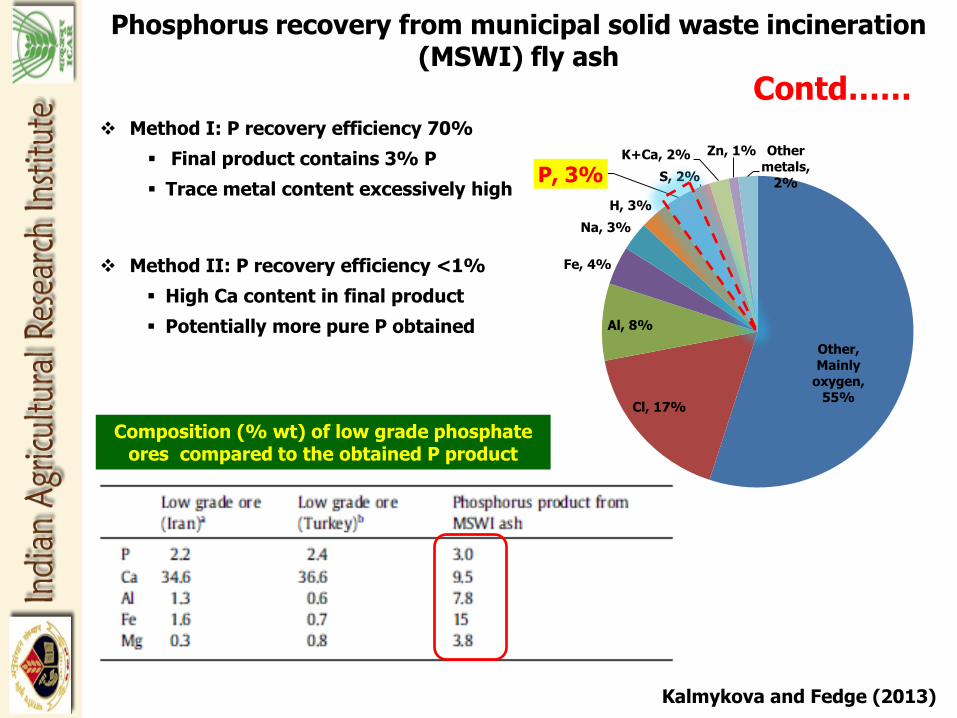
Other,
Mainly
oxygen, 55%
Cl, 17%
Al, 8%
Fe, 4%
Na, 3%
H, 3%
P, 3% S, 2%
K+Ca, 2% Zn, 1% Other
metals,
2%
Composition (% wt) of low grade phosphate ores compared to the obtained P product
Kalmykova and Fedge (2013)
Method I: P recovery efficiency 70%
Final product contains 3% P
Trace metal content excessively high
Method II: P recovery efficiency <1%
High Ca content in final product
Potentially more pure P obtained
Phosphorus recovery from municipal solid waste incineration (MSWI) fly ash
Contd……

Rock phosphate (RP) enriched compost: An approach to improve low-grade Indian rock phosphate
Rock phosphate enriched composts (RP-compost):
prepared by mixing four low-grade Indian rock phosphates with rice
straw with and without Aspergillus awamori
Mix ground RP @ 2 and 4 kg P (elemental P basis) per 100 kg of air-
dried rice straw (corresponding to 2% and 4% charged rate) with and
without phosphate solubilizing microorganism (PSM) viz. A. awamori
(@ 50 g per 100 kg of rice straw)
To enhance activity of the natural and added microflora, a uniform dose
of urea solution @ 0.25 kg N per 100 kg of rice straw was sprayed.
Fresh cow dung @ 5 kg per 100 kg of rice straw was made into slurry
and sprinkled to each treatment as natural inoculums.
A uniform dose of Trichoderma viride was inoculated @ 50 g per 100 kg of rice straw (on fresh mycelia weight basis) to hasten the composting.
mixed thoroughly, moisture content maintain 50-60% of field capacity
Duration 120-130 days
Biswas and Narayanasamy (2006)

Processes for phosphorus recovery from low graded rock phosphates (RPs)
Biswas and Narayanasamy (2006)

Effect of mineral elements on phosphorus release from heated sewage sludge
Laboratory activated sludge (L Sludge) and
wastewater treatment plant activated sludge
(WTP sludge)
Heated samples, centrifuged at 8000 rpm for 5
mins.
For P precipitation, CaCl2 was added to
supernatant solution, to maintain stoichiometric
Ca : P of 1:1 (pH 11)
Incubated for 2 hours at room temperature and centrifuged at 8000 rpm for 5 mins
Sludge samples heated at 70°C for 1 hour on a
water bath
Takiguchi et al. (2007)

Influence of addition mineral salts on the phosphorus release from the L-sludge
* - 0.01 level,
** - 0.05 level
Control
Organic phosphorus
Inorganic phosphorus
Residual phosphorus
Each salt was added to the L-sludge @ 5 mM before heat treatment
Takiguchi et al. (2007)

Dependency of phosphorus release on the total concentrations of Al, Mg, and Ca in WTP sludge
Takiguchi et al. (2007)

Phosphorus recovery from sewage sludge char ash
Anaerobically digested and thermally dried sewage sludge
(Butarque & Madrid Sur)
Grinding and sieving
(particle diameter 250-500 µm)
Pyrolysis
(Fluidized bed reactor 530°C)
Char Non-condensable gasses Pyrolysis liquid
Combustion
(Muffle furnace 600-900°C) Gasification
(Fluidized bed reactor 820°C)
Ash Gas Water + Tar Ash
Martinez et al. (2014)

P yield % =Plechate
Pash
∗ 100
Phosphorus yield (%) after leaching sewage sludge pyrolysis char ash with H2SO4
Phosphorus yield (%) after leaching sewage sludge pyrolysis char ash with oxalic acid
Martinez et al. (2014)

Benefits of phosphorus recovery and reuse
Cordell (2010)

Term Description Refferences
Agronomic PUE Yield increase per unit P applied Hammond et al., 2009
P use efficiency (I) Grain yield per nutrient supplied Manske et al., 2001
P use efficiency (II) Shoot biomass per unit P uptake Wissuwa et al., 1998
P uptake efficiency (I) Total above ground nutrient per unit P applied Osborne and Rengel 2002a
P uptake efficiency (II) Total P accumulated per unit root weight and length Liao et al., 2008
P acquisition efficiency Total P in the plant per unit P applied Osborne and Rengel 2002a
P utilization efficiency Grain yield per unit P uptake Manske et al., 2002
Shoot P utilization efficiency (I) Shoot biomass per unit P uptake Su et al., 2006
Shoot P utilization efficiency (II) Shoot biomass per unit P uptake (shoots and roots minus
seed P reserve)
Osborne and Rengel 2002a
Biomass utilization efficiency Biomass yield per unit P uptake Su et al., 2009
P harvest index Grain p concentration per total P uptake Batten 1992
P efficiency ratio (I) Grain yield per unit P uptake Jones et al., 1989
P efficiency ratio (II) Shoot growth at low P relative to shoot growth at high P Ozturk et al., 2005
Relative grain yield Grain yield at low P relative to grain yield at high P Graham 1984
Root efficiency ratio P uptake in tops per unit root dry weight Jones et al., 1992
Phosphorus use efficiencies and its synonymous
Bovill et al. (2013)

Possible mechanisms of P acquisition and utilization for better growth of modern crop
Bovill et al. (2013)

Richardson et al. (2011)
Plants and microbial strategies to improve the phosphorus efficiency in agriculture
There are three general strategies that triggers large increase in P
acquisition
Strategy 1: “Root foraging strategies”
Lower the critical P requirement for plant growth
Agriculture to be operated at lower plant available P
concentration
Slow the rate at which P accumulates in moderate to high P
sorbing soils
Strategy 2: “Soil P mining strategies”
Enhance the desorption, solubilisation or mineralization of P
from sparingly available pool and slowly mineralizing or
resistant organic P pool in soil
Strategy 3: Development of transgenic plants through molecular assisted
plant breeding and biotechnology

Strategy 1: Root foraging strategies, improve acquisition of soil P
1. More & longer adventitious root
2. More horizontally oriented basal roots
3. More taproot laterals
4. More dispersed higher order laterals
5. Increased root hair density and length
6. Greater association with mycorrhizae
7. Greater formation of aerenchyma
Plant mechanisms for improving phosphorus acquisition efficiency
Ramaekers et al. (2010)

Strategy 1: Root foraging strategies (Root hair structure and distribution in surface soil) contd…
Shallower root growth angles of
axial roots (basal roots in
legumes and crown and seminal
roots in cereals)
enhanced adventitious roots
better dispersion of lateral
roots
Richardson et al. (2011)

Strategy 1: Root foraging strategies (Root hair structure and distribution in surface soil) contd…
Crop: Phaseolus vulgaris
Soil type:
Oxisol (order), Udox (sub-order)
Red loam soil
pH- (4.5-5.5)
Miguel et al. (2015)

Strategy 1: Root foraging strategies (Root hair length and mycorrhizal association) contd…
Mycorrhizal association
Richardson et al. (2011)

Effect of arbuscular mycorhizal fungi and added phosphorus on fruit yield of chilli
Inoculation
Yield of chilli (kg pot-1)
Addition of P fertilizer
No addition Half the recommended
level
Recommended level
(75 kg ha-1)
Uninoculated 0.27 0.37 0.43
Glomas fasiculatum 0.40 0.52 -
Glomas albidum 0.38 0.42 -
Glomas macrocarpum 0.32 0.40 -
Glomas caledonicum 0.37 0.41 -
The efficiency of P uptake by AMF has been related to both the spatial
distribution of the AMF extraradical hyphae in the soil and to the capacity of P
uptake by unit length of the hyphae.
Calculations have shown that hyphal inflow of P (uptake per unit length of hyphae
per unit time) is around 18 x 10–14 mol cm–1 s–1 or about six times more compared
to non-mycorrhizal roots.
Soil: Alfisol, loamy soil, Crop: Chilli
Bagyaraj et al. (2015)

Strategy 1: Root foraging strategies (formation of root cortical aerenchyma) contd…
Root cortical aerenchyma
(RCA) and delayed secondary
development are important for
P acquisition as they regulate
the root costs.
Root cortical aerenchyma are
formed under nutrient stress
and oxygen stress conditions.
Root cortical cells died and
filled by air to form
aerenchyma.
Reduce nutrient and carbon
costs of root tissue while
maintaining surface area for
nutrient uptake.
LP= root weight under low P concentration
HP= root weight under high P concentration
Normal root Root cortical aerenchyma
Richardson et al. (2011)

Strategy 2: Soil phosphorus mining strategies
Mechanisms of phosphate solublization or phosphorus mining strategies:
Organic acids:
• PSM is generally accompanied by a decrease in pH of the medium
• Analysis approve the presence of organic acids e.g.- lactic, citric,
glycolic, succinic, malic, oxalic, fumaric acid etc. (Vassilev et al., 1996).
Chelating substances:
• 2-ketogluconic acids causes P release from insoluble phosphates by
chelation mechanism
• Chelation of Ca by oxalic acid also helps in the solublization of
insoluble phosphates (Illmer and Sachinner, 1992).
Humic substances:
Humic, Fulvic acids are strong chelating agents that efficiently chelate
significant amount of Ca2+ and release H+ ions thus creating a driving
force for dissolution of insoluble phosphates (Singh and Amberger, 1990).
Enzymes and phosphorus solublization:
The liberation of P from organic phosphate compounds may be due
the action of enzymes of esterase type

Production of H2S:
Sulphate reducing bacteria (anaerobic condition) produce hydrogen
sulphide which can solubilize ferric phosphates by forming insoluble
sulphides of iron and making P soluble
Heterotrophic microbes also produce H2S which help solublization of
ferric phosphates by reducing it to ferrous sulphide with the release
of available phosphates (Gaur, 1990).
Production of CO2:
Respired CO2 reduce the pH due to formation of H2CO3 that increase
the availability of phosphates and subsequent uptake by plants (Hayman, 1975).
Production of mineral acids:
Sulphur oxidizing bacteria produce mineral acids (e.g.- H2SO4) during
oxidation of reduced sulphur containing compounds e.g.- pyrite,
which causes dissolution of insoluble phosphate rock, and release P
Pyrite + molecular oxygen Iron sulphate
Iron sulphate + H2O H2SO4
H2SO4 2H+ + SO42-
Strategy 2: Soil phosphorus mining strategies
contd…
( Kapoor et al., 1991).

Strategy 2: Soil phosphorus mining strategies
contd…
Production of siderophores:
Siderophores (Greek: "iron carrier") are small, high affinity iron
chelating compounds secreted by micro-organisms such as bacteria,
fungi and grasses
Siderophore Organism
Enterobactin Escherichia coli
Bacillibactin Bacillus subtilis
Bacillus anthracis
Vibriobactin Vibrio cholerie
Catecholate siderophores
Phytoiderophore Organism
Ferrichrome Ustilago sphaerogena
Desferrioxamine B Streptomyces pilosus Streptomyces coelicolor
Desferrioxamine E Streptomyces coelicolor
Fusarinine C Fusarium roseum
Ornibactin Burkholderia cepacia
Hydroxamate phytosiderophores
epi-hydroxymugineic acid Deoxymugineic acid
Mugineic acid
Römheld and Marschner (1990)

Phosphorus mining micro-organisms
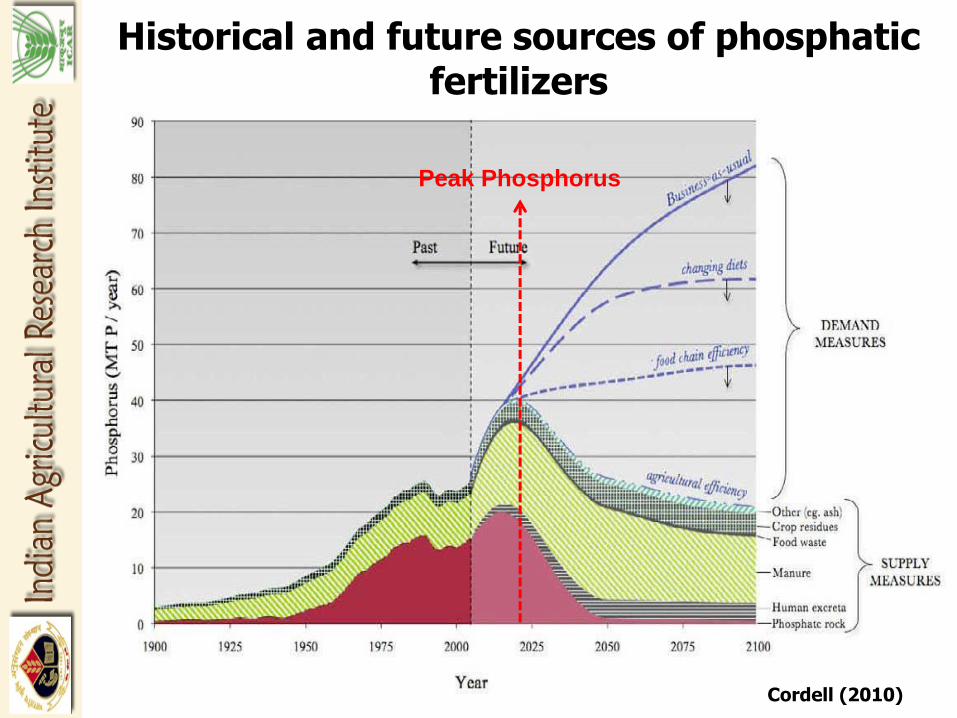
Historical and future sources of phosphatic fertilizers
Cordell (2010)
Peak Phosphorus

Controlled release phosphatic fertilizer: a novel concept for increasing phosphorus use efficiency
Controlled-release fertilizers (CRF) are made to release their content of
nutrients gradually and if possible to coincide with the nutrient
requirements of a plant.
These fertilizers are prepared by coating the active soluble component
with a membrane that serves as a diffusion barrier
The rate of nutrient release has frequently been controlled by the slow
diffusion of the nutrient ions through the membrane to the soil
Phosphatic
fertilizer H2O Phosphatic
fertilizer
H2PO4-
H2PO4-
H2PO4-
H2PO4-
H2PO4-
H2PO4-
H2PO4-
Phosphatic
fertilizer Phosphatic
fertilizer
H2PO4-
H2PO4-
H2PO4-

Shrink your phosphorus footprint: How?
Say no to excess and unbalanced
fertilization
Use phosphate free laundry detergent
Plant a buffer strip along the margin of
water body
No soaps in water
Controlled roof runoff
Have a soil erosion consultation
Scoop the poop of pets
Boat responsibly
No tri-sodium poly phosphate
Anonymous (2009)

Tackling the
P suitability
challenges in
India
Business Development
Awareness rising
Development of Indian policies
Knowledge transfer
Research & Development
Smart co-operation
Incentives & targets
How to tackle the P sustainability challenges in India?
http://agricoop.nic.in/

Technology implementation
Dynamic modelling
Scenario analysis
Cost-Benefit analysis
Indicators and P-footprints
Spatial distribution
Soil accumulation
Eutrophication
Waste management
Industrial transition
Process efficiency
Recycling technology
Chemical interaction
Fertilization experiments
Soil processes
Defining research agenda for sustainable P management through the integration of the macro-, meso-, and micro-
scales of research and knowledge
http://agricoop.nic.in/

5R Strategies to reduce India’s dependency on phosphate rock derived P
http://agricoop.nic.in/

Conclusions Phosphorus is an essential component for crop growth-development
and yield, thus acts as a flagship.
Conventional source of P is non-renewable, so nutrient (P) must be
recycled from waste water that contributes more than 10% of world
phosphorus footprint.
RP-compost could be an alternative and viable technology to utilize
both low-grade rock phosphates and rice straw efficiently and could be
used successfully as a cheaper source of P-fertilizer in place of costly
water soluble P like diammonium phosphate in crop production.
Heat treatment, pyrolysis of sewage sludge is an alternate method for
using non-conventional sources of P.
Plant having better root proliferation with root cortical aerenchyma, and
lesser basal root growth angle have better phosphorus utilization
efficiency
Slow release phosphatic fertilizers that synchronize the nutrient release
in accordance with plant demand is the newest concept for
improvement of plant phosphorus use efficiency

Future way….

Thank you…….

0
0.5
1
1.5
2
2.5
3
3.5
1990s 2000s Current
Population Growth Rate Foodgrain Production Rate
%
Population growth rate and food grain production rate in India
Food insecurity