photoion mass spectrometry of adenine, thymine and uracil in the 6
TRANSCRIPT

www.elsevier.com/locate/chemphys
Chemical Physics 314 (2005) 263–282
Photoion mass spectrometry of adenine, thymine and uracilin the 6–22 eV photon energy range
Hans-Werner Jochims a, Martin Schwell b, Helmut Baumgartel a, Sydney Leach c,*
a Institut fur Physikalische und Theoretische Chemie der Freien Universitat Berlin, Takustr. 3, 14195 Berlin, Germanyb Laboratoire Interuniversitaire des Systemes Atmospheriques (LISA), CNRS-UMR 7583, Universites Paris 7 et 12,
61 Avenue du General de Gaulle, 94010 Creteil, Francec Laboratoire d�Etude du Rayonnement et de la Matiere en Astrophysique (LERMA), CNRS-UMR 8112, Observatoire de Paris-Meudon,
5 place Jules-Janssen, 92195 Meudon, France
Received 8 February 2005; accepted 16 March 2005Available online 12 April 2005
Abstract
Using synchrotron radiation as excitation source in the 6–22 eV photon energy region, a photoionization mass spectrometrystudy of three nucleic acid bases, adenine, thymine and uracil, revealed VUV-induced degradation pathways of these important bio-logical molecules. The fragmentation patterns, ionization energies and ion appearance energies (AE) are reported, many for the firsttime, and are compared with results of electron impact and other studies. AE values enabled heats of formation of parent and somefragment ions to be revised or determined for the first time. Thermochemical data, coupled with the observed AEs, were also usefulin clarifying dissociative photoionization pathways. The main neutral loss species are HCN for adenine, HNCO and CO for thymineand uracil, but many subsequent and other fragmentation pathways, including some not suggested previously, are observed anddiscussed. The hyperconjugation properties of the methyl group make CO loss easier in thymine than in uracil. The astrophysicallyimportant fragment ion HCNH+ is shown to be formed by several fragmentation pathways in all three nucleobases. The relativeimportance of competitive fragmentation processes was determined in some cases. Some astrophysical implications concerningthe prospects for observation and survival of these nucleic acid bases in the interstellar medium and in meteorites are brieflydiscussed.� 2005 Elsevier B.V. All rights reserved.
1. Introduction
The vacuum ultraviolet (VUV) photophysics andphotochemistry of the pyrimidine and purine nucleicacid base constituents of DNA is of considerable interestin view of the possible delivery of these molecules fromspace to the early Earth, and the role that they couldhave played in the origin and development of life onour planet [1]. Some nucleobases have been found in
0301-0104/$ - see front matter � 2005 Elsevier B.V. All rights reserved.
doi:10.1016/j.chemphys.2005.03.008
* Corresponding author. Tel.: +33 1 4507 7561; fax: +33 1 45077100.
E-mail address: [email protected] (S. Leach).
meteorites [2–5], speculation has been made concerningtheir possible formation in the interstellar medium(ISM) [6,7], and pyrimidines and purines have been re-ported in the data obtained with the PUMA impactmass spectrometer during the flyby of comet Halley bythe Soviet spacecraft VEGA 1 [8]. Gas phase studiesof nucleic acid bases are also of significance in biologyfor understanding and determining properties of thesebasic units when free from interactions.
Concerning their possible existence in an astrophysi-cal context, the observation of the important nucleo-bases by radioastronomy requires initial laboratorystudies on their gas phase microwave spectra, whichhave indeed been carried out for the major tautomers

264 H.-W. Jochims et al. / Chemical Physics 314 (2005) 263–282
of the three nucleic acid bases studied here, adenine [9],thymine [10] and uracil [11]. Other possibilities of astro-physical observation include their infra-red spectra,which have been measured in the laboratory in the gasphase [12] and in low temperature matrices [13–16],both phases being relevant to possible astrophysicalmeasurements. Gas phase electronic spectra are alsoknown, but the observed UV absorption [17–19] orfluorescence [20,21] bands would be difficult to mea-sure and identify in astrophysical contexts. However,all of these spectroscopic studies have enriched ourknowledge of the structure of these nucleobases intheir tautomeric variants. Mass spectrometric measure-ments of cometary grains, already attempted on cometHalley in 1986 [8], will be improved in future spacemissions to comets, with some specific attempts to de-tect purine nucleobases [22].
Although the nucleobases studied possess severaltautomeric forms, the spectroscopic studies cited aboveshow that at the gas phase temperatures used in ourstudy, 150–200 �C, only one tautomer is present, atmore than 99%, with no evidence of tautomerizationof uracil or thymine to the enol form, or of adenineto the imino form [12].
Apart from several photoelectron spectral studies [23–31] there has been relatively little previous study of ioniza-tion phenomena of adenine, thymine and uracil. Theiradiabatic ionization energies are uncertain and there areonly a small number of mass spectral studies on unmodi-fied nucleobases, carried out by 20 and 70 eV electron im-pact, principally by the group of Dudek [32,33], followedbyothers [34–41].Nodissociative photoionization studieshave been reported on these nucleobases. We mentionthat there has been recent work on the dissociative elec-tron attachment of nucleobases and on their stable anionsin the gas phase [42,43]. We also note that energetic frag-ments resulting from dissociation of nucleobases cancause subsequent damage in biological systems. DeVrieset al. [44] have studied the fragmentationof uracil and thy-mine induced by collision with slow multiply chargedXe(q+, q = 5–25) ions. Complete breakdown into atomicand diatomic fragments occurs via Coulomb dissociationunder these conditions.
In this paper, we report results of a photoionizationmass spectrometry (PIMS) study of three nucleic acidbases, adenine, thymine and uracil. All three havebeen found in meteoritic materials [2–5]. The photoionyield curves of the nucleic acid base parent and frag-ment ions were measured as a function of incidentphoton energy in the 6–22 eV range. We report ioniza-tion energy (IE) and previously unknown fragmentappearance energies (AE). Knowledge of the ioniza-tion energies of the nucleobases is of importance inunderstanding the processes of oxidative damage[45,46], as well as in interpreting hole (radical cation)charge transfer and trapping [47–49], in DNA. The
photoion fragmentation patterns at an incident energyof 20 eV are compared with the ion fragmentationpatterns obtained by 20 and 70 eV electron impactionization processes. Our proposed fragmentationpathways build on the pioneer studies of Rice et al.[32,33] on the electron impact mass spectra of thesenucleobases. These pathways were established in partby making use of metastable peaks and isotope label-ing [34–37]. Our measurements of the appearanceenergies of fragment ions enable us to further investi-gate the validity of the proposed fragmentation path-ways and to consider new aspects and extensions of thedissociative ionization processes. The fragmentationinformation is not only pertinent to understandingradiation damage in DNA [50] but, as mentionedabove, it is also potentially of use for interpretationof data to be obtained by mass spectrometric measure-ments of species in cometary grains which will be col-lected during the ROSETTA space mission to thecomet 46p/Wirtanen [22].
The photoabsorption cross-section of nucleic acidbases is much higher in the VUV as compared withthe UV, as has been observed in absorption and EELSstudies on films of nucleobases, usually prepared byvacuum sublimation [51–55]. Low energy EELS mea-surements have been carried out on gas phase thymine[56], and high energy EELS on solid films of the threenucleobases studied here, which provided data up to35 eV [57]. We later compare this data, as well as pho-toelectron spectra, with our nucleobase parent photo-ion yield curves. MPI spectra of gas phase adeninehave also been measured [18]. Optical properties of ade-nine in the 1.8–80 eV region have been determined byoptical reflectance on solid films [58]. Photoacousticspectra of films of thymine and adenine have also beenobtained and compared with absorption measurementsin the 4.13–9.54 eV range [59]. In these different studiesthe bands observed have been assigned to p–p*, n–p*, etc.transitions and to chromophoric groups. We also notethe existence of a broad intense ‘‘absorption’’ peak ofthe nucleobases in the 20 eV region. This results mainlyfrom collective excitation of electrons and is commonlyobserved in organic compounds, as discussed elsewhere[60].
We mention that all of these molecules absorbstrongly at 10.2 eV, where the Lyman-a stellar emissionis intense. Furthermore, in connection with the possibleearthbound delivery of biotic molecules from space, weremark that the VUV luminosity of the early sun, duringthe Hadean period of considerable bombardment of theEarth from space, was about two orders of magnitudehigher than it is today, although the total luminositywas less [61].
Initial accounts of this work, which have been re-ported elsewhere in an exobiology context [62,63], in-clude preliminary values of the ionization energies and

N
NH2
1 56 7 CH3
O
3 4
89
O
3 4 5
8
H
H.-W. Jochims et al. / Chemical Physics 314 (2005) 263–282 265
some fragmentation appearance energies of the threenucleobases [62].
Adenine UracilThymine
N
N NH
23
4
8
9H
HHN
NH
O 1
25
67 H
HN
NH
O 1
2 6
7 H
Fig. 1. Molecular structure of adenine, thymine and uracil, includingcommon atom numbering.
2. Experimental
The experiments were carried out at two separatesynchrotron facilities, BESSY I and BESSY II, in Ber-lin. Synchrotron radiation from the electron storage ringBESSY I was monochromatized by a 1.5 m Au gratingmonochromator (modified McPherson) and then fo-cused into a differentially pumped gas cell which canbe heated up to 400 �C but was here restricted to lowertemperatures. The experimental set-up is described inmore detail elsewhere [64]. The nucleic acid base vaporswere introduced into the ionization chamber by directevaporation of solid samples in open containers placed1–2 cm below the position of the incident VUV radia-tion within the ion extraction zone. The whole chamberwas heated to temperatures, typically 120–140 �C, whichprovided an adequate supply of target molecules butwere sufficiently low to ensure that the thermally fragilelow volatile nucleic acid bases remained essentiallyundissociated in the gas phase. When some thermally in-duced dissociation did occur this was easily identified bythe observed mass spectra, thus enabling us to modifyexperimental parameters so as to achieve satisfactoryexperimental conditions of minimal thermal dissocia-tion. In cases where water impurity was observed inthe mass spectra this generally resulted from residuesof cleaning procedures of the apparatus which were car-ried out between experimental runs.
Parent and fragment ions formed by photoionizationof the nucleic acid bases adenine, thymine and uracilwere measured using a quadrupole mass spectrometer(Leybold Q200), and ion yield curves were obtainedthrough photon energy scans with measuring intervalsof 25 meV. The yield curves of the principal ions ob-served are presented in the appropriate figures. Trans-mitted photons were detected by the fluorescence of asodium salicylate coated window. Spectral bandwidthof the incident monochromatic radiation was typically2 A. Some experiments were carried out with anMgF2 filter (cut-off effective at 11.0 eV) in order to sup-press stray light and second-order radiation. Ionappearance energies were determined mainly with theaid of semi-log plots of the ion yield curves. A secondset of measurements on uracil was carried out more re-cently using synchrotron radiation from the BESSY IIelectron storage ring. Measuring equipment and exper-imental conditions were similar to those at BESSY I,except that at BESSY II we employed a 3 m normalincidence monochromator. The nucleic acid base sam-ples were commercial products (Sigma–Aldrich) of bestavailable purity. The formulae of the three nucleobasesstudied are given in Fig. 1.
3. Results and discussion
3.1. Adenine: mass spectra and ion yield curves
Table 1 gives a comparison between the relativeintensities of the m/z peaks in our mass spectrum ob-tained at 20 eV photon excitation energy and that ofRice and Dudek [33] measured with 70 eV electron im-pact. It also includes selected proposed loss of neutralspecies corresponding to the observed molecular ionsformed by dissociative ionization. The appearance ener-gies of the major m/z ions are listed, as measured fromthe onsets in the ion yield curves (Fig. 2).
The 20 eV photon impact and 70 eV electron impactmass spectra have essentially the same m/z featuresbut with differences in their relative intensities. Differentrelative intensities are also observed between reportedelectron impact mass spectra of adenine [22,33,38,65].These differences between the electron impact spectra,and also between electron and photon impact mass spec-tra, are most probably mainly due to different ion optics,residence times, and detection efficiency. These factorswill affect the mass spectral manifestations, especiallyof metastable ions. We remark also that with 70 eV elec-tron impact, but not with 20 eV photons, doublycharged molecular ions can be formed, with low yields,giving rise to charge separation reactions producingfragment monocations [66]. Differences between re-ported electron impact mass spectral intensities werealso observed for thymine and uracil, as discussed later.
3.1.1. The adenine parent ionFor the parent ion, m/z = 135, we measured an ioni-
zation energy of 8.20 ± 0.03 eV. The correspondingm/z = 135 ion yield curve shown in Fig. 2(a) was mea-sured using the MgF2 filter. In Table 2 this value is com-pared with those determined by various techniques. Theonly other measurement by photoionization is that re-ported Orlov et al. [67], who did not publish their ionyield curve. Agreement between these two PIMS mea-surement is good. An early measurement by electron im-pact [68] gives a much too high value, but latermeasurements [69,70] are not inconsistent with our IE va-lue. A recent measurement by the R2PI technique givesan upper limiting value 400 meV above the PIMS values[71]. The ionization energies reported from photoelectron

6 7 8 9 10 11 12
(f) m/z = 53
(e) m/z = 65
(d) m/z = 70
(g) m/z = 29
(c) m/z = 81
(b) m/z = 108
(a) m/z = 135
Lo
g r
elat
ive
inte
nsi
ty
photon energy / eV
10 12 14 16 18 20 22
Adenine
Fig. 2. Selected ion yield curves of adenine. The m/z = 135 ion yieldcurve has been measured using an MgF2 cut-off filter.
Table 1Electron impact [33] and photon impact mass spectra and photoion appearance energies: Adenine m = 135 (C5H5N5)
m/z Electron impact70 eV relative intensity
Photon impact20 eV relative intensity
Photon impactappearance energy (AE, eV)
Ion elementalformula
Neutral loss
135 100 100 8.20 ± 0.03 C5H5Nþ5
134 3 10 C5H4Nþ5 H
120 3 1 C5H4Nþ4 NH
119 (a) 3 C5H3Nþ4 NH2
108 34 57 11.56 ± 0.05 C4H4Nþ4 HCN
107 3 10 C4H3Nþ4 H2CN
92 (a) 9 C4H2Nþ3 HCN + NH2
81 19 50 12.8 ± 0.1 C3H3Nþ3 2HCN
80 7 10 C3H2Nþ3 H2CN + HCN
70 5 17 13.1 ± 0.1 C2H4Nþ3 C3NH2
67 7 10 C3H3Nþ2 HCN + NHCN
66 15 41 13.2 ± 0.1 C3H2Nþ2 HCN + NH2CN
65 6 0 C3HNþ2 2HCN + NH2
54 31 55 13.7 ± 0.1 C2H2Nþ2 3HCN
53 24 28 C2HNþ2 H2CN + 2HCN
43 12 34 13.0 ± 0.1 NH2CNH+ HCN + HCNCCN42 3 16 NH2CN
+
41 2 7 NHCN+
40 5 1 NCN+ 2HCN + NHCN39 8 1 HCCN+ 2HCN + NH2CN38 10 0 C2N
+ 3HCN + NH2
29 12 60 14.0 ± 0.1 NH2CH+
28 78 110 13.1 ± 0.1 HCNH+ C4H3N4
27 12 10 HCN+ 4HCN
(a) Reported in [65] and in [38] but not in [33].
266 H.-W. Jochims et al. / Chemical Physics 314 (2005) 263–282
spectroscopy peak measurements [23,31] provide verti-cal IEs which are 220–280 meV above the adiabaticvalues determined by our PIMS measurements. How-ever, bracketing experiments measuring the adiabaticrecombination energy [72] gave an adiabatic IE =8.55 ± 0.10 eV, about 350 meV above the PIMS value,and which is close to the vertical IE measured by photo-
electron spectroscopy. This points to unrecognizeddifficulties in the recombination energy measurementtechnique.
The difference of the order of 250 meV between theadiabatic and vertical IEs of adenine is similar to thatcalculated theoretically with various degrees of sophisti-cation [73–76]. There is no loss of planarity on ioniza-tion of adenine [74]. The difference between theadiabatic and vertical IEs therefore reflects bond lengthand angle changes (which have been calculated by Imp-rota et al. [75]), between the ground states of neutral andcationic adenine, and which result in Franck–Condontransition shifts. It may appear surprising that electronimpact measurements are capable of providing adiabaticvalues of the ionization energy in cases where there aresignificant changes in the geometry of neutral specieson electron loss, but this has been well demonstratedfor many molecular species [77].
Using our measured adiabatic IE of adenine, and theknown value of the heat of formationDH 298
f ðadenineÞ ¼ 207� 8 kJ=mol [78], we obtain avalue of the heat of formation of the cationDH 298
f ðadenine cationÞ ¼ 998� 11 kJ=mol, which isconsiderably greater than the valueDH 298
f ðadenine cationÞ ¼ 960 kJ=mol given by Liaset al. [78], based on a quoted PES onset value of theIE = 7.8 eV.
We made a direct comparison between the m/z = 135ion yield curve and the HeI photoelectron spectrum of

Table 2Adenine ionization energy valuesa
Experimental method Ionizationenergy (eV)
Referenceand year
Photoion yield curve (PIMS) 8.20 ± 0.03 Presentstudy
Electron impact ion yield curve 8.91 ± 0.10 [68] 1967Photoelectron spectroscopy (PES) 8.44 ± 0.03 (vert) [23] 1975PIMS 8.26 ± 0.05 [67] 1976Electron impact ion yield curve 8.3 ± 0.1 [69] 1976PES 8.48b (vert) [31] 1980Electron impact ion yield curve 8.45 ± 0.15 [70] 1996Recombination energy 8.55 ± 0.10 [72] 1999Resonance 2-photon ionization 68.606 ± 0.006 [71] 2002
a Adiabatic values unless otherwise stated.b Uncertainty not reported.
8 10 12 14 16 18 20
(c) Uracil
m/z = 135
(b) Thymine
(a) Adenine
Rel
ativ
e in
ten
sity
/a.u
.
energy / eV
PES
m/z = 126 PES
m/z = 112 PES
Fig. 3. Comparison of parent ion yield curve and photoelectronspectrum (PES are reproduced from [24,31]): (a) adenine; (b) thymine;(c) uracil.
5 10 15 20-0
-0
-0
5-
5-
10-
10-
10-
0-
(c) Uracil
m/z = 135
0-
0-
(b) Thymine
(a) Adenine
Op
tica
l ab
sorp
tio
n c
oef
fici
ent
µ/1
05 cm
-1
energy / eV
µ
m/z = 126µ
5-
m/z = 112
Rel
ativ
eio
n in
ten
sity
/ a.
u.
µ
Fig. 4. Comparison of parent ion yield curve and the opticalphotoabsorption spectrum (the optical absorption spectra, reproducedfrom [57], are derived from respective electron energy loss spectra): (a)adenine; (b) thymine; (c) uracil.
H.-W. Jochims et al. / Chemical Physics 314 (2005) 263–282 267
adenine measured by Lin et al. [31] (Fig. 3(a)). Thisshowed clearly that there are shoulders or apparentsteps in the ion yield curve at energies close to thoseof several features in the photoelectron spectrum (PESenergies [24,31] in brackets): 8.4 (8.48) eV assigned top1; �9.0 (�) eV; �9.8 (9.6) eV assigned to n1 and p2;�10.3 (10.5) eV assigned to p3; �12.0 (12.1) eV assignedto p4. The molecular orbital assignments are those givenin the PES studies [24,31]. The inflection that we observeclearly in the ion yield curve at �9.0 eV has no obviousfeature in the photoelectron spectra of adenine. How-ever, the 9.6 eV PES feature is broad and its profile ex-tends to about 8.8 eV on the lower energy side. This PESfeature has been assigned to both n1 and p2 and their en-ergy separation has been calculated to be 450 meV bythe HAM/3 method and 780 meV by 4-31G calculations[24], although the order of these two orbitals differs inthe two calculations. On the basis of relative intensitiesin the PES spectrum, we assign the 9.0 eV inflection in
the adenine ion yield curve to the n1 orbital and the9.8 eV inflection to p2.
At higher energies, the broad features in the PES be-tween 13 and 17 eV mimic quite well the parent ion yieldcurve (Fig. 3(a)). This region of the PES has not been as-signed but we note that there are similar features in thePES of purine in this energy region, for which molecularorbital assignments have been made [79]. We recall thatthe purine molecule is similar to that of adenine but inwhich the amino group of the latter is replaced by ahydrogen atom.
We also compared the parent ion yield curve with theoptical absorption curve derived from 25 keV electronenergy loss spectra of thin films of adenine [57] (Fig.4(a)). Our parent ion yield curves has several features,including three pronounced peaks at �14.5, �16 and�18 eV, respectively. There are only two peaks, at13 ± 0.3 and 17.4 ± 0.3 eV, in the adenine film spectrumin the 10–35 eV region. The physical relation betweenthese solid phase peaks, induced by electron excitationin a region where the ionization yield can be less thanunity [80,81], and the gas phase parent photoion peaksin this spectral region is not easy to disentangle.
3.1.2. Adenine ion fragmentation
Several loss mechanism pathways can be recognizedin the mass spectrum, following on the pioneer workof the Dudek group [33]. A schematic representationof major fragmentation pathways is given in Fig. 5.
(a) Successive loss of HCN groups: The principalpathway involves the successive loss of HCN (m = 27)groups:
C5H5Nþ5 ðm=z ¼ 135Þ �HCN ! C4H4N
þ4 ðm=z ¼ 108Þ
ð1Þ

N
N NH
N
NH2
N
N NH
N
NH2
H
H
N NH
N
NH2
H
H2N NH
N
H
N
NH
N
H
HN
HCN+C2H2N2
+
N
N N
H
H
H
.
.
1
2
3
4
56 7
8
9
m/z = 108AE = 11.56
m/z = 81AE = 12.8
m/z = 135IE = 8.2
.m/z = 108
+.
+
+ .m/z = 81
m/z = 54AE = 13.7
m/z = 27
(IIa)
(IIIa)
hν
(2) -HCN
(3) -HCN
-HCN
A
C2H4N3+ m/z = 70
AE = 13.1
(7)
CH3N2+ m/z = 43
AE = 13.0
(8) -HCN
(1) -HCN
H
H(I)
(IIIb)
(IIb)
C3H2N2+
m/z = 66AE = 13.2
C2HN+
m/z = 39
(4)
(5) -NH2CN
(6)
-HCN
+
+
Fig. 5. Principal fragmentation decay routes of the adenine radical cation. Measured appearance energy values are given for each fragment (in eV,for uncertainties refer to Table 1). Roman and Arabic numerals correspond to species and reactions, respectively.
268 H.-W. Jochims et al. / Chemical Physics 314 (2005) 263–282
C4H4Nþ4 ðm=z ¼ 108Þ �HCN ! C3H3N
þ3 ðm=z ¼ 81Þ
ð2Þ
C3H3Nþ3 ðm=z ¼ 81Þ �HCN ! C2H2N
þ2 ðm=z ¼ 54Þ
ð3Þ
C2H2Nþ2 ðm=z ¼ 54Þ �HCN ! HCNþ ðm=z ¼ 27Þ
ð4ÞFrom the appearance energy of the C4H4N
þ4 ion,
AE = 11.56 eV, and the known heats of formation ofadenine (207 ± 8 kJ/mol) and HCN (135.1 kJ/mol)[65,78], we calculate the heat of formation of theC4H4N
þ4 ion to be 1187 ± 12 kJ/mol. A similar calcula-
tion for the heat of formation of the C3H3Nþ3 ion gave a
value of 1172 ± 16 kJ/mol for this ion. The heats of for-mation of the three isomeric cyclic C3H3N
þ3 ions, 1,2,3-
triazine, 1,2,4-triazine and 1,3,5-triazine, are reported[65,78] to be 1313, 1222 and 1194 kJ/mol, respectively.This suggests that the C3H3N
þ3 ion formed in the disso-
ciative ionization of adenine is the 1,3,5-triazine cation(species IIIb in Fig. 5).
The respective appearance energies of the CnHnNþn
(n = 5,4,3,2) ions are 8.20, 11.56, 12.8 and 13.7 eV. Loss
of the successive HCN groups requires excess energies,respectively, of 3.36, 4.5 and 5.4 eV in the ion. This suiteof AEs and the corresponding excess energies confirmsthe pathway presented above. The initial HCN fragmen-tation, which requires at least two bond ruptures, is rel-atively more difficult than the succeeding HCN losseswhich each probably requires only one bond rupturein the precursor fragment ion and/or it corresponds toa successively smaller total reorganization energy. Theloss mechanisms could be quite complex and may in-volve loss of HNC as well as HCN. Our discussion doesnot distinguish between these two isomers. We refer tothem collectively as HCN.
From electron impact mass spectra of deuterium la-beled adenine [35] Occolowitz concluded that the firstHCN lost originates 55% from C6 and its attachedamine group, and 45% from C2 and either adjacentnitrogen. However, the mass spectra of 15N-labeled ade-nines [36] showed that there is about 87% loss of N1 inthe first HCN product, which suggests that a greaterpercentage of C2 is lost than reported by Occolowitz.The finding by Barrio et al. [36] is corroborated by theelectron impact mass spectrum of 13C2-adenine by Sethiet al. [37] which shows that the carbon atoms in the first

H.-W. Jochims et al. / Chemical Physics 314 (2005) 263–282 269
HCN molecule to be lost are 98% from C2. The mainreaction would therefore be expected to occur by rup-ture of the C2–N3 and N1–C6 bonds. These are bothcalculated to be weaker in the cation as compared withneutral adenine, whereas the C2–N1 and N3–4 bondsare calculated to be stronger in the cation [75].
The 15N mass spectra [36] also show that N7 and N9are completely retained in the C4H4N
þ4 ion product.
Sethi et al. [37] also found, from the mass spectrum of14C8-adenine, that there is complete retention of C8 inthe C4H4N
þ4 ion formed by the first HCN loss process,
and that there is partial loss of the carbon isotopic labelin further HCN loss steps. We note, however, that therecan be rearrangements of hydrogen (deuterium) prior toHCN leaving the molecule, as discussed by Sethi et al.[37]. Furthermore, many fragmentation sub-pathwayscan indeed be envisaged to contribute to these successiveHCN loss processes [33,37].
From these earlier isotopic studies, we can thus as-sume that fragment m/z = 108 has the structure IIashown in Fig. 5. Species IIa can isomerize to give speciesIIb which is probably thermodynamically more stable. Itis not clear from which structure the m/z = 81 ion isformed, but, as already concluded from thermodynami-cal considerations, the 1,3,5 triazine cation IIIb is mostlikely formed.
(b) Reactions involving loss of NH2CN and NHCN:
Several other fragmentation pathways can be establishedfrom the mass spectrum of adenine. One of these startsfrom the C4H4N
þ4 fragment ion (m/z = 108) which can
lose NH2CN to form the important C2H2Nþ2 ion (m/z =
66), from which there can be a further loss of HCN:
C4H4Nþ4 ðm=z ¼ 108Þ
! C3H2Nþ2 ðm=z ¼ 66Þ þNH2CN ðm ¼ 42Þ ð5Þ
C3H2Nþ2 ðm=z ¼ 66Þ
! C2Nþ ðm=z ¼ 39Þ þHCN ðm ¼ 27Þ ð6Þ
The heat of formation of the C3H2Nþ2 ion can be deter-
mined from its appearance energy, AE = 13.2 ± 0.1 eV,and the heats of formation of NH2CN, HCN and ade-nine. The heats of formation of three isomers of NH2CNhave been reported [65,78]: (i) cyanamide (134 kJ/mol),(ii) diazomethane (230 ± 17 kJ/mol) and (iii) 3H-diazi-rine (265 ± 11 kJ/mol). These provide the followingrespective values for the heat of formation of C2H2N
þ2 :
(i) 1212 ± 16 kJ/mol, (ii) 1116 ± 33 kJ/mol, and (iii)1081 ± 27 kJ/mol. The only heat of formation reportedfor a C2H2N
þ2 ion is that of the malononitrile ion,
1491 ± 11 kJ/mol [65]. This is much greater than theabove values and it shows that C2H2N
þ2 is not the mal-
ononitrile ion which, if formed by dissociative ionizationof adenine, would have an appearance energy several eVabove 13.2 eV. The structure of the C2H2N
þ2 ion formed
at 13.2 eV is therefore unknown.
Loss of NH2CN from m/z = 81 constitutes anotherpossible pathway to form the C2HN+ (m/z = 39) ionother than via reactions (5) and (6) which involve them/z = 66 ion. The m/z = 66 and 81 ions are both intensein our 20 eV photon impact mass spectrum, but the m/z = 39 ion, although present, is extremely weak. Thethree ions, m/z = 81, 66 and 39, appear with modestintensity in 70 eV electron impact mass spectra[33,38,65], where their intensities decrease in the m/z or-der 81 > 66 > 39, but with the I(66)/I(39) intensity ratiobeing of the order of 2. This is undoubtedly due to thegreater deposition of energy at the higher excitationenergies in the electron impact case. The appearance en-ergy of the m/z = 66 ion (13.2 eV, Table 1), formed bylosses of HCN and NH2CN (reactions (1) and (5)), isgreater than that of m/z = 81 (12.8 eV), which involvesloss of two HCN units from the parent ion (reactions(1) and (2)). The difference DE between the heat of for-mation of HCN and those of the NH2CN isomerscyanamide, diazomethane and 3H-Diazirine is, respec-tively, DE = 0.01, �0.98 and �1.35 eV. The differencebetween the appearance energies of the m/z = 81 andm/z = 66 ions is �0.4 eV, which indicates that theNH2CN neutral product is cyanamide and that thereis a potential barrier, at least of the order of 0.4 eV,to its formation.
One can imagine another formation pathway for them/z = 66 ion: by rupture of the C5–C6 bond and theC4–N3 bond in the adenine parent ion. This remainsto be tested, but the AE = 13.2 eV of the m/z = 66 ionis compatible with such a mechanism.
We remark that direct loss of NH2CN from the par-ent ion would give a fragment ion m/z = 93, which isabsent in our 20 eV photon impact mass spectrum.Its formation would involve rupture of three bondsand thus require a high internal energy in the parention, consistent with the non observation of this frag-ment ion in our mass spectrum. It is reported as a veryweak peak in some [38,65] 70 eV electron impact massspectra. We note the existence of an important peak atm/z = 42, which we assign to the NH2CN
+ ion, andwhich might be formed by the dissociationC4H4N
þ4 ! NH2CN
þ þ C3H2N2, which itself consti-tutes a charge-switch reaction relative to reaction (5).From the suggested structure IIb (Fig. 5) of them/z = 108 ion, the NH2CN
+ fragment is either thecyanamide or 3H-Diazirine cation, requiring H-shiftfor their formation, and not the diazomethane cationthe formation of which would necessitate more com-plex atomic rearrangements.
(c) Other important ions: The existence of a strongpeak at m/z = 43 (AE = 13.0 eV) is of interest. We pro-pose its assignment to an ion having the elemental for-mula CH3N
þ2 , in agreement with Sethi et al. [37]. It
has been suggested that possible pathways to its forma-tion involve prior formation of the m/z = 70 ion:

270 H.-W. Jochims et al. / Chemical Physics 314 (2005) 263–282
C5H5Nþ5 ðm=z ¼ 135Þ
! C2H4Nþ3 ðm=z ¼ 70Þ þ C3HN2 ðm ¼ 65Þ ð7Þ
C2H4Nþ3 ðm=z ¼ 70Þ
! C3HNþ2 ðm=z ¼ 43Þ þHCN ðm ¼ 27Þ ð8Þ
The high resolution mass spectrometry of adenine hasshown the m/z = 70 ion to have the elemental formulaC2H4N
þ3 , suggested to be formed by loss of C3HN2 from
the parent ion [37]. We consider that there could also bea pathway to this m/z = 70 ion via m/z = 108, where theneutral loss from the latter ion would be C2N (reaction(9)). This is a previously unreported fragmentationpathway:
C4H4Nþ4 ðm=z ¼ 108Þ
! C2H4Nþ3 ðm=z ¼ 70Þ þ C2Nðm ¼ 38Þ ð9Þ
The m/z = 70 ion has an appearance energyAE = 13.1 ± 0.1 eV. From this, and appropriate heatsof formation, we determine the heat of formation of thisC2H4N
þ3 ion via reactions (9) and (8) to be 980 ± 18 kJ/
mol. In the literature [78] there is reported a heat of for-mation of 835 kJ/mol for a cyclic radical ion having theelemental formula C2H4N
þ3 . If this is indeed the
m/z = 70 ion, a potential barrier can be inferred forthe formation of this ion fragment via reactions (9)and (8). An open chain form is also possible, as sug-gested by Sethi et al. [37].
We note that the intensity of the m/z = 70 ion relativeto that of m/z = 43 is about 0.5 in both the photon andelectron impact mass spectra, and that both ions haveclosely similar AE values, which suggests that there existmore than one pathway to form the m/z = 43 ion. In-deed, we propose another possible pathway for its for-mation. This is via the m/z = 108 ion in the followingway: If the C4H4N
þ4 ion is in its amino-imidazole carbo-
nitrile form (species IIb in Fig. 5), subsequent rupture ofC@C and a C–N bond would lead to the formation ofthe NH2CNH+ (i.e., CH3N
þ2 ) ion.
m/z = 28 and m/z = 29 ions: These are prominentions and their relative importance is much greater inthe 20 eV photon impact than in the 70 eV electron im-pact mass spectrum. The m/z = 29 ion has anAE = 14.0 eV. Its elemental formula is CH3N
+ and itis possibly the NH2CH
+ ion [82,83]. The m/z = 28 ionis very intense and it has an AE = 13.1 eV. We assignit to the HCNH+ species. Since its AE is lower thanthe AE of the m/z = 29 ion, it is not formed, at thresh-old, by loss of a hydrogen atom from the latter. A pos-sibility is that the HCNH+ ion is formed by the reaction:
C5H5Nþ5 ðm=z ¼ 135Þ
! HCNHþ ðm=z ¼ 28Þ þ C4H3N4 ðm ¼ 107Þ ð10Þ
which would correspond to a charge switch of reactionEq. (11), discussed below. However, other pathways to
formation of the HCNH+ ion are possible, as indicatedby 15N-labeled adenine studies [37].
(d) Less intense fragment ion peaks (no AE measure-
ments): The m/z = 134, 120, 119 and 118 ions, whichare variously observed weakly in some electron impactmass spectra [22,33,38,65], correspond, respectively, toloss of H, NH, NH2, and NH3 groups. The correspond-ing reactions would leave the condensed hetero-aromatic system undestroyed (if N10 is part of the leav-ing group). The m/z = 120 ion is reported in the electronimpact mass spectra by Rice and Dudek [33] andVarmuza et al. [22] but not the m/z = 119 and 118 ions,while the spectra reported by McCloskey [38] and inthe NIST collection [65] contain the m/z = 118 and 119peaks, but not the m/z = 120 feature. Only m/z = 134,120 and 119 were observed, in our 20 eV photon impactspectra. Observations of H and NHn loss processes in thedissociative ionization of adenine are thus sensitivelydependent on the source and ion optics parameters inmass spectrometers used in the measurements.
Another fragmentation pathway involves the initialloss of H2CN (methylene-amidogen) to give the frag-ment ion m/z = 107. This is followed by successive lossof one HCN unit to form the ion m/z = 80, and anotherHCN loss to give the m/z = 53 ion.
C5H5Nþ5 ðm=z ¼ 135Þ
! C4H3Nþ4 ðm=z ¼ 107Þ þH2CN ðm ¼ 28Þ ð11Þ
C4H3Nþ4 ðm=z ¼ 107Þ
! C3H2Nþ3 ðm=z ¼ 80Þ þHCN ðm ¼ 27Þ ð12Þ
C3H2Nþ3 ðm=z ¼ 80Þ
! C2HNþ2 ðm=z ¼ 53Þ þHCN ðm ¼ 27Þ ð13Þ
The relatively small intensities of the correspondingmass peaks in both electron and photon impact massspectra show that this is a minor pathway. Occolowitz[35] observed that only about 35% of the 14C label is re-tained in the fragment ions m/z = 80 formed by loss ofHCN and H2CN from the parent ion, which is a similarpercentage to that observed in the m/z = 81 ions formedby loss of two HCN groups from m/z = 135. He alsosuggested that the existence of an intermediate ion thatcould lose either HCN or H2CN.
We note also that the existence of a peak at m/z = 92,whose intensity, relative to that of m/z = 119, indicatesthat it arises from loss of NH2 (or H + NH) fromm/z = 108 rather than the suggested [37] loss of HCNfrom m/z = 119. The m/z = 65 and 38 ions which alsoinvolve loss of NH2, following multiple loss of HCNgroups from the parent ion, are observed only in elec-tron impact mass spectra (Table 1). Finally, we alsomention ions m/z = 67 and 40, which involve loss ofNHCN, following initial loss, respectively, of one andtwo HCN units from the parent ion. We note also the

8 10 12 14 16 18 20 22
(e) m/z = 54
(d) m/z = 55
(c) m/z = 82
(b) m/z = 83
(f) m/z = 39
(g) m/z = 28
(a) m/z = 126
Lo
g r
elat
ive
inte
nsi
ty
photon energy / eV
Thymine
Fig. 6. Selected ion yield curves of thymine.
H.-W. Jochims et al. / Chemical Physics 314 (2005) 263–282 271
existence of a peak at m/z = 41, corresponding to theNHCN+ ion.
3.2. Thymine: mass spectra and ion yield curves
In Table 3, the relative intensities of the m/z peaks inour thymine mass spectrum, obtained at 20 eV photonexcitation energy, are compared with those of Riceet al. [32], measured with both 20 and 70 eV electron im-pact. The appearance energies of the major m/z ions arelisted, as measured from the onsets in the photoion yieldcurves (Fig. 6), as well as the neutral loss species whichwe consider to be formed with the observed m/z ions bydissociative ionization.
Just as in the case of adenine, the 20 eV photon im-pact and 70 eV electron impact mass spectra of thymineare closely similar, having essentially the same m/z fea-tures but with a few differences in their relative intensi-ties. The m/z = 55 fragment ion peak is the strongestin both cases, the parent peak at m/z = 126 being abouthalf as intense. Other 70 eV electron impact mass spec-tra of thymine have been reported [34,38,65], which alsohave the m/z = 126, 83, 55, 54 and 28 peaks as the mostintense, but which have different relative intensities fromthose measured by Rice et al. [32]. As mentioned earlier,
Table 3Electron impact [32] and photon impact mass spectra and photoion appeara
m/z Electron impact70 eV relativeintensity
Electron impact20 eV relativeintensity
Photon impact20 eV relativeintensity
Photon imappearance(AE, eV)
126 46 100 52 8.82 ± 0.0125 0 0 297 2 0 184 2 2 383 6 17 8 10.70 ± 0.082 7 4 10 13.20 ± 0.071 3 0 370 4 0 258 0 0 156 7 2 955 100 47 100 11.7 ± 0.154 44 11 42 �12.953 6 0 452 14 0 245 0 0 144 6 0 943 4 0 2 11.9 ± 0.142 1 0 041 <1 0 140 6 0 739 12 0 9 14.4 ± 0.138 2 0 037 2 0 029 4 0 628 59 6 67 13.6 ± 0.127 36 0 1126 13 0 3
(a) Four different pathways, with different initial neutral loss species. See tecyclic m/z = 55 by rupture of two bonds, but this is less evident than the pa
these differences between the electron impact spectra aremost probably mainly due to differences in the ion opticsand ion residence times.
We note that a 20 eV electron impact mass spectrumof thymine has the parent peak as its most intense ion.The relative paucity of the mass spectral peaks in the
nce energies: Thymine m = 126 (C5H6N2O2)
pactenergy
Ion elemental formula Neutral loss
3 C5H6N2Oþ2
C5H5N2Oþ2 H
C4H3NOþ2 NH2CH
C4H6NO+ NCO5 C4H5NO+ HNCO5 C4H4NO+ HNCO + H
OCNHCO+ CH3CCHNHC2H2N2O
+ C3H4O
C3H4O+ HNCO + HCN
CH3CCHNH+ HNCO + COCH2CCHNH+ HNCO + CO + H
CO2 impurityHNCO+ C4H5NO
C3Hþ4 2HNCO
C3Hþ3 2HNCO + H
HCNH+ (a)C2H
þ3 or HCN+
C2Hþ2 HNCO + CO + H + HCNH (b)
xt. (b) or could be HNCO + CO + CH3N, the latter formed from thethway proposed in text.

272 H.-W. Jochims et al. / Chemical Physics 314 (2005) 263–282
20 eV electron impact mass spectrum (8 features) [32] ascompared with our 20 eV photon impact mass spectrum(24 peaks, Table 3) illustrates well the difference in en-ergy deposition with these two excitation sources,reflecting the fact that at 20 eV, electron impact is farfrom the Born approximation conditions [84] in whichelectron impact mimics photon impact excitation. Inter-estingly, the loss of HNCO from the parent ion is rela-tively more favored in the 20 eV electron impact ascompared with the 20 eV photon impact case (see Table3). This is consistent with the observation that HNCOloss corresponds to the lowest energy dissociative ioniza-tion process (AE = 10.7 eV, Table 3).
3.2.1. The thymine parent ion
For the parent ion, m/z = 126, we measured an ioni-zation energy of 8.82 ± 0.03 eV (Fig. 6). In Table 4 thisvalue is compared with those determined by varioustechniques. It is in excellent agreement with the onlyother value measured by photoionization mass spec-trometry [67]. As in the case of adenine, an early mea-surement of thymine by electron impact [68] gives avalue that is too high, but later measurements [69,70]give values much closer to our observed PIMS IE. Thevertical IEs obtained by photoelectron spectroscopypeak measurements [23,31] are 200–380 meV above theadiabatic values determined by PIMS and electron im-pact measurements. This is of the same order of magni-tude as the 240 meV predicted by a B1LYP functional[85] calculation [75], and 270 meV by a B3LYP func-tional calculation [86], for the difference between adia-batic and vertical IEs of thymine.
Using our measured adiabatic IE of thymine, and theknown value of the heat of formation DH 0
f ðthymineÞ ¼�328:70 kJ=mol [78], we obtain a value of the heat offormation of the cation DH 0
f ðthymine cationÞ ¼522:36 kJ=mol, which is very close to the preliminary va-lue DH 298
f ðthymine cationÞ ¼ 520 kJ=mol given by Liaset al. [78], based on a quoted PES onset value of theIE = 8.8 eV. A direct comparison between the m/z =126 ion yield curve and the HeI photoelectron spectrum
Table 4Thymine ionization energy valuesa
Experimental method Ionization energy(eV)
Referenceand year
Photoion yield curve (PIMS) 8.82 ± 0.03 Present studyElectron impact ion yield curve 9.43 ± 0.10 [68] 1967Photoelectron spectroscopy (PES) 9.14 ± 0.03 (vert) [23] 1975PES 9.02b (vert?) [25] 1975PIMS 8.87 ± 0.05 [67] 1976Electron impact ion yield curve 8.95 ± 0.10 [69] 1976PES 9.20b (vert) [28] 1976PES 9.18b (vert) [24] 1989Electron impact ion yield curve 9.15 ± 0.15 [70] 1996
a Adiabatic values unless otherwise stated.b Uncertainty not reported.
of thymine measured by Urano et al. [24] revealed a fewshoulders or apparent steps in the ion yield curve atenergies close to those of several features in the photo-electron spectrum (Fig. 3(b)), but less marked than inthe corresponding case of adenine. These features are re-lated to the PES bands assigned to the p1, n1, p2 and p3orbitals of thymine [24], as well as to some unassignedhigher energy PES features. An inflection that we ob-serve at �11.7 eV in the parent ion yield curve has noobvious feature in the photoelectron spectra of thymine.One possibility is that this corresponds to an autoioniza-tion process in a Franck–Condon gap [87].
At higher energies, there is a marked rise in the parention yield at about 16 eV, leading to a maximum at about19.3 eV. Although the PES intensity drops markedly be-tween 15 and 16 eV, in contrast to the parent ion yieldcurve, it shows, between 16 and 20 eV, a somewhat sim-ilar behaviour to the latter. This region of the PES hasnot been assigned but we note that there are similar fea-tures in the PES of pyrimidine in this energy region, forwhich molecular orbital assignments have been made[79].
Just as in the case of adenine, we compared the thy-mine parent ion yield curve with the optical absorptioncurve derived from 25 keV electron energy loss spectraof thin films of thymine [57] (Fig. 4(b)). Our parention yield curve has a plateau between 13 and 15.5 eV,followed by a rise to about 17.7 eV, continuing on to apeak at about 19 eV. In the thymine film spectrum, thereare peaks reported to be at 14.4 ± 0.3 and 18.3 ± 0.3 eV[57]. The physical relation between these solid and gasphase features requires further investigation.
3.2.2. Thymine ion fragmentation
(a) Reactions involving loss of HNCO and/or CO: Theprincipal fragmentation pathways of the thymine parentcation (species IV, see schematic representation Fig. 7)involve loss of HNCO (isocyanic acid). One unit lossgives rise to the m/z = 83 ion, whose AE = 10.7 eV:
C5H6N2Oþ2 ðm=z ¼ 126Þ
! C4H5NOþ ðm=z ¼ 83Þ þHNCO ðm ¼ 43Þ ð14Þ
This ion is formed by Retro–Diels–Alder (RDA) reac-tion from the thymine parent cation, and involves therupture of two bonds, N3–C4 and C2–N1, in the parention. The latter bond has been calculated to be muchweakened in the cation as compared with neutral thy-mine [75]. The m/z = 83 fragment ion has been sug-gested to have the structure of species Va (Fig. 7) [38].This is supported by recent calculations of the possibleminimum energy structures and relative stabilities ofC4H5NO+ isomers [75]. We remark that the mass spec-trum of 14C2-thymine [34] retains the m/z = 83 peak,confirming that the 14C2 atom has been eliminated inthe HNCO loss molecule, as proposed in reaction (14).

CH3HN
NH
O
O
HN
N
O
O
-H
C
CH3
C
HNH
-H
C
CH2
CHN H
(15) -CO
H
CC
O
CH3
CHN H
(14) RDA
-HNCO
CC CH3
CN H
O
-C2H2
-HCN
C2H2+
C2H3+ HCN
+
HCNH+
-OH
C3H3+
.
m/z = 126IE = 8.82
1
2
3 4
5
67
89
hν
+
.
m/z = 83AE = 10.7
(Va)
+.m/z = 83
(Vb)+
.m/z = 55AE = 11.7
+m/z = 54AE = 12.9 m/z = 28
AE =13.6
m/z = 82AE = 13.2
m/z = 26
m/z = 27
(VIII)m/z = 56
m/z = 39AE = 14.4
CC
HO
CH3
+
.
CH3
H H
T
(IV)
(VI)H
(VII)
CC
O
CH2
CHN H
+(IX)
+
Fig. 7. Principal fragmentation decay routes of the thymine radical cation. Measured appearance energy values are given for each fragment (in eV,for uncertainties refer to Table 3). Roman and Arabic numerals correspond to species and reactions, respectively.
H.-W. Jochims et al. / Chemical Physics 314 (2005) 263–282 273
One possible evolution of the Va C4H5NO+ ion thatwe considered is ring closure to form the 5-methyl-isoxaz-ole cation. The heat of formation of the 5-methyl-isoxaz-ole cation isDHf = 931 kJ/mol, obtained from the heat offormation of neutral 5-methyl isoxazole, DHf = 34 kJ/mol [65], and its adiabatic IE = 9.3 ± 0.1 eV, which wedetermined from the published HeI photoelectron spec-trum of Kobayashi et al. [88]. However, we find thatthe heat of formation of the observed C4H5NO+ ion,DHf(C4H5NO+) = 806 kJ/mol, based on its measuredappearance energy, is considerably smaller than that ofthe 5-methyl isoxazole cation, which shows that the latteris not formed in our experiment. Another possibility isthat the evolution is to the 4-methyl isoxazole cation (spe-cies Vb in Fig. 7), which is a dp system. Thermochemicaldata on this species are not available. We note that theweak ion m/z = 84, observed in both the 20 and 70 eVelectron impact mass spectra (Table 3), would corre-spond to the loss of NCO from IV.
The loss of two HNCO units gives rise to them/z = 40 ion, assigned to CH3–C@CH+. This can occur
directly from parent ion via rupture of the two bonds,C4–C5 and, N1–C6. However, the calculations of Imp-rota et al. [75] suggest that while the C4–C5 bond wouldbe considerably weaker in the cation, the N1–C6 bondwould be stronger. Formation of the m/z = 40 ionwould be more complex, if it occurred via m/z = 83,since it would involve rupture of two further bonds inthis intermediate ion to lose CO + NH.
Concerning the evolution of the m/z = 83 fragmention, we note that it can go on to lose a CO moleculeto form the most abundant ion in the mass spectrum,m/z = 55, whose AE = 11.7 eV.
C4H5NOþ ðm=z ¼ 83Þ! C3H5N
þ ðm=z ¼ 55Þ þ CO ðm ¼ 28Þ ð15ÞThis fragment ion, whose m/z value is, as expected, un-changed in the mass spectrum of 14C2-thymine [34], hasa proposed quasi-linear structure shown in Fig. 7 (speciesVI).Although this is the thermodynamicallymost favoredstructure, other isomersmight be kineticallymore accessi-ble according to the calculations of Improta et al. [75].

274 H.-W. Jochims et al. / Chemical Physics 314 (2005) 263–282
Another possible assignment of m/z = 55 is toCH3CCO
+ (methylketene ion which could eventuallyisomerize to CH2@CHCO+ or HC@CCH2O
+) thatcan be formed by rupture of the central carbon–carbonbond in m/z = 83. This corresponds to the charge switchof one of the reactions that can form m/z = 28 (see be-low). However, it is generally considered [38] that them/z = 55 ion is indeed CH3CCHNH+, containing themethyl group and the atoms N1, C5 and C6.
The m/z = 83 ion can also lose a hydrogen atom, sug-gested to be from the methyl group [32], to give m/z =82. It has been proposed [32] that further loss, of aCO group, is responsible for the formation of the strongm/z = 54 fragment ion C3H4N
+. However, our ion yieldmeasurements show that the AE of m/z = 54 (�12.9 eV)is smaller than that of m/z = 82 (13.2 eV). Thus, theremust exist some other mechanism of formation of them/z = 54 ion at threshold. This is most probably lossof a hydrogen atom from the m/z = 55 species. It is ofinterest that the maximum in the m/z = 55 ion yieldcurve is at about 16 eV (Fig. 6) whereas it is at about19 eV for the m/z = 54 ion, not far from the maximumin the parent ion curve (19.3 eV). The difference inenergy is of the order of magnitude of the dissociationenergy of a C–H bond. We remark that two differentstructures could exist for the m/z = 54 species, thequasi-linear species VII in Fig. 7, and a cyclic structurein which a methyl group is attached to a (H)CCN cyclicgroup [32].
(b) Other important ions: The weak m/z = 43 ion(AE = 11.9 ± 0.1) eV, assigned to HNCO+, could bethe fragment ion formed in a reaction correspondingto a charge switch in the reaction (14) which leads tothe formation of the m/z = 83 ion discussed above. Wenote that the shift of the m/z = 43 peak to m/z = 45 inthe 14C2-thymine mass spectrum published by Ulrichet al. [34] confirms our suggestion above that this ionis produced by a charge switch of reaction (14). Them/z = 43 ion is not observed in the 20 eV electron im-pact mass spectrum, although it is present in the 20 eVphoton impact spectrum. This is consistent with the factthat the m/z = 83 ion is relatively much weaker in the20 eV electron impact as compared with the photon im-pact mass spectrum (Table 3).
Following the Stevenson–Audier–Harrison (SAH)rule concerning the dissociation of odd electron ions[89], the fact that m/z = 83 has a smaller AE thanm/z = 43 suggests that the m = 83 neutral species(C4H5NO) has a smaller IE than HNCO, whoseIE = 11.61 ± 0.03 eV [78]. This is certainly the case forthe 5-methyl isoxazole form of C4H5NO, whose IE(-v) = 9.61 eV [88] and whose IE(ad) we have determinedas 9.3 ± 0.1 eV (see above). However, the C4H5NOproduct is not 5-methyl isoxazole since, from the11.9 eV appearance energy of m/z = 43 and the heatsof formation of thymine and of HNCO+, we calculate
the heat of formation of neutral C4H5NO to be�198 kJ/mol whereas, as mentioned above, the knownheat of formation of 5-methyl isoxazole is34.1 ± 0.75 kJ/mol [65]. Nor can C4H5NO be 3-methylisoxazole, since the latter has DHf = 35.6 ± 0.67 kJ/mol [65].
m/z = 39: The most probable assignment of them/z = 39 ion is to C3H
þ3 , which could be formed by loss
of a hydrogen atom from C3Hþ4 (m/z = 40). The high
AE = 14.4 eV of m/z = 39 is consistent with the energyexpensive pathways suggested above for formation ofits precursor ion, m/z = 40. Another possible formationpathway would be OH loss from m/z = 56 (species VIIIin Fig. 7), whose formation is discussed below.
m/z = 28: The suggested linear structure of them/z = 54 ion could give rise to formation of theHCNH+ (m/z = 28) and C2H
þ2 (m/z = 26) ions by rup-
ture of the central carbon–carbon bond. The importantHCNH+ ion could also be formed by rupture of the cen-tral carbon–carbon bond in the m/z = 82 fragment ion(species IX in Fig. 7). Another mechanism involves di-rect formation of HCNH+ from the parent ion, whichrequires rupture of two bonds, the C5–C6 double bondand the C2–N1 bond, both of which are calculated to beweaker in the cation [75]. We also note that from thestructure of the C4H5NO+ ion (m/z = 83, species Va)proposed above, it is possible, by rupture of the centralcarbon–carbon bond, to produce HCNH+. This is path-way E of Rice et al. [32] in which there would be loss ofthe methylketene radical CH3CCO. It is not clear as towhether this actually occurs since there is no mentionof a metastable peak for this process. Thus we have sug-gested five different possible pathways for forming theHCNH+ ion, via the respective precursors m/z = 126,83, 82, 55 and 54, which in the latter three cases involvesrupture of only one, carbon–carbon, bond. The AEs ofthe various fragment ions are consistent with all fivepathways. From the profiles of their respective ion yieldcurves, it appears that the relative importance of thesefive pathways to forming the HCNH+ ion is modifiedabove 16 eV, since the 16 eV maximum in the ion yieldcurves of the m/z = 55 and 83 ions is at a much lowerenergy than the maxima in the other three precursorion yield curves (Fig. 6).
A final remark concerning the m/z = 28 ion, assignedabove to HCNH+, is that it is unlikely to be CO+ sinceCO has a quite high ionization energy (14.014 eV [65]),whereas the m/z = 28 ion has an AE = 13.6 eV, lowerthan IE(CO).
(c) Less intense fragment ion peaks (no AE measure-
ments): There is no initial loss of CO from the parention, since the m/z = 98 fragment ion is absent in themass spectra. A weak ion is observed at m/z = 97, whichis possibly C4H3NOþ
2 , resulting from loss of NH2CH.We have not yet discussed the very weakest ions ob-served in our mass spectrum of thymine, at m/z = 71,

H.-W. Jochims et al. / Chemical Physics 314 (2005) 263–282 275
70, 58, 56, 53, 52, 45, 41, 27: (Table 3). Of these,m/z = 45 and 58 were not observed in the mass spectrumof Rice et al. [32], although m/z = 45 is present in themass spectrum of Ulrich et al. [34] and in that of theNIST [65].
m/z = 70, 71 and related species: We assign them/z = 71 peak to OCNHCO+, which could be formedfrom the parent ion by breaking of two bonds, C2–N1and C4–C5. Both bonds are expected to be weaker inthe cation from the calculations of Improta et al. [75]:
C5H6N2Oþ2 ðm=z ¼ 126Þ
! OCNHCOþ ðm=z ¼ 71Þ þ CH3CCHNH ðm ¼ 55Þð16Þ
This reaction also suggests that an alternative pathwayfor formation of the m/z = 55 ion would be a chargeswitch of reaction (16).
Them/z = 70 peak was assigned byUlrich et al. [34] toOCNCO+, based on a shift of two mass units in theirmass spectra observed in a 14C2 study of thymine. Wenote that this fragment ion would not be formed by lossof a hydrogen atom from m/z = 71, since the latter peakis unchanged in the carbon isotope spectrum. However,an alternative assignment of m/z = 70, which we con-sider to be more probable, is to C2H2N2O
+, whose struc-ture would be that of the 1,2,5-oxadiazole cation. Thiscould be formed from the parent cation by rupture ofthe C4–N3 and C5–C6 bonds and simultaneous forma-tion of a bond between the C6 and N3 atoms. The result-ing m/z = 70 ion would still be compatible with the massspectrum of the 14C2 study of thymine by Ulrich et al.[34]. With this new assignment of the m/z = 70 ion, theneutral loss is of a species whose elemental formula isC3H4O and whose structure is that of methylketene.
C5H6N2Oþ2 ðm=z ¼ 126Þ
! C2H2N2Oþ ðm=z ¼ 70Þ þ C3H4O ðm ¼ 56Þ ð17Þ
This assignment of m/z = 70 also makes possible a rea-sonable assignment of the m/z = 56 peak to the methyl-ketene ion C3H4O
+ (an isomer of species VIII). Thelatter could be formed by a reaction corresponding toa charge switch of reaction (17). It is difficult to estimatewhether this charge switch reaction is likely to occur,since although the ionization energy of methylketene isknown, IE(v) = 8.95 eV [65], that of 1,2,5-oxadiazolehas not been reported so far. The structure of the m/z =56 ion could also correspond to a 1-methyl-2-hydroxy-acetylene cation ðHO–C@CCHþ
3 Þ, species VIII inFig. 7), formed from ion Va (m/z = 83) by 1,5 H-shiftwith subsequent rupture of the central C–C bond. Thisreaction would most likely represent the unique HCNloss reaction for this nucleobase cation, in contrast, ofcourse, to adenine, where multiple HCN loss processesoccur. Isotopic studies are required to show whether thisassignment of m/z = 56 is viable.
The weak peak at m/z = 53+ is not assigned. Them/z = 52 ion is quite strong in the 70 eV electron impactmass spectrum, but absent in the 20 eV electron impactspectrum. This indicates, as do the intensities of someother relatively small fragment ions in the respectivemass spectra, that they result from higher energy disso-ciative ionization processes. There are two assignmentsðHCNþ; C2H
þ3 Þ for the m/z = 27 ion. HCN+ could be
formed by loss of a hydrogen atom from HCNH+.The formation of C2H
þ3 is not easily rationalized. Isoto-
pic labeling experiments are required to clarify the rela-tive importance of these two m/z = 27 fragment ions.
3.3. Uracil: mass spectra and ion yield curves
Table 5 presents the relative intensities of them/zpeaksin our uracil mass spectrum, obtained at 20 eV photonexcitation energy, and compares them with those of Riceet al. [32], measured with 70 eV electron impact, and withthe 20 eV electron impact spectra of Hecht et al. [41] andof Rice et al. [32]. The appearance energies of the majorm/z ions are listed, as measured from the onsets in thephotoion yield curves (Fig. 8), and we give the neutralspecies which we consider to be formed by dissociativeionization of uracil, along with the observed m/z ions.
Our 20 eV photon impact mass spectrum of uraciland the 70 eV electron impact one of Rice et al. [32]are very similar, having essentially the same m/z featuresbut with a few differences in their relative intensities. Them/z = 42 fragment ion peak is the strongest in bothcases, as it is in the 70 eV electron impact mass spectrumreported by Brown et al. [39]. Several other electron im-pact mass spectra of uracil have been reported, havingthe same principal ions but with relative intensities dif-ferent from those measured by Rice et al. [32]. In thesemass spectra the parent peak at m/z = 112 is the mostintense [34,38,40,65,90] and the intensities of the otherprincipal peaks are in the m/z order 42 > 69 > 28[34,40] or 69 > 42 > 28 [38,65,90,91]. As mentioned ear-lier, the differences between the 70 eV electron impactspectra are most probably due to differences in the ionoptics and ion residence times.
The 20 eV electron impact mass spectra of uracil ob-tained by Rice et al. [32] and by Hecht et al. [41] alsohave the parent peak as its most intense ion, with theother principal peaks being m/z = 69, 42 and 28. Themuch smaller number of m/z peaks in the 20 eV electronimpact mass spectrum of Rice et al. [32] (10 features) ofuracil as compared to our 20 eV photon impact massspectrum (Table 5) can here too be understood, as inthe similar case of thymine, as being due to a differentenergy deposition with these two excitation sources,since at 20 eV electron impact the Born approximationconditions [84] under which electron impact mimicsphoton impact excitation is not operative at this lowelectron excitation energy. However, we note that the

Table 5Electron impact [32,41] and photon impact mass spectra and photoion appearance energies: Uracil m = 112 (C4H4N2O2)
m/z Electron impact70 eV relativeintensity
Electron impact20 eV relative intensitya
Photon impact20 eV relativeintensity
Photon impactappearanceenergy (AE, eV)
Ion elementalformula
Neutral loss
112 78 100(100) 63 9.15 ± 0.03 C4H4N2Oþ2
96 2 0(0) 1 C4H4N2O+ O
95 0 <1(2) 077 0 <1(0) 070 7 5(5) 4 C3H4NO+ NCO69 63 69(66) 52 10.95 ± 0.05 C3H3NO+ HNCO68 33 15(5) 33 13.40 ± 0.05 C3H2NO+ HNCO + H67 1 <1(0) 056 3 <1(0) 353 4 <1(0) 152 1 <1(0) 151 1 <1(0) 044 8 4(1) 443 15 6(1) 10 13.6 ± 0.2 HNCO+ C3H3NO42 100 59(21) 100 13.25 ± 0.05 C2H2O
+ HNCO + HCN41 48 21(8) 50 12.95 ± 0.05 HCCHNH+ and/or HCCO+ HCNO + CO and/or
HNCO + HCN + H40 57 21(0) 25 14.06 ± 0.10 C2H2N
+ HNCO + H + CO39 15 5(0) 238 7 2(0) 032 0 2(0) 031 0 <1(0) 029 1 2(0) 3 NH2CH
+ or HCO+
28 78 74(10) 86 13.75 ± 0.05 HCNH+ HNCO + HCCO27 2 3(0) 4 HCN+ HNCO + HCCO + H26 4 4(0) 5 �15 eV C2H
þ2 2HNCO
18 n.m.b n.m. 4 H2O+ Also observed in NIST
17 n.m. n.m. 1 NH3+ Also observed in NIST
14 n.m. n.m. 3 N+ Also observed in NIST
a Data from the 20 eV electron impact mass spectra of Hecht et al. [41] and, in parentheses, of Rice et al. [32].b n.m. = not measured.
8 9 10
(e) m/z = 28
(d) m/z = 42
(c) m/z = 68
(b) m/z = 69
(a) m/z = 112
Lo
g r
elat
ive
inte
nsi
ty
photon energy / eV
10 12 14 16 18 20 22
Uracil
Fig. 8. Selected ion yield curves of uracil. The m/z = 112 ion yieldcurve has been measured using an MgF2 cut-off filter.
276 H.-W. Jochims et al. / Chemical Physics 314 (2005) 263–282
reported 20 eV electron impact mass spectrum of uracil,by Hecht et al. [41] (Table 5), contains many more,mainly very weak, features, and that the principal peakintensities are often much closer to those observed in the70 eV electron impact mass spectrum. It would thus ap-pear that the ion residence time was much longer in the20 eV electron impact experiments of Hecht et al. [41]than in those of Rice et al. [32].
Coupier et al. [91] recently measured both proton(20–150 keV) impact and electron (200 eV) impact massspectra of uracil. They observed the same principal frag-ment ions as in our 20 eV photon impact study, but dis-cussed only four of the fragment ions, m/z = 69, 42, 29and 28, giving the latter three different molecular ionassignments than ours, as discussed later. Especially inthe proton impact spectrum, they also observed a verylarge number of other fragment ions, this being due,no doubt, to the increased energy deposition with re-spect to our case and to that of 70 eV electron impact.In the proton impact study, the order of the principal

Table 6Uracil ionization energy valuesa
Experimental method Ionization energy(eV)
Referenceand year
Photoion yield curve (PIMS) 9.15 ± 0.03 Present studyElectron impact ion yield curve 9.82 ± 0.10 [68] 1967Electron impact ion yield curve 9.53 ± 0.02 [92] 1971Photoelectron spectroscopy (PES) 9.59 ± 0.03 (vert) [93] 1974PES 9.50 ± 0.03 (vert) [23] 1975PES 9.45b (vert) [25] 1975PES 9.60b (vert) [28] 1976PIMS 9.32 ± 0.05 [67] 1976Electron impact ion yield curve 9.35 ± 0.10 [69] 1976PES 9.68b (vert) [27] 1980PES 9.53b [29] 1996Electron impact ion yield curve 9.59 ± 0.08 (vert) [90] 2004
a Adiabatic values unless otherwise stated.b Uncertainty not reported.
H.-W. Jochims et al. / Chemical Physics 314 (2005) 263–282 277
ion intensities was m/z = 112 = 42 > 28 > 69, whereas inthe 200 eV electron impact mass spectrum it was m/z = 28 > 42 > 69 > 112.
3.3.1. The uracil parent ion
For the uracil ion C4H4N2Oþ2 , m/z = 112, we ob-
tained an ionization energy of 9.15 ± 0.03 eV from theparent ion yield curve, measured using an MgF2 filter(Fig. 8(a)). This value is a little smaller than theIE = 9.32 ± 0.05 eV obtained with the only other re-ported measurement by photoionization mass spectrom-etry [67] Table 6. Early measurements of uracil byelectron impact gave IE values that are rather high[68,92], but a later measurement [69] is much closer toour PIMS value. A recent electron impact measurement[90] also gave a value, IE = 9.59 ± 0.08 eV, considerablyhigher than our PIMS value, but similar to the verticalIEs of uracil obtained by photoelectron spectroscopypeak measurements [23,27–29,93]. The PES IE(vert) val-ues fall in the range 9.50–9.68 eV, i.e., 350–530 meVabove the adiabatic value determined by our PIMS mea-surement. The calculations of IE(ad) and IE(vert) re-ported for this RNA base by Wetmore et al. [94] givevalues IE(ad) = 9.21 eV and IE(vert) = 9.47 eV, a differ-ence of 260 meV.
HN
N
O
O
-H
C
H
C
HNH
-CO
H
CC
O
CHN
-
hν
+
.
+
.m/z = 41
AE = 12.95
m/z = 40AE = 14.06
m/z = 68AE = 13.4
+HN C C H
-CO
-H
(XII)
(XIV)
HN
NH
O
O 1
2
3 4 5
6
7
8
H
H+
Fig. 9. Principal fragmentation decay routes of the uracil radical cation. Meauncertainties refer to Table 5). Roman and Arabic numerals correspond to
As in the case of adenine and thymine, a direct com-parison between the m/z = 112 ion yield curve and theHeI photoelectron spectrum of uracil [24] revealed fea-tures in the ion yield curve that can be correlated withfeatures in the photoelectron spectrum (see Fig. 3(c)).Also, there is a general similarity in the parent ion yieldcurves of the two related nucleobases uracil and thy-mine. In particular, in both cases there is a marked rise
H
H
RDAHNCO
(20) -HCN
HCNH+
.
m/z = 112IE = 9.15
m/z = 69AE = 10.95
m/z = 28AE = 13.75
m/z = 42AE = 13.25
CC
O
HH+
.
H
H
(XIII)
(X)
(XI)
sured appearance energy values are given for each fragment (in eV, forspecies and reactions, respectively.
278 H.-W. Jochims et al. / Chemical Physics 314 (2005) 263–282
in the parent ion yield at about 16 eV, leading to a max-imum in the 19.3–19.5 eV region.
Using our measured adiabatic IE of uracil, and theknown value of the heat of formation DH 0
f ðuracilÞ ¼�303� 2 kJ=mol [78], we obtain a value of the heat offormation of the cation DH 0
f ðuracil cationÞ ¼ 580�5 kJ=mol, in agreement with the preliminary value585 kJ/mol given by Lias et al. [78], based on the onsetof a photoelectron spectral band.
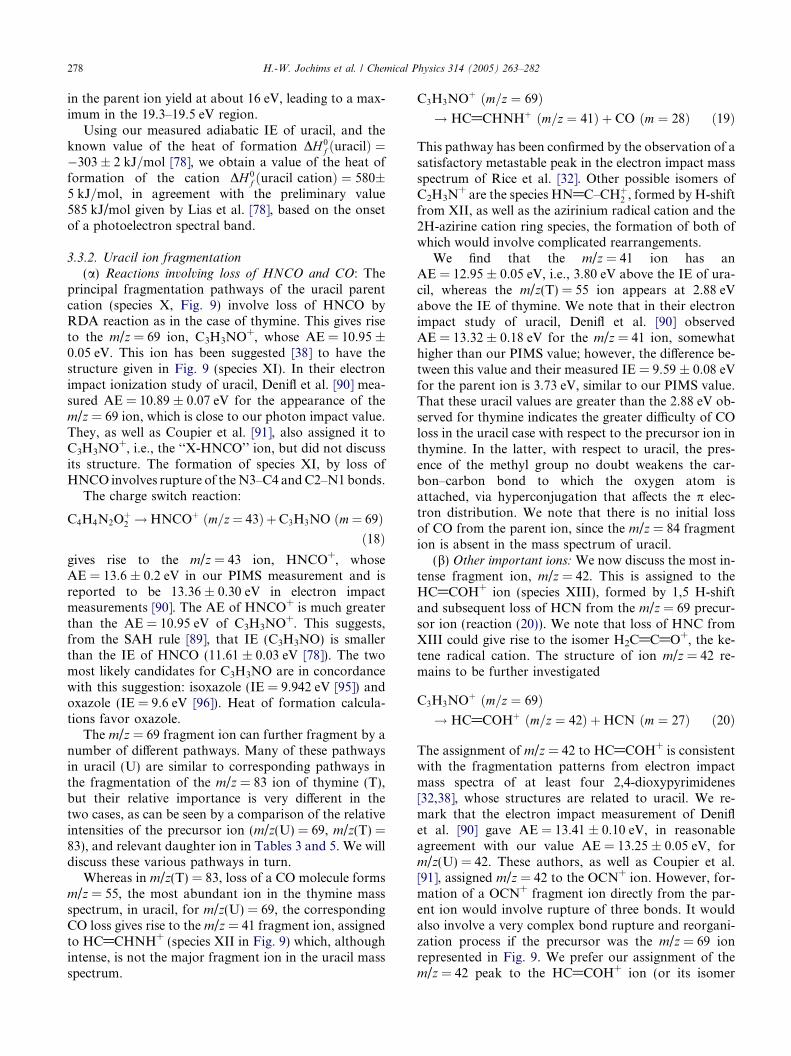
3.3.2. Uracil ion fragmentation
(a) Reactions involving loss of HNCO and CO: Theprincipal fragmentation pathways of the uracil parentcation (species X, Fig. 9) involve loss of HNCO byRDA reaction as in the case of thymine. This gives riseto the m/z = 69 ion, C3H3NO+, whose AE = 10.95 ±0.05 eV. This ion has been suggested [38] to have thestructure given in Fig. 9 (species XI). In their electronimpact ionization study of uracil, Denifl et al. [90] mea-sured AE = 10.89 ± 0.07 eV for the appearance of them/z = 69 ion, which is close to our photon impact value.They, as well as Coupier et al. [91], also assigned it toC3H3NO+, i.e., the ‘‘X-HNCO’’ ion, but did not discussits structure. The formation of species XI, by loss ofHNCO involves rupture of theN3–C4 andC2–N1 bonds.
The charge switch reaction:
C4H4N2Oþ2 !HNCOþ ðm=z¼ 43Þ þC3H3NO ðm¼ 69Þ
ð18Þgives rise to the m/z = 43 ion, HNCO+, whoseAE = 13.6 ± 0.2 eV in our PIMS measurement and isreported to be 13.36 ± 0.30 eV in electron impactmeasurements [90]. The AE of HNCO+ is much greaterthan the AE = 10.95 eV of C3H3NO+. This suggests,from the SAH rule [89], that IE (C3H3NO) is smallerthan the IE of HNCO (11.61 ± 0.03 eV [78]). The twomost likely candidates for C3H3NO are in concordancewith this suggestion: isoxazole (IE = 9.942 eV [95]) andoxazole (IE = 9.6 eV [96]). Heat of formation calcula-tions favor oxazole.
The m/z = 69 fragment ion can further fragment by anumber of different pathways. Many of these pathwaysin uracil (U) are similar to corresponding pathways inthe fragmentation of the m/z = 83 ion of thymine (T),but their relative importance is very different in thetwo cases, as can be seen by a comparison of the relativeintensities of the precursor ion (m/z(U) = 69, m/z(T) =83), and relevant daughter ion in Tables 3 and 5. We willdiscuss these various pathways in turn.
Whereas in m/z(T) = 83, loss of a CO molecule formsm/z = 55, the most abundant ion in the thymine massspectrum, in uracil, for m/z(U) = 69, the correspondingCO loss gives rise to the m/z = 41 fragment ion, assignedto HC@CHNH+ (species XII in Fig. 9) which, althoughintense, is not the major fragment ion in the uracil massspectrum.
C3H3NOþ ðm=z ¼ 69Þ! HC@CHNHþ ðm=z ¼ 41Þ þ CO ðm ¼ 28Þ ð19Þ
This pathway has been confirmed by the observation of asatisfactory metastable peak in the electron impact massspectrum of Rice et al. [32]. Other possible isomers ofC2H3N
+ are the species HN@C–CHþ2 , formed by H-shift
from XII, as well as the azirinium radical cation and the2H-azirine cation ring species, the formation of both ofwhich would involve complicated rearrangements.
We find that the m/z = 41 ion has anAE = 12.95 ± 0.05 eV, i.e., 3.80 eV above the IE of ura-cil, whereas the m/z(T) = 55 ion appears at 2.88 eVabove the IE of thymine. We note that in their electronimpact study of uracil, Denifl et al. [90] observedAE = 13.32 ± 0.18 eV for the m/z = 41 ion, somewhathigher than our PIMS value; however, the difference be-tween this value and their measured IE = 9.59 ± 0.08 eVfor the parent ion is 3.73 eV, similar to our PIMS value.That these uracil values are greater than the 2.88 eV ob-served for thymine indicates the greater difficulty of COloss in the uracil case with respect to the precursor ion inthymine. In the latter, with respect to uracil, the pres-ence of the methyl group no doubt weakens the car-bon–carbon bond to which the oxygen atom isattached, via hyperconjugation that affects the p elec-tron distribution. We note that there is no initial lossof CO from the parent ion, since the m/z = 84 fragmention is absent in the mass spectrum of uracil.
(b) Other important ions: We now discuss the most in-tense fragment ion, m/z = 42. This is assigned to theHC@COH+ ion (species XIII), formed by 1,5 H-shiftand subsequent loss of HCN from the m/z = 69 precur-sor ion (reaction (20)). We note that loss of HNC fromXIII could give rise to the isomer H2C@C@O+, the ke-tene radical cation. The structure of ion m/z = 42 re-mains to be further investigated
C3H3NOþ ðm=z ¼ 69Þ! HC@COHþ ðm=z ¼ 42Þ þHCN ðm ¼ 27Þ ð20Þ
The assignment of m/z = 42 to HC@COH+ is consistentwith the fragmentation patterns from electron impactmass spectra of at least four 2,4-dioxypyrimidenes[32,38], whose structures are related to uracil. We re-mark that the electron impact measurement of Deniflet al. [90] gave AE = 13.41 ± 0.10 eV, in reasonableagreement with our value AE = 13.25 ± 0.05 eV, form/z(U) = 42. These authors, as well as Coupier et al.[91], assigned m/z = 42 to the OCN+ ion. However, for-mation of a OCN+ fragment ion directly from the par-ent ion would involve rupture of three bonds. It wouldalso involve a very complex bond rupture and reorgani-zation process if the precursor was the m/z = 69 ionrepresented in Fig. 9. We prefer our assignment of them/z = 42 peak to the HC@COH+ ion (or its isomer

H.-W. Jochims et al. / Chemical Physics 314 (2005) 263–282 279
H2C@C@O+), whose formation is mechanistically morereasonable.
The incorrect assignment of the m/z = 42 ion toOCN+ has further implications. Feil et al. [97] have veryrecently measured the absolute value of the partialcross-section for formation of this cation in electronexcitation of uracil, and then used this cross-section,which they assumed was that of the OCN+ ion, in con-junction with the known sensitivity ratio for detection ofpositive and negative ions of the same species, to deter-mine the dissociative attachment cross-section for for-mation of the OCN� anion from uracil. The valuethey obtained was smaller by an order of magnitudethan that previously obtained with uracil by simple nor-malization with the cross-section for dissociative elec-tron detachment in CCl4 [98]. Although it is verypossible that the m/z = 42 anion formed by dissociativeelectron detachment in uracil is indeed OCN�, it ap-pears unlikely that the m/z = 42 cation is OCN+. Wesuggest that incorrect assignment of the m/z = 42 cationto OCN+ is in part responsible for the discrepancy be-tween the two OCN� cross-section values.
Another fragmentation pathway with m/z = 69 asprecursor ion leads, by rupture of the central carbon–carbon bond, to formation of HCNH+ (m/z = 28),AE = 13.75 ± 0.05 eV, by loss of the ketene radicalHC@C@O.
C3H3NOþ ðm=z ¼ 69Þ! HCNHþ ðm=z ¼ 28Þ þHC@C@O ðm ¼ 41Þ ð21Þ
It is not clear as to whether this actually occurs since thereis nomention of ametastable peak for this process in elec-tron impact experiments [32]. We further remark thatCoupier et al. [91] assign the m/z = 28 ion to CO+ (seealso [90]) but this is very unlikely, for reasons similar tothose discussed previously for the analogous case in thy-mine. Denifl et al. [90] measure AE = 13.83 ± 0.39 eV form/z = 28, in good agreement with our PIMS value.
We note that the charge switch ion HC@C@O+
(m/z = 41) to reaction (21) has the same m/z asHC@CHNH+, AE = 12.95 eV, discussed above. Bothion products are suggested by the fragmentationschemes of Rice et al. [32]. The respective IEs of theHC@C@O radical (�9.5 eV [78]) and HC@CHNH(10.1–12.2 eV, according to the structure of this ion[65]) suggest that HC@C@O+ could be a significant con-tributor to the m/z = 41 peak.
The m/z = 69 ion can also lose a hydrogen atom togive m/z = 68, which is a strong ion, whoseAE = 13.40 ± 0.05 eV. The electron impact measure-ment, AE = 12.75 ± 0.66 eV, is not inconsistent withour PIMS value, given the large uncertainty in the elec-tron impact value. It has been proposed [32] that thefairly strong m/z = 40 fragment ion (species XIV in Fig.9) can be formed via two pathways: (i) loss of a CO group
from m/z = 69, (species XI) followed by loss of a hydro-gen atom, or (ii) loss of H from XI followed by loss ofCO. Both pathways are indicated in Fig. 9. Our ion yieldmeasurements show that the AE ofm/z = 40 (14.06 eV) ismuch greater than that ofm/z = 69 (10.95 eV) and of theAE of the respective intermediate ions m/z = 41 and m/z = 68. This is consistent with the m/z = 40 ion resultingfrom three stages of fragmentation.
On the basis of the corresponding studies on thymine,it is possible to propose two different structures for aC2H2N
+ assignment of the m/z = 40 species, a quasi-lin-ear HN@C@CH+ (species XIV in Fig. 9) and a cyclicstructure in which a nitrogen atom is attached to twolinked CH groups. However, in contrast to the case ofthymine, where the corresponding m/z(T) = 54 ion isconsidered to have the structure H2C@C@CHNH+
(species VII), from which formation of the HCNH+
(m/z = 28) ion can occur by rupture of the central car-bon–carbon bond, the corresponding precursor ion inuracil, HN@C@CH+ [32], does not have a suitablestructure for easy formation of HCNH+.
We must remember that there is also a totally differ-ent assignment possible for the m/z = 40 ion, i.e.,CCO+, formed by loss of a hydrogen atom from aHC@C@O+ (m/z = 41) precursor that could be formedas discussed above. However, Rice et al. [32] affirm thatthe only ion observed at m/z = 40 is C2H2N
+. Isotopiclabeling studies would be useful to clarify this assertion.
Another mechanism for producing HCNH+ involvesdirect formation from the parent ion, which requiresrupture of two bonds, the C5–C6 double bond and theC2–N1 bond (Fig. 1), similar to the case of thymine:
C4H4N2Oþ2 ðm=z ¼ 112Þ
! HCNHþ ðm=z ¼ 28Þ þ C3H2NO2 ðm ¼ 84Þ ð22Þ
In contrast to thymine, for which we have suggested fivedifferent possible pathways for forming the HCNH+
ion, in the case of uracil (U) there appear to be onlytwo viable pathways to the formation of HCNH+, viareactions (21) and (22), respectively. The AE = 13.75 eVof m/z(U) = 28 and the AEs of the precursor ions (10.95and 9.15 eV, respectively) are consistent with these twopathways. We note, however, that the intensity of them/z = 69 ion decreases rapidly above 13.7 eV which isclose to the onset of the m/z = 28 eV ion yield curve.This suggests that both pathways to formation ofHCNH+ are operative, weakly from the parent ion pre-cursor, and strongly from the m/z = 69 precursor.
(c) Less intense fragment ion peaks (no AE measure-
ments): The other fragment ion peaks in Table 5 belongto minor ions, some of which are associated with highenergy processes.
m/z = 96: This weak ion is assigned to C4H4N2O+
corresponding to loss of a single oxygen atom from

280 H.-W. Jochims et al. / Chemical Physics 314 (2005) 263–282
the parent ion. This could result from cleavage of theC4–O4 bond or the C2–O2 bond. We note that the20 eV electron impact mass spectra contain a peak atm/z = 95 but not at m/z = 96, whereas the 70 eV elec-tron impact mass spectra, like our 20 eV photon impactspectrum, possess a peak at m/z = 96 but not atm/z = 95. This requires further investigation.
We note that the weak ion m/z = 70 corresponds tothe (U-NCO) cation.
m/z = 29, 27, 26: Coupier et al. [91] assign them/z = 29 ion to HCO+. An alternative assignment couldbe to the NH2CH
+ ion. The m/z = 27 ion is assigned toHCN+ but it is too weak for measurement of its appear-ance energy in our PIMS study. An electron impactmeasurement gave AE = 14.77 ± 0.92 eV [90] for thision. We assign the m/z = 26 ion to C2H
þ2 , formed via
loss of 2 HNCO molecules directly from the parention by rupture of two bonds, C4–C5 and C6–N1. Ionyield measurement of this very weak ion at BESSY IIshowed that its AE is approximately 15 eV.
m/z = 18, 17 and 14: The peaks at m/z = 18, 17 and14 in our 20 eV photon impact mass spectrum are belowthe lower mass limit (m/z = 20) reported in many elec-tron impact studies [32,34,38–41]. However, these peakscan be seen in the NIST mass spectrum [65], in the pro-ton and electron impact mass spectra [91] spectra, and ina 120 eV electron impact mass spectrum [97]. We con-sider these peaks to correspond, respectively, to H2O
+,NHþ
3 and N+ ions. The ratio of intensities of peaksm/z = 18 and 17 is the same in our 20 eV photon impactmass spectrum and in the NIST electron impact massspectrum, whereas our m/z = 14 signal is relativelyabout twice as strong as that in the NIST spectrum.The existence of the m/z = 14 ion, assigned to N+, lendscredence to the assignment of m/z = 17 to NHþ
3 ratherthan to an OH+ ion, which could occur, with aboutthe same relative intensity to m/z = 18, from a waterimpurity [89].
4. Conclusion
In this photoionization mass spectrometry study ofadenine, thymine and uracil, we used synchrotron radi-ation in the 6–22 eV photon energy region to investigateVUV-induced degradation pathways of these three nu-cleic acid bases in the gas phase. Photon impact massspectra and photoion yields as a function of excitationenergy were measured, virtually for the first time forthese important biological molecules. The measurementsprovided more accurate values than previously reportedfor the adiabatic IEs of these nucleobases. These valuesare important for the interpretation of charge transferphenomena in DNA and RNA.
We compared our 20 eV photoion mass spectra with20 and 70 eV electron impact (and 200 eV electron and
high energy proton impact in uracil) mass spectra. Theexistence of many metastable dissociation reactions, asseen in the electron impact studies, makes the numberof m/z peaks and their relative intensities dependenton ion source residence time, field-free region character-istics and applied potentials in the ion optics. Particu-larly interesting is the comparison between 20 eVphoton impact and 20 eV electron impact mass spectrafor thymine and uracil, illustrating great differences inenergy deposition due, in part, to the non-validity ofthe first Born approximation for low energy electrons.
The assignment of the m/z peaks in our photon im-pact mass spectra and analyses of fragment ion forma-tion pathways have been considerably assisted by datapublished on the electron impact mass spectra of thesenucleobases. In our work, the photoion appearanceenergies are reported for the first time. AE values en-abled heats of formation of parent and some fragmentions to be revised or determined. Thermochemical data,coupled with the observed AEs, were also useful in clar-ifying dissociative ionization pathways many of whichwere first proposed by Rice and Dudek [32,33]. Ourstudy has enabled us to refine these pathways, evaluatethe relative importance of competitive processes in somecases and propose pathways that were not previouslysuggested.
For the purine, adenine, the ion fragmentation ismainly governed by successive loss of HCN units. Thetwo pyrimidines, thymine and uracil, have similar disso-ciation pathways, with main neutral loss pathwayswhich involve HNCO and CO and, in uracil, HCN.However, there are some significant differences due tohyperconjugation properties of the methyl group in thy-mine so that the relative importance of analogous reac-tions differs markedly, in some cases, between thymineand uracil. The astrophysically important fragment ionHCNH+ can be formed by several fragmentation path-ways in all three nucleobases. The relative importanceof competitive fragmentation processes was determinedin some cases.
Further concerning the astrophysical implications ofour study, we note that the three nucleobases wouldbe easily photodissociated in HI regions of the interstel-lar medium since they exhibit fragmentation appearanceenergies well below 13.6 eV. Thus their observation inthe interstellar medium calls for study of regions of radi-ation protection (dark clouds) or regions where nucleo-base production could successfully outweighdestruction. This is confirmed by the analogous case ofthe amino acid glycine which has very recently been re-ported to have been observed by radioastronomy in hotmolecular core regions, where the visual extinction isvery large, thus providing radiation protection [89,99].The existence of nucleobases in meteorites and microme-teorites also implies that their formation and survivaloccurs in conditions of efficient VUV radiation shielding

H.-W. Jochims et al. / Chemical Physics 314 (2005) 263–282 281
as also implied by hydrogen lamp irradiation of nucleo-bases in low temperature matrices [100].
Acknowledgments
We thank Jean-Louis Chotin for technical assistanceduring BESSY runs. Support from the CNRS Groupede Recherche ‘‘GDR Exobiologie’’ and from the CNESconvention with INSU is gratefully acknowledged. Wethank BESSY for use of its facilities in supporting theexperimental studies under EC contract I 3 RII 3-CT-2004-506008. H.B. thanks the ‘‘Fonds des ChemischenIndustrie’’ for financial support.
References
[1] A. Brack (Ed.), The Molecular Origins of Life, CambridgeUniversity Press, Cambridge, UK, 1998.
[2] P.G. Stocks, A.W. Schwartz, Nature 282 (1979) 709.[3] P.G. Stocks, A.W. Schwartz, Geochim. Cosmochim. Acta 45
(1981) 563.[4] L.-L. Hua, K. Kobayashi, E.-I. Ochiai, C.W. Gerke, K.O.
Gerhardt, C. Ponnamperuma, OLEB 16 (1986) 226.[5] A. Shimoyama, S. Hagishita, K. Harada, Geochem. J. 24 (1990)
343.[6] S. Chakrabati, S.K. Chakrabarti, Astron. Astrophys. 354 (2000)
L6.[7] I.W.M. Smith, D. Talbi, E. Herbst, Astron. Astrophys. 369
(2001) 611.[8] J. Kissel, F.R. Krueger, Nature 326 (1987) 755.[9] R.D. Brown, P.D. Godfrey, D. McNaughton, A.P. Pierlot,
Chem. Phys. Lett. 156 (1989) 61.[10] R.D. Brown, P.D. Godfrey, D. McNaughton, A.P. Pierlot, J.
Chem. Soc. Chem. Commun. (1989) 37.[11] R.D. Brown, P.D. Godfrey, D. McNaughton, A.P. Pierlot, J.
Am. Chem. Soc. 110 (1988) 2329.[12] P. Colarusso, K.-Q. Zhang, B. Guo, P.F. Bernath, Chem. Phys.
Lett. 269 (1997) 39.[13] M. Graindourze, J. Smets, T. Zeegers-Huyskens, G. Maes, J.
Mol. Struct. 222 (1990) 345.[14] A Yu Ivanov, A.M. Plokhotnichenko, E.D. Radchenko, G.G.
Sheina, Yu.P. Blagoi, J. Mol. Struct. 372 (1995) 91.[15] M.J. Nowak, J. Mol. Struct. 193 (1989) 35.[16] M.J. Nowak, L. Lapinski, J. Kwiatkowski, J. Leszcynski, J.
Phys. Chem. 100 (1996) 3527.[17] L.B. Clark, G.G. Peschel, I. Tinoco Jr., J. Phys. Chem. 69 (1965)
3615.[18] D.C. Luhrs, J. Viallon, I. Fischer, Phys. Chem. Chem. Phys. 3
(2001) 1827.[19] Chr. Plutzer, E. Nir, M.S. de Vries, K. Kleinermanns, Phys.
Chem. Chem. Phys. 3 (2001) 5466.[20] M. Fujii, T. Tamura, N. Mikami, M. Ito, Chem. Phys. Lett. 126
(1986) 583.[21] N.J. Kim, G. Jeong, Y.S. Kim, J. Sung, S.K. Kim, J. Chem.
Phys. 113 (2000) 10052.[22] K. Varmuza, W. Werther, F.R. Krueger, J. Kissel, E.R. Schmid,
Int. J. Mass Spectrom. 189 (1999) 79.[23] N.S. Hush, A.S. Cheung, Chem. Phys. Lett. 34 (1975) 11.[24] S. Urano, X. Yang, P.R. LeBreton, J. Mol. Struct. 214 (1989)
315.
[25] G. Lauer, W. Schafer, A. Schweig, Tetrahedron Lett. 45 (1975)3939.
[26] C. Yu, T.J. O�Donnell, P.R. LeBreton, J. Phys. Chem. 85 (1981)3851.
[27] M.H. Palmer, I. Simpson, R.J. Platenkamp, J. Mol. Struct. 66(1980) 243.
[28] D. Dougherty, K. Wittel, J. Meeks, S.P. McGlynn, J. Am.Chem. Soc. 98 (1976) 3817.
[29] M. Kubota, T. Kobayashi, J. Electr. Spectrosc. Rel. Phenom. 82(1996) 61.
[30] S. Peng, A. Padva, P.R. LeBreton, Proc. Natl. Acad. Sci. USA73 (1976) 2966.
[31] J. Lin, C. Yu, S. Peng, I. Akiyama, K. Li, Li. Kao Lee, P.R.LeBreton, J. Am. Chem. Soc. 102 (1980) 4627.
[32] J.M. Rice, G.O. Dudek, M. Barber, J. Am. Chem. Soc. 87 (1965)4569.
[33] J.M. Rice, G.O. Dudek, J. Am. Chem. Soc. 89 (1967) 2719.[34] J. Ulrich, R. Teoule, R. Massot, A. Cornu, Org. Mass Spectrom.
2 (1969) 1183.[35] J.L. Occolowitz, Chem. Commun. (1968) 1226.[36] M.G. Barrio, D.I.C. Scopes, J.B. Holtwick, N.J. Leonard, Proc.
Natl. Acad. Sci. USA 78 (1981) 3986.[37] S.K. Sethi, S.P. Gupta, E.E. Jenkins, C.W. Whitehead, L.B.
Townsend, J.A. McCloskey, J. Am. Chem. Soc. 104 (1982)3349.
[38] J.A. McCloskey, in: P.O.P. TS�O (Ed.), Basic Principles inNucleic Acid Chemistry, vol. I, Academic Press, New York,1974, p. 209.
[39] E.G. Brown, B.S. Mangat, Biochim. Biophys. Acta 177 (1969)427.
[40] K.C. Smith, R.T. Aplin, Biochemistry 5 (1966) 2125.[41] S.M. Hecht, A.S. Gupta, N.J. Leonard, Biochim. Biophys. Acta
182 (1969) 444.[42] S. Gohlke, E. Illenberger, Europhys. News 33 (2002) 207.[43] R. Abouaf, J. Pommier, H. Dunet, Int. J. Mass Spectrom. 226
(2003) 397.[44] J. deVries, R. Hoekstra, R. Morgenstern, T. Schlatholter, Phys.
Rev. Lett. 91 (2003) 053401.[45] L.P. Candeias, S. Steenken, J. Am. Chem. Soc. 114 (1992)
699.[46] L.H. Seah, L.A. Burgoyne, J. Photochem. Photobiol. B 61 (2001)
10.[47] E.M. Conwell, D.M. Basko, J. Am. Chem. Soc. 123 (2001)
11441.[48] A. Heller, Faraday Discuss 116 (2000) 1.[49] M. Bixon, J. Jortner, J. Am. Chem. Soc. 123 (2001) 12556.[50] F. Jolibois, J. Cadet, A. Grand, R. Subra, V. Barone, N. Rega,
J. Am. Chem. Soc. 120 (1998) 1864.[51] P.-W. Hou, R.P. Rampling, J. Appl. Phys. 47 (1976) 4572.[52] L.C. Emerson, M.W. Williams, I�lan. Tang, R.N. Hamm, E.T.
Arakawa, Radiat. Res. 63 (1975) 235.[53] I.P. Vinogradov, V.V. Zemskikh, N. Ya Daononova, Opt.
Spectrosc. 36 (1974) 344.[54] T. Yamada, H. Fukutome, Biopolymers 6 (1968) 43.[55] A. Pinchuk, J. Quant. Spectrosc. Radiat. Transfer 85 (2004)
211.[56] R. Abouaf, J. Pommier, H. Dunet, Chem. Phys. Lett. 381 (2003)
486.[57] M. Isaacson, J. Chem. Phys. 56 (1972) 1803.[58] E.T. Arakawa, L.C. Emerson, S.I. Juan, J.C. Ashley, M.W.
Williams, Photochem. Photobiol. 44 (1986) 349.[59] T. Inagaki, A. Ito, K. Hieda, T. Ito, Photochem. Photobiol. 44
(1986) 303.[60] H.W. Jochims, E. Ruhl, H. Baumgartel, S. Tobita, S. Leach,
Int. J. Mass Spectrom. Ion Processes 167/168 (1997)35.
[61] C. Chyba, C. Sagan, Nature 355 (1992) 125.

282 H.-W. Jochims et al. / Chemical Physics 314 (2005) 263–282
[62] M. Schwell, F. Dulieu, S. Leach, in: Proceedings of the FirstEuropean Workshop on Exo-/Astro-Biology ESA 29-496, 2001,p. 133.
[63] M. Schwell, F. Dulieu, S. Leach, Astrobiology 1 (2001) 210.[64] M. Schwell, F. Dulieu, C. Gee, H.-W. Jochims, J.-L. Chotin, H.
Baumgartel, S. Leach, Chem. Phys. 260 (2000) 261.[65] NIST Chemistry WebBook. Available from: <http://
webbook.nist.gov>.[66] S. Leach, Z. Phys. Chem. 195 (1996) 15.[67] V.M. Orlov, A.N. Smirnov, Ya.M. Varshavsky, Tetrahedron
Lett. 48 (1976) 4377.[68] C. Lifschitz, E.D. Bergmann, B. Pullman, Tetrahedron Lett. 46
(1967) 4583.[69] B.I. Verkin, L.F. Sukodub, I.K. Yanson, Dokl. Akad. Nauk
SSSR 228 (1976) 1452.[70] S.K. Kim, W. Lee, D.R. Herschbach, J. Phys. Chem. 100 (1996)
7933.[71] Chr. Plutzer, K. Kleinermanns, Phys. Chem. Chem. Phys. 4
(2002) 4877.[72] C.T. Hwang, C.L. Stumpf, Y.-Q. Yu, H.I. Kenttamaa, Int. J.
Mass Spectrom. 182/183 (1999) 253.[73] A.-O. Colson, B. Besler, D.M. Close, M.D. Sevilla, J. Phys.
Chem. 96 (1992) 661.[74] S.D. Wetmore, R.J. Boyd, L.A. Eriksson, J. Phys. Chem. B 102
(1998) 10602.[75] R. Improta, G. Scalmani, V. Barone, Int. J. Mass Spectrom. 201
(2000) 321.[76] J. Reynisson, S. Steenken, PCCP 4 (2002) 527.[77] D.L. Hildebrand, Int. J. Mass Spectrom. 197 (2000) 237.[78] S.G. Lias, J.E. Bartmess, J.F. Libman, J.L. Holmes, R.D. Levin,
W.G. Mallard, J. Phys. Chem. Ref. Data 17 (Suppl. 1) (1988).[79] A.W. Potts, D.M.P. Holland, A.B. Trofimov, J. Schirmer, L.
Karlsson, K. Siegbahn, J. Phys. B 36 (2003) 3129.[80] H.W. Jochims, H. Baumgartel, S. Leach, Astron. Astrophys. 314
(1996) 1003.[81] E. Subertova, J. Bok, P. Rihak, V. Prosser, E. Silinsh, Phys.
Stat. Sol. (a) 18 (1973) 741.[82] P.C. Burgers, J.L. Holmes, J.K. Terlouw, J. Am. Chem. Soc. 106
(1984) 2762.
[83] E. Uggerud, H. Schwarz, J. Am. Chem. Soc. 107 (1985) 5046.[84] M. Inokuti, Rev. Mod. Phys. 43 (1971) 297.[85] C. Adamo, V. Barone, Chem. Phys. Lett. 274 (1997) 242.[86] M. Vega-Arroyo, P.R. LeBreton, T. Rajh, P. Zapol, L.A.
Curtiss, Chem. Phys. Lett. 380 (2003) 54.[87] G. Dujardin, S. Leach, O. Dutuit, T. Govers, P.M. Guyon, J.
Chem. Phys. 79 (1983) 644.[88] T. Kobayashi, T. Kubota, K. Ezumi, C. Utsunomiya, Bull.
Chem. Soc. Jpn. 55 (1982) 3915.[89] H.W. Jochims, M. Schwell, J.-L. Chotin, M. Clemino, F.
Dulieu, H. Baumgartel, S. Leach, Chem. Phys. 298 (2004)279.
[90] S. Denifl, B. Sonnweber, G. Hanel, P. Scheier, T.D. Mark, Int.J. Mass Spectrom. 238 (2004) 47.
[91] B. Coupier, B. Farizon, M. Farizon, M.J. Gaillard, F. Gobert,N.V. de Castro Faria, G. Jalbert, S. Ouaskit, M. Carre, B.Gstir, G. Hanel, S. Denifl, L. Feketeova, P. Scheier, T.D. Mark,Eur. Phys. J. D 20 (2002) 459.
[92] V.I. Zaretskii, V.I. Sadovskaya, N.S. Wulfson, V.F. Sizoy, V.G.Merimson, Org. Mass Spectrom. 5 (1971) 1179.
[93] A. Padva, P.R. LeBreton, R.J. Dinerstein, J.N.A. Ridyard,Biochem. Biophys. Res. Commun. 60 (1974) 1262.
[94] S.D. Wetmore, R.J. Boyd, L.A. Eriksson, Chem. Phys. Lett. 322(2000) 129.
[95] I.C. Walker, M.H. Palmer, J. Delwiche, S.V. Hoffmann, P.Limao Vieora, N.J. Mason, M.F. Guest, M.-J. Hubin-Franskin, J. Heinesch, A. Giuliani, Chem. Phys. 297 (2004)289.
[96] H.-E. Audier, M. Fetizon, Y. Henry, T. Prange, Org. MassSpectrom. 11 (1976) 1047.
[97] S. Feil, K. Gluch, S. Matt-Leubner, P. Scheier, J. Limtrakul, M.Probst, H. Deutsch, K. Becker, A. Stamatovic, T.D. Mark, J.Phys. B 37 (2004) 3013.
[98] G. Hanel, B. Gstir, S. Denifl, P. Scheier, M. Probst, B. Farizon,E. Illenberger, T.D. Mark, Phys. Rev. Lett. 90 (2003) 188104-1.
[99] Y.-J. Kuan, S.B. Charnley, H.-C. Huang, W.-L. Tseng, Z.Kisiel, Astrophys. J. 593 (2003) 848.
[100] Z. Peeters, O. Botta, S.B. Charnley, R. Ruitenkamp, P. Ehren-freund, Astrophys. J. Lett. 593 (2003) L129.