physical activity pattern and pedometer counts of adults from … · physical activity pattern and...
TRANSCRIPT
Physical Activity Pattern and Pedometer Counts of Adults from Niterói, Rio de Janeiro, Brazil: The Nutrition Physical Activity and Health Survey (PNAFS)
Luiz A AnjosThomaz BC Barbosa
Mauricio TL Vasconcellos

Energy expenditure is essential for the establishment of energy
requirements (ER) and physical activity recommendations for
populations

ER = EE = BMR x PAL
2004

Dietary Reference Intake (DRI) for Energy…
RESEARCH RECOMMENDATIONS (IOM, 2002)(Chapter 5, page 225)
Methods suitable for free-living population-based studies or applications should be
developed to measure physical activity levels in order to classify children and adults into
sedentary, low active, active, and very active levels of physical activity.

To promote and maintain health, all healthy adults aged 18 to 65 yr need moderate-intensity (3-6 METs) aerobic (endurance) physical activity for a minimum of 30 min
on five days each week MSSE 2007; 39(8):1423

Purpose:
Assess the nutritional status, energy expenditure and physical activity
patterns of the population of Niterói, state of Rio de Janeiro, Brazil
The Nutrition Physical Activity and Health Survey2003
PNAFS

Niterói, Rio de Janeiro2253’S; 4306”W
Total area of 131 km2
458,274 Peoplein 2000Urban

Methods to measure EE/PA at PNAFS
1) MONICA Optional study of Physical Activity (MOSPA) questionnaire
2) 24h HR monitoring – Flex-HR
3) 24h Activity recall synchronized with the 24h HR monitoring
4) 24h Pedometer synchronized with the 24h HR monitoring

Results of PNAFS
1) MOSPA questionnaire vs 24h Activity recall - # 283
2) Energy balance (EE estimated by the Flex-HR) - # 97
The present paper presents:
3) Physical activity pattern by 24h Activity recall and 24h Pedometer monitoring

PNAFS110 Census enumeration areas (CEA)
16 Households per CEA (Total of 1760)
1 randonly selected adult in each Household
3-level sampling
24h HR of the 1760 adults,24h Pedometer in 689 subjects (56% Women),529 BMR (MOSPA), 204 callibration curve (Flex-HR)
Sample weights calibrated to represent theadult population of Niterói for each subsample
PNAFS Pedometer and 24h HR Monitoring
The subject wore a Digi-walker
SW-701 pedometer and a HR
monitor for 24 h after which a 24h
activity recall was performed


Physical pattern (24h recall):The reported activities were coded as MET levels using the Compendium of Physical Activities. Total daily activities were compiled, classified as low (< 3 METs), moderate (3-6 METs) or vigorous (≥ 6 METs) and grouped in occupational, leisure-time, transportation and domestic chores.
Active when at least 30’ of moderate or vigorous activity (≥ 3 METs).
Pedometer:Grouped as < 10000 and ≥ 10000 steps/day.

Results

2,5
35,3
11
3,5
30,8
12
0
10
20
30
40
50
60
< 18.5 18.5 -- 25 25 -- 30 ≥ 30BMI (kg/m2)
%
MenWomen
BMI distribution
0102030405060708090
100110120130140150
20-30 30-40 40-50 50-60 ≥ 60Age (years)
Tim
e at
≥ 3
MET
s (m
in)
MenWomen
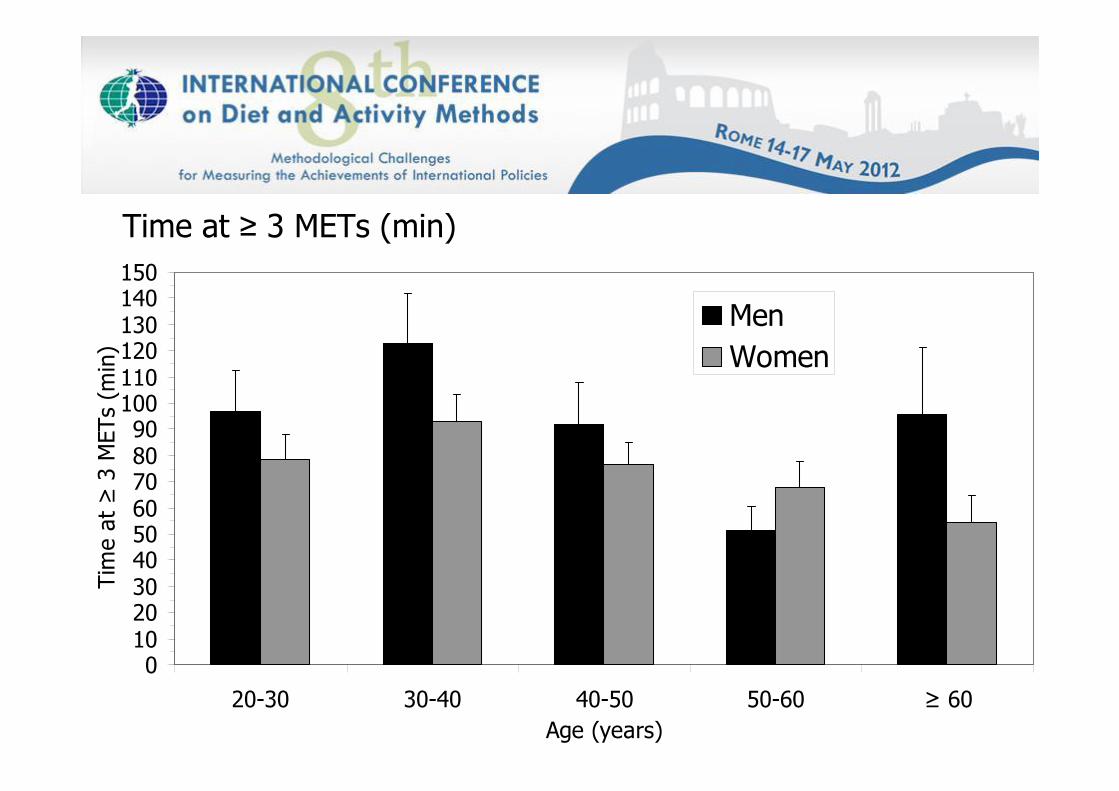
Time at ≥ 3 METs (min)

0102030405060708090
100110120130140150
< 18.5 18.5 -- 25 25 -- 30 ≥ 30BMI (kg/m2)
Tim
e at
≥ 3
MET
s (m
in)
MenWomen
Time at ≥ 3 METs (min)

44
53
44
42
66
50
22
15
36
25
35
25
10
14
15
13
2
11
10
29
20
17
7
18
30
22
28
31
29
27
44
37
28
34
44
37
16
11
13
14
3
12
24
19
16
24
14
20
0 10 20 30 40 50 60 70 80 90 100
20-30
30-40
40-50
50-60
≥ 60
Todos
20-30
30-40
40-50
50-60
≥ 60
Todos
Faix
a E
tária
(ano
s)
%
Atividades Domésticas Atividades Ocupacionais Lazer Ativo + Exercício Físico Deslocamentos
Mul
here
sH
omen
s
Domestic chores
Age
grou
ps (
year
s)
Occupational ActOccupational Act Leisure-time & exercise Transportation
All
All
Wom
enM
en

Median steps per day
7000
7500
8000
8500
9000
9500
10000
10500
11000
11500
20-30 30-40 40-50 50-60 ≥ 60Age (years)
Med
ian
step
s pe
r da
y
MenWomen

Median steps per day
5000550060006500700075008000850090009500
1000010500110001150012000
< 18.5 18.5 -- 25 25 -- 30 ≥ 30BMI (kg/m2)
Med
ian
step
s pe
r da
y
MenWomen

53,966,4
53,239,5
0%
10%
20%
30%
40%
50%
60%
70%
80%
90%
100%
24h Pedometer 24h Pedometer
< 30' < 30'
< 1
0000
< 1
0000
Men Women
Results

Conclusions:
Men are more active then women (20’ more in moderate/vigorous activities and greater number of steps).
Activity at moderate/vigorous intensities decreases after 40 years of age but increases again in men only after 60 years of age.

Conclusions:
Domestic chores in women and LTPA+transportation in men contribute approximately 50% to the 30 minutes of moderate/vigorous activities.
Aproximately 66% of men and 53% of women met the 30’ recommendation but these values were aproximately 13% lower if the step count of 10000 criterion is applied.

Thank [email protected]