physician step prescription and monitoring to improve
TRANSCRIPT

OR I G I N A L A R T I C L E
Physician step prescription and monitoring to improveARTERial health (SMARTER): A randomized controlled trialin patients with type 2 diabetes and hypertension
Kaberi Dasgupta MD, MSc1,6,8 | Ellen Rosenberg MD2 | Lawrence Joseph PhD1 |
Alexandra B. Cooke MSc3 | Luc Trudeau MD4 | Simon L. Bacon PhD5 | Deborah Chan BSc1 |
Mark Sherman MD6 | Rémi Rabasa-Lhoret MD, PhD7 | Stella S. Daskalopoulou MD, PhD8
| SMARTER Trial Group
1Division of Clinical Epidemiology,
Department of Medicine, McGill University
Health Centre, Montréal, Québec, Canada
2Department of Family Medicine, St. Mary's
Hospital, McGill University, Montreal, Québec,
Canada
3Divisions of Experimental Medicine and
Clinical Epidemiology, Department of
Medicine, McGill University Health Centre,
Montréal, Québec, Canada
4Cardiovascular Prevention Centre, Jewish
General Hospital, McGill University, Montreal,
Québec, Canada
5Division of Exercise Science, Concordia
University, Montreal, Québec, Canada
6Division of Endocrinology, McGill University,
Montreal, Québec, Canada
7Institut de Recherches Cliniques de Montréal,
Université de Montréal, Montreal, Québec,
Canada
8Division of Internal Medicine, Department of
Medicine, McGill University, Montreal,
Québec, Canada
Correspondence
Associate Professor Kaberi Dasgupta, Division
of Clinical Epidemiology, Department of
Medicine, McGill University Health Centre,
687 Pine Avenue West, V1.08, Montréal, QC,
H3W 2P5, Canada.
Email: [email protected]
Funding information
Funding for this trial is from the Canadian
Institutes of Health Research (MOPP 114996;
Nominated Principal Investigator, K. D.; Co-
Principal Investigators, S. S. D. and E. R.) and a
grant from the Heart and Stroke Foundation
(HSF G-12-000251; Principal Investigator,
K. D.). K. D. and S. S. D. both hold clinical
Aims: There are few proven strategies to enhance physical activity and cardiometabolic profiles
in patients with type 2 diabetes and hypertension. We examined the effects of physician-
delivered step count prescriptions and monitoring.
Methods: Participants randomized to the active arm were provided with pedometers and they
recorded step counts. Over a 1-year period, their physicians reviewed their records and pro-
vided a written step count prescription at each clinic visit. The overall goal was a 3000 steps/
day increase over 1 year (individualized rate of increase). Control arm participants were advised
to engage in physical activity 30 to 60 min/day. We evaluated effects on step counts, carotid
femoral pulse wave velocity (cfPWV, primary) and other cardiometabolic indicators including
haemoglobin A1c in diabetes (henceforth abbreviated as A1c) and Homeostasis Model Assess-
ment-Insulin Resistance (HOMA-IR) in participants not receiving insulin therapy.
Results: A total of 79% completed final evaluations (275/347; mean age, 60 years; SD, 11).
Over 66% of participants had type 2 diabetes and over 90% had hypertension. There was a net
20% increase in steps/day in active vs control arm participants (1190; 95% CI, 550-1840).
Changes in cfPWV were inconclusive; active vs control arm participants with type 2 diabetes
experienced a decrease in A1c (−0.38%; 95% CI, −0.69 to −0.06). HOMA-IR also declined in
the active arm vs the control arm (ie, assessed in all participants not treated with insulin; −0.96;
95% CI, −1.72 to −0.21).
Conclusions: A simple physician-delivered step count prescription strategy incorporated into
routine clinical practice led to a net 20% increase in step counts; however, this was below the
3000 steps/day targeted increment. While conclusive effects on cfPWV were not observed,
there were improvements in both A1c and insulin sensitivity. Future studies will evaluate an
amplified intervention to increase impact.
KEYWORDS
arterial stiffness, carotid femoral pulse wave velocity, diabetes, hypertension, pedometer,
physical activity, step counter
Trial registration: Clinicaltrials.gov NCT01475201; registered November
16, 2011.
Received: 7 November 2016 Revised: 4 January 2017 Accepted: 6 January 2017
DOI 10.1111/dom.12874
Diabetes Obes Metab. 2017;19:695–704. wileyonlinelibrary.com/journal/dom © 2017 The Authors. Diabetes, Obesity and Metabolismpublished by John Wiley & Sons Ltd.
This is an open access article under the terms of the Creative Commons Attribution‐NonCommercial‐NoDerivs License, which permits use and distribution in any medium, providedthe original work is properly cited, the use is non‐commercial and no modifications or adaptations are made.
695

investigator salary awards from the Fonds de
recherche du Québec-Santé. A. C. holds a
doctoral award from the Canadian Institutes of
Health Research. The study funders had no
role in collection, analysis, interpretation of
data, writing of the report or decision to submit
the article for publication.
1 | INTRODUCTION
In adults with type 2 diabetes, self-reported regular walks lead to a
greater-than-40% reduction in both mortality and vascular event rates
over the decade that follows the walking assessment.1–3 Pedometers
and accelerometers capture “steps” in real time; in recent years, there
has been a surge of popular interest in these devices as a means of
tracking physical activity, setting targets and, thereby, improving health.
In a longitudinal evaluation among adults with prediabetes, a
2000 steps/day increase over 1 year was associated with an 8% reduc-
tion in vascular complications over an average of 6 years.4 These find-
ings support the case for integrating step count monitoring into the
clinical management of individuals at high cardiometabolic risk.
Pedometer-based intervention trials have generally focused on
group-based sessions led by a facilitator who works with group members
to set goals and develop action plans. Such trials demonstrate an increase
of roughly 2000 steps/day over a 3 to 6-month intervention period.5,6
Unfortunately, many pedometer-based interventions are time-limited,
and there is evidence that step counts decline over time once the inter-
vention ends.7 In contrast, patients have long-term relationships with
their treating physicians and there are no direct costs to patients associ-
ated with clinical follow-up in a publicly-funded health care system. Thus,
physician-delivered interventions are potentially sustainable. However,
physicians cite many barriers to providing counseling concerning physical
activity, including lack of resources, effective tools, time and training.8–10
With an eye to sustainability and feasibility, we developed a
pedometer-based intervention that was designed to be easily integrated
into clinic visits for patients with type 2 diabetes and/or hypertension.
The SMARTER trial (Step Monitoring to improve ARTERial health; Clini-
cal Trials.gov NCT0147520) evaluated a pedometer-based intervention
that was integrated into real-world clinical practice settings where adults
with type 2 diabetes and/or hypertension are followed. The interven-
tion, delivered by the patient’s own physician, was designed to be short,
simple and easily integrated into clinic visits, to allow for sustainability. It
involved goal-setting, summarized in a “step count prescription.” “Steps”
may be easier for physicians to prescribe than more complex forms of
exercise. The change in step counts over the 1-year intervention was
compared between active and control arms.
Our aim was not only to capture an impact of the intervention on
physical activity, but also to gauge its biological effects. Thus, we evaluated
changes in several cardiometabolic measures. Primary outcome was change
in carotid femoral pulse wave velocity (cfPWV). This is a non-invasive
measure that reflects the composite effects of all vascular risk factors on
arterial health, and is considered to be a summative indicator of arterial
health. It is an independent predictor of cardiovascular events.11–13
2 | MATERIALS AND METHODS
The study design and methods have been described previously
(SMARTER; Step Monitoring to improve ARTERial health; Clinical-
trials.gov NCT01475201; registered November 16, 2011; first patient
recruited February 14, 2012).14 Briefly, SMARTER was a prospective,
randomized, open-label, blinded-endpoint (PROBE) trial. Written
informed consent was obtained and trial procedures were approved
by McGill University’s Faculty of Medicine Institutional Review Board
(A08-M76-11B) and participating institutions (McGill University
Health Centre, St. Mary’s Hospital, Jewish General Hospital, Institut
de Recherches Cliniques de Montréal).
A total of 74 physicians identified potentially eligible participants
during routine clinic visits (2012-2015). Eligibility criteria included a
diagnosis of type 2 diabetes, hypertension, or both; age of ≥18 years;
body mass index (BMI) of 25 to 40 kg/m2; and absence of gait
impairment. Individuals with co-morbid conditions with potential to
impact procedures/outcomes (eg, active malignancy, pregnancy) were
not enrolled, and those who reported 150 minutes or more of
leisure-time physical activity/week were also excluded. If cfPWV
could not be assessed at the baseline evaluation (eg, because of atrial
fibrillation or other arrhythmias), candidates were not randomized.
Similarly, candidates were excluded if pedometer-recorded step
counts were 10 000/day or more during the 1-week evaluation
phase that was a component of the baseline assessment. Although
increases in physical activity are arguably beneficial, irrespective of
baseline activity levels, the greatest benefits are likely to be realized
by the least fit and least active.15,16
2.1 | Ethics approval and consent to participate
Written informed consent was obtained and trial procedures were
approved by McGill University’s Faculty of Medicine Institutional
Review Board (A08-M76-11B) and participating institutions (McGill
University Health Centre, St. Mary’s Hospital, Jewish General Hospi-
tal, Institut de Recherches Cliniques de Montréal).
2.2 | Measurements
Participants completed questionnaires addressing demographic fac-
tors and medical history. Health behaviours and medications were
queried and measurements were completed at both baseline and final
assessments. Type 2 diabetes, hypertension and dyslipidemia diag-
noses were based on physician-reported diagnosis, use of corre-
sponding medications and/or participant-reported diagnosis. Duration
of disease was acquired by participant report. Participants wore a
696 DASGUPTA ET AL.

Yamax SW-701 pedometer at the waist for one week. The viewing
window was concealed with a snap-on cover and tamper-proof seal.14
The pedometer was sent to the study centre with an unused pedome-
ter (pre-stamped envelope) that captured the “extra” step counts regis-
tered during mailing. These extra steps were subtracted from the value
on the pedometer that was worn and steps/day were computed.
All measurements were performed in the morning under standar-
dized conditions at the Vascular Health Unit, Montreal General Hospital,
Montreal (Director, S.S. Daskalopoulou). Participants were fasting and
were specifically instructed to abstain from caffeinated beverages, etha-
nol intake and smoking for at least 12 hours prior to assessment. All
usual medications, other than antihyperglycaemic agents, were taken
the morning of assessment. cfPWV was assessed in duplicate in a
supine position after a 10-minute rest using applanation tonometry
(SphygmoCor system, AtCor Medical, Sydney, Australia) and values were
averaged.17–19 Specifically, a micromanometer-tipped tonometer (SPC-
301; Millar Instruments, Houston, Texas) was placed on the skin over-
laying the carotid artery and the femoral artery. With this instrument
and a 3-lead electrocardiogram (ECG), the PWV was automatically calcu-
lated from measurements of the pulse transit time and the distance
between the 2 recording sites [PWV = distance (m)/transit time
(s)].17–19 Transit time was measured from the foot of the carotid wave-
form to that of the femoral waveform (foot-to-foot method) using
sequential recordings referenced to the ECG. The distance was defined
as (distance from the suprasternal notch to femoral artery) – (distance
from carotid artery to the suprasternal notch), and was measured
directly with a measuring tape.17–19 cfPWV was selected as the primary
outcome because it is a composite indicator of arterial health and has
the potential to capture the effects of physical activity on arterial health,
including both those mediated by traditional cardiometabolic risk factors
and those operating through other pathways.20,21 Height, weight and
waist and hip circumference were measured using standard procedures.
BMI and waist-to-hip ratio were calculated. Peripheral blood pressure
and heart rate were assessed with an automated oscillometric BpTRU
Blood Pressure Monitor (BpTRU Medical Devices Ltd, BC, Canada;
6 automated measures, the first discarded and the average of the final
5 measures separately generated for systolic and diastolic blood pres-
sure values).22 Fasting venous blood samples were drawn in the morning
to measure total cholesterol, high density lipoprotein cholesterol (HDL)
and triglycerides using spectrophotometry. Haemoglobin A1c (in diabetes
patients; henceforth abbreviated as A1c) was measured with a high-
performance liquid chromatography analyser. In participants with type
2 diabetes who were not undergoing insulin therapy, and in all participants
without type 2 diabetes, fasting glucose and insulin values were also
assessed and were used to compute the Homeostatic Model Assessment-
Insulin Resistance value (HOMA-IR).23 Low-density lipoprotein cholesterol
levels (LDL) were calculated using the Friedewald equation.
2.3 | Randomization
Eligible individuals were randomized to either the control arm or the
active trial arm using Dacima Clinical software (ie, individual-level ran-
domization with no stratification; random permuted blocks with
randomly-varied block sizes of 2, 4 and 6).
2.4 | Interventions
Participants were typically seen by their physician in a clinical setting
3 to 4 times over a 12 to 15-month period. The control arm received
advice to engage in 30 to 60 minutes of activity daily, consistent with
usual care. In the active arm, the physician wrote a step count pre-
scription at each visit, as previously described in our protocol.14 At
the first visit, the physician received a package with a pedometer and
step count log for the participant, a package of “step count prescrip-
tion” scripts and the baseline steps/day as assessed during baseline
evaluation. The aim was to achieve a net increase over baseline of
3000 steps/day over 1 year. A step count increment of 2500 to
3000 steps is roughly equivalent to 30 minutes of walking at a mod-
erate pace, as established through direct counts of individuals walking
on a treadmill at a workload of 3 metabolic equivalents (METS)/
minute.24
The speed at which the overall step target was achieved was
determined during discussions between the patient and physician at
the initial and follow-up clinic visits, with some general guidelines
provided. We recommended a slower rate of increase for those with
lower step counts.14 Specifically, the time-frame for an increase of
3000 steps/day was recommended for 10 months for sedentary par-
ticipants (<5000 steps/day), for 7 months for low-active participants
(5000-7499 steps/day) and for 5 months for somewhat active parti-
cipants (7500-9999 steps/day). A SMARTER trial research assistant
reminded physicians when an active trial participant should be seen,
either personally or by telephone or email. The SMARTER interven-
tion did not include specific counseling related to dietary intake and
eating behaviour. However, the treating physician could provide die-
tary counselling similarly in both trial arms according to usual care
practice.
2.5 | Statistical analysis
Means, SD, number and proportions were calculated, as appropriate,
for all variables measured, separately for those in the active and con-
trol arms. We calculated average between-arm differences in “after
minus before values,” with 95% CIs for cfPWV, steps/day, other car-
diometabolic risk factors (systolic and diastolic blood pressure, A1c,
LDL, HDL, total cholesterol, triglycerides, HOMA-IR, BMI, waist cir-
cumference, waist-to-hip ratio) and changes in numbers of antihyper-
tensive, antihyperglycemic and lipid lowering medications.
Differences in mean changes between the active and control arms
were not adjusted; the mean changes for each trial arm were mean
within-individual changes and both arms were similar in terms of
baseline cfPWV, step counts and other cardiometabolic risk factors.
Intent-to-treat analyses with complete cases (ie, outcome assess-
ment) were conducted for all endpoints. Additionally, for changes in
cfPWV and pedometer-assessed step counts, we used multiple impu-
tations with ignorable and non-ignorable mechanisms. We compared
point estimates across these models (intent-to-treat analyses). Impu-
tations were performed using WinBUGS version 1.4.3 and other ana-
lyses were conducted with SAS software (Version 9.3).
In terms of process evaluation and fidelity to trial intervention
strategies, we examined the time interval between baseline and final
DASGUPTA ET AL. 697

assessments, and the number of clinical visits during the intervention
period. For participants from whom we were able to obtain the final
written prescription and who completed the final evaluation, we cal-
culated the difference between the final step count prescription and
target step counts (ie, baseline steps + 3000 steps/day) and the dif-
ference between the final evaluation of steps/day and the final pre-
scription (mean and SD).
3 | RESULTS
Among the 692 individuals who underwent preliminary assessment
of eligibility by telephone or in clinical waiting areas, 392 were invited
for a baseline assessment and 369 completed this evaluation
(Figure 1). Our original recruitment target was 364 individuals.14
Among those who completed the baseline evaluation, 22 were deter-
mined to have an average step count that was ≥10 000 steps/day
and were excluded. The remaining 347 were randomized. Final
assessments were completed by 275 participants (79%).
Participants averaged 60 years of age (SD 11) and over half were
women (Table 1). Based on physician-reported diagnosis, use of relevant
medications and/or self-report, more than 65% of participants had type
2 diabetes; a similar proportion had dyslipidaemia and close to 90% had
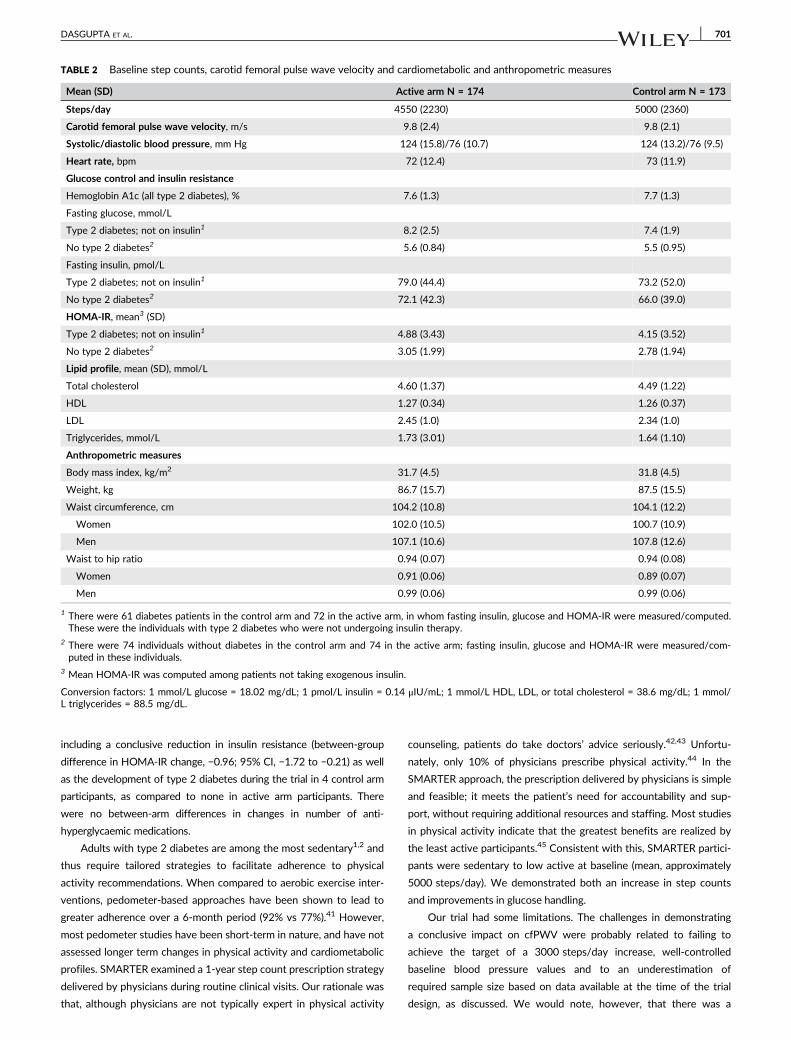
hypertension. Step counts, cfPWV and cardiometabolic risk factors were
very similar between the 2 trial arms (Table 2). Steps/day were in the
sedentary to low range, at under 5000 steps/day, and cfPWV was
high, at close to 10 m/s. BMI averaged in the stage 1 obesity
range. Systolic blood pressure was well-controlled at a mean value
of under 130 mm Hg; LDL-C was below 2.5 mmol/L and A1c was
under 8% in participants with diabetes. HOMA-IR was elevated in
those with type 2 diabetes who were not undergoing insulin ther-
apy at above 4, and in those without type 2 diabetes at roughly 3.
Medication profiles were similar between trial arms (Table S1).
Among the 74 physicians involved in the SMARTER trial,
32 (43%) followed at least 4 participants and 9 physicians (12%) fol-
lowed 9 or more participants. The average time interval (SD) between
baseline and final assessment was 1 year and 2 months for both trial
arms (423 [59] days in the active arm; 426 [70] days in the control
arm). During the trial intervention period, the average number of clin-
ical visits (SD) was 3.5 (0.7) in the active arm and 3.1 (1.0) in the con-
trol arm. Among the 134 active arm participants from whom the final
step count prescription was retrieved and who completed the final
assessment, prescribed step counts at the final clinical visit were
71 steps/day lower (SD 1963) than the 1-year target of baseline
steps/day + 3000 steps/day. The steps/day achieved as per final
assessment was 1712 (SD 2971) lower than prescribed. Among these
participants, 43% had a final prescription that was at or above target
and 26% had a final step count value that was at or above the value
prescribed at the final clinical visit. In complete case analysis, point
estimates suggested a net reduction in cfPWV in the active arm vs
control arm participants (−0.28 m/s; 95% CI, −0.68 to 0.13; Table 3);
this was not conclusive and CIs were wider with imputation
(−0.03 m/s; 95% CI, −0.22 to 0.17 with ignorable mechanisms; −0.01;
95% CI, −0.18 to 0.16 with non-ignorable mechanisms).
In complete case analysis, the difference in changes in step
counts between active and control arm participants was 1190 steps/
day (95% CI, 550-1840; Table 3). This represented a 20% increase in
step counts over baseline values. A net increase was confirmed using
imputation with ignorable mechanisms (619; 95% CrI, 327-911) and
non-ignorable mechanisms (443; 95% CrI, 181-706).
In an analysis evaluating the overall relationship between
changes in step counts and changes in cfPWV for all complete cases,
a 1000 steps/day increase was associated with a −0.068 m/s change
in cfPWV (95% CI, −0.15 to 0.01) in an age- and sex-adjusted model.
Complete case analyses were used for the remaining second-
ary outcomes (Table 3). There were net reductions in both systolic
and diastolic blood pressure in active vs control arms but these
differences were not conclusive (systolic, −2.59 mm Hg; 95% CI,
−5.66 to 0.47; diastolic, −1.21 mm Hg; 95% CI, −3.04 to 0.62).
There were no differences between active and control arms in
terms of change in number of antihypertensive agents (−0.08
agents; 95% CI, −0.31 to 0.15; Table S2). There was no important
difference in BMI change between active and control arms
(−0.15 kg/m2; 95% CI, −0.43 to 0.15) and, similarly, there were no
important between-arm differences in terms of changes in waist
circumference and waist-to-hip ratio. Lipid profiles changes did not
differ between the active and control arms among those who com-
pleted trial procedures (eg, HDL, 0.01; 95% CI, −0.03 to 0.05;
LDL, −0.02; −0.19, 0.15). There were no differences in change in
number of lipid-lowering medications in the active and control
arms (−0.06; 95% CI, −0.22 to 0.09).
There was evidence of an impact on glucose handling. Among
those with type 2 diabetes, there was a reduction in A1c among
those in the active arm compared to the control arm (−0.38%; 95%
CI, −0.69 to −0.06). There were no differences between the active
and control arms in terms of change in number of glucose-lowering
agents (0.15 agents; 95% CI, −0.15 to 0.44; Table S2). Among active
arm participants, none developed new type 2 diabetes and 4 devel-
oped impaired fasting glucose (6.1-6.9 mmol/L). Among control arm
participants, 4 developed type 2 diabetes and 3 developed impaired
fasting glucose. Among those in whom insulin resistance was
assessed (ie, patients with no diabetes or with diabetes but not
undergoing insulin therapy), there was a reduction in insulin resist-
ance in the active arm compared to the control arm (HOMA-IR,
−0.96; 95% CI, −1.72 to −0.21). A1c25 and HOMA-IR26 are independ-
ent predictors of cardiovascular disease.
4 | DISCUSSION
Our physician-delivered step count prescription and monitoring strat-
egy increased daily step counts by approximately 1200 over 1 year.
This represents a 20% increase from the baseline 5000 steps/day.
Physicians prescribed steps slightly below the 1-year target of
3000 steps/day above baseline values. The net change in steps/day
was below the number of steps prescribed, but a net increase was
observed. In terms of biological effects, cfPWV was lowered but this
was not conclusive. There were, however, improvements in both hae-
moglobin A1c (0.38% reduction) and insulin resistance (0.96
698 DASGUPTA ET AL.

reduction in HOMA-IR). Thus, a simple physician-delivered step count
prescription strategy incorporated into routine clinical practice can
augment physical activity and confer some favourable cardiometa-
bolic changes in sedentary overweight adults with type 2 diabetes
and/or hypertension.
Step count monitoring offers a concrete and measurable metric
to facilitate goal-setting for physical activity. Previous
pedometer-based interventions that were evaluated in patients with
type 2 diabetes have been more complex than the SMARTER inter-
vention, involving a facilitator and, frequently, group sessions. Two
FIGURE 1 Participant flow. * angina (1), chronic
obstructive pulmonary disease (6), inflammatoryarthritis (2), cancer (4), renal disease (1), liver disease(1), depression (1), urinary impairment (2). † PVCs,irregular sinus rhythm.
DASGUPTA ET AL. 699

meta-analyses6,27 indicate that such interventions achieve approxi-
mately 2000 steps/day more than the control arms over a 3 to 6-
month period, but there are declines in effect thereafter.7 In a single
study that compared group-based vs physician-delivered pedometer-
based counseling (no written prescription) over 3 months, the group-
based strategy had greater impact.28 The effects of such short-term
interventions, however, are not sustained over time. In contrast, our
intervention, being integrated into clinical practice, can be sustained
beyond a few months and, in fact, led to a between-arm difference at
1 year. Thus, there may be a trade-off between a short, more power-
ful intervention that cannot be continued over time compared to a
strategy with more modest effects but adapted to current models of
care. Highlighting the potential impact of smaller activity increments,
in a large observational cohort study conducted in Taiwan, a 15-
minute increment in physical activity was associated with long-term
reductions in mortality.29
The SMARTER intervention achieved a step count increase but
this was less than the target of 3000 steps/day. The steps prescribed
were close to this target but there remained an important gap
between steps prescribed and steps achieved. To close the gap, there
may be a need for more motivational support, a key need voiced by
patients.30 In future studies, we aim to enhance our intervention by
combining it with such components as telephone-based support from
other health professionals,31 peer support32 and automated messag-
ing.33 Interventions using such strategies have demonstrated promise
in prior studies but have not been combined with a physician-
delivered step-count prescription.
Although our results suggested a reduction in cfPWV, we were
underpowered to discern a conclusive impact. When designing SMAR-
TER, we based our sample size calculations on the single existing physi-
cal activity trial at that time, with cfPWV as the outcome. This previous
trial compared usual care to a 3-month supervised exercise interven-
tion34 among adults with diabetes, hypertension and dyslipidemia. The
reported effect was a roughly 20% between-arm difference in change
in cfPWV (ie, equivalent to 2 m/s from a baseline of approximately
12 m/s); we aimed to detect a 10% difference to be conservative. Since
then, other relevant studies have been conducted and these suggest a
more modest impact of physical activity interventions on cfPWV. For
example, a 2014 meta-analysis35 of supervised exercise interventions
demonstrated a 0.4 m/s reduction in cfPWV in the active arm com-
pared to the control arm. Consistent with this meta-analysis, we
detected a 0.28 m/s reduction in cfPWV in the active arm vs the con-
trol arm in complete case analysis, although our findings were not con-
clusive (95% CI, −0.68 to 0.13). Interestingly, a previous cohort study
that examined the relationship between step counts and cfPWV did not
demonstrate a conclusive inverse linear relationship at baseline, but
such a conclusive relationship did emerge at the 4-year follow-up
visit.36 There was slower progression of cfPWV for those with higher
baseline step counts (ie, increase in cfPWV was 0.1 m/s less per addi-
tional 1000 steps/day at baseline). It is possible, thus, that there is a
cumulative impact of increases in step count, and that it may take more
time for the step count increase we observed to translate into a conclu-
sive cfPWV reduction .
In a meta-analysis of pedometer-based interventions across clini-
cal populations (including 1 type 2 diabetes trial)5 there was a
−3.8 mm Hg (95% CI, −1.7 to −5.9) difference in systolic blood pres-
sure change in active vs control arms. In our trial, similar to cfPWV,
there was a greater reduction in both systolic (−2.59 mm Hg; 95% CI,
−5.66, 0.47) and diastolic (−1.21 mm Hg; 95% CI, −3.04, 0.62) blood
pressure in active vs control arms, although this was not conclusive.
The lack of conclusive effect is probably attributable to well-
controlled blood pressure at baseline (124/76 mm Hg average). Point
estimates for impact on HDL and LDL were in a favourable direction,
but were arguably trivial.
There were conclusive effects on glucose handling. Among
SMARTER trial participants with type 2 diabetes, there was a greater
reduction in A1c in active arm compared to control arm participants
(−0.38%; 95% CI, −0.69 to −0.06). This is close to the A1c reduc-
tion consistently demonstrated in gym-based supervised exercise
intervention studies.37–40 In a previously cited meta-analysis in
pedometer-based interventions in type 2 diabetes,6 no difference in
A1c emerged between intervention arms, but the authors noted that
baseline A1c was well controlled (6.64%-8.0% on average); this may
have limited the ability to detect differences. The baseline A1c in our
SMARTER trial was at the upper limit of this range. There was other
supporting evidence of favourable glucose handling effects in our trial,
TABLE 1 Demographic characteristics, smoking status,
cardiovascular risk factor and disease prevalence, and pregnancycardiometabolic complication history
Activearm N = 174
Controlarm N = 173
Demographic factors
Age, years, mean (SD) 60.0 (11.2) 59.4 (11.4)
Women, no. (%) 99 (56.9) 91 (52.6)
Post secondary education, no.(%)
117 (70.1) 123 (75.0)
White, no. (%) 110 (63.6) 98 (57.0)
Immigrant, no. (%) 90 (51.7) 96 (55.5)
Married/common-law, no. (%) 115 (74.2) 115 (75.2)
Employed or student, no. (%) 101 (58.7) 98 (58.0)
Menopause (women) 69 (69.7) 70 (76.9)
Smoking history, no. (%)
Current smoker 11 (6.3) 8 (4.7)
Past smoker 62 (35.6) 58 (33.7)
Type 2 diabetes 116 (66.7) 123 (71.1)
Duration, years, mean (SD) 10.5 (7.5) 10.6 (8.3)
Hypertension, no. (%) 161 (92.5) 151 (87.3)
Duration, years, mean (SD) 12.4 (11.4) 12.7 (10.3)
Dyslipidemia, no (%) 116 (66.7) 123 (71.1)
Duration, years, mean (SD) 9.6 (8.8) 9.5 (7.7)
Cardiovascular disease 35 (20.1) 28 (16.3)
Pregnancy-related complicationin women with previouspregnancy, n = 155
Gestational diabetes 18 (22.8) 19 (28.0)
Hypertensive disorder ofpregnancy
20 (25.3) 13 (19.1)
Type 2 diabetes, hypertension and dyslipidemia diagnoses were based onparticipant-reported diagnosis, physician-reported diagnosis and/or use ofcorresponding medications. Duration of disease was determined by par-ticipant report.
700 DASGUPTA ET AL.
including a conclusive reduction in insulin resistance (between-group
difference in HOMA-IR change, −0.96; 95% CI, −1.72 to −0.21) as well
as the development of type 2 diabetes during the trial in 4 control arm
participants, as compared to none in active arm participants. There
were no between-arm differences in changes in number of anti-
hyperglycaemic medications.
Adults with type 2 diabetes are among the most sedentary1,2 and
thus require tailored strategies to facilitate adherence to physical
activity recommendations. When compared to aerobic exercise inter-
ventions, pedometer-based approaches have been shown to lead to
greater adherence over a 6-month period (92% vs 77%).41 However,
most pedometer studies have been short-term in nature, and have not
assessed longer term changes in physical activity and cardiometabolic
profiles. SMARTER examined a 1-year step count prescription strategy
delivered by physicians during routine clinical visits. Our rationale was
that, although physicians are not typically expert in physical activity
counseling, patients do take doctors’ advice seriously.42,43 Unfortu-
nately, only 10% of physicians prescribe physical activity.44 In the
SMARTER approach, the prescription delivered by physicians is simple
and feasible; it meets the patient’s need for accountability and sup-
port, without requiring additional resources and staffing. Most studies
in physical activity indicate that the greatest benefits are realized by
the least active participants.45 Consistent with this, SMARTER partici-
pants were sedentary to low active at baseline (mean, approximately
5000 steps/day). We demonstrated both an increase in step counts
and improvements in glucose handling.
Our trial had some limitations. The challenges in demonstrating
a conclusive impact on cfPWV were probably related to failing to
achieve the target of a 3000 steps/day increase, well-controlled
baseline blood pressure values and to an underestimation of
required sample size based on data available at the time of the trial
design, as discussed. We would note, however, that there was a
TABLE 2 Baseline step counts, carotid femoral pulse wave velocity and cardiometabolic and anthropometric measures
Mean (SD) Active arm N = 174 Control arm N = 173
Steps/day 4550 (2230) 5000 (2360)
Carotid femoral pulse wave velocity, m/s 9.8 (2.4) 9.8 (2.1)
Systolic/diastolic blood pressure, mm Hg 124 (15.8)/76 (10.7) 124 (13.2)/76 (9.5)
Heart rate, bpm 72 (12.4) 73 (11.9)
Glucose control and insulin resistance
Hemoglobin A1c (all type 2 diabetes), % 7.6 (1.3) 7.7 (1.3)
Fasting glucose, mmol/L
Type 2 diabetes; not on insulin1 8.2 (2.5) 7.4 (1.9)
No type 2 diabetes2 5.6 (0.84) 5.5 (0.95)
Fasting insulin, pmol/L
Type 2 diabetes; not on insulin1 79.0 (44.4) 73.2 (52.0)
No type 2 diabetes2 72.1 (42.3) 66.0 (39.0)
HOMA-IR, mean3 (SD)
Type 2 diabetes; not on insulin1 4.88 (3.43) 4.15 (3.52)
No type 2 diabetes2 3.05 (1.99) 2.78 (1.94)
Lipid profile, mean (SD), mmol/L
Total cholesterol 4.60 (1.37) 4.49 (1.22)
HDL 1.27 (0.34) 1.26 (0.37)
LDL 2.45 (1.0) 2.34 (1.0)
Triglycerides, mmol/L 1.73 (3.01) 1.64 (1.10)
Anthropometric measures
Body mass index, kg/m2 31.7 (4.5) 31.8 (4.5)
Weight, kg 86.7 (15.7) 87.5 (15.5)
Waist circumference, cm 104.2 (10.8) 104.1 (12.2)
Women 102.0 (10.5) 100.7 (10.9)
Men 107.1 (10.6) 107.8 (12.6)
Waist to hip ratio 0.94 (0.07) 0.94 (0.08)
Women 0.91 (0.06) 0.89 (0.07)
Men 0.99 (0.06) 0.99 (0.06)
1 There were 61 diabetes patients in the control arm and 72 in the active arm, in whom fasting insulin, glucose and HOMA-IR were measured/computed.These were the individuals with type 2 diabetes who were not undergoing insulin therapy.
2 There were 74 individuals without diabetes in the control arm and 74 in the active arm; fasting insulin, glucose and HOMA-IR were measured/com-puted in these individuals.
3 Mean HOMA-IR was computed among patients not taking exogenous insulin.
Conversion factors: 1 mmol/L glucose = 18.02 mg/dL; 1 pmol/L insulin = 0.14 μIU/mL; 1 mmol/L HDL, LDL, or total cholesterol = 38.6 mg/dL; 1 mmol/L triglycerides = 88.5 mg/dL.
DASGUPTA ET AL. 701

conclusive increase in step counts despite failure to reach targets.
This was also confirmed through imputation with ignorable and non-
ignorable mechanisms, an approach more thorough than those in
previous pedometer-based studies. Furthermore, there was a
decrease in both cfPWV and blood pressure values, although these
were not conclusive. There was an impact on glucose handling,
proven through subgroup analyses; this was consistent in both
those with type 2 diabetes (ie, reduction in A1c) and those not
undergoing insulin therapy (ie, reduction in HOMA-IR). There were
some baseline differences between trial arms. However, baseline
steps/day, cfPWV and cardiometabolic profiles were similar
between arms. As in any trial, there was some attrition, but nearly
80% of participants completed the final assessment and drop-out
rates were similar between arms.
In conclusion, a simple physician-delivered step count prescrip-
tion strategy incorporated into routine clinical practice led to a net
increase of 20% in step counts; however, this was below the targeted
increment of 3000 steps/day. While conclusive effects on cfPWV
were not observed, there were conclusive improvements in both A1c
and insulin sensitivity. Future studies will evaluate an amplified inter-
vention to further increase step counts, to achieve greater impact on
cardiovascular health.
ACKNOWLEDGMENTS
The SMARTER trial group includes Susan Kahn (Professor of Medi-
cine, McGill University) and Louise Pilote (Physician Scientist;
Professor of Medicine, McGill University) who provided important
comments and feedback during protocol development. Recruitment
and assessment assistance was provided by Cindy Ibberson, Cor-
inne Suppère, Samantha Hajna, Anne-Sophie Brazeau, Marie-Eve
Robillard, Yessica Haydee Gomez Sandoval, Alexandra Cooke and
Rani Cruz. Patrick Belisle was our statistical programmer.
Critical to the success of this trial are our study participants and
our network of collaborating physicians, including Catherine Kudo1,
Natasha Garfield1, Les Meissner9, Roy Eappen9, Andrea Lalonde6,
Donald Sproule2 , Ghislaine Roederer7, Pierre Larochelle7, Candace
Lee, David Shannon3, Susan Still2, Vivian Petropoulos8, Maureen
Doyle2 ,Leonora Lalla2, Lynn McLaughlin2, Walter Gregory1 , Sara
Meltzer1, David Morris1, Jean-Marie Boutin7, Juan Rivera1, Margaret
Hughes2, Raymond Sorge2, Alexis Baass1,7, Stravroula Christopoulos4,
Barry Posner1, Khue Ly3, John Hughes2, Reuben Ostrofsky2, Karen
Dahan10, Robert Diez d’Aux2, Maxine Dumas-Pilon2, Pnina Wasser2,
Timothy Meagher3, Sofia Hussaini2, Kimberly Munro2, Robert Wis-
taff7, Agnieska Majdan4, Wen Hu1, April Kinghorn2, Mark Yaffe2,
Joanna Caron2, Jean-Francois Yale1, Carolina Capelle2, Sabiha Awan2,
Paul Cruvellier2 , Tina Kader4, Laurence Green3, Alicia Schiffrin4, Nilay
Ozen8, Samantha Sacks2, Zachary Weinstein2, Hortensia Mircescu7,
Michel Bertrand7, Goldie Marmor, Roxanne Arel2 , Eva Wesolowska7,
Ashley Martin3, Leah Feldman2, Marie-Luce Chen2 , Hans Zingg1,
Marie Weber2, Brent Richards4, Isabelle Leblanc2, Suzanne Morin3,
Murray Vasilevsky5, David Blank1, Sandra Morris2, Aileen Roman2,
Dominique Garrell7, Evelyn Kyle2, François Larivère7, Richard Mack-
ler, Ania Tissakht2, Jeffrey Wiseman3, Renata Sava2, Kurt Jansen10.
TABLE 3 Changes in outcomes among participants who completed final evaluations
Mean (95% CI) Active arm Control arm Difference
Steps/day 1220 (760, 1690) 30 (−420, 480) 1190 (550, 1840)
Carotid femoral pulse wave velocity, m/s −0.17 (−0.50, 0.17) 0.13 (−0.16, 0.42) −0.30 (−0.74, 0.14)
Blood pressure, mm Hg
Systolic −2.23 (−4.64, 0.18) 0.36 (−1.56, 2.29) −2.59 (−5.66, 0.47)
Diastolic −1.45 (−2.86, −0.04) −0.24 (−1.42, 0.93) −1.21 (−3.04, 0.62)
Heart rate, bpm −0.16 (−1.65, 1.33) 0.81 (−0.76, 2.4) −0.97 (−3.13, 1.18)
Glycemic control and insulin resistance
A1c, % (in type 2 diabetes) −0.20 (−0.46, 0.06) 0.18 (−0.01, 0.86) −0.38 (−0.69, −0.06)
In type 2 diabetes patients not on insulin and inparticipants without type 2 diabetes
Fasting insulin, pmol/L −2.15 (−8.61, 4.31) 10.4 (0.81, 20.07) −12.6 (−24.1, −1.1)
Fasting glucose, mmol/L −0.08 (−0.33, 0.18) 0.43 (0.17,0.68) −0.50 (−0.86, −0.15)
HOMA-IR −0.16 (−0.51, 0.18) 0.8 (0.12, 1.48) −0.96 (−1.72, −0.21)
Lipid profile, mmol/L
Total cholesterol, mmol/L −0.13 (−0.28, 0.01) −0.10 (−0.25,0.05) −0.03 (−0.24, 0.18)
HDL, mmol/L 0.01 (−0.02, 0.04) 0 (−0.03, 0.03) 0.01 (−0.03, 0.05)
LDL, mmol/L −0.10 (−0.22, 0.03) −0.08 (−0.19, 0.04) −0.02 (−0.19, 0.15)
Triglycerides, mmol/L −0.15 (−0.44, 0.3) 0.02 (−0.09, 0.13) −0.17 (−0.47, 0.12)
Anthropometric measures
Body mass index, kg/m2 −0.18 (−0.43, 0.07) −0.03 (−0.23, 0.16) −0.15 (−0.47, 0.17)
Weight, kg −0.66 (−1.35, 0.03) −0.11 (0.65, 0.42) −0.55 (−1.41, 0.32)
Waist circumference, cm 0.07 (−0.71, 1.14) 0.22 (−0.85, 0.99) −0.15 (−1.45, 1.15)
Waist to hip ratio 0 (−0.01, 0.01) 0.01 (−0.01, 0.02) −0.01 (−0.02, 0.01)
Conversion factors: 1 mmol/L glucose = 18.02 mg/dL; 1 pmol/L insulin = 0.14 μIU/mL; 1 mmol/L HDL, LDL, or total cholesterol = 38.6 mg/dL; 1 mmol/L triglycerides = 88.5 mg/dL.
702 DASGUPTA ET AL.

1Division of Endocrinology, Department of Medicine, McGill Uni-
versity Health Centre and McGill University; 2Department of Family
Medicine, St. Mary’s Hospital, Montreal, Quebec and McGill Univer-
sity; 3Division of Internal Medicine, Department of Medicine, McGill
University Health Centre and McGill University; 4Division of Endocri-
nology, Department of Medicine, Sir Mortimer Davis Jewish General
Hospital and McGill University; 5Division of Nephrology, Department
of Medicine, McGill University Health Centre and McGill University;6Division of Internal Medicine, Department of Medicine, Sir Mortimer
Davis Jewish General Hospital and McGill University; 7Institut de
Recherches Cliniques de Montréal (IRCM); 8Division of Cardiology,
Department of Medicine, St. Mary’s Hospital, Montreal, Quebec and
McGill University; 9Division of Endocrinology, St. Mary’s Hospital,
Montreal, Quebec and McGill University; 10Division of Primary Care,
Queen Elizabeth Health Complex (QEHC), Department of Family
Medicine, McGill University Health Centre.
Conflict of interest
All authors declare no support from any organization for the submit-
ted work; no financial relationships with any organizations that might
have an interest in the submitted work in the previous 3 years; and
no other relationships or activities that could appear to have influ-
enced the submitted work.
Author contributions
K. D. and S. S. D. conceived the study, supervized recruitment and
data collection, oversaw analyses and interpreted findings. K. D.
wrote the first draft of the manuscript, which was revised with S. S.
D., with important input from S. L. B., L. J., A. B. C., E. R., L. T., D. C.,
M. S. and R. R.-L. who also assisted with interpretation of findings.
D. C. performed recruitment and data collection. L. J. supervised sta-
tistical analyses.
REFERENCES
1. Gregg EW, Gerzoff RB, Caspersen CJ, Williamson DF, Narayan KM.Relationship of walking to mortality among US adults with diabetes.Arch Intern Med. 2003;163:1440-1447.
2. Hu FB, Stampfer MJ, Solomon C, et al. Physical activity and risk forcardiovascular events in diabetic women. Ann Intern Med.2001;134:96-105.
3. Smith TC, Wingard DL, Smith B, Kritz-Silverstein D, Barrett-Connor E.Walking decreased risk of cardiovascular disease mortality in olderadults with diabetes. J Clin Epidemiol. 2007;60:309-317.
4. Yates T, Haffner SM, Schulte PJ, et al. Association between change indaily ambulatory activity and cardiovascular events in people withimpaired glucose tolerance (NAVIGATOR trial): a cohort analysis. Lan-cet. 2014;383:1059-1066.
5. Bravata DM, Smith-Spangler C, Sundaram V, et al. Using pedometersto increase physical activity and improve health: a systematic review.JAMA. 2007;298:2296-2304.
6. Qiu S, Cai X, Chen X, Yang B, Sun Z. Step counter use in type 2 diabe-tes: a meta-analysis of randomized controlled trials. BMC Med.2014;12:36.
7. Tudor-Locke C, Bell RC, Myers AM, et al. Controlled outcome evalua-tion of the First Step Program: a daily physical activity interventionfor individuals with type II diabetes. Int J Obes Relat Metab Disord.2004;28:113-119.
8. Douglas F, Torrance N, van Teijlingen E, Meloni S, Kerr A. Primarycare staff’s views and experiences related to routinely advisingpatients about physical activity. A questionnaire survey. BMC PublicHealth. 2006;6:138.
9. Campkin L, Doyle-Baker PK. Exercise counselling and use of exerciseprofessionals by physicians: Findings from a scoping review. AlbertaCentre for Active Living 2015; July 8, 2015. https://www.centre4activeliving.ca/news/2015/07/physician-exercise-counselling/. Accessed December 12, 2016.
10. Patel A, Schofield GM, Kolt GS, Keogh JW. General practitioners’views and experiences of counselling for physical activity through theNew Zealand Green Prescription program. BMC Fam Pract.2011;12:119.
11. Mitchell GF, Hwang SJ, Vasan RS, et al. Arterial stiffness and cardio-vascular events: the Framingham Heart Study. Circulation.2010;121:505-511.
12. Mattace-Raso FU, van der Cammen TJ, Hofman A, et al. Arterial stiff-ness and risk of coronary heart disease and stroke: the RotterdamStudy. Circulation. 2006;113:657-663.
13. Vlachopoulos C, Aznaouridis K, Stefanadis C. Prediction of cardio-vascular events and all-cause mortality with arterial stiffness: a sys-tematic review and meta-analysis. J Am Coll Cardiol. 2010;55:1318-1327.
14. Dasgupta K, Rosenberg E, Daskalopoulou SS. Step Monitoring toimprove ARTERial health (SMARTER) through step count prescriptionin type 2 diabetes and hypertension: trial design and methods. Cardio-vasc Diabetol. 2014;13:7.
15. Myers J, Prakash M, Froelicher V, Do D, Partington S, Atwood JE.Exercise capacity and mortality among men referred for exercise test-ing. N Engl J Med. 2002;346:793-801.
16. Warburton DE, Nicol CW, Bredin SS. Health benefits of physicalactivity: the evidence. CMAJ. 2006;174:801-809.
17. Townsend RR, Wilkinson IB, Schiffrin EL, et al. Recommendations forimproving and standardizing vascular research on arterial stiffness: ascientific statement from the American Heart Association. Hyperten-sion. 2015;66:698-722.
18. Laurent S, Cockcroft J, Van BL, et al. Expert consensus document onarterial stiffness: methodological issues and clinical applications. EurHeart J. 2006;27:2588-2605.
19. Doonan RJ, Scheffler P, Yu A, et al. Altered arterial stiffness and sub-endocardial viability ratio in young healthy light smokers after acuteexercise. PLoS One. 2011;6:e26151.
20. Mora S, Cook N, Buring JE, Ridker PM, Lee IM. Physical activity andreduced risk of cardiovascular events: potential mediating mechan-isms. Circulation. 2007;116:2110-2118.
21. Bowles DK, Laughlin MH. Mechanism of beneficial effects of physicalactivity on atherosclerosis and coronary heart disease. J Appl Physiol.2011;111(1):308-310. doi:10.1152/japplphysiol.00634.2011.
22. Daskalopoulou SS, Khan NA, Quinn RR, et al. The 2012 Canadianhypertension education program recommendations for the manage-ment of hypertension: blood pressure measurement, diagnosis,assessment of risk, and therapy. Can J Cardiol. 2012;28:270-287.
23. Matthews DR, Hosker JP, Rudenski AS, Naylor BA, Treacher DF,Turner RC. Homeostasis model assessment: insulin resistance andbeta-cell function from fasting plasma glucose and insulin concentra-tions in man. Diabetologia. 1985;28:412-419.
24. Marshall SJ, Levy SS, Tudor-Locke CE, et al. Translating physicalactivity recommendations into a pedometer-based step goal: 3000steps in 30 minutes. Am J Prev Med. 2009;36:410-415.
25. Stevens RJ, Coleman RL, Adler AI, Stratton IM, Matthews DR,Holman RR. Risk factors for myocardial infarction case fatality andstroke case fatality in type 2 diabetes: UKPDS 66. Diabetes Care.2004;27:201-207.
26. Bonora E, Formentini G, Calcaterra F, et al. HOMA-estimated insulinresistance is an independent predictor of cardiovascular disease intype 2 diabetic subjects: prospective data from the Verona DiabetesComplications Study. Diabetes Care. 2002;25:1135-1141.
27. Vaes AW, Cheung A, Atakhorrami M, et al. Effect of ‘activity monitor-based’ counseling on physical activity and health-related outcomes inpatients with chronic diseases: a systematic review and meta-analysis.Ann Med. 2013;45:397-412.
DASGUPTA ET AL. 703

28. De Greef K, Deforche B, Tudor-Locke C, De Bourdeaudhuij I. Increas-ing physical activity in Belgian type 2 diabetes patients: a three-armrandomized controlled trial. Int J Behav Med. 2011;18:188-198.
29. Wen CP, Wai JP, Tsai MK, et al. Minimum amount of physical activityfor reduced mortality and extended life expectancy: a prospectivecohort study. Lancet. 2011;378:1244-1253.
30. Casey D, De Civita M, Dasgupta K. Understanding physical activityfacilitators and barriers during and following a supervised exerciseprogramme in Type 2 diabetes: a qualitative study. Diabet Med.2010;27:79-84.
31. Kirkman MS, Weinberger M, Landsman PB, et al. A telephone-delivered intervention for patients with NIDDM. Effect on coronaryrisk factors. Diabetes Care. 1994;17:840-846.
32. Foster G, Taylor SJ, Eldridge SE, Ramsay J, Griffiths CJ. Self-management education programmes by lay leaders for people withchronic conditions. Cochrane Database Syst Rev. 2007;4:CD005108.
33. Arambepola C, Ricci-Cabello I, Manikavasagam P, Roberts N,French DP, Farmer A. The impact of automated brief messages pro-moting lifestyle changes delivered via mobile devices to people withType 2 diabetes: a systematic literature review and meta-analysis ofcontrolled trials. J Med Internet Res. 2016;18:e86.
34. Madden KM, Lockhart C, Cuff D, Potter TF, Meneilly GS. Short-termaerobic exercise reduces arterial stiffness in older adults with type2 diabetes, hypertension, and hypercholesterolemia. Diabetes Care.2009;32:1531-1535.
35. Ashor AW, Lara J, Siervo M, Celis-Morales C, Mathers JC. Effects ofexercise modalities on arterial stiffness and wave reflection: a system-atic review and meta-analysis of randomized controlled trials. PLoSOne. 2014;9:e110034.
36. Jennersjo P, Ludvigsson J, Lanne T, Nystrom FH, Ostgren CJ. Pedom-eter-determined physical activity level and change in arterial stiffnessin Type 2 diabetes over 4 years. Diabet Med. 2012;29:1119–1125.
37. Umpierre D, Ribeiro PA, Kramer CK, et al. Physical activity adviceonly or structured exercise training and association with HbA1c levelsin type 2 diabetes: a systematic review and meta-analysis. JAMA.2011;305:1790-1799.
38. Boule N, Kenny G, Haddad E, Wells G, Sigal R. Meta-analysis of theeffect of structured exercise training on cardiorespiratory fitness inType 2 diabetes mellitus. Diabetologia. 2003;46:1071-1081.
39. Snowling NJ, Hopkins WG. Effects of different modes of exercisetraining on glucose control and risk factors for complications in type
2 diabetic patients: a meta-analysis. Diabetes Care. 2006;29:2518-2527.
40. Thomas DE, Elliott EJ, Naughton GA. Exercise for type 2 diabetesmellitus. Cochrane Database Syst Rev. 2006;3:CD002968.
41. Bell GJ, Harber V, Murray T, Courneya KS, Rodgers W. A comparisonof fitness training to a pedometer-based walking program matchedfor total energy cost. J Phys Act Health. 2010;7:203-213.
42. Hesse BW, Nelson DE, Kreps GL, et al. Trust and sources of healthinformation: the impact of the Internet and its implications for healthcare providers: findings from the first Health Information NationalTrends Survey. Arch Intern Med. 2005;165:2618-2624.
43. Kao AC, Green DC, Davis NA, Koplan JP, Cleary PD. Patients’ trust intheir physicians: effects of choice, continuity, and payment method.J Gen Intern Med. 1998;13:681-686.
44. Teoh H, Despres JP, Dufour R, et al. A comparison of the assessmentand management of cardiometabolic risk in patients with and withouttype 2 diabetes mellitus in Canadian primary care. Diabetes ObesMetab. 2013;15:1093-1100.
45. Vuori IM, Lavie CJ, Blair SN. Physical activity promotion in the healthcare system. Mayo Clin Proc. 2013;88:1446-1461.
SUPPORTING INFORMATION
Additional Supporting Information may be found online in the sup-
porting information tab for this article.
How to cite this article: Dasgupta K, Rosenberg E, Joseph L,
Cooke AB, Trudeau L, Bacon SL, Chan D, Sherman M,
Rabasa-Lhoret R, Daskalopoulou SS and SMARTER Trial
Group. Physician step prescription and monitoring to improve
ARTERial health (SMARTER): A randomized controlled trial in
patients with type 2 diabetes and hypertension. Diabetes Obes
Metab. 2017;19:695–704. https://doi.org/10.1111/dom.12874
704 DASGUPTA ET AL.