physics lecture 20 - pushing the speed limit files/lecture 20.pdfpermission to print research copies...
TRANSCRIPT

PERMISSION TO PRINT RESEARCH COPIES GRANTED BY JOBE CONSULTING LLC
Physics Lecture 20 - Pushing the Speed Limit
Introduction
The WIRL is the Woodcar Independent Racing League, a group of pinewood derby enthusiasists that build and race cars(an addictive hobby). WIRL communicate on the forum at this link. . The popular commercially available aluminum trackmade by BestTrackTM is the one used by the WIRL participants. The purpose of this lecture is to:
1) Provide precision BestTrack measurements so the track may be used in the Virtual Race.
2) Run a Lima, Ohio WIRL virtual race using a virtual car based on the 12 parameters of the winning WIRL car builtby Kevin of Derby Works. Show the power of the Virtual Race program in helping design faster cars.
3) Compare the results of the virtual race with the actual race at Lima and look at ways to push the speed limit.
4) Throw in some straightforward but interesting physics now and then (mostly in the boxes).
Significant Figures
When a PWD car is dropped from a height h, and we neglect friction, air drag, etc., then we find that its velocity v afterdropping distance h is v = On the earth, the gravitational constant g is close to 980.00 cm/sec2 and the2ghheight h of the car center of mass start position relative to the level of the finish line is about 4 ft = 48.000" = 121.92cm . So get out your calculator and multiply 2.0000 x 980.00 x 121.92 and then hit the square root key and you get488.84 cm/sec. Because 12 inches = 30.480 cm, when you divide 488.84 by 30.480, then you see that such a velocityis equivalent to 16 feet per second (actually, 16.038). A good ratio to remember isthat 88 feet per second is exactly 60 mph, so scale 16 down by the ratio 60/88 andyou get very close to 11 mph (actually, 10.935 mph).
Again, this is the velocity of your car as it crosses the finish line. You get this velocity no matterwhere the finish line is (as long as it is 4 ft lower than the start position). You could trip andaccidentally drop the car straight down 4 ft to the floor and its center of mass still hits at a velocityof 488.84 cm/sec. If your car is 7 inches long, or 7.0000 x 2.5400 = 17.780 cm long, then divideby its velocity and you get 0.03637 seconds it takes for the whole car length to pass the finish line.Many race timers can see 0.0001 seconds, and in this length of time the fraction 0.0001/0.03637= 0.002750 of a car length goes by. This is about 0.020 inches or the thickness of 2 playing cards.
The point of all this significant figures stuff is to realize that because of the 0.0001 seconds highaccuracy of the race timers, we need at least about 4 or 5 significant figures in all the arithmetic, in related measurements like above, if we want to use them to calculate relative finish positions to asmall fraction of a car length (It’s the old garbage in/garbage out cliche). We used mostly 5significant figures above, but it is difficult to measure some things like h to better than about 4significant figures, so 4 figures is an absolute minimum to be used in what follows.
Editing in the BestTrack Measurements
The gravitational constant of earth parameter, known as g or G (don’t confuse with g for grams), is979.27 cm per second squared for the Houston area. This is known as "The local acceleration ofgravity" . G can have different values for different planets depending on their mass. For cities on theearth with various latitudes, the G value can vary up to about 1%. Multiply the closest latitude (suchas 38) by 0.084 and add to 976.83. This will give a reasonably accurate value for g to edit into yourtrack design. When this is done for Houston, at about 29.8 latitude, you get 979.33, very close to itsaccepted value of 979.27. Table 1 shows a list of G values that covers the latitudes of most cities inthe US. At Lima, Ohio, we have a latitude of 40.74 which gives g = 980.25 from Table 1.
Table 1 - g valuevs. latitudeLatitude g (cm/sec2)
25 978.9326 979.0127 979.1028 979.1829 979.2730 979.3531 979.4332 979.5233 979.6034 979.6935 979.7736 979.8537 979.9438 980.0239 980.1140 980.1941 980.2742 980.3643 980.4444 980.5345 980.6146 980.6947 980.7848 980.8649 980.9550 981.03
Note that the car wheel rotates about50 times per second at this speedwhich is 3000 rpm.
PERMISSION TO PRINT RESEARCH COPIES GRANTED BY JOBE CONSULTING LLC
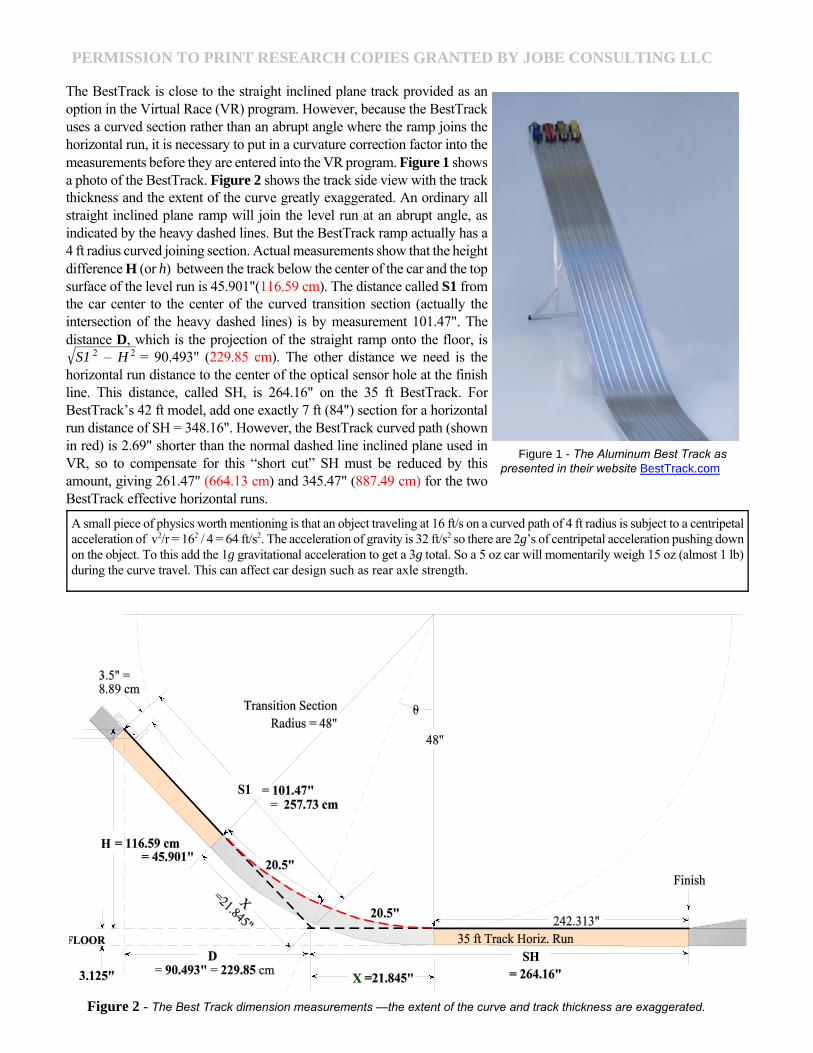
Figure 1 - The Aluminum Best Track as presented in their website BestTrack.com
Figure 2 - The Best Track dimension measurements —the extent of the curve and track thickness are exaggerated.
The BestTrack is close to the straight inclined plane track provided as anoption in the Virtual Race (VR) program. However, because the BestTrackuses a curved section rather than an abrupt angle where the ramp joins thehorizontal run, it is necessary to put in a curvature correction factor into themeasurements before they are entered into the VR program. Figure 1 showsa photo of the BestTrack. Figure 2 shows the track side view with the trackthickness and the extent of the curve greatly exaggerated. An ordinary allstraight inclined plane ramp will join the level run at an abrupt angle, asindicated by the heavy dashed lines. But the BestTrack ramp actually has a4 ft radius curved joining section. Actual measurements show that the heightdifference H (or h) between the track below the center of the car and the topsurface of the level run is 45.901"(116.59 cm). The distance called S1 fromthe car center to the center of the curved transition section (actually theintersection of the heavy dashed lines) is by measurement 101.47". Thedistance D, which is the projection of the straight ramp onto the floor, is
= 90.493" (229.85 cm). The other distance we need is theS1 2 – H 2
horizontal run distance to the center of the optical sensor hole at the finishline. This distance, called SH, is 264.16" on the 35 ft BestTrack. ForBestTrack’s 42 ft model, add one exactly 7 ft (84") section for a horizontalrun distance of SH = 348.16". However, the BestTrack curved path (shownin red) is 2.69" shorter than the normal dashed line inclined plane used inVR, so to compensate for this “short cut” SH must be reduced by thisamount, giving 261.47" (664.13 cm) and 345.47" (887.49 cm) for the twoBestTrack effective horizontal runs.
A small piece of physics worth mentioning is that an object traveling at 16 ft/s on a curved path of 4 ft radius is subject to a centripetalacceleration of v2/r = 162 / 4 = 64 ft/s2. The acceleration of gravity is 32 ft/s2 so there are 2g’s of centripetal acceleration pushing downon the object. To this add the 1g gravitational acceleration to get a 3g total. So a 5 oz car will momentarily weigh 15 oz (almost 1 lb)during the curve travel. This can affect car design such as rear axle strength.

PERMISSION TO PRINT RESEARCH COPIES GRANTED BY JOBE CONSULTING LLC
Figure 3 - The track edit box from the VirtualRace. The Best Track Data is as set up in Lima, Ohioaccording to Figure 2 with ρ and G as explained inthe text.
Figure 4 - TOPGUN, the winningmodified car by Kevin of Derby Works.
Concerning air density, Table 2 has been compiled from interpolatedvalues based on density data published in the 1965 version (44th Ed) of theHandbook of Chemistry and Physics by the Chemical Rubber Co. Lima,Ohio, has an altitude of 974 ft which gives ρ = 0.001129 g / cm3 fromTable 2 at 80o F (and RH = 50%). From Table 2 you can see that airdensity increases about 0.5% as the temperature goes down 20o F from 80o
F to 60o F. And as far as relative humidity is concerned, if you have a wet100% RH day the air density will only drop about 0.5% and if you have adesert condition of 0% RH the air density would increase about 0.5%.
Figure 3 shows the key information, from that so far presented(in red), entered into the Track Parameter edit dialog box fromthe Virtual Race Program. The values of ramp angle ALPHA andthe inclined plane length S1 are calculated from the data enteredat the top of this dialog box.
Editing in the Car Measurements
Figure 4 shows a photo of the winning car at Lima in the WIRLmodified division. The car is a hollowed out piece of balsa woodwith several 1/4" tungsten blocks glued in the rear of the hollowshell. The car plan view is shown in Figure 5. Kevin (the builder)was kind enough to show me the underside of the car. It was
estimated that about 25of the tungsten blocks,each weighing 4.80grams, were used forrear weighting. Table 3shows the weight of theother componentsrequired to get close to5.0000 oz (141.75grams).
The next thing to do isto enter the 12parameters of TOPGUN into the VirtualRace program and seehow well we can predict its performance.The 12 parameters that we use in avirtual car are explained in Lecture 10.After we create the virtual version ofTop Gun we can then discuss what couldbe done to perhaps increase the speed ofthe car. The Virtual Race program canthen be used to quantify such potentialdesign improvements.
Table 2 - Air density for various altitudes at 2temperatures at 50% relative humidity.
Altitude (ft) ρ (g / cm3) ρ (g / cm3)60o F 80o F
0 0.001219 0.001170500 0.001197 0.001149
1000 0.001176 0.0011281500 0.001154 0.0011072000 0.001133 0.0010862500 0.001111 0.0010653000 0.001090 0.0010443500 0.001068 0.0010234000 0.001046 0.0010024500 0.001025 0.0009815000 0.001003 0.0009605500 0.000982 0.0009396000 0.000960 0.000918
Table 3 - Estimated weights for TopGun
PartWeight (g)
25 Tungsten 1/4" cubes 120.004 RS Wheels 4.60
4 Axles 0.58Paint + Glue 3.00Balsa body 14.50
Most people don’t appreciate how heavy air is. If you bought a big box of papertowel rolls at Sam’s the empty cardboard box might measure about 39" on a side.This box is about a cubic meter, which is a million cubic centimeters, and Table 2shows the air in the box could weigh 1219 grams = 1.219 Kg = 2.7 lbs. Well, that’sabout what the empty cardboard box itself weighs.
PERMISSION TO PRINT RESEARCH COPIES GRANTED BY JOBE CONSULTING LLC
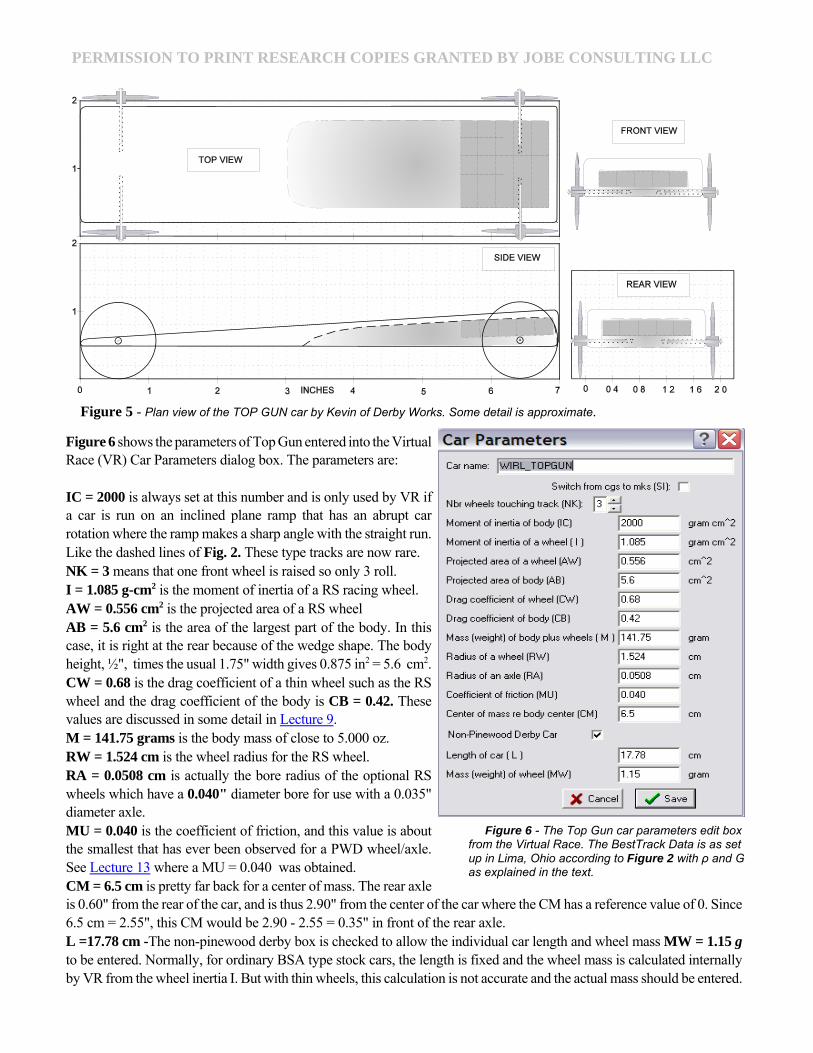
Figure 5 - Plan view of the TOP GUN car by Kevin of Derby Works. Some detail is approximate.
Figure 6 - The Top Gun car parameters edit boxfrom the Virtual Race. The BestTrack Data is as setup in Lima, Ohio according to Figure 2 with ρ and Gas explained in the text.
Figure 6 shows the parameters of Top Gun entered into the VirtualRace (VR) Car Parameters dialog box. The parameters are: IC = 2000 is always set at this number and is only used by VR ifa car is run on an inclined plane ramp that has an abrupt carrotation where the ramp makes a sharp angle with the straight run.Like the dashed lines of Fig. 2. These type tracks are now rare.NK = 3 means that one front wheel is raised so only 3 roll.I = 1.085 g-cm2 is the moment of inertia of a RS racing wheel.AW = 0.556 cm2 is the projected area of a RS wheelAB = 5.6 cm2 is the area of the largest part of the body. In thiscase, it is right at the rear because of the wedge shape. The bodyheight, ½", times the usual 1.75" width gives 0.875 in2 = 5.6 cm2.CW = 0.68 is the drag coefficient of a thin wheel such as the RSwheel and the drag coefficient of the body is CB = 0.42. Thesevalues are discussed in some detail in Lecture 9.M = 141.75 grams is the body mass of close to 5.000 oz.RW = 1.524 cm is the wheel radius for the RS wheel.RA = 0.0508 cm is actually the bore radius of the optional RSwheels which have a 0.040" diameter bore for use with a 0.035"diameter axle. MU = 0.040 is the coefficient of friction, and this value is aboutthe smallest that has ever been observed for a PWD wheel/axle.See Lecture 13 where a MU = 0.040 was obtained.CM = 6.5 cm is pretty far back for a center of mass. The rear axleis 0.60" from the rear of the car, and is thus 2.90" from the center of the car where the CM has a reference value of 0. Since6.5 cm = 2.55", this CM would be 2.90 - 2.55 = 0.35" in front of the rear axle. L =17.78 cm -The non-pinewood derby box is checked to allow the individual car length and wheel mass MW = 1.15 gto be entered. Normally, for ordinary BSA type stock cars, the length is fixed and the wheel mass is calculated internallyby VR from the wheel inertia I. But with thin wheels, this calculation is not accurate and the actual mass should be entered.
PERMISSION TO PRINT RESEARCH COPIES GRANTED BY JOBE CONSULTING LLC
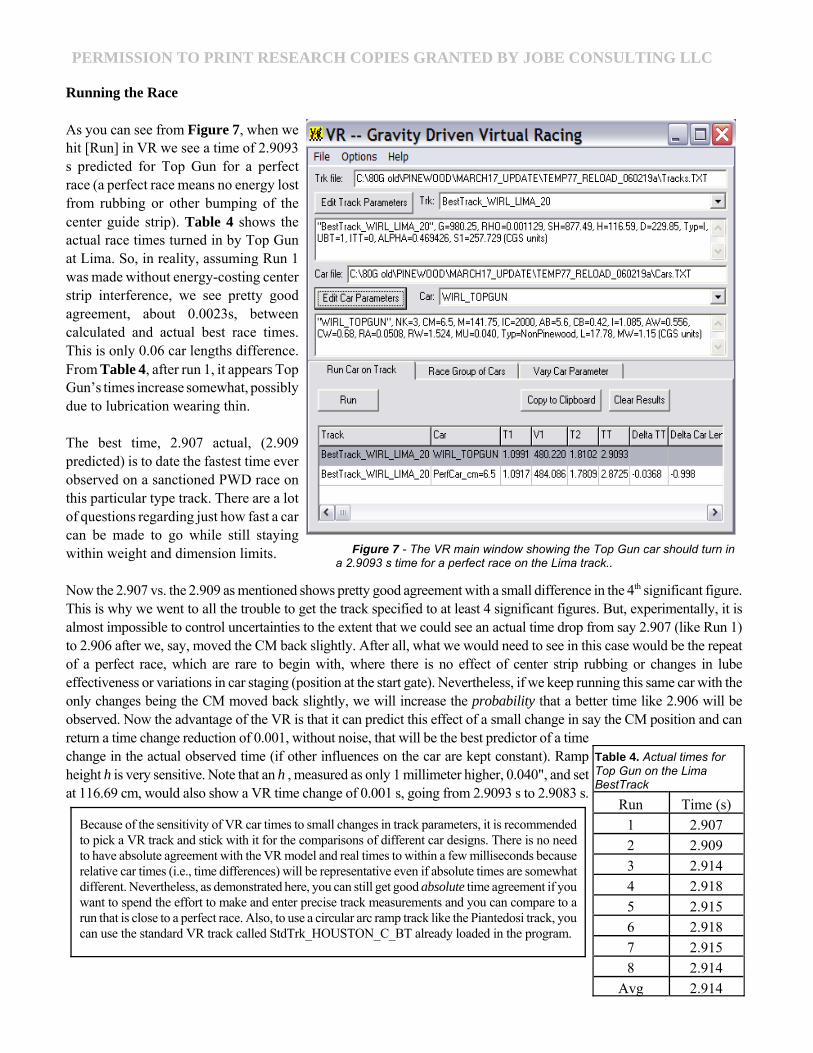
Figure 7 - The VR main window showing the Top Gun car should turn ina 2.9093 s time for a perfect race on the Lima track..
Running the Race
As you can see from Figure 7, when wehit [Run] in VR we see a time of 2.9093s predicted for Top Gun for a perfectrace (a perfect race means no energy lostfrom rubbing or other bumping of thecenter guide strip). Table 4 shows theactual race times turned in by Top Gunat Lima. So, in reality, assuming Run 1was made without energy-costing centerstrip interference, we see pretty goodagreement, about 0.0023s, betweencalculated and actual best race times.This is only 0.06 car lengths difference.From Table 4, after run 1, it appears TopGun’s times increase somewhat, possiblydue to lubrication wearing thin.
The best time, 2.907 actual, (2.909predicted) is to date the fastest time everobserved on a sanctioned PWD race onthis particular type track. There are a lotof questions regarding just how fast a carcan be made to go while still stayingwithin weight and dimension limits.
Now the 2.907 vs. the 2.909 as mentioned shows pretty good agreement with a small difference in the 4th significant figure.This is why we went to all the trouble to get the track specified to at least 4 significant figures. But, experimentally, it isalmost impossible to control uncertainties to the extent that we could see an actual time drop from say 2.907 (like Run 1)to 2.906 after we, say, moved the CM back slightly. After all, what we would need to see in this case would be the repeatof a perfect race, which are rare to begin with, where there is no effect of center strip rubbing or changes in lubeeffectiveness or variations in car staging (position at the start gate). Nevertheless, if we keep running this same car with theonly changes being the CM moved back slightly, we will increase the probability that a better time like 2.906 will beobserved. Now the advantage of the VR is that it can predict this effect of a small change in say the CM position and canreturn a time change reduction of 0.001, without noise, that will be the best predictor of a timechange in the actual observed time (if other influences on the car are kept constant). Rampheight h is very sensitive. Note that an h , measured as only 1 millimeter higher, 0.040", and setat 116.69 cm, would also show a VR time change of 0.001 s, going from 2.9093 s to 2.9083 s.
Table 4. Actual times forTop Gun on the LimaBestTrack
Run Time (s)1 2.9072 2.9093 2.9144 2.9185 2.9156 2.9187 2.9158 2.914
Avg 2.914
Because of the sensitivity of VR car times to small changes in track parameters, it is recommendedto pick a VR track and stick with it for the comparisons of different car designs. There is no needto have absolute agreement with the VR model and real times to within a few milliseconds becauserelative car times (i.e., time differences) will be representative even if absolute times are somewhatdifferent. Nevertheless, as demonstrated here, you can still get good absolute time agreement if youwant to spend the effort to make and enter precise track measurements and you can compare to arun that is close to a perfect race. Also, to use a circular arc ramp track like the Piantedosi track, youcan use the standard VR track called StdTrk_HOUSTON_C_BT already loaded in the program.

PERMISSION TO PRINT RESEARCH COPIES GRANTED BY JOBE CONSULTING LLC
Figure 8 - The effects of air drag, wheel inertia, and axle/wheel friction on Top Gun times.
The Perfect Car
Let’s leave the virtual Top Gun CM the same at 6.5 cm and set air drag, wheel/axle friction, and wheel moment ofinertia all to zero. We then have a Perfect Car that turns in a 2.8725 time as shown in the data window in Figure 7.So, according to the Virtual Race model, Kevin’s Top Gun was within about a car length (0.998) of a car run in avacuum, with zero friction, and with weightless wheels. Such a perfect car could not actually be built or run, but howclose can we get to this 2.8725 s limit? To answer this question, we need to examine the separate effects of wheelinertia, wheel/axle friction, and air drag while keeping the CM constant at 6.5 cm.
The Effects of Wheel Momentof Inertia, Air Drag, andWheel/Axle Friction.
As shown in Figure 8, the TopGun time and the Perfect Cartime are given as the far left andright dark blue bars. If we runVR with only the body andwheel air drag at zero we get the2.8947 s time, if we instead setthe wheel moment of inertia tozero we get the 2.8954 s time,and if we put this parameter backto its Top Gun value and setwheel/axle friction (MU) at zerowe get 2.9013 s. If Top Gun usedstandard 0.098" bores, frictiondrag is 2.5 times larger than shown and the time would be 2.9212 s.
Next, let’s see what might be done to improve the wheel inertia time losses.
Wheel Inertia and Related Parameters
When we trim down the RS wheel further to reduce its moment of inertia, we also change its area (AW), its mass (MW),and its radius (RW). Recall when we change the wheel radius, we also change the lever arm that transmits the wheel/axlefriction force that acts to slow down the whole car system (see Lecture 4). So what we will do here is make several virtualwheels, calculate their inertia, area, and mass as shown in Lecture 5. Wheel radius will also be noted and we will assemblethese wheels on the Top Gun virtual car to make 6 virtual cars to race. What we are going to demonstrate was firstuncovered in 1994 and documented in the large green book The Physics of the Pinewood Derby which was copyrightedin 2004. Basically, we will now show that the RS wheels as sold are not the optimum size for the fastest runs.
It turns out that when you set up the equations of motion for a gravity driven car and solve the equations you get the timeto traverse the given track as a function of the 12 or so parameters of the car. It is not an easy job to solve the equations (afew hundred pages of the big green book show that the job is fairly involved) but once the solutions are obtained one getsthe relationship among the wheel radius, bore radius, coefficient of friction, wheel air drag, and wheel inertia parameters.
Aircraft flight simulators are sophisticated programs that apply appropriate physical and aerodynamic principles in orderto make virtual flying seem close to reality. A modern fighter such as the F 22 Raptor is said to require upwards of 6,000or so parameters in its training and testing simulator. By comparison, the 12 or so parameters required to design and runa virtual PWD car would seem rather simple. Nevertheless, the basic principles used to model real performance are the samein both cases. In the year 2027, a practicing engineer developing models for flights from the moon to Titan, with perhaps10,000 parameters involved, will recall with a smile his first experience as a Cub Scout with virtual models based onmathematics and natural laws.

PERMISSION TO PRINT RESEARCH COPIES GRANTED BY JOBE CONSULTING LLC
Figure 8 - The effects of air drag, wheel inertia, and axle/wheel friction on Top Gun times.
Figure 10 - The results from progressively trimming wheel 1 to create wheels 2 through 6. Mat’l is Delrin.
Figure 9 - The cross section of a RS racing wheel with a 0.040" diameter bore.
Figure 9 shows the calculation ofthe moment of inertia of the RSracing wheel according to Lecture5. Recall in Lecture 5 there was alink to an Excel spreadsheet thatwould allow a very accurateinertia and mass calculation for awheel. All one needs to do isestimate how many squares are inthe shaded cross section of ½ thewheel as shown and list thisnumber in the Zs column. Put thiscolumn in the spreadsheet and themoment of inertia and mass willappear. Also note to the right ofthe graph we list the number of Zssquares for the projected area ofthe wheel. Each square is 0.02" x0.02" = 0.508 x 0.508 = 0.0258cm2. So 107.7 squares x 2 (alsocount the top half of the wheel)gives 0.556 cm2 for AW. Do thisfor 5 other wheels of progressivelysmaller radii and you get theinformation shown below in Figure 10.

PERMISSION TO PRINT RESEARCH COPIES GRANTED BY JOBE CONSULTING LLC
Figure 11 - When we analyze the wheels of Figure 10 accordingto the graphical calculation based on Figure 9, for Delrin we get thevalues above for the wheel inertia I, the wheel mass MW, and thewheel projected area AW. For P’styrene, MW & I are 75% less.
Figure 12 - When we run the virtual cars with the wheels of Figure10, we see where the optimum wheel radius should be depending onwheel material, wheel bore size, and wheel/axle friction.
Figure 11 shows the decrease in wheel inertia I (blue),wheel mass (brown) and wheel cross-sectional orprojected area AW (red) as the radius and outerthickness are progressively reduced. The values of Iand AW going from wheel 1 to wheel 2 show thelargest drop as some extra mass was removedcompared to later trimmings.
Figure 12 shows the very interesting results of thevirtual races with the different wheels of Figure 10.Thetop right blue triangle marks the time (2.9093 s) we hadearlier of Top Gun running Delrin wheels at RW =1.524 cm radius and RB = 0.0508 cm at a wheel/axlefriction of 0.04. Now Delrin™ is a specialized polymerthat has good strength properties but has a high densityof 1.40 g/cm3. The moment of inertia of a wheel isproportional to the wheel material density, so switchingto the ordinary, but still strong, polystyrene wheels willreduce the moment of inertia 75% from 1.085 to 0.814g-cm2. This alone reduces the time to 2.906 s. If we nowstart to reduce the wheel radii we see two interactingeffects, primarily of wheel inertia and transmittedfriction. The wheel moment of inertia slows down theoverall car CM velocity because it is storing energy asrotation that could be applied to moving the wholevehicle forward. The larger the radius for a given mass,the more inertia the wheel will have. But, on the otherhand, the larger the radius, the less is the wheel/axlefriction force that will be transmitted to the whole car. Soas you reduce the radius and thus I, there is a point wherethe frictional time increase starts becoming greater thanthe time reduction due to smaller I, and at this point youhave found the optimum wheel radius as seen in Figure12.
All classical motion in the universe is either pure translational (all points in a body follows parallel trajectories) or pure rotational(every point in a body describes a circle around a common stationary center) or a combination of the two. A rolling hoop (an all rimwheel) is a combination that has exactly as much rotational energy as it does translational energy (where the CM is the only translatingpoint). So given a fixed amount of potential energy by virtue of raising the whole object in a gravitational field, the rolling hoop atthe finish line has a translational velocity of its center given by only v = Now if you cou ld get that whole hoop to slide downgh .
a ramp of really slick ice of zero friction without rotating its velocity at the finish line would be v = or 41.4% greater. A gravity2ghdriven car has both rotational and translational components as well, and the less rotational energy that is used the more is left overto increase translational velocity. Perhaps we could explain it to a youngster this way: “Billy, play like you’re small or your PWDcar is big and you are sitting on the car body between the rear wheels. You are whizzing down the ramp and you peek over the edgeand see that the bottom of your left rear wheel is headed backwards away from the finish line at a pretty good clip. As a matter of factit looks like it’s leaving the finish line at the same rate that marks on the track are going backwards. Then you look at the top of thesame left rear wheel and it appears it is headed towards the finish line at the same clip—that’s good. And you notice the very rear ofthe wheel is headed straight up and the very front is headed straight down, neither towards the finish line. Billy says, ‘Wow, thematerial in the wheel doesn’t seem to know which way the finish line is. I’d probably do better with a sled. At least all the parts wouldbe headed in the right direction’.” Billy is right—with a good sled and a nice no friction slick icy ramp all your energy istranslational and you get to the finish line quicker compared to the case where you have to wind up wheels on the way down.
PERMISSION TO PRINT RESEARCH COPIES GRANTED BY JOBE CONSULTING LLC
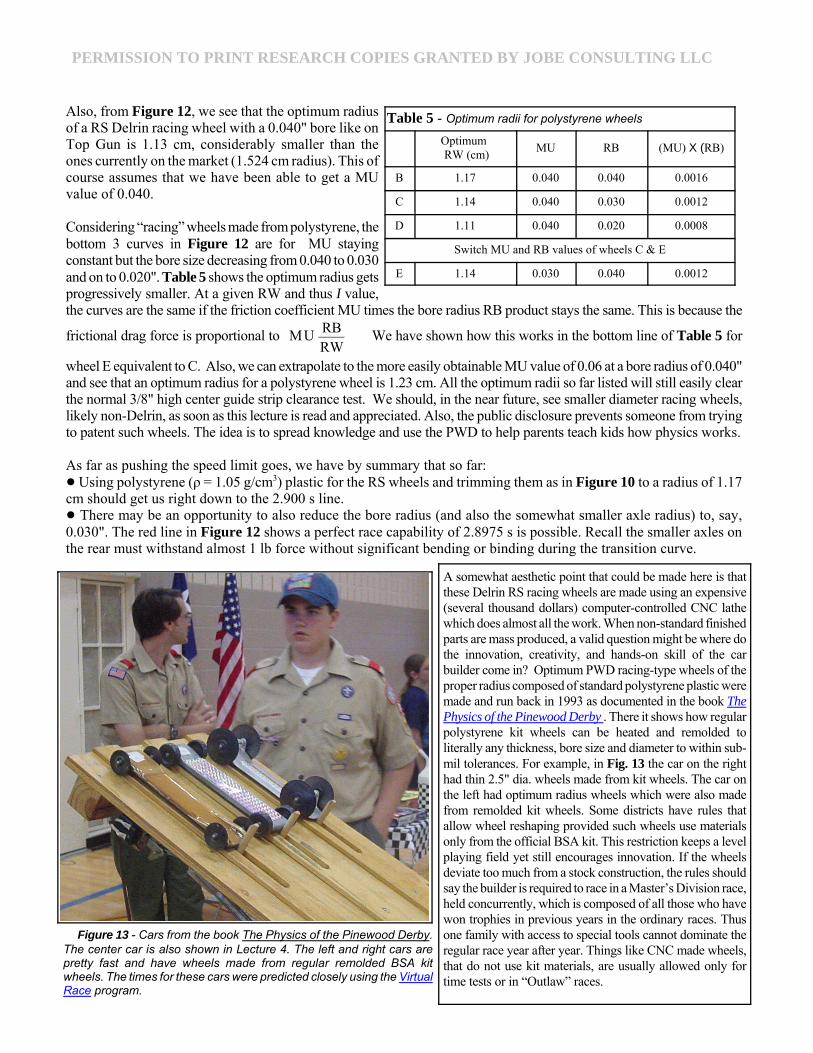
Figure 13 - Cars from the book The Physics of the Pinewood Derby.The center car is also shown in Lecture 4. The left and right cars arepretty fast and have wheels made from regular remolded BSA kitwheels. The times for these cars were predicted closely using the VirtualRace program.
Also, from Figure 12, we see that the optimum radiusof a RS Delrin racing wheel with a 0.040" bore like onTop Gun is 1.13 cm, considerably smaller than theones currently on the market (1.524 cm radius). This ofcourse assumes that we have been able to get a MUvalue of 0.040.
Considering “racing” wheels made from polystyrene, thebottom 3 curves in Figure 12 are for MU stayingconstant but the bore size decreasing from 0.040 to 0.030and on to 0.020". Table 5 shows the optimum radius getsprogressively smaller. At a given RW and thus I value,the curves are the same if the friction coefficient MU times the bore radius RB product stays the same. This is because the
frictional drag force is proportional to We have shown how this works in the bottom line of Table 5 forMU RBRW
wheel E equivalent to C. Also, we can extrapolate to the more easily obtainable MU value of 0.06 at a bore radius of 0.040"and see that an optimum radius for a polystyrene wheel is 1.23 cm. All the optimum radii so far listed will still easily clearthe normal 3/8" high center guide strip clearance test. We should, in the near future, see smaller diameter racing wheels,likely non-Delrin, as soon as this lecture is read and appreciated. Also, the public disclosure prevents someone from tryingto patent such wheels. The idea is to spread knowledge and use the PWD to help parents teach kids how physics works.
As far as pushing the speed limit goes, we have by summary that so far: ! Using polystyrene (ρ = 1.05 g/cm3) plastic for the RS wheels and trimming them as in Figure 10 to a radius of 1.17cm should get us right down to the 2.900 s line. ! There may be an opportunity to also reduce the bore radius (and also the somewhat smaller axle radius) to, say,0.030". The red line in Figure 12 shows a perfect race capability of 2.8975 s is possible. Recall the smaller axles onthe rear must withstand almost 1 lb force without significant bending or binding during the transition curve.
Table 5 - Optimum radii for polystyrene wheels
Optimum RW (cm) MU RB (MU) X (RB)
B 1.17 0.040 0.040 0.0016
C 1.14 0.040 0.030 0.0012
D 1.11 0.040 0.020 0.0008
Switch MU and RB values of wheels C & E
E 1.14 0.030 0.040 0.0012
A somewhat aesthetic point that could be made here is thatthese Delrin RS racing wheels are made using an expensive(several thousand dollars) computer-controlled CNC lathewhich does almost all the work. When non-standard finishedparts are mass produced, a valid question might be where dothe innovation, creativity, and hands-on skill of the carbuilder come in? Optimum PWD racing-type wheels of theproper radius composed of standard polystyrene plastic weremade and run back in 1993 as documented in the book ThePhysics of the Pinewood Derby . There it shows how regularpolystyrene kit wheels can be heated and remolded toliterally any thickness, bore size and diameter to within sub-mil tolerances. For example, in Fig. 13 the car on the righthad thin 2.5" dia. wheels made from kit wheels. The car onthe left had optimum radius wheels which were also madefrom remolded kit wheels. Some districts have rules thatallow wheel reshaping provided such wheels use materialsonly from the official BSA kit. This restriction keeps a levelplaying field yet still encourages innovation. If the wheelsdeviate too much from a stock construction, the rules shouldsay the builder is required to race in a Master’s Division race,held concurrently, which is composed of all those who havewon trophies in previous years in the ordinary races. Thusone family with access to special tools cannot dominate theregular race year after year. Things like CNC made wheels,that do not use kit materials, are usually allowed only fortime tests or in “Outlaw” races.

PERMISSION TO PRINT RESEARCH COPIES GRANTED BY JOBE CONSULTING LLC
Figure 14 - The VR results for running [Vary Parameter] forcomparing drag coefficient time gain vs CM time loss.
As we leave the subject of wheel inertia, bore/axlesize, wheel/axle friction, wheel material, and wheelouter radius, we might mention that air drag on thethinner and smaller wheels is less which also helps toreduce time slightly. For example, if Top Gunrunning wheel No. 1 had only its area AW changeand it went from 0.556 to 0.447 cm2 , which is thearea of wheel No. 2, its time would decrease veryslightly from 2.9093 to 2.9084 s, a change of 0.0009s. However, the I value going down to that of wheelNo. 2 keeping the area and everything else constantgives a change of 2.9093 to 2.9031 s which is adecrease of 0.0062 s, about 7 times more. Also, wheelmass changes have a barely noticeable VR race effectbecause the overall mass is assumed to be keptconstant at 5 oz by adding enough body mass tocompensate for that trimmed off the wheels.
Aerodynamic Improvements
We have basic principles and examples of aerodynamiceffects in Lectures 8, 9 and 10. Regarding the TopGun design, we should be able to reduce the maximumheight from 0.5" to 0.25", although this would meanthe tungsten cubes would be exposed at the top andbottom for lack of space to put wood (epoxy glueworks well to form a solid rigid tungsten 1/4" highblock of 25 cubes). This would halve AB to 2.80 cm2.Running the VR for this car shows the time drops from2.9093 to 2.9043, a difference of 0.0050 s. But howabout drag coefficient? If we could move the tungsten(and CM) forward some we could taper the rear downto a point like an airfoil shape, We looked at thistradeoff in Lecture 10 (see Fig. 2 there). Figure 14shows Top Gun of AB = 2.80 cm2 being run in VRwith the CB reducing from 0.42 to the 0.24 typical ofa tapered rear. This is compared to this same Top Gunbeing run with the CM going from 6.5 down to 4 cm orso. As you can see, the drag coefficient reduction cangain 0.0022 s but by the time the CM is movedforward to 5.855 cm you have given the 0.0022 s back.That is just not enough distance to produce ameaningful taper. Of course, as discussed in Lecture 7,on a circular arc ramped track any CM change willcause about 4 times more time difference than the sameCM change on an inclined plane ramped track. It would help if a tapered tungsten shape, predrilled for axles, could be madefor the rear end. Still, we conclude that the drag coefficient cannot easily be changed from 0.42 by rear tapering.

PERMISSION TO PRINT RESEARCH COPIES GRANTED BY JOBE CONSULTING LLC
The Coefficient of Wheel/Axle Friction
Our original analysis of Top Gun as built was that it must have a MU value close to 0.040. This is a practical lower limitfor ordinary sliding friction of two smooth surfaces. Recall in Lecture 13 we were able to get this MU using Super ZGraphite plus Super Z Oil. There is likely no room for coefficient of friction reduction using simple journal bearings.
Conclusions
Using VR to analyze Top Gun improvements suggests we use a polystyrene optimum wheel No 5 of 0.030" bore running,say, a 0.025" nickel plated axle lubed with Super Z Graphite plus Super Z Oil. This should give 2.8975 s for a no bumpingrace. A reduction of body projected area to 2.8 cm2 should reduce time further giving 2.8925 s. This is within 0.020 secondsof a Perfect Car and only 0.54 car lengths behind perfection at the finish line, almost twice as close as Top Gun’s 1st run. Buta skilled builder must still control lubrication, rail riding, and car staging strategies to realize this time. Let the race go on.