physics teachers and instruction in physics - boston college · 328 chapter 11: physics teachers...
TRANSCRIPT

To help place students’ achievement in physics in the context of their school and classroom situations, TIMSS Advanced asked students’ teachers to complete questionnaires about their educational preparation to teach physics, their school and classroom situations, and the instructional practices they used in teaching physics to the students assessed. The chapter begins by presenting teachers’ reports about their background characteristics, education, and participation in professional activities and development. The second part of the chapter provides information about a number of aspects of their pedagogical approaches to the teaching of physics, including the predominant learning activities and technology used as well as the roles of homework and assessments.
Results are generally shown as the percentages of students whose teachers reported various situations. That is, the student is the unit of analysis so that TIMSS Advanced 2008 can describe students’ classroom contexts. The exhibits have special notations when relatively large percentages of students did not have teacher questionnaire information. For a country where teacher responses were available for 70 to 84 percent of the students, an “r” is included next to its data.
Chapter 11Physics Teachers and Instruction in Physics

326 chapter 11: physics teachers and instruction in physics
Where teacher responses were available for 50 to 69 percent of students, an “s” is included.
Background Characteristics of Physics Teachers
This section presents information about the background characteristics of the teachers of physics, including gender, age, and years of teaching experience. As shown in Exhibit 11.1, in Armenia and the Russian Federation, 87 and 77 percent, respectively, of physics students were taught by female teachers. In the other countries, the majority of physics students were taught by men. Italy, with 44 percent female and 56 percent male, came closest to achieving gender parity. However, in Lebanon, the Netherlands, Norway, and Sweden, from 89 to 95 percent of the students had male teachers.
Exhibit 11.1 also presents teachers’ reports about their age and teaching experience. Perhaps the most striking feature of these results is that 38 to 47 percent of the physics students in Armenia, Italy, the Russian Federation, and Slovenia were taught by teachers who were at least 50 years old. In Lebanon, the Netherlands, Norway, and Sweden, the figure was from 57 to 64 percent. On the other hand, more than half of the Iranian students were taught by teachers less than 40 years old.
As might be expected, these physics students were taught by highly experienced teachers. Reported years of experience ranged from a low of 17 years in the Islamic Republic of Iran, who had a much larger proportion of younger teachers than was the case in other countries, to a high of 26 years in Lebanon. Teachers in the Netherlands, the Russian Federation, and Sweden, each with an average of 24 years, were nearly as experienced as the Lebanese teachers. In most countries, the teachers had been teaching physics throughout most of their teaching careers; but this was less often the case in Italy, the Russian Federation, and

327chapter 11: physics teachers and instruction in physics
Exhibit 11.1: Physics Teachers’ Gender, Age, and Number of Years Teaching
Country
Percent of Students by Teacher Characteristics Average Number of Years TeachingGender Age
Female Male 29 Years or Under
30–39 Years
40–49 Years
50 Years or Older
Teaching Altogether
Teaching Physics
Armenia 87 (2.2) 13 (2.2) 9 (1.9) 17 (3.6) 36 (4.0) 38 (3.4) 21 (0.3) 22 (0.3)
Iran, Islamic Rep. of 31 (2.5) 69 (2.5) 7 (2.5) 48 (4.6) 31 (3.9) 14 (2.5) 17 (0.6) 15 (0.6)
Italy 44 (4.9) 56 (4.9) 3 (1.6) 14 (4.6) 37 (5.3) 47 (5.4) 21 (0.8) 11 (0.6)
Lebanon 11 (1.9) 89 (1.9) 3 (0.9) 18 (1.7) 23 (2.4) 57 (2.5) 26 (0.5) 26 (0.4)
Netherlands 5 (2.1) 95 (2.1) 4 (1.9) 16 (4.4) 17 (3.6) 64 (5.9) 24 (1.4) 20 (1.3)
Norway 11 (2.9) 89 (2.9) 3 (1.9) 20 (3.5) 16 (3.7) 60 (4.8) 22 (1.2) 19 (1.3)
a Russian Federation 77 (3.4) 23 (3.4) 6 (2.8) 17 (3.6) 31 (4.3) 46 (4.6) 24 (0.9) 9 (0.7)
b Slovenia 27 (0.2) 73 (0.2) 7 (0.2) 14 (0.2) 36 (0.2) 42 (0.3) 20 (0.1) 13 (0.0)
Sweden 11 (3.0) 89 (3.0) 2 (1.4) 20 (3.1) 13 (3.0) 64 (4.1) 24 (1.1) 21 (1.1)
Data provided by teachers.
a Russian physics teachers teach physics for their entire career. The figure reported under “Years of Teaching Physics” refers to Physics at advanced level.
b Slovenian physics teachers teach physics for their entire career. The figure reported under “Years of Teaching Physics” refers to the advanced physics program introduced 13 years ago.
( ) Standard errors appear in parentheses. Because results are rounded to the nearest whole number, some totals may appear inconsistent.
SOU
RCE:
IEA
TIM
SS A
dvan
ced
2008
©
Exhibit 11.1 Physics Teachers’ Gender, Age, and Number of Years Teaching
Exhibit 11.2: Teachers’ Plans to Continue Teaching Physics
Country
Percent of Students by Their Teachers’ Plans to Continue Teaching
Plan to Continue Teaching as Long
as I Can
Plan to Continue Teaching Until the Opportunity for a
Better Job in Education
Comes Along
Plan to Continue Teaching for Awhile But
Probably Will Leave the Field
of Education
Undecided at This Time
Armenia 86 (0.2) 12 (0.2) 0 (0.0) 2 (0.0)
Iran, Islamic Rep. of 83 (3.4) 10 (2.7) 3 (1.6) 4 (1.9)
Italy 84 (3.9) 12 (3.5) 2 (1.1) 3 (1.5)
Lebanon 81 (2.0) 7 (1.5) 4 (0.9) 8 (1.2)
Netherlands 79 (4.8) 8 (3.3) 4 (2.0) 9 (2.9)
Norway 75 (4.5) 3 (1.6) 4 (2.1) 18 (3.7)
Russian Federation 65 (4.2) 3 (2.1) 11 (3.0) 20 (3.4)
Slovenia 69 (0.2) 1 (0.0) 3 (0.1) 27 (0.2)
Sweden 73 (3.4) 2 (1.3) 5 (2.0) 20 (2.9)
Data provided by teachers.
( ) Standard errors appear in parentheses. Because results are rounded to the nearest whole number, some totals may appear inconsistent.
SOU
RCE:
IEA
TIM
SS A
dvan
ced
2008
©
Exhibit 11.2 Teachers’ Plans to Continue Teaching Physics

328 chapter 11: physics teachers and instruction in physics
Slovenia, where teachers had significantly fewer years of experience teaching physics than of teaching generally.
Teachers were also asked about their plans for the future, insofar as teaching physics was concerned. The results, shown in Exhibit 11.2, indicate that most of the physics teachers in these countries plan to continue their teaching careers, although significant proportions in some countries—18 percent in Norway, 20 percent in the Russian Federation and Sweden, and 27 percent in Slovenia—were undecided about their future plans. Few teachers in any of these countries (less than 15 percent) indicated that they planned to leave the field of education or that they planned to look for a different position within the field of education. It appears that teachers of physics in these countries like their jobs and plan to continue in them at least for a while.
Teacher Education for Teaching Physics
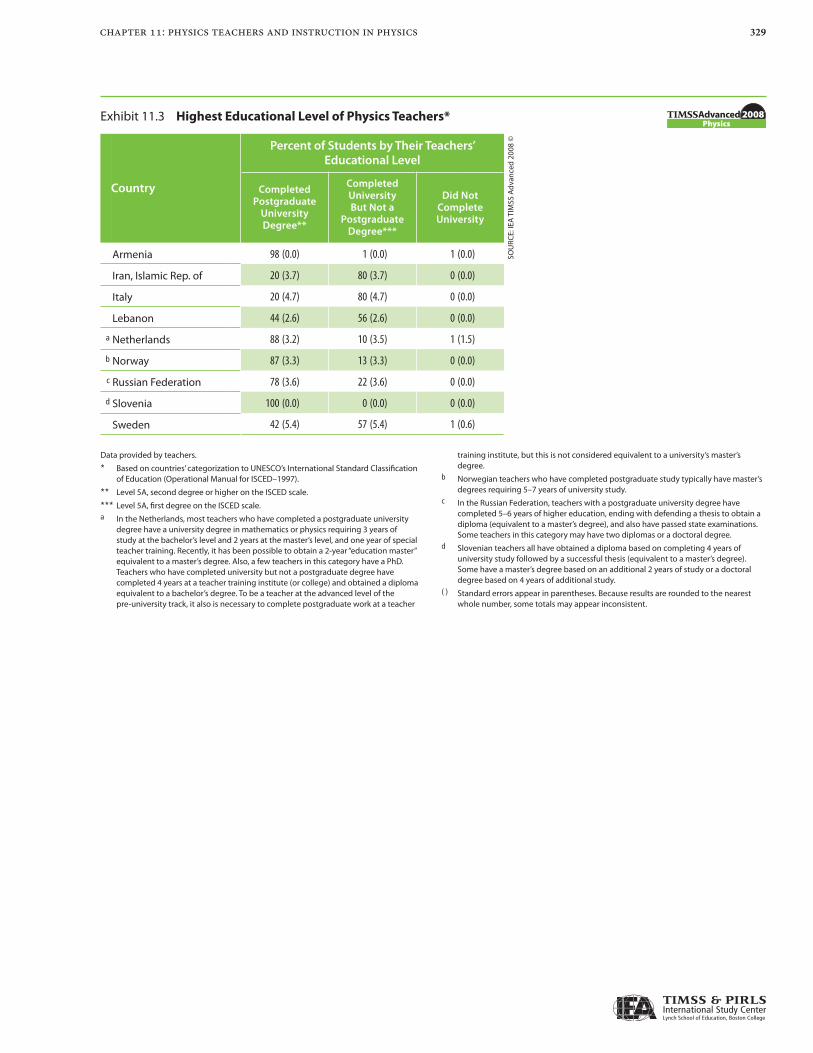
Exhibit 11.3 indicates that virtually every teacher of physics in these countries had a university degree, either at the undergraduate or graduate level. In Armenia and Slovenia, essentially all students (98 to 100%) were taught physics by a teacher with a postgraduate degree, and most were in the the Netherlands (88%), Norway (87%), and the Russian Federation (78%).
Teachers were asked to indicate which, from a list of several choices, had been a “major or main area(s) of study” for them in their post-secondary studies. The options available were physics, science education, engineering, general education, mathematics, mathematics education, and other. Teachers were free to identify more than one main area of study, so the percents for each country total more than 100.
329chapter 11: physics teachers and instruction in physics
Exhibit 11.3: Highest Educational Level of Physics Teachers*
Country
Percent of Students by Their Teachers’ Educational Level
Completed Postgraduate
University Degree**
Completed University But Not a
Postgraduate Degree***
Did Not Complete University
Armenia 98 (0.0) 1 (0.0) 1 (0.0)
Iran, Islamic Rep. of 20 (3.7) 80 (3.7) 0 (0.0)
Italy 20 (4.7) 80 (4.7) 0 (0.0)
Lebanon 44 (2.6) 56 (2.6) 0 (0.0)
a Netherlands 88 (3.2) 10 (3.5) 1 (1.5)
b Norway 87 (3.3) 13 (3.3) 0 (0.0)
c Russian Federation 78 (3.6) 22 (3.6) 0 (0.0)
d Slovenia 100 (0.0) 0 (0.0) 0 (0.0)
Sweden 42 (5.4) 57 (5.4) 1 (0.6)
Data provided by teachers.
* Based on countries’ categorization to UNESCO’s International Standard Classification of Education (Operational Manual for ISCED–1997).
** Level 5A, second degree or higher on the ISCED scale.
*** Level 5A, first degree on the ISCED scale.
a In the Netherlands, most teachers who have completed a postgraduate university degree have a university degree in mathematics or physics requiring 3 years of study at the bachelor’s level and 2 years at the master’s level, and one year of special teacher training. Recently, it has been possible to obtain a 2-year “education master” equivalent to a master’s degree. Also, a few teachers in this category have a PhD. Teachers who have completed university but not a postgraduate degree have completed 4 years at a teacher training institute (or college) and obtained a diploma equivalent to a bachelor’s degree. To be a teacher at the advanced level of the pre-university track, it also is necessary to complete postgraduate work at a teacher
training institute, but this is not considered equivalent to a university’s master’s degree.
b Norwegian teachers who have completed postgraduate study typically have master’s degrees requiring 5–7 years of university study.
c In the Russian Federation, teachers with a postgraduate university degree have completed 5–6 years of higher education, ending with defending a thesis to obtain a diploma (equivalent to a master’s degree), and also have passed state examinations. Some teachers in this category may have two diplomas or a doctoral degree.
d Slovenian teachers all have obtained a diploma based on completing 4 years of university study followed by a successful thesis (equivalent to a master’s degree). Some have a master’s degree based on an additional 2 years of study or a doctoral degree based on 4 years of additional study.
( ) Standard errors appear in parentheses. Because results are rounded to the nearest whole number, some totals may appear inconsistent.
SOU
RCE:
IEA
TIM
SS A
dvan
ced
2008
©
Exhibit 11.3 Highest Educational Level of Physics Teachers*

330 chapter 11: physics teachers and instruction in physics
Exhibit 11.4: Teachers’ Major or Main Area(s) of Study
Country
Percent of Students by Their Teachers’ Major or Main Area(s) of Study in Their Post-secondary Education
Physics Chemistry Biology Engineering Education – Science Mathematics Education –
MathematicsEducation–
General Other
Armenia 96 (0.4) 12 (2.2) 2 (1.8) 4 (2.9) 22 (3.3) 42 (2.9) 18 (1.2) 28 (1.4) 12 (1.1)
Iran, Islamic Rep. of 92 (2.2) 2 (1.2) 1 (0.5) 14 (2.9) 9 (2.9) 11 (3.0) 6 (2.5) 4 (1.8) 3 (1.2)
Italy 40 (5.6) 0 (0.0) 0 (0.0) 10 (3.7) – – 50 (5.8) – – – – 0 (0.0)
Lebanon 95 (0.6) 15 (1.6) 4 (1.0) 4 (0.7) 22 (1.6) 27 (2.0) 16 (1.5) 13 (1.3) 12 (1.0)
Netherlands 82 (4.0) 10 (3.0) 0 (0.0) 16 (4.0) 51 (4.9) 29 (4.8) 12 (3.2) – – 9 (2.4)
Norway 95 (2.4) 19 (4.3) 1 (0.4) 13 (2.4) 2 (1.5) 95 (2.2) 2 (1.5) 17 (3.1) 35 (5.2)
Russian Federation 98 (1.3) 1 (0.7) 1 (0.6) 20 (3.7) 36 (4.4) 38 (4.2) 14 (3.3) 39 (4.6) 10 (3.0)
Slovenia 86 (0.2) 3 (0.1) 0 (0.0) 10 (0.1) 8 (0.0) 4 (0.0) 8 (0.1) 0 (0.0) 3 (0.1)
Sweden 97 (1.5) 16 (3.5) 4 (2.7) 15 (4.0) 44 (4.9) 90 (2.9) 60 (4.7) 32 (5.6) 12 (3.6)
Data provided by teachers.
( ) Standard errors appear in parentheses.
A dash (–) indicates comparable data are not available.
SOU
RCE:
IEA
TIM
SS A
dvan
ced
2008
©
Exhibit 11.4 Teachers’ Major or Main Area(s) of Study
Exhibit 11.5: National Requirements for Being a Teacher of Physics
Country Requirements
Armenia Teachers need the Certificate of Higher Education.
Iran, Islamic Rep. of Teachers need at least a bachelor’s degree in physics.
ItalyTeachers need to have taken a national examination and completed a degree in mathematics, physics, or engineering.
LebanonTeachers must have a degree in physics, pass an admission examination to a Faculty of Pedagogy at Lebanese University, and complete 2 years of pedagogical study.
NetherlandsTeachers either have a university master’s degree in physics (or a related area) followed by a 1-year university education course, or have attended a polytechnic college obtaining a bachelor’s degree in physics (education) followed by a master’s course in physics education.
NorwayTeachers are required to have a university bachelor’s degree consisting of 1 full year (60 credit points) of physics courses. They also need 1 year of teacher education courses, consisting of general pedagogy, science education, and teaching practice in schools.
Russian FederationTeachers need the Certificate of Higher Education, with certificates of physics education and of professional development in advanced physics highly desirable.
Slovenia
To obtain a teaching license, it is necessary to complete physics study together with some pedagogical courses at the Faculty for Mathematics and Physics or the study of two educational science subjects (physics/mathematics, physics/chemistry) at the Faculty of Education and an additional 1 year course at the Faculty for Mathematics and Physics. They must also teach under supervision of a seminar teacher for 1 year, and pass a teaching certification examination organized by the ministry.
SwedenTeachers of the Physics B course are expected to have a major in physics (at least 2 years of university study in physics) and at least 1.5 years of an additional subject, most commonly mathematics. A degree in teacher education also is expected.
Data provided by National Research Coordinators.
SOU
RCE:
IEA
TIM
SS A
dvan
ced
2008
©
Exhibit 11.5 National Requirements for Being a Teacher of Physics

331chapter 11: physics teachers and instruction in physics
As is shown in Exhibit 11.4, 82 percent or more of the students in every country except Italy had teachers who had specialized in physics. In Italy, only 40 percent of students had teachers with physics as a major area of study, but 50 percent had teachers whose major area of study was mathematics. On the other hand, relatively few students were taught physics by teachers who indicated that they had science education as a major area of study in university. In Norway (95%) and Sweden (90%), substantial proportions of students had physics teachers who also had mathematics as a main area of their program.
Exhibit 11.5 presents brief descriptions of national requirements for being a teacher of physics in each of the countries. There is a high degree of commonality across all of these descriptions. Basically, teachers of physics in all of these countries are required to have an extensive tertiary level academic background in physics and in teacher education.
Physics Teachers’ Professional Activities and Development
Teachers in most countries have a choice of a number of professional or syndical organizations available to them. They may, as a condition of employment, be required to join, or at least pay membership dues to, the teachers’ union that bargains with their employers regarding salaries, working conditions, and the like. However, they may also choose to become members of a professional association, either local or national, that brings together teachers with similar backgrounds and interests to discuss professional matters and promote the cause of physics education, for example.
Teachers of physics who participated in this study were asked whether they belonged to a professional association of physics teachers and whether they participated regularly in activities sponsored by such organizations. As Exhibit 11.6 makes clear, the results were not very

332 chapter 11: physics teachers and instruction in physics
encouraging. In most countries less than half the students were taught physics by a teacher who belonged to a professional organization of physics teachers. Results regarding participation in professional activities were not any more encouraging. Apparently, many teachers of physics in these countries do not have the opportunity or see the need to join professional organizations or to participate in activities sponsored by them.
Participating teachers were presented with five statements relating to their participation in a range of professional activities. The activities included attending workshops or conferences, making a presentation at a workshop or conference, having an article published in a journal or magazine directed at teachers, taking part in an innovative project for curriculum and instruction, and exchanging information online about teaching physics. Students whose teachers had participated in three or more of these activities were categorized at the high level of participation. Those whose teachers had not participated in any of these activities were categorized at the low level, and all the rest were categorized at the medium level. This information is summarized in Exhibit 11.7. In the table, the countries are presented in descending order of the percentage of students whose teachers were classified at the high level of participation. Also, the results are presented in relation to students’ average achievement, although there appeared to be little relationship between more participation by teachers and students’ achievement except in Armenia.
In Slovenia, the Russian Federation, and Iran, no more than 10 percent of students were taught by teachers who were classified at the low level of participation in professional activities; the rest of the students in those countries, 90 percent or more, were taught by teachers who reported a high or medium level of participation. Results from the other countries were rather disappointing, with 17 percent of Italian

333chapter 11: physics teachers and instruction in physics
Exhibit 11.6: Teachers’ Participation in a Professional Organization for Physics Teachers
Country
Percent of Students Whose Teacher Was
a Member of a Professional
Organization for Physics Teachers
Percent of Students Whose
Teacher Regularly Participated in
Activities Sponsored by a Professional Organization for Physics Teachers
Armenia 41 (0.8) 60 (2.6)
Iran, Islamic Rep. of 42 (4.1) 33 (4.6)
Italy 22 (5.3) 37 (5.3)
Lebanon 25 (2.1) 33 (2.3)
Netherlands 74 (4.2) 46 (4.9)
Norway 39 (4.3) 7 (2.4)
Russian Federation 78 (3.1) 78 (2.7)
Slovenia 47 (0.2) 38 (0.2)
Sweden 30 (4.9) 17 (3.1)
Data provided by teachers. ( ) Standard errors appear in parentheses. SO
URC
E: IE
A T
IMSS
Adv
ance
d 20
08 ©
Exhibit 11.6 Teachers’ Participation in a Professional Organization for Physics Teachers
Exhibit 11.7: Index of Teachers’ Participation in Professional Activities in Physics (PAP)
CountryHigh PAP Medium PAP Low PAP
Percent of Students
Average Achievement
Percent of Students
Average Achievement
Percent of Students
Average Achievement
Slovenia 52 (0.2) 534 (2.9) 38 (0.2) 544 (3.0) 10 (0.2) 508 (3.9)
Russian Federation 41 (5.0) 533 (17.2) 51 (5.3) 516 (16.7) 8 (2.6) 491 (19.6)
Iran, Islamic Rep. of 24 (3.7) 453 (11.0) 67 (4.0) 462 (8.5) 10 (2.2) 461 (31.3)
Netherlands 21 (4.5) 574 (5.7) 55 (5.1) 584 (5.2) 23 (4.4) 589 (6.2)
Lebanon 19 (1.5) 460 (5.1) 48 (2.2) 439 (4.1) 33 (2.0) 441 (6.2)
Italy 18 (4.6) 429 (19.3) 65 (5.1) 417 (9.9) 17 (4.2) 445 (18.0)
Sweden 8 (2.3) 478 (24.0) 56 (4.8) 498 (7.3) 35 (4.8) 500 (6.4)
Armenia 5 (0.2) 502 (10.8) 70 (2.2) 500 (6.6) 25 (2.2) 479 (8.0)
Norway 4 (1.9) 532 (12.7) 49 (5.5) 530 (5.2) 47 (6.1) 538 (6.5)
Based on teachers’ responses to five statements about their participation in professional activities: 1) Attended a workshop or conference; 2) Gave a presentation at a workshop or conference; 3) Published an article in a journal or magazine for teachers (print or online); 4) Took part in an innovative project for curriculum and instruction; and 5) Exchanged information online about how to teach physics. Students whose teachers participated
in three or more of the five activities were assigned to the high level. Students whose teachers did not participate in any activities were assigned to the low level. All other students were assigned to the medium level.
( ) Standard errors appear in parentheses. Because results are rounded to the nearest whole number, some totals may appear inconsistent.
SOU
RCE:
IEA
TIM
SS A
dvan
ced
2008
©
Exhibit 11.7 Index of Teachers’ Participation in Professional Activities in Physics (PAP)

334 chapter 11: physics teachers and instruction in physics
students, about one fourth of Dutch and Armenian students, about one third of Lebanese and Swedish students, and nearly half the Norwegian students taught by teachers who had low levels of participation.
Another questionnaire item asked teachers whether or not they had participated in professional development in one or more of six areas related to physics teaching in the previous two years. The areas were: physics content, physics pedagogy or instruction, physics curriculum, integrating information technology into physics, improving students’ critical thinking or problem-solving skills, and physics assessment.
The results presented in Exhibit 11.8 indicate that in seven of the nine countries (everywhere except Lebanon and the Russian Federation) the most common professional development areas for teachers focused on either physics content, physics pedagogy and instruction, or physics curriculum. The least common professional development areas in most countries focused on physics assessment strategies or improving students’ critical thinking and problem-solving skills. In general, greater percentages of students in Armenia, the Russian Federation, and Slovenia were taught by teachers who had participated in one or more of these professional development activities within the past two years than in the other six countries. The teachers of Italian students reported the lowest levels of participation.
Previous cycles of TIMSS have shown that the extent of professional collaboration among teachers in the same school varies widely across countries, and Exhibit 11.9 shows that this was the case with physics teachers at this level. On a positive note, results show that about half the students or more in every country were taught by teachers who consulted with colleagues in their school about pedagogical matters several times each month. In fact, in five countries, at least 80 percent of the students had teachers that met with their colleagues at least several times a month or even weekly. On the other hand, from 35 to

335chapter 11: physics teachers and instruction in physics
Exhibit 11.8: Teachers’ Participation in Professional Development
Country
Percent of Students Whose Teachers Participated in Professional Development in Various Areas of Physics in the Past Two Years
Physics ContentPhysics
Pedagogy/Instruction
Physics Curriculum
Integrating Information
Technology into Physics
Improving Students’ Critical
Thinking or Problem-solving
Skills
Physics Assessment
Armenia 69 (1.4) 69 (2.9) 81 (2.1) 30 (0.6) 46 (2.0) 40 (1.5)
Iran, Islamic Rep. of 62 (4.2) 70 (3.4) 41 (4.2) 34 (4.8) 24 (3.9) 29 (4.0)
Italy 49 (5.9) 43 (4.8) 16 (4.2) 23 (4.7) 20 (3.5) 4 (2.2)
Lebanon 36 (2.3) 40 (2.3) 30 (1.7) 37 (2.4) 36 (2.2) 49 (2.2)
Netherlands 41 (4.2) 42 (4.7) 33 (5.0) 36 (6.1) 13 (3.4) 15 (4.5)
Norway 59 (5.4) 31 (4.5) 46 (4.7) 40 (5.0) 2 (1.5) 12 (3.1)
Russian Federation 60 (4.9) 70 (4.6) 64 (4.0) 78 (3.8) 37 (4.1) 49 (4.6)
Slovenia 89 (0.2) 81 (0.2) 60 (0.3) 69 (0.3) 42 (0.2) 46 (0.3)
Sweden 63 (4.9) 32 (5.2) 17 (3.7) 22 (2.9) 10 (2.6) 24 (5.8)
Data provided by teachers. ( ) Standard errors appear in parentheses.
SOU
RCE:
IEA
TIM
SS A
dvan
ced
2008
©
Exhibit 11.8 Teachers’ Participation in Professional Development
Exhibit 11.9: Frequency of Collaboration Among Physics Teachers
Country
Percent of Students by Their Teachers’ Frequency of Collaboration with Other Teachers
At Least Weekly 2 or 3 Times per Month
Never or Almost Never
Armenia 42 (1.8) 56 (1.9) 2 (0.1)
Iran, Islamic Rep. of 8 (2.1) 55 (4.3) 37 (4.2)
Italy 5 (2.5) 49 (5.4) 46 (5.5)
Lebanon 21 (1.8) 61 (2.4) 18 (2.1)
Netherlands 4 (2.0) 61 (5.5) 35 (5.2)
Norway 6 (2.4) 74 (4.6) 20 (4.2)
Russian Federation 46 (3.6) 49 (3.5) 5 (1.7)
Slovenia 7 (0.1) 50 (0.3) 43 (0.3)
Sweden 23 (4.6) 67 (4.6) 10 (2.1)
Based on teachers’ responses to four statements about types of interactions among physics teachers: discussion about how to teach a particular concept, working on preparing instruction materials, visit to another teachers’ classroom to observe his/her teaching, and informal observation of my classroom by another teacher. Responses were
provided on a 4-point Likert scale: 1) Never or almost never; 2) 2 or 3 times per month; 3) 1–3 times per week; 4) Daily or almost daily.
( ) Standard errors appear in parentheses. Because results are rounded to the nearest whole number, some totals may appear inconsistent.
SOU
RCE:
IEA
TIM
SS A
dvan
ced
2008
©
Exhibit 11.9 Frequency of Collaboration Among Physics Teachers
336 chapter 11: physics teachers and instruction in physics
46 percent of students in Iran, Italy, the Netherlands, and Slovenia were taught by teachers who rarely, if ever, consulted with colleagues in their school about pedagogical matters such as how to teach a particular concept, worked collegially to prepare instructional materials, observed a colleague’s teaching, or invited a colleague to observe their teaching.
Exhibit 11.10 presents school principals’ reports about how teachers of physics were evaluated in each of the participating countries. The results are shown in terms of the percentage of students in each country taught by teachers who were evaluated on the basis of classroom observations by the school principal or a senior staff member, classroom observations by an external examiner or inspector, student achievement, or teacher peer reviews.
Evaluation of teachers on the basis of their students’ achievement is frequently portrayed, by teachers and others, as inherently unjust since it does not take into account individual differences in students’ abilities, work habits, and the like. In spite of such opposition, for these teachers of advanced students, it was by far the most commonly used approach for teacher evaluation in the TIMSS Advanced countries. At least three fourths of students in every one of the participating countries were taught by teachers who were being evaluated, at least in part, on the basis of how well those students performed in physics. The second most popular approach to teacher evaluation was classroom observations by the school principal or a senior staff member. Classroom observations by inspectors and peer reviews were less widely used. There appeared to be less emphasis given to teacher evaluation in the Netherlands and Norway than in the other participating countries, and more in Armenia and the Russian Federation.

337chapter 11: physics teachers and instruction in physics
Exhibit 11.10: Schools’ Reports on Ways They Evaluate Physics Teachers’ Practices
Country
Percent of Students by Ways Their Schools Evaluate Physics Teachers’ Practice
Observations by the Principal or
Senior Staff
Observations by Inspectors or
Other Persons External to the
School
Student Achievement
Teacher Peer Review
Armenia 96 (0.4) 45 (0.7) 96 (0.1) 91 (0.4)
Iran, Islamic Rep. of 74 (4.5) 43 (5.2) 98 (1.4) 41 (5.1)
Italy 72 (5.5) 3 (2.5) 92 (3.0) 39 (6.3)
Lebanon 89 (1.9) 43 (2.4) 95 (1.0) 60 (2.3)
Netherlands 37 (5.6) 27 (4.6) 86 (3.7) 37 (6.0)
Norway 24 (5.6) 0 (0.0) 81 (3.8) 46 (5.7)
Russian Federation 99 (1.0) 65 (4.8) 99 (0.7) 89 (2.5)
Slovenia 86 (0.2) 7 (0.2) 75 (0.2) 45 (0.2)
Sweden 63 (5.0) 8 (3.2) 88 (3.9) 49 (6.3)
Data provided by schools. ( ) Standard errors appear in parentheses.
SOU
RCE:
IEA
TIM
SS A
dvan
ced
2008
©
Exhibit 11.10 Schools’ Reports on Ways They Evaluate Physics Teachers’ Practices
338 chapter 11: physics teachers and instruction in physics
Characteristics of Physics Classes
Exhibit 11.11 addresses the issue of class size and the relationship between class size and student achievement in physics, using data supplied by the participating teachers about their TIMSS Advanced 2008 physics classes. The table first shows the average size of a participating physics class in each country. The rest of the table is divided into four sections, one for each of four ranges of class size: viz., 1–24 students, 25–32 students, 33–40 students, and over 40 students. For each of the four class-size categories, the table indicates the percentage of students in that country who were in a physics class within that size range and the average TIMSS Advanced 2008 physics scale score for those students.
Only in the Islamic Republic of Iran was the average class size as large as 32, and in the rest of the countries it was 25 or less. The smallest average class size, 17 students, was found in the Netherlands and Norway. The finding of relatively small class sizes is further illustrated by the fact that hardly any students were in classes with 33 or more students, although 29 percent of Iranian students were in classes with more than 40 students. There was a relationship between class size and students’ average achievement in Armenia, Italy, and the Netherlands, with students in smaller classes having higher average physics achievement. However, the results were not consistent in the other countries.
Many factors are known to present challenges to effective teaching, including the student composition of the classes. The teachers of physics were asked to estimate to what extent five student-related factors limited their approaches to teaching. The five factors were: students with different academic abilities, students who came from a wide range of backgrounds, students with special needs, uninterested students, and disruptive students. Responses were given on a 4-point

339chapter 11: physics teachers and instruction in physics
Exhibit 11.11: Achievement and Class Size for Physics Instruction
Country
Overall Average
Class Size
1–24 Students 25–32 Students 33–40 Students 41 or More Students
Percent of Students
Average Achievement
Percent of Students
Average Achievement
Percent of Students
Average Achievement
Percent of Students
Average Achievement
Armenia r 25 (0.2) 43 (4.7) 514 (12.1) 48 (4.7) 480 (8.4) 9 (0.1) 445 (21.1) 0 (0.0) ~ ~
Iran, Islamic Rep. of 32 (1.1) 28 (3.6) 437 (9.2) 31 (4.4) 479 (13.9) 12 (3.2) 448 (23.9) 29 (4.3) 466 (16.2)
Italy 21 (0.4) 80 (5.1) 431 (8.5) 20 (5.1) 395 (15.1) 0 (0.0) ~ ~ 0 (0.0) ~ ~
Lebanon 18 (0.2) 78 (1.0) 446 (3.6) 14 (0.9) 435 (4.7) 4 (0.1) 445 (9.4) 4 (0.1) 420 (5.1)
Netherlands 17 (0.6) 88 (4.1) 586 (3.2) 12 (4.1) 558 (13.6) 0 (0.0) ~ ~ 0 (0.0) ~ ~
Norway 17 (0.4) 88 (3.6) 533 (4.6) 12 (3.6) 539 (9.6) 0 (0.0) ~ ~ 0 (0.0) ~ ~
Russian Federation 22 (0.3) 63 (4.3) 514 (11.3) 37 (4.3) 533 (15.4) 0 (0.0) ~ ~ 0 (0.0) ~ ~
Slovenia 23 (0.0) 51 (0.3) 526 (2.6) 38 (0.2) 547 (2.9) 7 (0.1) 538 (8.6) 3 (0.0) 607 (8.1)
Sweden 22 (0.5) 61 (5.1) 497 (6.7) 38 (5.0) 499 (10.0) 1 (1.0) ~ ~ 0 (0.0) ~ ~
Data provided by teachers.
( ) Standard errors appear in parentheses. Because results are rounded to the nearest whole number, some totals may appear inconsistent.
A tilde (~) indicates insufficient data to report achievement.
An “r” indicates data are available for at least 70% but less than 85% of the students.
SOU
RCE:
IEA
TIM
SS A
dvan
ced
2008
©
Exhibit 11.11 Achievement and Class Size for Physics Instruction
Exhibit 11.12: Index of Student Factors Limiting Instruction in Physics
Country
High (Few or No Limitations)
Medium (Some Limitations)
Low (Many Limitations)
Percent of Students
Average Achievement
Percent of Students
Average Achievement
Percent of Students
Average Achievement
Norway 54 (5.4) 534 (5.0) 44 (5.4) 533 (5.7) 2 (1.7) ~ ~
Sweden 45 (5.2) 516 (6.2) 51 (5.4) 485 (6.8) 4 (1.4) 451 (34.7)
Netherlands 43 (6.0) 591 (5.5) 54 (6.0) 577 (5.3) 2 (1.8) ~ ~
Slovenia 34 (0.3) 541 (3.7) 55 (0.3) 537 (2.9) 11 (0.2) 507 (4.8)
Lebanon 30 (1.9) 455 (4.8) 56 (2.5) 438 (4.0) 14 (1.8) 433 (10.6)
Armenia r 23 (0.7) 470 (19.5) 58 (0.7) 509 (6.5) 19 (0.5) 498 (9.6)
Russian Federation 22 (4.1) 551 (18.9) 59 (4.8) 508 (13.8) 20 (3.8) 524 (24.8)
Iran, Islamic Rep. of 21 (3.8) 492 (17.1) 60 (4.6) 464 (10.2) 20 (3.6) 415 (11.1)
Italy 17 (4.0) 464 (17.4) 71 (4.9) 417 (9.7) 12 (3.4) 413 (15.6)SO
URC
E: IE
A T
IMSS
Adv
ance
d 20
08 ©
Exhibit 11.12 Index of Student Factors Limiting Instruction in Physics
Based on teachers’ responses to five statements about student factors limiting physics instruction: 1) Students with different academic abilities; 2) Students who come from a wide range of backgrounds; 3) Students with special needs; 4) Uninterested students; and 5) Disruptive students. Responses were provided on a 4-point scale: 1. Not at all; 2. A little; 3. Some; and 4. A lot. Students in the high category had teachers who reported few (if any) limitations, on average (less than 2), and those in the low category had teachers that reported their instruction was limited a lot, on average (greater than 3). The remaining students fell into the medium category.
( ) Standard errors appear in parentheses. Because results are rounded to the nearest whole number, some totals may appear inconsistent.
A tilde (~) indicates insufficient data to report achievement.
An “r” indicates data are available for at least 70% but less than 85% of the students.
340 chapter 11: physics teachers and instruction in physics
scale: not at all, a little, some, and a lot. TIMSS Advanced used the teachers’ responses to construct an Index of Student Factors Limiting Instruction in Physics. Students were included in the high category, if, on average, their teacher reported that their classroom was impacted only a little (if at all), and in the low category if, on average, these factors impacted instruction at least somewhat. The remaining students constituted the medium category.
The results are presented in Exhibit 11.12. In the table, the countries are presented in descending order of the percentage of students in the high category. Considering that the students taking physics are a select group and are in relatively small classes, it might be surprising that teachers said the composition of their classes did limit their teaching at least somewhat for substantial percentages of students. In general, students in the high category had higher achievement than students in the medium and low categories, but this was not the case in all countries. Results showed that no more than 20 percent of the students in all countries were taught by teachers who felt that these five student-related factors constituted major limitations on their instruction. However, except for Norway with 54 percent of students in the high category, the majority of students in the rest of the participating countries were in the medium category where teachers reported some limitations on their instruction.
Activities in Physics Lessons
Exhibits 11.13 and 11.14 summarize reports by students and their teachers, respectively, about the frequency of occurrence of seven instructional activities related to thinking skills covered in the TIMSS Advanced 2008 physics cognitive domains. The activities included watching the teacher demonstrate an experiment or investigation, conducting an experiment or investigation, using laws

341chapter 11: physics teachers and instruction in physics
Exhibit 11.13: Students’ Reports on Frequency of Various Learning Activities in Physics Lessons
Country
Percent of Students Who Reported Doing the Activity in About Half the Lessons or More
Watch the Teacher
Demonstrate an
Experiment or
Investigation
Conduct an Experiment
or Investigation
Use Laws and Formulas of Physics to Solve
Problems
Give Explanations About What
We Are Studying
Relate What We Are
Learning in Physics to Daily Lives
Memorize Formulas and
Procedures of Physics
Read Our Physics
Textbooks and Other Resource Materials
Watch the Teacher
Demonstrate Physics on a
Computer
Armenia 34 (2.1) r 22 (2.2) r 78 (2.3) r 73 (2.5) r 42 (2.6) r 64 (3.1) r 43 (2.3) r 12 (1.8)
Iran, Islamic Rep. of 19 (1.3) 12 (1.0) 89 (0.8) 56 (1.6) 40 (1.3) 79 (1.0) 73 (1.3) 5 (0.8)
Italy 15 (1.8) 12 (2.0) 78 (1.6) 61 (2.4) 24 (2.0) 56 (2.0) 32 (2.3) 6 (1.9)
Lebanon – – – – – – – – – – – – – – – –
Netherlands 11 (1.6) 3 (0.6) 87 (1.1) 32 (1.8) 20 (1.4) 26 (1.3) 51 (2.2) 10 (1.5)
Norway 14 (1.6) 4 (0.6) 92 (0.8) 45 (2.0) 29 (1.7) 18 (1.7) 36 (2.1) 13 (1.4)
Russian Federation 23 (1.3) 9 (0.9) 94 (0.7) 77 (1.5) 41 (1.6) 74 (1.4) 53 (1.9) 21 (2.9)
Slovenia 41 (1.3) 19 (1.1) 76 (1.1) 79 (1.2) 51 (1.7) 20 (1.3) 11 (0.8) 37 (1.2)
Sweden 54 (2.3) 25 (1.8) 81 (1.3) 38 (1.5) 27 (1.7) 22 (1.4) 45 (2.0) 11 (1.8)
Data provided by students.
( ) Standard errors appear in parentheses.
A dash (–) indicates comparable data are not available.
An “r” indicates data are available for at least 70% but less than 85% of the students.
SOU
RCE:
IEA
TIM
SS A
dvan
ced
2008
©
Exhibit 11.13 Students’ Reports on Frequency of Various Learning Activities in Physics Lessons
Exhibit 11.14: Teachers’ Reports on Frequency of Various Learning Activities in Physics Lessons
Country
Percent of Students Whose Teachers Reported Students Doing the Activity in About Half the Lessons or More
Watch Me Demonstrate
an Experiment or
Investigation
Conduct an Experiment
or Investigation
Use Laws and Formulas of
Physics to Solve
Problems
Give Explanations
About Something
They Are Studying
Relate What They Are
Learning in Physics to Daily Lives
Have Students Memorize
Formulas and Procedures
Read Their Textbooks or
Other Resource Materials
Armenia r 26 (0.7) r 15 (0.3) r 95 (0.1) r 97 (0.0) r 83 (0.3) r 62 (0.7) r 59 (1.9)
Iran, Islamic Rep. of 59 (4.5) 26 (4.2) 85 (3.7) 73 (3.8) 73 (3.7) 59 (4.2) 89 (3.0)
Italy 11 (3.1) 10 (3.1) 82 (5.2) 90 (2.9) 46 (5.8) 15 (3.5) 55 (5.3)
Lebanon 43 (2.0) 30 (2.3) 89 (1.4) 82 (1.3) 81 (1.8) 61 (2.5) 63 (2.4)
Netherlands 28 (4.6) 2 (1.5) 90 (2.8) 31 (5.4) 33 (4.6) 14 (3.8) 41 (5.0)
Norway 24 (4.1) 6 (2.2) 82 (3.7) 56 (5.6) 45 (5.3) 19 (4.9) 30 (4.1)
Russian Federation 48 (4.6) 19 (3.5) 100 (0.3) 91 (2.9) 75 (3.0) 53 (4.3) 26 (3.8)
Slovenia 50 (0.2) 15 (0.2) 77 (0.2) 20 (0.2) 60 (0.2) 5 (0.1) 10 (0.2)
Sweden 72 (4.7) 29 (4.7) 52 (5.6) 66 (5.0) 38 (4.4) 4 (1.6) 16 (4.2)
Background data provided by teachers.
( ) Standard errors appear in parentheses.
An “r” indicates data are available for at least 70% but less than 85% of the students.
SOU
RCE:
IEA
TIM
SS A
dvan
ced
2008
©
Exhibit 11.14 Teachers’ Reports on Frequency of Various Learning Activities in Physics Lessons

342 chapter 11: physics teachers and instruction in physics
and formulas of physics to solve problems, giving explanations about something students are studying, relating what students are learning in physics to their daily lives, memorizing formulas and procedures, and reading physics textbooks and other resource materials. Students were also asked about how frequently they watched the teacher demonstrate physics on a computer. The data in Exhibit 11.13 are the percentages of students reporting that an activity occurred in at least half the lessons in their physics class, and the data in Exhibit 11.14 are the percentages of students whose teachers reported the activity occurred in at least half the lessons.
Using the laws and formulas of physics to solve problems was the activity most often identified by students as occurring in at least half of their physics classes. According to their reports, this activity occurred this frequently for 76 to 94 percent of the students (data are not available for Lebanon for this question). In Armenia, the Russian Federation, and Slovenia, about three fourths of students also reported that giving explanations about what they were learning was a prevalent activity, as did students in Iran and the Russian Federation for memorizing, and students in Iran for reading the textbook. Interestingly, in Norway, 92 percent of the students reported using the laws and formulas of physics to solve problems in half or more of their physics classes, and the next highest was 45 percent for being asked to give explanations. Conducting an experiment or investigation or watching the teacher demonstrate physics on a computer were selected by the smallest proportions of students in every country.
Exhibit 11.14 shows that, according to teachers, most students were asked to use the laws and formulas of physics to solve problems in half or more of their classes, and except in the Netherlands and Slovenia, the majority of students were asked to give explanations about the topic being studied. Also, 60 percent or more were asked to
343chapter 11: physics teachers and instruction in physics
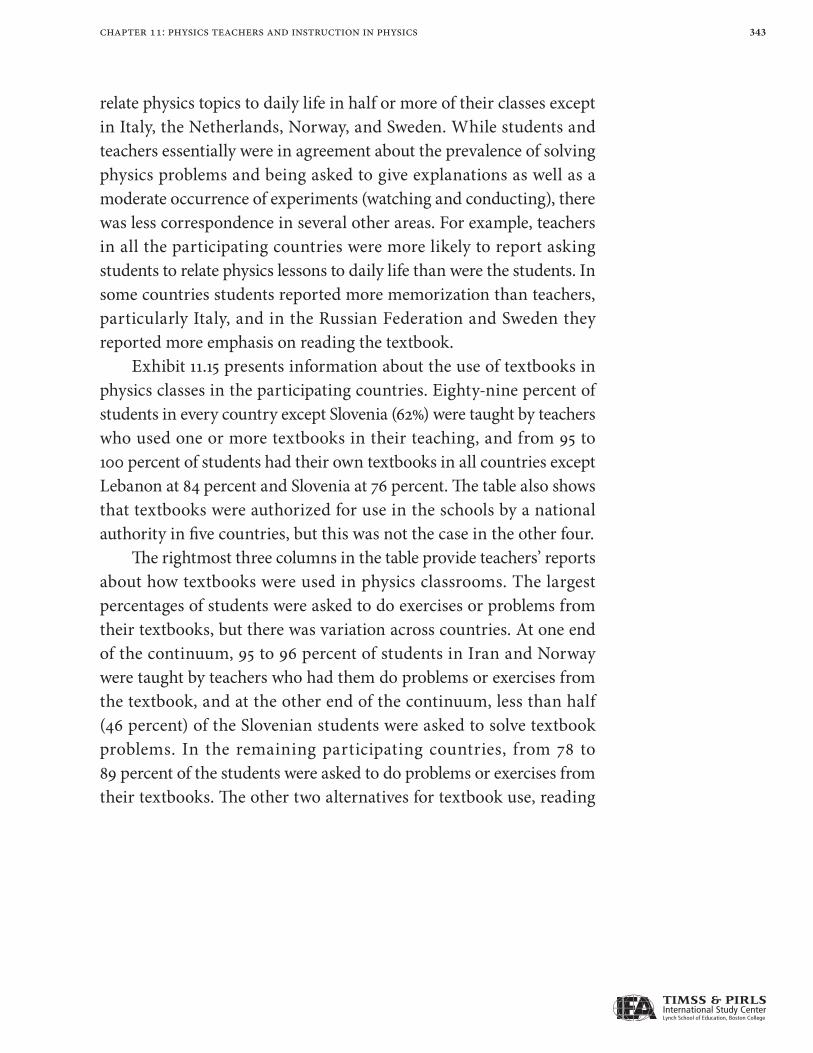
relate physics topics to daily life in half or more of their classes except in Italy, the Netherlands, Norway, and Sweden. While students and teachers essentially were in agreement about the prevalence of solving physics problems and being asked to give explanations as well as a moderate occurrence of experiments (watching and conducting), there was less correspondence in several other areas. For example, teachers in all the participating countries were more likely to report asking students to relate physics lessons to daily life than were the students. In some countries students reported more memorization than teachers, particularly Italy, and in the Russian Federation and Sweden they reported more emphasis on reading the textbook.
Exhibit 11.15 presents information about the use of textbooks in physics classes in the participating countries. Eighty-nine percent of students in every country except Slovenia (62%) were taught by teachers who used one or more textbooks in their teaching, and from 95 to 100 percent of students had their own textbooks in all countries except Lebanon at 84 percent and Slovenia at 76 percent. The table also shows that textbooks were authorized for use in the schools by a national authority in five countries, but this was not the case in the other four.
The rightmost three columns in the table provide teachers’ reports about how textbooks were used in physics classrooms. The largest percentages of students were asked to do exercises or problems from their textbooks, but there was variation across countries. At one end of the continuum, 95 to 96 percent of students in Iran and Norway were taught by teachers who had them do problems or exercises from the textbook, and at the other end of the continuum, less than half (46 percent) of the Slovenian students were asked to solve textbook problems. In the remaining participating countries, from 78 to 89 percent of the students were asked to do problems or exercises from their textbooks. The other two alternatives for textbook use, reading

344 chapter 11: physics teachers and instruction in physics
Exhibit 11.15: Policy and Usage of Textbooks
Country
Textbooks Certified by
National Authority
Percent of StudentsPercent of Students Whose Teachers
Require Them to Do the Following Activities in Half of the Lessons or More
Whose Teachers Use Textbooks
for Teaching
Who Have Their Own Textbooks
Do Problems or Exercises from
Their Textbooks
Read the Textbook
Examples of How to Do Problems
or Exercises
Read About Physics Theory
from Their Textbooks
Armenia k r 89 (0.3) r 95 (0.1) r 78 (0.4) r 70 (1.6) r 48 (0.8)
Iran, Islamic Rep. of k 95 (1.9) 99 (0.5) 96 (1.5) 90 (2.9) 82 (3.4)
Italy j 99 (1.2) 97 (2.0) 82 (4.8) 60 (5.2) 69 (4.1)
Lebanon k 89 (2.0) 84 (1.7) 89 (1.8) 70 (2.3) 73 (2.3)
Netherlands j 100 (0.0) 100 (0.0) 89 (3.2) 52 (5.4) 62 (5.1)
Norway j 100 (0.0) 100 (0.0) 95 (2.2) 54 (4.7) 47 (5.2)
Russian Federation k 90 (2.8) 96 (1.2) 83 (3.4) 51 (4.3) 56 (4.6)
Slovenia k 62 (0.2) 76 (0.2) 46 (0.2) 17 (0.2) 29 (0.2)
Sweden j 100 (0.3) 100 (0.4) 84 (4.5) 31 (3.9) 42 (5.3)
Data provided by National Research Coordinators and by teachers.
( ) Standard errors appear in parentheses.
An “r” indicates data are available for at least 70% but less than 85% of the students.
k Yes j No
SOU
RCE:
IEA
TIM
SS A
dvan
ced
2008
©
Exhibit 11.15 Policy and Usage of Textbooks
345chapter 11: physics teachers and instruction in physics
examples of problem or exercise solutions provided in the textbook and reading about physics theory from the textbook, were required for much smaller percentages of students except in Iran.
The final exhibit in this section, Exhibit 11.16, focuses on the percent of class time allocated by teachers of physics to each of several activities. The activities listed were teaching new material to the whole class, students working on problems or exercises either on their own or with other students, reviewing and summarizing what has been taught for the whole class, reviewing homework, reteaching and clarifying content or procedures for the whole class, oral or written tests or quizzes, classroom management tasks not related to the content or purpose of the lesson, and other activities. In responding to this item, teachers were asked to ensure that the total across all eight categories of activities came to 100 percent.
For students in the participating countries, the first two categories—teaching new material to the class as a whole and students working on their own or with other students—accounted for from 42 to 65 percent of the time in physics classes. The next biggest category was test and quizzes (from 11 to 20 percent of the time), except in the Netherlands, Norway, and Sweden. The three categories of reviewing what had been taught, reviewing homework, and reteaching and clarifying content/procedures each accounted for a range of from 5–6 to 11–13 percent of the time. Very little time was taken up with classroom management tasks, at most 6 percent, and the “other” category also accounted for only a small proportion of time.

346 chapter 11: physics teachers and instruction in physics
Exhibit 11.16: Teachers’ Reports of the Percent of Time in Physics Lessons Spent on Various Activities in a Typical Week
CountryTeaching New Material to the
Whole Class
Students Working on Problems on Their
Own or with Other Students
Reviewing and Summarizing What
Has Been Taught for the Whole Class
Reviewing Homework
Armenia r 29 (0.2) r 19 (0.2) r 11 (0.3) r 8 (0.1)
Iran, Islamic Rep. of 40 (1.8) 17 (0.9) 8 (0.6) 8 (0.5)
Italy 30 (1.1) 12 (0.9) 10 (0.4) 10 (0.8)
Lebanon 27 (0.7) 19 (0.6) 11 (0.3) 10 (0.4)
Netherlands 33 (1.7) 28 (1.4) 9 (0.7) 13 (1.3)
Norway 31 (1.4) 34 (1.4) 8 (0.3) 8 (0.8)
Russian Federation 31 (0.9) 24 (0.9) 10 (0.4) 8 (0.3)
Slovenia 46 (0.1) 17 (0.1) 6 (0.0) 5 (0.0)
Sweden 36 (1.6) 25 (1.2) 11 (0.8) 5 (0.5)
Country
Reteaching and Clarifying Content/
Procedures for the Whole Class
Oral or Written Tests or Quizzes
Classroom Management Tasks
Not Related to the Lesson’s
Content/Purpose (e.g., Interruptions
and Keeping Order)
Other Activities
Armenia r 12 (0.3) r 13 (0.4) r 5 (0.0) r 3 (0.1)
Iran, Islamic Rep. of 7 (0.5) 11 (0.7) 5 (0.4) 4 (0.4)
Italy 10 (0.6) 20 (1.0) 3 (0.4) 4 (0.6)
Lebanon 10 (0.3) 12 (0.3) 6 (0.3) 5 (0.2)
Netherlands 8 (0.6) 2 (0.3) 4 (0.5) 5 (0.7)
Norway 6 (0.5) 8 (0.4) 1 (0.2) 4 (0.6)
Russian Federation 9 (0.5) 13 (0.6) 2 (0.3) 3 (0.4)
Slovenia 8 (0.0) 11 (0.0) 3 (0.0) 4 (0.0)
Sweden 9 (0.4) 6 (0.5) 2 (0.5) 5 (1.1)
Data provided by teachers.
( ) Standard errors appear in parentheses. Because results are rounded to the nearest whole number, some totals may appear inconsistent.
An “r” indicates data are available for at least 70% but less than 85% of the students. SO
URC
E: IE
A T
IMSS
Adv
ance
d 20
08 ©
Exhibit 11.16 Teachers’ Reports of the Percent of Time in Physics Lessons Spent on Various Activities in a Typical Week

347chapter 11: physics teachers and instruction in physics
Technology Use in Physics Classes
Exhibit 11.17 focuses on the extent to which different technologies were used in physics classes in the participating countries. The exhibit is divided into three parts with the first part dealing with calculators, the second with computers, and the third with other computing technology. Students were asked to indicate how frequently each of the three was used: in every or almost every lesson, in about half the lessons, in some lessons, or never. The table shows, for each country and for each frequency-of-usage category, the percent of students who chose that category and the average physics achievement for those students.
There was a considerable range in students’ reports about the frequency of using calculators in physics lessons. Ninety-two percent of the Norwegian students and 81 percent of the Dutch students reported that they used calculators in every or almost every lesson, as did about three fourths of the Slovenian and Swedish students. In Italy, Lebanon, and the Russian Federation, most students (68 to 90%) used calculators at least as frequently as in half their lessons. Calculators were used much less frequently in Armenia and Iran, where 16 and 21 percent, respectively, reported that they never used calculators in their physics classes.
Across countries, there was a general pattern for students with higher average achievement to report more calculator usage, although the results across usage categories were inconsistent. In Italy, the Netherlands, Norway, the Russian Federation, and Sweden, where calculators were used by students at least in some lessons, there was a relationship between more frequent use of calculators and higher achievement. In these countries, students reporting calculator use in every lesson had the highest achievement followed by those using calculators in half the lessons, and then, only some lessons.

348 chapter 11: physics teachers and instruction in physics
Exhibit 11.17: Students' Reports of Frequency of Using Different Technologies in Physics Lessons
Country
Frequency of Using Calculators
Every or Almost Every Lesson
About Half the Lessons Some Lessons Never
Percent of Students
Average Achievement
Percent of Students
Average Achievement
Percent of Students
Average Achievement
Percent of Students
Average Achievement
Armenia r 33 (2.2) 504 (7.8) 15 (1.3) 505 (12.5) 36 (2.0) 497 (7.5) 16 (2.0) 457 (12.1)
Iran, Islamic Rep. of 13 (1.1) 409 (8.3) 26 (1.3) 438 (7.8) 40 (1.4) 462 (8.3) 21 (1.6) 515 (10.9)
Italy 43 (2.6) 446 (8.1) 25 (1.7) 423 (10.1) 26 (2.0) 395 (12.9) 6 (1.0) 363 (12.2)
Lebanon 69 (1.3) 445 (3.4) 21 (1.0) 451 (5.7) 9 (0.7) 438 (8.5) 1 (0.3) ~ ~
Netherlands 81 (1.8) 587 (3.6) 14 (1.3) 568 (5.6) 5 (0.8) 566 (10.6) 1 (0.3) ~ ~
Norway 92 (1.0) 538 (4.2) 6 (0.9) 509 (10.3) 2 (0.3) ~ ~ 0 (0.2) ~ ~
Russian Federation 62 (2.2) 542 (9.8) 21 (1.3) 511 (11.1) 15 (1.5) 463 (18.3) 2 (0.3) ~ ~
Slovenia 78 (1.1) 537 (2.7) 16 (1.0) 528 (6.9) 5 (0.7) 534 (13.5) 1 (0.3) ~ ~
Sweden 76 (2.5) 500 (5.8) 15 (1.4) 494 (9.8) 8 (1.6) 490 (16.2) 1 (0.2) ~ ~
Country
Frequency of Using Computers
Every or Almost Every Lesson
About Half the Lessons Some Lessons Never
Percent of Students
Average Achievement
Percent of Students
Average Achievement
Percent of Students
Average Achievement
Percent of Students
Average Achievement
Armenia r 3 (0.7) 458 (22.6) 3 (0.6) 509 (31.1) 17 (2.5) 507 (11.2) 78 (3.0) 489 (6.6)
Iran, Islamic Rep. of 1 (0.2) ~ ~ 3 (0.3) 439 (25.0) 12 (1.1) 478 (13.8) 84 (1.2) 459 (6.9)
Italy 2 (0.9) ~ ~ 3 (0.7) 431 (28.6) 20 (2.0) 446 (13.3) 75 (2.6) 417 (7.5)
Lebanon 2 (0.3) ~ ~ 5 (0.6) 423 (9.9) 25 (1.1) 448 (5.3) 67 (1.4) 447 (3.4)
Netherlands 1 (0.3) ~ ~ 3 (0.7) 574 (12.4) 67 (2.0) 583 (3.6) 29 (2.1) 584 (5.7)
Norway 3 (1.1) 525 (14.5) 4 (0.8) 522 (13.7) 41 (4.5) 534 (5.0) 53 (5.0) 538 (4.9)
Russian Federation 3 (0.8) 525 (24.7) 8 (1.1) 537 (16.7) 27 (2.1) 536 (12.0) 62 (3.2) 514 (12.2)
Slovenia 9 (0.9) 536 (9.9) 19 (1.5) 540 (6.2) 49 (1.2) 542 (3.2) 23 (1.0) 516 (3.9)
Sweden 0 (0.2) ~ ~ 2 (0.6) ~ ~ 40 (4.2) 508 (8.4) 57 (4.4) 491 (6.7)
Data provided by students.
( ) Standard errors appear in parentheses. Because results are rounded to the nearest whole number, some totals may appear inconsistent.
A dash (–) indicates comparable data are not available. A tilde (~) indicates insufficient data to report achievement.
An “r” indicates data are available for at least 70% but less than 85% of the students.
SOU
RCE:
IEA
TIM
SS A
dvan
ced
2008
©
Exhibit 11.17 Students’ Reports of Frequency of Using DifferentTechnologies in Physics Lessons

349chapter 11: physics teachers and instruction in physics
Exhibit 11.17: Students' Reports of Frequency of Using Different Technologies in Physics Lessons
Country
Frequency of Using Other Computing Technology
Every or Almost Every Lesson
About Half the Lessons Some Lessons Never
Percent of Students
Average Achievement
Percent of Students
Average Achievement
Percent of Students
Average Achievement
Percent of Students
Average Achievement
Armenia r 2 (0.6) ~ ~ 3 (0.8) 489 (27.1) 15 (1.9) 509 (14.7) 79 (2.1) 490 (6.0)
Iran, Islamic Rep. of 1 (0.2) ~ ~ 3 (0.4) 416 (27.3) 12 (1.0) 456 (12.6) 84 (1.1) 463 (6.9)
Italy 2 (0.4) ~ ~ 2 (0.6) ~ ~ 15 (1.4) 420 (13.8) 82 (1.5) 424 (7.4)
Lebanon 2 (0.4) ~ ~ 7 (0.7) 452 (8.7) 37 (1.2) 449 (4.5) 54 (1.5) 446 (4.1)
Netherlands 2 (0.4) ~ ~ 5 (0.6) 577 (9.5) 54 (1.7) 582 (3.9) 40 (1.7) 585 (4.9)
Norway 0 (0.2) ~ ~ 3 (0.4) 513 (14.0) 49 (3.3) 537 (5.1) 48 (3.4) 535 (5.4)
Russian Federation 5 (0.6) 546 (15.3) 6 (0.7) 535 (12.8) 36 (1.5) 520 (11.1) 53 (1.8) 519 (10.8)
Slovenia 4 (0.6) 528 (14.8) 11 (1.1) 537 (7.1) 54 (1.6) 540 (3.6) 31 (1.4) 528 (4.2)
Sweden – – – – – – – – – – – – – – – –
Exhibit 4.1 Books in the Home with Trends
SOU
RCE:
IEA
TIM
SS A
dvan
ced
2008
©
Data provided by students.
( ) Standard errors appear in parentheses. Because results are rounded to the nearest whole number, some totals may appear inconsistent.
A dash (–) indicates comparable data are not available. A tilde (~) indicates insufficient data to report achievement.
An “r” indicates data are available for at least 70% but less than 85% of the students.
Exhibit 11.17 Students’ Reports of Frequency of Using Different Technologiesin Physics Lessons (Continued)

350 chapter 11: physics teachers and instruction in physics
The second part of Exhibit 11.17 deals with computer use in physics classes, and the results show that computer use remains far from common in these countries. A majority of students from every participating country except the Netherlands and Slovenia said that computers were never used in their physics classes. And at least 89 percent of students from every country except Slovenia reported that computers were used in less than half of their physics classes. Even for the usage categories with sufficient percentages of students, most of the between-group differences in average scale score did not consistently favor one group over the others.
The third part of Exhibit 11.17 concerns what was called “other computing technology” in the student questionnaire, and that term might not have been familiar to many students. The data show that such technologies are not in widespread use. Most students in Armenia, Iran, and Italy (79 to 84%) reported never using such technology. However, approximately half to two thirds of students in the other countries said that other computing technology was used in at least some lessons in their physics classes.
Students were also asked to indicate what type of calculator they usually used, if they did use a calculator in their physics class. Four types of calculators were listed and accompanied by brief descriptions, as follows:
▶ Simple calculator – basic functions only (+, –, ×, ÷, %, or √), without functions like log, sin, cos
▶ Scientific calculator – basic functions (+, –, ×, ÷, %, or √), and also functions like log, sin, cos
▶ Graphing calculator – scientific and also able to display some graphs
▶ Symbolic calculator – graphing and also able to solve expressions in symbolic terms

351chapter 11: physics teachers and instruction in physics
Exhibit 11.18 presents the percentage of students in each country who reported using each type of calculator. As discussed under 11.17 and reproduced here for reference (in the last data column), Armenia and Iran were the only two countries in which appreciable percentages of students reported that they never used calculators in physics classes. In these two countries, about half the students reported using simple calculators and about one fourth scientific calculators. In the Russian Federation, it was relatively equal—43 percent simple calculators and 53 percent scientific calculators. Nearly all students in Italy, Lebanon, and Slovenia reported using scientific calculators. In the Netherlands, Norway, and Sweden, most students used graphing calculators, but 16 percent in Norway and 10 percent in Sweden also reported using symbolic calculators.
Teachers were also asked about the kinds of calculators their students used during physics classes, and their responses are presented in Exhibit 11.19. On the whole, teachers’ responses about calculator use in their classes coincided with those of their students; however, there were some differences, most no doubt stemming from a difference of opinion about what constituted, for example, a symbolic calculator as opposed to a graphing calculator.
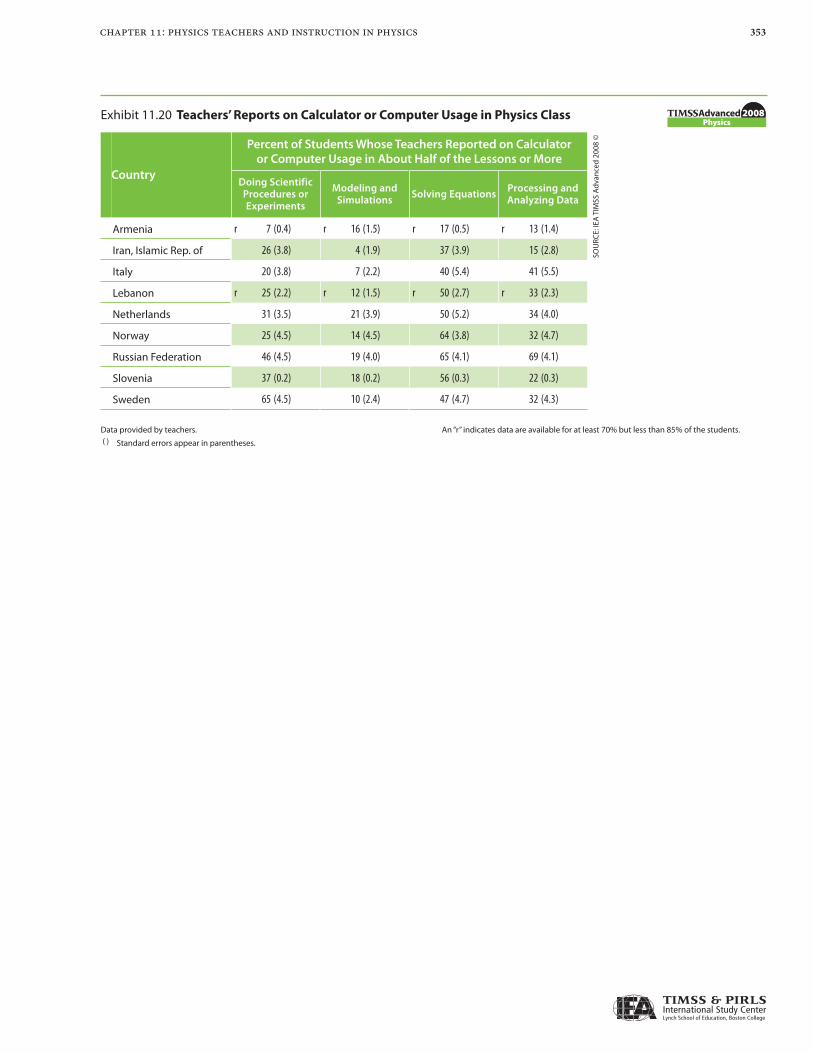
Exhibit 11.20 presents data from teachers about the kinds of situations in which students were most likely to use calculators or computers in their physics classes. The data are presented in terms of the percentage of students taught by teachers who estimated that their students used calculators in a given situation in half of the lessons or more. The given situations were doing scientific procedures or experiments, modeling and simulations, solving equations, and processing and analyzing data.
According to their teachers, in general, a significant percentage of students used calculators in about half the lessons or more for each of

352 chapter 11: physics teachers and instruction in physics
Exhibit 11.18: Students’ Reports on Types of Calculators Used During Physics Lessons
CountryPercent of Students Using Percent of Students
Who Never Used a CalculatorSimple Calculator Scientific Calculator Graphing Calculator Symbolic Calculator
Armenia r 58 (2.5) 22 (1.9) 2 (0.7) 2 (0.4) 16 (2.0)
Iran, Islamic Rep. of 49 (1.6) 28 (1.5) 1 (0.2) 1 (0.2) 21 (1.6)
Italy 2 (0.5) 89 (1.3) 1 (0.3) 1 (0.3) 6 (1.0)
Lebanon 4 (0.6) 91 (0.9) 2 (0.5) 1 (0.3) 1 (0.3)
Netherlands 1 (0.3) 8 (0.8) 87 (0.9) 3 (0.5) 1 (0.3)
Norway 1 (0.2) 7 (1.0) 76 (2.1) 16 (1.8) 0 (0.2)
Russian Federation 43 (2.4) 53 (2.4) 1 (0.3) 1 (0.2) 2 (0.3)
Slovenia 4 (0.5) 93 (0.9) 1 (0.3) 1 (0.4) 1 (0.3)
Sweden 1 (0.2) 2 (0.4) 87 (1.1) 10 (1.0) 1 (0.2)
Data provided by students.
( ) Standard errors appear in parentheses. Because results are rounded to the nearest whole number, some totals may appear inconsistent.
An “r” indicates data are available for at least 70% but less than 85% of the students.
SOU
RCE:
IEA
TIM
SS A
dvan
ced
2008
©
Exhibit 11.18 Students’ Reports on Types of Calculators Used During Physics Lessons
Exhibit 11.19: Teachers’ Reports on the Types of Calculators Used by Students in the TIMSS Class During Physics Lessons
CountryPercent of Students Using Percent of Students
Who Never Used a CalculatorSimple Calculator Scientific Calculator Graphing Calculator Symbolic Calculator
Armenia r 74 (1.4) 24 (1.4) 0 (0.0) 0 (0.0) 2 (0.0)
Iran, Islamic Rep. of 36 (3.6) 50 (4.5) 0 (0.0) 0 (0.0) 13 (2.8)
Italy 1 (0.1) 97 (1.5) 2 (1.1) 0 (0.0) 0 (0.0)
Lebanon 8 (1.3) 84 (1.6) 8 (0.8) 0 (0.1) 0 (0.0)
Netherlands 0 (0.0) 2 (1.4) 90 (3.1) 8 (2.8) 0 (0.0)
Norway 0 (0.0) 0 (0.0) 91 (3.2) 8 (3.1) 1 (0.0)
Russian Federation 35 (3.8) 65 (3.8) 0 (0.0) 0 (0.0) 0 (0.0)
Slovenia 6 (0.2) 94 (0.2) 0 (0.0) 0 (0.0) 0 (0.0)
Sweden 0 (0.0) 5 (2.2) 93 (2.7) 2 (1.5) 0 (0.0)
Data provided by teachers.
( ) Standard errors appear in parentheses. Because results are rounded to the nearest whole number, some totals may appear inconsistent.
An “r” indicates data are available for at least 70% but less than 85% of the students.
SOU
RCE:
IEA
TIM
SS A
dvan
ced
2008
©
Exhibit 11.19 Teachers’ Reports on the Types of Calculators Used by Students in the TIMSS Class During Physics Lessons
353chapter 11: physics teachers and instruction in physics
Exhibit 11.20: Teachers' Reports on Calculator or Computer Usage in Physics Class
Country
Percent of Students Whose Teachers Reported on Calculator or Computer Usage in About Half of the Lessons or More
Doing Scientific Procedures or Experiments
Modeling and Simulations Solving Equations Processing and
Analyzing Data
Armenia r 7 (0.4) r 16 (1.5) r 17 (0.5) r 13 (1.4)
Iran, Islamic Rep. of 26 (3.8) 4 (1.9) 37 (3.9) 15 (2.8)
Italy 20 (3.8) 7 (2.2) 40 (5.4) 41 (5.5)
Lebanon r 25 (2.2) r 12 (1.5) r 50 (2.7) r 33 (2.3)
Netherlands 31 (3.5) 21 (3.9) 50 (5.2) 34 (4.0)
Norway 25 (4.5) 14 (4.5) 64 (3.8) 32 (4.7)
Russian Federation 46 (4.5) 19 (4.0) 65 (4.1) 69 (4.1)
Slovenia 37 (0.2) 18 (0.2) 56 (0.3) 22 (0.3)
Sweden 65 (4.5) 10 (2.4) 47 (4.7) 32 (4.3)
Data provided by teachers.
( ) Standard errors appear in parentheses.
An “r” indicates data are available for at least 70% but less than 85% of the students.
SOU
RCE:
IEA
TIM
SS A
dvan
ced
2008
©
Exhibit 11.20 Teachers’ Reports on Calculator or Computer Usage in Physics Class

354 chapter 11: physics teachers and instruction in physics
the four purposes, although Armenia reported less use across categories than the other countries. In general, calculators were reported to be used most heavily for solving equations. However, they also were used relatively frequently for processing and analyzing data and for doing scientific procedures or experiments. The least supported category across countries was using calculators for modeling and simulation.
The last page of each TIMSS Advanced 2008 physics test booklet asked students to indicate whether or not they had used a calculator during the test, what type and brand of calculator they had used, and how extensively they had made use of it. They were given three choices for the last item: very little (for fewer than 5 questions), somewhat (for between 5 and 10 questions), and quite a lot (for more than 10 questions). The results are displayed in Exhibit 11.21, together with trend data on changes between the two cycles of TIMSS Advanced for the four countries that participated in both 1995 and 2008: Norway, the Russian Federation, Slovenia, and Sweden.
Relatively few students reported using their calculator on more than 10 questions on the TIMSS Advanced 2008 physics test. As might be anticipated based on the heavy use of calculators in their instruction, the most use of calculators on the TIMSS Advanced 2008 physics test was reported by students in the Netherlands; in addition to 8 percent reporting a lot of use, 43 percent said somewhat and another 47 percent a little. Next, 7 percent of Slovenian students reported a lot of use, 38 percent somewhat, and 48 a little. While only 3 percent of Norwegian students reported a lot of use, 29 reported some use and 60 percent little use. Swedish students also made moderate use of the calculator (3% a lot, 23% somewhat, and 61% a little). In contrast, about half the Armenian and Iranian students reported they did not use their calculators on the test at all as did about one fourth of the Russian students.

355chapter 11: physics teachers and instruction in physics
Exhibit 11.21: Trends in Students' Reports of Calculator Use During the TIMSS Physics Test
Country
Used Calculator Quite a Lot (More than 10 Questions)
Used Calculator Somewhat (5–10 Questions)
2008 Percent of Students
1995 Percentof Students
2008 Average
Achievement
1995 Average
Achievement
2008 Percent of Students
1995 Percentof Students
2008 Average
Achievement
1995 Average
Achievement
Armenia s 4 (0.8) ◊ ◊ 497 (33.7) ◊ ◊ 12 (1.1) ◊ ◊ 564 (8.9) ◊ ◊
Iran, Islamic Rep. of 1 (0.2) ◊ ◊ ~ ~ ◊ ◊ 5 (0.7) ◊ ◊ 454 (12.8) ◊ ◊
Italy 2 (0.4) ◊ ◊ ~ ~ ◊ ◊ 20 (2.1) ◊ ◊ 453 (9.2) ◊ ◊
Lebanon 2 (0.4) ◊ ◊ ~ ~ ◊ ◊ 20 (1.0) ◊ ◊ 459 (6.4) ◊ ◊
Netherlands 8 (0.7) ◊ ◊ 586 (6.2) ◊ ◊ 43 (1.3) ◊ ◊ 584 (3.6) ◊ ◊
Norway 3 (0.4) 3 (0.6) 564 (13.2) i 610 (11.4) 29 (1.3) i 37 (1.8) 549 (4.8) i 592 (5.1)
Russian Federation 2 (0.3) 1 (0.4) ~ ~ ~ ~ 19 (1.1) h 14 (1.3) 544 (9.9) 564 (13.8)
Slovenia 7 (0.7) h 2 (1.0) 565 (7.1) ~ ~ 38 (1.4) h 16 (1.5) 552 (3.8) 560 (16.2)
Sweden 3 (0.4) i 5 (0.7) 510 (15.3) i 600 (19.8) 23 (1.4) i 38 (2.5) 530 (5.4) i 588 (5.0)
Country
Used Calculator Very Little (Less than 5 Questions)
Did Not Use a Calculator
2008 Percent of Students
1995 Percentof Students
2008 Average
Achievement
1995 Average
Achievement
2008 Percent of Students
1995 Percentof Students
2008 Average
Achievement
1995 Average
Achievement
Armenia s 28 (2.0) ◊ ◊ 523 (8.6) ◊ ◊ 56 (1.9) ◊ ◊ 467 (8.0) ◊ ◊
Iran, Islamic Rep. of 44 (1.9) ◊ ◊ 472 (8.5) ◊ ◊ 51 (2.2) ◊ ◊ 453 (9.2) ◊ ◊
Italy 50 (2.4) ◊ ◊ 425 (9.7) ◊ ◊ 28 (2.6) ◊ ◊ 390 (10.3) ◊ ◊
Lebanon 64 (1.3) ◊ ◊ 452 (4.2) ◊ ◊ 14 (1.1) ◊ ◊ 401 (6.0) ◊ ◊
Netherlands 47 (1.4) ◊ ◊ 586 (3.4) ◊ ◊ 3 (0.5) ◊ ◊ 557 (12.7) ◊ ◊
Norway 60 (1.2) h 56 (1.8) 533 (4.5) i 575 (6.3) 7 (0.7) h 4 (0.8) 468 (9.6) i 570 (12.3)
Russian Federation 52 (1.2) 49 (2.2) 536 (10.6) 553 (9.0) 27 (1.8) i 36 (2.8) 472 (14.5) i 543 (13.9)
Slovenia 48 (1.6) i 65 (2.4) 525 (3.5) 539 (13.6) 7 (0.7) i 17 (2.2) 485 (9.5) 494 (17.3)
Sweden 61 (1.3) h 53 (2.6) 498 (5.0) i 570 (4.8) 13 (1.0) h 3 (0.6) 436 (11.1) i 558 (15.2)
Data provided by students.
Depending on the booklet assigned, students responded to 25–29 physics items. Items were designed to be answered without a calculator, and students were asked to show their work for constructed-response items. However, about 3–5 items could be answered using a graphing or symbolic calculator.
( ) Standard errors appear in parentheses. Because results are rounded to the nearest whole number, some totals may appear inconsistent.
A diamond (◊) indicates the country did not participate in the 1995 assessment.
A tilde (~) indicates insufficient data to report achievement.
An “s” indicates data are available for at least 50% but less than 70% of the students.
h 2008 significantly higher than 1995
i 2008 significantly lower than 1995
SOU
RCE:
IEA
TIM
SS A
dvan
ced
2008
©
Exhibit 11.21 Trends in Student’s Reports of Calculator Use During the TIMSS Physics Test

356 chapter 11: physics teachers and instruction in physics
In the four countries that participated in both cycles of the study—Norway, the Russian Federation, Slovenia, and Sweden—the trend data for the proportions of students using calculators in 2008 compared to 1995 showed increases in Slovenia and the Russian Federation, and decreases in Norway and Sweden. In Slovenia, the percentages increased for the “a lot” and “somewhat” categories and decreased for the “little” and “did not use” categories. In the Russian Federation, there was no change in the “a lot” category, but an increase in “somewhat” category was accompanied by a decrease in the “did not use” category. In Sweden, the percentages in the “a lot” and “somewhat” categories decreased, while they increased in the “little” and “did not use” categories. In Norway, there was no change in the “a lot” category, but a decrease in the “somewhat” category was accompanied by increases in the “little” and “did no use” categories. The students’ average achievement associated with the usage categories basically reflects students’ overall patterns and changes between the two assessment cycles.
The Role of Homework in Physics Instruction
Exhibit 11.22 contains teachers’ reports about their emphasis on homework. For the Index of Teachers’ Emphasis on Physics Homework, students in the high category had teachers who reported giving relatively long homework assignments (more than 30 minutes) on a relatively frequent basis (in about half the lessons or more). Students in the low category had teachers who gave short assignments (less than 30 minutes) relatively infrequently (in about half the lessons or less). The medium level includes all other possible combinations of teachers’ responses. The exhibit shows, for each country, the percentage of students in each category together with their average TIMSS Advanced 2008 physics scale score. The countries are listed in descending order of the proportion of students in the high category.

357chapter 11: physics teachers and instruction in physics
Exhibit 11.22: Index of Teachers’ Emphasis on Physics Homework (EPH)
CountryHigh EPH Medium EPH Low EPH
Percent of Students
Average Achievement
Percent of Students
Average Achievement
Percent of Students
Average Achievement
Lebanon 86 (1.4) 444 (3.1) 10 (1.3) 432 (11.3) 3 (0.3) 439 (10.8)
Russian Federation 83 (3.2) 535 (11.1) 14 (3.2) 442 (15.9) 2 (1.2) ~ ~
Norway 77 (4.2) 531 (5.1) 14 (4.2) 548 (8.4) 9 (3.3) 533 (10.8)
Armenia r 72 (0.7) 507 (7.8) 22 (0.4) 476 (9.3) 6 (0.8) 445 (7.9)
Iran, Islamic Rep. of 71 (3.5) 461 (8.1) 16 (3.0) 449 (19.8) 13 (3.0) 456 (18.0)
Italy 67 (5.7) 437 (8.4) 22 (4.9) 371 (14.5) 12 (4.0) 448 (34.5)
Netherlands 47 (5.8) 584 (6.2) 29 (4.9) 590 (5.5) 25 (4.6) 573 (5.7)
Sweden 34 (4.0) 505 (7.6) 33 (4.7) 491 (10.3) 33 (5.0) 493 (7.3)
Slovenia 15 (0.2) 551 (4.3) 39 (0.2) 541 (2.5) 47 (0.3) 524 (3.0)
Based on teachers’ responses to three questions about whether they assign physics homework, how often they usually assign physics homework and how many minutes of physics homework they usually assign. Students in the high category were assigned more than 30 minutes of homework about half of the lessons or more, and those in low category were assigned less than 30 minutes of homework about half of the lessons or less. The medium category includes all other possible combinations of responses.
( ) Standard errors appear in parentheses. Because results are rounded to the nearest whole number, some totals may appear inconsistent.
A tilde (~) indicates insufficient data to report achievement.
An “r” indicates data are available for at least 70% but less than 85% of the students.
SOU
RCE:
IEA
TIM
SS A
dvan
ced
2008
©
Exhibit 11.22 Index of Teachers’ Emphasis on Physics Homework (EPH)

358 chapter 11: physics teachers and instruction in physics
From 83 to 86 percent of students in Lebanon and the Russian Federation were in the high category, closely followed by Norway at 77 percent. At the other extreme, nearly half the students in Slovenia and a third in Sweden had teachers who assigned very little, if any homework (i.e., they assigned 30 minutes or less of homework in no more than half their lessons). The Netherlands had 25 percent of its students in this category. Teachers in the other countries responded such that 85 percent of more of their students were in either the high or medium group. Armenia and Slovenia were the only countries that showed a consistent relationship between more time on homework and higher achievement results.
Teachers were also asked about how frequently they included, as part of a physics homework assignment for their students, each of five activities: doing problem/question sets; reading the textbook; memorizing formulas and procedures; gathering, analyzing, and reporting data; finding one or more applications of the content covered; and working on projects. The results are presented in Exhibit 11.23 in terms of the percentage of students in each country whose teachers indicated that they assigned a particular activity always or almost always, sometimes, or never or almost never.
The most popular kind of homework assignment in every one of these countries included “doing problem/question sets.” Virtually 100 percent of the students in every country were asked to complete such an assignment for homework at least sometimes, and about three fourths were asked to do so always or almost always. In Slovenia, for example, this homework activity was assigned always or almost always to 95 percent of the students and the other types of homework were assigned always or almost always to only to 2 to 4 percent of the students. In some countries, however, reading from the textbook and memorizing formulas and procedures were assigned very frequently

359chapter 11: physics teachers and instruction in physics
Exhibit 11.23: Teachers’ Reports on the Kinds of Physics HomeworkAssigned to the TIMSS Advanced Physics Class
Country
Percent of Students by Types of Homework Assigned by Their Teachers
Doing Problem/Question Sets Reading the TextbookMemorizing Formulas
and Procedures
Always or Almost Always
SometimesNever or Almost Never
Always or Almost Always
SometimesNever or Almost Never
Always or Almost Always
SometimesNever or Almost Never
Armenia r 86 (0.3) 14 (0.3) 0 (0.0) r 78 (0.7) 22 (0.7) 0 (0.0) r 81 (0.5) 19 (0.5) 0 (0.0)
Iran, Islamic Rep. of 72 (4.0) 28 (4.0) 0 (0.0) 66 (3.9) 32 (3.9) 1 (1.4) 36 (4.6) 46 (4.6) 18 (3.6)
Italy 76 (5.2) 23 (5.1) 1 (0.9) 71 (5.1) 26 (5.1) 3 (1.8) 6 (2.4) 41 (5.7) 53 (6.0)
Lebanon 83 (2.1) 17 (2.1) 0 (0.0) 42 (2.4) 51 (2.4) 7 (1.5) 45 (2.6) 43 (2.5) 12 (1.5)
Netherlands 94 (2.9) 6 (2.9) 0 (0.0) 50 (7.2) 39 (6.5) 11 (4.0) 3 (2.2) 33 (5.4) 64 (5.8)
Norway 82 (3.8) 18 (3.8) 0 (0.0) 42 (4.9) 38 (4.6) 20 (4.6) 3 (2.0) 43 (4.6) 54 (5.2)
Russian Federation 94 (1.8) 6 (1.8) 0 (0.0) 76 (3.8) 24 (3.7) 1 (0.0) 57 (4.3) 40 (4.3) 3 (1.0)
Slovenia 95 (0.0) 5 (0.0) 0 (0.0) 2 (0.1) 55 (0.2) 44 (0.2) 2 (0.1) 9 (0.1) 89 (0.2)
Sweden 73 (5.3) 27 (5.3) 0 (0.0) 53 (7.1) 37 (6.6) 10 (3.8) 0 (0.3) 23 (5.8) 77 (5.8)
Country
Percent of Students by Types of Homework Assigned by Their Teachers
Gathering, Analyzing, and Reporting Data
Finding One or More Applications
of the Content CoveredWorking on Projects
Always or Almost Always
SometimesNever or Almost Never
Always or Almost Always
SometimesNever or Almost Never
Always or Almost Always
SometimesNever or Almost Never
Armenia r 36 (1.3) 61 (1.4) 3 (0.1) r 47 (0.8) 44 (0.6) 10 (0.2) r 13 (0.8) 54 (2.2) 33 (2.2)
Iran, Islamic Rep. of 22 (4.0) 63 (4.8) 15 (3.5) 12 (2.9) 66 (4.2) 22 (3.8) 3 (1.8) 46 (4.7) 51 (4.5)
Italy 6 (2.3) 61 (5.9) 34 (5.7) 12 (3.7) 58 (6.0) 29 (6.1) 1 (0.1) 30 (5.0) 69 (5.1)
Lebanon 26 (2.0) 62 (2.3) 12 (1.6) 18 (2.0) 66 (2.5) 16 (2.0) 5 (1.4) 51 (2.4) 44 (2.4)
Netherlands 1 (1.1) 50 (6.0) 49 (6.1) 0 (0.0) 23 (4.5) 77 (4.5) 4 (1.8) 40 (6.0) 57 (6.1)
Norway 1 (0.9) 43 (5.1) 56 (4.9) 0 (0.0) 29 (4.0) 71 (4.0) 0 (0.0) 27 (4.5) 73 (4.5)
Russian Federation 12 (2.8) 81 (3.3) 7 (1.9) 27 (3.6) 69 (4.0) 4 (2.2) 2 (1.4) 68 (4.4) 29 (4.2)
Slovenia 4 (0.1) 68 (0.2) 28 (0.2) 2 (0.1) 53 (0.2) 45 (0.2) 2 (0.1) 39 (0.2) 59 (0.2)
Sweden 0 (0.0) 38 (6.1) 62 (6.1) 0 (0.0) 38 (6.4) 62 (6.4) 0 (0.0) 33 (5.5) 67 (5.6)
Data provided by teachers.
( ) Standard errors appear in parentheses. Because results are rounded to the nearest whole number, some totals may appear inconsistent.
An “r” indicates data are available for at least 70% but less than 85% of the students.
SOU
RCE:
IEA
TIM
SS A
dvan
ced
2008
©
Exhibit 11.23 Teachers’ Reports on the Kinds of Physics Homework Assigned to the TIMSS Advanced Physics Class
360 chapter 11: physics teachers and instruction in physics
to the majority of students. Assigning data analysis for homework or finding applications of recently covered content was highly variable—assigned to very few (0–6%) students up to as many as one third of the students depending on the country. Working on projects was rarely assigned in any country.
Students were asked about how much homework they did, and how frequently that homework involved three of the five activities that teachers had also been asked about: doing problem/question sets, reading the textbook, and memorizing formulas and procedures. Their responses are summarized in Exhibit 11.24. For each country, the exhibit indicates the average number of hours per week that the students spent on physics homework as well as the percentage of students who reported that they “always or almost always”, “sometimes”, or “never or almost never” had homework that involved each of those activities.
Students’ reports tended to correspond with the reports of their teachers—that is, students appeared to be doing the assigned homework. Students in the Netherlands, Norway, Slovenia, and Sweden recorded the lowest average number of hours per week spent on physics homework: 1.6 hours or less in total. Students in Iran and Lebanon reported spending considerably more time on physics homework (at least 4 hours a week). Students in the Russian Federation also reported relatively heavy homework schedules (3.3 hours a week). Students agreed with their teachers about having to do problem/question sets for their physics homework “sometimes” or “always or almost always”. The lowest levels of homework activity were reported for reading the textbook in Slovenia and for memorizing formulas and procedures in the Netherlands, Norway, and Slovenia. Apart from these exceptions, a majority of students in every country reported that their physics homework included one or more of these three activities at least sometimes.

361chapter 11: physics teachers and instruction in physics
Exhibit 11.24: Students’ Reports on the Time Spent Doing Various Kinds of Physics Homework
Country
Average Hours
per Week Spent Doing
Physics Homework
Percent of Students Doing Various Activities for Physics Homework
Problem/Question Sets Read the TextbookMemorize Formulas
and Procedures
Always or Almost Always
SometimesNever or Almost Never
Always or Almost Always
SometimesNever or Almost Never
Always or Almost Always
SometimesNever or Almost Never
Armenia r 2.5 (0.15) r 42 (3.0) 50 (2.8) 8 (1.1) r 54 (3.2) 41 (2.7) 5 (1.2) r 37 (2.5) 54 (2.1) 8 (1.0)
Iran, Islamic Rep. of 4.5 (0.09) 48 (1.5) 49 (1.5) 3 (0.4) 52 (1.7) 42 (1.6) 6 (0.7) 57 (1.4) 39 (1.3) 4 (0.5)
Italy 2.1 (0.07) 38 (2.8) 49 (2.1) 13 (1.6) 48 (2.8) 40 (2.1) 12 (1.4) 51 (2.3) 40 (1.9) 8 (1.1)
Lebanon 4.1 (0.10) 53 (1.6) 44 (1.6) 3 (0.4) 30 (1.4) 58 (1.5) 12 (0.8) 49 (1.6) 41 (1.4) 10 (1.0)
Netherlands 1.0 (0.03) 60 (2.1) 32 (1.7) 8 (1.1) 29 (1.6) 59 (1.1) 12 (1.3) r 5 (0.6) 39 (1.6) 56 (1.6)
Norway 1.6 (0.06) 82 (1.2) 16 (1.2) 2 (0.3) 46 (2.1) 46 (1.5) 7 (1.4) 5 (0.5) 44 (1.6) 51 (1.7)
Russian Federation 3.3 (0.09) 74 (1.8) 25 (1.7) 1 (0.2) 57 (2.2) 38 (2.0) 5 (0.7) 70 (1.5) 27 (1.3) 3 (0.5)
Slovenia r 0.7 (0.03) 44 (1.5) 50 (1.6) 6 (0.6) r 2 (0.5) 29 (1.8) 69 (1.7) r 4 (0.6) 28 (1.9) 68 (1.9)
Sweden r 1.0 (0.04) 72 (2.1) 25 (1.9) 3 (0.4) 49 (2.1) 45 (1.8) 7 (0.8) r 11 (1.0) 44 (1.7) 45 (1.9)
Background data provided by students.
( ) Standard errors appear in parentheses. Because results are rounded to the nearest whole number, some totals may appear inconsistent.
An “r” indicates data are available for at least 70% but less than 85% of the students.
SOU
RCE:
IEA
TIM
SS A
dvan
ced
2008
©
Exhibit 11.24 Students’ Reports on the Time Spent Doing Various Kinds of Physics Homework

362 chapter 11: physics teachers and instruction in physics
Types of Assessments Used in Physics Classes
This section concerns the assessment practices used by teachers of physics in the participating countries to monitor their students’ progress. Teachers were asked about the degree of emphasis they assigned to each of three possible data sources: classroom tests (e.g., teacher-made or textbook tests), informal assessment, and other tests. For each source, teachers indicated whether it was given major emphasis, some emphasis, or little or no emphasis. Results are presented in Exhibit 11.25 in terms of the percentage of students who were taught by teachers who reported that a given data source was accorded major, some, or little emphasis in their evaluation procedures.
Teachers in all these countries indicated that they placed more emphasis on classroom tests (e.g., teacher-made or textbook tests) as sources of data on student progress than on either of the two other alternatives. More than 90 percent of students in every one of these countries except Armenia (77%) were taught by teachers who indicated that they placed either major or some emphasis on such tests. The two other forms of assessment—informal assessment and other tests—were used by many teachers, but less emphasis was given to them. In most participating countries, significant proportions of students were taught by teachers who gave little or no emphasis to either of these alternatives.
Exhibit 11.26 provides information about how often teachers administered tests or examinations to their TIMSS Advanced 2008 physics classes. Teachers were asked to select one of four alternatives: at least once a month, about every other month, about 2 or 3 times a year, and never. For each of these four groups, the results in Exhibit 11.26 show the percentage of students taught by teachers in that category and the average physics achievement for those students.
All students of physics in these countries were taught by teachers who gave tests or examinations at least several times during the year.

363chapter 11: physics teachers and instruction in physics
Exhibit 11.25: Teachers' Emphasis on Sources to Monitor Students' Progress in Physics
Country
Percent of Students by Their Teachers' Emphasis on Various Sources to Monitor Students' Progress
Classroom Tests (e.g., Teacher-made or
Textbook Tests)Informal Assessment Other Tests
Major Emphasis
Some Emphasis
Little or No Emphasis
Major Emphasis
Some Emphasis
Little or No Emphasis
Major Emphasis
Some Emphasis
Little or No Emphasis
Armenia 29 (0.5) 49 (0.7) 23 (0.6) 8 (0.2) 50 (0.7) 42 (0.8) r 5 (0.1) 43 (0.6) 51 (0.6)
Iran, Islamic Rep. of 74 (4.0) 24 (4.1) 3 (1.5) 8 (2.6) 58 (4.5) 33 (4.6) 18 (3.1) 36 (3.6) 46 (3.7)
Italy 63 (5.3) 37 (5.3) 0 (0.0) 14 (3.8) 67 (5.3) 19 (4.0) 16 (4.1) 56 (5.1) 28 (4.6)
Lebanon 68 (2.3) 22 (2.0) 9 (1.4) 29 (2.5) 40 (2.4) 31 (2.5) r 19 (2.1) 39 (2.5) 42 (2.8)
Netherlands 96 (2.3) 4 (2.3) 0 (0.0) 7 (2.6) 21 (4.6) 72 (4.7) – – – – – –
Norway 96 (2.1) 4 (2.1) 0 (0.0) 7 (2.5) 54 (5.3) 39 (5.3) – – – – – –
Russian Federation 87 (3.1) 12 (2.9) 1 (0.8) 14 (3.1) 57 (4.4) 29 (3.3) 7 (2.2) 53 (5.1) 40 (4.8)
Slovenia 71 (0.2) 26 (0.2) 3 (0.1) 28 (0.3) 48 (0.2) 24 (0.2) 19 (0.2) 39 (0.2) 42 (0.3)
Sweden 74 (4.2) 25 (4.1) 1 (0.9) 15 (3.6) 70 (4.5) 14 (3.2) 54 (5.4) 29 (4.6) 18 (3.4)
Data provided by teachers.
( ) Standard errors appear in parentheses. Because results are rounded to the nearest whole number, some totals may appear inconsistent.
A dash (–) indicates comparable data are not available.
An “r” indicates data are available for at least 70% but less than 85% of the students.
SOU
RCE:
IEA
TIM
SS A
dvan
ced
2008
©
Exhibit 11.25 Teachers’ Emphasis on Sources to Monitor Students’ Progress in Physics
Exhibit 11.26: Frequency of Physics Tests
Country
Percent of Students Whose Teachers Give a Physics Test or Examination
At Least Once a MonthAbout Every Other Month
About 2 or 3 Times a Year
Never
Percent of Students
Average Achievement
Percent of Students
Average Achievement
Percent of Students
Average Achievement
Percent of Students
Average Achievement
Armenia s 40 (0.8) 493 (13.8) s 52 (0.7) 513 (6.1) s 8 (0.1) 464 (18.2) s 0 (0.0) ~ ~
Iran, Islamic Rep. of 57 (4.2) 466 (10.8) 27 (3.7) 446 (11.9) 16 (3.1) 465 (18.6) 0 (0.0) ~ ~
Italy 54 (5.7) 424 (11.2) 27 (4.8) 442 (16.7) 19 (4.9) 394 (13.3) 0 (0.0) ~ ~
Lebanon 87 (1.5) 443 (3.2) 9 (1.2) 458 (10.5) 3 (0.8) 413 (21.8) 1 (0.0) ~ ~
Netherlands 7 (2.4) 597 (10.8) 65 (5.3) 581 (4.9) 27 (5.0) 583 (5.8) 0 (0.0) ~ ~
Norway 35 (5.5) 538 (7.0) 63 (5.3) 531 (4.4) 2 (1.7) ~ ~ 0 (0.0) ~ ~
Russian Federation 92 (2.1) 522 (10.7) 8 (2.1) 515 (32.8) 0 (0.0) ~ ~ 0 (0.0) ~ ~
Slovenia 10 (0.2) 562 (4.3) 59 (0.2) 539 (2.6) 30 (0.2) 518 (3.3) 0 (0.0) ~ ~
Sweden 5 (2.3) 437 (21.4) 68 (4.9) 498 (6.0) 28 (4.8) 506 (9.1) 0 (0.0) ~ ~
Data provided by teachers.
( ) Standard errors appear in parentheses. Because results are rounded to the nearest whole number, some totals may appear inconsistent.
A tilde (~) indicates insufficient data to report achievement.
An “s” indicates data are available for at least 50% but less than 70% of the students.
SOU
RCE:
IEA
TIM
SS A
dvan
ced
2008
©
Exhibit 11.26 Frequency of Physics Tests

364 chapter 11: physics teachers and instruction in physics
The most frequent testing was reported in Lebanon and the Russian Federation, where 87 to 92 percent of students were tested at least monthly. About half the students (54 to 57%) were tested this frequently in Iran and Italy as were a third of the students in Norway. From 27 to 30 percent of the students were tested only 2 or 3 times a year in the Netherlands, Slovenia, and Sweden. Generally speaking, the direction of the achievement differences in a given country across the four groups of students did not favor one group over the others in a consistent fashion.
Exhibit 11.27 provides information about the item formats physics students in these countries were most likely to see on tests and examinations. Teachers were asked to report whether the tests and examinations they administered to their students consisted of constructed-response items only, mostly constructed-response items, about half constructed-response and half objective items, mostly objective items, or only objective items. For each of these five groups, the results in Exhibit 11.27 show the percentages of students whose teachers used the various formats and the average achievement of those students.
There was substantial variation across countries in approaches to testing. In the Netherlands, 78 percent of students were taught by teachers whose tests consisted exclusively of constructed-response items, by far the largest percentage. Italy and Sweden also reported extensive use of constructed-response items, but exclusively for only 26 to 29 percent of the students. In Armenia (23%), Lebanon (46%), and Norway (25%), considerable percentages of students were taught by teachers whose tests consisted mainly or entirely of objective items (e.g., multiple-choice items). In the other countries, 9 percent or less of students were in that category. Once again, between-group, within-country differences in achievement did not favor one group over the others in a consistent fashion.

365chapter 11: physics teachers and instruction in physics
Exhibit 11.27: Formats of Questions Used by Teachers in Physics Tests or Examinations
Country
Only Constructed-
response
Mostly Constructed-
response
About Half Constructed- response and Half Objective (e.g., Multiple-
choice)
Mostly Objective
Only Objective
Percent of
Students
Average Achievement
Percent of
Students
Average Achievement
Percent of
Students
Average Achievement
Percent of
Students
Average Achievement
Percent of
Students
Average Achievement
Armenia 14 (0.2) 460 (13.6) 5 (0.7) 481 (63.8) 58 (0.7) 512 (5.6) 12 (0.6) 501 (9.0) 11 (0.5) 464 (11.1)
Iran, Islamic Rep. of 8 (2.4) 456 (17.5) 31 (4.3) 428 (9.7) 52 (4.2) 468 (10.5) 8 (2.3) 540 (23.0) 1 (0.7) ~ ~
Italy 26 (5.2) 418 (20.0) 43 (6.2) 422 (11.6) 22 (4.7) 424 (13.9) 8 (2.3) 456 (30.3) 0 (0.0) ~ ~
Lebanon r 8 (1.6) 472 (11.2) r 29 (2.4) 444 (7.3) r 17 (2.8) 440 (9.3) r 38 (2.6) 444 (6.3) r 8 (1.4) 452 (13.2)
Netherlands 78 (5.0) 585 (4.0) 19 (4.8) 575 (10.6) 0 (0.0) ~ ~ 3 (1.8) 568 (10.4) 0 (0.0) ~ ~
Norway 11 (2.6) 538 (13.8) 34 (4.9) 539 (6.4) 30 (4.8) 535 (5.8) 25 (5.6) 529 (8.7) 0 (0.0) ~ ~
Russian Federation 13 (3.1) 563 (22.8) 27 (4.1) 486 (22.0) 60 (4.9) 529 (10.9) 1 (0.6) ~ ~ 0 (0.0) ~ ~
Slovenia 9 (0.1) 554 (3.8) 21 (0.2) 543 (4.7) 67 (0.2) 529 (2.1) 3 (0.0) 552 (13.5) 0 (0.0) ~ ~
Sweden 29 (4.3) 498 (9.0) 64 (5.2) 496 (7.7) 7 (2.6) 516 (14.7) 0 (0.0) ~ ~ 0 (0.0) ~ ~
Data provided by teachers.
( ) Standard errors appear in parentheses. Because results are rounded to the nearest whole number, some totals may appear inconsistent.
A tilde (~) indicates insufficient data to report achievement.
An “r” indicates data are available for at least 70% but less than 85% of the students.
SOU
RCE:
IEA
TIM
SS A
dvan
ced
2008
©
Exhibit 11.27 Formats of Questions Used by Teachers in Physics Tests or Examinations
366 chapter 11: physics teachers and instruction in physics
The focus of Exhibit 11.28 is the level of cognitive demand teachers emphasized in the physics tests they administered to their TIMSS Advanced 2008 students. Teachers were asked to indicate the frequency (always or almost always, sometimes, never or almost never) with which they included items requiring each of four levels of cognitive demand (knowing facts and concepts, application of knowledge and understanding, developing hypotheses and designing scientific investigations, and explanations or justifications) on their tests. For each of these four cognitive-demand categories, the results in Exhibit 11.28 show the percentage of students who were taught by teachers in that category.
In Iran, Italy, and Sweden, about three fourth of students (72 to 76%) were always or almost always asked questions based on knowing facts and concepts as were about two thirds of the students in the Russian Federation. In the rest of the countries except the Netherlands (65%), over 90 percent were taught by teachers who said that the tests they administered to their physics students at least sometimes included items based on knowing facts and concepts. Nearly all students (from 98 to 100%) in every country were taught by teachers who at least sometimes included items based on the application of knowledge and understanding on their tests, and nearly all (except for 12 to 14 percent in the Netherlands and Slovenia) were taught by teachers whose tests at least sometimes included items requiring students to explain or justify their responses. The smallest percentages of students were asked questions involving hypotheses and investigations, but taken as a whole, the results indicate that the tests and examinations physics students are administered in these countries typically contain items requiring all four levels of cognitive demand.

367chapter 11: physics teachers and instruction in physics
Exhibit 11.28: Types of Questions in Physics Tests
Country
Percent of Students by Types of Questions Teachers Include in Their Physics Tests
Questions Based on Knowing Facts and Concepts
Questions Based on the Application of Knowledge and
Understanding
Questions Involving Developing Hypotheses and Designing Scientific
Investigations
Always or Almost Always
SometimesNever or Almost Never
Always or Almost Always
SometimesNever or Almost Never
Always or Almost Always
SometimesNever or Almost Never
Armenia r 46 (0.7) 54 (0.7) 0 (0.0) r 66 (1.1) 34 (1.1) 0 (0.0) r 29 (0.6) 69 (0.6) 2 (0.1)
Iran, Islamic Rep. of 72 (3.6) 28 (3.6) 1 (0.9) 67 (4.2) 31 (4.1) 2 (1.2) 5 (1.9) 52 (4.5) 43 (4.6)
Italy 76 (4.4) 23 (4.3) 1 (1.1) 86 (4.6) 13 (4.5) 1 (0.1) 2 (1.3) 30 (4.9) 68 (5.0)
Lebanon r 40 (2.7) 54 (2.7) 7 (1.3) r 81 (1.8) 19 (1.8) 0 (0.0) r 41 (2.7) 50 (2.7) 9 (1.0)
Netherlands 15 (4.2) 50 (5.4) 35 (5.8) 89 (3.2) 11 (3.2) 0 (0.0) 5 (2.3) 61 (4.6) 33 (4.3)
Norway 46 (5.4) 47 (5.3) 7 (3.1) 90 (2.9) 10 (2.9) 0 (0.0) 0 (0.0) 34 (5.3) 66 (5.3)
Russian Federation 65 (4.6) 35 (4.6) 0 (0.2) 95 (1.7) 5 (1.7) 0 (0.0) 6 (2.8) 63 (4.5) 31 (4.4)
Slovenia 41 (0.2) 54 (0.2) 6 (0.1) 85 (0.2) 15 (0.2) 0 (0.0) 7 (0.1) 43 (0.2) 50 (0.2)
Sweden 72 (3.8) 25 (3.7) 3 (1.5) 88 (3.3) 11 (3.2) 1 (0.0) 2 (1.0) 51 (4.9) 47 (4.8)
Country
Percent of Students by Types of Questions Teachers Include in
Their Physics Tests (Continued)
Questions Requiring Explanations or Justifications
Always or Almost Always
SometimesNever or Almost Never
Armenia 80 (0.4) 20 (0.4) 0 (0.0)
Iran, Islamic Rep. of 34 (4.2) 63 (4.3) 3 (1.2)
Italy 61 (6.0) 35 (5.8) 4 (1.9)
Lebanon r 73 (2.4) 26 (2.4) 1 (0.5)
Netherlands 16 (3.6) 71 (5.0) 14 (3.7)
Norway 78 (4.2) 21 (4.2) 0 (0.5)
Russian Federation 56 (4.8) 44 (4.8) 0 (0.0)
Slovenia 21 (0.2) 67 (0.2) 12 (0.2)
Sweden 83 (3.4) 17 (3.4) 0 (0.0)
Data provided by teachers.
( ) Standard errors appear in parentheses. Because results are rounded to the nearest whole number, some totals may appear inconsistent.
An “r” indicates data are available for at least 70% but less than 85% of the students.
SOU
RCE:
IEA
TIM
SS A
dvan
ced
2008
©
Exhibit 11.28 Types of Questions in Physics Tests
