physics unit 1& 2 overview - home | vicphysics pracs 2013... · web viewphysics unit 1& 2...
TRANSCRIPT

STUDENT : ……………………………
XXX SCHOOL
PHYSICS
Unit 3
Electronics and photonics
2013Index1. Using the Multimeter and reviewing DC circuits 32. The LDR and Thermistor 93. Learning to use the CRO 134. Diodes 155. LED 186. Photodiodes 217. Capacitors 248. DC power supplies 27
Selected pracs from Camberwell Grammar School written by Dr Murray Anderson and Dan O'Keeffe
Page 1

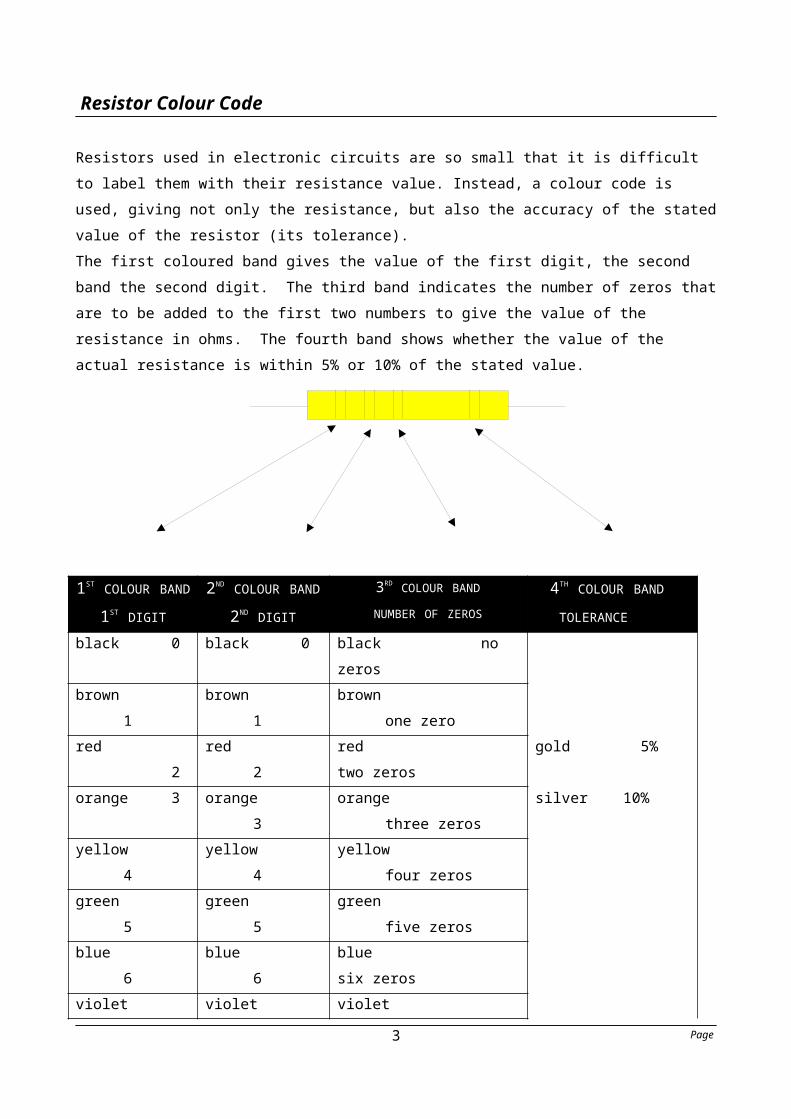
Resistor Colour Code
Resistors used in electronic circuits are so small that it is difficult to label them with their resistance value. Instead, a colour code is used, giving not only the resistance, but also the accuracy of the stated value of the resistor (its tolerance). The first coloured band gives the value of the first digit, the second band the second digit. The third band indicates the number of zeros that are to be added to the first two numbers to give the value of the resistance in ohms. The fourth band shows whether the value of the actual resistance is within 5% or 10% of the stated value.
1ST COLOUR BAND
1ST DIGIT
2ND COLOUR BAND
2ND DIGIT
3RD COLOUR BAND
NUMBER OF ZEROS4TH COLOUR BAND
TOLERANCE
black 0 black 0 black no zerosbrown 1 brown
1brown one zero
red 2
red 2
red two zeros
gold 5%
orange 3 orange 3
orange three zeros
silver 10%
yellow 4 yellow 4
yellow four zeros
green 5 green 5
green five zeros
blue 6 blue 6
blue six zeros
violet 7 violet 7
violet seven zeros
grey 8 grey 8
grey eight zeros
white 9 white 9
white nine zeros
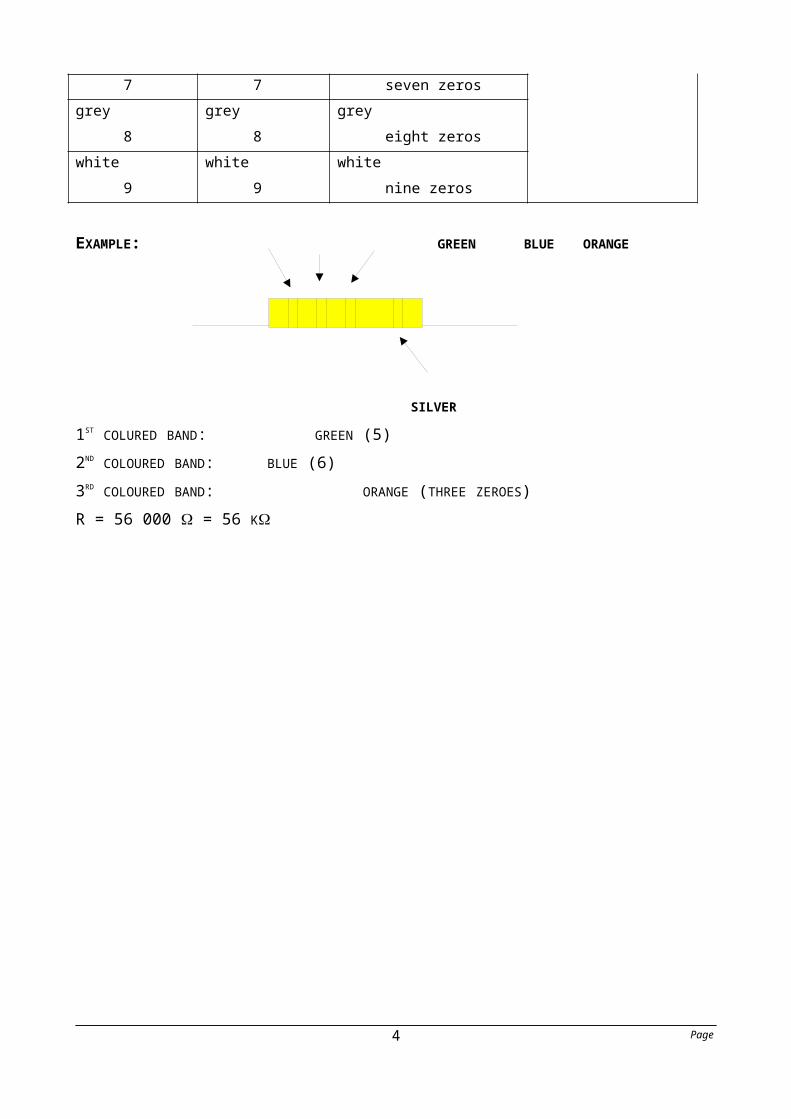
EXAMPLE: GREEN BLUE ORANGE
Page 2
SILVER
1ST COLURED BAND: GREEN (5)2ND COLOURED BAND: BLUE (6)3RD COLOURED BAND: ORANGE (THREE ZEROES)R = 56 000 = 56 K
Page 3
Electronics Prac 1: Using the Multimeter and reviewing DC circuits
Aims1) to review Year 11 knowledge by constructing a simple circuit2) to use a multimeter to make resistance, voltage and current measurements3) to compare experimental results with theory calculations4) to get you to record your work for each prac in a systematic way so that you can refer to this work later5) to write up your work as you go, not after the event
Equipment1 × 6 volt dry cell 8 leads1 switch 56 Ω, 68 Ω and 180 Ω resistors1 multimeter
Tasks1) Using the multimeter set on resistance measurement, measure the resistance of each
of the 3 resistors. Write these values in the “measured” column and record their accuracy compared to stated value.
2) Calculate the total resistance of the circuit using your measured values of the resistors used.
3) Construct the circuit shown below.
Check your circuit with your teacher before proceeding. Have the switch closed only when taking measurements.
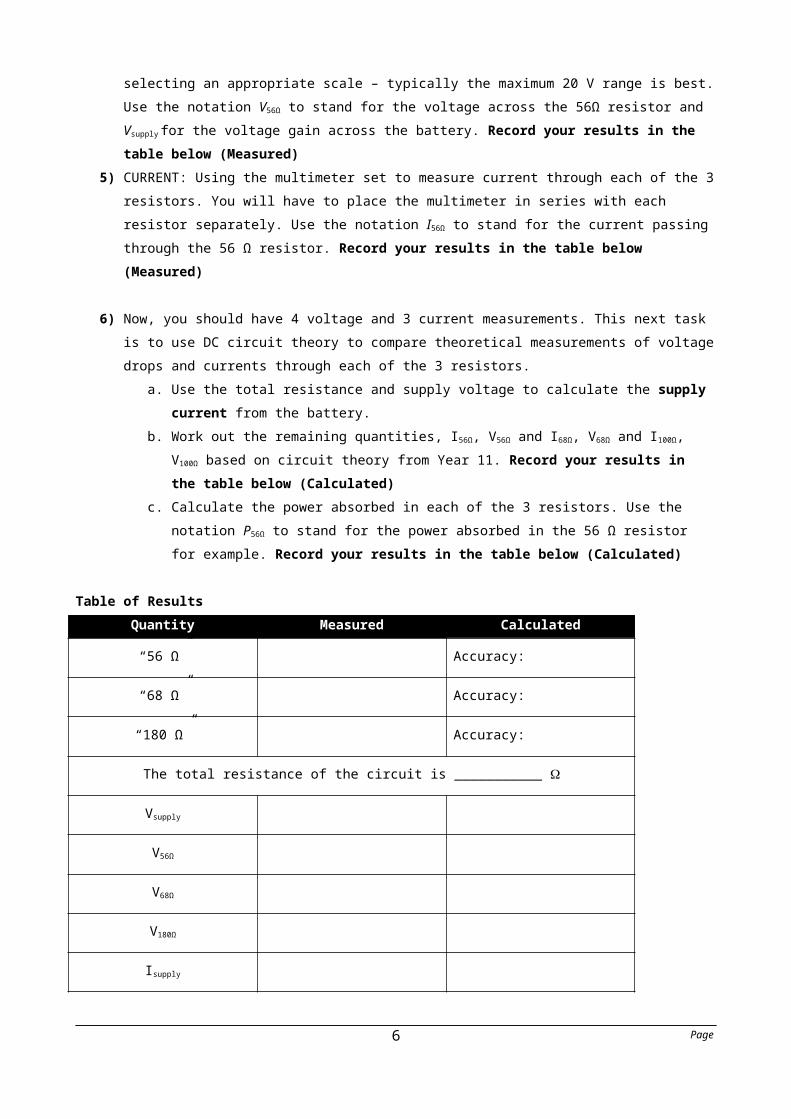
4) VOLTAGE: Close the switch and measure the voltage across the battery, R1, R2 and R3 respectively using a multimeter set to voltage measurement, selecting an appropriate scale – typically the maximum 20 V range is best. Use the notation V56Ω to stand for the voltage across the 56Ω resistor and Vsupply for the voltage gain across the battery. Record your results in the table below (Measured)
5) CURRENT: Using the multimeter set to measure current through each of the 3 resistors. You will have to place the multimeter in series with each resistor separately.
Page 4

Use the notation I56Ω to stand for the current passing through the 56 Ω resistor. Record your results in the table below (Measured)
6) Now, you should have 4 voltage and 3 current measurements. This next task is to use DC circuit theory to compare theoretical measurements of voltage drops and currents through each of the 3 resistors.
a. Use the total resistance and supply voltage to calculate the supply current from the battery.
b. Work out the remaining quantities, I56Ω, V56Ω and I68Ω, V68Ω and I100Ω, V100Ω based on circuit theory from Year 11. Record your results in the table below (Calculated)
c. Calculate the power absorbed in each of the 3 resistors. Use the notation P56Ω to stand for the power absorbed in the 56 Ω resistor for example. Record your results in the table below (Calculated)
Table of ResultsQuantity Measured Calculated
“56 Ω” Accuracy:
“68 Ω” Accuracy:
“180 Ω” Accuracy:
The total resistance of the circuit is ___________
Vsupply
V56Ω
V68Ω
V180Ω
Isupply
I56Ω
I56Ω
I180Ω
P56Ω N/A
Page 5
TheoryVsupply = VA + VB (A and B in series)VA = VB (A and B in parallel)
Rtotal = RA + RB +…. (A and B in series)
1R total
= 1R A
+ 1RB
. . .. .. . .⇒R total=R A RB
R A+RB (2 resistors A and B in parallel)
Isupply =
V sup ply
R total
Voltage distribution in series:
V A
V B=
R A
RB with IA = IB; voltage is distributed in direct proportion to resistance, the bigger the resistor the larger the voltage drop across it.For example:
V supply=12=V 5+V 3 and
V 5
V 3=5
3⇒V 5=1 . 67 V 3
and hence by substitution2 .67V 3=12⇒V 3=4 .5 V and hence V 5=12−4 . 5=7 .5 V.
Current distribution in parallel:
I B
I B=
RA
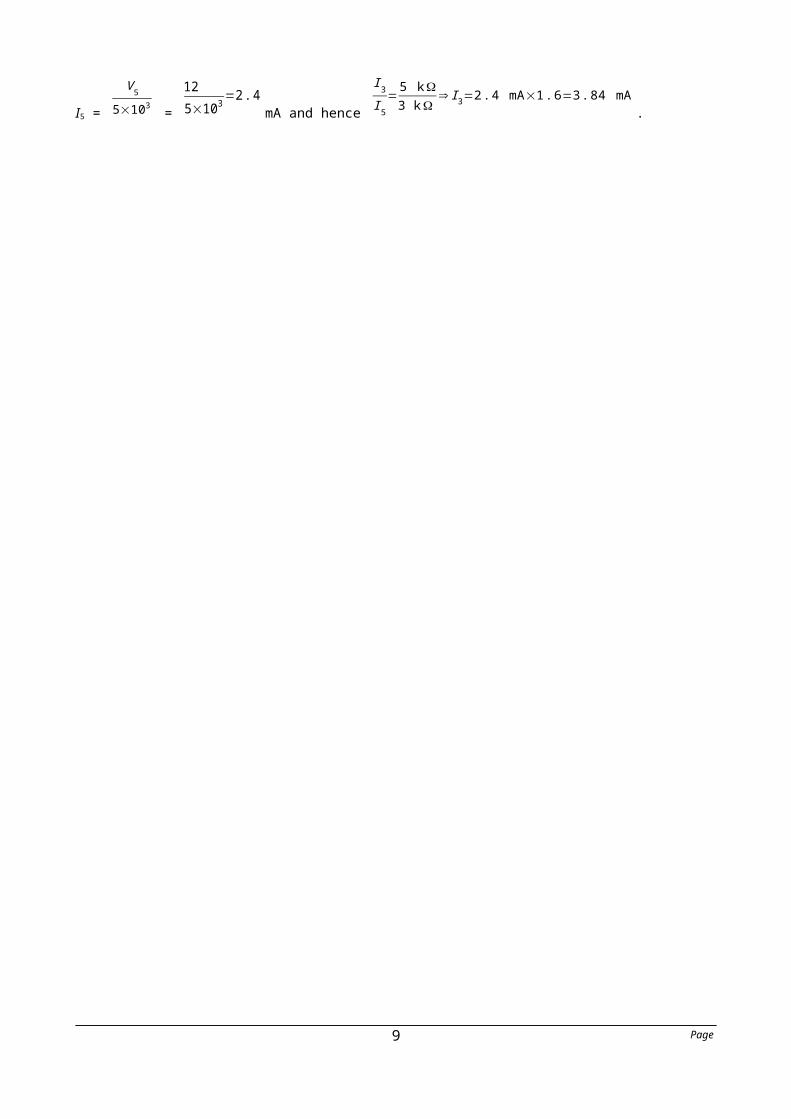
RB with VA = VB; current is distributed in inverse proportion to resistance, the bigger the resistance the smaller the current passing though it For example
I5 =
V 5
5×103 =
125×103
=2. 4mA and hence
I 3
I 5=5 k
3 k⇒ I 3=2. 4 mA×1 .6=3 .84 mA
.
Page 6

DC Circuit Problems
Problem A
Sally, Mustapha, Alexis and Wang-Chow have just finished wiring up an electrical circuit. They sincerely hope that it will work. It consists of a 12V battery and four globes A, B, C & D that they bought at a local hardware shop. Below is a diagram of the circuit that they have connected.
Globes A and D have a resistance of 4 each, while globes B & C each have a resistance of 24 Ω.
1) Determine the total resistance of the circuit
2) Calculate the current in light globe D
3) With the aid of calculations, list the globes in order of brightness
Page 7

Problem BA set of 60 party-lights run off a 240 V power supply. Each of the 3 rows of lights contains 20 globes. Below is a circuit diagram. The light globes are all identical and three globes X, M and N are labelled.
1) What is the voltage across each globe?
The power absorbed by each globe is 2.0W2) What is the current in each of the light globes?
3) Calculate the resistance of the light globe marked X?
4) Calculate the power transferred from the power supply.
During the night, the light globe marked X breaks.5) Describe what happens to the brightness of each of the globes marked M and N.
Page 8
Motor = 4.0 Ω
240V
0V
Motor = 4.0 Ω
Vm Vw
6m 12m R = 0.025 Ω/m
Problem C (Extension Only – This is HARD)
Alexis and Wang-Chow have become tired of their simple circuits and decide to head to the dodgem cars.
They board two different vehicles, each of which is equipped with a motor of resistance 4.0 Ω. The overhead line supplies 240 V DC and the ground is earthed at 0 V.
The upper supply line to the cars has a resistance of 0.025Ω/m The lower supply line is earthed – effectively R = 0. The circuit can be modelled as shown below:
1) Determine the ratio of Vm/Vw
2) Determine the ratio of Pm/Pw (the power dissipated by each motor)
AnswersProblem A1) Rtotal = 31.4Ω2) ID = 0.33A3) C=0.07 W, D=0.42 W, A=0.58 W, B=3.49 WProblem B1) 12V2) 0.167 A3) 72 4) 120 W5) M is off due to break in circuit, N stays constant.
Problem C (HARD)1) 1.075 2) 1.16
Page 9

Electronics Prac 2: The LDR and ThermistorAims1) to review the importance of a voltage divider circuit2) to experiment with two non-ohmic conductors
Equipment6 volt dry cell, switch, LDR, Thermistor, variable resistor, 6 cables, multimeter
Background An LDR is a semi-conductor (often cadmium sulphide) whose resistance varies typically
from 200 kΩ in darkness to a few kΩ in sunlight in response to the amount of light shone on the active surface.
A thermistor is also a variable resistor. At room temperature the resistance is typically in the kilo-ohm range and reduces to a few hundred ohms at temperatures of a few hundred degrees Celsius.
In each case both the devices conduct more readily with the input of energy, either light or heat: essentially what happens is that more free electrons are made in the semi-conductor in the presence of light or heat and hence the material conducts better and thus the resistance falls.
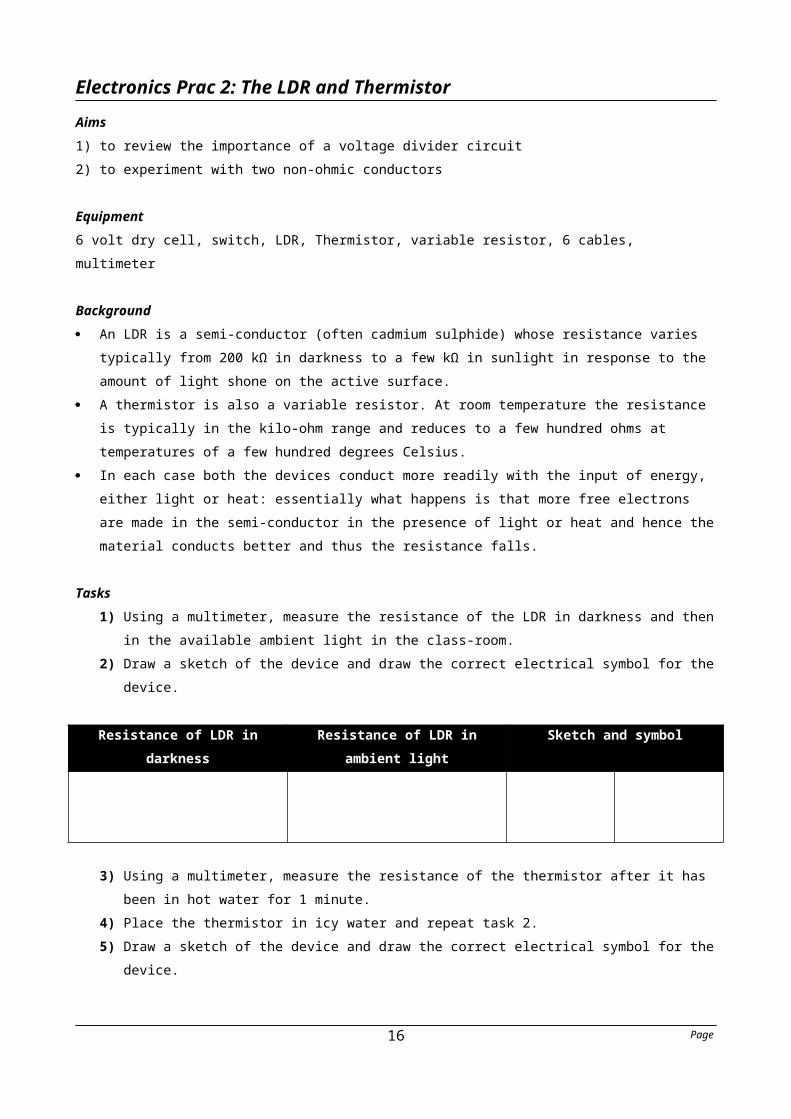
Tasks1) Using a multimeter, measure the resistance of the LDR in darkness and then in the
available ambient light in the class-room.2) Draw a sketch of the device and draw the correct electrical symbol for the device.
Resistance of LDR in darkness
Resistance of LDR in ambient light
Sketch and symbol
3) Using a multimeter, measure the resistance of the thermistor after it has been in hot water for 1 minute.
4) Place the thermistor in icy water and repeat task 2.5) Draw a sketch of the device and draw the correct electrical symbol for the device.
Resistance of thermistor in hot water
Resistance of thermistor in icy water
Sketch and symbol
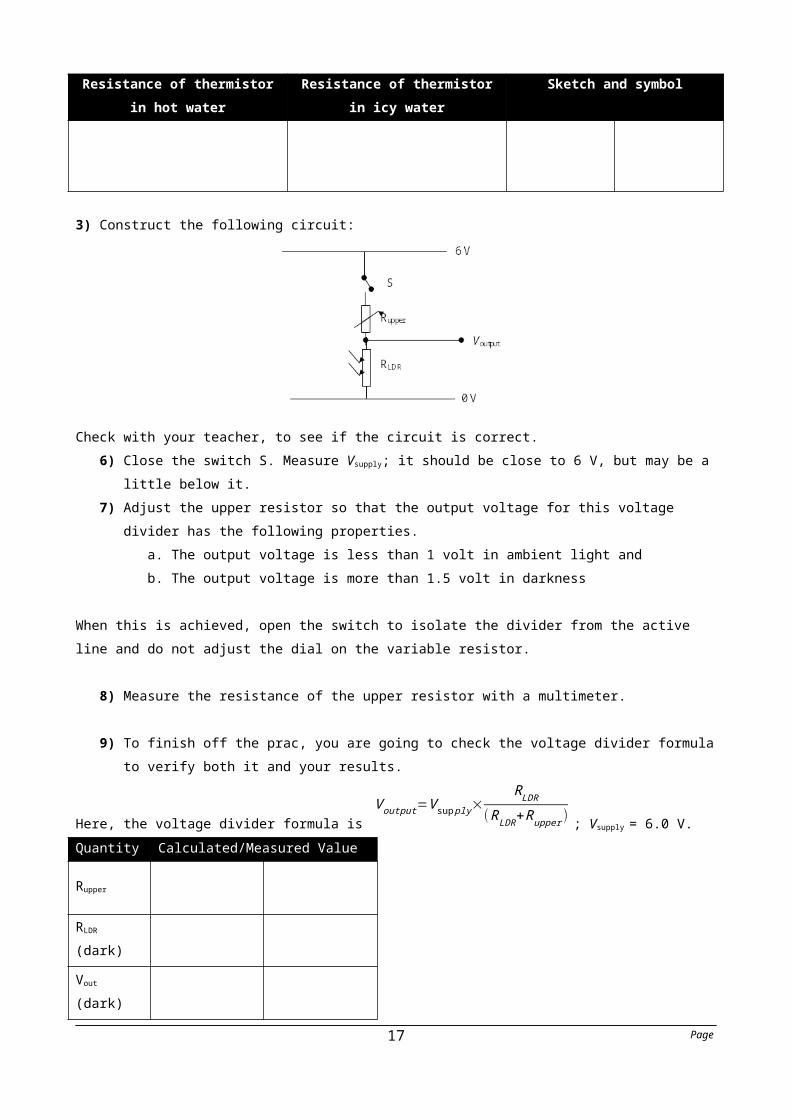
3) Construct the following circuit:
Page 10

Check with your teacher, to see if the circuit is correct.6) Close the switch S. Measure Vsupply; it should be close to 6 V, but may be a little below
it.7) Adjust the upper resistor so that the output voltage for this voltage divider has the
following properties.a. The output voltage is less than 1 volt in ambient light andb. The output voltage is more than 1.5 volt in darkness
When this is achieved, open the switch to isolate the divider from the active line and do not adjust the dial on the variable resistor.
8) Measure the resistance of the upper resistor with a multimeter.
9) To finish off the prac, you are going to check the voltage divider formula to verify both it and your results.
Here, the voltage divider formula is V output=V sup ply×
RLDR
( RLDR+Rupper ) ; Vsupply = 6.0 V.Quantity Calculated/Measured Value
Rupper
RLDR (dark)
Vout (dark)
RLDR (light)
Vout (light)
10) Use your textbook to find out the following words and write definitions in the table below.
Device Definition
Page 11

Transducer
Optical – electrical transducer
Electrical – optical transducer
Page 12

LDR and Thermistor problems
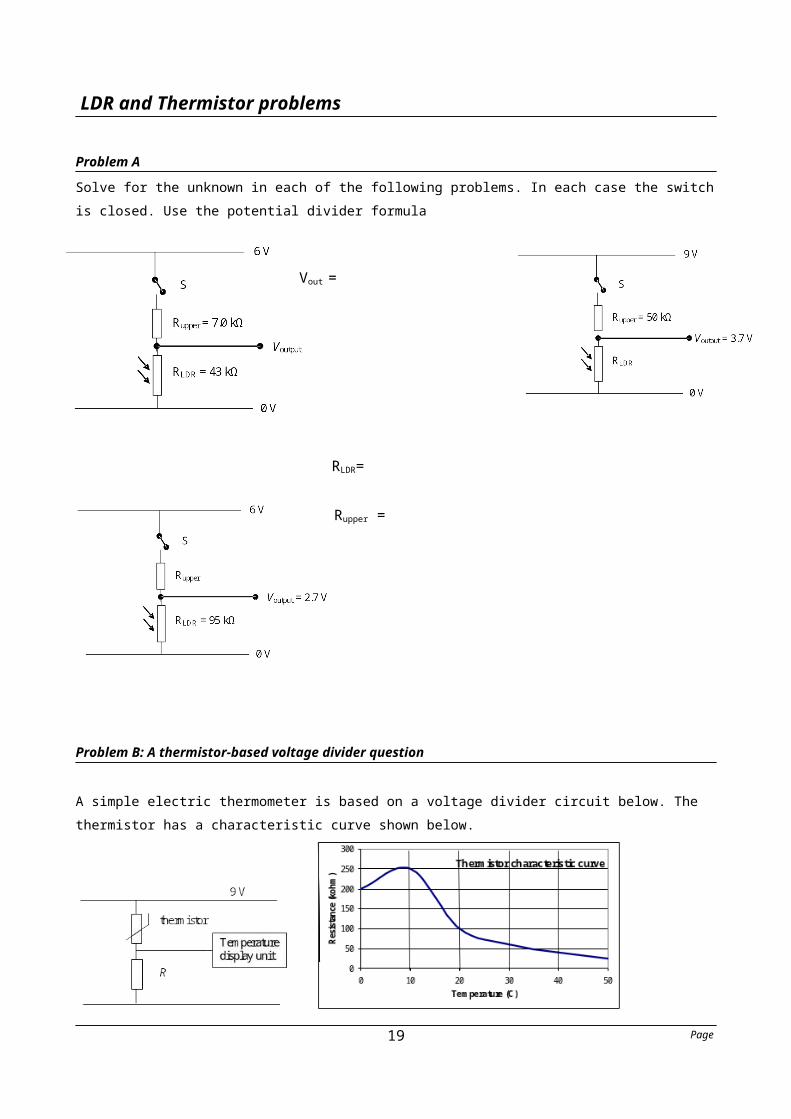
Problem ASolve for the unknown in each of the following problems. In each case the switch is closed. Use the potential divider formula
Problem B: A thermistor-based voltage divider question
A simple electric thermometer is based on a voltage divider circuit below. The thermistor has a characteristic curve shown below.
1) State the temperature when the resistance of the thermistor is 50 kΩ. ______________The designers of the unit require the voltage input to the display unit to be 4.0 V when the temperature is 20 C.2) Calculate the value of the resistance R that will achieve this.
Page
Vout =
Rupper =
RLDR=
13

3) Using your value for R in Question 2, determine the temperature when the voltage across the display unit is 3.0 V.
4) What is the output voltage to the display unit when the temperature is 50 C?
Problem C: Voltage divider problem solving task.A light dependent resistor or LDR is placed in series with a resistor of resistance R in a potential divider circuit. This is shown in Figure 1.
The table below gives the resistance of the light dependent resistor in light and dark conditions.
light 0.40 k
dark 30 kIt is required that the output voltage Vout of the potential divider is
a) greater than 1.5 V in the dark and b) less than 1.0 V in light conditions.
1) Use calculations and explain your reasoning to choose an appropriate value for R that satisfies both conditions a) and b). 2) Show that your value for R chosen works.
Page 14

AnswersProblem A 1) 5.16 V 2) 35 k 3) 116 k Problem B 1) 35o 2) 80 k 3) 16o 4) 6.9 V Problem C To be marked by teacher!
Page 15
Electronics Prac 3 – Learning how to use a CRO
AimTo revise the confident use of a CRO as a voltage measuring device but one that gives a visual display.
EquipmentCRO 1 × 6 volt dry cell1 × power supply 1 × multimeter
Background A CRO is just a visual voltmeter which can be used to measure constant and time-varying
voltages. If the voltages are periodic, they can be used to measure the period and hence the frequency of the signal. The CRO will give you a graph of voltage as a function of time, v(t). The controls on the CRO translate and stretch the time and voltage axes to obtain a clear picture.
As a convention in this lab, make the left hand yellow AC outlet the ACTIVE with the right hand AC outlet the neutral as a default. This will mean that there is only one correct way to connect the CRO to the circuit where the red wire of the co-axial cable is the ACTIVE input for the CRO.
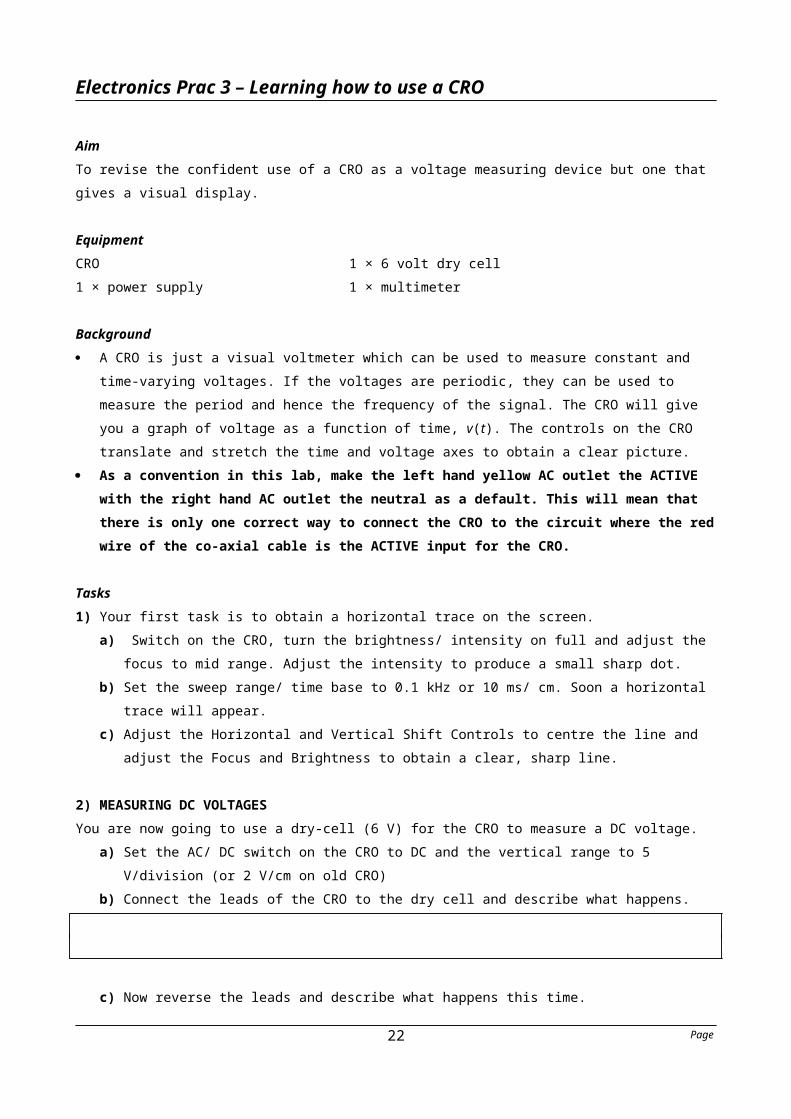
Tasks1) Your first task is to obtain a horizontal trace on the screen.
a) Switch on the CRO, turn the brightness/ intensity on full and adjust the focus to mid range. Adjust the intensity to produce a small sharp dot.
b) Set the sweep range/ time base to 0.1 kHz or 10 ms/ cm. Soon a horizontal trace will appear.
c) Adjust the Horizontal and Vertical Shift Controls to centre the line and adjust the Focus and Brightness to obtain a clear, sharp line.
2) MEASURING DC VOLTAGESYou are now going to use a dry-cell (6 V) for the CRO to measure a DC voltage.
a) Set the AC/ DC switch on the CRO to DC and the vertical range to 5 V/division (or 2 V/cm on old CRO)
b) Connect the leads of the CRO to the dry cell and describe what happens.
c) Now reverse the leads and describe what happens this time.
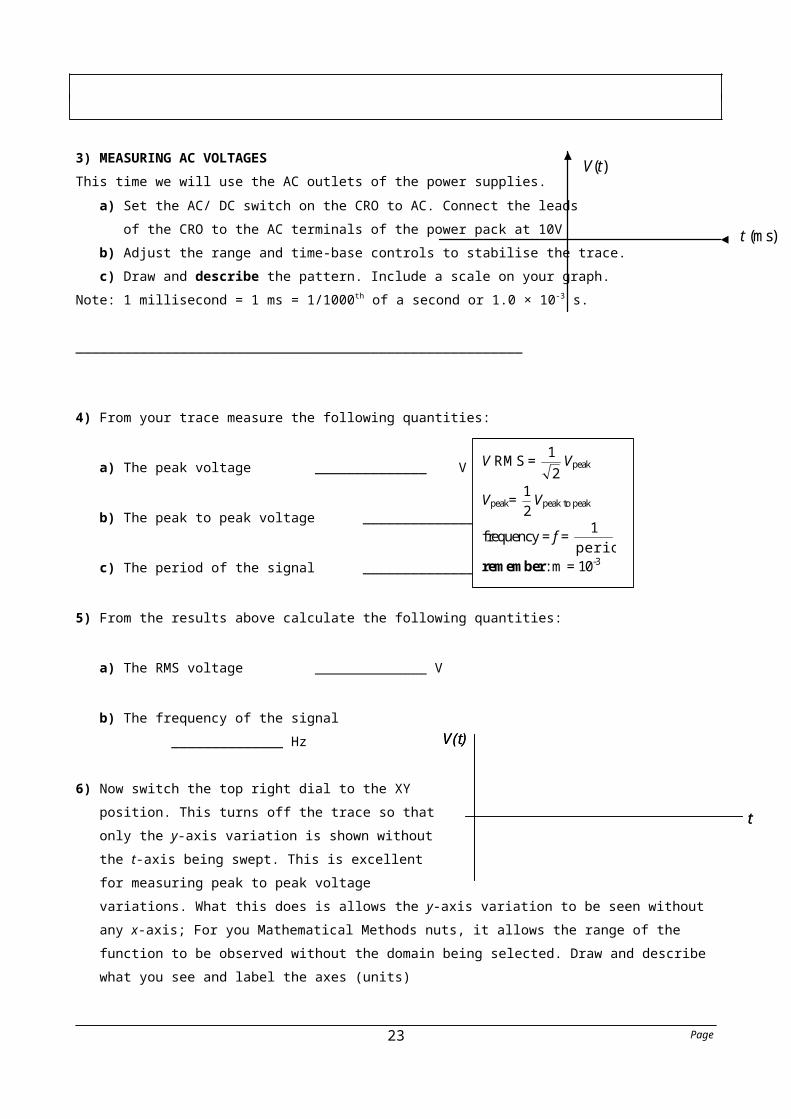
3) MEASURING AC VOLTAGESThis time we will use the AC outlets of the power supplies.
a) Set the AC/ DC switch on the CRO to AC. Connect the leads of the CRO to the AC terminals of the power pack at 10V
Page
V(t)
t (ms) 16
b) Adjust the range and time-base controls to stabilise the trace.c) Draw and describe the pattern. Include a scale on your graph.
Note: 1 millisecond = 1 ms = 1/1000th of a second or 1.0 × 10⁻³ s.
________________________________________________________
4) From your trace measure the following quantities:
a) The peak voltage ______________ V
b) The peak to peak voltage ______________ V
c) The period of the signal ______________ ms
5) From the results above calculate the following quantities:
a) The RMS voltage ______________ V
b) The frequency of the signal ______________ Hz
6) Now switch the top right dial to the XY position. This turns off the trace so that only the y-axis variation is shown without the t-axis being swept. This is excellent for measuring peak to peak voltage variations. What this does is allows the y-axis variation to be seen without any x-axis; For you Mathematical Methods nuts, it allows the range of the function to be observed without the domain being selected. Draw and describe what you see and label the axes (units)
7) Use a CRO to measure the peak-to-peak voltage and a multimeter to measure the RMS voltage across the power supply. Fill out the table below. Note: Use the AC voltage setting on the multimeter.
Power Pack Setting(Volts)
Multimeter Reading (Volts)
Calculated Peak-to-Peak
Voltage (Multimeter x
22)
CROPeak-to-Peak Voltage (V)
2
4
6
Page
V RMS = 2
1 Vpeak
Vpeak= 21 Vpeak to peak
frequency = f = period
1
remember: m = 10-3
V(t)
t
V(t)
t
17

8
8) Comment on the results of the last two columns.
Page 18
Electronics Prac 4 – DiodesIntroduction Diodes are one of many electronic devices that are made from semiconductors.
Semiconductors are Group 4 elements such as Silicon and Germanium that have been doped with small amounts of Group 3 and 5 elements. These group 4 elements in the periodic table form crystals in their pure state.
Semiconductors doped with group 3 elements are called p-type semiconductors. Though the material is elecrically neutral, they have insufficient electrons for the number of atoms and hence the material has a virtual positive charge.
Semiconductors doped with group 5 elements are called n-type semiconductors. These materials have virtual negative charges.
When p-type and n-type are joined a p-n junction is formed and this junction is the heart of the diode and gives it its unique properties. At the join the virtual positive charges neutralise the virtual negative charges to create a thin wafer of material that does not conduct, this wafer is called the depletion zone. Adding a positive voltage (this is called forward biasing) overcomes this and after the applied voltage exceeds about 0.70 V the junction conducts. Adding a voltage in the opposite direction (this is called reverse biasing) only adds to making the wafer thicker and consequentally the diode insulates even better
Diodes have the property that they allow current to flow through them in one direction only. This is reflected in the fact their electrical resistance depends on which way they are connected to the circuit.
Diodes are used mostly in converting AC voltages to DC voltages and hence will re-appear later in the course.
TasksThe aim of this prac is to investigate the electrical properties of a typical diode
1) TESTING A DIODEConnect the diode and a light globe in series across a supply voltage of 6 V using a dry-cell battery. Determine which way the diode needs to be placed in the circuit for the light to go on.Diodes conduct electricity one way (provided the forward bias is great enough) but not the other way.Using the positive terminal of the battery and the markings on the diode, draw in the space below the circuit diagram for when the light works, showing the polarity of the battery and the orientation of the diode.
Page
2)
1)
19

2) VOLTAGE-CURRENT CHARACTERISTICS OF A DIODESketch the graph of the diode characteristics in Fig 4.12 on page 87 of the text book.
Page 20

3) USING A DIODE IN A CIRCUITConnect up in series a diode and a 1 kΩ resistor to a DC power supply. Use a multimeter to measure the voltage across both the diode and the 1 kΩ resistor separately for each of the DC voltage settings on the power supply.
DC SupplyDial setting (V)
DC Supply voltage measured (V)
Voltage acrossthe Diode (V)
Voltage acrossthe Resistor (V)
2
4
6
8
10
12
A silicon based semiconductor will have a maximum voltage of about 0.70 V across it whereas a germanium based semiconductor will have a maximum voltage of only 0.10 V across it when forward biased. What type of diode are you working with? _____________________________
Diode Problems1) Find the value of the unknown resistor in the circuit
below. [Hint: What is the voltage across and the current through the resistor?]
2) What would happen to the circuit if the resistance was R = 2.0 Ω?
3) What is the voltage V on the right hand side of the diode in the circuit shown? [Hint: the supply voltage is 6.0 V and a silicon-diode will only take a maximum of 0.70 V across it under normal operating conditions.]
Page 21
4) Hence, what is the voltage drop across the 750 Ω resistor?
5) What is the current through the diode and hence the 750 Ω resistor?
6) What is the effective resistance of the diode?
7) What is the power absorbed by the diode?
8) Re-draw the circuit above like Question 1. That is, as a potential divider circuit with the diode in series with the 750 Ω resistor.
It is important that you understand the similarities between the circuits.
Answers1) 237
Page 22
2) Current would increase until diode burns out.3) 5.3 V4) 5.3 V 5) 7 mA 6.) 99 7) 4.9 mW
Page 23

Electronics Prac 5 – Light Emitting Diodes (LEDs)
Introduction Light emitting diodes are semi-conducting devices that have properties similar to a
standard diode, but the convert the electrical energy absorbed into visible light. They can be made to emit red, blue, green and more recently white light [broad spectrum].
They are designated in electrical circuits with the symbol:
Because they convert electrical energy into light they are considered to be electro-optical transducers unlike the LDR, which converts light input into an electrical variation and is considered to be an optico-electrical transducer.
For a typical LED, about 20 – 30 mA is required to produce a strong light output and they typically have, like all diodes, a maximum voltage. In the case of LEDs this is about 1.6 – 1.8 for red LED’s and 2.3 V for green and yellow LEDs. Hence, you always place an LED in series with a second protective resistance and like all diodes they conduct one way but not the other.
TasksThe aim of the prac is to investigate the elecrical and optical properties of a typical LED.
1) Constuct the circuit below and copy the diagram into your prac book.
2) This circuit will allow you to vary the voltage across the LED using a rheostat. The resistor in series with the LED is to ensure that the current cannot be sufficiently great to damage
the LED. Would a 10 Ω resistor be suitable for this task? [ I =
VR ]
Page 24

3) Move the rheostat arm from A to B and check that the LED lights up. This tests that the circuit is operational. Connect a voltmeter across the LED and a milliammeter in series with the LED.
4) Complete the table below – calculating the additional quantities of Resistance and PowerAdjust the rheostat arm so that there is 0.1 V across the LED. Measure and record the voltage across and the current through the LED. Now increase the voltage by 0.10 V and repeat. Also make comments about the brightness of the light emitted by the diode.
Voltage (V) Current (mA) Resistance (Ω) Power (mW) Brightness
0.1
0.3
0.6
1.1
1.4
1.6
1.7
1.75
1.8
1.9
2.2
2.4
2.6
5) Plot the characteristic curve for the LED.
6) State what happens to the resistance of the LED as the voltage across it increases.
7) State what the LED does as the power absorbed increases – into what form is the energy transferred? Find out if it does this with 100% efficiency.
Page 25

LED Problem
1) Give an example of an opto-electrical transducer and an electro-optical transducer clearly stating how they are different.
A green LED has a characteristic curve shown below. David and Marsha propose to use the LED as a display light for an amplifier they are building. It is proposed that the LED will run with a current of 20 mA. The maximum current for the LED is 70 mA. The circuit is shown
below.
2) Determine the value of the resistor R so that the LED will run with a current of 20 mA.
3) What is the power consumed by the circuit in operation?
Marsha suggests lowering the resistance of R to 50 Ω.4) Discuss the implication if this is attempted.
Answers1) Your teacher will check your definition!2) 505 3) 0.24 W
Page 26

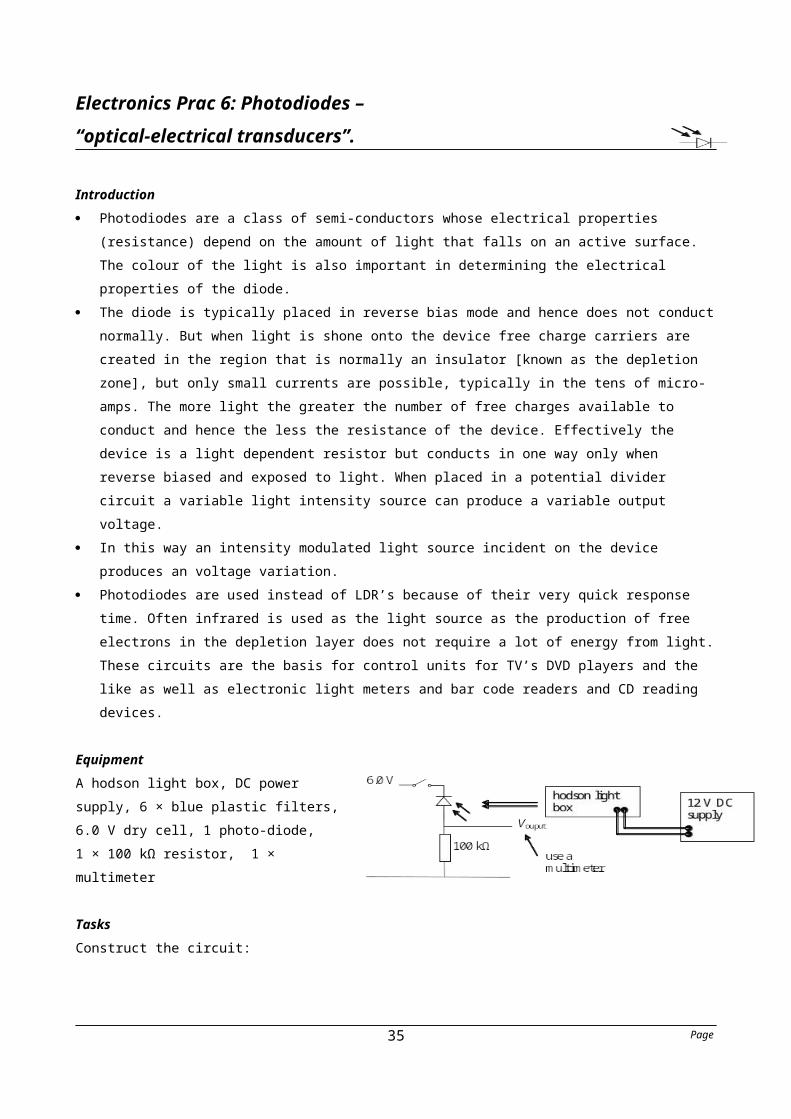
Electronics Prac 6: Photodiodes – “optical-electrical transducers”.
Introduction Photodiodes are a class of semi-conductors whose electrical properties (resistance)
depend on the amount of light that falls on an active surface. The colour of the light is also important in determining the electrical properties of the diode.
The diode is typically placed in reverse bias mode and hence does not conduct normally. But when light is shone onto the device free charge carriers are created in the region that is normally an insulator [known as the depletion zone], but only small currents are possible, typically in the tens of micro-amps. The more light the greater the number of free charges available to conduct and hence the less the resistance of the device. Effectively the device is a light dependent resistor but conducts in one way only when reverse biased and exposed to light. When placed in a potential divider circuit a variable light intensity source can produce a variable output voltage.
In this way an intensity modulated light source incident on the device produces an voltage variation.
Photodiodes are used instead of LDR’s because of their very quick response time. Often infrared is used as the light source as the production of free electrons in the depletion layer does not require a lot of energy from light. These circuits are the basis for control units for TV’s DVD players and the like as well as electronic light meters and bar code readers and CD reading devices.
EquipmentA hodson light box, DC power supply, 6 × blue plastic filters, 6.0 V dry cell, 1 photo-diode, 1 × 100 kΩ resistor, 1 × multimeter
TasksConstruct the circuit:
PART 1 – Complete results in the table1) Close the switch and record the output voltage
of the divider circuit in darkness and in light with the light from a hodson light box shining directly onto the photodiode. NOTE: If the light is too bright, Vout will be > 6.0V due to the diode becoming forward biased. Operate in conditions so Vout < 6.0V, so the photodiode is reversed biased.
2) Determine the voltage across the photodiode in darkness and in light
Page 27
Quantity Light Dark
Vout (V100k)
Vphotodiode
I100k
Iphotodiode
P100k
Pphotodiode

3) Use your results to calculate the current flowing in the photodiode in darkness and in light. Hint: you know the voltage drop across the 100 kΩ resistor in both dark and light conditions.
4) From the above determine the electrical power absorbed by the photodiode in light and dark conditions. ( P = VI).
5) Why is a 100 kΩ resistor chosen in series with a photodiode, why not 100 Ω?
PART 2Now set the hodson light box up so that a narrow beam of light strikes the active surface of the photodiode. In this part of the practical exercise, you are going to methodically adjust the amount of light striking the surface of the photodiode by placing 1, 2, 3, 4, 5 and 6 blue filters between the diode and the light source. In this way we can make a simple prototype light intensity sensor.The applications for this include electrical devices that can measure the turbidity of water samples (remember the Hach kit in Year 10 Science?) or sensing devices that can adjust lighting conditions due to variations in natural lighting through to devices that can read intensity modulated light signals.
1) Collect the following information in a table:
# of filters
Output voltage
(V)
1
2
3
4
5
6
2) Plot a graph of output voltage versus the number of filters and explain the trend in the data.
Page 28
Page 29

Electronics Prac # 7. Capacitors
Equipment: 6 V battery, 100 F capacitor, 10 k resistor, stop watch, voltmeter, CRO
Capacitors consist of a sandwich of two metal plates separated by a thin insulator. They are usually rolled up into a cylinder and put in a small can with two wires coming out that are connected to the two plates.
They are used for storing electrical charge. This property is very useful in electronics circuits and power supplies. The amount of charge that a capacitor can store is determined by its capacity and the voltage across the two plates.
Quantity of Stored Charge (Coulomb) = Capacitance (Farad) x Voltage (Volt)
Q = C x V
A Farad is a very large quantity. Capacitor values are normally much smaller and expressed in microfarads ( F), nanofarads (nF) and picofarads (pF).
Find out what micro-, nano- and pico- mean.
micro : .................... nano : ..................... pico : ..................
Calculate the quantity of charge stored on a capacitor of 100 F, when 12 volts is applied to it.______________________________________________________________________
______________________________________________________________________
Look up the appendix on page 517 of your text book to find the charge on the electron, and calculate the number of electrons that have been transferred from one plate to the other.______________________________________________________________________
______________________________________________________________________
______________________________________________________________________
Page 30

A) THE CHARGING PROCESS
Connect the circuit up as shown. Ensure that the positive end of the capacitor, the longer wire, will connect to the positive end of the 6 V battery.
The voltmeter monitors the voltage across the 10k ohm resistor and thus by Ohm's Law, also the current going through the circuit to charge up the capacitor. So if the voltage across the resistor changes, so also does the current through the resistor change.
Now connect the positive end of the capacitor to the positive of the battery to complete the circuit.
Describe how the voltage across the resistor changes during the charging process.______________________________________________________________________
______________________________________________________________________
Now, in the light of the paragaph above, describe how the current through the resistor changes during the charging process.
______________________________________________________________________
______________________________________________________________________
B) THE DISCHARGING PROCESS
Reverse the voltmeter leads across the resistor. Now disconnect the positive end capacitor from the battery and connect it to the negative end of the battery, thus bypassing the battery. This now discharges the capacitor through the resistor and you can observe and describe how the voltage and current changes.______________________________________________________________________
______________________________________________________________________
______________________________________________________________________
Page 31

C) THE TIME CONSTANT
The time taken for the charging and discharging process to occur depends on the resistor and capacitor values in the circuit. The time for the voltage to rise to 63% of its final value is called the Time Constant. You will need a stop watch for this part of the experiment.
Connect the circuit up as follows using a 6V battery
Adjust the timebase of the CRO to give a straight line on the screen. Set the input controls so that you can observe a 6 Volt deflection. Connect the CRO across the battery to check how close to 6 Volts the battery is.
You can use the stopwatch to measure the time it takes for the voltage across the capacitor to rise from 0 Volts to 6 Volts. Start the watch as you remove the clip lead.
Reading (sec): ...................
You will have found this time is difficult to measure as it is hard to tell when the capacitor is fully charged.
The Time Constant gets over these problems. The Time Constant, the time taken to charge to 63% of the fully charged voltage. It can also be calculated from the relationship :
τ = R . C
Calculate 63% of the charging voltage and find out where that value is on the CRO screen.Now discharge the capacitor with the clip lead and repeat the experiment, but this time measuring the time to reach 63% of the charging voltage and enter in the table over the page.
Page 32

For the following values measure and calculate the time constants:
Capacitor Resistor Measured Time Constant (s)
Calculated Time Constant (s)
100 µF10 k
100 µF100 k
10 µF10 k
D) CAPACITORS AND AC VOLTAGES
Connect the circuit as follows. Make sure the multimeter is switched to the AC ranges.
Switch on the AC voltage and note if there is any voltage across the resistor.
Is there any AC current in the resistor 1 minute after switching on? ........
Describe how capacitors respond to AC and DC voltages.
______________________________________________________________________
______________________________________________________________________
______________________________________________________________________
______________________________________________________________________
Page 33

Electronics Prac #8. DC Power Supplies
Many electrical appliances, particularly portable ones, are designed to run off both AC and DC. To do this the appliance needs circuitry that can convert 240 V AC into, for example, 9 V DC.
This is done in several stages.
1. Transformer: Reduces the 240 V AC to a lower AC voltage usually about 6 - 30 V AC. Your power supply uses a variable transformer. We will be looking at how the transformer works in the next topic.
2. Rectifier: Changes the AC voltage into DC voltage.3. Filter: Smooths out the variation in the voltage level.4. Regulator: Keeps the voltage steady as the current supplied varies (unlike a battery). This
is not part of the course.
Rectification of AC VoltageThe backwards and forwards mode of AC needs to be changed into voltage going in only one direction. The behaviour of diodes is ideal for this purpose.
The Half Wave RectifierSet up the following circuit.
The 56 ohm resistor is used to limit the current in case of a short circuit and to protect the diode.
Turn on the CRO and switch it to DC. Connect the CRO from point A to the base line. Adjust the settings on the CRO to obtain a couple of cycles. In the space below draw a picture of the AC input voltage to the rectifier as accurately as possible. Then conect to B.
Voltage at A Voltage at B
Page
240 V AC Transformer Rectifier Filter Regulator 9 V DC
34
The signal at B is called half-wave rectified, for an obvious reason.
Explain why don’t you see other half of the wave?
..........................................................................................................................................................
.........................................................................................................................................
.................
Capacitive SmoothingTo smooth out the voltage we use a capacitor in combination with the load resistor. Calculate the Time Constant with the 10 F capacitor and the load resistor:..........................................................................................................................................................Now connect the free end of the 10 F capacitor to the base line and draw the CRO picture.
Replace the 10 F capacitor with the 100 F capacitor.What is the new Time Constant?............................................................................................................
Draw the picture on the CRO.How do the last two pictures differ?....................................................................................................................................................................................................................................................................................................................In the half of the cycle when the current is flowing through the load resistor, i.e when the diode is conducting, the capacitor is being charged up.
When there is no current, i.e. the diode is not conducting, the capacitor discharges through the load resistor with a time constant that depends on both the load resistor and the capacitor. The larger capacitor gives a longer Time Constant, so the voltage stays higher for longer until the next cycle comes through.
Even though the voltage with the larger capacitor looks very straight, there is still some variation or a “ripple voltage” as it is called. To see the ripple voltage we need to remove the steady DC component from the input signal to the CRO and just look at the variation.
Page 35

Switch the CRO to AC. The trace now shows only the variation about the average value for the voltage. You should get a flat line across the middle of the screen, but there is still a very small variation. You can see this variation by increasing the sensitivity of the vertical scale.
The flatter the voltage line, the closer the voltage is to the DC voltage of a battery. This closeness is measured by the size of the peak-to peak voltage of this ripple in the voltage.
Use the scale on the CRO to measure the ripple voltage, i.e. the peak to peak voltage. __________
Page 36