pices_mar2015ppt
TRANSCRIPT

Evaluation of potential trophic impacts from hake(M. merluccius) emergence in the North Sea.
3rd International SymposiumEffects of Climate Changes on World’s Ocean
Xochitl Cormon1, A. Kempf2, K. Rabhi1, M. Rouquette1,Y. Vermard3, M. Vinther4 and P. Marchal1
1IFREMER, Channel and North Sea Fisheries Research Unit, Boulogne-sur-Mer
2Thünen Institute, Institute of Sea Fisheries, Hamburg
3IFREMER, Unit of Fisheries Ecology and Modelling, Nantes
4Denmark Technical University, DTU Aqua, Charlottenlund
21-27 March 2015, Santos, Brazil

Introduction Species presentation
Saithe and hake in the North Sea
?COMPETITION
?
[email protected] Hake emergence trophic impacts PICES 2015, 27 March 1 / 8

Introduction Species presentation
Saithe and hake in the North Sea
?COMPETITION
?
2000 2002 2004 2006 2008 2010 2012
−2
−1
01
2
2000 2002 2004 2006 2008 2010 2012
−2
−1
01
2
2000 2002 2004 2006 2008 2010 2012
−2
−1
01
2 SaitheHake Q1Hake Q3
Standardized spawning stock biomass trends (ICES, 2013; Baudron and Fernandes, 2014)[email protected] Hake emergence trophic impacts PICES 2015, 27 March 1 / 8

Introduction State of the knowledge
Step by step towards competition theory (Link and Auster,2013)
1. Opposite trends
2000 2002 2004 2006 2008 2010 2012
−2
−1
01
2
2000 2002 2004 2006 2008 2010 2012
−2
−1
01
2
2000 2002 2004 2006 2008 2010 2012
−2
−1
01
2 SaitheHake Q1Hake Q3
Since early 2000’s in the NorthSea:
Opposite trends ofpopulation abundance.
Increase of hake probabilityof presence and ofsaithe-hake overlap.Importance of temperatureand Norway pout presencefor probable habitats.Potential diet overlap.
[email protected] Hake emergence trophic impacts PICES 2015, 27 March 2 / 8

Introduction State of the knowledge
Step by step towards competition theory (Link and Auster,2013)
2. Spatial overlap,Cormon et al., 2014
0 5 10
52
54
56
58
60
0.0
0.2
0.4
0.6
0.8
1.0
0 5 10
52
54
56
58
60
−0.4
−0.2
0.0
0.2
0.4
0 5 10
52
54
56
58
60
0.0
0.2
0.4
0.6
0.8
1.0
0 5 10
52
54
56
58
60
−0.4
−0.2
0.0
0.2
0.4
Winter and Summer, (2007-2012) - (1991-1996)
Since early 2000’s in the NorthSea:
Opposite trends ofpopulation abundance.Increase of hake probabilityof presence and ofsaithe-hake overlap.
Importance of temperatureand Norway pout presencefor probable habitats.Potential diet overlap.
[email protected] Hake emergence trophic impacts PICES 2015, 27 March 2 / 8
Introduction State of the knowledge
Step by step towards competition theory (Link and Auster,2013)
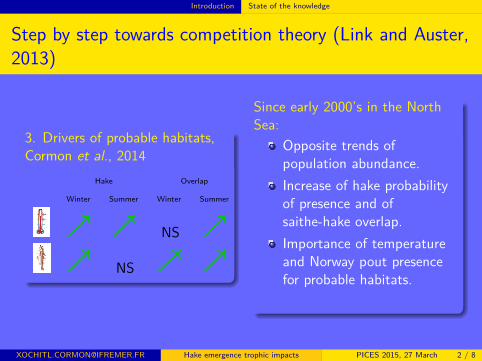
3. Drivers of probable habitats,Cormon et al., 2014
Hake Overlap
Winter Summer Winter Summer
NS
NS
Since early 2000’s in the NorthSea:
Opposite trends ofpopulation abundance.Increase of hake probabilityof presence and ofsaithe-hake overlap.Importance of temperatureand Norway pout presencefor probable habitats.
Potential diet overlap.
[email protected] Hake emergence trophic impacts PICES 2015, 27 March 2 / 8
Introduction State of the knowledge
Step by step towards competition theory (Link and Auster,2013)
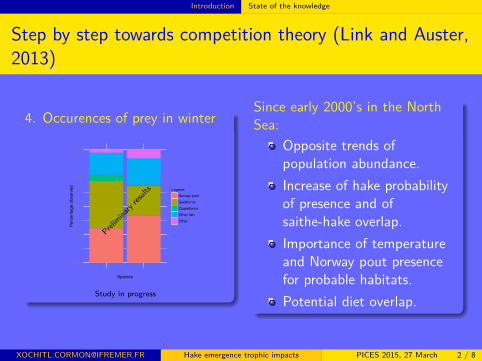
4. Occurences of prey in winter
0.00
0.25
0.50
0.75
1.00
H SSpecies
Per
cent
agem
obse
rved Legend
Norwaympout
Gadiforms
Clupeiforms
Othermfish
Other
Prelim
inaryresults
Study in progress
Since early 2000’s in the NorthSea:
Opposite trends ofpopulation abundance.Increase of hake probabilityof presence and ofsaithe-hake overlap.Importance of temperatureand Norway pout presencefor probable habitats.Potential diet overlap.
[email protected] Hake emergence trophic impacts PICES 2015, 27 March 2 / 8

Introduction State of the knowledge
Step by step towards competition theory (Link and Auster,2013)
5. Limiting resources?Last but not least condition toassume competition
Since early 2000’s in the NorthSea:
Opposite trends ofpopulation abundance.Increase of hake probabilityof presence and ofsaithe-hake overlap.Importance of temperatureand Norway pout presencefor probable habitats.Potential diet overlap.
[email protected] Hake emergence trophic impacts PICES 2015, 27 March 2 / 8

Introduction Objectives
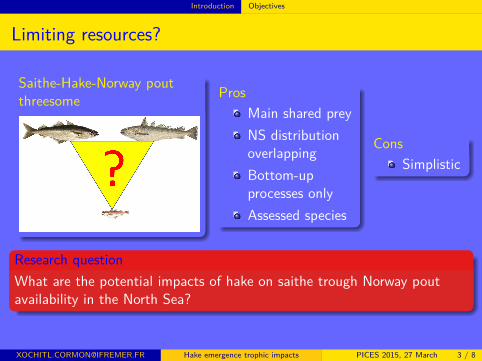
Limiting resources?
Saithe-Hake-Norway poutthreesome
[email protected] Hake emergence trophic impacts PICES 2015, 27 March 3 / 8

Introduction Objectives
Limiting resources?
Saithe-Hake-Norway poutthreesome Pros
Main shared prey
NS distributionoverlappingBottom-upprocesses onlyAssessed species
[email protected] Hake emergence trophic impacts PICES 2015, 27 March 3 / 8

Introduction Objectives
Limiting resources?
Saithe-Hake-Norway poutthreesome Pros
Main shared preyNS distributionoverlapping
Bottom-upprocesses onlyAssessed species
[email protected] Hake emergence trophic impacts PICES 2015, 27 March 3 / 8

Introduction Objectives
Limiting resources?
Saithe-Hake-Norway poutthreesome Pros
Main shared preyNS distributionoverlappingBottom-upprocesses only
Assessed species
[email protected] Hake emergence trophic impacts PICES 2015, 27 March 3 / 8

Introduction Objectives
Limiting resources?
Saithe-Hake-Norway poutthreesome Pros
Main shared preyNS distributionoverlappingBottom-upprocesses onlyAssessed species
[email protected] Hake emergence trophic impacts PICES 2015, 27 March 3 / 8

Introduction Objectives
Limiting resources?
Saithe-Hake-Norway poutthreesome Pros
Main shared preyNS distributionoverlappingBottom-upprocesses onlyAssessed species
ConsSimplistic
[email protected] Hake emergence trophic impacts PICES 2015, 27 March 3 / 8
Introduction Objectives
Limiting resources?
Saithe-Hake-Norway poutthreesome Pros
Main shared preyNS distributionoverlappingBottom-upprocesses onlyAssessed species
ConsSimplistic
Research questionWhat are the potential impacts of hake on saithe trough Norway poutavailability in the North Sea?
[email protected] Hake emergence trophic impacts PICES 2015, 27 March 3 / 8

Materials and methods SMS
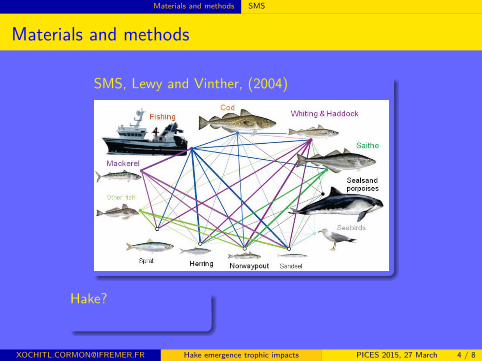
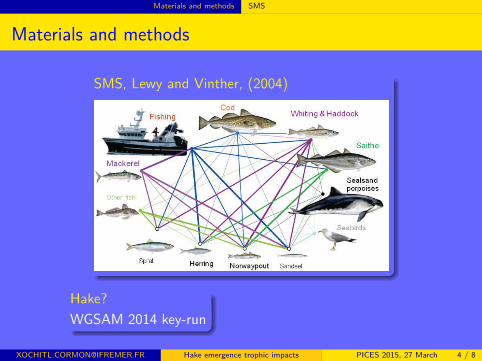
Materials and methods
SMS, Lewy and Vinther, (2004)
[email protected] Hake emergence trophic impacts PICES 2015, 27 March 4 / 8
Materials and methods SMS
Materials and methods
SMS, Lewy and Vinther, (2004)
Hake?
WGSAM 2014 key-run
[email protected] Hake emergence trophic impacts PICES 2015, 27 March 4 / 8
Materials and methods SMS
Materials and methods
SMS, Lewy and Vinther, (2004)
Hake?WGSAM 2014 key-run
[email protected] Hake emergence trophic impacts PICES 2015, 27 March 4 / 8

Materials and methods SMS
Materials and methods
SMS, Lewy and Vinther, (2004)
Hake?WGSAM 2014 key-run
Bottom-up?
Cormon et al., in prep
[email protected] Hake emergence trophic impacts PICES 2015, 27 March 4 / 8

Materials and methods SMS
Materials and methods
SMS, Lewy and Vinther, (2004)
Hake?WGSAM 2014 key-run
Bottom-up?Cormon et al., in prep
[email protected] Hake emergence trophic impacts PICES 2015, 27 March 4 / 8

Materials and methods Parametrization and scenarios
Parametrization and scenarios
Parametrization
Stock-recruitment: Ricker (saithe & Norway pout), deterministic.Saithe growth: VBGF and linear relationship between K and Norwaypout average on two yearsConsumption rates: Allometric relationship with mean weight.Fishery mortality: Status-quo from hindcast.Hindcast & Forecast: 1974-2013 & 2014-2065.
ScenariosStatus-quo Growth Extreme Moderate
Growth X O O OHake change 1 1 1.10 1.05Period 2011-2013 2011-2013 2014-2025 2014-2025
[email protected] Hake emergence trophic impacts PICES 2015, 27 March 5 / 8

Materials and methods Parametrization and scenarios
Parametrization and scenarios
ParametrizationStock-recruitment: Ricker (saithe & Norway pout), deterministic.
Saithe growth: VBGF and linear relationship between K and Norwaypout average on two yearsConsumption rates: Allometric relationship with mean weight.Fishery mortality: Status-quo from hindcast.Hindcast & Forecast: 1974-2013 & 2014-2065.
ScenariosStatus-quo Growth Extreme Moderate
Growth X O O OHake change 1 1 1.10 1.05Period 2011-2013 2011-2013 2014-2025 2014-2025
[email protected] Hake emergence trophic impacts PICES 2015, 27 March 5 / 8

Materials and methods Parametrization and scenarios
Parametrization and scenarios
ParametrizationStock-recruitment: Ricker (saithe & Norway pout), deterministic.Saithe growth: VBGF and linear relationship between K and Norwaypout average on two years
Consumption rates: Allometric relationship with mean weight.Fishery mortality: Status-quo from hindcast.Hindcast & Forecast: 1974-2013 & 2014-2065.
ScenariosStatus-quo Growth Extreme Moderate
Growth X O O OHake change 1 1 1.10 1.05Period 2011-2013 2011-2013 2014-2025 2014-2025
[email protected] Hake emergence trophic impacts PICES 2015, 27 March 5 / 8

Materials and methods Parametrization and scenarios
Parametrization and scenarios
ParametrizationStock-recruitment: Ricker (saithe & Norway pout), deterministic.Saithe growth: VBGF and linear relationship between K and Norwaypout average on two yearsConsumption rates: Allometric relationship with mean weight.
Fishery mortality: Status-quo from hindcast.Hindcast & Forecast: 1974-2013 & 2014-2065.
ScenariosStatus-quo Growth Extreme Moderate
Growth X O O OHake change 1 1 1.10 1.05Period 2011-2013 2011-2013 2014-2025 2014-2025
[email protected] Hake emergence trophic impacts PICES 2015, 27 March 5 / 8

Materials and methods Parametrization and scenarios
Parametrization and scenarios
ParametrizationStock-recruitment: Ricker (saithe & Norway pout), deterministic.Saithe growth: VBGF and linear relationship between K and Norwaypout average on two yearsConsumption rates: Allometric relationship with mean weight.Fishery mortality: Status-quo from hindcast.
Hindcast & Forecast: 1974-2013 & 2014-2065.
ScenariosStatus-quo Growth Extreme Moderate
Growth X O O OHake change 1 1 1.10 1.05Period 2011-2013 2011-2013 2014-2025 2014-2025
[email protected] Hake emergence trophic impacts PICES 2015, 27 March 5 / 8

Materials and methods Parametrization and scenarios
Parametrization and scenarios
ParametrizationStock-recruitment: Ricker (saithe & Norway pout), deterministic.Saithe growth: VBGF and linear relationship between K and Norwaypout average on two yearsConsumption rates: Allometric relationship with mean weight.Fishery mortality: Status-quo from hindcast.Hindcast & Forecast: 1974-2013 & 2014-2065.
ScenariosStatus-quo Growth Extreme Moderate
Growth X O O OHake change 1 1 1.10 1.05Period 2011-2013 2011-2013 2014-2025 2014-2025
[email protected] Hake emergence trophic impacts PICES 2015, 27 March 5 / 8

Results and discussion Results
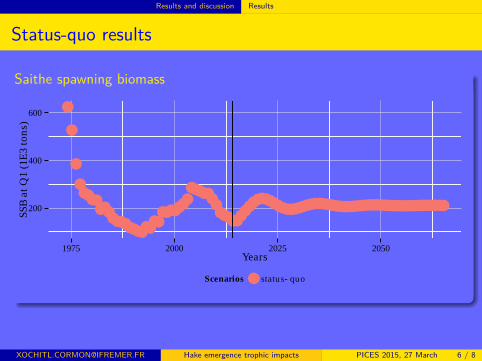
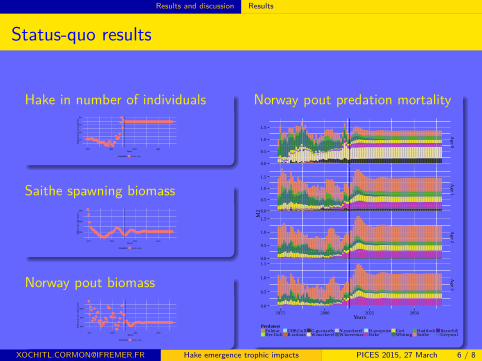
Status-quo results
Hake in number of individuals
●●●●●●●●●●●●●●●●●●●●●●●
●
●●●●●
●●
●●●●
●
●
●
●
●●●●●●●●●●●●●●●●●●●●●●●●●●●●●●●●●●●●●●●●●●●●●●●●●●●●●
20
40
60
80
1975 2000 2025 2050Years
Abu
ndan
ce a
t Q1
(1E
3)
Scenarios ● status−quo
Hake in number of individuals
●●●●●●●●●●●●●●●●●●●●●●●
●
●●●●●
●●
●●●●
●
●
●
●
●●●●●●●●●●●●●●●●●●●●●●●●●●●●●●●●●●●●●●●●●●●●●●●●●●●●●
20
40
60
80
1975 2000 2025 2050Years
Abu
ndan
ce a
t Q1
(1E
3)
Scenarios ● status−quo
Norway pout biomass●
●
●●
●●
●
●●●●
●●●
●●●
●
●●●
●●●
●●●●
●
●
●●●●●
●
●
●
●
●
●●●●●●●●●
●●●●●●●●●●●●●●●●●●●●●●●●●●●●●●●●●●●●●●●●●●●400
800
1200
1975 2000 2025 2050Years
TSB
at Q
1 in
(1E
3 to
ns)
Scenarios ● status−quo
Norway pout predation mortality
0.0
0.5
1.0
1.5
0.0
0.5
1.0
1.5
0.0
0.5
1.0
1.5
0.0
0.5
1.0
1.5
Age 0
Age 1
Age 2
Age 3
1975 2000 2025 2050Years
M2
PredatorsFulmarHer.Gull
GBB.GullR.radiata
G.gurnardsW.mackerel
N.mackerelW.horsemac
H.porpoiseHake
CodWhiting
HaddockSaithe
RazorbillGreyseal
[email protected] Hake emergence trophic impacts PICES 2015, 27 March 6 / 8
Results and discussion Results
Status-quo results
Saithe spawning biomass
●
●
●
●●●●●
●●●●●●●●●●●●●●●
●●●●●●●
●●●●●●●●●●●●●
●●●●●●●●●●●●●●●●●●●●●●●●●●●●●●●●●●●●●●●●●●●●●●●●●200
400
600
1975 2000 2025 2050Years
SSB
at Q
1 (1
E3
tons
)
Scenarios ● status−quo
Hake in number of individuals
●●●●●●●●●●●●●●●●●●●●●●●
●
●●●●●
●●
●●●●
●
●
●
●
●●●●●●●●●●●●●●●●●●●●●●●●●●●●●●●●●●●●●●●●●●●●●●●●●●●●●
20
40
60
80
1975 2000 2025 2050Years
Abu
ndan
ce a
t Q1
(1E
3)
Scenarios ● status−quo
Norway pout biomass●
●
●●
●●
●
●●●●
●●●
●●●
●
●●●
●●●
●●●●
●
●
●●●●●
●
●
●
●
●
●●●●●●●●●
●●●●●●●●●●●●●●●●●●●●●●●●●●●●●●●●●●●●●●●●●●●400
800
1200
1975 2000 2025 2050Years
TSB
at Q
1 in
(1E
3 to
ns)
Scenarios ● status−quo
Norway pout predation mortality
0.0
0.5
1.0
1.5
0.0
0.5
1.0
1.5
0.0
0.5
1.0
1.5
0.0
0.5
1.0
1.5
Age 0
Age 1
Age 2
Age 3
1975 2000 2025 2050Years
M2
PredatorsFulmarHer.Gull
GBB.GullR.radiata
G.gurnardsW.mackerel
N.mackerelW.horsemac
H.porpoiseHake
CodWhiting
HaddockSaithe
RazorbillGreyseal
[email protected] Hake emergence trophic impacts PICES 2015, 27 March 6 / 8

Results and discussion Results
Status-quo results
Saithe recruitment
0
100
200
300
400
1975 2000 2025 2050Years
Rec
ruit
men
t at Q
1 (1
E3)
Scenarios status−quo
Hake in number of individuals
●●●●●●●●●●●●●●●●●●●●●●●
●
●●●●●
●●
●●●●
●
●
●
●
●●●●●●●●●●●●●●●●●●●●●●●●●●●●●●●●●●●●●●●●●●●●●●●●●●●●●
20
40
60
80
1975 2000 2025 2050Years
Abu
ndan
ce a
t Q1
(1E
3)
Scenarios ● status−quo
Norway pout biomass●
●
●●
●●
●
●●●●
●●●
●●●
●
●●●
●●●
●●●●
●
●
●●●●●
●
●
●
●
●
●●●●●●●●●
●●●●●●●●●●●●●●●●●●●●●●●●●●●●●●●●●●●●●●●●●●●400
800
1200
1975 2000 2025 2050Years
TSB
at Q
1 in
(1E
3 to
ns)
Scenarios ● status−quo
Norway pout predation mortality
0.0
0.5
1.0
1.5
0.0
0.5
1.0
1.5
0.0
0.5
1.0
1.5
0.0
0.5
1.0
1.5
Age 0
Age 1
Age 2
Age 3
1975 2000 2025 2050Years
M2
PredatorsFulmarHer.Gull
GBB.GullR.radiata
G.gurnardsW.mackerel
N.mackerelW.horsemac
H.porpoiseHake
CodWhiting
HaddockSaithe
RazorbillGreyseal
[email protected] Hake emergence trophic impacts PICES 2015, 27 March 6 / 8

Results and discussion Results
Status-quo results
Norway pout biomass
●
●
●●
●●
●
●●●●
●●●
●●●
●
●●●
●●●
●●●●
●
●
●●●●●
●
●
●
●
●
●●●●●●●●●
●●●●●●●●●●●●●●●●●●●●●●●●●●●●●●●●●●●●●●●●●●●400
800
1200
1975 2000 2025 2050Years
TSB
at Q
1 in
(1E
3 to
ns)
Scenarios ● status−quo
Hake in number of individuals
●●●●●●●●●●●●●●●●●●●●●●●
●
●●●●●
●●
●●●●
●
●
●
●
●●●●●●●●●●●●●●●●●●●●●●●●●●●●●●●●●●●●●●●●●●●●●●●●●●●●●
20
40
60
80
1975 2000 2025 2050Years
Abu
ndan
ce a
t Q1
(1E
3)
Scenarios ● status−quo
Norway pout biomass●
●
●●
●●
●
●●●●
●●●
●●●
●
●●●
●●●
●●●●
●
●
●●●●●
●
●
●
●
●
●●●●●●●●●
●●●●●●●●●●●●●●●●●●●●●●●●●●●●●●●●●●●●●●●●●●●400
800
1200
1975 2000 2025 2050Years
TSB
at Q
1 in
(1E
3 to
ns)
Scenarios ● status−quo
Norway pout predation mortality
0.0
0.5
1.0
1.5
0.0
0.5
1.0
1.5
0.0
0.5
1.0
1.5
0.0
0.5
1.0
1.5
Age 0
Age 1
Age 2
Age 3
1975 2000 2025 2050Years
M2
PredatorsFulmarHer.Gull
GBB.GullR.radiata
G.gurnardsW.mackerel
N.mackerelW.horsemac
H.porpoiseHake
CodWhiting
HaddockSaithe
RazorbillGreyseal
[email protected] Hake emergence trophic impacts PICES 2015, 27 March 6 / 8
Results and discussion Results
Status-quo results
Hake in number of individuals
●●●●●●●●●●●●●●●●●●●●●●●
●
●●●●●
●●
●●●●
●
●
●
●
●●●●●●●●●●●●●●●●●●●●●●●●●●●●●●●●●●●●●●●●●●●●●●●●●●●●●
20
40
60
80
1975 2000 2025 2050Years
Abu
ndan
ce a
t Q1
(1E
3)
Scenarios ● status−quo
Saithe spawning biomass●
●
●
●●●●●
●●●●●●●●●●●●●●●
●●●●●●●
●●●●●●●●●●●●●
●●●●●●●●●●●●●●●●●●●●●●●●●●●●●●●●●●●●●●●●●●●●●●●●●200
400
600
1975 2000 2025 2050Years
SSB
at Q
1 (1
E3
tons
)
Scenarios ● status−quo
Norway pout biomass●
●
●●
●●
●
●●●●
●●●
●●●
●
●●●
●●●
●●●●
●
●
●●●●●
●
●
●
●
●
●●●●●●●●●
●●●●●●●●●●●●●●●●●●●●●●●●●●●●●●●●●●●●●●●●●●●400
800
1200
1975 2000 2025 2050Years
TSB
at Q
1 in
(1E
3 to
ns)
Scenarios ● status−quo
Norway pout predation mortality
0.0
0.5
1.0
1.5
0.0
0.5
1.0
1.5
0.0
0.5
1.0
1.5
0.0
0.5
1.0
1.5
Age 0
Age 1
Age 2
Age 3
1975 2000 2025 2050Years
M2
PredatorsFulmarHer.Gull
GBB.GullR.radiata
G.gurnardsW.mackerel
N.mackerelW.horsemac
H.porpoiseHake
CodWhiting
HaddockSaithe
RazorbillGreyseal
[email protected] Hake emergence trophic impacts PICES 2015, 27 March 6 / 8

Results and discussion Results
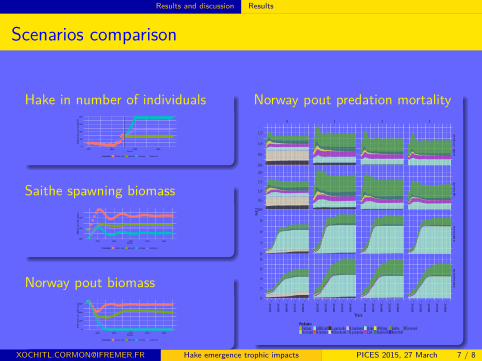
Scenarios comparison
Hake in number of individuals
●●●●●●●●●●●●●●●●●●●●●●●●●●●●●●●
●●●●●
●●
●●●●●●●●●●●●●●●●●●●●●●●●●●●●●●●●●●●●●●●●●●●●●●●●●●●●●●
0
50
100
150
200
1975 2000 2025 2050Years
Abu
ndan
ce a
t Q1
(1E
3)
Scenarios ● status−quo growth extreme moderate
Hake in number of individuals
●●●●●●●●●●●●●●●●●●●●●●●●●●●●●●●
●●●●●
●●
●●●●●●●●●●●●●●●●●●●●●●●●●●●●●●●●●●●●●●●●●●●●●●●●●●●●●●
0
50
100
150
200
1975 2000 2025 2050Years
Abu
ndan
ce a
t Q1
(1E
3)
Scenarios ● status−quo growth extreme moderate
Norway pout biomass●●
●●●●●●
●●●●●●●●●●●●●●●●●●●●●●●●●●●●●●●●●●●●●●●●●●●●
0
200
400
600
2020 2030 2040 2050 2060Years
TSB
at Q
1 in
(1E
3 to
ns)
Scenarios ● status−quo growth extreme moderate
Norway pout predation mortality0 1 2 3
0.0
0.5
1.0
1.5
0.0
0.5
1.0
1.5
2.0
0
3
6
9
0
2
4
6
8
sta
tus−
qu
og
row
thex
trem
em
od
era
te
20
20
20
30
20
40
20
50
20
60
20
20
20
30
20
40
20
50
20
60
20
20
20
30
20
40
20
50
20
60
20
20
20
30
20
40
20
50
20
60
Years
M2
PredatorsFulmarHer.Gull
GBB.GullR.radiata
G.gurnardsW.mackerel
N.mackerelH.porpoise
HakeCod
WhitingHaddock
SaitheRazorbill
Greyseal
[email protected] Hake emergence trophic impacts PICES 2015, 27 March 7 / 8

Results and discussion Results
Scenarios comparison
Saithe spawning biomass
●●
●
●●●●●●
●●●●●●●●●●●●●●●●●●●●●●●●●●●●●●●●●●●●●●●●●●●
100
150
200
2020 2030 2040 2050 2060Years
SSB
at Q
1 (1
E3
tons
)
Scenarios ● status−quo growth extreme moderate
Hake in number of individuals
●●●●●●●●●●●●●●●●●●●●●●●●●●●●●●●
●●●●●
●●
●●●●●●●●●●●●●●●●●●●●●●●●●●●●●●●●●●●●●●●●●●●●●●●●●●●●●●
0
50
100
150
200
1975 2000 2025 2050Years
Abu
ndan
ce a
t Q1
(1E
3)
Scenarios ● status−quo growth extreme moderate
Norway pout biomass●●
●●●●●●
●●●●●●●●●●●●●●●●●●●●●●●●●●●●●●●●●●●●●●●●●●●●
0
200
400
600
2020 2030 2040 2050 2060Years
TSB
at Q
1 in
(1E
3 to
ns)
Scenarios ● status−quo growth extreme moderate
Norway pout predation mortality0 1 2 3
0.0
0.5
1.0
1.5
0.0
0.5
1.0
1.5
2.0
0
3
6
9
0
2
4
6
8
sta
tus−
qu
og
row
thex
trem
em
od
era
te
20
20
20
30
20
40
20
50
20
60
20
20
20
30
20
40
20
50
20
60
20
20
20
30
20
40
20
50
20
60
20
20
20
30
20
40
20
50
20
60
Years
M2
PredatorsFulmarHer.Gull
GBB.GullR.radiata
G.gurnardsW.mackerel
N.mackerelH.porpoise
HakeCod
WhitingHaddock
SaitheRazorbill
Greyseal
[email protected] Hake emergence trophic impacts PICES 2015, 27 March 7 / 8

Results and discussion Results
Scenarios comparison
Norway pout biomass
●●●●●●●●
●●●●●●●●●●●●●●●●●●●●●●●●●●●●●●●●●●●●●●●●●●●●
0
200
400
600
2020 2030 2040 2050 2060Years
TSB
at Q
1 in
(1E
3 to
ns)
Scenarios ● status−quo growth extreme moderate
Hake in number of individuals
●●●●●●●●●●●●●●●●●●●●●●●●●●●●●●●
●●●●●
●●
●●●●●●●●●●●●●●●●●●●●●●●●●●●●●●●●●●●●●●●●●●●●●●●●●●●●●●
0
50
100
150
200
1975 2000 2025 2050Years
Abu
ndan
ce a
t Q1
(1E
3)
Scenarios ● status−quo growth extreme moderate
Norway pout biomass●●
●●●●●●
●●●●●●●●●●●●●●●●●●●●●●●●●●●●●●●●●●●●●●●●●●●●
0
200
400
600
2020 2030 2040 2050 2060Years
TSB
at Q
1 in
(1E
3 to
ns)
Scenarios ● status−quo growth extreme moderate
Norway pout predation mortality0 1 2 3
0.0
0.5
1.0
1.5
0.0
0.5
1.0
1.5
2.0
0
3
6
9
0
2
4
6
8
sta
tus−
qu
og
row
thex
trem
em
od
era
te
20
20
20
30
20
40
20
50
20
60
20
20
20
30
20
40
20
50
20
60
20
20
20
30
20
40
20
50
20
60
20
20
20
30
20
40
20
50
20
60
Years
M2
PredatorsFulmarHer.Gull
GBB.GullR.radiata
G.gurnardsW.mackerel
N.mackerelH.porpoise
HakeCod
WhitingHaddock
SaitheRazorbill
Greyseal
[email protected] Hake emergence trophic impacts PICES 2015, 27 March 7 / 8
Results and discussion Results
Scenarios comparison
Hake in number of individuals
●●●●●●●●●●●●●●●●●●●●●●●●●●●●●●●
●●●●●
●●
●●●●●●●●●●●●●●●●●●●●●●●●●●●●●●●●●●●●●●●●●●●●●●●●●●●●●●
0
50
100
150
200
1975 2000 2025 2050Years
Abu
ndan
ce a
t Q1
(1E
3)
Scenarios ● status−quo growth extreme moderate
Saithe spawning biomass
●●
●
●●●●●●
●●●●●●●●●●●●●●●●●●●●●●●●●●●●●●●●●●●●●●●●●●●
100
150
200
2020 2030 2040 2050 2060Years
SSB
at Q
1 (1
E3
tons
)
Scenarios ● status−quo growth extreme moderate
Norway pout biomass●●
●●●●●●
●●●●●●●●●●●●●●●●●●●●●●●●●●●●●●●●●●●●●●●●●●●●
0
200
400
600
2020 2030 2040 2050 2060Years
TSB
at Q
1 in
(1E
3 to
ns)
Scenarios ● status−quo growth extreme moderate
Norway pout predation mortality0 1 2 3
0.0
0.5
1.0
1.5
0.0
0.5
1.0
1.5
2.0
0
3
6
9
0
2
4
6
8
sta
tus−
qu
og
row
thex
trem
em
od
era
te
20
20
20
30
20
40
20
50
20
60
20
20
20
30
20
40
20
50
20
60
20
20
20
30
20
40
20
50
20
60
20
20
20
30
20
40
20
50
20
60
Years
M2
PredatorsFulmarHer.Gull
GBB.GullR.radiata
G.gurnardsW.mackerel
N.mackerelH.porpoise
HakeCod
WhitingHaddock
SaitheRazorbill
Greyseal
[email protected] Hake emergence trophic impacts PICES 2015, 27 March 7 / 8
Results and discussion Conclusion and prospects
What do we know and what’s next?
ConclusionsLower saithe biomass estimates with growth.
Dominance of saithe and hake in predation on Norway pout.Impact of hake on Norway pout and on saithe biomass.
Limits
Simplistic.Uncertainties.
Prospects
Stochastic recruitment.Fishery scenarios.
[email protected] Hake emergence trophic impacts PICES 2015, 27 March 8 / 8

Results and discussion Conclusion and prospects
What do we know and what’s next?
ConclusionsLower saithe biomass estimates with growth.Dominance of saithe and hake in predation on Norway pout.
Impact of hake on Norway pout and on saithe biomass.
Limits
Simplistic.Uncertainties.
Prospects
Stochastic recruitment.Fishery scenarios.
[email protected] Hake emergence trophic impacts PICES 2015, 27 March 8 / 8

Results and discussion Conclusion and prospects
What do we know and what’s next?
ConclusionsLower saithe biomass estimates with growth.Dominance of saithe and hake in predation on Norway pout.Impact of hake on Norway pout and on saithe biomass.
LimitsSimplistic.
Uncertainties.
Prospects
Stochastic recruitment.Fishery scenarios.
[email protected] Hake emergence trophic impacts PICES 2015, 27 March 8 / 8

Results and discussion Conclusion and prospects
What do we know and what’s next?
ConclusionsLower saithe biomass estimates with growth.Dominance of saithe and hake in predation on Norway pout.Impact of hake on Norway pout and on saithe biomass.
LimitsSimplistic.Uncertainties.
ProspectsStochastic recruitment.
Fishery scenarios.
[email protected] Hake emergence trophic impacts PICES 2015, 27 March 8 / 8

Results and discussion Conclusion and prospects
What do we know and what’s next?
ConclusionsLower saithe biomass estimates with growth.Dominance of saithe and hake in predation on Norway pout.Impact of hake on Norway pout and on saithe biomass.
LimitsSimplistic.Uncertainties.
ProspectsStochastic recruitment.Fishery scenarios.
[email protected] Hake emergence trophic impacts PICES 2015, 27 March 8 / 8

The End
The End...
(: Travel support :)
Baudron, A. and Fernandes, P. (2014). "Adverse consequences of stock recovery: European hake, a new “choke” species undera discard ban?" Fish and fisheries. doi: 10.1111/faf.12079.Cormon, X., Loots, C., Vaz, S., Vermard, Y. and Marchal, P. (2014). "Spatial interactions between saithe (Pollachius virens)and hake (Merluccius merluccius) in the North Sea." ICES Journal of Marine Science. doi: 10.1093/icesjms/fsu120.Cormon, X., Ernande B., Kempf, A., Vermard, Y., and Marchal, P. (in prep). "Bottom-up processes in the North Sea, aninvestigation of North Sea saithe growth characteristics in relation to environmental factors."ICES (2013). "Saithe in Subareas IV, VI and Division IIIa." Report of the Working Group on the Assessment of Demersal Stocksin the North Sea and Skagerrak (WGNSSK) CM/ACOM:13:565-609.Lewy P. and Vinther M. (2004) "SMS, A stochastic age-length-structured multispecies model applied to North Sea and BalticSea stocks."Link J. and Auster P. (2013) "The challenges of evaluating competition among marine fishes: who cares, when does it matter,and what can we do about it?" Bulletin of Marine Science: 89(1):213-247.
[email protected] Hake emergence trophic impacts PICES 2015, 27 March 8 / 8