pike anabranch fish intervention monitoring: progress ... · pike anabranch fish intervention...
TRANSCRIPT

Pike Anabranch Fish Intervention Monitoring:
Progress Report 2013
C. Bice, S. L. Gehrig and B. Zampatti
SARDI Publication No. F2013/000472-1 SARDI Research Report Series No. 712
SARDI Aquatic Sciences PO Box 120 Henley Beach SA 5022
September 2013

Pike Anabranch Fish Intervention Monitoring: Progress Report 2013
C. Bice, S. L. Gehrig and B. Zampatti
SARDI Publication No. F2013/000472-1 SARDI Research Report Series No. 712
September 2013

This publication may be cited as:
Bice, C. M., Gehrig, S. L. and Zampatti, B. P. (2013). Pike Anabranch Fish Intervention Monitoring: Progress
Report 2013. South Australian Research and Development Institute (Aquatic Sciences), Adelaide. SARDI
Publication No. F2013/000472-1. SARDI Research Report Series No 712. 39pp.
South Australian Research and Development Institute
SARDI Aquatic Sciences
2 Hamra Avenue
West Beach SA 5024
Telephone: (08) 8207 5400
Facsimile: (08) 8207 5406
http://www.sardi.sa.gov.au
DISCLAIMER
The authors warrant that they have taken all reasonable care in producing this report. The report has been through
the SARDI internal review process, and has been formally approved for release by the Research Chief, Aquatic
Sciences. Although all reasonable efforts have been made to ensure quality, SARDI does not warrant that the
information in this report is free from errors or omissions. SARDI does not accept any liability for the contents of
this report or for any consequences arising from its use or any reliance placed upon it. The SARDI Report Series is
an Administrative Report Series which has not been reviewed outside the department and is not considered peer-
reviewed literature. Material presented in these Administrative Reports may later be published in formal peer-
reviewed scientific literature.
© 2013 SARDI
This work is copyright. Apart from any use as permitted under the Copyright Act 1968 (Cth), no part may be
reproduced by any process, electronic or otherwise, without the specific written permission of the copyright owner.
Neither may information be stored electronically in any form whatsoever without such permission.
Printed in Adelaide: September 2013
SARDI Publication No. F2013/000472-1
SARDI Research Report Series No. 712
Author(s): C. M. Bice, S. L. Gehrig and B. P. Zampatti
Reviewer(s): P. Wilson and J. Nicol
Approved by: Dr Q. Ye
Science Leader – Inland Waters & Catchment Ecology
Signed:
Date: 4 September 2013
Distribution: SA Department of Environment Water and Natural Resources (DEWNR), SAASC
Library, University of Adelaide Library, Parliamentary Library, State Library and
National Library
Circulation: Public Domain

Bice, Gehrig and Zampatti (2013) Pike Fish Intervention Monitoring 2013
i
TABLE OF CONTENTS
TABLE OF CONTENTS ............................................................................................................................... i
LIST OF FIGURES ...................................................................................................................................... ii
LIST OF TABLES ....................................................................................................................................... iv
Acknowledgements ....................................................................................................................................... 1
Executive summary ....................................................................................................................................... 2
1. Introduction ............................................................................................................................................... 4
2. Methods .................................................................................................................................................... 7
2.1. Site selection ...................................................................................................................................... 7
2.2. Data collection ................................................................................................................................ 10
2.3. Data analysis ................................................................................................................................... 12
3. Results ..................................................................................................................................................... 13
3.1. Catch summary ................................................................................................................................ 13
3.2. Spatial variability in fish assemblage structure .............................................................................. 15
3.3. Fish recruitment .............................................................................................................................. 16
3.4. Microhabitat availability ................................................................................................................. 20
3.5. Fish-microhabitat associations ....................................................................................................... 22
3.6. Hydraulic habitat characterisation ................................................................................................. 26
4. Discussion ............................................................................................................................................... 33
4.1. Fish assemblage structure ............................................................................................................... 33
4.2. Microhabitat cover and fish-microhabitat associations .................................................................. 34
4.3. Hydraulic habitat characterisation ................................................................................................. 35
4.4. Conclusion ....................................................................................................................................... 35
5. References ............................................................................................................................................... 37

Bice, Gehrig and Zampatti (2013) Pike Fish Intervention Monitoring 2013
ii
LIST OF FIGURES
Figure 1. Map showing the location of impact (red circles), creek control (green circles) and river control
(blue circles) sites sampled in the Pike Anabranch and adjacent River Murray in 2013. .................... 9
Figure 2. Non-metric multi-dimensional scaling (MDS) plot of fish assemblages sampled using
electrofishing from creek control (solid circle), river control (open circle) and impact (solid triangle)
sites in 2013. ....................................................................................................................................... 15
Figure 3. Relative abundance (number of fish . minute electrofishing-1
. electrofishing shot-1
± standard
error (SE)) of species determined to contribute to differences between fish assemblages (SIMPER)
or characterise the assemblage within a treatment (ISA) at creek control (white bar), river control
(light grey bar) and impact sites (dark grey bar). ............................................................................... 16
Figure 4. Length frequency distribution of a) carp gudgeon (TL), b) Murray rainbowfish (FL), c)
unspecked hardyhead (FL) and d) Australian smelt (FL) at creek control (white bar), river control
(grey bar) and impact (black bar) sites. .............................................................................................. 18
Figure 5. Length frequency distribution of a) bony herring (FL), b) golden perch (TL), c) freshwater
catfish (TL) and d) silver perch (FL) at creek control (white bar), river control (grey bar) and impact
(black bar) sites. ................................................................................................................................. 19
Figure 6. Length frequency distribution of a) common carp (FL) and b) goldfish (FL) at creek control
(white bar), river control (grey bar) and impact (black bar) sites....................................................... 20
Figure 7. Non-metric multi-dimensional scaling (MDS) plot of proportional microhabitat cover measured
during sampling of creek control (solid circle), river control (open circle) and impact (solid triangle)
sites in 2013. ....................................................................................................................................... 21
Figure 8. Cross-sectional water velocity (top) and circulation profiles (bottom) generated from ADCP
transects at site 8 (Control: Pike to Mundic Cutting) in autumn 2013. Current velocity plot present
cross-transect velocities (U) in cells 0.5 m in length x 0.25 m in height. The circulation plot presents
a combination of velocities in the vertical and horizontal planes (i.e. along-transect, W, and
vertically, V), transverse to the banks, with vectors representing the direction of rotation................ 27
Figure 9. Cross-sectional water velocity (top) and circulation profiles (bottom) generated from ADCP
transects at site 10 (Control: Pike River downstream Coombs Bridge) in autumn 2013. Current
velocity plot present cross-transect velocities (U) in cells 0.5 m in length x 0.25 m in height. The
circulation plot presents a combination of velocities in the vertical and horizontal planes (i.e. along-
transect, W, and vertically, V), transverse to the banks, with vectors representing the direction of
rotation. .............................................................................................................................................. 28

Bice, Gehrig and Zampatti (2013) Pike Fish Intervention Monitoring 2013
iii
Figure 10. Cross-sectional water velocity (top) and circulation profiles (bottom) generated from ADCP
transects at site 3 (Impact: Tanyaca Creek upstream Horseshoe) in autumn 2013. Current velocity
plot present cross-transect velocities (U) in cells 0.5 m in length x 0.25 m in height. The circulation
plot presents a combination of velocities in the vertical and horizontal planes (i.e. along-transect, W,
and vertically, V), transverse to the banks, with vectors representing the direction of rotation. ........ 29
Figure 11. Cross-sectional water velocity (top) and circulation profiles (bottom) generated from ADCP
transects at site 4 (Impact: Tanyaca Creek downstream horseshoe) in autumn 2013. Current velocity
plot present cross-transect velocities (U) in cells 0.5 m in length x 0.25 m in height. The circulation
plot presents a combination of velocities in the vertical and horizontal planes (i.e. along-transect, W,
and vertically, V), transverse to the banks, with vectors representing the direction of rotation. ........ 30
Figure 12. Cross-sectional water velocity (top) and circulation profiles (bottom) generated from ADCP
transects at site 5 (Impact: Lower Pike River) in autumn 2013. Current velocity plot present cross-
transect velocities (U) in cells 0.5 m in length x 0.25 m in height. The circulation plot presents a
combination of velocities in the vertical and horizontal planes (i.e. along-transect, W, and vertically,
V), transverse to the banks, with vectors representing the direction of rotation................................. 31
Figure 13. Cross-sectional water velocity (top) and circulation profiles (bottom) generated from ADCP
transects at site 6 (Impact: Lower Pike River at Simarloo) in autumn 2013. Current velocity plot
present cross-transect velocities (U) in cells 0.5 m in length x 0.25 m in height. The circulation plot
presents a combination of velocities in the vertical and horizontal planes (i.e. along-transect, W, and
vertically, V), transverse to the banks, with vectors representing the direction of rotation................ 32

Bice, Gehrig and Zampatti (2013) Pike Fish Intervention Monitoring 2013
iv
LIST OF TABLES
Table 1. Site number, site name, treatment (impact, creek control and river control sites), latitude and
longitude and flow type (1 = fast flowing anabranches, 2 = slow flowing anabranches, 3 =
backwaters, 4 = main channel) for sites sampled within the Pike Anabranch system in 2013.
*indicates sites where ADCP transects were undertaken. .................................................................... 8
Table 2. Summary of species and total numbers of fish captured across 16 sampling sites in Pike
Anabranch system and adjacent River Murray in autumn 2013. *denotes non-native species. ......... 14
Table 3. Mean cover (mean proportional cover.electrofishing shot-1
± standard error) of microhabitats and
functional types at creek control, river control and impact sites in 2013. Recruits =
seedling/saplings. ............................................................................................................................... 22
Table 4. Results of Indicator Species Analysis used to derive positive and negative fish-microhabitat
associations for impact, control and river control sites. Indicator Values (IV) for species in
percentage of perfect indication for that particular habitat type are presented in brackets and only
statistically significant (p < 0.05) indicator species are presented. Perfect indication (100%) occurs
when a microhabitat type is always present when a given fish species is present (positive
association) or always present when a given fish species is absent (negative association). (ad) =
adult trees. .......................................................................................................................................... 24
Table 5. Hydraulic habitat metrics calculated from ADCP generated data from control and impact sites
within the Pike Anabranch system in autumn 2013. Metrics include point discharge (m3.s
-1) at each
location, the transect length (m), mean depth (m) across the cross-section, total area of the cross-
section (m2), mean cross-transect (upstream to downstream) velocity (U, m.s
-1), Max U (m.s
-1), Min
U (m.s-1
), standard deviation in cross-transect velocities (m.s-1
), coefficient of variation, mean
velocity along or parallel to each transect (V, m.s-1
), mean velocity in the vertical plane (W, m.s-1
)
and the modified circulation metric (M3, s-1
). ..................................................................................... 26

Bice, Gehrig and Zampatti (2013) Pike Fish Intervention Monitoring 2013
1
Acknowledgements
This project has been funded by the Riverine Recovery Project (RRP), a component of South Australia’s
$610 million Murray Futures Program, which is funded by the Australian Government’s Water for the
Future initiative. The project was managed by Brad Hollis of the South Australian Department of
Environment, Water and Natural Resources. The authors would like to thank the following SARDI staff
who assisted with fieldwork and producing maps; Arron Strawbridge, Ian Magraith, Neil Wellman,
George Giatas, Phillipa Wilson and Luciano Bucater. Thanks also go to Phillipa Wilson and Jason Nicol
(SARDI), and Brad Hollis (DEWNR) for reviewing this document.

Bice, Gehrig and Zampatti (2013) Pike Fish Intervention Monitoring 2013
2
Executive summary
The Pike Anabranch and Floodplain is one of three large anabranch systems in the Riverland region of the
lower River Murray, South Australia. The Pike Anabranch bypasses Lock and Weir No. 5, resulting in a
head differential (total >3 m), which creates a diverse range of aquatic habitats across the system,
comprised of permanently flowing creeks, lagoons and backwaters. At present the system is degraded due
to decreased frequency of floodplain inundation, limited capacity to vary flows within the system and
multiple barriers to fish passage.
As part of the Riverine Recovery Project (RRP) several management interventions have been planned for
the Pike Anabranch system with the objective of increasing flow to the inner part of the system (i.e. Deep
Creek, Mundic Creek, Tanyaca Creek and Rumpagunyah Creek), increasing hydrological connectivity
and mitigating barriers to fish passage. Specifically, the early works program, stage 1 and stage 2
interventions will include an upgrade to the inlet structure at Deep Creek, replacement (e.g. with culverts)
of a range of earthen banks (e.g. Coombs Bridge) and fishway construction on the Deep Creek Regulator,
and Banks B, C and D. These interventions will result in an increase in flow to the Pike Anabranch from
~350 ML.day-1
up to ~1000 ML.day-1
and significantly improve hydrological connectivity within the
system and between the Pike Anabranch system and the River Murray.
The current project was developed to assess the influence of the early works program, stage 1 and stage 2
interventions in the Pike Anabranch system as part of the RRP, on fish and fish habitats. It is
hypothesised that increases in hydraulically diverse lotic habitat and increased connectivity will result in
significant changes to fish assemblage structure (i.e. species composition and abundance) and
recruitment, habitat (vegetated and hydraulic) and fish-habitat associations, including increases in the
abundance of species that prefer hydraulically diverse environments (e.g. Murray cod and golden perch).
This report presents data from ‘before’ intervention monitoring undertaken in 2013. On-ground works for
the interventions are planned for 2013/14, with ‘after’ intervention monitoring planned for 2015 and
2016.
A before-after-control-impact (BACI) monitoring design was developed to assess the response of fish
assemblages, instream habitat and hydraulic habitat to the planned interventions. A total of 16 sites were
sampled, representative of three treatments; 1) impact sites (n = 7): creeks within the Pike Anabranch
system likely to experience changes in hydrology and hydraulic characteristics as a result of the
interventions, 2) creek control sites (n = 6): creeks within the Pike Anabranch system unlikely to

Bice, Gehrig and Zampatti (2013) Pike Fish Intervention Monitoring 2013
3
experience changes to hydrology and hydraulic characteristics as a result of the interventions, and 3) river
control sites (n = 3): sites in the River Murray main channel unlikely to experience changes to hydrology
and hydraulic characteristics as a result of the interventions. Each site was sampled with standardised boat
electrofishing and microhabitat cover was quantitatively assessed. Hydraulic habitat characterisation was
undertaken using an acoustic Doppler current profiler (ADCP) at a subset of impact and control sites.
A total of 3,945 fish were sampled from 14 species. Bony herring were the most abundant species
sampled, followed by common carp, golden perch and unspecked hardyhead, respectively. Fish
assemblage structure did not differ significantly between impact and creek control sites, but were
significantly different between river control sites and impact and creek control sites. These differences
were primarily due to greater relative abundance of bony herring, Australian smelt and Murray
rainbowfish at river control sites and greater relative abundance of golden perch, common carp, goldfish
and carp gudgeon at sites within the anabranch system (impact and creek control); most likely a reflection
of typical differences in fish assemblages between riverine and anabranch habitats. Whilst it was not an
objective of the current project, a comparison of data from 2013 with data collected in 2009 from the Pike
Anabranch highlighted substantial changes in fish assemblage structure. Notably, there were considerable
increases in the abundance of golden perch and common carp in 2013, likely due to enhanced recruitment
accompanying flooding and high flows during 2010–2012.
Microhabitat cover was significantly different between treatments and largely driven by a greater relative
cover of structural microhabitats at impact sites within the Pike Anabranch compared to creek and river
control sites. This result is encouraging in light of the future interventions, since many native fish species
(e.g. Murray cod, golden perch) are typically associated with structural habitat elements, particularly
when coupled with lotic hydrodynamics. Nonetheless, hydraulic characterisation of impact sites within
the Pike Anabranch in 2013 indicated that flow velocities and hydraulic complexity are currently
relatively low.
On-ground works are scheduled for 2013/14, with accompanying ‘after’ intervention monitoring planned
for 2014 and 2015. Data collected on fish assemblage structure and recruitment, microhabitat cover, fish-
microhabitat associations and hydraulic habitat in 2013 provides a baseline to determine potential changes
in the aforementioned parameters as a result of the interventions.

Bice, Gehrig and Zampatti (2013) Pike Fish Intervention Monitoring 2013
4
1. Introduction
River regulation and water abstraction in the Murray-Darling Basin (MDB) have dramatically altered the
natural flow regime of the lower River Murray (Maheshwari et al. 1995). The construction of a series of
low-level weirs along the main channel of the lower River Murray in the 1920s and 1930s transformed a
dynamic lotic environment to one characterised by a series of lentic weir pools with limited hydraulic
complexity and increased water level stability (Walker 2006). The frequency and duration of floodplain
inundation has decreased, whilst periods of elevated within-channel flow have also been reduced
(Maheshwari et al. 1995). Subsequently, the ecological character of the lower River Murray has
transformed, with declines in species adapted to lotic flowing water environments (e.g. Murray cod
(Maccullochella peelii) and the riverine mussel (Alathyria jacksoni)) and increased prevalence of
generalist species or those adapted to stable environments (e.g. common carp (Cyprinus carpio) and
willow (Salix babylonica)) (Walker 1985, Walker and Thoms 1993).
The Pike Anabranch and Floodplain is one of three large (~6,700 ha) anabranch systems (Chowilla,
Katarapko and Pike) in the Riverland region of the lower River Murray, South Australia. The Pike
Anabranch is fed by two inlet creeks (Margaret Dowling Creek and Deep Creek) that flow from the Lock
5 weir pool into Mundic Creek, before flowing through a series of creeks and lagoons, and finally re-
entering the River Murray downstream of Lock 5 via the lower Pike River. As the anabranch system
bypasses Lock 5, a head differential (>3 m) is created across the system, resulting in a diverse range of
aquatic habitats, including fast-flowing creeks, slow-flowing creeks and backwaters. Flowing water
habitats such as this are now absent under regulated conditions in the lower River Murray main channel.
Whilst the Pike Anabranch supports a diverse fish assemblage (Beyer et al. 2010) it is nevertheless
considered to be highly degraded due to the impacts of river regulation. On a catchment-scale, river
regulation and water abstraction in the MDB has reduced flooding frequency and duration, with various
accompanying impacts (e.g. floodplain salinisation) and on a local-scale, flow to the system is limited by
the operational constraints of the inlet structures (i.e. Margaret Dowling inlet and Deep Creek inlet and
associated bridges) and further fragmented by a range of additional structures (i.e. banks B, C, D, E, F,
F1, G, H, Snake Creek stock crossing and Coombs Bridge). Under low flows, these structures present
barriers to fish passage, restricting the movement of fish both within the system and between the
anabranch system and River Murray main channel.

Bice, Gehrig and Zampatti (2013) Pike Fish Intervention Monitoring 2013
5
As part of the Riverine Recovery Project (RRP; Murray Futures Program) several management
interventions have been proposed for the Pike Anabranch system to improve flow and connectivity within
the system. These include,
1. Early Works program: Upgrade of Deep Creek inlet regulator and associated bridge to improve
hydraulic connectivity, increasing flow volumes and facilitating fish passage (includes fishway
construction on the Deep Creek Regulator).
2. Stage 1: Improved connectivity and fish passage throughout the Pike Anabranch system through
upgrades of Banks D, E, F, F1, H, G and Coombs Bridge (includes fishway construction on Bank
D).
3. Stage 2: Improved anabranch hydraulics during natural flood events through the replacement of
Banks B and C (includes construction of fish friendly culverts/fishways).
These proposed works will result in increased flow to the Pike Anabranch system (from ~350 ML.day-1
up to ~1000 ML.day-1
) and increased capacity to vary flow, thereby influencing hydraulic complexity,
potentially altering vegetated habitat and increasing connectivity both within the system and between the
Pike Anabranch and adjacent River Murray channel. The proposed changes will predominantly influence
the inner part of the system (i.e. Deep Creek, Maragaret Dowling Creek, Mundic Creek, Tanyaca Creek
and Rumpagunyah Creek), potentially increasing the area of favourable habitat for a range of native fish
species within the Pike system and facilitating fish movement within and between the Pike Anabranch
and main channel.
The current project has three key components with associated objectives and hypotheses;
1. To investigate spatio-temporal variation in fish assemblage structure (i.e. species composition and
abundance), recruitment, habitat (vegetated and hydraulic) and fish-habitat associations within the
Pike Anabranch system in relation to the interventions.
- It is hypothesised that increases in hydraulically diverse lotic habitat and increased
connectivity will result in significant changes to fish assemblage structure and
recruitment, habitat (vegetated and hydraulic) and fish-habitat associations, including
increases in the abundance of species that prefer hydraulically diverse environments
(e.g. Murray cod, golden perch).
2. To assess the effectiveness of newly constructed fishways on the Deep Creek inlet and Bank D.
3. To assess the effectiveness of newly constructed fishways on Banks B and C. *NOTE: these
banks are only connected upon flows in excess of 35,000 ML.day-1
and would only be monitored
if/when such conditions occurred.

Bice, Gehrig and Zampatti (2013) Pike Fish Intervention Monitoring 2013
6
Spatio-temporal variation in fish assemblage structure, recruitment, habitat and fish-habitat associations
(component 1) were investigated using a before-after-control-impact (BACI) experimental design. The
current report summarises data collected during before intervention monitoring. Construction and on-
ground works were planned for 2013/14 so the before intervention monitoring was scheduled for 2013
(prior to construction) to compare with after intervention monitoring scheduled for 2015 and 2016. The
fishway assessment components will occur in spring 2014 (component 2) or when flows exceed 30,000
ML.day-1
(component 3).

Bice, Gehrig and Zampatti (2013) Pike Fish Intervention Monitoring 2013
7
2. Methods
2.1. Site selection
A range of control (creek control, n = 6 and river control, n = 3) and impact (n = 7) sites were selected
from the Pike Anabranch system and adjacent River Murray, to be sampled before and after the
interventions being implemented, congruent with the BACI experimental approach (Table 1; Figure 1).
Impact sites were selected on creeks within the Pike Anabranch system most likely to experience
alteration to connectivity, hydrology and hydraulic characteristics as a result of the interventions under
the RRP. Sites previously sampled by Beyer et al. (2010) were selected, with the addition of one further
site (Site 2). In contrast, control sites were selected where the hydrology was unlikely to be influenced by
interventions over the study period and included sites on creeks within the Pike Anabranch (creek control
sites) and sites on the main river channel (river control sites). Again, sites previously sampled by Beyer et
al. (2010) were resampled and an additional creek control site in the upper Pike River (Site 9) was also
included. All sites were initially assigned to a mesohabitat category (i.e. fast-flowing habitats, slow-
flowing habitats, backwaters and River Murray main channel habitats) by visual estimation following
Beyer et al. (2010), but some were later quantified and, if necessary, revised following hydraulic habitat
characterisation. Sites were categorised based on mean water velocity (sensu Zampatti et al. 2011),
where fast-flowing habitats were characterised as having mean velocities of >0.18 m s-1
, slow-flowing
habitats 0.05–0.18 m s-1
, backwaters <0.05 m s-1
and main channel <0.1 m s-1
(Table 1).

Bice, Gehrig and Zampatti (2013) Pike Fish Intervention Monitoring 2013
8
Table 1. Site number, site name, treatment (impact, creek control and river control sites), latitude and
longitude and flow type (1 = fast flowing anabranches, 2 = slow flowing anabranches, 3 = backwaters, 4
= main channel) for sites sampled within the Pike Anabranch system in 2013. *indicates sites where
ADCP transects were undertaken.
Site
no.
Site name Treatment Latitude Longitude Flow
type
1 Mundic H Bank access Impact S34˚12.984’ E140˚47.105’ 3
2 Downstream Bank D Impact S34˚13.599’ E140˚46.203’ 3
3 Tanyaca Creek* Impact S34˚13.388’ E140˚45.495’ 3
4 Tanyaca Creek (d/s horseshoe)* Impact S34˚14.404’ E140˚45.074’ 2
5 Lower Pike* Impact S34˚15.580’ E140˚45.554’ 2
6 Lower Pike (Simarloo)* Impact S34˚16.459’ E140˚43.974’ 2
7 Lower Pike (d/s of Lyrup Rd) Impact S34˚15.712’ E140˚41.223’ 3
8 Mundic to Pike Cutting* Control (creek) S34˚11.966’ E140˚47.624’ 1
9 Upper Pike (d/s) Pike Lagoon Control (creek) S34˚12.927’ E140˚48.020’ 3
10 Coomb’s Bridge (d/s bridge)* Control (creek) S34˚13.435’ E140˚48.537’ 2
11 Lower Snake Creek Control (creek) S34˚14.267’ E140˚46.262’ 3
12 Upper Pike (cliffs) Control (creek) S34˚14.262’ E140˚49.550’ 3
13 Pike River (downstream of Col Col) Control (creek) S34˚15.304’ E140˚46.153’ 3
14 Main channel Murray (u/s Lock 5) Control (river) S34˚11.028’ E140˚46.421’ 4
15 Main channel Murray (d/s Lk 5) Control (river) S34˚13.550’ E140˚44.150’ 4
16 Main channel Murray (d/s Pike
Junction)
Control (river) S34˚15.268’ E140˚40.646’ 4

Bice, Gehrig and Zampatti (2013) Pike Fish Intervention Monitoring 2013
9
Figure 1. Map showing the location of impact (red circles), creek control (green circles) and river control (blue circles) sites sampled in the Pike
Anabranch and adjacent River Murray in 2013.

Bice, Gehrig and Zampatti (2013) Pike Fish Intervention Monitoring 2013
10
2.2. Data collection
Fish assemblage structure and recruitment
Fish assemblages at all sites were sampled from 08/04/2013–19/04/2013 using standardised boat
electrofishing. Boat electrofishing is a proven method to effectively and rapidly sample both large and
small-bodied fish in the littoral zone of turbid lowland rivers and creeks (Faragher and Rodgers 1997),
and is commonly used in anabranches and the main channel of the lower River Murray (Baumgartner et
al. 2008a, Zampatti et al. 2011). Fish were sampled from the littoral zone using a Smith-Root® 5 kW
electrofishing unit. At each site, 12 (six on each bank) x 90 second (power on time) ‘electrofishing shots’
were conducted during daylight hours and fish were dip-netted by a team of two netters and placed in a
live well. For each electrofishing shot, all sampled fish were identified, enumerated and a sub-sample of
20 individuals per species measured for length (fork (FL) or total length (TL), mm). Any positively
identified fish unable to be dip netted were recorded as ‘observed’.
All large-bodied fish (i.e. golden perch, silver perch, freshwater catfish and common carp) sampled that
were >250 mm in length were implanted with a PIT (Passive Integrated Transponder) tag and external
dart tag. PIT tags have unique identification codes that are recorded should a fish pass within the read
range of a reader, which are present on all fishways on main channel weirs of the lower River Murray
(Baumgartner et al. 2008b). PIT reader infrastructure may also be included on new fishways planned for
the Pike, Chowilla and Katarapko Anabranch systems. Thus, fish implanted with PIT tags in the Pike
Anabranch system may assist in assessing the effectiveness of new fishways in the system, as well as
assessing the movement of fish between the Pike Anabranch and River Murray, and movement within the
main channel of the River Murray.
Habitat availability
Simultaneous to electrofishing surveys, quantitative visual assessments of percentage cover of instream
microhabitat types (vegetation and structural elements) were undertaken within the area of each
electrofishing shot. Vegetation was recorded to individual taxa and categorised based on the following
functional groups: emergent, submerged, floating, amphibious, terrestrial and floodplain taxa (modified
from classification framework devised by Brock and Casanova (1997) to suit plant communities of the
lower River Murray). Where necessary, submerged vegetation was sampled using a van Veen grab to
verify identification to species. Woody debris, tree roots, rock and man-made pontoons were classified as
‘structural’ microhabitats. Woody debris was further categorised depending on the size of the wood (i.e.
WD 1: twigs and branches with diameters < 1 cm, WD 2: branches with diameters 1-5 cm and WD 3:

Bice, Gehrig and Zampatti (2013) Pike Fish Intervention Monitoring 2013
11
branches and trunks with diameters > 5 cm). The remaining area that was neither vegetated or contained
structural habitat was classified as ‘open water’.
Hydraulic habitat characterisation
Cross-sectional velocity profiles were measured at six sites (four impact and two control) (Table 1) using
a boat mounted SonTek River Surveyor M9 acoustic Doppler current profiler (ADCP). For specific
details on the operation of ADCP units see Shields and Rigby (2005). The ADCP record various data
including depth, heading, echo intensity and velocity, in several planes, and thus can generate cross-
sectional velocity profiles of streams with velocity readings provided across grided ‘cells’. These data can
also be used to investigate complex flow phenomena such as turbulence and circulation or flow rotation
(e.g. eddies) (Crowder and Diplas 2002), which may be biologically relevant to fish assemblage patterns
and vegetation cover.
Data that were generated from ADCP transects were first viewed in the SonTek ADCP software package
RiverSurveyor Live. Data were then exported to MATLAB (The Mathworks Inc. 2010) and interpolated
across grids with equal cell sizes (0.5 m long x 0.25 m high) using the Delaney triangulation scattered
data function, to produce cross-sectional velocity plots. Water velocity outputs for each cell are generated
in three planes; perpendicular or cross-transect (i.e. U, upstream to downstream), parallel to or along a
transect (i.e. V, from bank to bank) and vertical velocity (i.e. W, up or down). A range of hydraulic
metrics were calculated, namely discharge (m3.s
-1), transect length (m), mean depth (m), cross-sectional
area (m2), mean U (m.s
-1), max U (m.s
-1), min U (m.s
-1), standard deviation U, coefficient of variation,
mean V (m.s-1
), mean W (m.s-1
) and the modified circulation metric (M3, s-1
) (sensu Crowder and Diplas
2000). Calculation of M3 is explained by Equation 1, where w represents velocity in the vertical plane z
and v represents velocity in the lateral plane y. Absolute values of velocity are used so that the direction of
calculation (i.e. clockwise or counter-clockwise) does not result in the cancelation of eddies of equal
strength in opposing directions. Higher values of M3 indicate greater frequency and strength of eddies or
greater levels of circulation (i.e. flow rotation) within a cross-section.
Equation 1. M3 =

Bice, Gehrig and Zampatti (2013) Pike Fish Intervention Monitoring 2013
12
2.3. Data analysis
Spatial variation in both fish assemblage structure (i.e. species composition and abundance) and
microhabitat cover (microhabitat type and proportional cover) was investigated using single-factor
permutational mulitvariate analysis of variance (PERMANOVA) (Anderson 2001, Anderson and Ter
Braak 2003) in the software package PRIMER v. 6.1.12 (Clarke and Gorley 2006) and PERMANOVA+
(Anderson et al. 2008). Analyses were performed on fish relative abundance data (fish.minute of
electrofishing-1
.electrofishing shot-1
) and microhabitat cover proportions, which were fourth root and
arcsine transformed, respectively. PERMANOVA was performed on Bray-Curtis similarity matrices
(Bray and Curtis 1957). Non-Metric Multi-Dimensional Scaling (MDS), generated from the same
matrices was used to visualise assemblages and microhabitat cover from different treatments (i.e. impact,
creek control, river control). When differences occurred in fish assemblages or microhabitat cover
between treatments, Similarity Percentages (SIMPER) analysis was used to determine the fish species or
microhabitat types contributing to these differences and a 40% cumulative contribution cut-off was
applied.
When differences occurred in fish assemblages and microhabitat cover between treatments, Indicator
Species Analysis (ISA) (Dufrene and Legendre 1997) was also used to determine what fish species and
microhabitat types characterised the assemblage/microhabitat cover in each treatment, using the software
package PCOrd v 5.12 (McCune and Mefford 2006). ISA combines information on the concentration of
species abundance in a particular group and the faithfulness of occurrence of a species in a particular
group (McCune et al. 2002). A perfect indicator of a particular group should be faithful to that group
(always present) and exclusive to that group (never occurring in other groups) (McCune et al. 2002). This
test produces indicator values (IV) for each species in each group on the basis of the standards of the
perfect indicator. Statistical significance of each indicator value is tested by Monte Carlo (randomisation)
technique, where the real data are compared against (in the case for this study) 5000 runs of randomised
data (Dufrene and Legendre 1997).
ISA was also used to investigate if the presence or absence of specific fish species was significantly
positively or negatively associated with particular microhabitat types within each treatment (impact, creek
control, river control). This test was used to determine whether a microhabitat type had a significantly
greater proportion of cover when a fish species was either present or absent. This analysis was undertaken
separately for each fish species within each treatment (α = 0.05).
Bice, Gehrig and Zampatti (2013) Pike Fish Intervention Monitoring 2013
13
3. Results
3.1. Catch summary
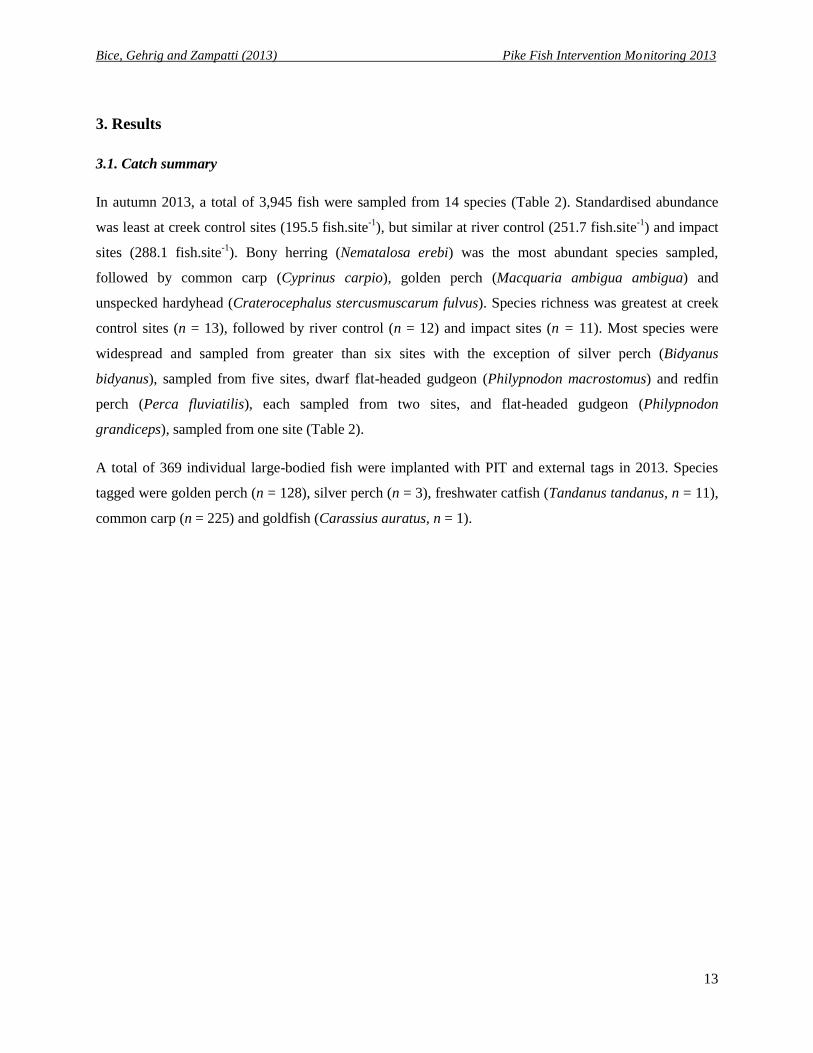
In autumn 2013, a total of 3,945 fish were sampled from 14 species (Table 2). Standardised abundance
was least at creek control sites (195.5 fish.site-1
), but similar at river control (251.7 fish.site-1
) and impact
sites (288.1 fish.site-1
). Bony herring (Nematalosa erebi) was the most abundant species sampled,
followed by common carp (Cyprinus carpio), golden perch (Macquaria ambigua ambigua) and
unspecked hardyhead (Craterocephalus stercusmuscarum fulvus). Species richness was greatest at creek
control sites (n = 13), followed by river control (n = 12) and impact sites (n = 11). Most species were
widespread and sampled from greater than six sites with the exception of silver perch (Bidyanus
bidyanus), sampled from five sites, dwarf flat-headed gudgeon (Philypnodon macrostomus) and redfin
perch (Perca fluviatilis), each sampled from two sites, and flat-headed gudgeon (Philypnodon
grandiceps), sampled from one site (Table 2).
A total of 369 individual large-bodied fish were implanted with PIT and external tags in 2013. Species
tagged were golden perch (n = 128), silver perch (n = 3), freshwater catfish (Tandanus tandanus, n = 11),
common carp (n = 225) and goldfish (Carassius auratus, n = 1).

Bice, Gehrig and Zampatti (2013) Pike Fish Intervention Monitoring 2013
14
Table 2. Summary of species and total numbers of fish captured across 16 sampling sites in Pike Anabranch system and adjacent River Murray in
autumn 2013. *denotes non-native species.
Site codes
Creek Control River Control Impact
8 9 10 11 12 13 14 15 16 1 2 3 4 5 6 7
Creek
control
total
River
control
total
Impact
total
Combined
total
Common
name
Scientific name
Golden
perch
Macquaria
ambigua ambigua 27 30 19 0 4 0 8 14 15 1 1 49 34 42 20 15 80 37 162 279
Silver perch Bidyanus bidyanus 2 1 1 0 2 0 0 1 0 0 0 0 0 0 0 0 6 1 0 7
Freshwater
catfish
Tandanus
tandanus 1 1 1 0 0 0 1 2 4 0 0 0 0 1 0 0 3 7 1 11
Bony
herring
Nematalosa erebi 402 76 93 50 62 10 28 401 162 106 109 96 178 205 149 176 693 591 1020 2304
Australian
smelt
Retropinna semoni 1 0 2 5 0 9 0 9 11 0 1 2 2 0 0 8 17 20 13 50
Murray
rainbowfish
Melanotaenia
fluviatilis 11 6 5 0 0 0 22 3 15 2 1 3 6 0 6 28 22 40 46 108
Flat-headed
gudgeon
Philypnodon
grandiceps 0 1 0 0 0 0 0 0 0 0 0 0 0 0 0 0 1 0 0 1
Dwarf flat-
headed
gudgeon
Philypnodon
macrostomus 1 0 0 0 0 0 0 0 1 0 0 0 0 0 0 0 1 1 0 2
Unspecked
hardyhead
Craterocephalus
stercusmuscarum
fulvus
10 2 20 7 4 1 2 0 6 73 2 3 0 1 7 6 44 8 92 144
Carp
gudgeon
complex
Hypseleotris spp
6 0 3 0 0 0 1 0 0 15 1 4 0 3 0 2 9 1 25 35
Common
carp*
Cyprinus carpio 68 49 39 30 47 0 23 13 9 16 55 296 51 64 81 24 233 45 587 865
Eastern
gambusia*
Gambusia
holbrooki 0 0 2 3 0 0 0 2 1 1 0 1 0 2 0 0 5 3 4 12
Goldfish* Carassius auratus 14 1 3 22 19 0 1 0 0 1 9 39 9 6 1 0 59 1 65 125
Redfin
perch*
Perca fluviatilis 0 0 0 0 0 0 0 0 0 0 0 1 0 0 0 1 0 0 2 2
Total number
Species diversity 543 167 188 117 138 20 86 445 224 215 179 494 281 324 264 260 1173 755 2017 3945
11 9 11 6 6 3 8 8 9 8 8 10 6 8 6 8 13 12 11 14

Bice, Gehrig and Zampatti (2013) Pike Fish Intervention Monitoring 2013
15
3.2. Spatial variability in fish assemblage structure
Data from Site 13 (creek control, Pike River downstream of Col Col) represented a statistical outlier
because few species and low numbers of fish were sampled. Subsequently, those data were excluded from
the analysis because these may have masked differences between treatments. MDS ordination of fish
assemblage data exhibited a weak grouping of fish assemblages by treatment (Figure 2), supported by
PERMANOVA, which detected significant differences in fish assemblages between treatments (Pseudo-
F2, 179 = 7.82, p < 0.001). Pairwise comparisons revealed that river control sites were significantly
different from creek control (t = 3.5, p < 0.001) and impact (t = 3.24, p < 0.001) sites, but impact and
creek control sites were not significantly different (t = 1.43, p = 0.087).
Figure 2. Non-metric multi-dimensional scaling (MDS) plot of fish assemblages sampled using
electrofishing from creek control (solid circle), river control (open circle) and impact (solid triangle) sites
in 2013.
SIMPER (adopting a 40% cumulative contribution cut-off) indicated that differences between
assemblages sampled at river control sites and both creek control and impact sites, were due to greater
abundances of bony herring and Murray rainbowfish (Melanotaenia fluviatilis) at river control sites, and
comparatively greater abundances of golden perch and common carp at creek control and impact sites
(Figure 3). ISA determined the assemblage at river control sites was characterised by Murray rainbowfish
Bice, Gehrig and Zampatti (2013) Pike Fish Intervention Monitoring 2013
16
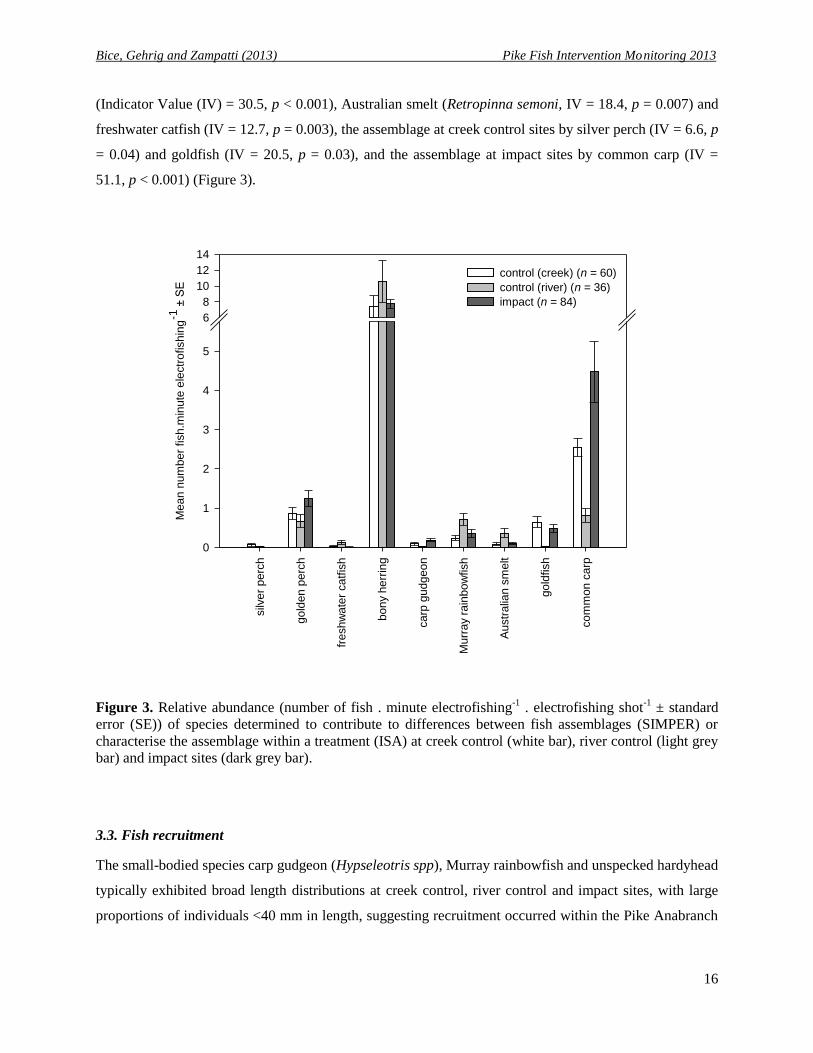
(Indicator Value (IV) = 30.5, p < 0.001), Australian smelt (Retropinna semoni, IV = 18.4, p = 0.007) and
freshwater catfish (IV = 12.7, p = 0.003), the assemblage at creek control sites by silver perch (IV = 6.6, p
= 0.04) and goldfish (IV = 20.5, p = 0.03), and the assemblage at impact sites by common carp (IV =
51.1, p < 0.001) (Figure 3).
Figure 3. Relative abundance (number of fish . minute electrofishing-1
. electrofishing shot-1
± standard
error (SE)) of species determined to contribute to differences between fish assemblages (SIMPER) or
characterise the assemblage within a treatment (ISA) at creek control (white bar), river control (light grey
bar) and impact sites (dark grey bar).
3.3. Fish recruitment
The small-bodied species carp gudgeon (Hypseleotris spp), Murray rainbowfish and unspecked hardyhead
typically exhibited broad length distributions at creek control, river control and impact sites, with large
proportions of individuals <40 mm in length, suggesting recruitment occurred within the Pike Anabranch
silv
er
perc
h
gold
en p
erc
h
fresh
wate
r ca
tfis
h
bony
herr
ing
ca
rp g
udgeon
Murr
ay
rain
bow
fish
Austr
alia
n s
melt
gold
fish
co
mm
on c
arp
Mean n
um
ber
fish
.min
ute
ele
ctr
ofish
ing
-1 ±
SE
0
1
2
3
4
5
6
8
10
12
14
control (creek) (n = 60)
control (river) (n = 36)
impact (n = 84)

Bice, Gehrig and Zampatti (2013) Pike Fish Intervention Monitoring 2013
17
and adjacent River Murray in 2012/13 (Figure 4a-c). Recruitment of Australian smelt was less distinct
with all individuals sampled >40 mm FL (Figure 4d).
Bony herring exhibited similar length distributions across all treatments, with broad size ranges and a
large proportion of likely newly recruited individuals <100 mm FL (Figure 5a). Golden perch also
exhibited similarly broad length distributions across treatments (Figure 5b). Two individuals <70 mm TL
were sampled from impact sites and likely represented newly recruited fish from spawning in 2012/13.
Freshwater catfish sampled across all treatments ranged 361–524 mm TL and thus no evidence of recent
recruitment was detected (Figure 5c). Only low numbers of silver perch were sampled at all sites, but the
species exhibited a broad length range from creek control sites and a single fish sampled from a river
control site (84 mm FL) likely represented a recently recruited individual from spawning in 2012/13
(Figure 5d).
With the exception of goldfish at river control sites, where only one individual was sampled, common
carp and goldfish were typically sampled from broad length distributions, with evidence of recent
recruitment within the Pike Anabranch system and in the case of common carp, in the adjacent River
Murray channel (Figure 6a and b).

Bice, Gehrig and Zampatti (2013) Pike Fish Intervention Monitoring 2013
18
Figure 4. Length frequency distribution of a) carp gudgeon (TL), b) Murray rainbowfish (FL), c)
unspecked hardyhead (FL) and d) Australian smelt (FL) at creek control (white bar), river control (grey
bar) and impact (black bar) sites.
0 10 20 30 40 50
Pe
rce
nt
fre
qu
en
cy
0
20
40
60
80
100 n = 9
0 10 20 30 40 50
n = 22
0 10 20 30 40 50 60 70 80
Pe
rce
nt
fre
qu
en
cy
0
10
20
30
40
n = 19
0 10 20 30 40 50 60 70 80
n = 36
Length (mm)
0 10 20 30 40 50 60 70 80
Pe
rce
nt
fre
qu
en
cy
0
20
40
60
80
100
n = 13
Length (mm)
0 10 20 30 40 50 60 70 80
n = 12
0 10 20 30 40 50 60
Pe
rce
nt
fre
qu
en
cy
0
20
40
60n = 34
0 10 20 30 40 50 60
n = 52
a) carp gudgeon
b) Murray rainbowfish
d) Australian smelt
c) unspecked hardyhead
0 10 20 30 40 50
n = 1
0 10 20 30 40 50 60 70 80
n = 33
Length (mm)
0 10 20 30 40 50 60 70 80
n = 15
0 10 20 30 40 50 60
n = 5

Bice, Gehrig and Zampatti (2013) Pike Fish Intervention Monitoring 2013
19
Figure 5. Length frequency distribution of a) bony herring (FL), b) golden perch (TL), c) freshwater
catfish (TL) and d) silver perch (FL) at creek control (white bar), river control (grey bar) and impact
(black bar) sites.
0 100 200 300 400
Perc
ent fr
equency
0
10
20
30
40
50
n = 339
0 100 200 300 400
n = 599
0 100 200 300 400 500
Perc
ent fr
equency
0
5
10
15
20
n = 68
0 100 200 300 400 500
n = 146
0 100 200 300 400 500 600
Perc
ent fr
equency
0
20
40
60
80
100n = 3
0 100 200 300 400 500 600
n = 1
Length (mm)
0 100 200 300 400
Perc
ent fr
equency
0
20
40
60
80
100
n = 6
Length (mm)
a) bony herring
b) golden perch
c) freshwater catfish
d) silver perch
Not sampled at impact sites
0 100 200 300 400
n = 258
0 100 200 300 400 500
n = 32
0 100 200 300 400 500 600
n = 7
Length (mm)
0 100 200 300 400
n = 1

Bice, Gehrig and Zampatti (2013) Pike Fish Intervention Monitoring 2013
20
Figure 6. Length frequency distribution of a) common carp (FL) and b) goldfish (FL) at creek control
(white bar), river control (grey bar) and impact (black bar) sites.
3.4. Microhabitat availability
At impact sites, there were 23 instream microhabitat types from seven functional groups, compared to 18
microhabitat types from six functional groups and 14 microhabitats from five functional groups,
respectively, at creek control and river control sites (Table 3). MDS ordination of instream microhabitat
data showed groupings of microhabitats by treatment (Figure 7), supported by PERMANOVA which
detected significant differences in microhabitat cover between treatments (Pseudo-F2, 191 = 25.25,
p < 0.001). Pairwise comparisons revealed that microhabitat cover was significantly different between
creek control, river control and impact sites (Bonferroni corrected α = 0.017).
SIMPER (adopting a 40% cumulative contribution cut-off) indicated differences in microhabitat cover
between treatments were primarily driven by greater cover of WD 3 at impact sites and greater cover of
Typha domingensis and open water at control sites. ISA was also used to determine what microhabitats
characterised microhabitat cover for each treatment. Microhabitat cover at creek control sites was
characterised by a range of floating, amphibious and emergent macrophytes including Azolla filiculoides,
0 100 200 300 400 500 600 700
Perc
ent
frequency
0
5
10
15
20
25
n = 156
0 100 200 300 400 500 600 700
n = 302
Length (mm)
0 100 200 300
Perc
ent
frequency
0
20
40
60
80
100n = 45
Length (mm)
0 100 200 300
n = 50
a) common carp
b) goldfish
0 100 200 300 400 500 600 700
n = 30
Length (mm)
0 100 200 300
n = 1

Bice, Gehrig and Zampatti (2013) Pike Fish Intervention Monitoring 2013
21
Ludwigia peploides, Phragmites australis, Schoenoplectus validus and Typha domingensis, along with
open water. River control sites were characterised by the terrestrial Pasaplum distichum and emergent
Juncus usitatus and Salix babylonica. Impact sites were characterised by high proportions of cover of
structural elements, including WD 1, WD 2, WD 3 and tree roots, as well as adult Eucalyptus
camaldulensis.
Figure 7. Non-metric multi-dimensional scaling (MDS) plot of proportional microhabitat cover measured
during sampling of creek control (solid circle), river control (open circle) and impact (solid triangle) sites
in 2013.

Bice, Gehrig and Zampatti (2013) Pike Fish Intervention Monitoring 2013
22
Table 3. Mean cover (mean proportional cover.electrofishing shot-1
± standard error) of microhabitats and
functional types at creek control, river control and impact sites in 2013. Recruits = seedling/saplings.
Microhabitat
Functional type Creek
control
River
control
Impact
Bolboschoenus caldwellii Emergent - - 0.001 ± 0.001
Cyperus gymnocaulos Emergent 0.03 ± 0.03 - 0.01 ± 0.01
Juncus usitatus Emergent - 0.19 ± 0.15 0.05 ± 0.05
Phragmites australis Emergent 1.5 ± 0.44 0.53 ± 0.32 0.05 ± 0.03
Schoenoplectus validus Emergent 3.68 ± 1.01 0.89 ± 0.62 0.63 ± 0.23
Typha domingensis Emergent 10.63 ± 1.55 11.03 ± 3.5 1.64 ± 0.5
Crassula helmsii Emergent - - 0.01 ± 0.01
Salix babylonica Emergent 0.15 ± 0.10 11.36 ± 4.57 -
Myriophyllum verrucosum Submerged - - 0.21 ± 0.1
Azolla filiculoides Floating 0.72 ± 0.25 - 0.20 ± 0.13
Aster subulatus Amphibious 0.03 ± 0.02 - 0.01 ± 0.01
Ludwigia peploides Amphibious 4.94 ± 0.69 0.19 ± 0.17 1.37 ± 0.35
Duma florulenta Amphibious 0.15 ± 0.10 - -
Persicaria lapathifolia Amphibious 0.34 ± 0.19 - 0.19 ± 0.11
Open water N/A 64.23 ± 3.04 54.64 ± 5.37 52.56 ± 1.95
WD 1 Structural 2.22 ± 0.47 2.89 ± 0.77 5.94 ± 0.54
WD 2 Structural 3.60 ± 0.59 5.00 ± 0.91 10.42 ± 0.48
WD 3 Structural 5.04 ± 0.89 8.67 ± 1.28 17.01 ± 1.03
Tree roots Structural 2.53 ± 0.52 3.67 ± 0.87 6.88 ± 0.65
Rock Structural - - 0.07 ± 0.05
Man-made structure (e.g. pontoon) Structural 0.08 ± 0.08 0.47 ± 0.33 0.08 ± 0.06
Eucalyptus camaldulensis (adult) Floodplain tree - - 2.24 ± 0.6
Eucalyptus camaldulensis (recruit) Floodplain tree 0.07 ± 0.07 - 0.04 ± 0.04
Eucalyptus camaldulensis (dead) Floodplain tree - - 0.42 ± 0.3
Acacia stenophylla (adult) Floodplain tree - 0.33 ± 0.33 -
Paspalum distichum Terrestrial - 0.14 ± 0.1 0.01 ± 0.01
Lactuca serriola Terrestrial 0.06 ± 0.06 - -
Total microhabitats 18 14 23
3.5. Fish-microhabitat associations
As the composition of microhabitat differed significantly between treatments, fish-habitat associations
were investigated separately for creek control, river control and impact sites. Microhabitats that
contributed a mean proportional cover of <0.1% and fish species with <5 individuals sampled were
excluded from analyses. Of the remaining microhabitat types present at impact (n = 13), control (n = 13)
and river control (n = 14) sites, six fish species exhibited significant associations with specific
microhabitat types at impact sites, nine species at creek control sites and three species at river control sites
(Table 4). Spatial variability in fish-microhabitat associations between treatments were species specific.
Associations were often inconsistent across treatments for large-bodied fish species, but were consistent
across treatments for small-bodied species.

Bice, Gehrig and Zampatti (2013) Pike Fish Intervention Monitoring 2013
23
At impact sites, golden perch presence was positively associated with open water and negatively
associated with a range of emergent, amphibious and floating macrophytes and the floodplain tree
Eucalyptus camaldulensis (Table 4). Alternatively at both creek control and river control sites it was
negatively associated with open water, but positive association was exhibited with several structural
microhabitats including WD 1, WD 2, WD 3 and tree roots. Freshwater catfish were rare at impact and
creek control sites, but were positively associated with WD 2 at river control sites. Australian smelt
exhibited no significant associations at impact and river control sites, but at creek control sites, were
positively associated with the floating Azolla filiculoides and emergent Salix babylonica. Murray
rainbowfish were positively associated with open water at impact sites and negatively associated with
WD 3, but conversely at creek control sites, positively associated with WD 1, WD 2 and WD 3, and
negatively associated with open water. At river control sites, the species was positively associated with
Typha domingensis. At both impact and creek control sites, unspecked hardyhead and carp gudgeon were
positively associated with one or more emergent, submergent, amphibious and floating macrophyte
species and negatively associated with open water. Carp gudgeon were considered rare at river control
sites and no significant associations were detected for unspecked hardyhead.
Common carp exhibited contrasting associations between treatments with negative associations with a
range of amphibious and emergent macrophytes, and Eucalyptus camaldulensis, at impact sites, but
positive associations with Typha domingensis and Ludwigia peploides, as well as structural elements
(WD 1, WD 2 and WD 3) at control sites. Eastern gambusia was positively associated with Eucalyptus
camaldulensis at impact sites and Azolla filiculoides, and Schoenoplectus validus at creek control sites.
Goldfish were negatively associated with Eucalyptus camaldulensis at impact sites, but positively
associated with a range of emergent, amphibious and floating macrophytes at control sites, and negatively
associated with open water.

Bice, Gehrig and Zampatti (2013) Pike Fish Intervention Monitoring 2013
24
Table 4. Results of Indicator Species Analysis used to derive positive and negative fish-microhabitat associations for impact, control and river
control sites. Indicator Values (IV) for species in percentage of perfect indication for that particular habitat type are presented in brackets and only
statistically significant (p < 0.05) indicator species are presented. Perfect indication (100%) occurs when a microhabitat type is always present
when a given fish species is present (positive association) or always present when a given fish species is absent (negative association). (ad) = adult
trees.
Common
name
Scientific name Impact Control River control
Positive Negative Positive Negative Positive Negative
Golden perch Macquaria
ambigua ambigua
Open water (53.5) A. filiculoides (19.4)
E. camaldulensis
(ad) (26.2)
L. peploides (28.9)
M. verrucosum
(16.1)
P. lapathifolia (9.7)
S. validus (25.8)
T. domingensis
(34.2)
WD 1 (43.8)
WD 2 (52.8)
WD 3 (48.1)
Tree root (60.2)
A. filiculoides (21.4)
Open water (55.2)
S. validus (29.8)
WD 1 (47.5)
WD 2 (60.7)
WD 3 (49.9)
Open water (59.0)
Silver perch Bidyanus bidyanus - - N/S N/S Rare Rare
Freshwater
catfish
Tandanus tandanus Rare Rare WD 1 (49.5) N/S WD 2 (56.1) N/S
Bony herring Nematalosa erebi Widespread Widespread WD 2 (46.0)
WD 3 (44.4)
N/S Widespread Widespread
Australian
smelt
Retropinna semoni N/S N/S A. filiculoides
(20.3)
S. babylonica
(12.6)
WD 2 (39.6)
WD 3 (43.6)
Tree root (31.6)
N/S N/S
Murray
rainbowfish
Melanotaenia
fluviatilis
Open water (53.8) WD 3 (54.9) WD 1 (49.0)
WD 2 (56.3)
WD 3 (58.1)
N/S T. domingensis
(42.9)
Open water (61.8)
Unspecked
hardyhead
Craterocephalus
stercusmuscarum
fulvus
E. camaldulensis
(ad) (35.1)
L. peploides (47.2)
M. verrucosum
(20.0)
P. lapathifolia
(12.0)
S. validus (32.0)
T. domingensis
(45.3)
Open water (54.5) Ludwigia
peploides (49.3)
Salix babylonica
(12.0)
N/S N/S N/S

Bice, Gehrig and Zampatti (2013) Pike Fish Intervention Monitoring 2013
25
Table 4 continued.
Common
name
Scientific name Impact Control River control
Positive Negative Positive Positive Negative
Carp gudgeon
complex
Hypseleotris spp E. camaldulensis
(ad) (49.3)
L. peploides (47.8)
S. validus (24.1)
T. domingensis
(45.1)
Open water (53.5) WD 1 (48.5)
S. babylonica
(32.7)
N/S rare rare
Common carp* Cyprinus carpio N/S E. camaldulensis
(ad) (44.6)
L. peploides (42.8)
S. validus (39.1)
T. domingensis
(47.7)
WD 1 (32.4)
WD 2 (46.0)
WD 3 (42.5)
T. domingensis
(71.1)
L. peploides
(64.8)
Open water (62.4) N/S N/S
Eastern
gambusia*
Gambusia holbrooki E. camaldulensis
(dead) (24.0)
N/S A. filiculoides
(42.3)
L. peploides
(67.0)
P. australis (39.2)
S. validus (61.5)
N/S N/S N/S
Goldfish* Carassius auratus N/S E. camuldulensis
(ad) (20.8)
A. filiculoides
(22.4)
L. peploides
(52.8)
P. lapathifolia
(13.2)
S. validus (42.3)
T. domingensis
(66.3)
P. australis (27.5)
Open water (60.9) rare rare

Bice, Gehrig and Zampatti (2013) Pike Fish Intervention Monitoring 2013
26
3.6. Hydraulic habitat characterisation
During ADCP transect measurement; discharge in the River Murray ranged between 6,984 and 8,113
ML.day-1
. Nonetheless, under current management, flow to the Pike Anabranch system remains constant
at ~350 ML.day-1
due to irrigation demands and the current configuration of inlet structures. Creek
morphology and proximity of regulatory structures (e.g. earthen banks) differ markedly between sites and
accordingly hydraulic characteristics, such as discharge, mean depth and a range of flow velocity related
metrics also varied (Table 5; Figure 8–13). Mean cross-transect velocity varied from 0.01–0.19 m.s-1
across sites and the modified circulation metric (M3), which is a measure of the strength and frequency of
eddies in cross-sectional profiles, also varied between sites. The greatest mean velocity and circulation
occurred at Site 8 (the Mundic-Pike Cutting). In general at impact sites, velocity ranges, mean flow
velocities and circulation were comparatively low (Table 5). Nevertheless, the cross-sectional velocity
profiles (Figure 8–13) and hydraulic metrics generated will provide a means to determine changes in the
hydraulic environment following the planned interventions. Hydraulic characterisations were not made at
river control sites, as main channel sites are more influenced by daily variation in discharge (Bice et al.
2013b) and are morphologically distinct from creek sites.
Table 5. Hydraulic habitat metrics calculated from ADCP generated data from control and impact sites
within the Pike Anabranch system in autumn 2013. Metrics include point discharge (m3.s
-1) at each
location, the transect length (m), mean depth (m) across the cross-section, total area of the cross-section
(m2), mean cross-transect (upstream to downstream) velocity (U, m.s
-1), Max U (m.s
-1), Min U (m.s
-1),
standard deviation in cross-transect velocities (m.s-1
), coefficient of variation, mean velocity along or
parallel to each transect (V, m.s-1
), mean velocity in the vertical plane (W, m.s-1
) and the modified
circulation metric (M3, s-1
).
Creek control sites Impact sites
Site 8 Site 10 Site 3 Site 4 Site 5 Site 6
Discharge (m3.s
-1) 4.2 5 0.48 3.3 16.24 8.22
Transect length (m) 16.95 52.73 34.55 25.68 50.7 26.23
Mean depth (m) 0.55 0.79 0.61 0.84 1.24 1.15
Area (m2) 22.33 83.55 37.85 42.29 157.73 90.16
Mean U (m.s-1
) 0.19 0.06 0.01 0.08 0.10 0.09
Max U (m.s-1
) 0.36 0.27 0.15 0.16 0.21 0.22
Min U (m.s-1
) -0.08 -0.13 -0.13 -0.07 -0.05 -0.10
Standard deviation U 0.13 0.09 0.03 0.04 0.03 0.04
Coefficient of variation 0.68 1.49 2.02 0.44 0.26 0.48
Mean V 0.06 0.001 0.001 0.01 0.02 0.03
Mean W 0.01 0.01 0.006 0.002 0.003 0.004
M3 (s-1
) 0.12 0.05 0.06 0.07 0.03 0.05

Bice, Gehrig and Zampatti (2013) Pike Fish Intervention Monitoring 2013
27
Figure 8. Cross-sectional water velocity (top) and circulation profiles (bottom) generated from ADCP transects at site 8 (Control: Pike to Mundic
Cutting) in autumn 2013. Current velocity plot present cross-transect velocities (U) in cells 0.5 m in length x 0.25 m in height. The circulation plot
presents a combination of velocities in the vertical and horizontal planes (i.e. along-transect, W, and vertically, V), transverse to the banks, with
vectors representing the direction of rotation.

Bice, Gehrig and Zampatti (2013) Pike Fish Intervention Monitoring 2013
28
Figure 9. Cross-sectional water velocity (top) and circulation profiles (bottom) generated from ADCP transects at site 10 (Control: Pike River
downstream Coombs Bridge) in autumn 2013. Current velocity plot present cross-transect velocities (U) in cells 0.5 m in length x 0.25 m in
height. The circulation plot presents a combination of velocities in the vertical and horizontal planes (i.e. along-transect, W, and vertically, V),
transverse to the banks, with vectors representing the direction of rotation.

Bice, Gehrig and Zampatti (2013) Pike Fish Intervention Monitoring 2013
29
Figure 10. Cross-sectional water velocity (top) and circulation profiles (bottom) generated from ADCP transects at site 3 (Impact: Tanyaca Creek
upstream Horseshoe) in autumn 2013. Current velocity plot present cross-transect velocities (U) in cells 0.5 m in length x 0.25 m in height. The
circulation plot presents a combination of velocities in the vertical and horizontal planes (i.e. along-transect, W, and vertically, V), transverse to the
banks, with vectors representing the direction of rotation.

Bice, Gehrig and Zampatti (2013) Pike Fish Intervention Monitoring 2013
30
Figure 11. Cross-sectional water velocity (top) and circulation profiles (bottom) generated from ADCP transects at site 4 (Impact: Tanyaca Creek
downstream horseshoe) in autumn 2013. Current velocity plot present cross-transect velocities (U) in cells 0.5 m in length x 0.25 m in height. The
circulation plot presents a combination of velocities in the vertical and horizontal planes (i.e. along-transect, W, and vertically, V), transverse to the
banks, with vectors representing the direction of rotation.

Bice, Gehrig and Zampatti (2013) Pike Fish Intervention Monitoring 2013
31
Figure 12. Cross-sectional water velocity (top) and circulation profiles (bottom) generated from ADCP transects at site 5 (Impact: Lower Pike
River) in autumn 2013. Current velocity plot present cross-transect velocities (U) in cells 0.5 m in length x 0.25 m in height. The circulation plot
presents a combination of velocities in the vertical and horizontal planes (i.e. along-transect, W, and vertically, V), transverse to the banks, with
vectors representing the direction of rotation.

Bice, Gehrig and Zampatti (2013) Pike Fish Intervention Monitoring 2013
32
Figure 13. Cross-sectional water velocity (top) and circulation profiles (bottom) generated from ADCP transects at site 6 (Impact: Lower Pike
River at Simarloo) in autumn 2013. Current velocity plot present cross-transect velocities (U) in cells 0.5 m in length x 0.25 m in height. The
circulation plot presents a combination of velocities in the vertical and horizontal planes (i.e. along-transect, W, and vertically, V), transverse to the
banks, with vectors representing the direction of rotation.

Bice, Gehrig and Zampatti (2013) Pike Fish Intervention Monitoring 2013
33
4. Discussion
As part of the Riverine Recovery Project (RRP), several interventions are planned for the Pike Anabranch
system with the aim of increasing flow to the system, providing greater capacity to vary flow volumes,
increasing hydrological connectivity and mitigating barriers to fish passage (DEWNR 2011). Specifically,
the Early Works program and stage 1 intervention involve upgrading the inlet regulator at Deep Creek,
including the construction of a fishway, to allow greater variation in flow delivered to the system, and the
replacement/upgrade of Banks E, D, F, F1, H, G and Coombs Bridge, including fishway construction on
Bank D. Stage 2 of the intervention program involves the replacement of Banks B and C with culverts
and fishways, which will improve hydrological connectivity and hydraulics during natural flood events. It
is hypothesised that increased hydrological connectivity and flow to the system, and accompanying
increases in hydraulically diverse lotic habitat, will result in significant changes to fish assemblage
structure and recruitment, habitat (vegetated and hydraulic) and fish-habitat associations, including
increases in the abundance of fish species that prefer hydraulically diverse environments (e.g. Murray
cod, golden perch). This report summarises results from ‘before’ intervention monitoring undertaken in
2013. On-ground works are planned for 2013/14, with ‘after’ intervention monitoring planned for 2015
and 2016.
4.1. Fish assemblage structure
In 2013, total fish abundance (3945 fish) and diversity (14 species) across the 16 sites were similar to
abundance (4138 fish) and diversity (13 species) recorded from sampling in the Pike Anabranch system in
2009 (Beyer et al. 2010). Nonetheless, the abundances of several species were different between 2009 and
2013. Bony herring was the most abundant species in both years but several small-bodied species (i.e.
unspecked hardyhead, Australian smelt and carp gudgeon), were present in lower numbers in 2013,
relative to 2009. In contrast, golden perch (n = 279) and common carp (n = 865) were sampled in greater
numbers than in 2009 (n = 47 and 237, respectively), whilst silver perch and freshwater catfish were
sampled in similar abundances in both years. No Murray cod were detected in either year.
Similar patterns of reduced abundance of small-bodied species and increased abundance of golden perch
and common carp following flooding and elevated flow was evident in the Chowilla and Kataraptko
Anabranches (Leigh et al. 2012, Wilson et al. 2012, Zampatti and Leigh 2013), and the main channel of
the lower River Murray over the same period (Bice et al. 2013a). Bice et al. (2013a) suggest that reduced
cover of favoured habitat, in the form of submerged vegetation, during and post-flooding likely resulted
in the observed decreases in abundance of small-bodied species in the main channel. Similarly,

Bice, Gehrig and Zampatti (2013) Pike Fish Intervention Monitoring 2013
34
submerged vegetation cover was substantially reduced in the Pike Anabranch in 2013, relative to 2009,
and may have influenced the abundance of small-bodied species. In contrast, increased abundance of
golden perch in the Chowilla and Kataraptko Anabranches, and main channel, were attributed to
enhanced recruitment of fish spawned in 2009/10 and 2010/11, across the floodplain geomorphic region
of the lower Murray (i.e. from Lock 3 to the Murray-Darling Junction) following flooding (Zampatti and
Leigh 2013). The observation of high abundances of golden perch, from a broad size range, in the Pike
Anabranch provides further support to a uniform recruitment response to high flows and flooding across
the floodplain geomorphic region (Zampatti and Leigh 2013) and suggests that habitats within the Pike
Anabranch system are favourable for the species.
In 2013, fish assemblages were not significantly different between control and impact sites within the
Pike Anabranch system, but assemblages at river control sites were significantly different from both creek
control and impact sites. Differences were primarily due to greater relative abundances of bony herring,
Australian smelt and Murray Rainbowfish at river control sites and greater relative abundances of golden
perch, common carp, goldfish and carp gudgeon at creek control and impact sites. Length frequency
distributions and recruitment of most species appeared consistent across treatments with the exception of
several species (e.g. carp gudgeon, silver perch and goldfish) that were sampled in low abundance from
certain treatments. These patterns likely reflect typical differences between fish assemblages of riverine
and anabranch habitats within this region. Following the planned interventions, it is hypothesised that fish
assemblages at impact sites will be significantly different from current assemblages, but assemblages at
creek control and river sites will not change significantly.
4.2. Microhabitat cover and fish-microhabitat associations
Instream microhabitat cover varied significantly between treatments and was most diverse at impact sites,
with 23 microhabitat types present. Differences in microhabitat cover were generally due to greater
relative proportional cover of structural microhabitats (woody debris types and tree roots) at impact sites,
greater relative proportional cover of emergent (e.g. Phragmites australis and Schoenoplectus validus)
and amphibious macrophytes (e.g. Ludwigia peploides) at creek control sites, and greater relative cover of
Salix babylonica at river control sites. This result is unsurprising given the differing morphologies of river
and creek sites, and the abundance of Salix babylonica in the littoral zone of the lower River Murray main
channel (Gehrig 2010). The high proportion of structural elements at impact sites is encouraging in light
of the prospective interventions; large-bodied native species, including golden perch and Murray cod,
have previously been shown to be positively associated with structural elements, particularly when
accompanied by flowing water in the case of Murray cod (Crook et al. 2001, Koehn 2009). As such, the

Bice, Gehrig and Zampatti (2013) Pike Fish Intervention Monitoring 2013
35
‘physical template’ of favourable habitat for large-bodied native species is present at impact sites within
the Pike Anabranch, and it is hypothesised that provision of increased flow and hydraulic complexity at
these sites will benefit these species.
Most species exhibited significant positive or negative associations with specific microhabitats in one or
more treatment. Several associations, particularly the positive association of small-bodied fish (e.g.
unspecked hardyhead and carp gudgeon) with submerged, emergent and amphibious macrophytes, were
consistent across treatments and with other investigations of fish-habitat associations in the region
(Zampatti et al. 2011, Bice et al. 2013a). Interestingly, golden perch was positively associated with
structural elements at both creek and river control sites, but not at impact sites. This does not infer that
golden perch did not inhabit structural microhabitats at impact sites; rather the greater relative proportion
of structural elements at impact sites may dictate that these microhabitat types are often present in
electrofishing shots from which golden perch are absent, thus influencing the results of ISA. Additionally,
the suitability of individual snags as golden perch habitat may be dictated by other factors, including
surrounding depth, which is not factored into analyses. Common carp also exhibited variable habitat
associations between control and impact sites. Nevertheless, common carp are highly mobile and may
utilise a variety of habitats.
4.3. Hydraulic habitat characterisation
Hydraulic conditions were highly variable between sites due to differences in morphology and proximity
to regulatory structures. The creek control site at the Pike-Mundic Cutting (site no. 8), exhibited the
greatest velocity range (-0.08–0.6 m.s-1
), mean velocity (0.19 m.s-1
) and circulation (M3 = 0.12). Impact
sites typically had lower (and narrower) velocity ranges, mean velocities and circulation. Nevertheless,
flow volumes and subsequently the hydraulic metrics measured, are likely to increase following the early
works and stage 1 intervention, and the velocity profiles measured in 2013 will provide the basis for
measuring this change.
4.4. Conclusion
This report described results from ‘before’ intervention monitoring in the Pike Anabranch in 2013. Whilst
not a focus of the current project, comparison of results from monitoring in 2013 with those from
previous monitoring in 2009, highlight changes in microhabitat cover and fish assemblages in the Pike
Anabranch following flooding and high flows from 2010 to 2012. Similar patterns in microhabitat and
fish assemblage dynamics have been documented in the Chowilla and Kataraptko Anabranches, and the

Bice, Gehrig and Zampatti (2013) Pike Fish Intervention Monitoring 2013
36
River Murray main channel (Leigh et al. 2012, Wilson et al. 2012, Bice et al. 2013a, Zampatti and Leigh
2013).
On-ground works as part of the interventions are planned to be undertaken in 2013/14, with subsequent
‘after-intervention’ monitoring to be undertaken in 2015 and 2016. The nature of fish habitat is
fundamentally a product of the interplay between physical habitat and hydrodynamics; encouragingly,
creeks in the Pike Anabranch system that will be subject to interventions, are characterised by high levels
of cover of complex physical habitat, which upon increases in hydrodynamic variability, may favour
native fish species.
Increased connectivity, following bank replacement and fishway construction, throughout the Pike
Anabranch and between the system, and the River Murray main channel, will potentially benefit native
fish populations by facilitating movement. Assessment of the effectiveness of new fishways on Deep
Creek and Bank D will be conducted in spring 2014. Should the fishways be fitted with PIT reader
infrastructure, the movement of large-bodied fish through these fishways may be further assessed. In
2013, a total of 369 individual fish were implanted with PIT tags under the current project and
movements of these individuals through fishways within the Pike Anabranch system and more broadly in
the lower River Murray may be monitored.

Bice, Gehrig and Zampatti (2013) Pike Fish Intervention Monitoring 2013
37
5. References
Anderson, M. J. (2001). A new method for non-parametric analysis of variance. Austral Ecology 26: 32-
46.
Anderson, M. J., R. N. Gorley and K. R. Clarke (2008). PERMANOVA+ for PRIMER: Guide to
Software and Statistical Methods, PRIMER-E: Plymouth, UK.
Anderson, M. J. and C. J. F. Ter Braak (2003). Permutation test for multi-factorial analysis of variance.
Journal of Statistical Computation and Simulation 73: 85-113.
Baumgartner, L. J., I. G. Stuart and B. P. Zampatti (2008a). Determining diel variation in fish
assemblages downstream of three weirs in a regulated lowland river. Journal of Fish Biology 72: 218-
232.
Baumgartner, L. J., I. G. Stuart and B. P. Zampatti (2008b). Synthesis: what have we learnt about fish
passage in the Murray-Darling Basin. The Sea to Hume Dam: Restoring Fish Passage in the Murray
River. J. Barrett, Murray-Darling Basin Commission, Canberra: 76-85.
Beyer, K., K. B. Marsland, C. Sharpe, T. Wallace, B. P. Zampatti and J. M. Nicol (2010). Fish and Fish
Habitats of the Pike River Anabranch and Floodplain Complex. South Australian Research and
Development Institute (Aquatic Sciences), Adelaide. SARDI Publication No. F2010/000090-1. SARDI
Research Report Series No. 429. .
Bice, C. M., S. L. Gehrig, B. P. Zampatti, J. M. Nicol, P. Wilson, S. L. Leigh and K. Marsland (2013a).
Flow induced alterations to fish assemblages, habitat and fish-habitat associations in a regulated lowland
river. Hydrobiologia In Review.
Bice, C. M., S. L. Leigh, J. M. Nicol and B. P. Zampatti (2013b). Changes in hydraulic complexity in the
lower River Murray main channel in relation to flow variability. South Australian Research and
Development Institute (Aquatic Sciences), Adelaide. SARDI Publication No. F2013/000214-1. SARDI
Research Report Series No. 709. 32 pp.
Bray, J. and J. Curtis (1957). An ordination of the upland forest communities of Southern Wisconsin.
Ecological Monographs 27: 325-349.
Brock, M. A. and M. T. Casanova (1997). Plant life at the edge of wetlands: ecological responses to
wetting and drying patterns. Frintiers in ecology: building the links. N. Klomp and I. Lunt, Elsevier,
Oxford: 181-192.

Bice, Gehrig and Zampatti (2013) Pike Fish Intervention Monitoring 2013
38
Clarke, K. R. and R. N. Gorley (2006). PRIMER v6: User manual/tutorial, PRIMER-E Ltd, Plymouth,
UK.
Crook, D. A., A. I. Robertson, A. J. King and P. Humphries (2001). The influence of spatial scale and
habitat arrangement on diel patterns of habitat use by two lowland river fishes. Oecologia 129: 525-533.
Crowder, D. W. and P. Diplas (2000). Evaluating spatially explicit metrics of stream energy gradients
using hydrodynamic model simulations. Canadian Journal of Fisheries and Aquatic Sciences 57: 1497-
1507.
Crowder, D. W. and P. Diplas (2002). Vorticity and circulation: spatial metrics for evaluating flow
complexity in stream habitats. Canadian Journal of Fisheries and Aquatic Sciences 59: 633-645.
DEWNR (2011). Riverine Recovery Project Implementation Plan - Pike Floodplain Project Element.
Version 1.a. Department of Environment Water and Natural Resources.
Dufrene, M. and P. Legendre (1997). Species assemblages and indicator species: the need for a flexible
asymmetrical approach. Ecological Monographs 67: 345-366.
Faragher, R. M. and M. Rodgers (1997). Performance of sampling gear types in the new South Wales
river surveys. Fish and rivers in stress: The NSW rivers survey. A. H. Harris and P. C. Gehrke, NSW
Fisheries Office of Conservation/CRC for Freshwater Ecology, Sydney/Canberra.
Gehrig, S. L. (2010). The role of hydrology in determining distribution paterns of invasive willows (Salix)
and dominant native trees in the lower River Murray (South Australia). Ph.D. Thesis, the University of
Adelaide, Australia.
Koehn, J. D. (2009). Multi-scale habitat selection by Murray cod Maccullochella peelii peelii in two
lowland rivers. Journal of Fish Biology 75: 113-129.
Leigh, S., S. Gehrig, P. Wilson, B. Zampatti and J. Nicol (2012). Intervention monitoring of fish and fish
habitats within the Kataraptko Anabranch system ('Katfish' Demonstration Reach): Before intervention
surveys 2010 and 2011. South Australian Research and Development Institute (Aquatic Sciences),
Adelaide. SARDI Publication No. F2010/000994-2. SARDI Research Report Series No. 634. 46pp.
Maheshwari, B. L., K. F. Walker and T. A. McMahon (1995). Effects of regulation on the flow regime of
the River Murray, Australia. Regulated Rivers: Research & Management 10: 15-38.
McCune, B., J. B. Grace and D. L. Urban (2002). Analysis of Ecological Communities. MjM Software
Design, Gleneden Beach, Oregon.

Bice, Gehrig and Zampatti (2013) Pike Fish Intervention Monitoring 2013
39
McCune, B. and M. Mefford (2006). PC-ORD. Multivariate Analysis of Ecological Data, Version 5.0.
MjM Software Design, Glendon Beach, Oregon.
Shields, F. D. and J. R. Rigby (2005). River habitat quality from river velocities measured using acoustic
doppler current profiler. Environmental Management 36: 565-575.
The Mathworks Inc. (2010). MATLAB version 7.10.0. Natick, Massachussets.
Walker, K. F. (1985). A review of the ecological effects of river regulation in Australia. Hydrobiologia
125: 111-129.
Walker, K. F. (2006). Serial weirs, cumulative effects: the Lower River Muray, Australia. Ecology of
Desert Rivers. R. T. Kingsford, Cambridge University Press: 248-279.
Walker, K. F. and M. C. Thoms (1993). Environmental effects of flow regulation on the lower River
Murray, Australia. Regulated Rivers: Research & Management 8: 103-119.
Wilson, P., S. Leigh, C. Bice and B. Zampatti (2012). Chowilla icon site fish assemblage monitoring
2012.
Zampatti, B. and S. Leigh (2013). Effects of flooding on recruitment and abundance of golden perch
(Macquaria ambigua ambigua) in the lower River Murray. Ecological Management and Restoration 14:
135-143.
Zampatti, B. P., S. J. Leigh and J. M. Nicol (2011). Fish and aquatic macrophyte communities in the
Chowilla Anabranch System, South Australia: A report on investigations from 2004 - 2007. South
Australia Research and Development Institute (Aquatic Sciences), Adelaide. SARDI Publication No.
F2010/000719-1. SARDI Research Report Series No. 525. 180 pp.