piles and wales provide the proper horizontal alignment
TRANSCRIPT

CHAPTER 6
CONSTRUCTION CONSIDERATIONS
The construction of bulkheads is less complicated than the design
proess. Figures 6-la through 6-lf are a pictorial sequence of a typical
navy bulkhead construction oper'ation. In spite-of the apparent sim-
plicity, there are factors which must be considered to comply with
design criteria and result in optimum performance. This section includes
a discussion of these factors.
6.1. General Construction Procedure
6.1.1. Pile Installation
Prior to installing the sheet piles, the bulkhead alignment is
determined and guides are placed, such as wales placed on temporary
stakes. This is not necessary for navy bulkheads because the fender
piles and wales provide the proper horizontal alignment. Vertical align-
ment may include a slight batter in the direction of the fill side of
wall-. This is standard practice in areas subject to freezing and tide
changes. The overall effect is to diminish pile uplift by ice on a
rising tide. A temporary wale may be placed below the upper wale to
facilitate construction. This lower wale is not necessary for the
permanent structure.
Sheet piles are generally installed by driving, jetting, or a
combination of both, Driving is more desirable from a soil mechanics
200

201
Typical construction sequence BBS Creosote Lumber Co.Inc., undated!
Figure 6-l.
SIIEATlllNts is lowsrssi htto enation vrith the akltS ~ water jet snn nsrtaa te the itrALEAS.
WALEPIS too erst hotttnnJ wo ~ to hohl tho~ Sea io hne.
OahrentsaE T1S ROOS are esnnaateo to oEAOhtEHPILES ~ tha nrttsrn hnnr met nta iaaf

202
grig PfLCSaa I~<~ .,t ee ~p~ eRSTuml ~ |he ~
<he ~
e
~~!~g h ~ ~ harh4 conceeh the
wce4m~4

203
standpoint as the downward force of the pile tip tends to locally com-
pact the soil, thus increasing its strength. Jetting is more commonly
practiced where timber sheet piling is installed. This procedure entails
pumping water through a pipe under approximately 100 psi �89 N/m ! pres-
sure and advancing the pipe into the subgrade closely followed by the
pile. Jetting is not effective in gravel, silt, or clay and tends to
loosen. the soil locally, thus decreasing the soil strength.
Because jetting facilitates installati.on and driving enhances soil
strength, a combination of these creates the optimum operation where the
pile is jetted to within a few feet of the required depth and the re-
mainder is driven.
As piles interlock using tongue-and-groove or ball-and-socket
fittings Figure 6-2!, it is recommended tha.t the direction of construc-
tion leads with the tongue, or ball. This will eliminate the danger of
soil clogging the groove, or socket, and subsequent improper interlock
and leaning.
Driving in pairs or in panels Figure 6-3! eliminates some of the
interlock friction occurring between piles. This also facilitates
driving as rigidity is increased and leaning is reduced.
Other causes of leaning may include defective guides, pile defor-
mation, improper driving and improper jetting. Remedies include pulling
the heads of piles during installation Figure 6-4a!, use of guide piles
in conjunction with driving in panels Figure 6-4b!, applying the
driving force at an angle Figure 6-4c!, use of piles with chamfers at
the foot Figure 6-4d!, and use of specialty fabricated wedge-shaped
piles Figure 6-4e! Teng, 1962!.

O
JSa4 e
0l
Hhl
eg09 a.IAIDO
gO
~ !Cz ys
v'
ta oele JR+
Z 0lA
QJ
6JJ

205
b, Typical ball and socket U.S. Steel, 1975, f p. 1!
Figure 6-2. Continued

206
P'igure 6-3. Driving sheet piles in panels Teng, 1962, p. 378!

207
' Gaedegl Iee
c!
Figure 6-4. Reme iial actions Teng, 1962, p. 379!
Wodqe enceedyN ar e ee formea yy 0%%fle .hO«ee ar 0y «e deej
e

208
6. I.. 2. Wales
6.1.3. ~Anchora e
The anchorage should be installed in parent material a safe dis-
tance from the wall Section 5.3.2.!. If the parent material is unde-
sirable, it should be removed and the backfill in front of the anchorage
should be compacted.
Alternative anchoring schemes are shown in Figure 6-6 and alterna-
tive anchorage schemes are shown in Figure 6-7.
6.l.4. Tie-Rods
Holes are drilled through fender piles if used!, wales, sheet
piles and anchorages. One tie-rod segment is passed through the wali,
another segment through the anchorage, and the two segments are joined
using a turnbuckle. If settlement of the tie-rods is considered a
problem, PVC pipe should surround the tie-rod Section 6.2.6.!.
If the tie-rod is not horizontal, the design load should be in-
creased by a load factor
LF1
cos 9�-1!
After the piles are installed, wales are connected by bolting
channels to each steel sheet pile section or by nailing timber wales
to timber sheet piles Section 5.4.3.!.
Splices are made in wales where required. Locating the splices of
wooden wales at. the tie-rod eliminates the need for splice plates and
reduces the potential for ponding, thereby accruing some economic
advantages.
Typical details of wales for steel walls are shown in Figure 6-5.

209
ooueaa ~n. ~ wALL
Figure 6-5. Standard wale details U.S. Steel, 1976, pp. 71-73!

210
OOVSLE IHEIOE CHAHNEL WALEE WELDED IHTERIAEOIATE EEAAI QE CHAHHEL MPAEATORE
DCWSLE INSOE CHAHHEL WAL~TEO CHAHHEL EEPAEATORE
Table 6-5. Continued

OQLSRLK IHROK CBAHHKL WALK~TED PIPK HPARATQRS
OQVRLK QUTKIOK CHAHHKL W*~LOKO IHTKRAIKOIATE RKAM QR CBAHHKL 5KPARATQRK
Figure 6-5. Caa.tinued

Z12
%Kg ANCHOR f0% FARTH AHCHORSI
Figure 6-6. Alternative anchoring schemes U.S. Steel, 1976, pp. 74-75!

213
Figure 6-7. Alternative anchorages U.S. Steel, 1976, p. 82!
SHEET PILE ANCHORWALL RRAT RE CONTTPRlODROR INTENALITTENT
VERTICAL ANO RATTER'TINRER PILE ANCHOR TLRMTINRER DRAG LOCR
VERTICAL ANO RATTERPILE ANCHOR VVIMREINFORCED CONCRETE CAP
RATTER PILE ANCHOR WITHREINRDRCEO CONCRETE CAP
VERTICAL AND RATTERH.BEAN PILI ANCHOR WITHRTINTDRCLD CONCRETE CA~

214
in which 9 ~ the angle between the tie-rod and the horizontal plane,
In corrosive environments the tie-rod should be protected by
using galvanized steel and employing protective wraps, bituminous treat-
ment or special painting.
Turnbuckles should be tightened until slack is removed from the
tie-rods. Overtightening causes anchor yield and excess stresses in
the tie-rod and sheet piling.
Tie-rods in wood bulkheads are frequently spaced at 7.5 ft �.27 m!
intervals. Construction details do not interfere with this spacing or
any variation thereof. Steel bulkheads, on the other hand, limit the
designer's flexibility in choosing the interval as pile sections differ
in driving width Table 5-2!. For example, the section shown in Figure
6-5a is a PDA 27 with a width of 16 in �.41 m! and tie-rods at every
seventh section for an interval of 8 ft �.44 m!; Figure 6-5c shows a
P238 pile with an 18 in �.46 m! width and tie-rods at every seventh
section for an interval of 9 ft �.74 m!.
The designer must be aware of these constraints because the tie-
rod tension is a function of the spacing, as well as the computed pull
per unit length of wall. An interval used for computations that is
different from the interval permitted by the pile section configuration
will result either in overdesigned, uneconomic tie-rods and wales, or a
design prone to failure from overstressing.

215
6. 1. 6. Backfill and Dred in
Free-draining backfill material should be used. Zf the expense
is too great to employ coarse material for the entire fill, a sand drain
or sand blanket should be employed Figure 5-4!. Zf either of these is
not feasible, then the additional load of saturated material must be
considered, as well as the reduction of the effective depth of penetr'a-
tion because of hydrostatic imbalance Section 5. 2. 3.! .
The fill should be placed in equal lifts across the entire length
of the bulkhead. Filing up the fill in one area results in local over-
stressing of pile members and tie-rods. The backfill should not be
compacted as chis increases the stresses beyond the designed values.
Dredging, if required, should be accomplished after backfilling
is completed. The net result of this sequence is to provide additional
reduction of the bending moment. because of arching of soil between the
tie-rod and dredge level.
6. l. 7. Ti htenin of Viuts
For timber structures, the proper tightening tension is reached
when washers begin to indent the adjacent timber. High strength bolts
used for steel sheet piling are tightened in accordance with the
Specification for Structural Joints using ASTM A325 or A490 bolts,
Manual of Steel Construction AZSC, 1976!
6.2. Other Considerations
6.2.1. Construction F, ui ment
Bulkheads are often the first structures completed in new de-
velopments. This implies that construction activity will take place

216
nearby. If this is anticipated, surcharges fzom heavy equipment must
be accounted for in the design procedure or restrictions must be made
as to the allowable proximity of the equipment. A horizontal di,stance
equal to the wall height is recommended as the closest a piece of equip-
ment may be allowed. Xf the tie-rod and anchorage are shallow, the
equipment should not be allowed to pass over these.
6.2.2. ualit Assurance of Materials
To insuze that materials are in compliance with design specifica-
tions, some measures need to be taken. The most fundamental step i,s
an inspection of the material for obvi.ous defects. If timber is the
basic structural material, grademarks Figure 5-13! should be found on
the members which indicate the grade marking service and stress grade.
A certificate is also available from the grading agency. Certificates
of compliance may be requested from suppliers for assurance that the
proper preservation process and amount was used. Certification may
also be requested to insure compliance with the proper ASTM designations
and any ordered special treatment such as bituminous coating.
6. 2.3. Cuttin and Notchin
Treated timber members should not be cut to size. This practice
subjects the cut. ends to attack from the elements from which protection
was desired. Preservation treatment should be specified as being
applied to all surface areas of timber members.
A similar argument applies for notching or countersinking recesses
.for tie-rods to provide a flush face. In addition to limiting the
effectiveness of preservatives, it reduces the net area of the section

217
in terms of its effectiveness to carry a load. An alternative to this
practice is to nail a coil of rope around the protruding tie-rod. This
will offer the desired protection to the moored vehicles.
If any cutting is done, preservative should be post-applied at
the site. This is not as effective as pressure treatment, but it is a
vast improvement ovex' leaving the cut unprotected.
6.2.4. Re ulations Pertainin to Coastal Use
The use of coastal zones implies that some change in the environ-
ment will occur stemming from such use. Permission may be required
prior to using coastal lands by the U.S. Army Coxps of Engineers.
Environmental Protective Agency, county or local governments. In New
York State a Coastal Zone Management Program exists under the auspices
of the Department of State, although regulatory functions are delegated
to localities. At any rate, the structux'e's impact. upon the environ-
ment must be assessed and the need to obtain permits must be ascerta.ined.
For details, see "Regulatory Processes in Coastal Structure Construc-
tion" Ronan, 1979! .
6.2.5. Construction Details
Typical construction details appear in Figures 6-8 through 6-12.
6.3.
Although the construction of bulkheads is relatively straightforward
some factoxs must be taken into account which may affect. the desired.
performance of the system. Certain problems inherent in the installation
of sheet piles can be overcome with some suggested techniques. Connec-
tion of wales and tie-rods and installation of the anchorage must be

Figure 6-8. Typical bulkhead, wale outside AWPI, p. 4!

219
paces parer!ei!e %rara
<an s 's isii sr soacinapere!!a«o Groin
Qirscvan af toad action
Figure 6-9. Typical bolting details, timber Timber Engineering Co.,1956, pp. 511-513!
soo I 'icr io ~rain
~ � o.- 'I
Laces perpaeeiav er te Ore e
a aEaas margin tonara anicrr balt is acting � '' � ~
7~ Can!sr io coins r
tpaipandicoiar ia Grain
~O~ 0

220
Seamtora rreythea oa
snaenl m wekjeg
Figure 6-10. Common arrangement oz wales and tie-rods Teng, 1962,p. 372!

221

222
Figure 6-12. Steel bulkhead with timber fender piles U.S. Steel,1976, p. 74!

223
accomplished with respect to conditions imposed by the design. Benefits
may accrue from the optimum sequencing of dredging and undesi,rable
consequences may result in the improper placement of backfill. Sur-
charges imposed by construction equipment must be accounted for or
damage to the system may occur. Measures should. be taken to assure that
the material purchased complies with the quality specified in the design.
Field alterations performed on treated timber reduce the effectiveness
of the preservative. Consideration of these factors during construction
will enhance the longevity and proper functioning of the bulkhead.

CHAPTER 7
RELIABILITY AND FACTOR OF SAFETY
The chance of a system performing successfully is termed its
reliability, R. The complement of reliability i.s the probability of
failure, Pf, whi,ch is defined as
�-1!P ~1-Rf
224
Every system has a finite probability of failure that depends upon:
the system's ability to sustain loads, i.e., the capacity; the loads
placed upon the system, i.e., the demand; and the variability of the
capacity and demand.
Capacity-demand models involving penetration depth, tie-rod pull
and bending moment for a particular hypothetical situation cannot be
used to determine the probability of failure of all bulkhead systems.
It can, however, suggest the order of magnitude of reliability to be
expected, if realistic values and assumptions are chosen. A portion of
this chapter is, therefore, dedicated to such a hypothetical situation
where the reliability and factors of safety are explored.
The situation presented here is a bulkhead designed in accordance
with Rowe's reduction method. Probabilistic methods are employed to
determine the probability of failure of the design and some qualitative
conclusions are drawn. Since the simplified design procedure suggested
in this work is based on the Rowe method and some variability exists

225
between the Rowe and simplified methods solutions, probabilistic methods
are again utilized to investigate reliability.
Certain assumptions are inherent in the simplified design procedure
and the argument presented in this chapter. A discussion of these
assumptions should help to establish the validity of this work.
A very basic, yet critical, assumption is that the soil strength
and unit weight are established by virtue of sufficient investigation.
Some variability in these parameters can be expected and some variability
will, consequently, occur in the loadings and the capacity to resist
failure.
Variability in loadings caused by faulty construction procedure
is not addressed.
As suggested in Chapters 2 and 3, the Free Earth Support and Rowe
methods have been established as accurate means of describing bulkhead
behavior. They have been corroborated by experiment and by comparison
to theoretical and sophisticated analytical techniques. It can then
be readily assumed that these methods can be modified to portray ade-
quate capacity-demand models.
Some variability exists in the ultimate strengths of construction
materials comprising bulkheads. It is suggested that the average factor
of safety of stress graded timber is 2.5 and that 99 percent of all
tests will demonstrate a minimum factor of safety of 1.25 Timber
Engineering Co., 1974!. If a. design value of 2,000 psi �3.8 ~/m2! is
assumed for the flexural strength of timber sheet piles composed of

226
FSC
D�-2!
then a factor of safety of unity or less signifies imminent failure,
i.e., when the capacity is equal to the demand. The margin of safety,
SM, is the difference of capacity and demand, or
SM=C-D �-3a!
Failuxe will occur when SM 6 0.
southern pine, the average ultimate strength can be assumed as 5,000
psi �4.4. MN/m ! and 99 percent of the same material can be assumed to2
possess an ultimate strength of 2,500 psi �7.2 MN/m !. Tie-rods made2
from grade A36 steel must possess a minimum yield strength of 36,000
psi �48 MN/m !. The average yield strength of all A36 steel members2
is not known, but a conservative value may be assumed to be 40,000 psi
�75 MN/m !. It may also be assumed, conservatively speaking, that 992
percent of all A36 steel possesses at least the minimum required yield
strength, 36,000 psi �48 MN/m !.2
Conservative assumptions are also made for selecting the appxo-
priate mean value of soil parameters. The variabilities of these
parameters reflect data taken from the technical literature. The random
values chosen for soil and. material parameters are assumed to be nor-
mally distributed and to repx'esent infinite populations.
A hypothetical situation may be used to illustrate the factors of
safety against penetration failure, tie-rod failure, and bending moment
failure, and the associated probabilities of failure. With the factor
of safety defined as the ratio of demand, D, to capacity, C, or

227
SM ~ C - D, and �-3b!
the standard deviation of the safety margin may be defined as
/ 2 2SM j C+'D �-3c!
A standardized. value, z, is determined by
SM �-4!
From this value can be determined the probability that SM S 0, or the
probability of failure. Such a determination is made from probability
density functions which may be found in statistical tables.
Capacity and demand for the three modes of failure previously
mentioned will be analyzed statistically to find the mean and standard
deviation of the safety margin. The standard score will then be deter-
mined and converted to the probability of failure.
The capacity and demand will vary depending upon many factors,
such as material flaws, heterogeneity, etc., and are, therefore, termed
variates. The value that occurs most frequently is termed the expected
value, or mean, and a measure of the amount that values differ from the
mean is termed the standard deviation.
If C and D are normal variates, then C and D are the means and
S and S are the standard deviations. The mean safety margin may be
defined as

228
7.2. Anchored. Wa3.ls in Sand
7. 2.1. H othetical Si,tuation
A. design will be illustrated for a bulkhead whose geometry is
given in Figure 4-1, with the dimensions
H 10' �.05 m!
H ~ 6' � 83 m!
2' �.61 m!
4' �.22 m!, and
6' �.83 m!
HA
tl
as:
yl ~ 100 pcf �5.8 kN/m !3
~ 30 degrees1
y2 120 � 62. 4
57.6 pcf 9.09 kN/m !, and3
30 degrees2
The design proceeded by calculating the depth of penetration by
the Free Earth Support method and the tie-rod pull and bending moments
by the Rowe reduction method. A factored angle of in. ternal friction
was used for computing the required depth of penetration, such tha».
-1 1tan � > tan g! �-1!
in which SZ = an. appropriate safety factor, taken as 1.5, $ = angle of
The material comprising the fill and subgrade is loose sand. The mean
values of the design parameters assigned to layer t and t2 are assumed

229
1 2 2
2 alyl 1 3 1 A
1 2 2
2 a2y2 2 3 2 l A
+ � K y D -D+H-H!1 2 2
2112 2 2 1 A
yZ'2 2l
For the geometry of this situation and for y2 y3, and K 1 K 2 =al a2
K = Ka3 a
2 = K I. �1S! yl + �l7! yZ �-6b !
The capacity to resist this demand is provided by the moment about the
tie-rod produced by the application of passive stress such that
internal friction, unfactored, and Pf ~ angle of internal friction,
factored. The tie-rod diameter is then calculated based on an allowable
tensile strength, f ~ 22,000 psi �51 MN/m !. Finally, the sheet pile2
member thickness is selected based upon an allowable flexural stress
of f ~ 2,000 psi �3.8 N/m2! . The resulting minimum parameters required
are a penetration depth, D 4.S ft �.46 m!, tie-rod diameter, d
0. 68 in �7. 2 mm!, and sheet pile thickness, t ~ 1. 81 in �6.0 mm! .
Penetration depth stems from the demand found by summing moments
about the tie-rod. The demand moment is from active stress applied
against the wall. This motivating phenomena is computed as

230
R~ � K yD � D+H-H!, or1 2 2
2 p 3 3 A�-7a!
�-7b!R ~ K y �21!.p 3
The variability of a parameter, x, can be demonstrated in terms
of its coefficient of variation
V - � . 100XX
S�-8!
in which x ~ the mean value of the parameter, and S ~ the standardx
deviation.
A correlation was found between variance of horizontal stress
coefficients and the angle of internal friction Singh, 1972!, such
that
�-9a!V 1.15 VP, and
�-9b!V - 1.10 Vy.
For example, for an angle of internal friction, > ~ 30 degrees, V
16.1 percent and V~ ~ 15.4 percent.
The standard deviations associated with stress coefficients K
0.279 and K ~ 5.74 are S 0.0449 and S 0.884 respectively.P
Other pertinent parameters with variability are void ratio, e
Schultze, 1972!, and specific gravity of the soil solids, G Schultze,
1972; Padilla and Vanmarcke, 1974!. Appropriate values assigned to
these parameters are a mean void ratio of 0,663 with a standard devia-
tion 0.088, and a mean specific gravity of 2.65 with a standard devia-
tion of 0.01.

231
The relationship existing between the unit weight, void ratio,
and specific gravity for saturated soil is
G + e!
� + e! w�-10!
in which Y = unit weight of water.W
A mechanism relating the variability of n independent parameters
x to the dependent parameter y is Hahn and Shapiro, 1967!n
�-11!
Therefore, for the relationship between unit ~eight, void ratio and
specif ic gravity
a�-G!
s-37. 2,
� + e!
3Y Yw� ~ 37.5,
aG 1+es
s
S = 3.30 lb/ft �.521 kN/m ! .Y
are shown in Table 7-1.
Using Equations 7-7 through 7-11 and the selected values, the ~cans
and standard deviations can be computed for the motivating moments,
the resisting moments, R, and the probability of failure. The results

232
Table 7-1. Probability of failure and factor of safety
Tie-Rod PullPenetration
Parameter
40,000 7,100 14,500 1,900 5,00017, 200Naan
9703115606, 600 1, 1622, 830
3. 045. 743.17
1.20 x 105.108.00 x 10
2.042.33 2. 63
Nota: 1 ft-1b ~ 1.356 N-n1 1b ~ 0.00444 kN1 psi = 0.00689 NH/~
StandardDeviation
StandardScore
Probabilityof Failure
Factor of
Safety
Df t-1b
Cft-1b
D
lb
C
lb
D Csi! si!

233
Similar approaches can be taken with the tie-rod and bending
stress demands. Tie-rod load is given by
�-12!T ~ K [�00! y + 9417! y ].
Hence
S ! S ! + ~T ! S !T 3yl y aY2 Y
1 2
+ K ! SK!, andaT 2 23K K
S ~ 1162 lb �.16 kN! ~
The maximum bending moment for this situation is given by
5.8S P - K [�1 ~ 8! y + �2.6! y !]
K [�1.S! yl + 9 74! YZ �-13b!
�-13c!K [ �7. 2! yl + �0.8! y2! ~
�. 304! �2! ~/ �. 55! �-14a!
= K [ �7. 5! yl + �5. 9! y 2] �-14b!
The standard deviation for bending stress is given by
S = ~ ! S ! + ~ ! S, !1
+ � ! S ! , and3K Ka K,
For a reduction factor in bending of 0.30 and section modulus of 6.55
in /ft in this case, the maximum bending stress is3

234
S 311 psi �.14 MN/m !.
As previously established, the mean flexural strength of wood
sheet piles can be taken as 5,000 psi �4.4 MN/m ! and mean yield2
strength of A36 steel can be taken as 40,000 psi �75 MN/m ! so that2
.m 2ULT 4
�-15!
�. 68! �0, 000!
~ 14,500 lb �4.4 kN! .
T~T, and 970 psi �.68 MN/m ! for o.2
The probability of failure in penetration depth, tie-rod pull and
bending stress may now be computed using Equations 7-2 through 7-5.
The results are given in Table 7-1.
7.2.2. Reliabilit of the Desi Curves
The preceding hypothetical situation clearly demonstrates high
reliability and comfortable factors of safety against failure for a 10
foot �.05 m! wall in loose sand. One is able to surmise that similar
results would occur in analyses of various geometries and soil condi-
tions.
The standard deviations of the capacities can be found by back-
calculation. Assumed cumulative probabilities of 99 percent associated
with a minimum yield strength of 36,000 psi �48 MN/m ! for A36 steel2
and a minimum flexural strength of 2,000 psi �3.8 MN/m ! for timber2
sheet piles result in standard deviations of 560 lb �.49 kN!, for

235
The same reliability might be expected from the design curves
which comprise the basis for the simplified method as they were derived
from the Rowe procedure. The design curves, however, do not coincide
exactly with design solutions provided by the Rowe method, since the
curves represent mean values of the solutions. The variabilities of
the differe~ces between the Rowe solutions and mean values of the
design curves are demonstrated in Figures 3-4 through 3-15 and Table 3-5.
The variation of the design curves is expressed in terms of
percent difference. This can be converted to the same units that ex-
press the variation fn the hypothetical situation. Since the design
curves are the result of a least squares method of best fit, the mean
percent difference between the curve and the data points is very close
to zero. The means of the design curves can thus be assumed to be
equal to the means of the demand of the hypothetical situation, i.e.,
the mean percent difference between the curve and the demand of all
hypothetical situations is zero. The standard deviations can be dimen-
sionalized by multiplying the standard deviation, expressed as a
percent, by the associated mean of the hypothetical situation. For ex-
ample, a 10 percent standard deviation for tie-rod loads would convert
to
ST = �. 10! �100!
710 lb �. 16 kN! .
The reliability of the design curves, expressed in terms of the orob-
ability of failure, is shown in Table 7-2.

236
Table 7-2. Reliability of the design curves anchored walls in sand!
Parameter
Mean
5604,750 511 210530 970
3.024.534.77
1.30 x 10
Vote: 1 f t-1b 1.356 N-m1 lb ~ 0.00444 kN1 psi 0.00689 MN/~
StandardDeviation
StandardScore
Probabilityof Failure
PenetrationD C D C D C
ft lb ft lb 1b lb si si
17,200 40,000 7, 270 14,500 2,000 5.000

237
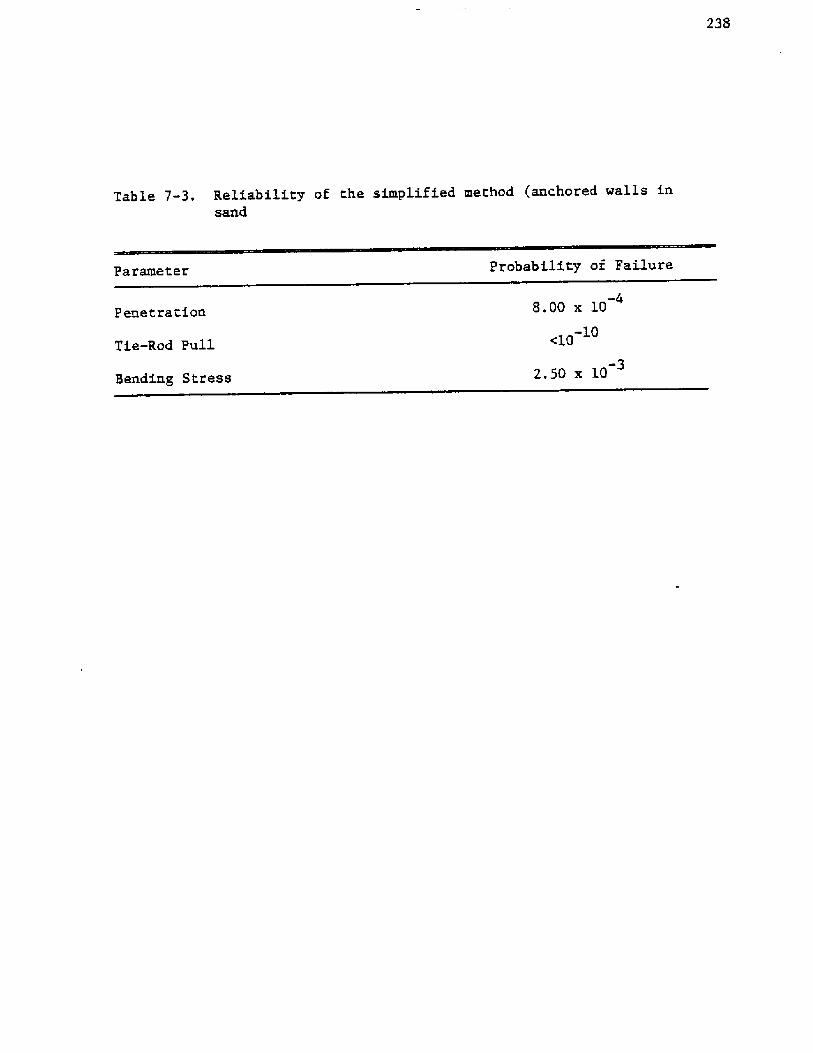
7. 2.3. Reliabilit of the Sim lified Method
R ~ II R.
i 1
�-16!
in which R ~ the reliability of the i component and n ~ the numberth
of components in the system. In terms of probability of failure, the
relationship is
nP II 1- �-P !
f ii
�-17!
in which Pi the probability of failure of the i component Harr,,t,h
1977!. The reliability of the simplified method may thus be assessed
from the combinatorial probability of failure of its components as
shown in Table 7-3.
7.3. Anchored Walls in Cla
7. 3. 1. H othetical Situation Undrained!
The conditions assumed for anchored walls in sand remains the
same with the exception of a cohesive subgrade where c = 250 psi �.72
/m-!, an. anchored wall in clay may be designed in accordance with'7
the Rowe reduction method. The design depth of penetration, tie-rod
pull, tie-rod diameter, bending stress and pile thickness are
The- simplified method may be considered as a system consisting
of 2 components: the Rowe reduction method and the design curves. The
reliability of a system whose components operate in series may be ex-
pressed as
238
Table 7-3. Reliability of the simplified method anchored walls insand
Probability of FailureParameter
P enet rat ion
Tie-Rod Pull
Bending Stress
8.00 x 10
10-10
2.50 K 10

239
D ~ 5.54 feet �.69 m!
P 6,530 pounds �8.2 kN!
d 0.615 inches �5.6 mm!
o = 1,990 psi �3.7 Pa! and
t 1.92 inches �8.8 mm!
The analysis proceeds as before with additions of another variant,
the cohesion parameter, whose coefficient of variation may be taken as
V 18.6 percent Lumb, 1972!', which gives a standard distribution of
S ~ 46.5. The resulting capacities, demands, standard scores andc
probabilities of failure are shown in Table 7-4.
The most striking aspect of the results is the relatively large
probability of failure in penetration as compared to what is virtually
a very substantial factor of safety. This disparity stems from the
large variance of the cohesion parameter.
Coefficients of variation for the cohesion range as high as 50
percent Harr, 1977!. Incorporating this value into the foregoing
analysis results in a probability of failure in penetration of Pf
0.25.
7.3.2. H othetical Situation: Penetration Cora utedfor Drained Condition
If the long-term case drained condition! is considered, the
design results in a depth of penetratio~ D = 9.2 ft �.8 m!, factor of
safety FS ~ 2.2 and probability of failure P = 0.003. This is basedf
on the assumption that the variance of the parameters is the same as
the variance for cohesionless soils. If this depth of penetration is

240
Table 7-4. Probability of failure, anchored walls in clay undrained!
Penetration
Parmneter
5,230 30,500 6.530 11.500 1,990 5,000Mean
450920 13,800 1,070 970320
2. 95l. 83
10 1.60 x 103.40 x 10
5.83 1. 76 2. 51
Note: 1 ft-lb ~ 1.356 N-m1 lb ~ 0.00444 kN1 psi ~ 0.00689 HN/at2
Standard
Deviation
StandardScore
P robabil ityof Failure
Factor of
Saf ety
D
f t-lb
D C D C1b lb si si

241
used to compute the probability of failure for the short term case, the
probabili.ty of failure would be almost zero for a coefficient of varia--6
tion of 1S.6 percent on cohesion, and approximately 10 for a coeffi-
cient. of variation of 50 percent.
SH=C-D �-3a!
SS< S � S, and2 2
SN c�-3b!
SN
7.4. Summa and Conclusions
The investigation of a hypothetical situation provided a concep-
tualization of the reliability of anchored bulkheads. Sy incorporating
variations in the pertinent soil and material parameters found in the
technical literature, a means was established whereby the probability
of failure in penetration, tie-rod pull, and bending stress could be
estimated.
A capacity-demand model was formulated for each of t' he three
potential modes of failure for walls in a sand subgrade, in a clay sub-
grade under undrained conditions, and in a clay subgrade under drained
conditions. Penetration failure was seen to be the most probable mode
of failure while tie-rod failure was virtually improbable under the
assumptions declared. The probability of flexural failure of timber
members was less than penetration failure, but not nearly as low as
tie-rod failure.
Recalling that the safety margin, variance in capacity and demand,
and the probability of failure are related by

242
the reasons for the general trend appear clear: a high safety margin
results in a low probability of failure, while a high variance in either
capacity or demand has the opposite effect.
Since the specified engineering properties of steel can be rela-
tively easy to attain with low variance, steel products will show a
rather high capacity. Added reliance stems from the fact that, to
achieve the minimum yield fox' each lot manufactured, the metallurgical
design process is conservative and an average yield results which is
substantially higher than the required minimum. Rigid quality control
insures that a very low percentage of the final px'oduct has a yield less
than the specified minimum.
Since timber cannot be processed and refined to the extent that
iron ore can, the final pxoduct exhibits more variability in its en-
' gineering properties. Designs using timber show high reliability which
is derived from the quality assurance provided by stxess grading.
Both demand and capacity of the penetration model are functions of
the soi.l parameters and penetration depth. Since high variance in soil
parameters pertains to both capacity and demand, a high safety margin
is required to achieve an acceptable reliability. Obviously, increasing
the safety margin may be accomplished by decreasing the demand or in-
creasing the capacity. The only choices available to obtain either end
are to replace the in-situ material with a more suitable one, or to
increase the depth of penetration. Additional excavation and backfilling
is costly, thus increasing the penetration depth is more attractive.
Unfortunately, large increases in depth are necessary to offset high
variability, low soil strength, or both.

243
Harr states that, "For most problems in geocechnical engineering,
Pf 5 10 " Harr, 1977!- Zt is not, unreasonable therefore, to considerthis order of magnitude as a desired standard and to declare as accept-
able any probability of failure that is less than 0.01.
The numerical results of the analysis of the hypothetical situation
demonstrate the acceptable reliability except for one case. The reli-
ability of tie-rods and flexural member sheet piles! are acceptable in
all cases. Penetration depth, however, is unreliable for clays in the
undrained condition, even for the moderate coefficient of variation of
18.6 percent. This realization is important as the apparent factor of
safety against failure of S.83 is very substantial and falsely suggests
an adequate design. However, when. the wall is redesigned for the
drained condition, an acceptable reliability results for both long and
short term.
The design curves possess small variability and show high reli-
ability as a result. When considered as a component of a design system
which incorporates the Free Earth Support method with Rowe reduction,
the design curves lead to reliable designs providing, of course, that
there is not excessive variability exhibited by the soil parameters.
The technical literature suggests that the undrained strength of
cohesive soils demonstrates high variability. Deterministic designs
based upon undrained strength produce an inherent risk of failure.
Designs based upon drained strength, however, show good reliability;
hence the drained condition can be considered to control the design
process.

244
SM
SM
�-18!
A. table is consulted to 'ascertain the probability of failure for a
particular number of data points.
The t scores for a desired probability of failure less than 0.01
are shown in Table 7-5. It is readily observed that as the number of
data points decreases, the t score increases. This indicates that for
the desired reliability a greater safety margin, lower variance in soil
parameters, or both, is required for fewer data points. The only
option left to the designer confronted with scant data is to increase
the safety margin. This is very likely to be less cost-effective than
an increased scope in site investigation.
It may be concluded that the Free Earth Support, Rowe, and simpli-
fied methods are inherently reliable for walls in sand subgrades. To
extend this high reliability to walls in cohesive subgrades, an adequate
site investigation is required whose scope will be determined by the
variability of the data.
The reliability of a particular design can be estimated provided
that the site was adequately investigated. One important aspect regard-
ing the adequacy of the investigation is the number of data points used
to determine the mean soil parameters. Since the investigation entails
sampling from a population ~hose standard distribution is unknown, the
desired probability of failure confidence interval! may be investi-
gated by utilizing a cumulative probability function described by a
student distribution Harr, 1977!, where the standard score is given by

245
less than 0.01
Ho. Data Points Score
31. 821
6. 965
4. 451
3. 747
3.365
3.143
2. 998
2.896
2. 821
2. 764
2. 718
2. 681
12
13
2. 650
Z. 624
2. 60217
18 Z. 583
2. 567
2. 552
2. 539
Z. 528
2. 518
2. 508
19
20
21
22
23
24
Z. 500
2. 49226
2. 48527
Z.479
Z. 47329
Table 7-5. t Score required for a probability of failure

CHAPTER S
SUM%9!Y AND CONCLUSIONS
Bulkheads must be designed to resist failure fram bending and
fram lack of sufficient penetration belaw the dredge level. The forces
causing failure stem fram horizontal stresses exerted upon the wall
from the soil on the backfill side. Resistance to bending failure is
derived from the properties of the wall, and outward movement of the
toe of the wall is resisted by the soil on the dredge side. Required
penetration depth may be reduced by employing a tie-rad and anchorage
an the fill side, adequately dimensioned and located.
Bulkhead behavior is governed by the complicated interaction of
many variables, requiring equally complex procedures to determine the
design loads. Overly simplified methods tend to over- or under-design
the system. A simpli.fied procedure is needed which addresses the
pertinent variables, and this is described herein.
Various approaches have been used to determine the horizontal
stress distribution and the resultant forces and moments. Of the seven
approaches reviewed in Chapter 2, the Free Earth Support method with
Rowe reductions was found to be the most extensively examined and
covered the widest range af conditions. In spite of its technical merit,
the FES/Rowe procedure is complex. A simplified method was therefore
derived from the more complicated one.
246

247
A computer program vas devised which calculated penetration depth,
moment and tie-rod load in accordance with the FES/Rove method for a
wide variety of soil conditions and site geometries. Chapter 3 explains
the methodology by which the pertinent parameters were combined and
correlated to generate simplified design curves.
A detailed explanation of the FES/Rove and simplifi.ed methods
is given in Chapter 4. The expediency of the simplified method is made
apparent in that explanation and is substantiated by the procedural flow
tables and design examples that appear in the Appendices.
Although the determination of penetration depth and loadings is
of prime importance in bulkhead design, there are other items that re-
quire careful consideration to complete the design. Chapter 5 provides
a discussion of other pertinent factors, i.e., overall system cost-
effectiveness, external loads, component dimensioning and detailing.
Procedural flow tables and examples are provided in the Appendices for
the design of components.
Proper construction practices are also required for a properly
functioning system. A general construction procedure is discussed in
Chapter 6, as well as some other practical considerations concerning
construction methods.
A qualitative description of bulkhead reliability was developed
by inference in Chapter 7. A capacity-demand model of a typical bulk-
head was examined with respect to penetration depth, moment, and tie-
rod load. Both sand and clay subgrades were considered. Soil and
material strength parameters and variability were selected from the
technical literature and incorporated into the model. The models

248
showed that, because of the high variability of clay strength parameters,
walls in clay were less reliable than walls in sand. However, a design
based upon the long-term strength of clay results in a reliable design,
even when the short-term parameters are considered.
By examining the capacity-demand model using probabilistic methods,
several concepts were reinforced, i.e., once an adequate penetration
depth is found, the probability of system failure is low; the risk of
penetration fail~re in a clay subgrade is high when considering short-
term strength, but is reduced when the long-term strength is used for
design; and as the number of data points used to determine the strength
parameters of the soil increases, the probability of system failure
decreases.