pilot scale geothermal silica recovery at mammoth lakes€¦ · we also benefited greatly from the...
TRANSCRIPT
Publ ic Interest Energy Research (P IER) Program FINAL PROJECT REPORT
PILOT‐SCALE GEOTHERMAL SILICA RECOVERY AT MAMMOTH LAKES
MAY 2009CEC ‐500 ‐2009 ‐077
Prepared for: California Energy Commission Prepared by: Lawrence Livermore National Laboratory
Prepared by: Primary Author(s): William Bourcier Carol Bruton Sarah Roberts Brian Viani Scott Conley Sue Martin Lawrence Livermore National Laboratory 7000 East Avenue Livermore, CA 94550-9234 Contract Number: PIR-04-003 Prepared for: California Energy Commission Pablo Gutiérrez Project Manager Linda Spiegel Office Manager Energy Generation Research Office Laurie ten Hope Deputy Director RESEARCH AND DEVELOPMENT DIVISION Robert P. Oglesby Executive Director
DISCLAIMER This report was prepared as the result of work sponsored by the California Energy Commission. It does not necessarily represent the views of the Energy Commission, its employees or the State of California. The Energy Commission, the State of California, its employees, contractors and subcontractors make no warrant, express or implied, and assume no legal liability for the information in this report; nor does any party represent that the uses of this information will not infringe upon privately owned rights. This report has not been approved or disapproved by the California Energy Commission nor has the California Energy Commission passed upon the accuracy or adequacy of the information in this report.
i
Acknowledgements
The success of this project benefited from the help of numerous individuals. In particular, Richard Simons of Rocky Point Environmental Services LLC who designed and built a first‐rate pilot plant and was key to the success of the project; Larry Lien fo Membrane Development Specialists who provided insightful advice on running membrane systems on this new application; Tom Wolfe of Perlorica who provided all sorts of useful advice on working with membranes at high altitudes; Andy Pasczowki of Precision colloids who pointed us in the right direction for extracting colloids and identifying a market for what we produced; and Peter Allen of PCI for help on running efficient UF systems.
We also benefited greatly from the staff at Mammoth Pacific LP for providing help ranging from plenty of hot water to replacement screws. Thanks also to Larry Nickerson for interfacing with the plant owners, Ormat and Constellation Energy, and his technical support during both phases of the project. And Special thanks to Elizabeth Wilbrecht for her help and encouragement throughout the project.
Please cite this report as follows:
Roberts, Sarah, Brian Viani, Scott Conley, and Sue Martin. 2009. Co‐Production of Silica from Geothermal Fluids. California Energy Commission, PIER Renewables Research Technologies Program. CEC‐500‐2009‐077.
ii
Preface
The California Energy Commission’s Public Interest Energy Research (PIER) Program supports public interest energy research and development that will help improve the quality of life in California by bringing environmentally safe, affordable, and reliable energy services and products to the marketplace.
The PIER Program conducts public interest research, development, and demonstration (RD&D) projects to benefit California.
The PIER Program strives to conduct the most promising public interest energy research by partnering with RD&D entities, including individuals, businesses, utilities, and public or private research institutions.
PIER funding efforts are focused on the following RD&D program areas:
• Buildings End‐Use Energy Efficiency
• Energy Innovations Small Grants
• Energy‐Related Environmental Research
• Energy Systems Integration
• Environmentally Preferred Advanced Generation
• Industrial/Agricultural/Water End‐Use Energy Efficiency
• Renewable Energy Technologies
• Transportation
“Pilot-Scale Geothermal Silica Recovery at Mammoth Lakes” is the final report for project PIR‐04‐003 conducted by Lawrence Livermore National Laboratory. The information from this project contributes to PIER’s Renewable Energy Technologies Program.
For more information about the PIER Program, please visit the Energy Commission’s website at www.energy.ca.gov/research/ or contact the Energy Commission at 916‐654‐4878.
iii
Table of Contents
Contents Preface .......................................................................................................................................................... ii
Abstract .................................................................................................................................................... vii
Executive Summary ................................................................................................................................... 1
Introduction ................................................................................................................................................ 3
Background and Overview ................................................................................................................... 3
Project Objectives ................................................................................................................................... 5
Project Approach and Methods ........................................................................................................... 6
Computer Simulations of the Silica Recovery Process ................................................................. 9
Project Outcomes and Results ................................................................................................................ 14
Design and Construction of Pilot unit .............................................................................................. 14
Colloidal silica separation using ultrafiltration ............................................................................... 18
Operation of Pilot Unit and Test Results .............................................................................................. 24
Silica Polymerization Rates................................................................................................................. 25
Transmission Electron microscopy (TEM) imaging of silica colloids ........................................... 27
Chemical analysis of silica colloids ............................................................................................... 30
Operational issues ................................................................................................................................ 30
Economic Analysis ................................................................................................................................... 33
Cost Estimates ...................................................................................................................................... 33
Economics of silica production .......................................................................................................... 51
Marketing Analysis .............................................................................................................................. 57
Conclusions and Recommendations ..................................................................................................... 62
Acknowledgements ................................................................................................................................. 62
References ................................................................................................................................................. 63
Appendix 1 Operating procedures for pilot plant………………………………………………….68
Appendix 2. Pilot plant operating data ................................................................................................ 75
iv
List of Figures Figure 1‐‐Simple schematic of pilot plant unit operations ................................................................... 7 Figure 2‐ Calculated saturation indices for selected minerals in the Mammoth feed water at 50⁰C during reverse osmosis water recovery. (LLNL) ........................................................................ 13 Figure 3‐ Predicted masses of minerals precipitating from the Mammoth feed water at 50⁰C during reverse osmosis water recovery. (LLNL) ................................................................................. 13 Figure 4‐ Silica recovery pilot showing RO pressure vessels (2 white tubes and grey tube below) and UF vessels (silver) above. Control panels and sampling ports to the left. .................. 14 Figure 5‐ Detailed schematic of pilot plant showing locations of valves, flowmeters, and pressure gauges. (LLNL) ......................................................................................................................... 15 Figure 6‐ Fluid mixing tank (on left) where RO concentrate, RO permeate, and UF permeate mix prior to being fed into plant reinjection system. Green box on right is 460V 3‐phase transformer that feeds power into pilot system. (LLNL) ................................................................. 15 Figure 7‐ Air‐cooled chiller used to cool plant fluid to below 60oC (140oF) prior to entering pilot system. Fire hose on right connects to downstream‐side of heat exchanger on power plant. Hose on left feeds to RO supply of pilot unit in transportainer. (LLNL) ........................................ 16 Figure 8‐300 gallon tank used to hold RO concentrate prior to colloid separation by UF. ........... 18 Figure 9‐‐ 5‐HP UF pump (background) and 2‐HP CIP pump (foreground) used for silica processing. (LLNL) .................................................................................................................................. 19 Figure 10‐ Filtration unit used for second stage of silica colloid concentration. Fluid from larger colloid tank was pumped directly into top reservoir. Membrane housing contained a spiral‐wound UF membrane (Osmonics MW series) (LLNL) ........................................................... 20 Figure 11‐ Close‐up of pressure vessel that houses ʺ1812ʺ RO‐NF‐UF elements (1.8ʺ diameter by 12ʺ length). (LLNL) ............................................................................................................................. 21 Figure 12‐ Densities of colloidal silica solutions vs. silica content. This relationship is weakly dependant on colloid size. (LLNL) ....................................................................................................... 22 Figure 13‐ Stability of colloidal silica solutions (“sol stability”) as a function of pH and salinity. At pH 8, the pH of colloidal silica solutions produced in the pilot plant, necessitated reducing the salt content through diafiltration gel formation (from Iler, 1979). (LLNL) ............. 23 Figure 14‐ Measured “reactive” (unpolymerized) silica vs. time from five tests at reverse osmosis recoveries indicated. The higher the recovery, the higher the starting silica concentration. (LLNL) ............................................................................................................................. 26 Figure 15‐ Transmission electron microscope (TEM) photographs of silica colloids (continued on next page) (LLNL) .............................................................................................................................. 29 Figure 16‐ Deposits of oil and minerals on the oil coagulating pre‐filters. (LLNL) ....................... 32 Continued on next page
v
Figure 17‐ Details for cost estimates for an 18 MGD silica extraction plant reproduced from WTCOST output. (LLNL) ....................................................................................................................... 36 Figure 18‐Detailed cost estimates for an 18 MGD silica extraction plant based on the spreadsheet tool of Membrane Development Specialists (MDS) provided by Larry Lien, October 2008; revised by WLB November 2008. (LLNL) ................................................................... 46 Figure 18‐Detailed cost estimates for an 18 MGD silica extraction plant based on the spreadsheet tool of Membrane Development Specialists (MDS) provided by Larry Lien, October 2008; revised by WLB November 2008. (LLNL) ................................................................... 46 Figure 19‐ Details of economic analysis for silica production at the Mammoth Lakes power plant t for 18 MGD facility operating at 80% water recovery and a royalty stream of 6%. (LLNL) ....................................................................................................................................................... 52 Figure 20‐ Sensitivity analysis for estimated internal rate of return (IRR) as functions of (a) silica price and construction cost; and (b) silica recovery and construction cost. Calculations using conservative values of $24,843 CAPEX and $16,034 OPEX in thousands. The CAPEX value corresponds to a “$/daily gallon” value of 1.38 (see Figure 8). (LLNL) .......... 53 Figure 21‐ Pro forma and NPV cost analysis assuming a 6% royalty stream. (LLNL) ................. 55 Figure 22‐ Alternate cost scenarios. For (a) a reverse osmosis membrane lifetime of 12 months instead of 6 months. For (b) the staff is reduced from 20 FTE to 10 FTE. All other parameters remain the same as in Figure 25 above. ........................................................................... 56 Figure 23‐ General method used for commercial production of specialty silicas. (LLNL) ........... 57 Figure 24‐ Distribution of the 845 million pounds of specialty silicas produced annually (reproduced by permission from Freedonia Group, Report “Industry Study 1783”). (LLNL) .... 58 Figure 25‐ Types of specialty silicas. Geothermal silica feed could be used to directly generate any of the “wet process” silicas as well as indirectly provide feed for fused and fumed silica (reproduced by permission from Freedonia Group, Report “Industry Study 1783”). (LLNL) ... 59
vi
List of Tables
Table 1‐Composition of Mammoth Lakes, California geothermal water piped into pilot plant. Courtesy of (LLNL) .................................................................................................................................................. 10 Table 2‐ Mineral names and formulas ................................................................................................................... 11 Table 3‐. Measured pH, silica, and conductivity values* of the geothermal fluid. (LLNL) .......................... 17 Table 4‐ Compositions of geothermal fluid and reverse osmosis concentrate and permeate for reverse osmosis water recovery of 73%. LLNL ................................................................................................................ 25 Table 5‐ Particle size of silica colloids determined from TEM analysis (standard deviations based on analysis of 100 particles) LLNL ............................................................................................................................... 27 Table 6 Compositions of colloidal silica by‐products (in ppm) LLNL ............................................................. 30 Table 7‐ Cost indices LLNL .................................................................................................................................... 34 Table 8‐ shows a summary of the results of the cost analysis in U.S. dollars. LLNL .................................... 35 Table 9‐ Input parameters used for economic analysis of silica recovery at Mammoth Lakes. .................... 51 Table 10‐. Historical and estimated price data for specialty silica in dollars per pound of dry silica; colloidal silica = silica sol (reproduced by permission from Freedonia Group, Report “Industry Study 1783”). LLNL ............................................................................................................................................................. 60 Table 11‐ Value and tonnage of specialty silica markets including future estimated demand (reproduced by permission from Freedonia Group, Report “Industry Study 1783”). LLNL ........................ 60 Table 12‐ Global colloidal silica markets (annual) in terms of millions of pounds dry silica content (reproduced by permission from Freedonia Group, Report “Industry Study 1783”). LLNL ....................... 61
vii
Abstract
This project analyzed the technical and economic feasibility of a silica recovery process that could significantly lower the net costs of geothermal energy production by providing an additional revenue stream. A pilot‐scale recovery plant to extract silica from geothermal fluids was successfully demonstrated at the Mammoth Lakes geothermal plant. The pilot results were incorporated in an economic analysis of silica recovery. The results of the economic analysis suggest that the rates‐of‐return are favorable with costs‐offsets of about one cent per kilowatt hour. The technology is simple, and can be readily applied to other geothermal systems, in particular those with low salinities. The technology thus has the potential to enhance currently sub‐economic geothermal sites into profitability. The process also produces a clean water by‐product that would be available for a wide variety of uses, in particular for power plant wet cooling. The next step towards full‐scale commercialization would be the construction of a demonstration‐scale plant that would produce approximately one ton per day silica and a purified water stream sufficient for wet cooling of 10‐15 mega‐watts of power plant capacity.
Keywords: Geothermal energy, mineral extraction, silica, silica colloids, reverse osmosis, ultrafiltration

viii
1
Executive Summary
Introduction
The economic competitiveness of geothermal energy can be enhanced by co‐producing valuable mineral by‐products that are contained in solution in the geothermal fluid. It is estimated that the extraction of marketable silica from the Mammoth Lakes, California geothermal fluids could offset the cost of geothermal power by more than $0.01/kWh. Extraction of other metals from the Mammoth fluids and at other California geothermal power plants could generate about $0.005/kWh per metal.
Project Objectives and Purpose
This project was intended to demonstrate the technical and economic feasibility of metal and mineral co‐production from geothermal fluids in California. This project focused on a pilot‐scale demonstration of the extraction of marketable silica (SiO2) from geothermal fluid at the Mammoth Lakes geothermal power plant in California.
Project Outcome
Silica extraction tests were carried out using a 20 gallon per minute feed supply of geothermal fluid obtained downstream of the heat exchanger at temperatures of 50‐80oC (120‐180oF), prior to reinjection. The fluid was neutral in pH and relatively low in salinity (1700 ppm) with a silica content of about 250 ppm.
There were two main steps in the silica recovery process: reverse osmosis and ultrafiltration. The reverse osmosis unit was operated at water recoveries up to 80 percent (1250 ppm silica) without silica fouling. The reverse osmosis concentrate was then aged to grow silica colloids, and then passed through a cross‐flow ultrafilter to extract the silica colloids into a concentrated solution of 10‐30 wt percent colloidal silica. The silica product was characterized in terms of colloid size, colloid monodispersivity (uniformity of size), chemical composition, and percentage silica in solution. The silica was determined to be within the specifications of known commercial colloidal silica products.
Conclusions and Recommendations
The silica recovery process developed produced a clean, low‐salinity water by‐product useful for wet cooling or other applications, both within and outside the geothermal power plant. The
2
ideal application of this new technology would be for use in a water‐cooled binary geothermal power plant as binary power plants allow for cooler geothermal reservoirs to be used due to a cooling process involving pumps, heat exchangers, and low boiling point liquids. In the binary geothermal power plant, the clean water by‐product is used for plant cooling before its reinjection, and the concentrate stream is used to recover silica as well as other minerals such as lithium, cesium, and tungsten. Geothermal projects in California that would benefit most from this technology would be those in moderate temperature systems with low‐salinity waters using binary power plants.
3
Introduction
Background and Overview
Geothermal energy is widely recognized as a clean and environmentally friendly source of base‐load power. California has tremendous geothermal resources that have yet to be developed, as well as an aggressive Renewable Portfolio Standard calling for increased renewable energy use, and a mandate to decrease greenhouse gas emissions through Assembly Bill 32. However, it is also recognized that the economics of geothermal energy must be improved to accelerate market penetration.
A recent Department of Energy (DOE) sponsored report (“Geothermal Risk Mitigation Strategies Report” by Deloitte, Feb. 15, 2008) noted that the “recent limited interest that has begun to develop in geothermal energy has been driven by government policy, in the form of tax incentives and regulatory mandates”. In particular, the federal production tax credit (PTC) of $0.015/kWh has been a vital aspect in the financing of geothermal projects. Thus offsets of the costs of geothermal power could significantly accelerate and expand geothermal energy utilization in California. Such an offset in the cost of geothermal power could be realized by recovering minerals and other value‐added products from geothermal fluids.
It is estimated that the extraction of marketable silica from the Mammoth Lakes, California geothermal fluids could offset the cost of geothermal power by over $0.01/kWh. Extraction of other metals from the Mammoth fluids and at other California geothermal power plants could generate about $0.005/kWh per metal. Considering that many geothermal fluids produce two or more metals, metal and mineral co‐production could stimulate the same growth in geothermal energy that the production tax credit has, thereby reducing the dependence of the geothermal industry on tax credits, and helping to make geothermal power competitive with fossil fuels. Deloitte’s report also noted that royalty relief programs have led to increased resource development. Metal co‐production can generate royalty payments to geothermal producers that could serve in a similar manner to increase geothermal resource development in California.
To demonstrate the technical and economic feasibility of metal and mineral co‐production from geothermal fluids in California, this project focused on a pilot‐scale demonstration of the extraction of marketable silica (SiO2) from geothermal fluid at the Mammoth Lakes, California geothermal power plant. The pilot plant was based on a process previously developed through laboratory and field tests co‐funded by the California Energy Commission (Commission) (PIR‐00‐003) and the Department of Energy (DOE) Geothermal Technologies Program. The pilot test established optimum operating parameters for silica extraction and demonstrated the long‐term viability of the process. Results of the pilot study were used to develop a detailed economic analysis of full‐scale development of silica co‐production.
4
If commercialized, silica recovery would not only reduce the overall cost of producing geothermal energy by providing an additional revenue stream, but would also facilitate the extraction of additional metals such as lithium, cesium and rubidium which occur in the fluids. These metals are more readily extracted once silica, a common scale‐forming compound, is removed from the fluid. The use of this type of ‘clean mining’ to extract metals from geothermal fluids eliminates the need for acquiring these metals through energy intensive and environmentally damaging mining technologies.
In traditional metals mining, 22 tons of material must be mined (and disposed of) for every 1 ton of metal produced. In contrast, geothermal fluids contain metals in soluble form already, and no waste is produced because the geothermal fluid is simply reinjected once the metal has been extracted. Eliminating the need to blast, drill, crush, and grind material to produce an appropriate product for final processing will lead to significant energy savings as well. Grinding consumes 40% of current energy use across the metal mining industry, and diesel‐powered materials handling equipment consumes another 17% (Mining Industry Energy Bandwidth Study, BCS Inc., June 2007). Mining geothermal fluids for their metal content also lowers the dependence of California and the U.S. on foreign sources of metals. The U.S. currently imports much if not all of their precipitated silica, lithium and cesium from foreign sources.
Another value‐added product of the mineral recovery process described in this report is a clean, low‐salinity water that is suitable for use in wet cooling and other applications at the power plant, or for domestic and other commercial uses. Wet cooling can significantly increase power production during warm weather when power demands are at their highest. The value of this water is likely to increase significantly over the next few years as California water shortages become even more common, and it becomes harder for geothermal power plants to secure sources of water for their operations.
The extraction technologies developed for the Mammoth Lakes binary power plant can be modified to work at other California geothermal sites because of the similarities of geothermal fluids and their silica chemistries. Much of the planned geothermal development in California will harvest medium temperature geothermal resources, similar to Mammoth Lakes with similar silica chemistries and binary energy conversion systems. The Mammoth fluids have also been variably concentrated during the course of this research so that their chemistries resembled fluids in both flash and binary geothermal systems, further extending the applicability of the technical results to a number of geothermal systems.
In summary, mineral extraction from geothermal fluids will benefit the California ratepayer by creating an additional source of revenue that will help to accelerate market penetration of
5
renewable, base‐load geothermal energy, meet California’s RPS goal, reduce greenhouse gas emissions in accordance with Assembly Bill 32, reduce the environmental impact and energy demand of mining, and provide a clean source of water to increase power production and ease demand on California’s limited water supplies.
Project Objectives
The overall technical goal of this project was to demonstrate an economic silica recovery process that significantly lowers the net cost of geothermal energy production. Lawrence Livermore National Laboratory’s specific goal was to lower the cost by $0.005 per kilowatt‐hour.
The technical objectives of this project were:
• Conduct a minimum 2 month‐long continuous extraction test to acquire process performance data for input to the economic model
• Demonstrate recovery of >50 lbs of silica per day from 20 gpm feed • Determine the highest RO water recovery that allows 2 months continuous RO
operation with less than 20% membrane permeability decrease • Generate at least one metric ton of uniform colloidal silica solution having at least 30 wt
% silica for product testing
The processes used in sequence: (1) reverse osmosis to concentrate silica for subsequent extraction, (2) a stirred reactor in which silica polymerizes and aggregates to form colloids, the desired silica by‐product, and (3) a filtration step in which the silica particles are separated from the aqueous fluid.
A preliminary economic analysis of these technologies showed favorable results. The major expenses were personnel and membrane replacement costs. These results were obtained using software for estimating costs for common water treatment technologies (WTCOST; Moch, 2006).
Several key questions and needs remained that would best be addressed by pilot‐scale studies. These key issues included:
1. Reverse osmosis (RO) operating conditions: What is the maxiumum RO recovery that can be attained without significant membrane fouling by silica? “RO recovery” is the ratio of volumes of low salinity permeate to high salinity concentrate. The higher the recovery, the higher the concentration of silica and salts in the concentrate. There is a trade‐off in that silica is easier to extract when it is present at high concentrations, but at high concentrations it is more likely to precipitate on the membrane surface and
6
necessitate more frequent cleaning. It also could potentially reduce membrane longevity. Data on membrane performance under a range of recoveries and with continuous operation over week to month‐long durations were therefore needed to quantify this tradeoff.
2. Silica reaction method: A related need is that of determining the optimum conditions for silica polymerization. At low silica concentrations, additives such as salts and commercial polyelectrolytes can be used to enhance silica polymerization and particle growth. At higher concentrations, cooling by 10‐30oC can provide the same effect. In all cases, the more rapidly the silica reacts, the smaller the reactor needs to be in order to provide enough residence time for particle growth. Again there is a tradeoff between the costs of additives, the capital costs of the reactor, the potential negative impact of the additive on reinjection, and membrane longevity and cleaning costs. Systematic data on silica precipitation rates as a function of its concentration are needed to quantify these relationships and allow process optimization.
3. Silica separation: A major problem with previous attempts to extract silica from geothermal fluids has been silica separation (filtration) methods. Ultrafiltration with membranes of about 100 nanometer pore size have been used successfully, but not without relatively high maintenance costs due to the need for frequent cleaning. Whereas in phase one of this work the equipment was operated over time periods of a few hours to a few days, in the current project it was operated over weeks to months to better define working limits and cleaning and replacement costs.
Project Approach and Methods
Lawrence Livermore National Laboratory (LLNL) conducted a pilot‐scale demonstration of silica extraction at the Mammoth Lakes, California geothermal site based on a process previously developed through laboratory and field tests co‐funded by the California Energy Commission (Commission) (PIR‐00‐003) and the Department of Energy (DOE) Geothermal Technologies Program (Phase I; Bourcier et al. 2005)1. The pilot plant produced a marketable silica by‐product as well as clean, low salinity water for plant use in cooling or other
1 The study by Bourcier et al. (2005) generated multiple precipitated silica by-products in addition to colloidal silica. Colloidal silica was chosen as the most attractive target for extraction because colloidal silica formed spontaneously without additives post-reverse osmosis and a market for the product was identified. See section “Marketing Analysis” for further discussion.
7
applications. The pilot tests were carried out in order to establish optimum operating parameters for silica extraction and demonstrate the long‐term viability of the process. LLNL then used the results of the pilot study to conduct a detailed economic analysis of full‐scale development of silica co‐production.
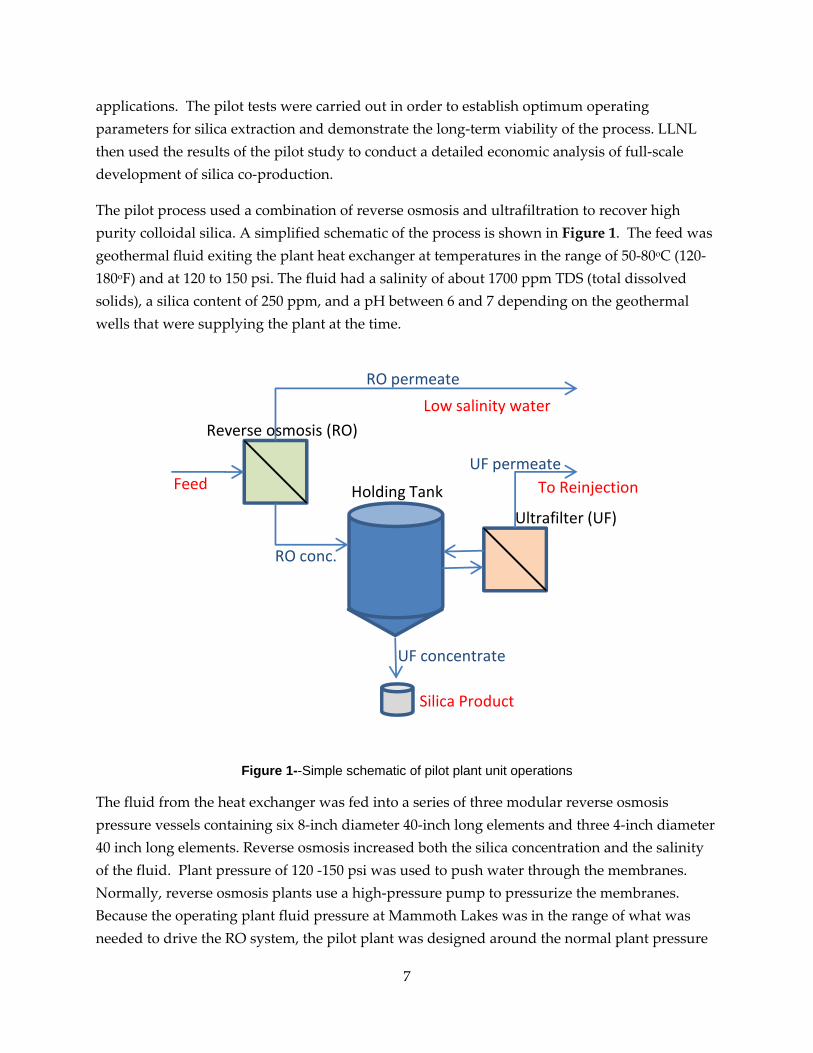
The pilot process used a combination of reverse osmosis and ultrafiltration to recover high purity colloidal silica. A simplified schematic of the process is shown in Figure 1. The feed was geothermal fluid exiting the plant heat exchanger at temperatures in the range of 50‐80oC (120‐180oF) and at 120 to 150 psi. The fluid had a salinity of about 1700 ppm TDS (total dissolved solids), a silica content of 250 ppm, and a pH between 6 and 7 depending on the geothermal wells that were supplying the plant at the time.
Figure 1--Simple schematic of pilot plant unit operations
The fluid from the heat exchanger was fed into a series of three modular reverse osmosis pressure vessels containing six 8‐inch diameter 40‐inch long elements and three 4‐inch diameter 40 inch long elements. Reverse osmosis increased both the silica concentration and the salinity of the fluid. Plant pressure of 120 ‐150 psi was used to push water through the membranes. Normally, reverse osmosis plants use a high‐pressure pump to pressurize the membranes. Because the operating plant fluid pressure at Mammoth Lakes was in the range of what was needed to drive the RO system, the pilot plant was designed around the normal plant pressure
RO permeate
Reverse osmosis (RO)
Ultrafilter (UF)
RO conc.
UF concentrate
UF permeate
Silica Product
Low salinity water
To ReinjectionFeed Holding Tank
8
to avoid the need for a high‐pressure pump. However, all costs associated with the pumps that would be needed for a full‐scale system are included in the economic analysis.
Based on Phase 1 results, RO membranes that are commonly used to desalinate seawater were selected. Although the Mammoth Lakes fluids are low in salinity and would be considered appropriate for brackish‐water RO elements, the high fluid temperature decreases the salt (and silica) rejection of RO membranes. Using a tighter (smaller pore size) sea water element gave higher salt and silica rejection, both desirable for the process. The seawater RO elements were from Toray Group USA.
A range of RO water recoveries were tested. The water recovery is defined as the fraction of pure water produced divided by the total amount of feed water. The RO concentrate makes up the difference. As the water recovery increases, the concentration of silica and salt in the RO concentrate increases. The higher the silica concentration, the faster the silica will polymerize and react to form colloids. A fast rate of colloid formation improves the economics of the process because of reduced costs associated with aging the fluid prior to silica colloid separation. However, with higher silica concentrations, it is more likely that silica will foul the RO membranes. One of the pilot study goals was to systematically increase the RO recovery until silica fouling was observed. An optimum recovery for silica co‐production would be a recovery marginally lower than the value at which silica fouling can be detected. In addition, various membrane cleaning methodologies on the fouled membranes could be tested in order to better estimate costs associated with membrane operation and maintenance.
The concentrate from the RO unit that contained concentrated silica was then fed into a holding tank (blue in Figure 1) where the solution was allowed to reside for times from 5 minutes to 1 hour prior to ultrafiltration. The length of residence time in the tank varied with recovery; the higher the recovery, the higher the silica content, and the shorter the time before colloid separation.
The UF system separates water from the silica colloids by moving the concentrate fluid parallel to microporous membranes (cross‐flow filtration) which allows water to pass thought the pores and leaves the colloids behind. The system is run until most of the water is removed. Given that testing started with about 0.1 wt % silica (1000 ppm) and in order to produce a product that is 20‐30 wt % silica, 99.5 – 99.7% of the water must be removed to produce a commercial grade of silica colloids.
Ultrafilters similar to those used for commercial colloidal silica production were used. The membranes and pressure vessels with a nominal pore size of 100 nm were obtained from PCI Membranes (B1 modules). Cross flow fluid velocities were maintained around 11 ft/sec. with a cross‐membrane pressure of 80‐100 psi .
9
During some silica production runs, there was an increased amount of dissolved carbon dioxide in the fluid. It was visible as bubbles inside the flow gauges of both the RO permeate and concentrate (Figure 10, on right). This increase in carbon dioxide was probably due to an increased amount of feed from production wells in the Casa Diablo area to the west of the power plant site. These wells are known to be higher in carbon dioxide than the wells in the vicinity of the plant. It was also noted that the feed solution had a slightly lower pH than it had several years ago during Phase 1 of this work (Bourcier et al., 2005). Although this variability is of some concern for maintaining a consistent silica by‐product, it did not appear to affect the colloidal silica solutions based on past characterization of colloid size and rate of colloid formation.
Computer Simulations of the Silica Recovery Process Prior to operation of the pilot system, geochemical modeling of the reverse osmosis process was conducted to predict the maximum water recovery prior to significant mineral scaling of the process equipment. Geochemical modeling uses a thermodynamic approach to calculate the saturation state and quantities of all solid minerals that could precipitate and potentially foul the membranes.
Simulations were made with The Geochemist’s Workbench geochemical modeling code “React” and the thermodynamic data base “thermo.com.V8.R6+.dat” originating from Lawrence Livermore National Laboratory that is distributed with The Geochemist’s Workbench (Bethke, 1996). Activity coefficients were calculated using the B‐dot extension of the Debye‐Huckel equation. The temperature during reverse osmosis processing was assumed to be 50⁰C.
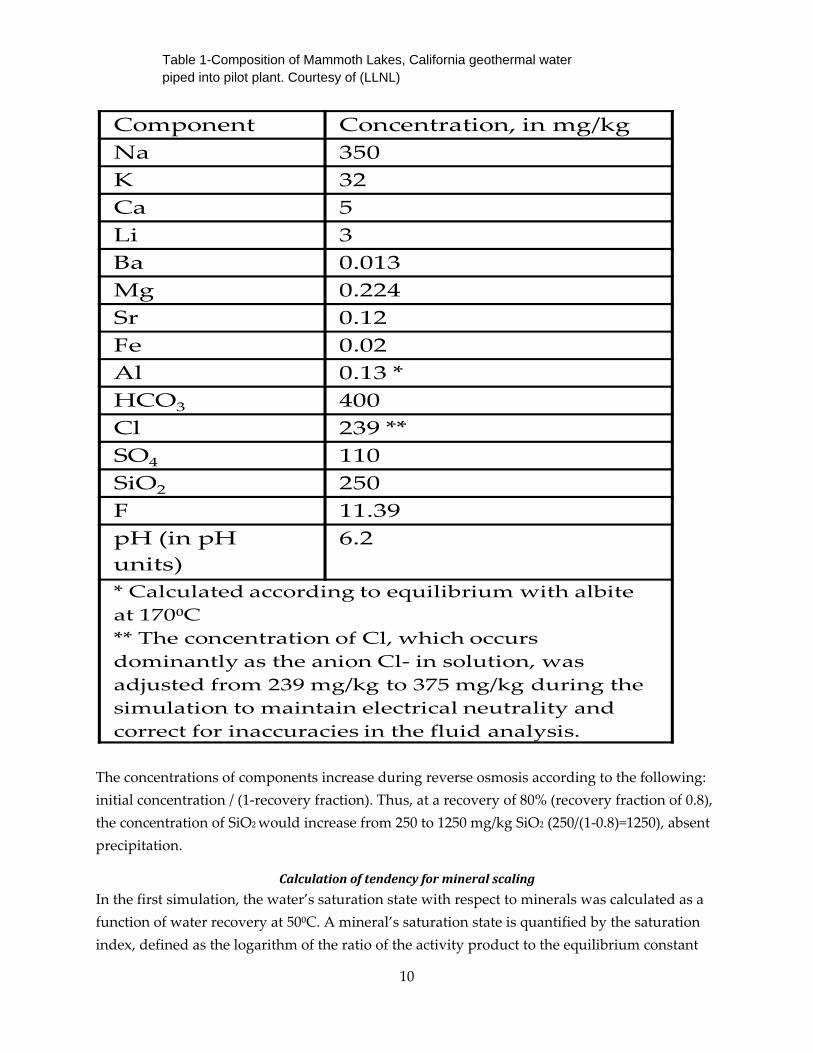
Table 1 shows the Mammoth water chemistry prior to concentration by reverse osmosis. The oxidation state of the system was assumed to be sufficiently reducing to maintain Fe in a reduced (+2 valence) state, as would be expected in a closed binary loop system under pressure. The aluminum concentration was fixed by assuming equilibrium with the mineral albite (NaAlSi3O8) at subsurface reservoir conditions (170⁰C). Aluminum analyses tend to be problematic, and the assumption of downhole equilibrium with a mineral in the reservoir that buffers the aluminum concentration has shown to yield good results. Results are expressed in terms of the percent of water recovery.
10
Component Concentration, in mg/kgNa 350K 32Ca 5Li 3Ba 0.013Mg 0.224Sr 0.12Fe 0.02Al 0.13 * HCO3 400Cl 239 **SO4 110SiO2 250F 11.39pH (in pH units)
6.2
* Calculated according to equilibrium with albiteat 170⁰C** The concentration of Cl, which occurs dominantly as the anion Cl‐ in solution, was adjusted from 239 mg/kg to 375 mg/kg during the simulation to maintain electrical neutrality and correct for inaccuracies in the fluid analysis.
The concentrations of components increase during reverse osmosis according to the following: initial concentration / (1‐recovery fraction). Thus, at a recovery of 80% (recovery fraction of 0.8), the concentration of SiO2 would increase from 250 to 1250 mg/kg SiO2 (250/(1‐0.8)=1250), absent precipitation.
Calculation of tendency for mineral scaling
In the first simulation, the water’s saturation state with respect to minerals was calculated as a function of water recovery at 50⁰C. A mineral’s saturation state is quantified by the saturation index, defined as the logarithm of the ratio of the activity product to the equilibrium constant
Table 1-Composition of Mammoth Lakes, California geothermal water piped into pilot plant. Courtesy of (LLNL)
11
(e.g. Bethke, 1996). If the saturation index is equal to zero, the mineral is in equilibrium with the water. If positive, the mineral is oversaturated and has a thermodynamic tendency to precipitate and form scale. If negative, the mineral is undersaturated and will not precipitate. For this simulation, no actual precipitation was allowed in order to track the potential for a wide variety of minerals to precipitate when concentrations of silica and salt in the reverse osmosis concentrate increase as permeate (water) is removed.
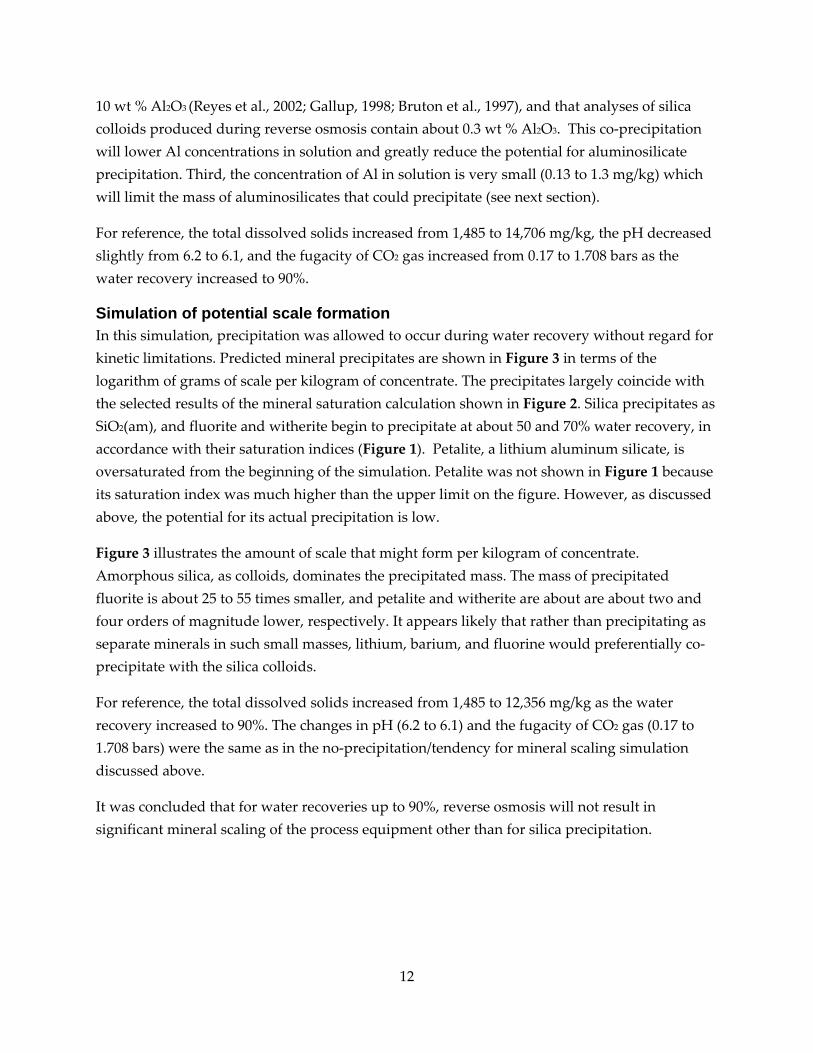
Figure 2 illustrates some classes of the most important mineral scaling reactions that might occur during the reverse osmosis process. For reference, mineral formulas are shown in Table 2. Amorphous silica (SiO2(am)), is saturated initially in the water, and becomes increasingly supersaturated as water is recovered, which is consistent with its observed precipitation as colloids in the system. Sulfates (represented by gypsum) do not reach saturation even at water recoveries as high as 90%. Although the carbonate mineral witherite is supersaturated at a recovery of about 70%, calcite remains undersaturated throughout. The concentration of barium is very small throughout recovery (0.013 to 0.13 mg/kg) and it is not expected to form significant amounts of scale. Trace amounts of barium will usually co‐precipitate with calcite, but will not significantly increase the saturation index of calcite. Fluorite reaches saturation at about 50% recovery, and may precipitate in small amounts (see next section).
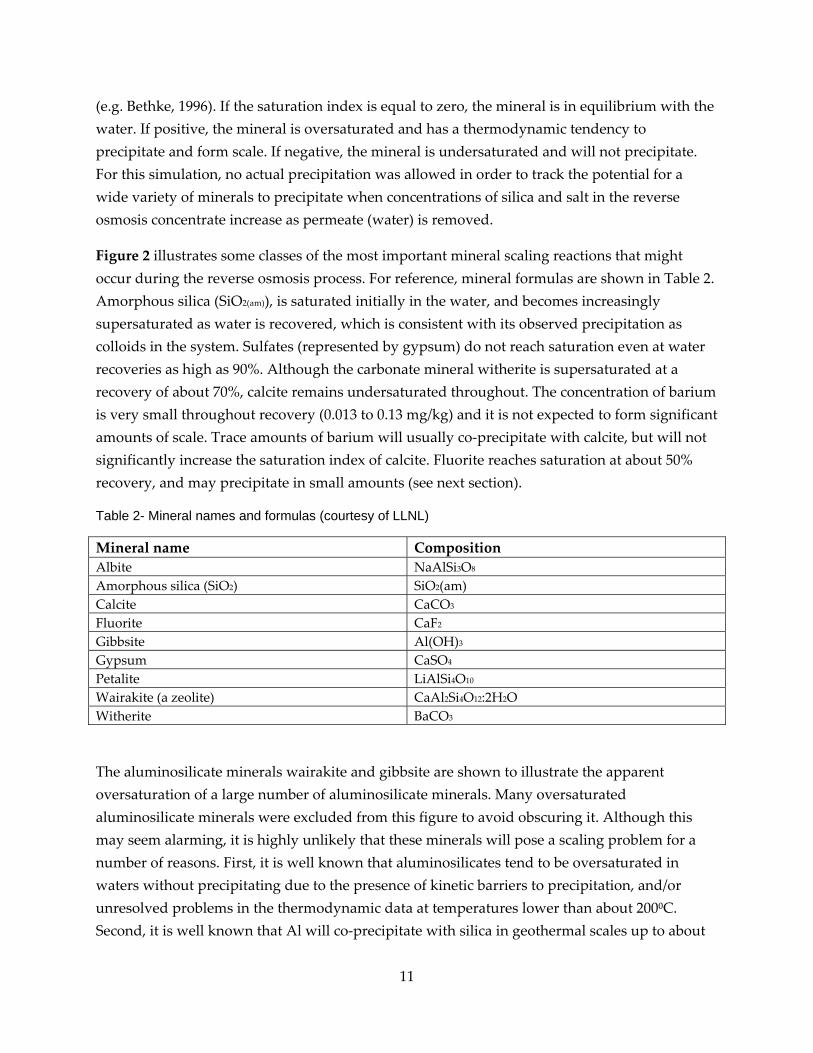
Table 2- Mineral names and formulas (courtesy of LLNL)
Mineral name Composition Albite NaAlSi3O8 Amorphous silica (SiO2) SiO2(am) Calcite CaCO3 Fluorite CaF2 Gibbsite Al(OH)3 Gypsum CaSO4 Petalite LiAlSi4O10 Wairakite (a zeolite) CaAl2Si4O12:2H2O Witherite BaCO3
The aluminosilicate minerals wairakite and gibbsite are shown to illustrate the apparent oversaturation of a large number of aluminosilicate minerals. Many oversaturated aluminosilicate minerals were excluded from this figure to avoid obscuring it. Although this may seem alarming, it is highly unlikely that these minerals will pose a scaling problem for a number of reasons. First, it is well known that aluminosilicates tend to be oversaturated in waters without precipitating due to the presence of kinetic barriers to precipitation, and/or unresolved problems in the thermodynamic data at temperatures lower than about 200⁰C. Second, it is well known that Al will co‐precipitate with silica in geothermal scales up to about
12
10 wt % Al2O3 (Reyes et al., 2002; Gallup, 1998; Bruton et al., 1997), and that analyses of silica colloids produced during reverse osmosis contain about 0.3 wt % Al2O3. This co‐precipitation will lower Al concentrations in solution and greatly reduce the potential for aluminosilicate precipitation. Third, the concentration of Al in solution is very small (0.13 to 1.3 mg/kg) which will limit the mass of aluminosilicates that could precipitate (see next section).
For reference, the total dissolved solids increased from 1,485 to 14,706 mg/kg, the pH decreased slightly from 6.2 to 6.1, and the fugacity of CO2 gas increased from 0.17 to 1.708 bars as the water recovery increased to 90%.
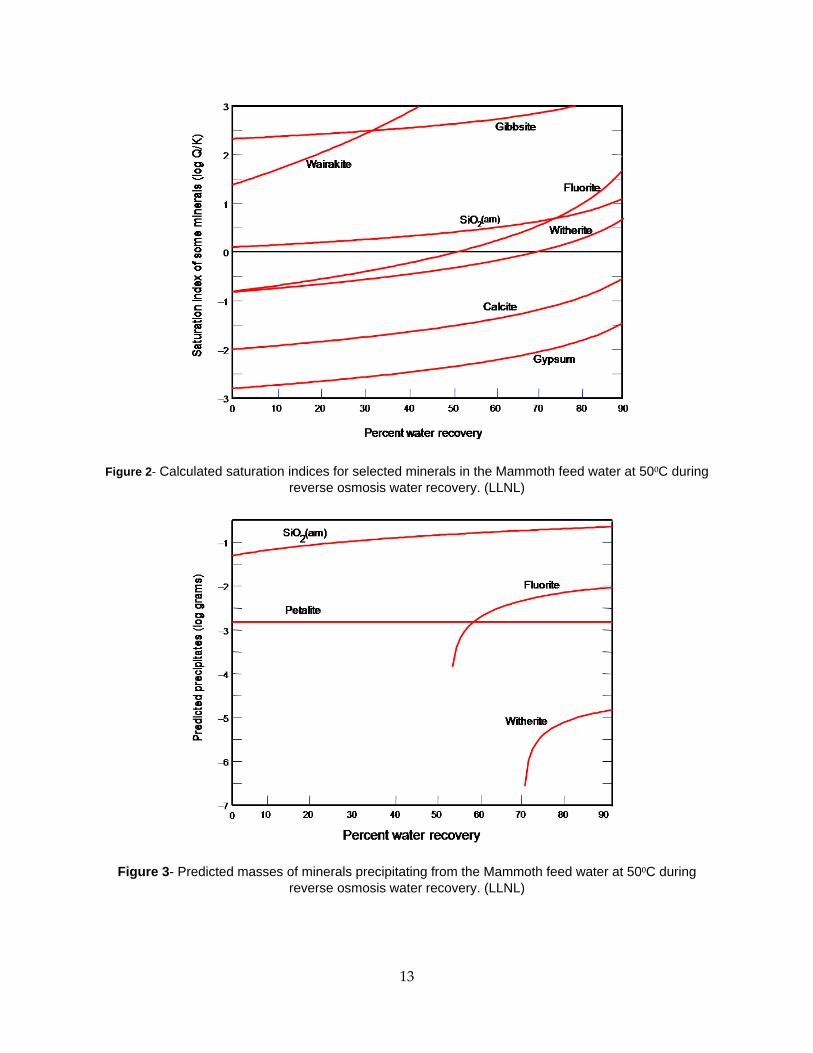
Simulation of potential scale formation In this simulation, precipitation was allowed to occur during water recovery without regard for kinetic limitations. Predicted mineral precipitates are shown in Figure 3 in terms of the logarithm of grams of scale per kilogram of concentrate. The precipitates largely coincide with the selected results of the mineral saturation calculation shown in Figure 2. Silica precipitates as SiO2(am), and fluorite and witherite begin to precipitate at about 50 and 70% water recovery, in accordance with their saturation indices (Figure 1). Petalite, a lithium aluminum silicate, is oversaturated from the beginning of the simulation. Petalite was not shown in Figure 1 because its saturation index was much higher than the upper limit on the figure. However, as discussed above, the potential for its actual precipitation is low.
Figure 3 illustrates the amount of scale that might form per kilogram of concentrate. Amorphous silica, as colloids, dominates the precipitated mass. The mass of precipitated fluorite is about 25 to 55 times smaller, and petalite and witherite are about are about two and four orders of magnitude lower, respectively. It appears likely that rather than precipitating as separate minerals in such small masses, lithium, barium, and fluorine would preferentially co‐precipitate with the silica colloids.
For reference, the total dissolved solids increased from 1,485 to 12,356 mg/kg as the water recovery increased to 90%. The changes in pH (6.2 to 6.1) and the fugacity of CO2 gas (0.17 to 1.708 bars) were the same as in the no‐precipitation/tendency for mineral scaling simulation discussed above.
It was concluded that for water recoveries up to 90%, reverse osmosis will not result in significant mineral scaling of the process equipment other than for silica precipitation.
13
Figure 2- Calculated saturation indices for selected minerals in the Mammoth feed water at 50⁰C during reverse osmosis water recovery. (LLNL)
Figure 3- Predicted masses of minerals precipitating from the Mammoth feed water at 50⁰C during reverse osmosis water recovery. (LLNL)
14
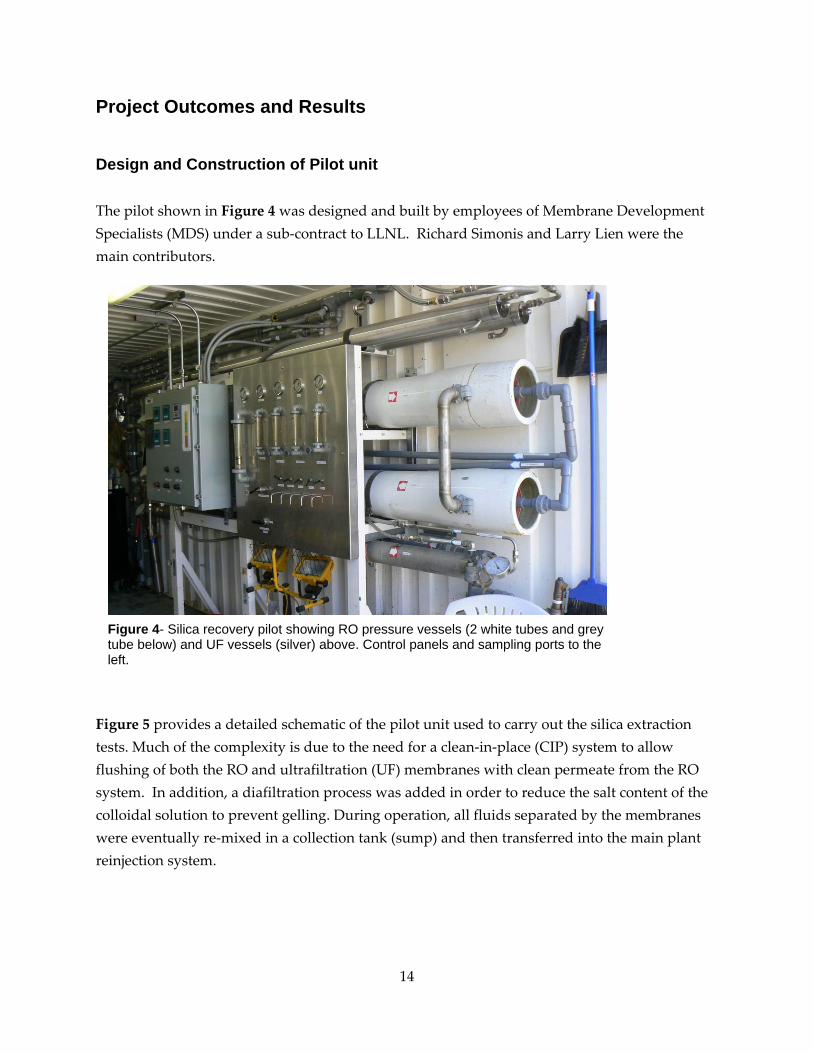
Project Outcomes and Results Design and Construction of Pilot unit The pilot shown in Figure 4 was designed and built by employees of Membrane Development Specialists (MDS) under a sub‐contract to LLNL. Richard Simonis and Larry Lien were the main contributors.
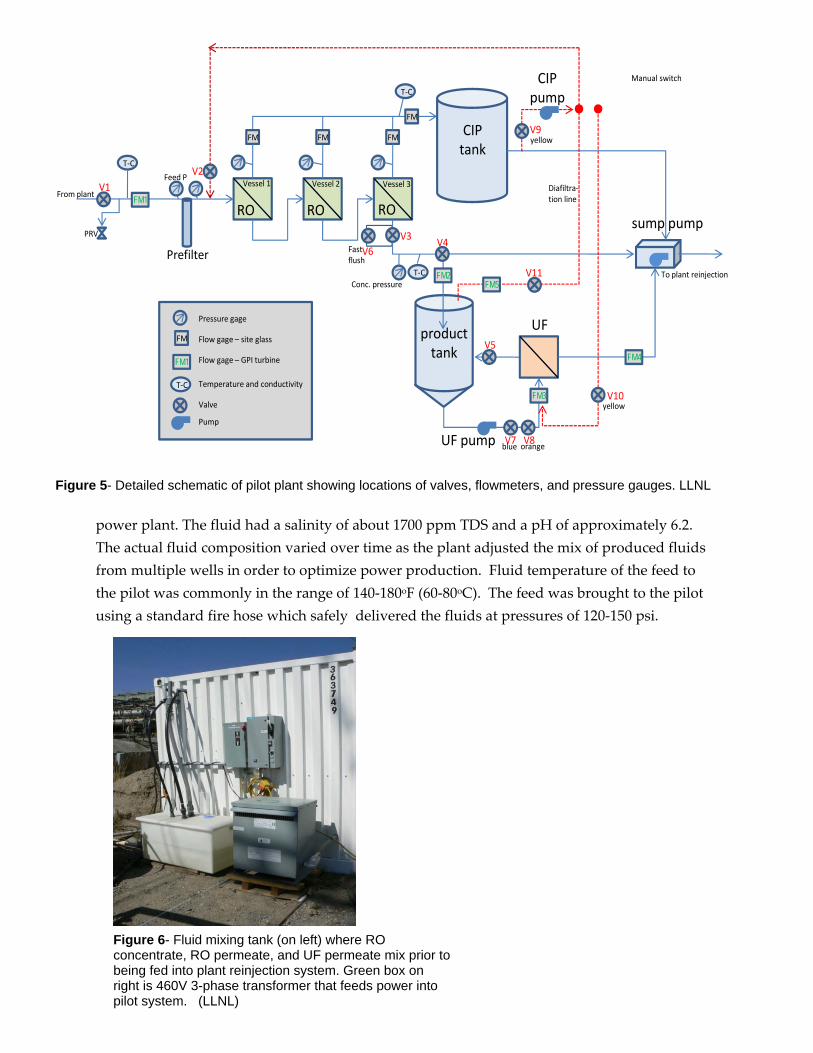
Figure 5 provides a detailed schematic of the pilot unit used to carry out the silica extraction tests. Much of the complexity is due to the need for a clean‐in‐place (CIP) system to allow flushing of both the RO and ultrafiltration (UF) membranes with clean permeate from the RO system. In addition, a diafiltration process was added in order to reduce the salt content of the colloidal solution to prevent gelling. During operation, all fluids separated by the membranes were eventually re‐mixed in a collection tank (sump) and then transferred into the main plant reinjection system.
Figure 4- Silica recovery pilot showing RO pressure vessels (2 white tubes and grey tube below) and UF vessels (silver) above. Control panels and sampling ports to the left.
15
The pilot plant was fed using geothermal fluid from Unit 100 (5 MW) at the Mammoth Lakes power plant. The fluid had a salinity of about 1700 ppm TDS and a pH of approximately 6.2. The actual fluid composition varied over time as the plant adjusted the mix of produced fluids from multiple wells in order to optimize power production. Fluid temperature of the feed to the pilot was commonly in the range of 140‐180oF (60‐80oC). The feed was brought to the pilot using a standard fire hose which safely delivered the fluids at pressures of 120‐150 psi.
Figure 5- Detailed schematic of pilot plant showing locations of valves, flowmeters, and pressure gauges. LLNL
V1V2
V3 V4
V5
sump pumpPRV
UF
RO RO RO
Prefilter
producttank
CIPtank
CIPpump
UF pump
FM
FMFMFM
FM1
Feed P
Conc. pressure
Fast flush
orange
yellow
V6
V9
V8
Manual switch
Vessel 1 Vessel 2 Vessel 3
V7
FM2
FM4
FM3
blue
V10yellow
T‐C
T‐C
T‐C
Pressure gage
Valve
Pump
Flow gage – GPI turbine
Flow gage – site glass
Temperature and conductivity
FM1
FM
T‐C
To plant reinjection
From plant
V11FM5
Diafiltra‐tion line
Figure 6- Fluid mixing tank (on left) where RO concentrate, RO permeate, and UF permeate mix prior to being fed into plant reinjection system. Green box on right is 460V 3-phase transformer that feeds power into pilot system. (LLNL)
16
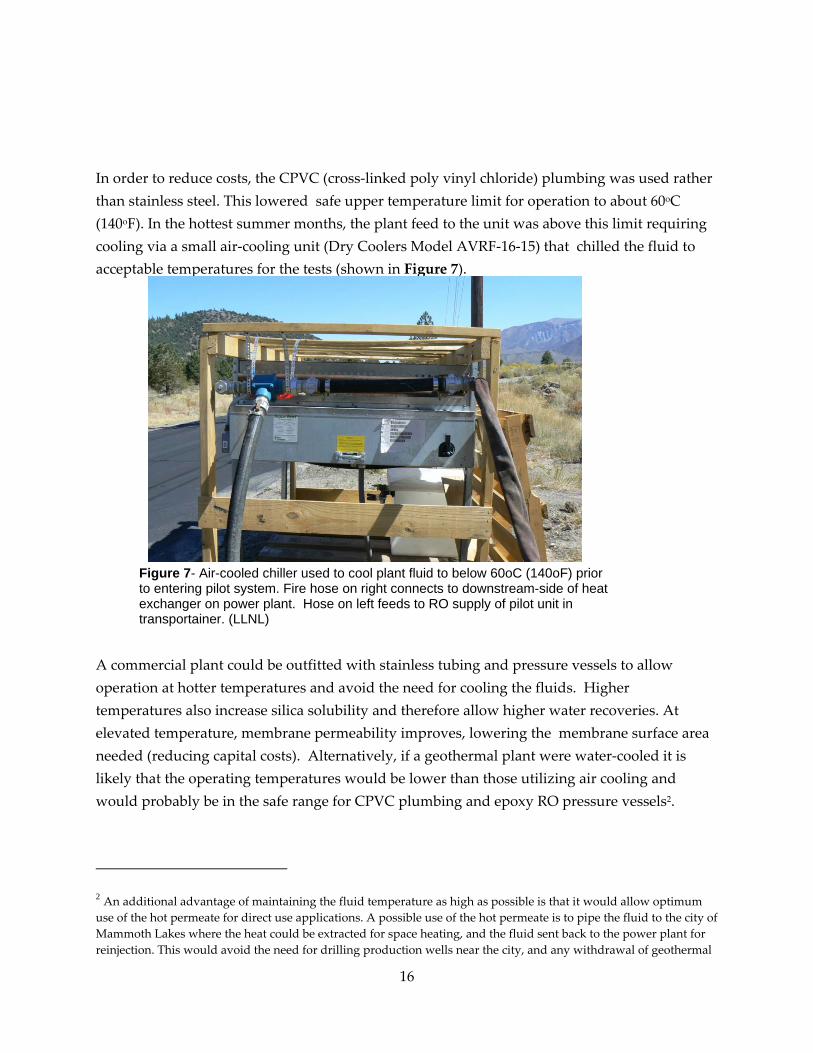
In order to reduce costs, the CPVC (cross‐linked poly vinyl chloride) plumbing was used rather than stainless steel. This lowered safe upper temperature limit for operation to about 60oC (140oF). In the hottest summer months, the plant feed to the unit was above this limit requiring cooling via a small air‐cooling unit (Dry Coolers Model AVRF‐16‐15) that chilled the fluid to acceptable temperatures for the tests (shown in Figure 7).
A commercial plant could be outfitted with stainless tubing and pressure vessels to allow operation at hotter temperatures and avoid the need for cooling the fluids. Higher temperatures also increase silica solubility and therefore allow higher water recoveries. At elevated temperature, membrane permeability improves, lowering the membrane surface area needed (reducing capital costs). Alternatively, if a geothermal plant were water‐cooled it is likely that the operating temperatures would be lower than those utilizing air cooling and would probably be in the safe range for CPVC plumbing and epoxy RO pressure vessels2.
2 An additional advantage of maintaining the fluid temperature as high as possible is that it would allow optimum use of the hot permeate for direct use applications. A possible use of the hot permeate is to pipe the fluid to the city of Mammoth Lakes where the heat could be extracted for space heating, and the fluid sent back to the power plant for reinjection. This would avoid the need for drilling production wells near the city, and any withdrawal of geothermal
Figure 7- Air-cooled chiller used to cool plant fluid to below 60oC (140oF) prior to entering pilot system. Fire hose on right connects to downstream-side of heat exchanger on power plant. Hose on left feeds to RO supply of pilot unit in transportainer. (LLNL)
17
During operations, the plant processed between 18 and 25 gallons per minute (GPM) of feed. The plant feed was connected directly to the fluid discharge from the power plant heat exchanger without any pressure or flow control. Eight and four inch diameter RO membranes used in the tests were produced by Toray (Seawater TM820‐370) and GE‐Osmonics (Duratherm AG4040F), respectively. Eight inch elements are the standard size for most RO applications. A full‐scale plant would use many more elements than the number used in pilot, albeit identical to pilot scale elements, and thus the results provide relevant data for cost estimates for full‐scale production.
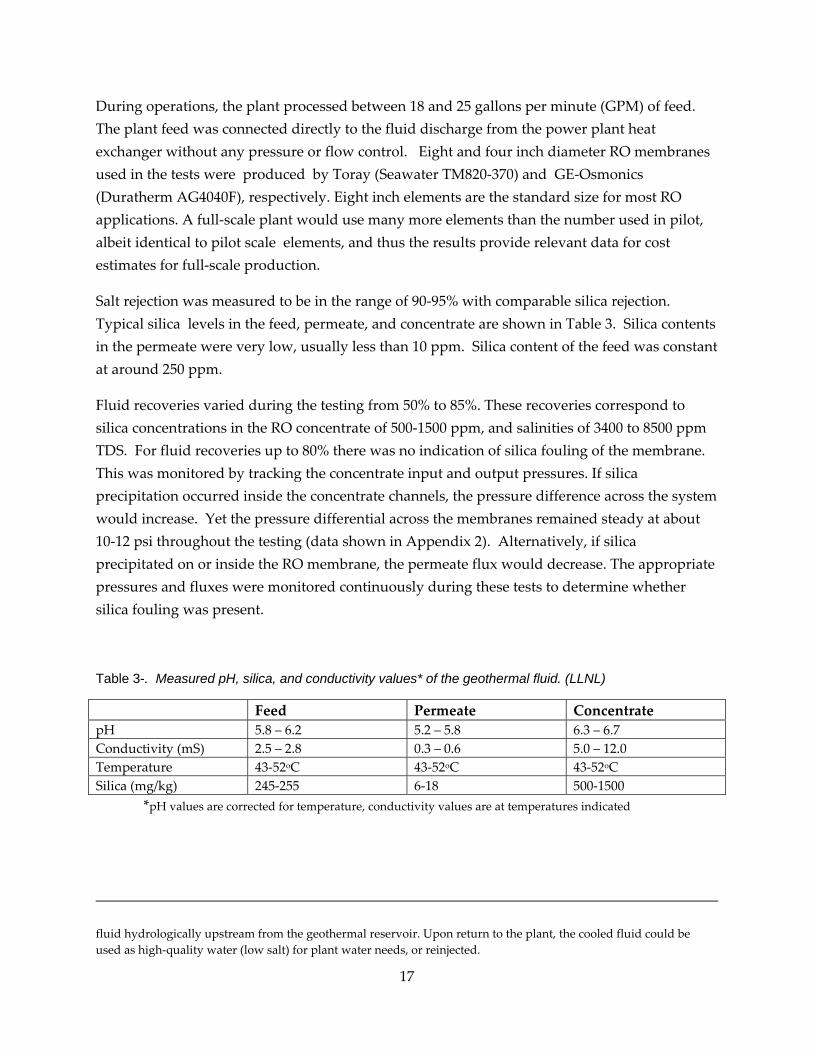
Salt rejection was measured to be in the range of 90‐95% with comparable silica rejection. Typical silica levels in the feed, permeate, and concentrate are shown in Table 3. Silica contents in the permeate were very low, usually less than 10 ppm. Silica content of the feed was constant at around 250 ppm.
Fluid recoveries varied during the testing from 50% to 85%. These recoveries correspond to silica concentrations in the RO concentrate of 500‐1500 ppm, and salinities of 3400 to 8500 ppm TDS. For fluid recoveries up to 80% there was no indication of silica fouling of the membrane. This was monitored by tracking the concentrate input and output pressures. If silica precipitation occurred inside the concentrate channels, the pressure difference across the system would increase. Yet the pressure differential across the membranes remained steady at about 10‐12 psi throughout the testing (data shown in Appendix 2). Alternatively, if silica precipitated on or inside the RO membrane, the permeate flux would decrease. The appropriate pressures and fluxes were monitored continuously during these tests to determine whether silica fouling was present.
Table 3-. Measured pH, silica, and conductivity values* of the geothermal fluid. (LLNL)
Feed Permeate Concentrate pH 5.8 – 6.2 5.2 – 5.8 6.3 – 6.7 Conductivity (mS) 2.5 – 2.8 0.3 – 0.6 5.0 – 12.0 Temperature 43‐52oC 43‐52oC 43‐52oC Silica (mg/kg) 245‐255 6‐18 500‐1500
*pH values are corrected for temperature, conductivity values are at temperatures indicated
fluid hydrologically upstream from the geothermal reservoir. Upon return to the plant, the cooled fluid could be used as high‐quality water (low salt) for plant water needs, or reinjected.
18
For fluid recoveries of 83% and higher, there was a clear decrease in permeate flux across the RO membranes in the second housing (elements 4‐6). The permeate flux dropped from approximately five GPM to values of less than one GPM over a few hours.
Repeated rinsing with RO permeate and flushing with feed at low fluid recoveries did not restore the membrane permeabilities. This suggests that fluid recoveries higher than 80% produce silica concentrations that allow silica precipitation inside the RO pressure vessels during processing. Hence, recoveries greater than 80% cannot be used on a continuous basis to produce colloidal silica without frequent membrane cleaning and replacement. During the time period of May to September, 350,000 gallons of plant fluid passed through the RO pilot plant. The UF unit processed about 87,500 gallons of RO concentrate, enough to produce about 750 pounds (dry silica) of colloidal silica solution. Because of time and budget limitations, not all of the silica processed by the UF unit was captured. The majority was processed, then piped to the sump tank for reinjection.
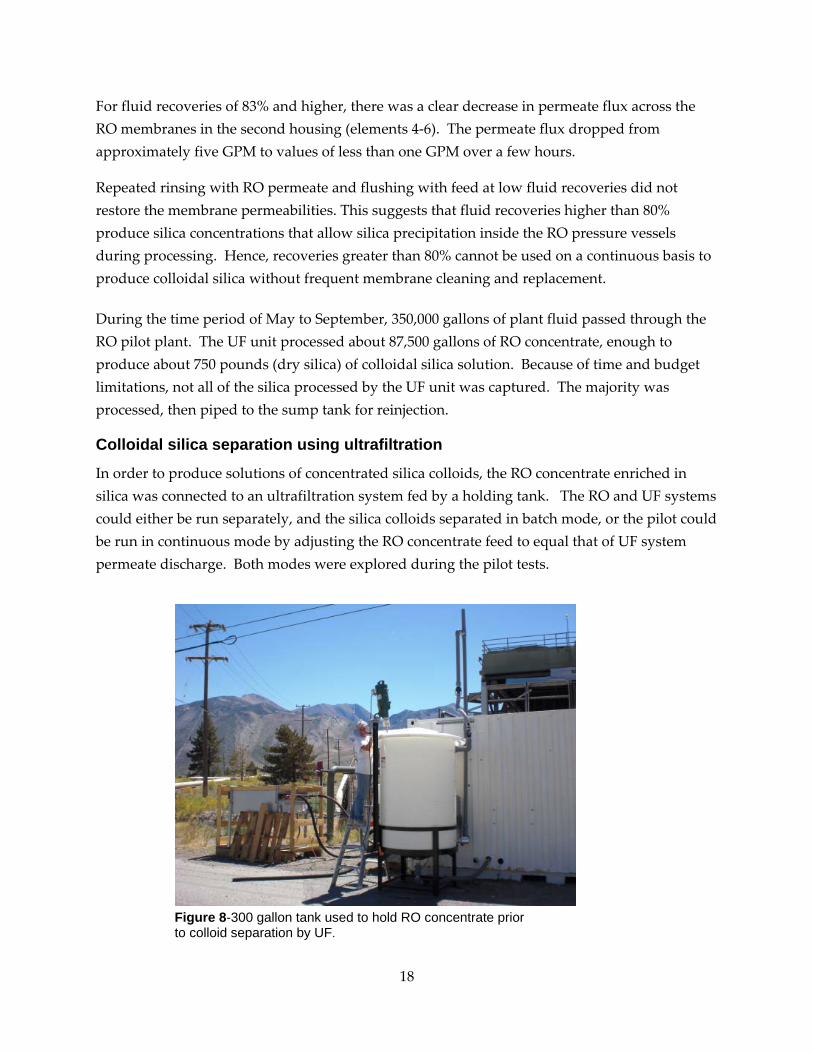
Colloidal silica separation using ultrafiltration
In order to produce solutions of concentrated silica colloids, the RO concentrate enriched in silica was connected to an ultrafiltration system fed by a holding tank. The RO and UF systems could either be run separately, and the silica colloids separated in batch mode, or the pilot could be run in continuous mode by adjusting the RO concentrate feed to equal that of UF system permeate discharge. Both modes were explored during the pilot tests.
Figure 8-300 gallon tank used to hold RO concentrate prior to colloid separation by UF.
19
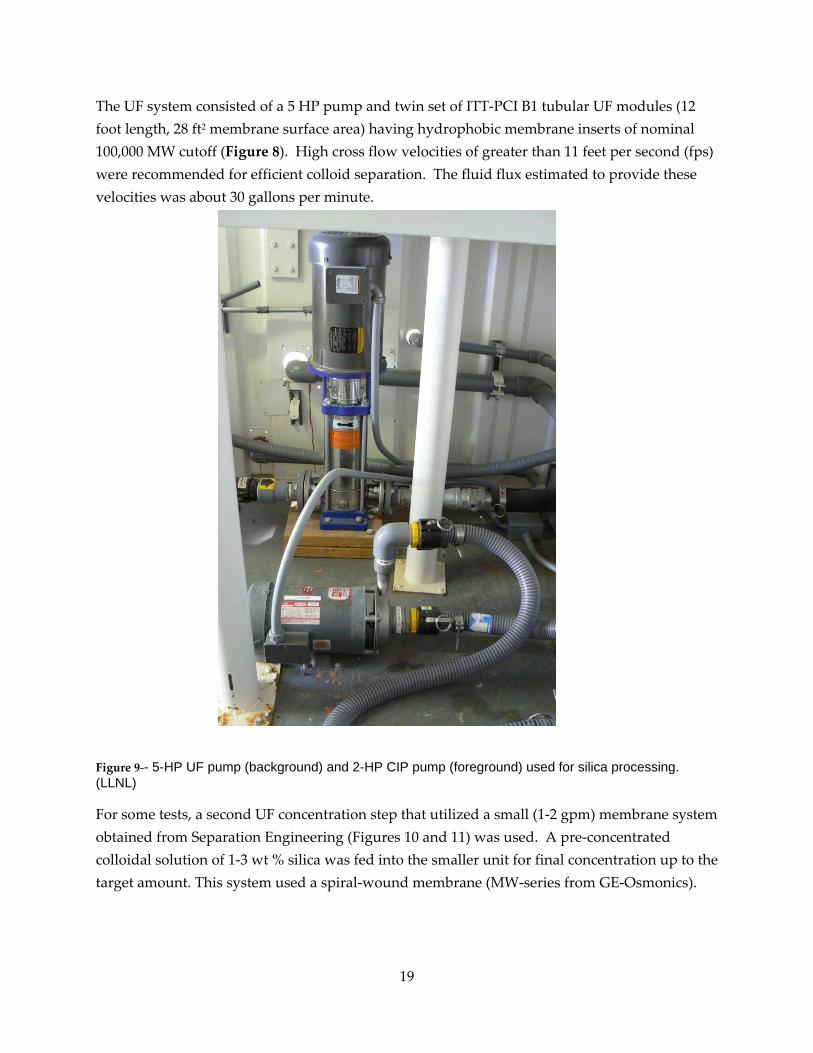
The UF system consisted of a 5 HP pump and twin set of ITT‐PCI B1 tubular UF modules (12 foot length, 28 ft2 membrane surface area) having hydrophobic membrane inserts of nominal 100,000 MW cutoff (Figure 8). High cross flow velocities of greater than 11 feet per second (fps) were recommended for efficient colloid separation. The fluid flux estimated to provide these velocities was about 30 gallons per minute.
Figure 9‐- 5-HP UF pump (background) and 2-HP CIP pump (foreground) used for silica processing. (LLNL)
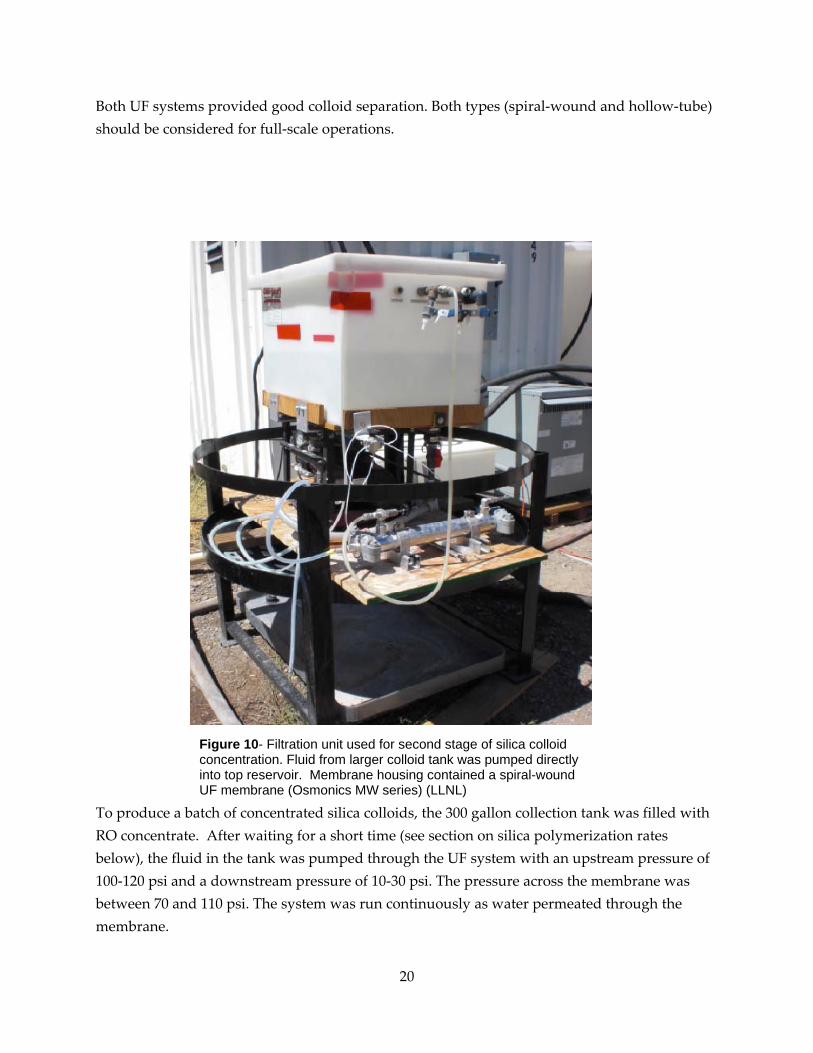
For some tests, a second UF concentration step that utilized a small (1‐2 gpm) membrane system obtained from Separation Engineering (Figures 10 and 11) was used. A pre‐concentrated colloidal solution of 1‐3 wt % silica was fed into the smaller unit for final concentration up to the target amount. This system used a spiral‐wound membrane (MW‐series from GE‐Osmonics).
20
Both UF systems provided good colloid separation. Both types (spiral‐wound and hollow‐tube) should be considered for full‐scale operations.
To produce a batch of concentrated silica colloids, the 300 gallon collection tank was filled with RO concentrate. After waiting for a short time (see section on silica polymerization rates below), the fluid in the tank was pumped through the UF system with an upstream pressure of 100‐120 psi and a downstream pressure of 10‐30 psi. The pressure across the membrane was between 70 and 110 psi. The system was run continuously as water permeated through the membrane.
Figure 10- Filtration unit used for second stage of silica colloid concentration. Fluid from larger colloid tank was pumped directly into top reservoir. Membrane housing contained a spiral-wound UF membrane (Osmonics MW series) (LLNL)
21
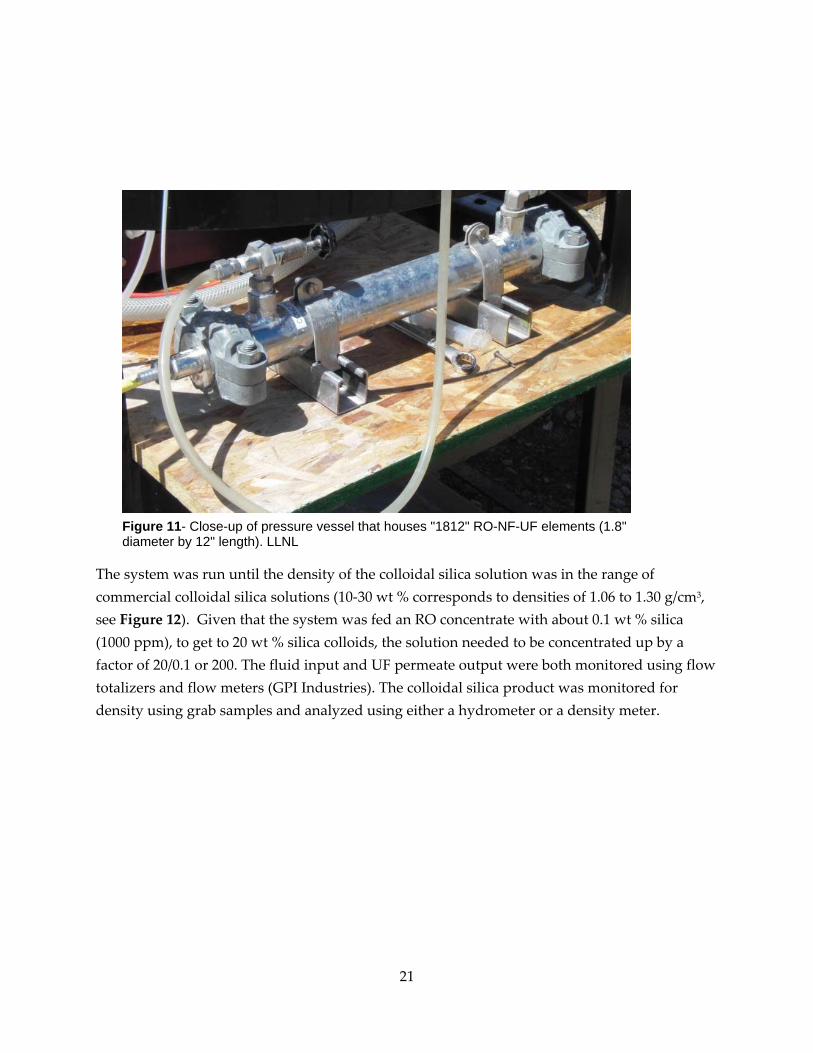
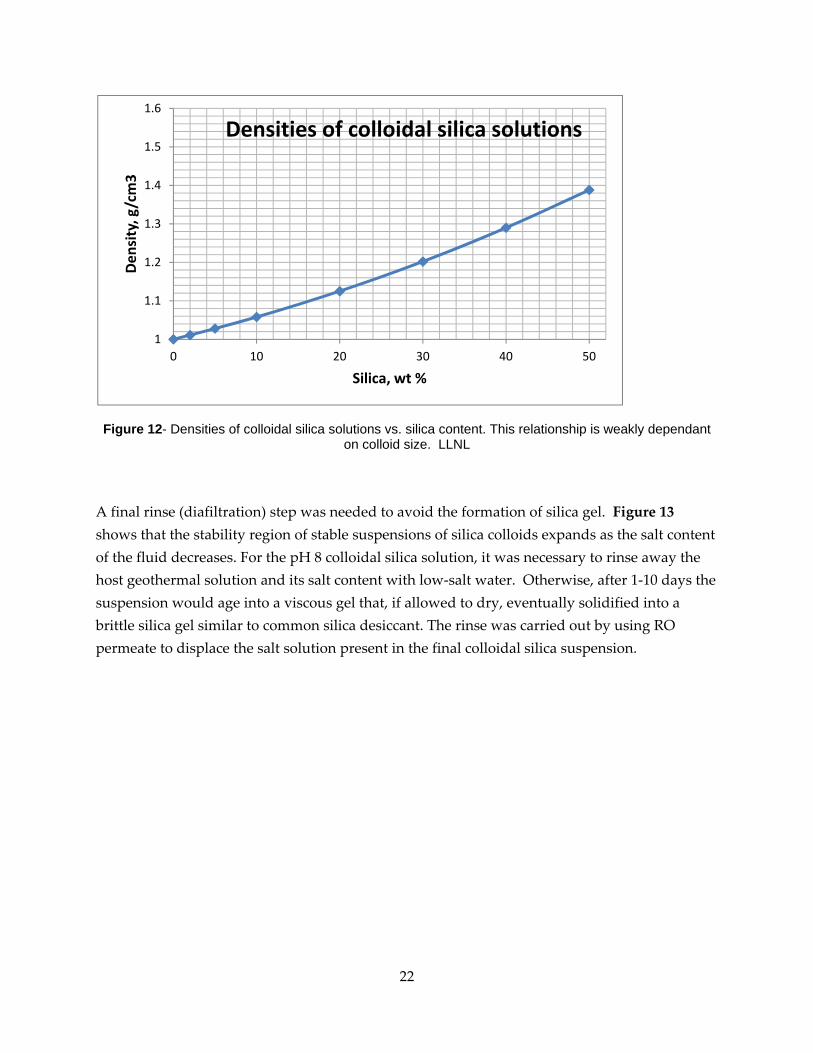
The system was run until the density of the colloidal silica solution was in the range of commercial colloidal silica solutions (10‐30 wt % corresponds to densities of 1.06 to 1.30 g/cm3, see Figure 12). Given that the system was fed an RO concentrate with about 0.1 wt % silica (1000 ppm), to get to 20 wt % silica colloids, the solution needed to be concentrated up by a factor of 20/0.1 or 200. The fluid input and UF permeate output were both monitored using flow totalizers and flow meters (GPI Industries). The colloidal silica product was monitored for density using grab samples and analyzed using either a hydrometer or a density meter.
Figure 11- Close-up of pressure vessel that houses "1812" RO-NF-UF elements (1.8" diameter by 12" length). LLNL
22
Figure 12- Densities of colloidal silica solutions vs. silica content. This relationship is weakly dependant on colloid size. LLNL
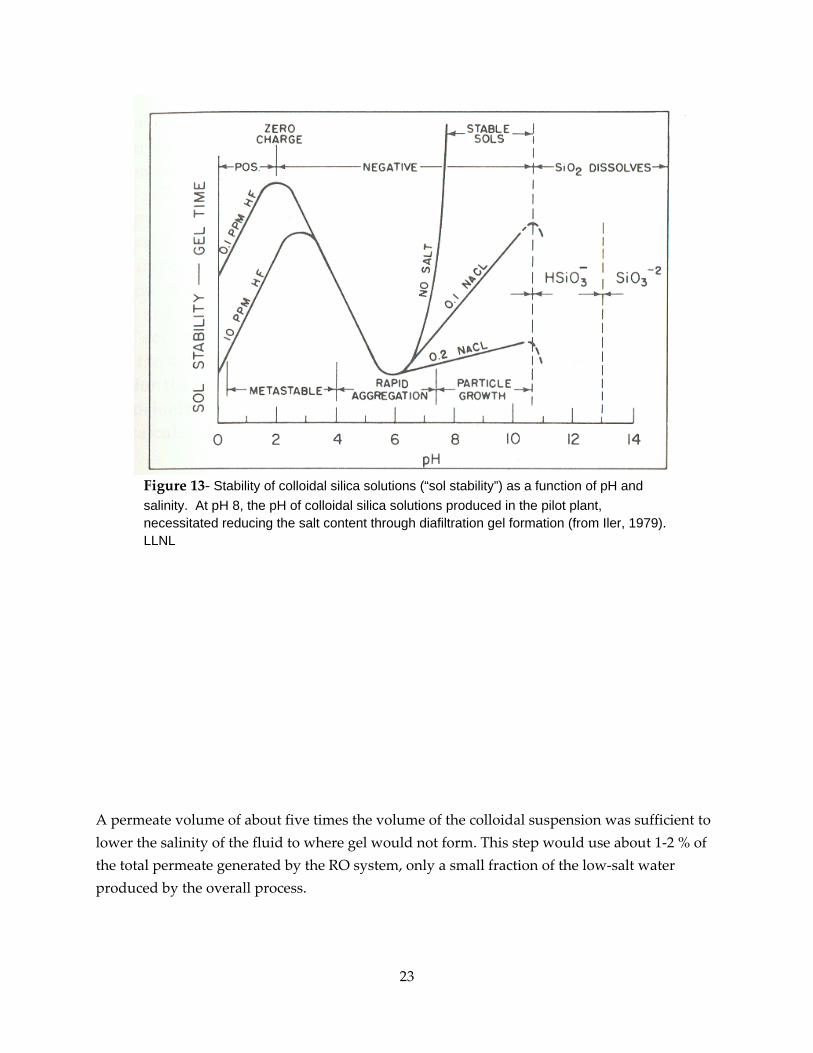
A final rinse (diafiltration) step was needed to avoid the formation of silica gel. Figure 13 shows that the stability region of stable suspensions of silica colloids expands as the salt content of the fluid decreases. For the pH 8 colloidal silica solution, it was necessary to rinse away the host geothermal solution and its salt content with low‐salt water. Otherwise, after 1‐10 days the suspension would age into a viscous gel that, if allowed to dry, eventually solidified into a brittle silica gel similar to common silica desiccant. The rinse was carried out by using RO permeate to displace the salt solution present in the final colloidal silica suspension.
1
1.1
1.2
1.3
1.4
1.5
1.6
0 10 20 30 40 50
Den
sity, g/cm3
Silica, wt %
Densities of colloidal silica solutions
23
Figure 13‐ Stability of colloidal silica solutions (“sol stability”) as a function of pH and salinity. At pH 8, the pH of colloidal silica solutions produced in the pilot plant, necessitated reducing the salt content through diafiltration gel formation (from Iler, 1979). LLNL
A permeate volume of about five times the volume of the colloidal suspension was sufficient to lower the salinity of the fluid to where gel would not form. This step would use about 1‐2 % of the total permeate generated by the RO system, only a small fraction of the low‐salt water produced by the overall process.
24
It should be added that silica gel also has commercial uses and could be produced as a lower value by‐product if necessary, for example for colloidal solutions produced at the site that did not meet market specifications for colloidal silica solutions.
Operation of Pilot Unit and Test Results The pilot unit was operated in intervals over a 6‐month period from May through October of 2008. During that time, approximately 350,000 gallons of plant feed was processed at an input rate that varied between about 15 and 25 gallons per minute. Table 3 shows the range of pH and conductivity values measured for the fluid over time. Temperature of the feed ranged from 45 to 70oC (110 to 160oF). Salt rejection was generally in the range of 90‐95% when using sea water RO elements (see Appendix 2). The salt rejection is defined as the permeate salinity divided by the mean feed salinity in percent. Early tests with brackish water elements showed salt rejections in the range of 80‐85%. Brackish water elements are a looser membrane than sea water elements and have larger pore sizes and higher water permeabilites. Although the Mammoth Lakes fluids are considered brackish, because of the high fluid temperature, which also loosens the membrane and increases water flux, the sea water elements provided the best silica and salt rejection for silica removal.
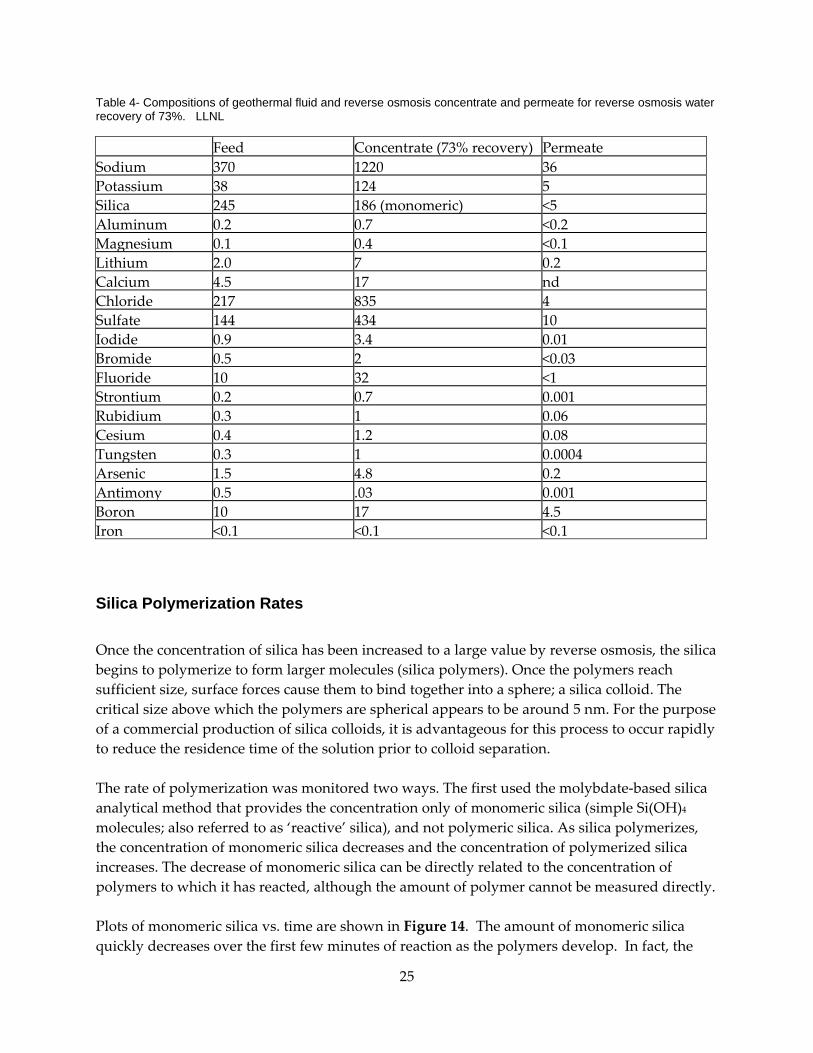
The compositions of typical fluids (feed, permeate, and concentrate) produced by the reverse osmosis unit are shown in Table 4. Silica showed high rejection with the Toray membranes. Typical silica values in the RO permeate throughout the pilot test period were in the range of 5 to 15 ppm. Total dissolved salts in the permeate were commonly less than 100 ppm.
25
Table 4- Compositions of geothermal fluid and reverse osmosis concentrate and permeate for reverse osmosis water recovery of 73%. LLNL
Feed Concentrate (73% recovery) Permeate Sodium 370 1220 36Potassium 38 124 5Silica 245 186 (monomeric) <5Aluminum 0.2 0.7 <0.2Magnesium 0.1 0.4 <0.1Lithium 2.0 7 0.2Calcium 4.5 17 ndChloride 217 835 4Sulfate 144 434 10Iodide 0.9 3.4 0.01Bromide 0.5 2 <0.03 Fluoride 10 32 <1Strontium 0.2 0.7 0.001 Rubidium 0.3 1 0.06Cesium 0.4 1.2 0.08Tungsten 0.3 1 0.0004 Arsenic 1.5 4.8 0.2Antimony 0.5 .03 0.001 Boron 10 17 4.5Iron <0.1 <0.1 <0.1
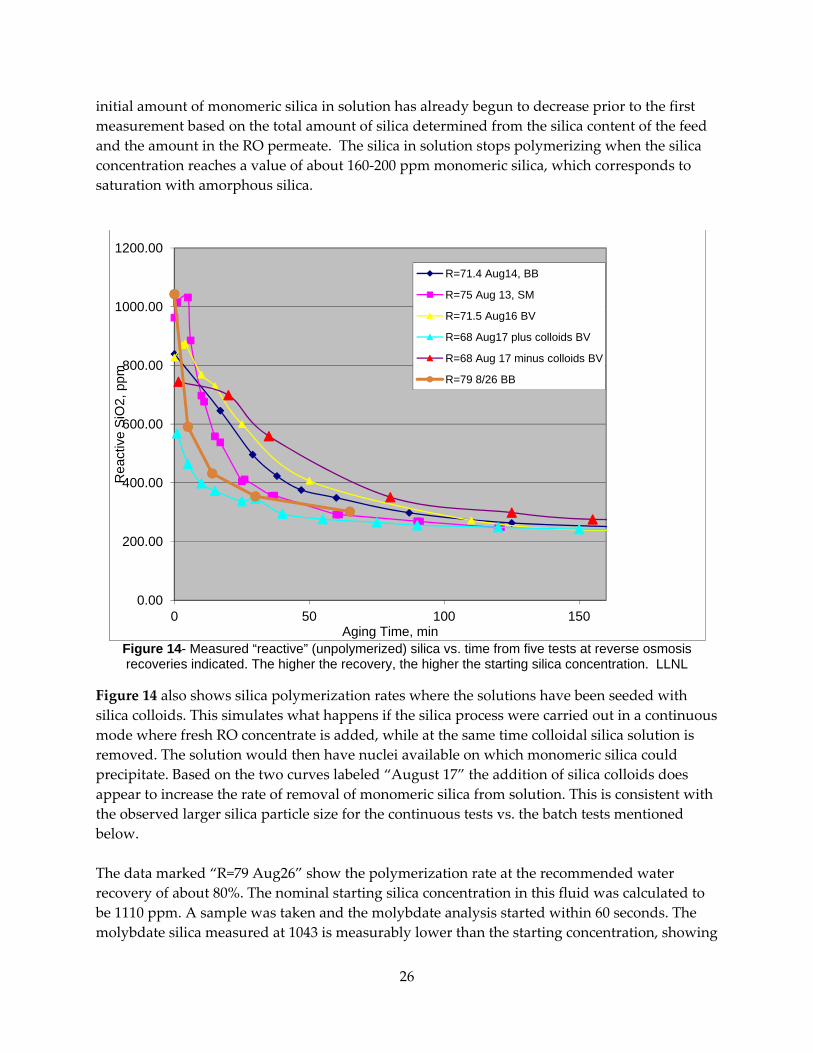
Silica Polymerization Rates Once the concentration of silica has been increased to a large value by reverse osmosis, the silica begins to polymerize to form larger molecules (silica polymers). Once the polymers reach sufficient size, surface forces cause them to bind together into a sphere; a silica colloid. The critical size above which the polymers are spherical appears to be around 5 nm. For the purpose of a commercial production of silica colloids, it is advantageous for this process to occur rapidly to reduce the residence time of the solution prior to colloid separation. The rate of polymerization was monitored two ways. The first used the molybdate‐based silica analytical method that provides the concentration only of monomeric silica (simple Si(OH)4 molecules; also referred to as ‘reactive’ silica), and not polymeric silica. As silica polymerizes, the concentration of monomeric silica decreases and the concentration of polymerized silica increases. The decrease of monomeric silica can be directly related to the concentration of polymers to which it has reacted, although the amount of polymer cannot be measured directly. Plots of monomeric silica vs. time are shown in Figure 14. The amount of monomeric silica quickly decreases over the first few minutes of reaction as the polymers develop. In fact, the
26
initial amount of monomeric silica in solution has already begun to decrease prior to the first measurement based on the total amount of silica determined from the silica content of the feed and the amount in the RO permeate. The silica in solution stops polymerizing when the silica concentration reaches a value of about 160‐200 ppm monomeric silica, which corresponds to saturation with amorphous silica.
Figure 14- Measured “reactive” (unpolymerized) silica vs. time from five tests at reverse osmosis recoveries indicated. The higher the recovery, the higher the starting silica concentration. LLNL
Figure 14 also shows silica polymerization rates where the solutions have been seeded with silica colloids. This simulates what happens if the silica process were carried out in a continuous mode where fresh RO concentrate is added, while at the same time colloidal silica solution is removed. The solution would then have nuclei available on which monomeric silica could precipitate. Based on the two curves labeled “August 17” the addition of silica colloids does appear to increase the rate of removal of monomeric silica from solution. This is consistent with the observed larger silica particle size for the continuous tests vs. the batch tests mentioned below. The data marked “R=79 Aug26” show the polymerization rate at the recommended water recovery of about 80%. The nominal starting silica concentration in this fluid was calculated to be 1110 ppm. A sample was taken and the molybdate analysis started within 60 seconds. The molybdate silica measured at 1043 is measurably lower than the starting concentration, showing
0.00
200.00
400.00
600.00
800.00
1000.00
1200.00
0 50 100 150
Rea
ctiv
e S
iO2,
ppm
Aging Time, min
R=71.4 Aug14, BB
R=75 Aug 13, SM
R=71.5 Aug16 BV
R=68 Aug17 plus colloids BV
R=68 Aug 17 minus colloids BV
R=79 8/26 BB
27
that at high silica starting concentrations, polymerization is very rapid. The starting silica concentrations should be as high as possible to reduce polymerization rates, but not so high that membrane fouling occurs. The data for 80% recovery suggest that 15‐20 minutes of aging are needed for over half the silica to polymerize. The second method used for monitoring the rate of polymerization (rate of formation of silica colloids) was light scattering using a particle size analyzer from Brookhaven Instruments. Dynamic light scattering (DLS) can be used to detect particles down to a few nanometers in size, but the particles must be at fairly high concentrations. For silica colloids, it was determined using commercial colloidal silica solutions that about 0.2 wt % silica is needed in order to detect and measure colloid size. The starting concentrate solution coming off the RO unit had about 1000 ppm silica or about 0.1 wt % silica. Thus the colloids remained undetected until they had been concentrated up into the detection range by the UF system. For batch tests, the DLS results generally showed that the process produced colloids of about 20 nm in diameter, about twice the size determined using TEM imaging (discussed below) which were generally around 10 nm. For a continuous test, a a mean colloid size of around 40 nm was measured, larger than colloid sizes for the batch test results. This suggests that once colloids formed, adding continuous feed would tend to grow the existing colloids rather than add new colloids to the solution. A continuous process could be useful for growing larger colloids than the 10 nm size that tends to form in the Mammoth Lakes fluids with batch processing. These colloid sizes are within the size range of marketable colloids, which ranges from 8 to over 200 nm.
Transmission electron microscopy (TEM) imaging of silica colloids
Samples of colloidal silica solutions from the pilot tests were sent to the Robert P. Apkarian Center for Microscopy at Emory University for TEM imaging. TEM uses an electron beam to image small particles and is the best quantitative method for measuring colloid size and size distribution. Jeanette Taylor carried out the imaging.
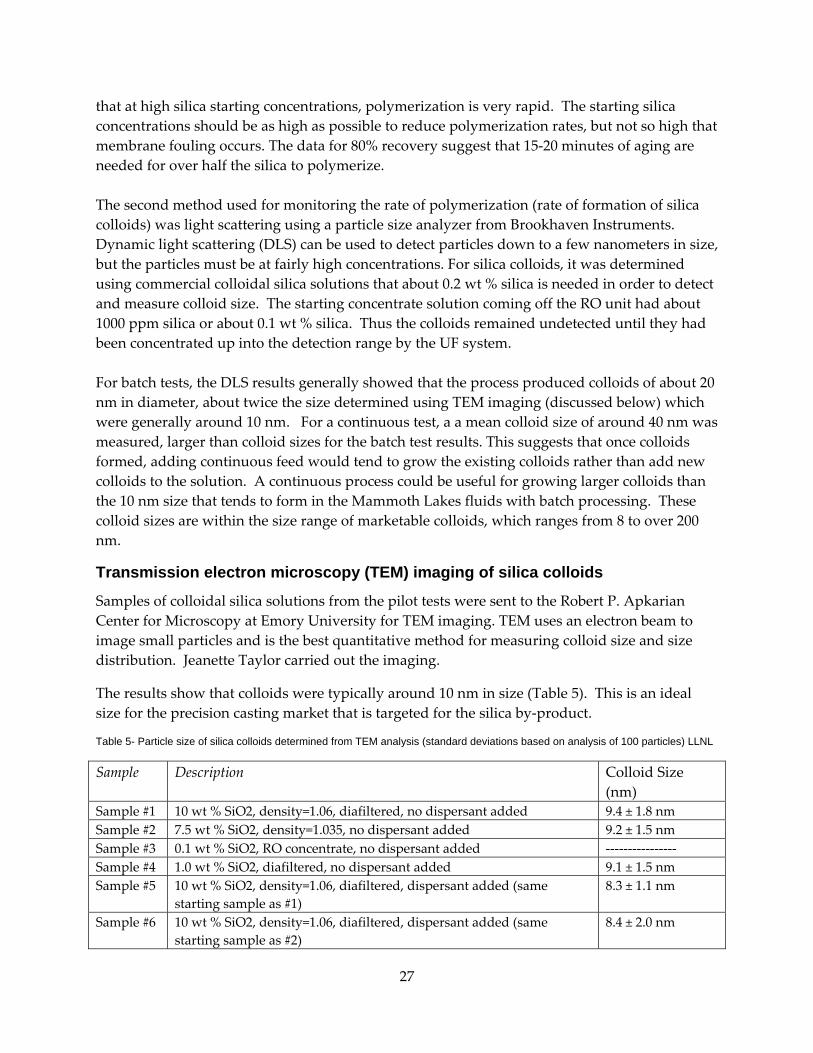
The results show that colloids were typically around 10 nm in size (Table 5). This is an ideal size for the precision casting market that is targeted for the silica by‐product.
Table 5- Particle size of silica colloids determined from TEM analysis (standard deviations based on analysis of 100 particles) LLNL
Sample Description Colloid Size (nm)
Sample #1 10 wt % SiO2, density=1.06, diafiltered, no dispersant added 9.4 ± 1.8 nm Sample #2 7.5 wt % SiO2, density=1.035, no dispersant added 9.2 ± 1.5 nm Sample #3 0.1 wt % SiO2, RO concentrate, no dispersant added ‐‐‐‐‐‐‐‐‐‐‐‐‐‐‐‐ Sample #4 1.0 wt % SiO2, diafiltered, no dispersant added 9.1 ± 1.5 nm Sample #5 10 wt % SiO2, density=1.06, diafiltered, dispersant added (same
starting sample as #1) 8.3 ± 1.1 nm
Sample #6 10 wt % SiO2, density=1.06, diafiltered, dispersant added (same starting sample as #2)
8.4 ± 2.0 nm
28
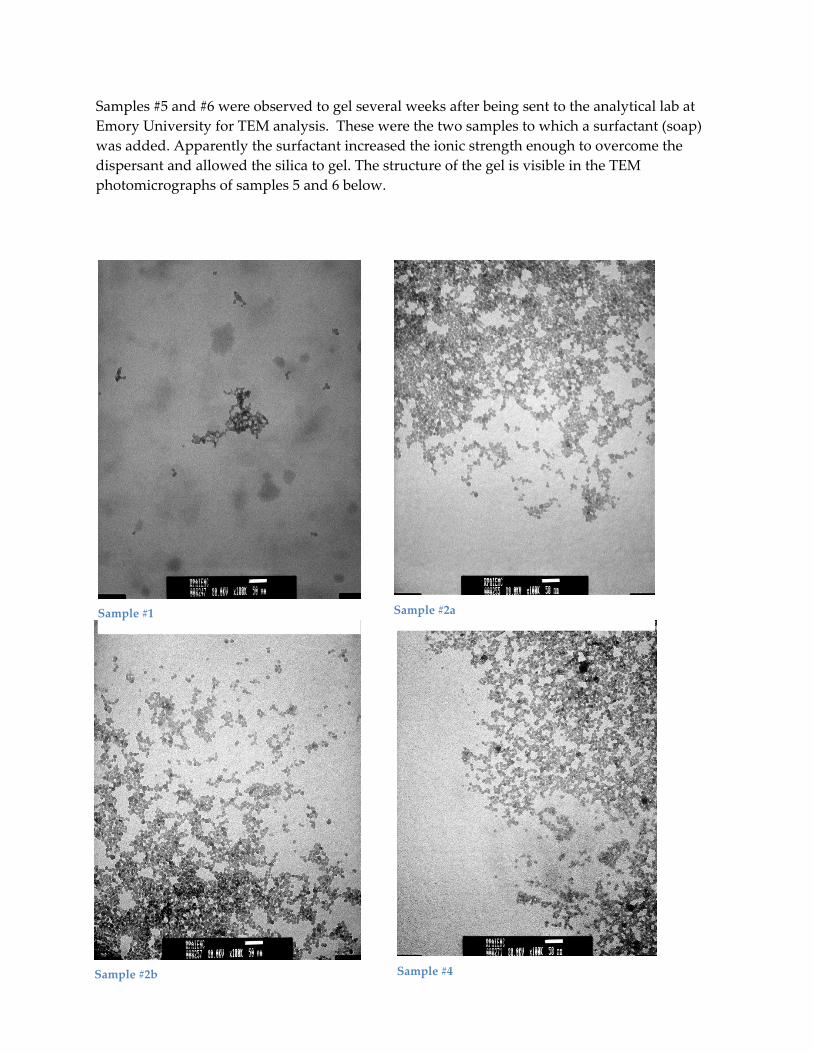
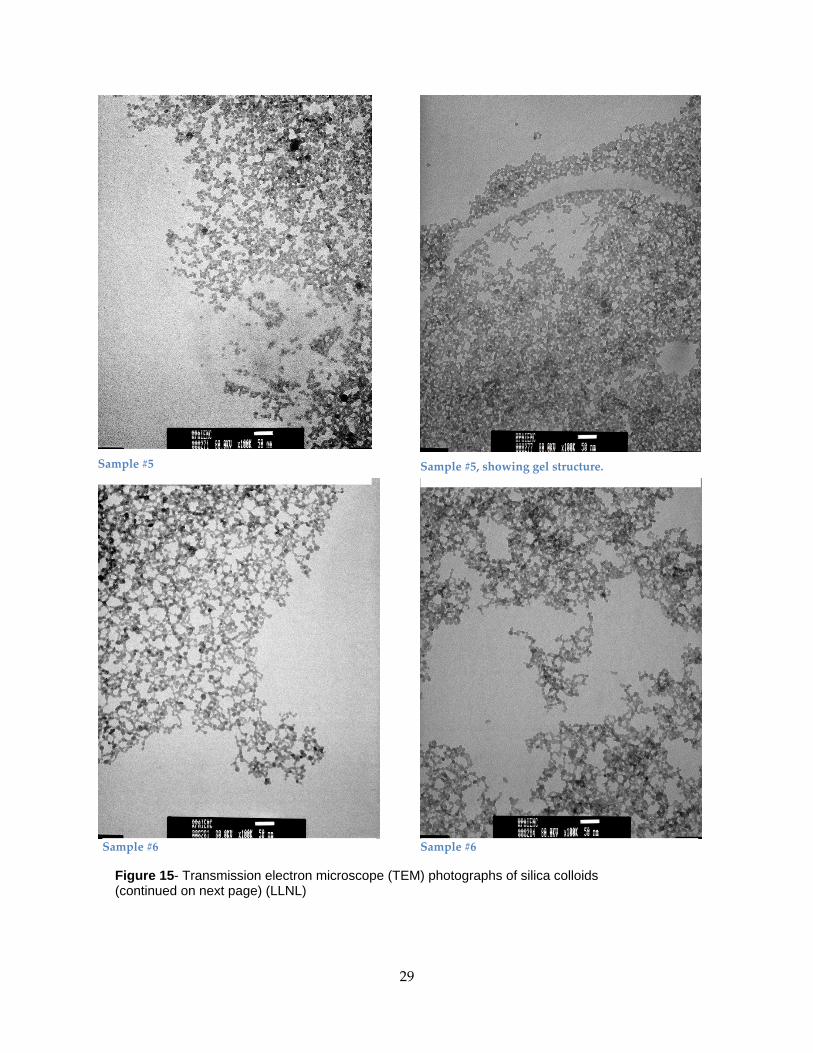
Samples #5 and #6 were observed to gel several weeks after being sent to the analytical lab at Emory University for TEM analysis. These were the two samples to which a surfactant (soap) was added. Apparently the surfactant increased the ionic strength enough to overcome the dispersant and allowed the silica to gel. The structure of the gel is visible in the TEM photomicrographs of samples 5 and 6 below.
Sample #1 Sample #2a
Sample #2b Sample #4
29
Sample #5 Sample #5, showing gel structure.
Sample #6 Sample #6
Figure 15- Transmission electron microscope (TEM) photographs of silica colloids (continued on next page) (LLNL)
30
When concentrating the colloids, both 30 and 1‐2 gpm UF systems were used, both of which had their feed tanks outside and were susceptible to windblown dust. For this reason, the images have a noticeable amount of contaminants. This would not be an issue for a system if it were indoors and better protected from outside contaminants. Images for sample #3 showed only the contaminants; no silica colloids were imaged, thus those images were not included.
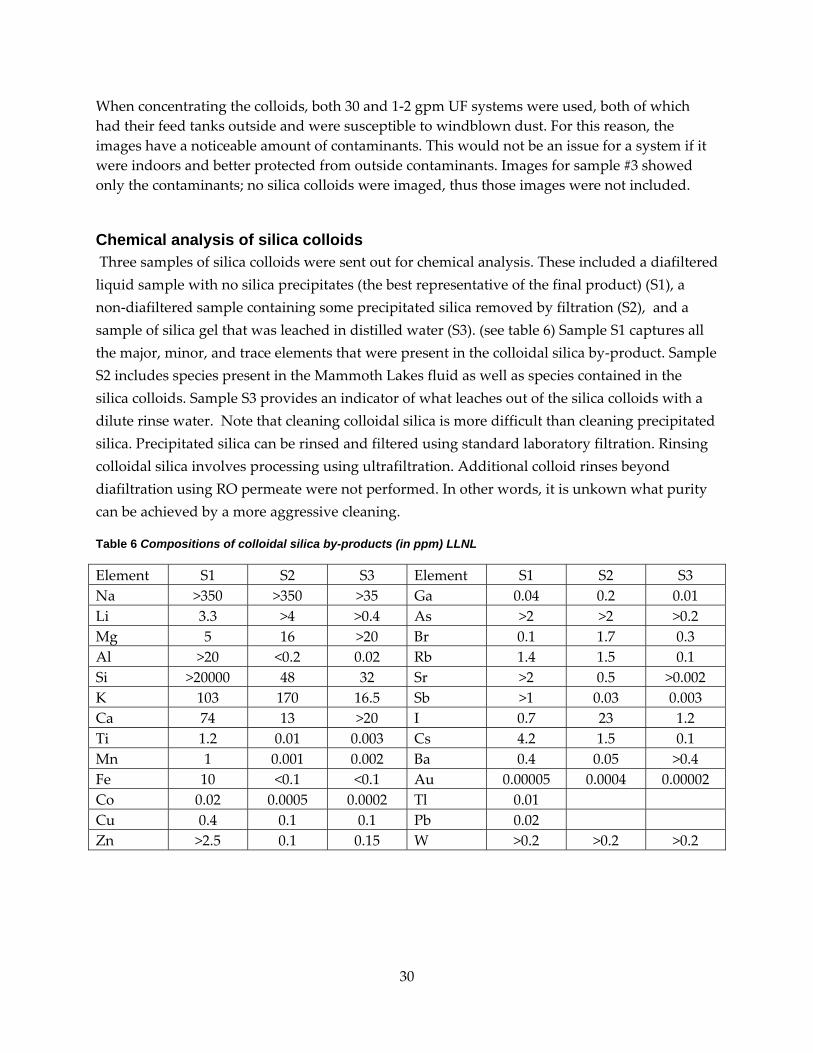
Chemical analysis of silica colloids Three samples of silica colloids were sent out for chemical analysis. These included a diafiltered liquid sample with no silica precipitates (the best representative of the final product) (S1), a non‐diafiltered sample containing some precipitated silica removed by filtration (S2), and a sample of silica gel that was leached in distilled water (S3). (see table 6) Sample S1 captures all the major, minor, and trace elements that were present in the colloidal silica by‐product. Sample S2 includes species present in the Mammoth Lakes fluid as well as species contained in the silica colloids. Sample S3 provides an indicator of what leaches out of the silica colloids with a dilute rinse water. Note that cleaning colloidal silica is more difficult than cleaning precipitated silica. Precipitated silica can be rinsed and filtered using standard laboratory filtration. Rinsing colloidal silica involves processing using ultrafiltration. Additional colloid rinses beyond diafiltration using RO permeate were not performed. In other words, it is unkown what purity can be achieved by a more aggressive cleaning.
Table 6 Compositions of colloidal silica by-products (in ppm) LLNL
Element S1 S2 S3 Element S1 S2 S3 Na >350 >350 >35 Ga 0.04 0.2 0.01 Li 3.3 >4 >0.4 As >2 >2 >0.2 Mg 5 16 >20 Br 0.1 1.7 0.3 Al >20 <0.2 0.02 Rb 1.4 1.5 0.1 Si >20000 48 32 Sr >2 0.5 >0.002 K 103 170 16.5 Sb >1 0.03 0.003 Ca 74 13 >20 I 0.7 23 1.2 Ti 1.2 0.01 0.003 Cs 4.2 1.5 0.1 Mn 1 0.001 0.002 Ba 0.4 0.05 >0.4 Fe 10 <0.1 <0.1 Au 0.00005 0.0004 0.00002 Co 0.02 0.0005 0.0002 Tl 0.01 Cu 0.4 0.1 0.1 Pb 0.02 Zn >2.5 0.1 0.15 W >0.2 >0.2 >0.2
31
The data shows that the diafiltered sample (S1) is very clean. All measured elements are below
100 ppm except for sodium, potassium, and possibly aluminum. Arsenic and antimony were
above the very low upper quantification limit of ICP‐MS. The sample would need to be re‐run
to determine their concentrations. The rest of the elements are low enough to not be of concern
for the likely colloidal silica markets.
Operational issues
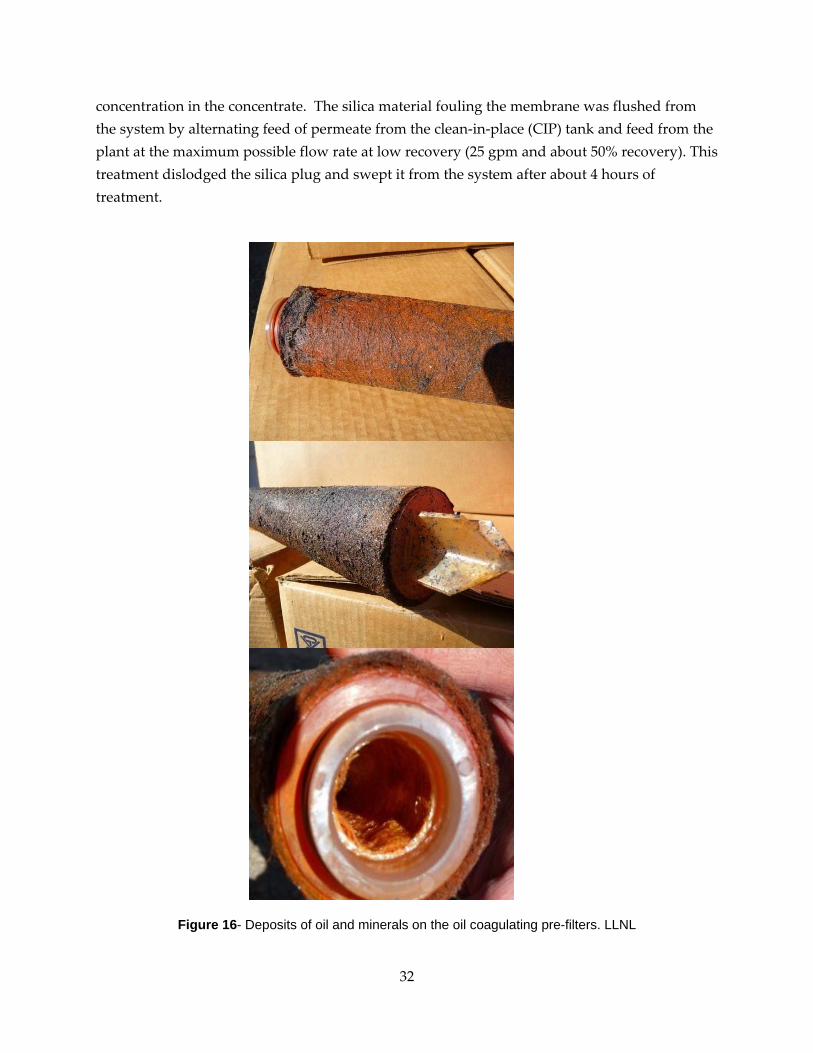
During the first phase of the silica recovery project, dark‐colored silica precipitates were observed. The investigations indicated that the coloration was caused by contamination with oil, probably pump oil from down‐hole production pumps. During the pilot tests a 20‐inch oil coalescing filter upstream from the RO membranes was used to prevent contact with the oil. Periodically the filters were removed and examined by sectioning them to determine the depth of penetration of the oil. We determined that to safely avoid any chance of oil contacting and fouling the RO membranes, the filter should be replaced after 3‐4 days of continuous use at 20 gpm. Figure 26 shows the used filters, covered with a combination of oil and also mineral deposits from the geothermal fluid.
There were two situations where the RO membranes were accidently fouled by precipitation of silica. The first situation was caused by a broken valve stem in a three‐way CPVC valve that supplied either plant feed or clean permeate to the RO membranes. Although the valve was thought to be fully open, in fact it was partially closed and only a reduced flux of geothermal fluid was being fed into the system. At this slow flow rate (substantially less than design flux of 20 gpm), the large area of RO membrane essentially concentrated the feed to a very high degree. This also concentrated the silica to high values, it was estimated that in this case to be several thousand ppm. The silica quickly polymerized at this high concentration and precipitated (gelled) in the feed channels blocking further flow. Examination of the RO elements showed that the last eight‐inch RO element (number six of six) was filled with viscous silica gel.
Fortunately the fouling was not irreversible. Once the element was drained and allowed to partially dry, the silica was easily flushed and the permeability returned to normal. This suggests that silica fouling due to this type of upset could easily be overcome with simple rinsing and reinsertion of the RO elements.
The second fouling incident was caused by a reduction in the feed to the RO system due to a problem with the concentrate reinjection pump. A plant engineer noticed an overflow problem with the reinjection tank and reduced the feed flow to the pilot plant. This happened while the pilot was running overnight, unattended by staff. The reduced flow caused a problem very similar to that described above for the broken valve, very high recovery and high silica
32
concentration in the concentrate. The silica material fouling the membrane was flushed from the system by alternating feed of permeate from the clean‐in‐place (CIP) tank and feed from the plant at the maximum possible flow rate at low recovery (25 gpm and about 50% recovery). This treatment dislodged the silica plug and swept it from the system after about 4 hours of treatment.
Figure 16- Deposits of oil and minerals on the oil coagulating pre-filters. LLNL
33
It was concluded that although silica fouling of the membrane channels is possible, it is fairly easily to recover from this type of fouling and do not see it as a major disadvantage to the process.
However, as mentioned previously, fouling of the membrane itself (vs. the channels) at high water recoveries (85% or greater) was not reversible by in‐situ flushing and would pose a more difficult challenge if such higher recoveries were necessary for efficient silica extraction. However, this is not the case.
Economic Analysis
LLNL’s economic analysis is based on a facility for silica recovery from a geothermal fluid feed of 18 MGD (million gallons per day) which is close to the average total fluid flux at the Mammoth Pacific power plant. The intended goal is an analysis that provides the cost benefits for construction of a new power plant that utilizes the silica recovery process both to generate a silica by‐product and to generate a low salt fluid suitable for wet cooling. However, e the information needed to take credit for the economic benefits of the value of the water by‐product, either though increased power production, or market value of the water was not avaliable. For most geothermal plants, the fluid must be re‐injected to maintain reservoir pressure and fluid production, so that sale of the pure water by‐product may not be an option. However, water swaps are possible where non‐potable water is available locally that might be used for reinjection, and the higher‐quality RO permeate used for municipal or agricultural needs. In any case, the value of the water remains to be added to the analysis of the economic benefits of silica co‐production.
Cost Estimates
Two methods were used to estimate costs for the silica recovery process. The first was to use existing software for estimating costs for water treatment plants (WTCOST, Moch, 2005). The estimator provides for both capital and operating costs. The user provides the details of construction costs via cost indices that can be obtained from published sources such as ENR (the Engineering News Record Construction Costs Index). The process uses two unit processes commonly used in water treatment; RO and UF. Thus this program was thought to be very useful to estimate costs, although some provisions were made to adjust the results to account for differences between the pilot plant process and typical water treatment plants. For example, a disinfection and chlorination step was not included because the permeate was not intended
34
for use as drinking water. WTCOST was developed by Irving Moch & Associates under contract to the U.S. Bureau of Reclamation.
The second method utilized an experienced consultant (Larry Lien of Membrane Development Specialists) who provided a spreadsheet‐based analysis of operating costs based on his knowledge of membrane treatment costs for a wide variety of industrial and commercial applications. Both of these cost estimates provided for all the major operating costs, such as labor, membrane replacement, electricity, pumps and pumping costs, chemicals for cleaning, anti‐scalants and dispersants for process control, membrane cleaning and replacement costs (RO, UF and filtration), membrane pressure vessels, water needed for processing, laboratory services, training, insurance, and all labor and overhead costs. The actual costs are provided in the figures below which were taken directly from the cost estimator code output. The capital cost estimates, besides estimating the plant costs, also provide for buildings, including an administrative area, architectural and engineering design of the plant, site work, and interest on construction and bond financing. Table 7 summarizes the estimated input parameters for the cost analysis. Figures 17 and 18 provide a detailed summary of the cost estimates of the two methods.
Table 7- Cost indices LLNL
Electricity $0.07 kilowatt‐hour Labor $45.30 hourly Overhead 44 percent RO membranes $800 8” element ENR Steel cost 37 $/cwt ENR Cement cost 110 $/ton
WTCOST implicitly assumes that the ultrafiltration system is used to pre‐treat the water prior to reverse osmosis desalination. For this reason, two separate WTCOST realizations were used then costs were added to obtain the total costs. WTCOST also assumes some fixed parameters for UF used to determine energy costs and membrane surface area. When UF is used to as a pre‐treatment step, it is generally used at very low pressure (10‐20 psi) and high recoveries. When used to separate silica colloids, it is run at high pressures of 100‐120 psi with high cross‐flow velocities of 12 fps or more, and recycling of the fluid past the membranes. To account for the costs associated with these operating conditions, $600,000 per year of additional electricity cost was added and the water flux through the membrane to was increased to 100 GFD (gallons per square foot per day) to improve estimates. The increased electrical cost was determined using the total power needs for UF provided by the MDS estimated power need (HWPT estimator) using an energy cost of seven cents per kilowatt‐hour.
35
Pilot testing results provided key input to obtain the capital and operating cost estimates summarized in Table 8. For example, no sign of membrane deterioration or fouling over several months of operation was exhibited. Based on these observations, a six month RO membrane lifetime analysis was used, although it is strongly believed the membranes will last longer than this. In the proposed process, the membranes experience fairly benign operating conditions; low pressures of 100‐ 150 psi, and low salinity, neutral pH fluids. In the pilot tests, membrane water flux was in the range of 2‐4 GFD (gallons per square foot per day), values much lower and therefore safer than the 10‐12 GFD recommended upper limit for the membranes, again supporting a longer expected membrane lifetime. The major concern for membrane longevity is silica fouling, and no indication of any fouling in the tests up to water recoveries of 80% was perceived.
The UF membranes are known to last about 6 months based on information obtained from commercial silica colloid manufacturers. The UF membranes tend to erode way with time due to the scouring action of the silica colloids, eventually losing their functionality. The RO membranes are not subjected to the scouring because the colloids form after the fluid exits the RO modules.
Table 8- shows a summary of the results of the cost analysis in U.S. dollars. LLNL
Table 8. Estimated costs for full‐scale (18 MGD) silica extraction facility at Mammoth Lakes. Capital Costs (WTCOST) Operating Costs Direct Indirect Total WTCOST est. MDS est. RO $16,136,000 $5,163,000 $21,299,000 $13,437,000 $10,608,000 UF & Diafiltration $2,685,000 $859,000 $3,544,000 $2,597,000 $4,992,000 Totals $18,821,000 $6,022,000 $24,843,000 $16,034,000 $15,600,000
A major uncertainty is staffing. It was assumed in both cost analyses a staff of 20 full time employees. This is close in number to the current staff of 23 at the Mammoth Lakes Power Plant. Based on the MPLP staffing and analysis of the staffing typical for water treatment plants, it is believed 20 is a conservative upper maximum for the staffing level at a silica plant processing 18 MGD of water.
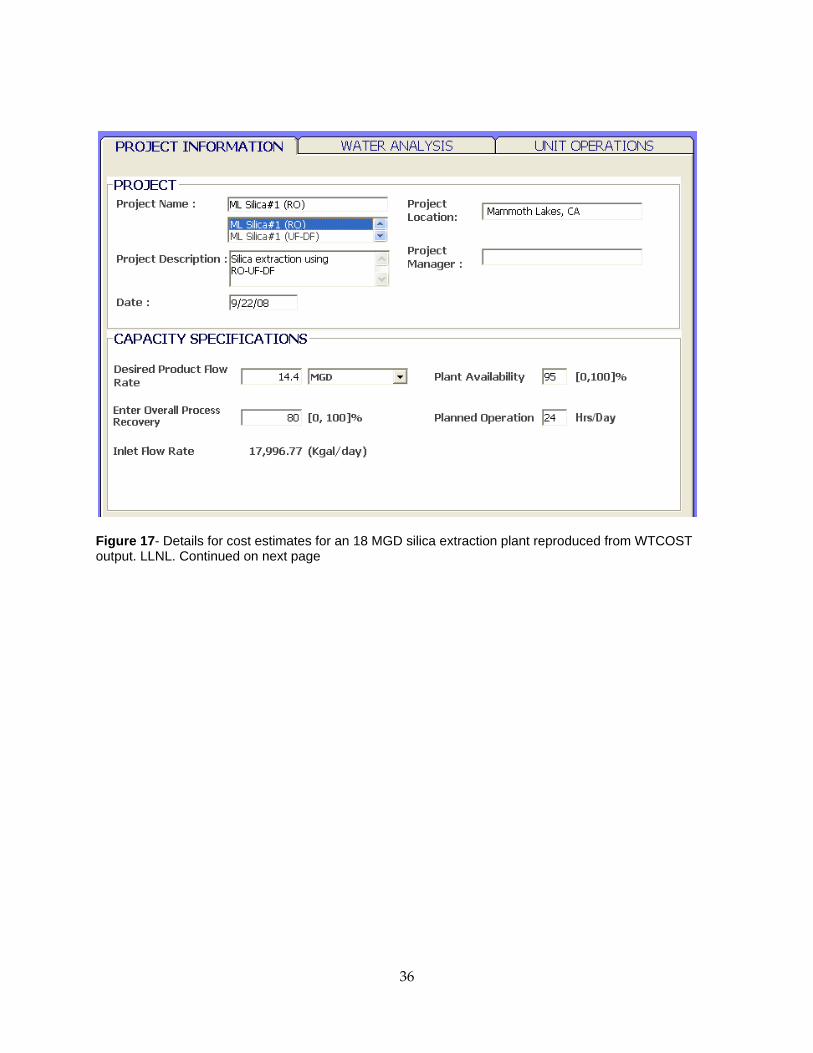
36
Figure 17- Details for cost estimates for an 18 MGD silica extraction plant reproduced from WTCOST output. LLNL. Continued on next page
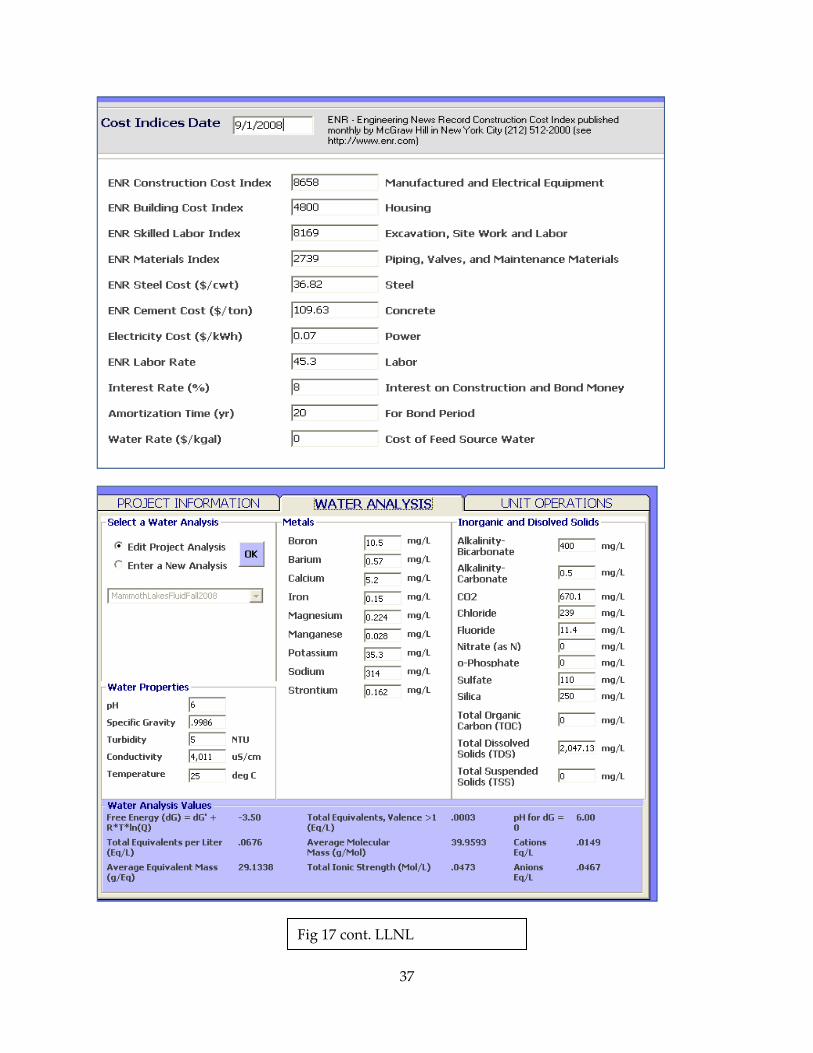
37
Fig 17 cont. LLNL
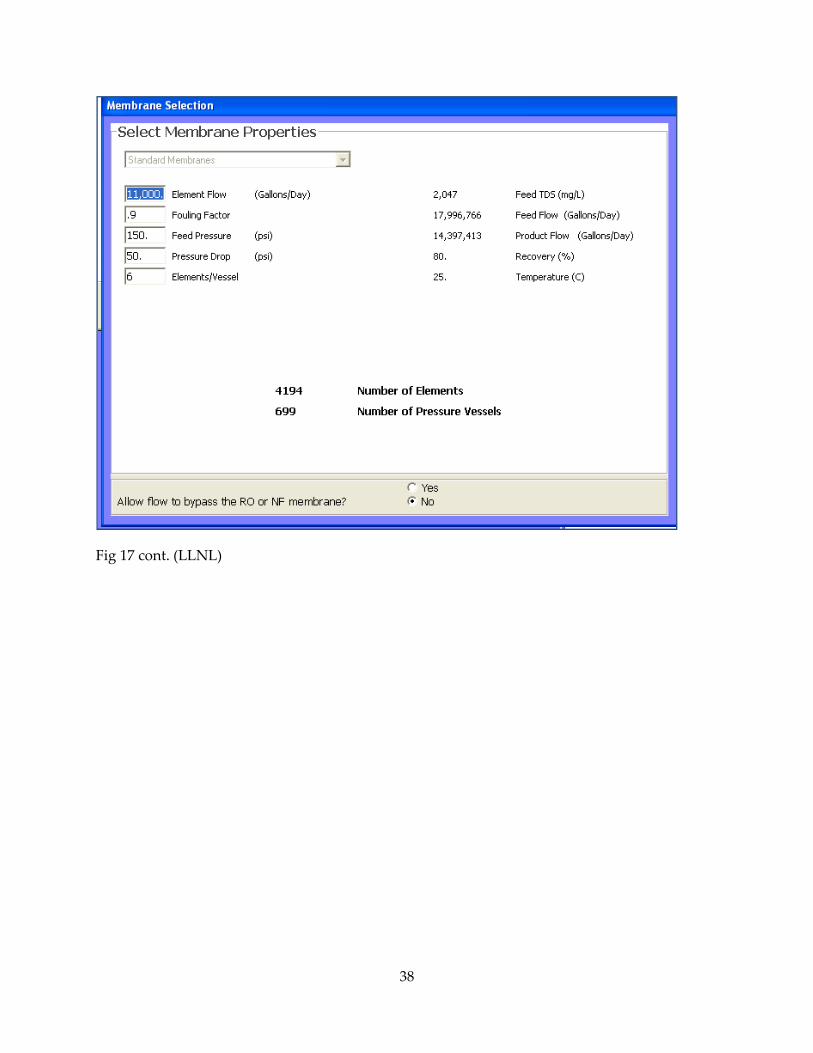
38
Fig 17 cont. (LLNL)
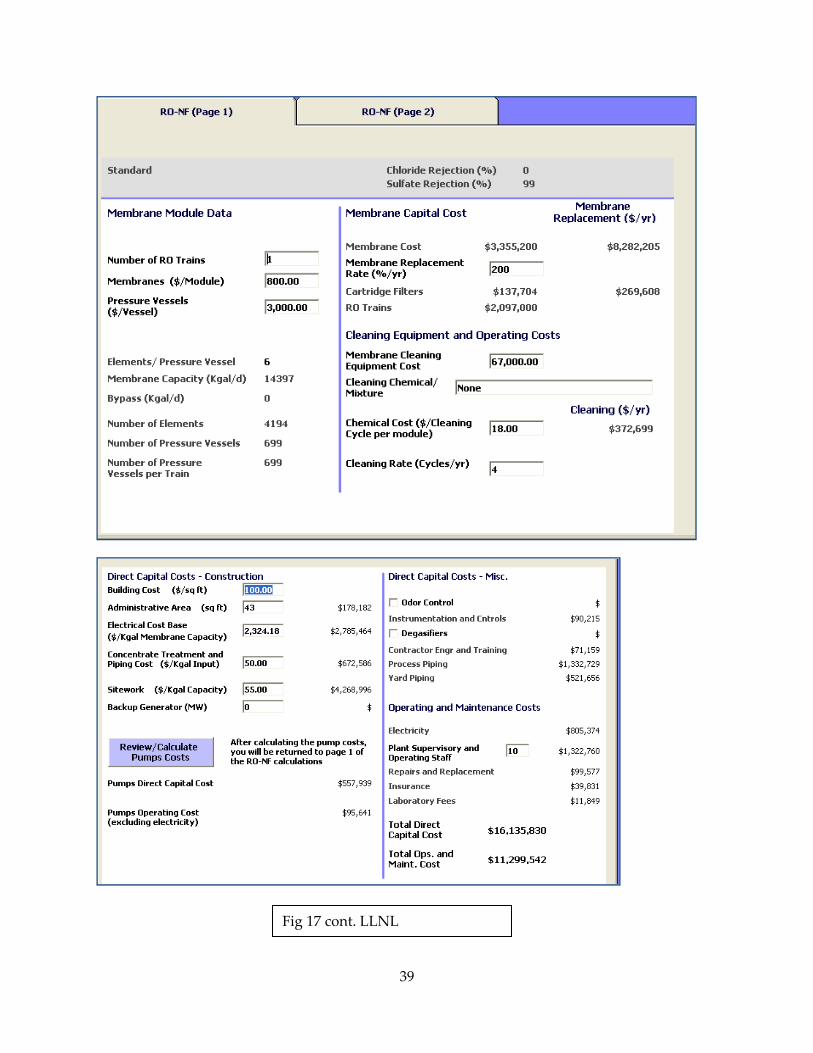
39
Fig 17 cont. LLNL
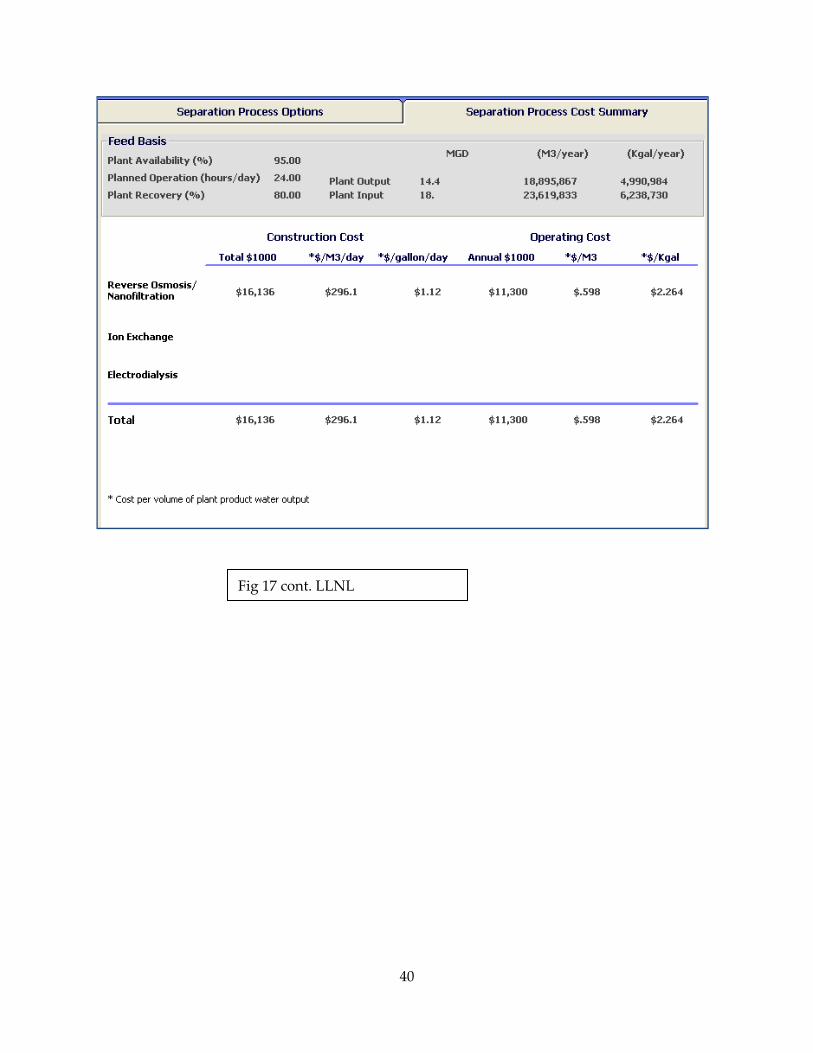
40
Fig 17 cont. LLNL
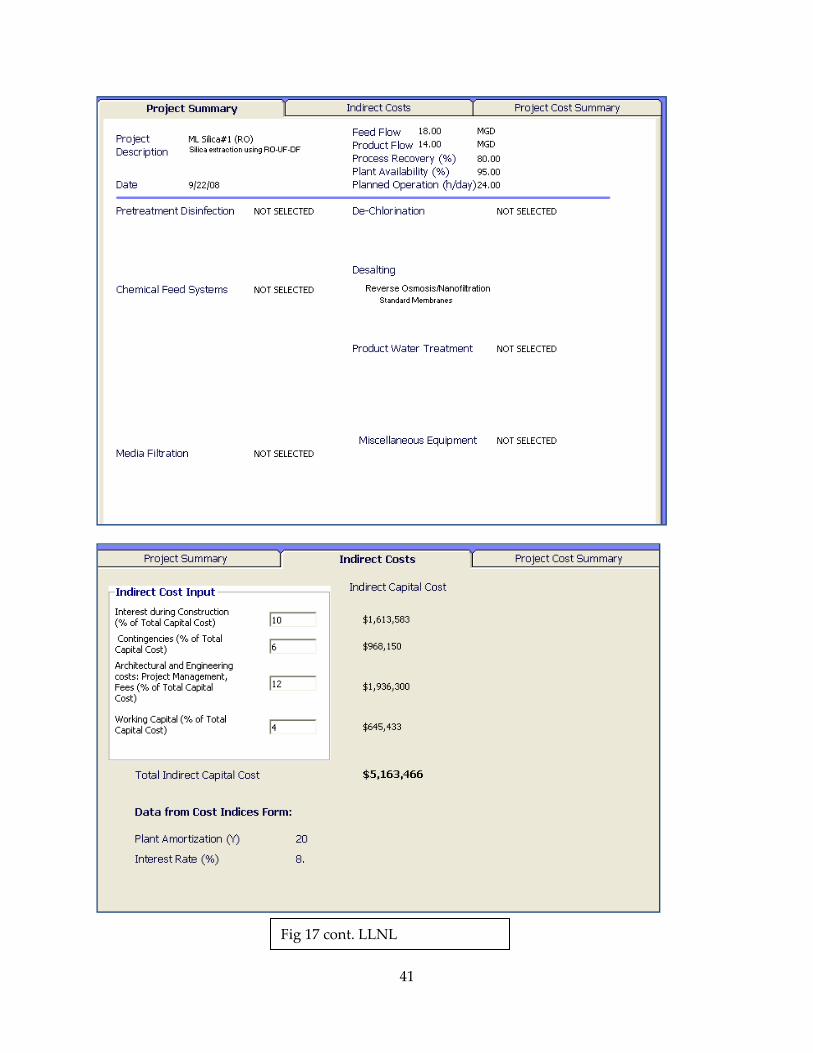
41
Fig 17 cont. LLNL
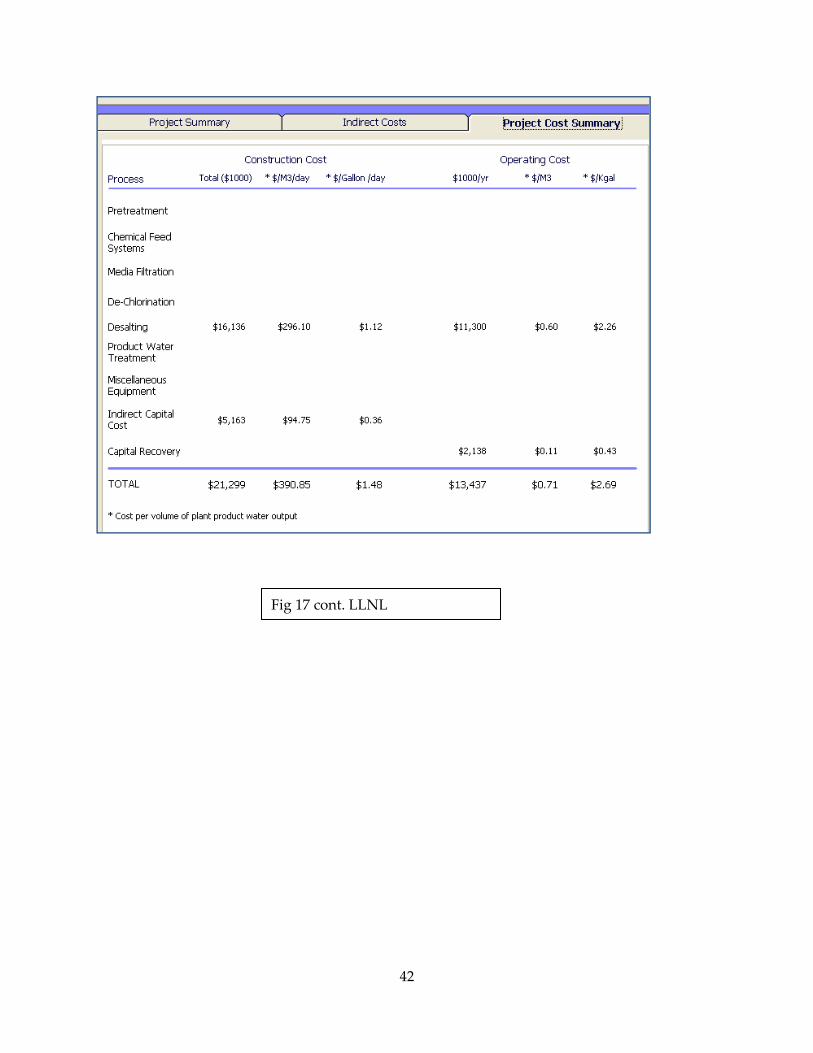
42
Fig 17 cont. LLNL
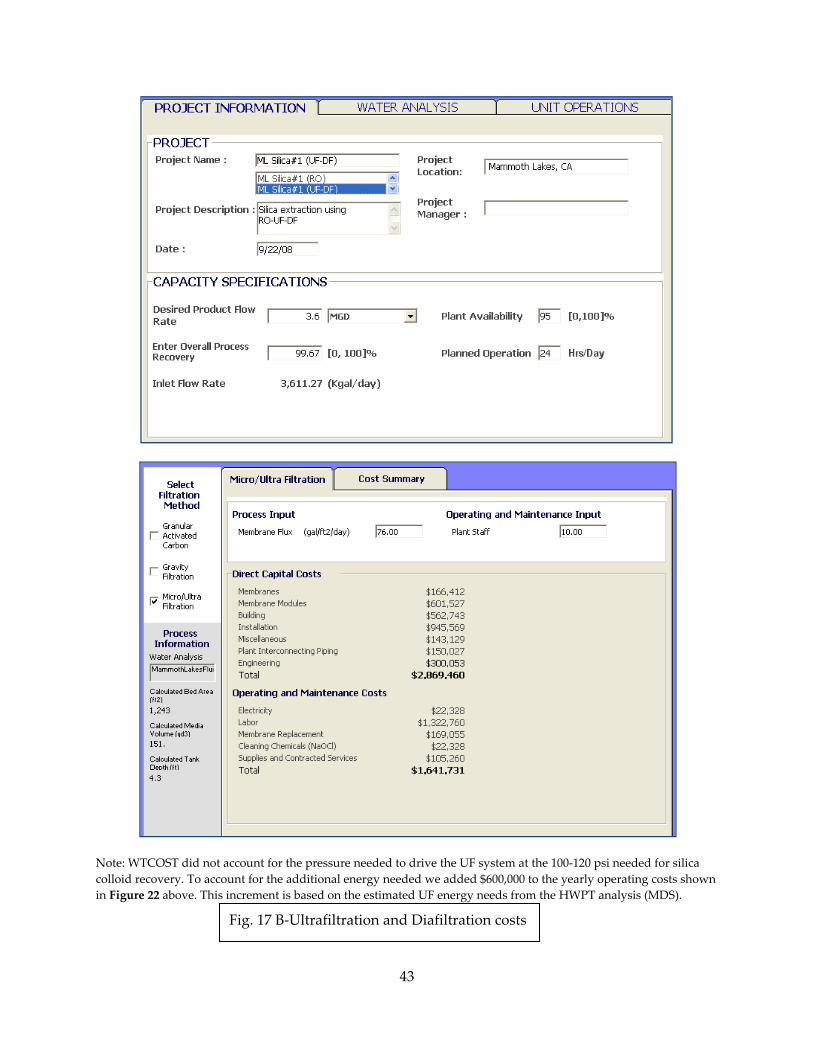
43
Note: WTCOST did not account for the pressure needed to drive the UF system at the 100‐120 psi needed for silica colloid recovery. To account for the additional energy needed we added $600,000 to the yearly operating costs shown in Figure 22 above. This increment is based on the estimated UF energy needs from the HWPT analysis (MDS).
Fig. 17 B‐Ultrafiltration and Diafiltration costs
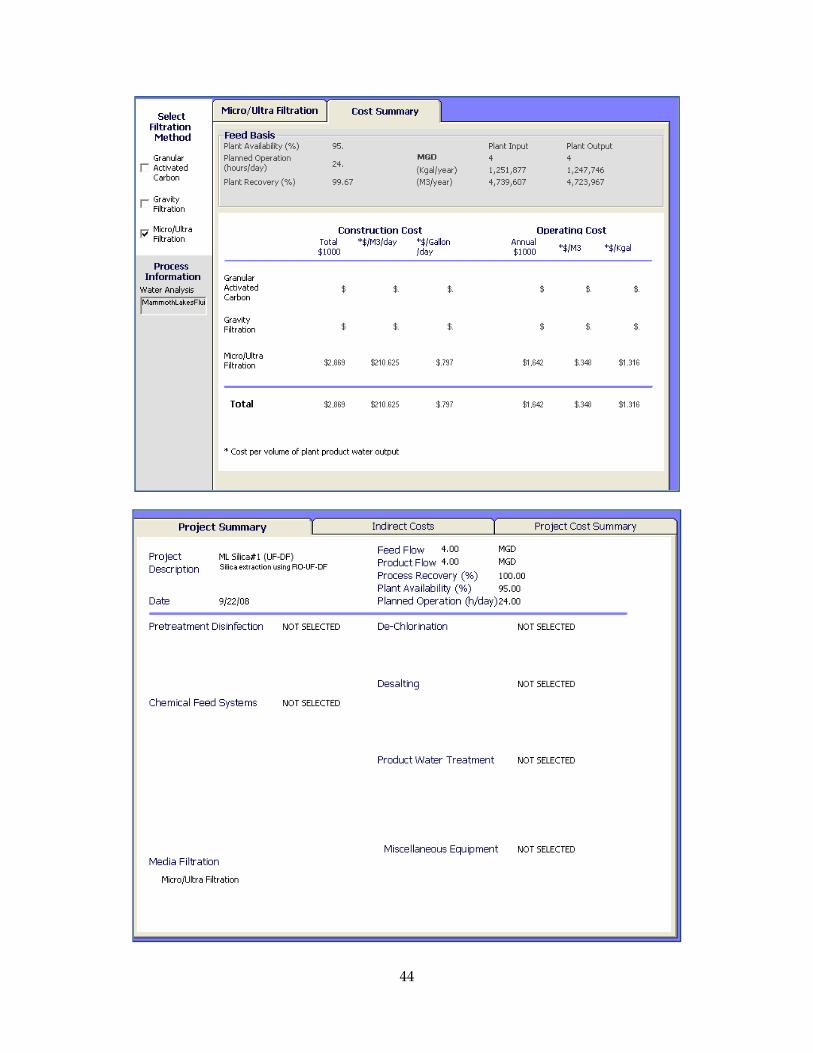
44
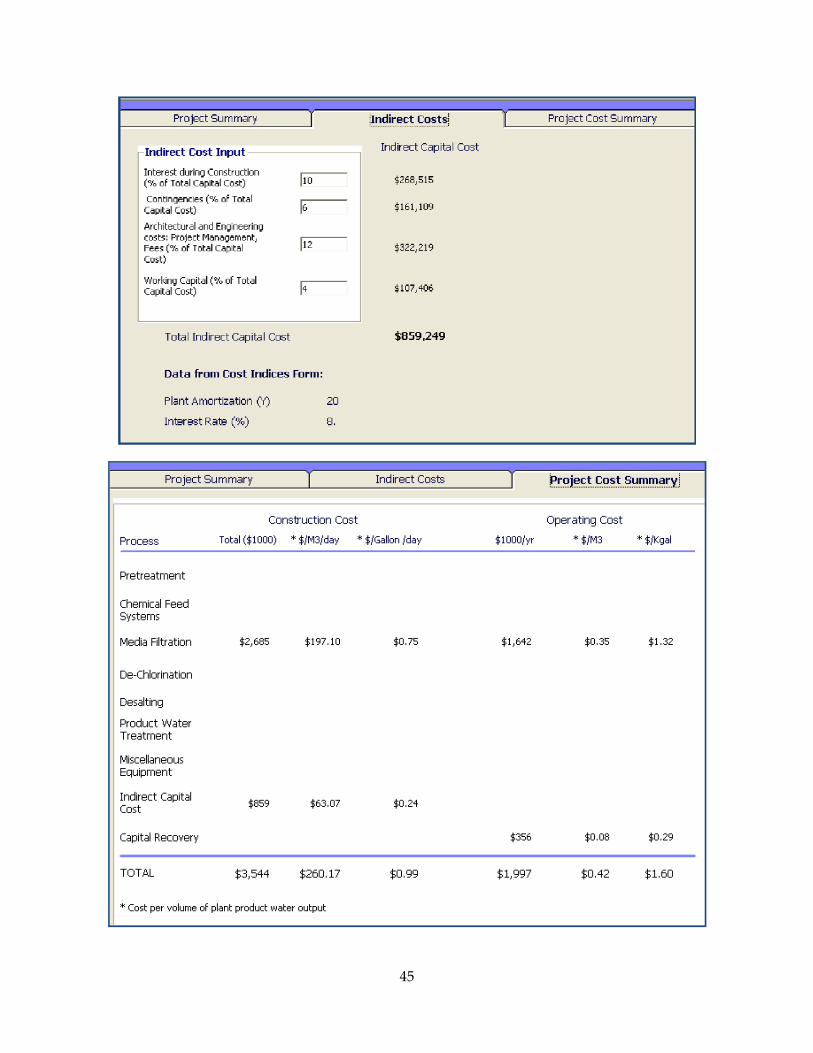
45
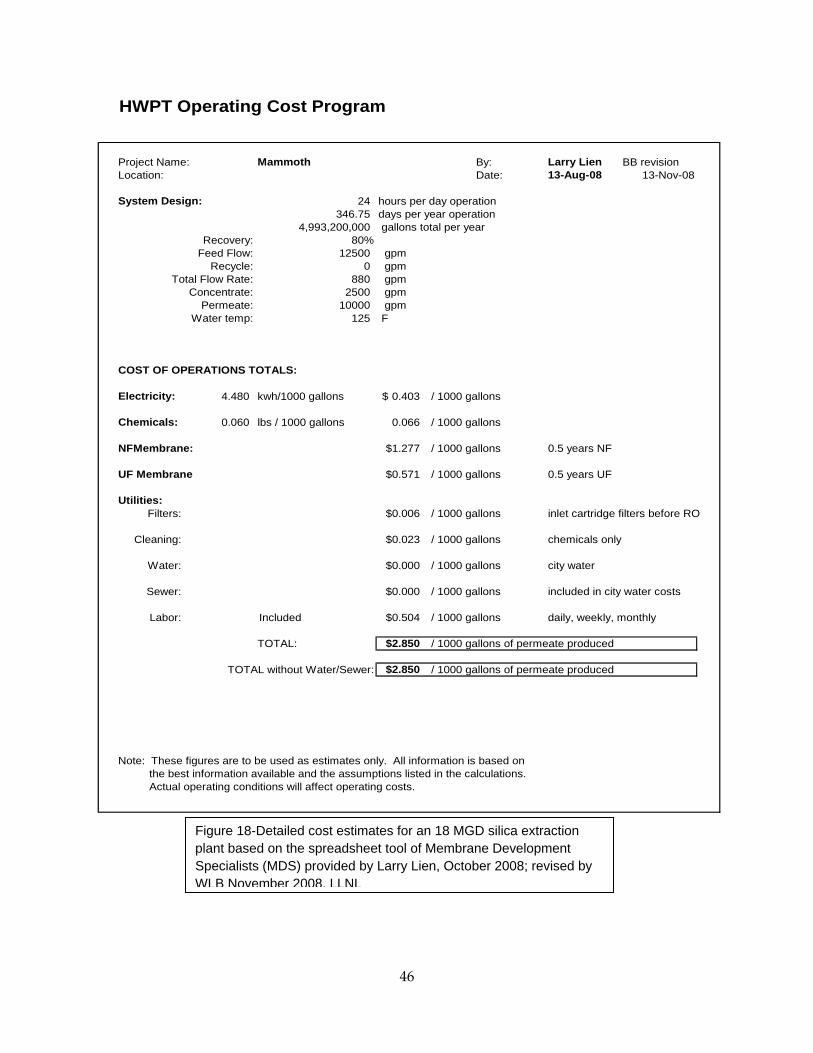
46
HWPT Operating Cost Program
Project Name: Mammoth By: Larry Lien BB revisionLocation: Date: 13-Aug-08 13-Nov-08
System Design: 24 hours per day operation346.75 days per year operation
4,993,200,000 gallons total per yearRecovery: 80%
Feed Flow: 12500 gpmRecycle: 0 gpm
Total Flow Rate: 880 gpmConcentrate: 2500 gpm
Permeate: 10000 gpmWater temp: 125 F
COST OF OPERATIONS TOTALS:
Electricity: 4.480 kwh/1000 gallons 0.403$ / 1000 gallons
Chemicals: 0.060 lbs / 1000 gallons 0.066 / 1000 gallons
NFMembrane: $1.277 / 1000 gallons 0.5 years NF
UF Membrane $0.571 / 1000 gallons 0.5 years UF
Utilities:Filters: $0.006 / 1000 gallons inlet cartridge filters before RO
Cleaning: $0.023 / 1000 gallons chemicals only
Water: $0.000 / 1000 gallons city water
Sewer: $0.000 / 1000 gallons included in city water costs
Labor: $0.504 / 1000 gallons daily, weekly, monthly
TOTAL: $2.850 / 1000 gallons of permeate produced
TOTAL without Water/Sewer: $2.850 / 1000 gallons of permeate produced
Note: These figures are to be used as estimates only. All information is based on the best information available and the assumptions listed in the calculations. Actual operating conditions will affect operating costs.
Included
Figure 19-Detailed cost estimates for an 18 MGD silica extraction plant based on the spreadsheet tool of Membrane Development Specialists (MDS) provided by Larry Lien, October 2008; revised by
Figure 18-Detailed cost estimates for an 18 MGD silica extraction plant based on the spreadsheet tool of Membrane Development Specialists (MDS) provided by Larry Lien, October 2008; revised by WLB November 2008. LLNL
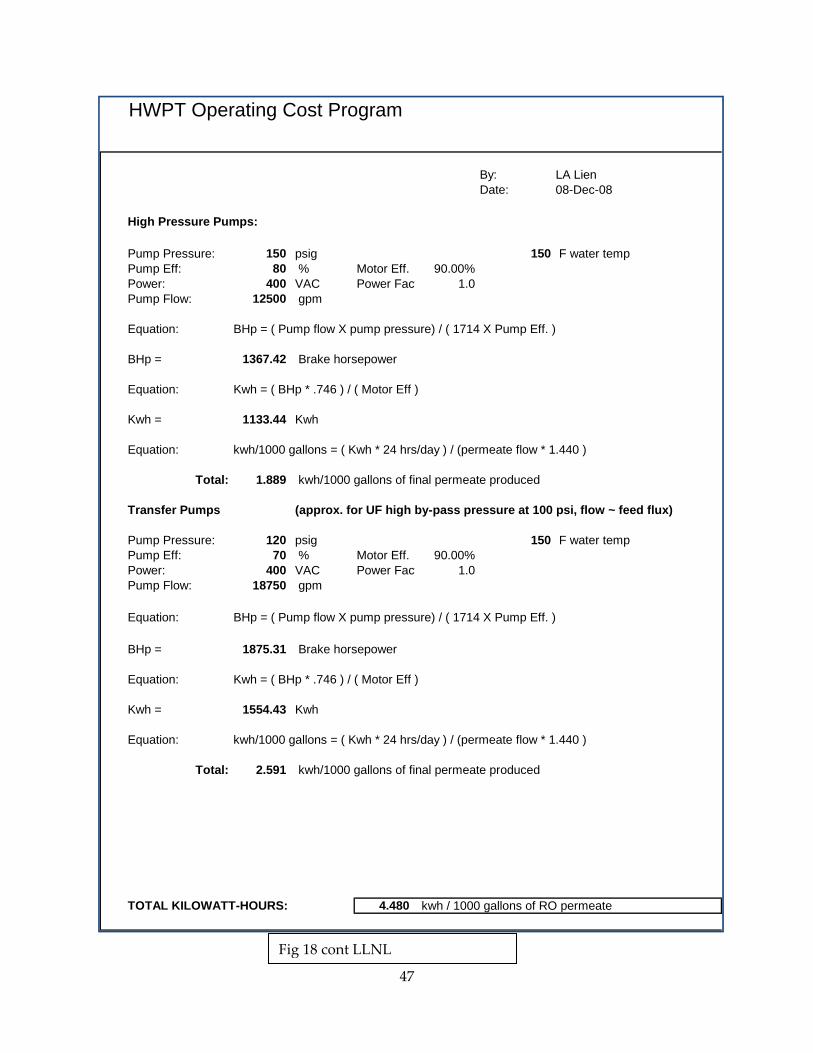
47
HWPT Operating Cost Program
By: LA LienDate: 08-Dec-08
High Pressure Pumps:
Pump Pressure: 150 psig 150 F water tempPump Eff: 80 % Motor Eff. 90.00%Power: 400 VAC Power Fact 1.0Pump Flow: 12500 gpm
Equation: BHp = ( Pump flow X pump pressure) / ( 1714 X Pump Eff. )
BHp = 1367.42 Brake horsepower
Equation: Kwh = ( BHp * .746 ) / ( Motor Eff )
Kwh = 1133.44 Kwh
Equation: kwh/1000 gallons = ( Kwh * 24 hrs/day ) / (permeate flow * 1.440 )
Total: 1.889 kwh/1000 gallons of final permeate produced
Transfer Pumps (approx. for UF high by-pass pressure at 100 psi, flow ~ feed flux)
Pump Pressure: 120 psig 150 F water tempPump Eff: 70 % Motor Eff. 90.00%Power: 400 VAC Power Fact 1.0Pump Flow: 18750 gpm
Equation: BHp = ( Pump flow X pump pressure) / ( 1714 X Pump Eff. )
BHp = 1875.31 Brake horsepower
Equation: Kwh = ( BHp * .746 ) / ( Motor Eff )
Kwh = 1554.43 Kwh
Equation: kwh/1000 gallons = ( Kwh * 24 hrs/day ) / (permeate flow * 1.440 )
Total: 2.591 kwh/1000 gallons of final permeate produced
TOTAL KILOWATT-HOURS: 4.480 kwh / 1000 gallons of RO permeate
Fig 18 cont LLNL
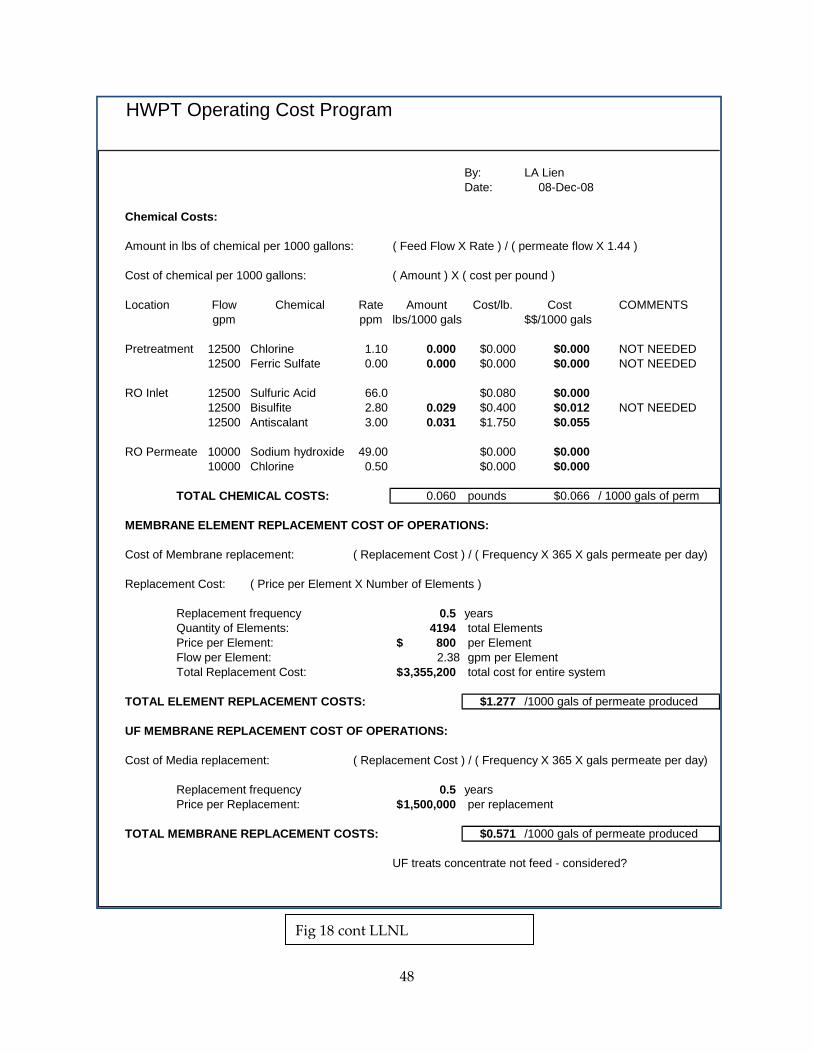
48
HWPT Operating Cost Program
By: LA LienDate: 08-Dec-08
Chemical Costs:
Amount in lbs of chemical per 1000 gallons: ( Feed Flow X Rate ) / ( permeate flow X 1.44 )
Cost of chemical per 1000 gallons: ( Amount ) X ( cost per pound )
Location Flow Chemical Rate Amount Cost/lb. Cost COMMENTSgpm ppm lbs/1000 gals $$/1000 gals
Pretreatment 12500 Chlorine 1.10 0.000 $0.000 $0.000 NOT NEEDED12500 Ferric Sulfate 0.00 0.000 $0.000 $0.000 NOT NEEDED
RO Inlet 12500 Sulfuric Acid 66.0 $0.080 $0.00012500 Bisulfite 2.80 0.029 $0.400 $0.012 NOT NEEDED12500 Antiscalant 3.00 0.031 $1.750 $0.055
RO Permeate 10000 Sodium hydroxide 49.00 $0.000 $0.00010000 Chlorine 0.50 $0.000 $0.000
TOTAL CHEMICAL COSTS: 0.060 pounds $0.066 / 1000 gals of perm
MEMBRANE ELEMENT REPLACEMENT COST OF OPERATIONS:
Cost of Membrane replacement: ( Replacement Cost ) / ( Frequency X 365 X gals permeate per day)
Replacement Cost: ( Price per Element X Number of Elements )
Replacement frequency 0.5 yearsQuantity of Elements: 4194 total ElementsPrice per Element: 800$ per ElementFlow per Element: 2.38 gpm per ElementTotal Replacement Cost: 3,355,200$ total cost for entire system
TOTAL ELEMENT REPLACEMENT COSTS: $1.277 /1000 gals of permeate produced
UF MEMBRANE REPLACEMENT COST OF OPERATIONS:
Cost of Media replacement: ( Replacement Cost ) / ( Frequency X 365 X gals permeate per day)
Replacement frequency 0.5 yearsPrice per Replacement: 1,500,000$ per replacement
TOTAL MEMBRANE REPLACEMENT COSTS: $0.571 /1000 gals of permeate produced
UF treats concentrate not feed - considered?
Fig 18 cont LLNL
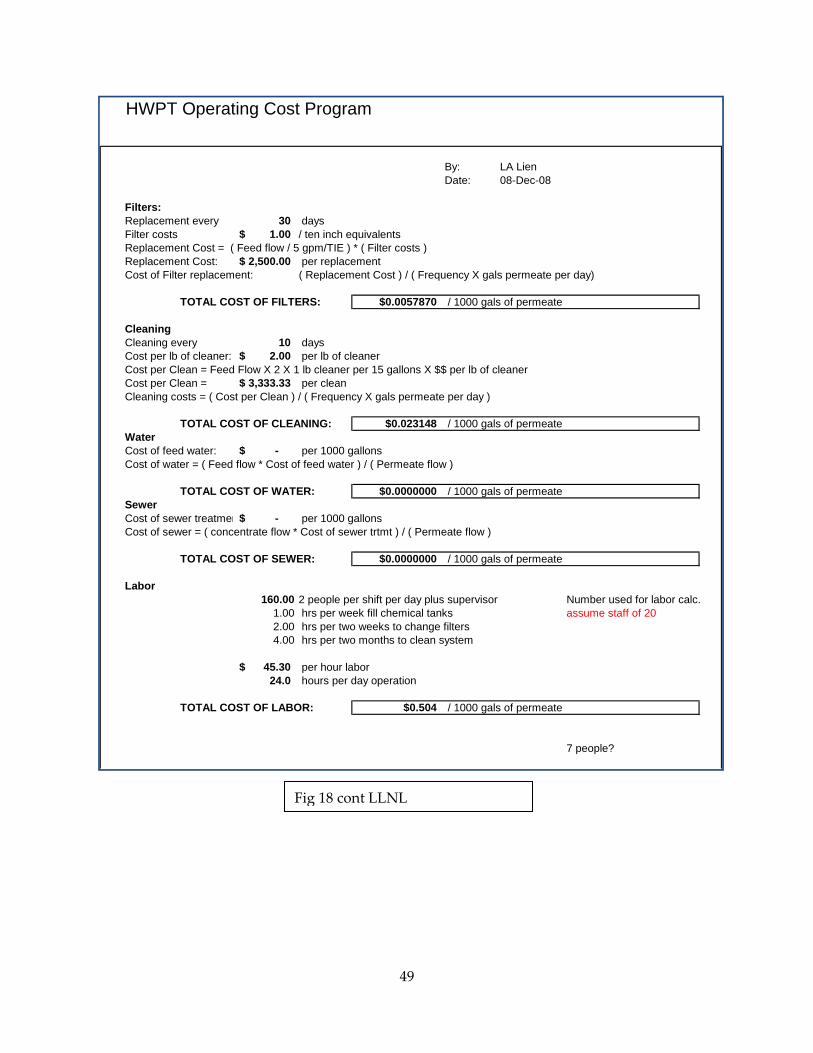
49
HWPT Operating Cost Program
By: LA LienDate: 08-Dec-08
Filters:Replacement every 30 daysFilter costs 1.00$ / ten inch equivalentsReplacement Cost = ( Feed flow / 5 gpm/TIE ) * ( Filter costs )Replacement Cost: 2,500.00$ per replacementCost of Filter replacement: ( Replacement Cost ) / ( Frequency X gals permeate per day)
TOTAL COST OF FILTERS: $0.0057870 / 1000 gals of permeate
CleaningCleaning every 10 daysCost per lb of cleaner: 2.00$ per lb of cleanerCost per Clean = Feed Flow X 2 X 1 lb cleaner per 15 gallons X $$ per lb of cleanerCost per Clean = 3,333.33$ per cleanCleaning costs = ( Cost per Clean ) / ( Frequency X gals permeate per day )
TOTAL COST OF CLEANING: $0.023148 / 1000 gals of permeateWaterCost of feed water: -$ per 1000 gallonsCost of water = ( Feed flow * Cost of feed water ) / ( Permeate flow )
TOTAL COST OF WATER: $0.0000000 / 1000 gals of permeateSewerCost of sewer treatmen -$ per 1000 gallonsCost of sewer = ( concentrate flow * Cost of sewer trtmt ) / ( Permeate flow )
TOTAL COST OF SEWER: $0.0000000 / 1000 gals of permeate
Labor160.00 2 people per shift per day plus supervisor Number used for labor calc.
1.00 hrs per week fill chemical tanks assume staff of 202.00 hrs per two weeks to change filters4.00 hrs per two months to clean system
45.30$ per hour labor24.0 hours per day operation
TOTAL COST OF LABOR: $0.504 / 1000 gals of permeate
7 people?
Fig 18 cont LLNL
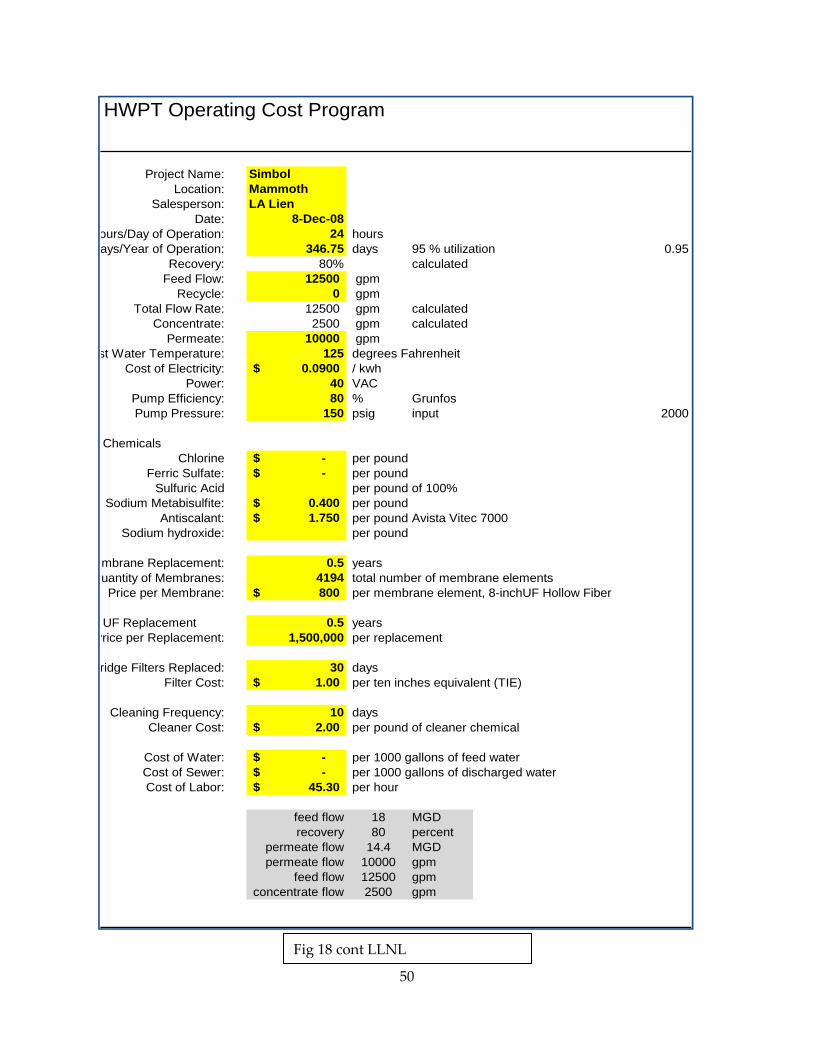
50
HWPT Operating Cost Program
Project Name: SimbolLocation: Mammoth
Salesperson: LA LienDate: 8-Dec-08
ours/Day of Operation: 24 hoursays/Year of Operation: 346.75 days 95 % utilization 0.95
Recovery: 80% calculatedFeed Flow: 12500 gpm
Recycle: 0 gpmTotal Flow Rate: 12500 gpm calculated
Concentrate: 2500 gpm calculatedPermeate: 10000 gpm
st Water Temperature: 125 degrees FahrenheitCost of Electricity: 0.0900$ / kwh
Power: 40 VACPump Efficiency: 80 % GrunfosPump Pressure: 150 psig input 2000
ChemicalsChlorine -$ per pound
Ferric Sulfate: -$ per poundSulfuric Acid per pound of 100%
Sodium Metabisulfite: 0.400$ per poundAntiscalant: 1.750$ per pound Avista Vitec 7000
Sodium hydroxide: per pound
mbrane Replacement: 0.5 yearsuantity of Membranes: 4194 total number of membrane elementsPrice per Membrane: 800$ per membrane element, 8-inchUF Hollow Fiber
UF Replacement 0.5 yearsPrice per Replacement: 1,500,000 per replacement
ridge Filters Replaced: 30 daysFilter Cost: 1.00$ per ten inches equivalent (TIE)
Cleaning Frequency: 10 daysCleaner Cost: 2.00$ per pound of cleaner chemical
Cost of Water: -$ per 1000 gallons of feed waterCost of Sewer: -$ per 1000 gallons of discharged waterCost of Labor: 45.30$ per hour
feed flow 18 MGDrecovery 80 percent
permeate flow 14.4 MGDpermeate flow 10000 gpm
feed flow 12500 gpmconcentrate flow 2500 gpm
Fig 18 cont LLNL
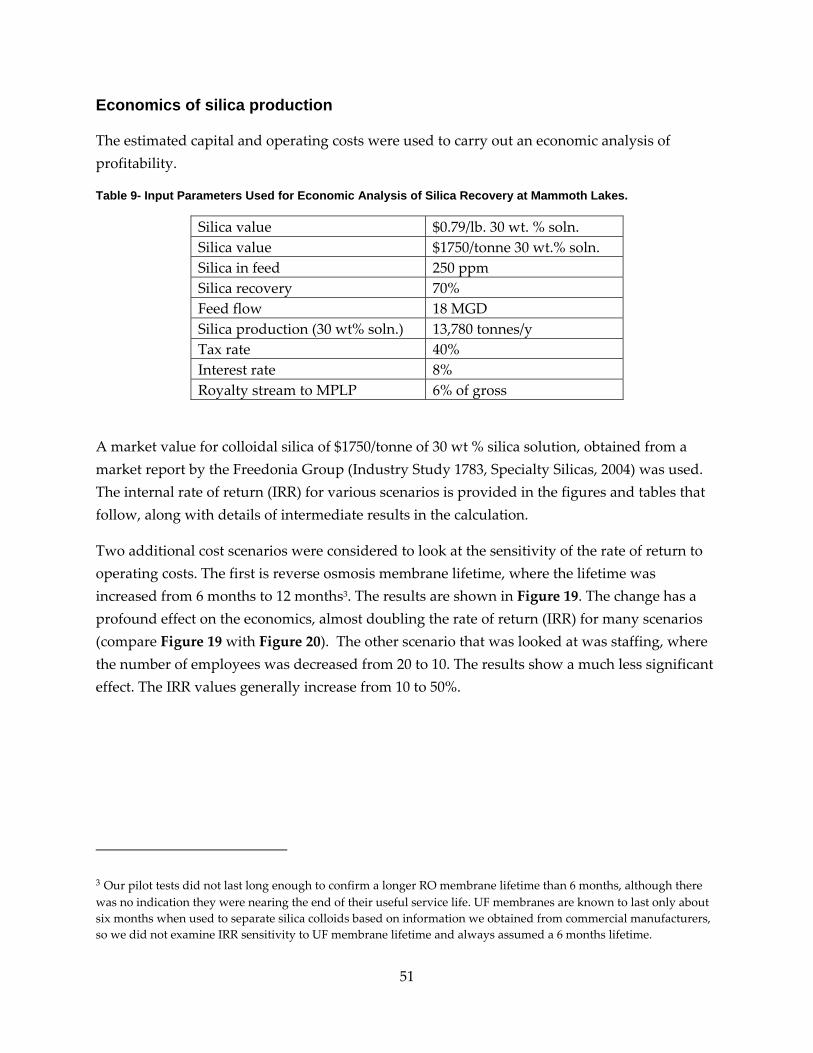
51
Economics of silica production
The estimated capital and operating costs were used to carry out an economic analysis of profitability.
Table 9- Input Parameters Used for Economic Analysis of Silica Recovery at Mammoth Lakes.
Silica value $0.79/lb. 30 wt. % soln. Silica value $1750/tonne 30 wt.% soln. Silica in feed 250 ppm Silica recovery 70% Feed flow 18 MGD Silica production (30 wt% soln.) 13,780 tonnes/y Tax rate 40% Interest rate 8% Royalty stream to MPLP 6% of gross
A market value for colloidal silica of $1750/tonne of 30 wt % silica solution, obtained from a market report by the Freedonia Group (Industry Study 1783, Specialty Silicas, 2004) was used. The internal rate of return (IRR) for various scenarios is provided in the figures and tables that follow, along with details of intermediate results in the calculation.
Two additional cost scenarios were considered to look at the sensitivity of the rate of return to operating costs. The first is reverse osmosis membrane lifetime, where the lifetime was increased from 6 months to 12 months3. The results are shown in Figure 19. The change has a profound effect on the economics, almost doubling the rate of return (IRR) for many scenarios (compare Figure 19 with Figure 20). The other scenario that was looked at was staffing, where the number of employees was decreased from 20 to 10. The results show a much less significant effect. The IRR values generally increase from 10 to 50%.
3 Our pilot tests did not last long enough to confirm a longer RO membrane lifetime than 6 months, although there was no indication they were nearing the end of their useful service life. UF membranes are known to last only about six months when used to separate silica colloids based on information we obtained from commercial manufacturers, so we did not examine IRR sensitivity to UF membrane lifetime and always assumed a 6 months lifetime.
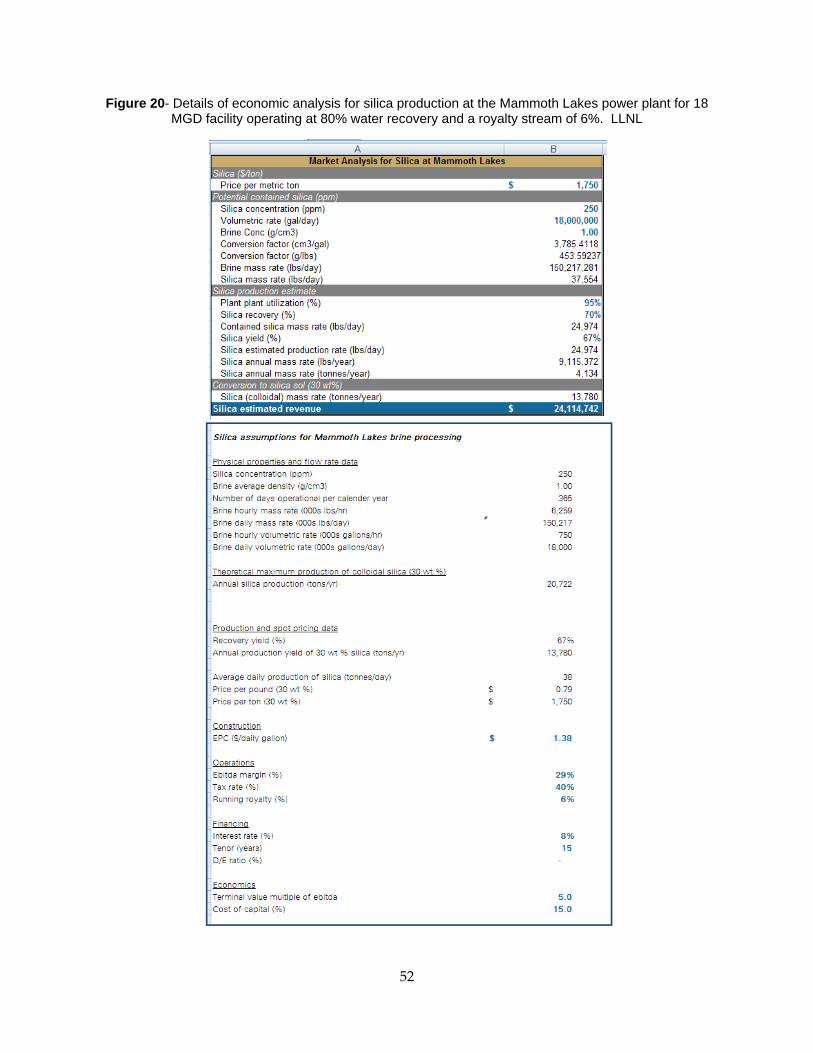
52
Figure 20- Details of economic analysis for silica production at the Mammoth Lakes power plant for 18 MGD facility operating at 80% water recovery and a royalty stream of 6%. LLNL
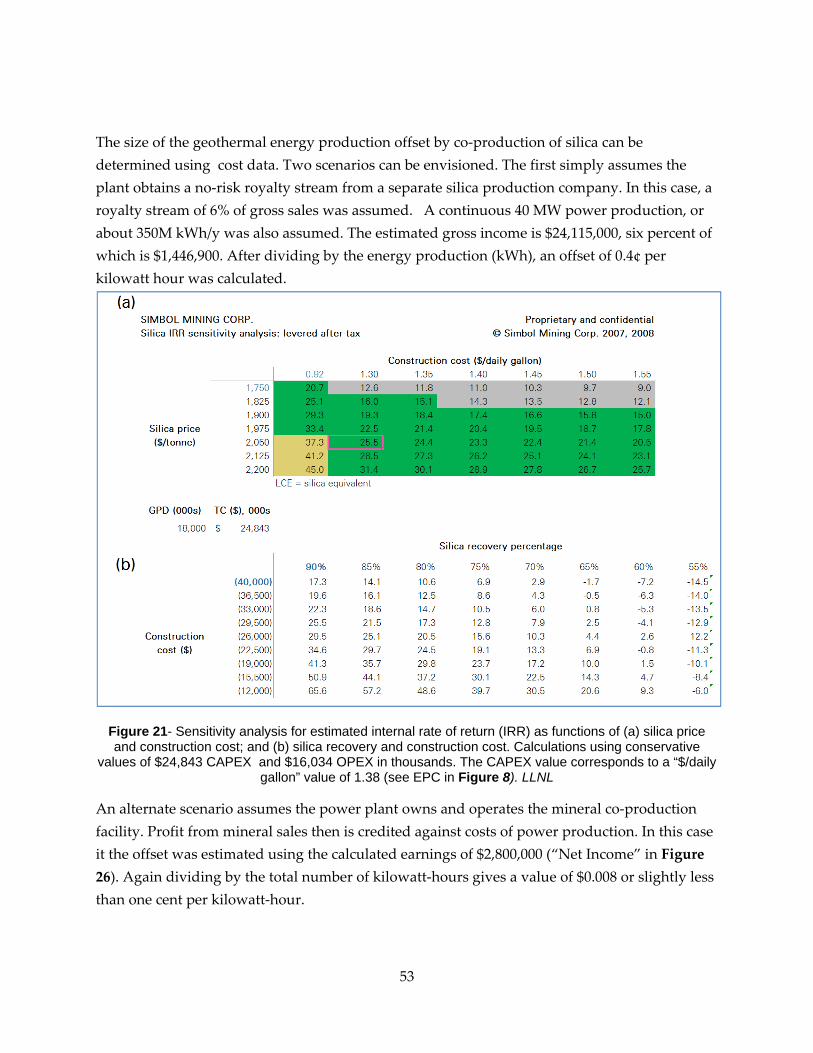
53
The size of the geothermal energy production offset by co‐production of silica can be determined using cost data. Two scenarios can be envisioned. The first simply assumes the plant obtains a no‐risk royalty stream from a separate silica production company. In this case, a royalty stream of 6% of gross sales was assumed. A continuous 40 MW power production, or about 350M kWh/y was also assumed. The estimated gross income is $24,115,000, six percent of which is $1,446,900. After dividing by the energy production (kWh), an offset of 0.4¢ per kilowatt hour was calculated.
Figure 21- Sensitivity analysis for estimated internal rate of return (IRR) as functions of (a) silica price and construction cost; and (b) silica recovery and construction cost. Calculations using conservative
values of $24,843 CAPEX and $16,034 OPEX in thousands. The CAPEX value corresponds to a “$/daily gallon” value of 1.38 (see EPC in Figure 8). LLNL
An alternate scenario assumes the power plant owns and operates the mineral co‐production facility. Profit from mineral sales then is credited against costs of power production. In this case it the offset was estimated using the calculated earnings of $2,800,000 (“Net Income” in Figure 26). Again dividing by the total number of kilowatt‐hours gives a value of $0.008 or slightly less than one cent per kilowatt‐hour.

54
Together the royalty and revenue income streams provide a potential cost offset of 0.8¢ + 0.4¢ = 1.2¢ /kWh.
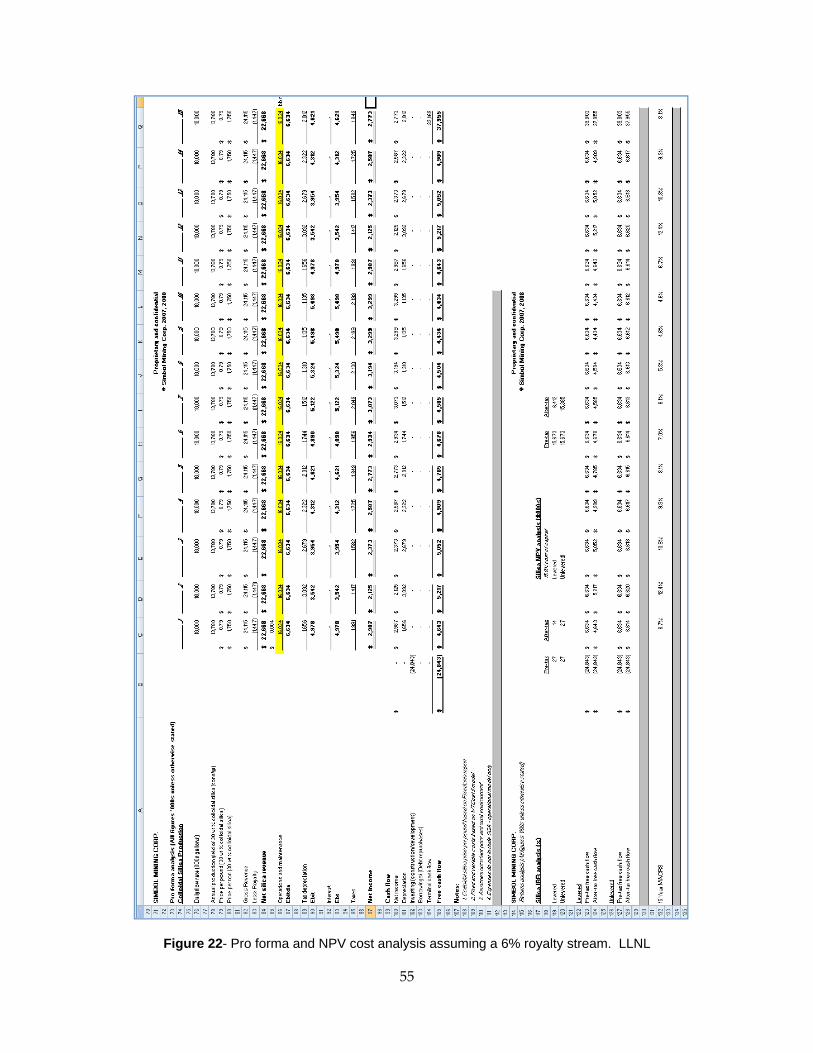
55
Figure 22- Pro forma and NPV cost analysis assuming a 6% royalty stream. LLNL
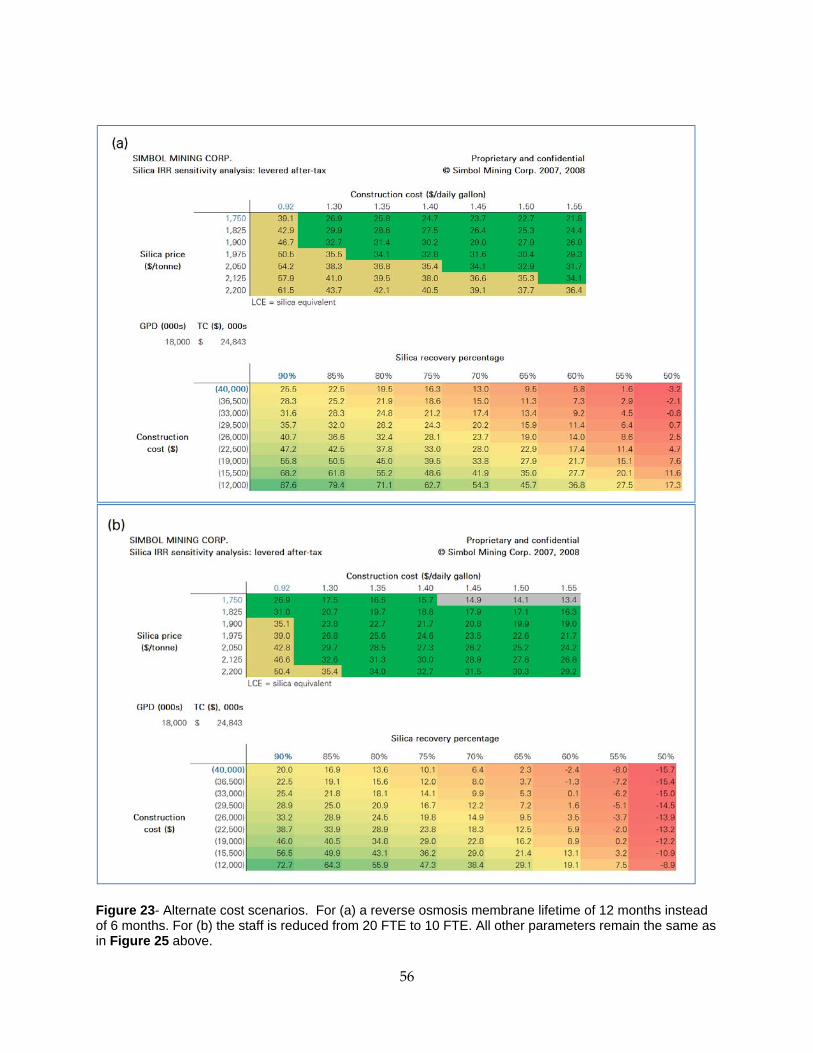
56
Figure 23- Alternate cost scenarios. For (a) a reverse osmosis membrane lifetime of 12 months instead of 6 months. For (b) the staff is reduced from 20 FTE to 10 FTE. All other parameters remain the same as in Figure 25 above.
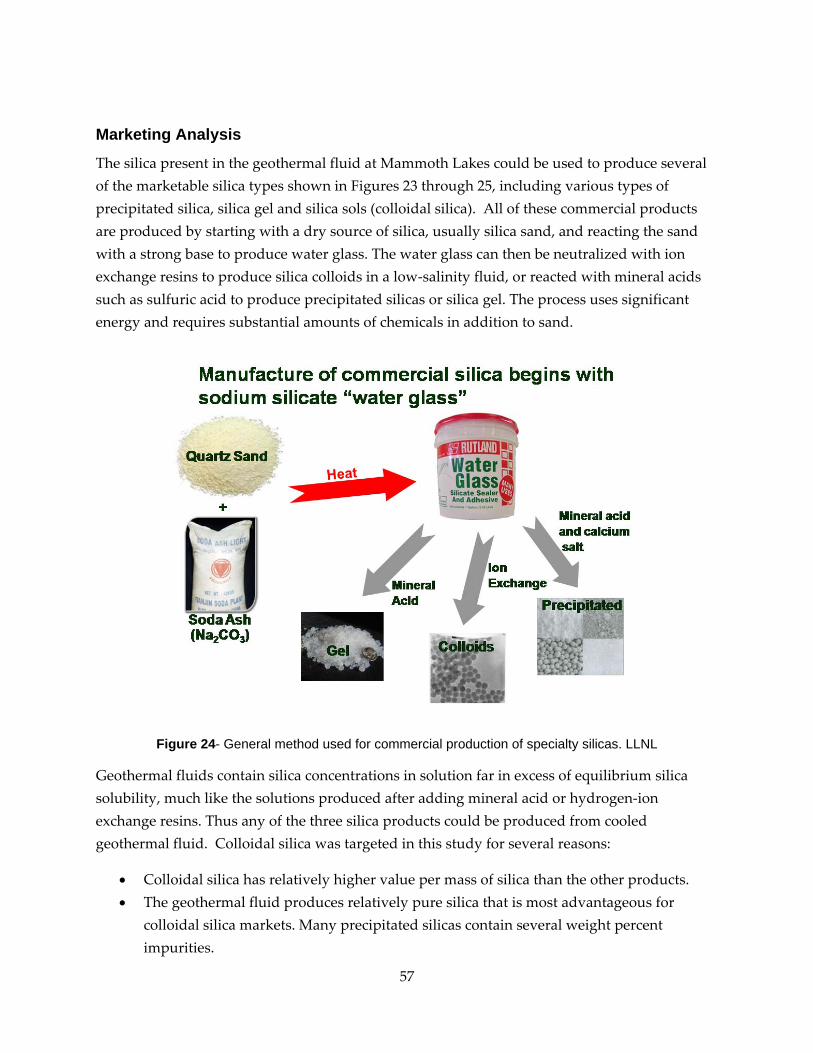
57
Marketing Analysis
The silica present in the geothermal fluid at Mammoth Lakes could be used to produce several of the marketable silica types shown in Figures 23 through 25, including various types of precipitated silica, silica gel and silica sols (colloidal silica). All of these commercial products are produced by starting with a dry source of silica, usually silica sand, and reacting the sand with a strong base to produce water glass. The water glass can then be neutralized with ion exchange resins to produce silica colloids in a low‐salinity fluid, or reacted with mineral acids such as sulfuric acid to produce precipitated silicas or silica gel. The process uses significant energy and requires substantial amounts of chemicals in addition to sand.
Figure 24- General method used for commercial production of specialty silicas. LLNL
Geothermal fluids contain silica concentrations in solution far in excess of equilibrium silica solubility, much like the solutions produced after adding mineral acid or hydrogen‐ion exchange resins. Thus any of the three silica products could be produced from cooled geothermal fluid. Colloidal silica was targeted in this study for several reasons:
• Colloidal silica has relatively higher value per mass of silica than the other products. • The geothermal fluid produces relatively pure silica that is most advantageous for
colloidal silica markets. Many precipitated silicas contain several weight percent impurities.
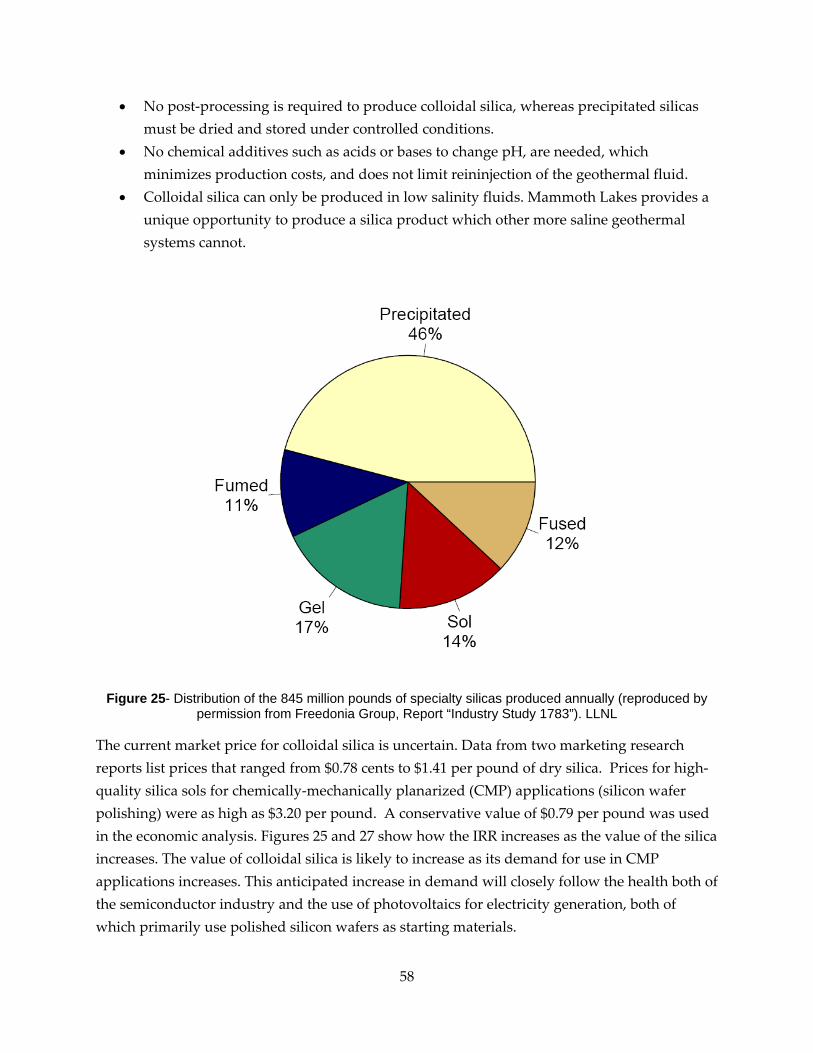
58
• No post‐processing is required to produce colloidal silica, whereas precipitated silicas must be dried and stored under controlled conditions.
• No chemical additives such as acids or bases to change pH, are needed, which minimizes production costs, and does not limit reininjection of the geothermal fluid.
• Colloidal silica can only be produced in low salinity fluids. Mammoth Lakes provides a unique opportunity to produce a silica product which other more saline geothermal systems cannot.
Figure 25- Distribution of the 845 million pounds of specialty silicas produced annually (reproduced by permission from Freedonia Group, Report “Industry Study 1783”). LLNL
The current market price for colloidal silica is uncertain. Data from two marketing research reports list prices that ranged from $0.78 cents to $1.41 per pound of dry silica. Prices for high‐quality silica sols for chemically‐mechanically planarized (CMP) applications (silicon wafer polishing) were as high as $3.20 per pound. A conservative value of $0.79 per pound was used in the economic analysis. Figures 25 and 27 show how the IRR increases as the value of the silica increases. The value of colloidal silica is likely to increase as its demand for use in CMP applications increases. This anticipated increase in demand will closely follow the health both of the semiconductor industry and the use of photovoltaics for electricity generation, both of which primarily use polished silicon wafers as starting materials.
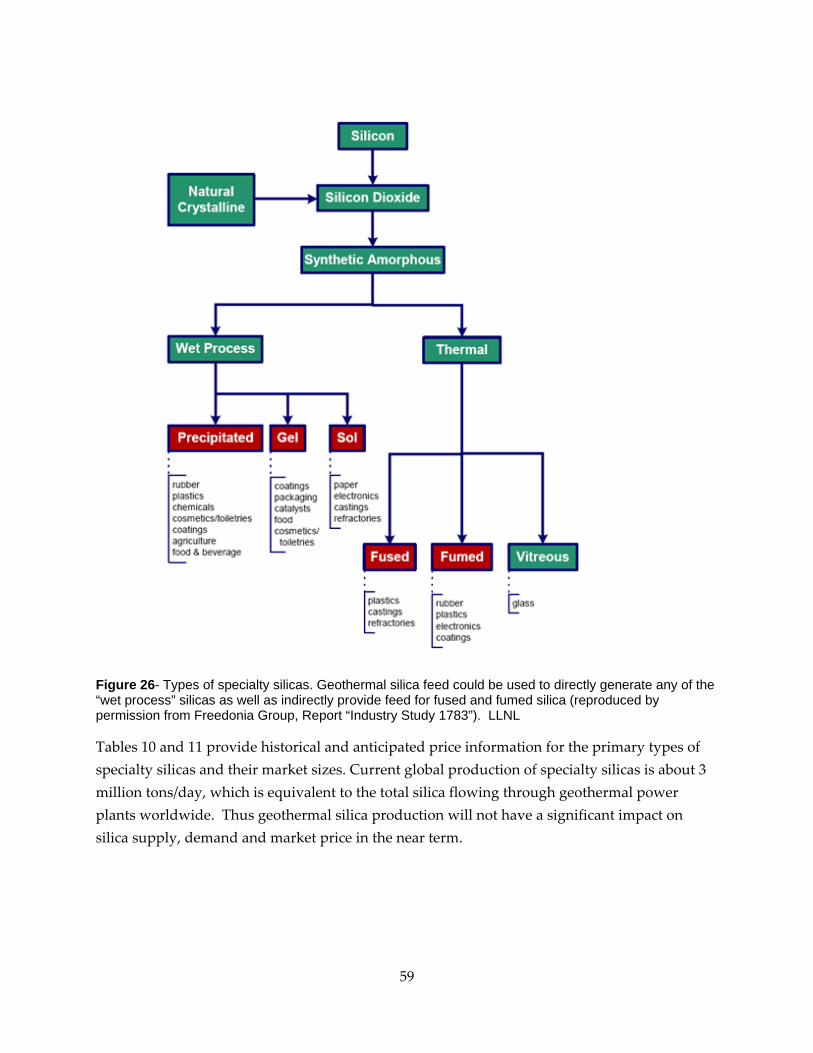
59
Figure 26- Types of specialty silicas. Geothermal silica feed could be used to directly generate any of the “wet process” silicas as well as indirectly provide feed for fused and fumed silica (reproduced by permission from Freedonia Group, Report “Industry Study 1783”). LLNL
Tables 10 and 11 provide historical and anticipated price information for the primary types of specialty silicas and their market sizes. Current global production of specialty silicas is about 3 million tons/day, which is equivalent to the total silica flowing through geothermal power plants worldwide. Thus geothermal silica production will not have a significant impact on silica supply, demand and market price in the near term.
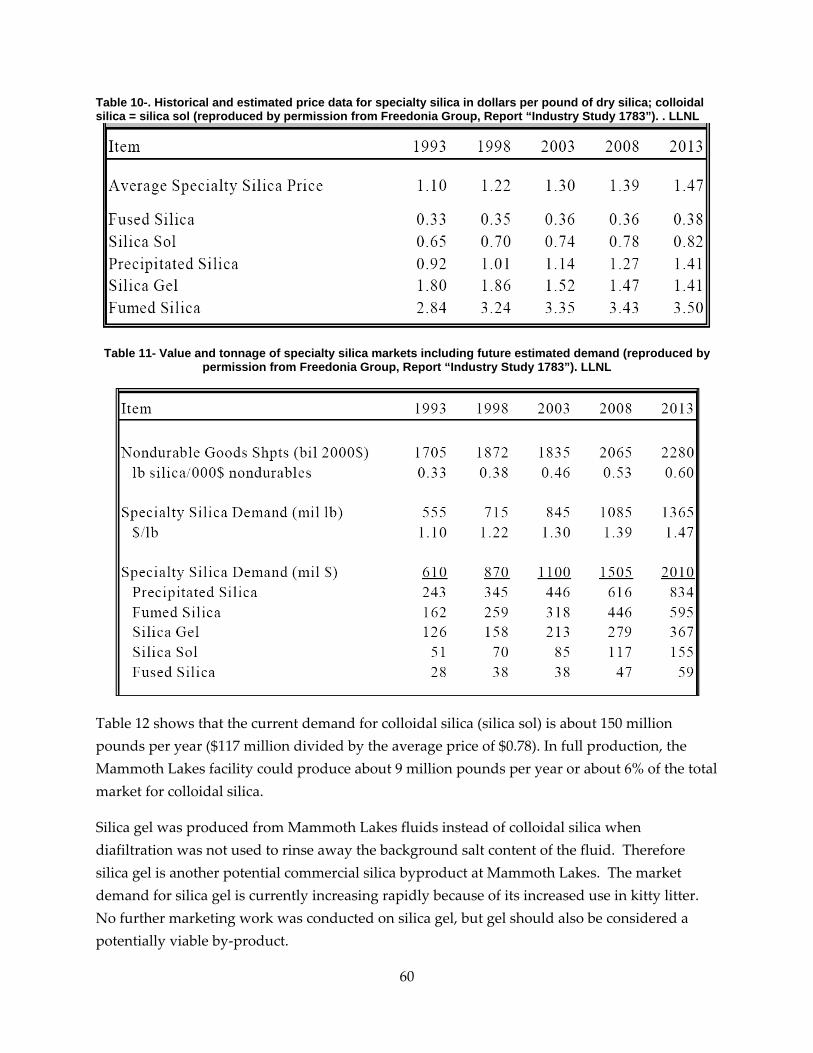
60
Table 10-. Historical and estimated price data for specialty silica in dollars per pound of dry silica; colloidal silica = silica sol (reproduced by permission from Freedonia Group, Report “Industry Study 1783”). . LLNL
Table 11- Value and tonnage of specialty silica markets including future estimated demand (reproduced by permission from Freedonia Group, Report “Industry Study 1783”). LLNL
Table 12 shows that the current demand for colloidal silica (silica sol) is about 150 million pounds per year ($117 million divided by the average price of $0.78). In full production, the Mammoth Lakes facility could produce about 9 million pounds per year or about 6% of the total market for colloidal silica.
Silica gel was produced from Mammoth Lakes fluids instead of colloidal silica when diafiltration was not used to rinse away the background salt content of the fluid. Therefore silica gel is another potential commercial silica byproduct at Mammoth Lakes. The market demand for silica gel is currently increasing rapidly because of its increased use in kitty litter. No further marketing work was conducted on silica gel, but gel should also be considered a potentially viable by‐product.
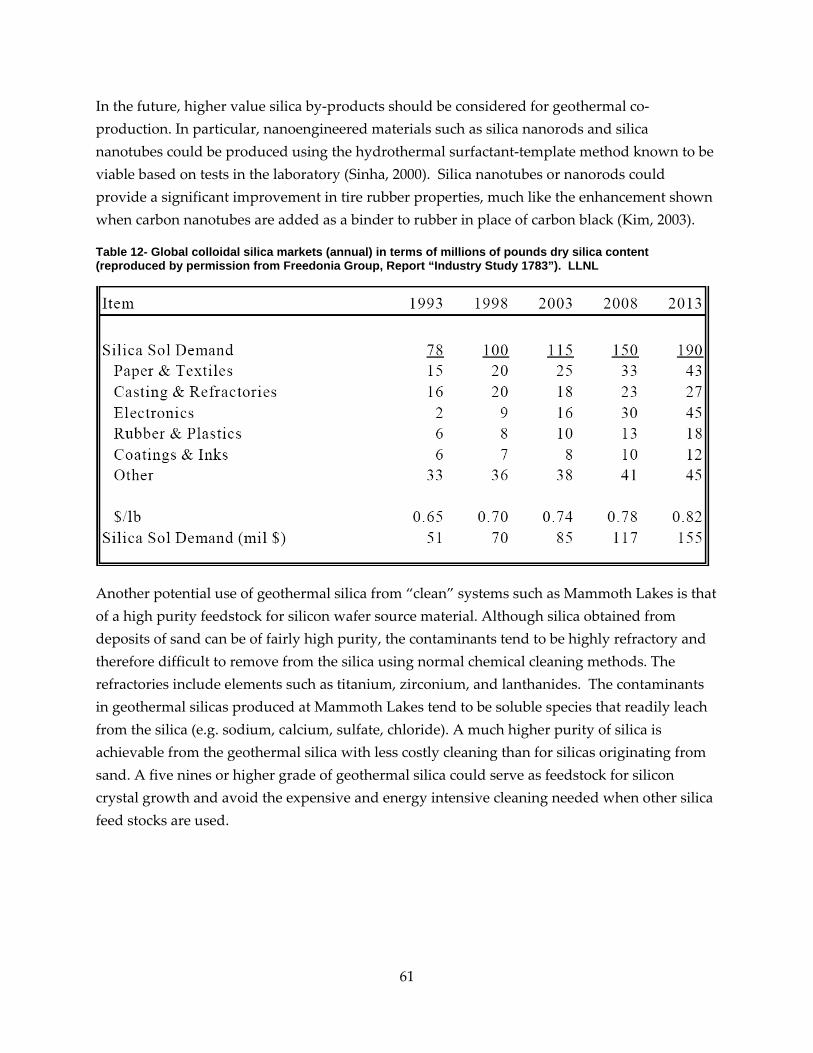
61
In the future, higher value silica by‐products should be considered for geothermal co‐production. In particular, nanoengineered materials such as silica nanorods and silica nanotubes could be produced using the hydrothermal surfactant‐template method known to be viable based on tests in the laboratory (Sinha, 2000). Silica nanotubes or nanorods could provide a significant improvement in tire rubber properties, much like the enhancement shown when carbon nanotubes are added as a binder to rubber in place of carbon black (Kim, 2003).
Table 12- Global colloidal silica markets (annual) in terms of millions of pounds dry silica content (reproduced by permission from Freedonia Group, Report “Industry Study 1783”). LLNL
Another potential use of geothermal silica from “clean” systems such as Mammoth Lakes is that of a high purity feedstock for silicon wafer source material. Although silica obtained from deposits of sand can be of fairly high purity, the contaminants tend to be highly refractory and therefore difficult to remove from the silica using normal chemical cleaning methods. The refractories include elements such as titanium, zirconium, and lanthanides. The contaminants in geothermal silicas produced at Mammoth Lakes tend to be soluble species that readily leach from the silica (e.g. sodium, calcium, sulfate, chloride). A much higher purity of silica is achievable from the geothermal silica with less costly cleaning than for silicas originating from sand. A five nines or higher grade of geothermal silica could serve as feedstock for silicon crystal growth and avoid the expensive and energy intensive cleaning needed when other silica feed stocks are used.
62
Conclusions and Recommendations
A pilot‐scale silica recovery plant was successfully used to extract silica from geothermal fluids at the Mammoth Lakes geothermal plant. The pilot results were incorporated in an economic analysis of silica recovery. The results of the economic analysis suggest that the rates‐of‐return are favorable with cost‐offsets of about one cent per kilowatt hour. The technology is simple, and can be readily applied to other geothermal systems, in particular those with low salinities. These systems are characteristically those having relatively low reservoir temperatures. The technology thus has the potential to enhance currently sub‐economic geothermal sites into profitability. The process also produces a clean water by‐product that would be available for a wide variety of uses, in particular for power plant wet cooling.
The next step towards full‐scale commercialization would be the construction of a demonstration‐scale plant on the order of 0.5‐1 MGD that would produce approximately one ton per day silica, sufficient for marketing, and a purified water stream sufficient for wet cooling of 10‐15 MW of power plant capacity.
Mineral extraction from geothermal fluids will benefit the California ratepayer by creating an additional source of revenue that will help to accelerate market penetration of renewable, base‐load geothermal energy, meet California’s RPS goal, reduce greenhouse gas emissions in accordance with Assembly Bill 32, reduce the environmental impact and energy demand of mining, and provide a clean source of water to increase power production and ease demand on California’s limited water supplies.
Acknowledgements The success of this project benefited from the help of numerous individuals. In particular, Richard Simonis of Rocky Point Environmental Services LLC who designed and built a first‐rate pilot plant and was key to the success of the project; Larry Lien of Membrane Development Specialists who provided key advice on this new membrane application; Tom Wolfe of Perlorica who provided help and encouragement throughout the project; Andy Pasczowki of Precision Colloids who found the right direction for colloid extraction using UF and identified a market for what was produced; and Peter Allen of PCI for help on running efficient UF systems. The staff at Mammoth Pacific LP provided help of all kinds, including hot water when necessary, advice on de‐icing, and replacement parts during emergencies. Thanks also to Larry
63
Nickerson for interfacing with the plant owners, Ormat and Constellation Energy, and his technical support during both phases of the project. And special thanks to Elizabeth Wilbrecht of MPLP for her help and encouragement throughout the project.
References Bethke, C. M., 1996, Geochemical Reaction Modeling: Oxford University Press, New York, 397 pages.
Bourcier, W.L., Mackenzie Johnson, Adam Wallace, Bill Ralph, and Carol Bruton, 2005, Co‐production of Silica from Geothermal Fluids, Final Report California Energy Commission Project PIR‐00‐003, 94 pages. Bruton, C.J., Counce, D., Bergfeld, D., Goff, F., Johnson, S.D., Moore, J.N. and Nimz, G., 1997, Preliminary investigation of scale formation and fluid chemistry at the Dixie Valley Geothermal Field, Nevada: Geothermal Resources Council Trans. 1997 Annual Meeting.
Gallup, D.L., 1998, Geochemistry of geothermal fluids and well scales, and potential for mineral recovery: Ore Geology Reviews, v. 12, p. 225‐236.
Iler, Ralph K. (1979) The Chemistry of Silica, Wiley Interscience, New York, 866 pages.
Kim, Young‐Nam, 2003, K H Chemicals Co. Ltd., Int. Patent No. WO/2003/060002, RUBBER COMPOSITION COMPRISING CARBON NANOTUBES AS REINFORCING AGENT AND PREPARATION THEREOF
Moch, I. (2006) WTCOST II. Water Treatment and Cost Estimation Manual, Developed by I. Moch and Associates, Querns Engineering Services, and Boulder Research Enterprises. With the US Bureau of Reclamation. Available through I. Moch &Associates, 302‐477‐0420 [email protected].
Reyes, A.G, Trompetter, W.J., Britten, K. and Searle, J., 2002, Mineral deposits in the Rotokawa geothermal pipelines, New Zealand: J. of Volcanology and Geothermal Research, v. 119, p. 215‐239.
Sinha, M., Qadri, S. B., and Singh, C. P., 2000, Development of mesoporous silica nanotubes, 2000 Foresight Conference on Molecular Nanotechnology, November 2000, Bethesda, MD.

64
65
Appendix 1. Pilot plant operating procedures and safety plan.
Procedures and Safety Plans for the Silica Pilot Plant at the Mammoth Lakes Geothermal Power Plant
Bill Bourcier, Sarah Roberts, and Brian Viani
Lawrence Livermore National Laboratory
August 17, 2008.
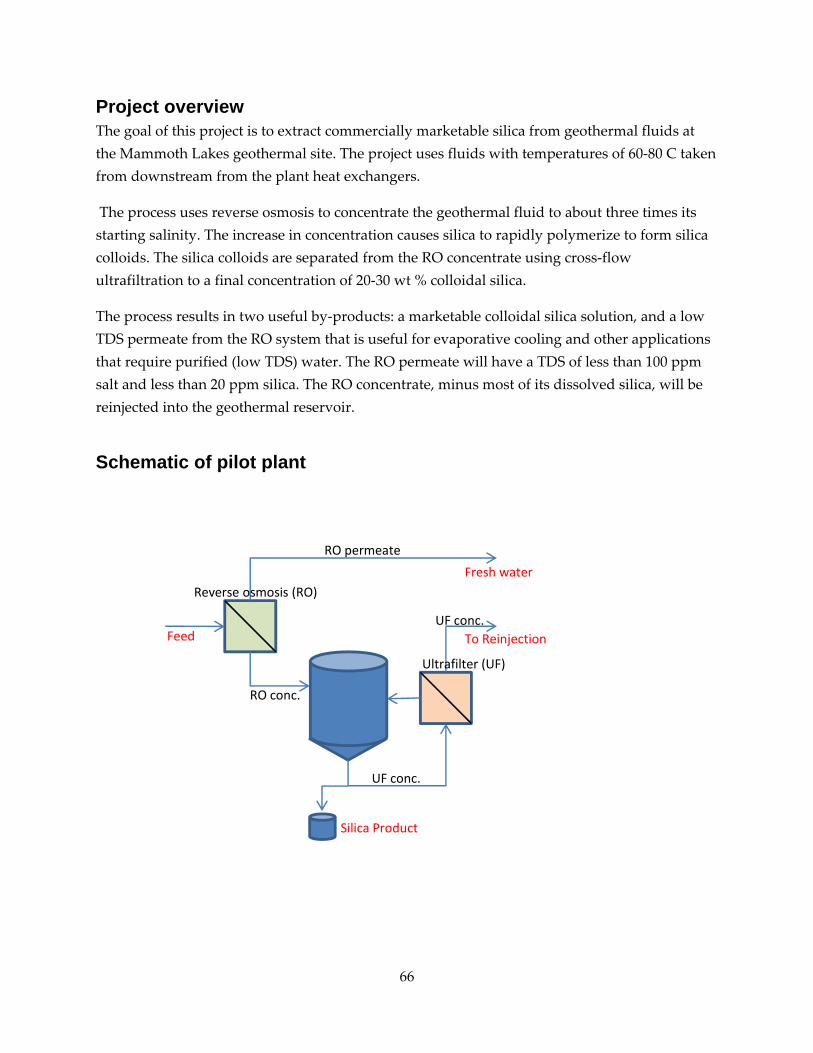
66
Project overview The goal of this project is to extract commercially marketable silica from geothermal fluids at the Mammoth Lakes geothermal site. The project uses fluids with temperatures of 60‐80 C taken from downstream from the plant heat exchangers.
The process uses reverse osmosis to concentrate the geothermal fluid to about three times its starting salinity. The increase in concentration causes silica to rapidly polymerize to form silica colloids. The silica colloids are separated from the RO concentrate using cross‐flow ultrafiltration to a final concentration of 20‐30 wt % colloidal silica.
The process results in two useful by‐products: a marketable colloidal silica solution, and a low TDS permeate from the RO system that is useful for evaporative cooling and other applications that require purified (low TDS) water. The RO permeate will have a TDS of less than 100 ppm salt and less than 20 ppm silica. The RO concentrate, minus most of its dissolved silica, will be reinjected into the geothermal reservoir.
Schematic of pilot plant
RO permeate
Reverse osmosis (RO)
Ultrafilter (UF)
RO conc.
UF conc.
UF conc.
Silica Product
Fresh water
To ReinjectionFeed
67
Emergency shutdown procedures
For emergency shutdown, the feed supply valve and the electrical quick disconnect, both located outside the facility container and labeled as such, should be shut off. LLNL personnel should then be notified that the shutdown was necessary. In general, when the facility is operating, LLNL personnel will be present. However, the RO system alone (without silica recovery) will run continuously and there is the potential that a problem could develop overnight and that shutdown would be necessary. The most likely cause of a shutdown would be visible water running from the pilot housing due to a major leak or line rupture. The RO system is powered by plant fluid pressure alone and is not supplied or boosted by a pump. Therefore, the RO system can be run without any electrical service to the pilot unit. However, the sump pump that transfers the RO permeate discharge to the reinjection line needs power to operate. Therefore, if for any reason electricity to the pilot unit is interrupted, the feed line should be shut off.
68
Appendix 1
Operating procedures for pilot plant
Reverse osmosis (RO) system startup
Contact plant operator with request for feed from plant Fire hose should be connected to an outlet downstream from the heat exchanger, generally from unit 100 (5 MW) The fluid should have a temperature between 50 and 80 C and a pressure less than 150 psi Replace pre‐filter if needed (TBD how often this is necessary, at least every 5 days) Make sure chiller is powered on (if needed; plant T > 60 C /150 F) by turning on interlock switch on chiller front panel, and turning on Off/On switch on Siemens box on transportainer Check return tank (tank with sump pump) to make sure it is powered on and operational Valves should be in the following positions: Open conc. backpressure (V3 on panel) fully Open fast flush (V6 on panel) to speed air removal from system) Close feed/CIP selector valve (V2 yellow handle) Set orange (V4) (on upper wall corner opposite CIP tank) to feed concentrate to drain (“conc. to drain”) Close yellow CIP to pump inlet valve (V9) Permeate backpressure valves open (on panel) When fluid is available from plant, open outside valve (V1) slightly to allow fluid into the system (gently please) Continue to open V1 until flow through system is about 18‐20 GPM (on FM1) Check and record flow rate (concentrate flow monitor on panel should be pegged) (IF CONCENTRATE FLOW IS NOT PEGGED – CLOSE V1 IMMEDIATELY, SYSTEM IS BLOCKED) Allow system to run 5‐10 minutes to remove air from system; will see bubbles in flow meters Close fast flush (V6 on panel) when close to thermal equilibration (cond=perm=feed) Gradually turn down conc. backpressure (V3 on panel) to increase permeate flow Vessel 1 flow should be about 5‐8 gpm, P 25‐30 psi Vessel 2 flow should be about 4‐6 gpm, P 20‐25 psi Vessel 3 flow should be about 0.3‐1 gpm, P 5‐10 psi Adjust concentrate and permeate control valves (on control panel) to get these flows
69
Note: Conc. Float is likely to be stuck at top of flow chamber, may need to encourage it to unstuck position by gentle tapping, or by temporarily increasing backpressure using valve V3 May need to re‐adjust feed valve (V1) to maintain 20 gpm at FM1 (iterate steps 5‐10 if necessary) Wait about 15 minutes to let system settle then record parameters (flow rates, pressure gradients, temperatures, and conductivities should all stabilize; pressure gradient across RO units should be about 10 psi) Check delta P across prefilter – should be less than 8 psi; if greater than 8 psi need to swap in new filter element at earliest convenience (make a note in the data log) Notes: The RO system should always have at least 3 gpm concentrate running through the system. Less than that does not provide enough cross‐flow and makes silica fouling more likely Always open and close all valves “slowly‐gently” to avoid rapid pressure changes anywhere in system Never adjust any CPVC (plastic) valves while under pressure. If necessary, temporarily shut off feed and then adjust valve
Chiller Unit For feed temperatures greater than 60 C (150 F) the fluid needs to be cooled to the operating range of the pilot (50‐60 C). An air cooled chiller should be plumbed into the feed line and used to cool the fluid. The chiller has a thermostat inside the control panel that is pre‐set to keep the fluid in the proper range (125‐140 F). Turn on power to the unit using the power switch on the transportainer (follow wire conduit if unsure) and the switch on the front panel of the chiller and the unit will come on (the fan will power up) when the hot fluid enters.
70
Reverse osmosis (RO) operation and data recording
RO recovery is varied by using the concentrate backpressure valve (V3 on panel). Set RO recovery by slowly closing V3. This provides backpressure to the RO modules forcing fluid across the membrane into the permeate side. As the valve is closed, permeate flow rates should increase and concentrate flow should decrease, and total flow should decrease slightly. The conductivity of the concentrate should increase, the concentration of the permeate will remain about the same. Adjust V3 until the desired recovery is obtained. Remember that the higher the recovery, the more likely silica fouling of the RO membranes becomes. After changing the recovery, it will take up to 20 minutes for the system to equilibrate at the new operating condition. System recovery sets the silica concentration of the concentrate. To estimate the silica concentration, assume silica behaves the same as total salt content. For example, if concentrate conductivity is three times the feed conductivity, the water recovery is about 67% and the expected silica concentration is about three times the feed silica. Normally at Mammoth Lakes, the silica feed is about 250 ppm, so a 67% recovery would produce a concentrate with about 750 ppm silica. In reality, the silica rejection is about 90‐95%, so the actual silica concentration would be a bit less than 750 ppm. Silica analysis should always be carried out to confirm these estimated silica values. The silica (and salt) rejection of the membrane goes down as the temperature increases. Data should be recorded at 1‐2 hour intervals and samples taken as needed. All sampling ports should be flushed 2‐3 times before final sample taken. Feed and RO concentrate and individual permeate samples are taken at the flow control panel. Composite permeate sample is taken from the sampling port on the permeate to CIP tank line (sampling valve fastened to container wall near exit fan). Individual permeate samples (from V1, V2, and V3) are taken from flow control panel as needed for diagnostics, but are not routinely taken. Periodically check to make sure drains and return sump pump are working, as well as checking before startup. Check the return tank at the plant (near unit 200) to make sure return valve is open and pump is turned on (usually done by plant personnel via request to plant operator). Always wear an attractive Nomex (fire retardant) gown and hard hat when inside gate (due to use of non‐odorized isobutane working fluid in heat exchangers).
71
Reverse osmosis (RO) clean-in-place and shutdown
Before shutting down, check delta P across pre‐filter, if greater than 10 psi, make a note to swap in new element after system is shut down Open conc. backpressure (V3) all the way RO conc. conductivity should begin to drop Permeate flow drops Open fast flush (V6) Open permeate backpressure valves (on panel) Feed and conc. conductivity should begin to equalize, when they are within 25%, shut off feed (V1) to begin clean in place (CIP) flush. If this is not done, osmotic pressure from salt solution can damage the membranes. Make sure CIP is connected to RO system (vs. UF system) using Banjo fitting (manual changeover) V4 should be set to send RO concentrate to sump Open V2 to allow permeate stored in black CIP tank to enter RO system (V1 is closed so that fluid flows only into RO vessels) Open valve V9 to allow CIP water to feed RO (note that feed line and feed readouts are now isolated and are not providing info on CIP fluid) Turn on CIP pump Float level on CIP tank should start going down Run until conductivity of conc. and perm. are within 10% (generally around 400 uS) Shut off CIP pump Return valves to starting positions V2 – Closed (CIP to RO) V9 – Closed (CIP pump inlet) V3 – Open (RO backpressure) V4 – RO conc. set to drain Note: Replace pre‐filter if needed
72
UF system startup and collection of silica colloids The goal is to fill the UF collection tank with silica‐enriched RO concentrate. Begin the collection after the system has equilibrated for about 15 minutes at the desired silica concentration, if operating in semi‐continuous mode (i.e., if RO concentrate is periodically added to the UF tank prior to harvesting the UF concentrate). If operating in batch mode (i.e., when the UF concentrate from a single UF tank fill is collected and the tank cleaned prior to introducing more RO concentrate), let equilibrate for at least one hour before starting UF. Zero flow totalizers for RO concentrate (FM2) and UF permeate (FM4). Turn off plant feed (V1) remembering approximate setting Quickly switch valve V4 to feed RO concentrate into UF tank (outside tank HDPE) Turn on plant feed (V1) to same setting Fill UF tank to desired level (the level marks have been calculated based on the dimensions of the tank). The fill volume in gallons is equal to: H*6.2795 + 18.288 , where H is the height of the liquid surface above the tank base. Turn off plant feed (V1) Switch valve V4 back to send RO concentrate to drain Turn on plant feed (V1) Open valves V5, V7, and V8 Verify that the UF tank drain valve is open Measure temperature in UF tank Turn on tank heater if desired to maintain the initial fill temperature; turn thermostat clockwise until “click” is heard (make sure heater breakers in the electrical panel inside the transportainer are switched “on”) Turn on UF pump V7 is for UF flow control V5 is for UF backpressure control V8 was made redundant when V7 was installed, used for UF CIP Want about 28‐30 gpm total flow rate to get 11 fps flow rate needed for colloid separation May need to prime pump and remove trapped air by partially opening V10 (yellow handle) for up to a minute (this can also be done with the pump off, using gravity) Adjust V7 to allow about 28‐30 GPM flow at FM3 FM4 flow should start at about 4‐5 GPM and decrease as solution becomes more concentrated Level in UF tank should decrease as UF permeate is removed to drain
73
NOTE: Heater should be turned off if run in batch mode, to make sure the fluid level in the tank does not drop below the heater element. Semi‐Continuous Operation Refill UF tank with RO concentrate as needed to get desired volume of treated fluid (Note: A concentration factor of about 300 is needed to generate 25 wt % silica solution from 700‐1000 ppm starting solution. For tank of 350 gallons only about one gallon of product will be generated per 300 gallon batch. For this reason, the operator will need to episodically re‐fill the UF tank with additional RO concentrate to obtain multiple tank volumes for processing. Total flows into and out of the system are recorded on the flow meters on the RO concentrate (FM2) and UF permeate (FM4) to enable quantification of the total fluid volumes and silica content of final solution. NOTE: Based on volumes calculated from the tank dimensions, it appears that FM2 does not record the correct volume. FM2 totals need to be multiplied by 0.957. FM4 appears to record nearly the same volumes as determined by measuring fluid level in the tank. Batch Operation Fill UF tank to maximum level mark Note initial fluid temperature in tank Turn on stirrer Turn on heater if desired After aging, start UF pump Run UF until tank level drops to about 35 gallons (10x concentration) or when air starts being sucked into UF pump line Collect concentrate sample (need to be flexible here) via V10, or by attaching a line to the drain beneath the tank Clean tank according to protocol below
74
Ultrafiltration (UF) clean-in-place and shutdown
Close V7 slowly unit flow (FM3) is less than about 9 gpm, permeate flow should be less than 1 gpm. Turn off UF pump Now need to feed fresh water to flush system Connect line on UF tank to send UF feed to sump (loose hose near high tank inlet) Connect CIP hose to UF line (as labeled) Close valve V8 Open V9 – Discharge line from CIP tank Open V10 slightly Start CIP pump – fluid should be flowing through UF membranes and into tank Open V10 and V5 fully and run for 10‐20 minutes (UF conc. should be at about 15‐20 gpm, UF permeate should be about 3 gpm Stop CIP pump Close valve V10 Drain UF product tank to ground (open connection on bottom) Now want to flush UF product tank Reconnect feed to UF tank Leave bottom of UF tank open for rinse Partially open V5 and V10 and start CIP pump Open V5 and V10 fully Allow to flow for a few minutes to rinse UF tank, stop CIP pump Reconnect bottom line of tank Start CIP pump and fill UF tank to about 150 gallons (7‐8 minutes) Shut off CIP pump Open V8, close V10 Reconnect UF feed to sump tank Run UF pump until tank fluid gone (to clean the rest of the UF line and UF pump) Open bottom and drain UF tank Done! ISSUES: Recording of total flow through RO and UF ‐ procedure
75
Appendix 2. Pilot plant operating data
76
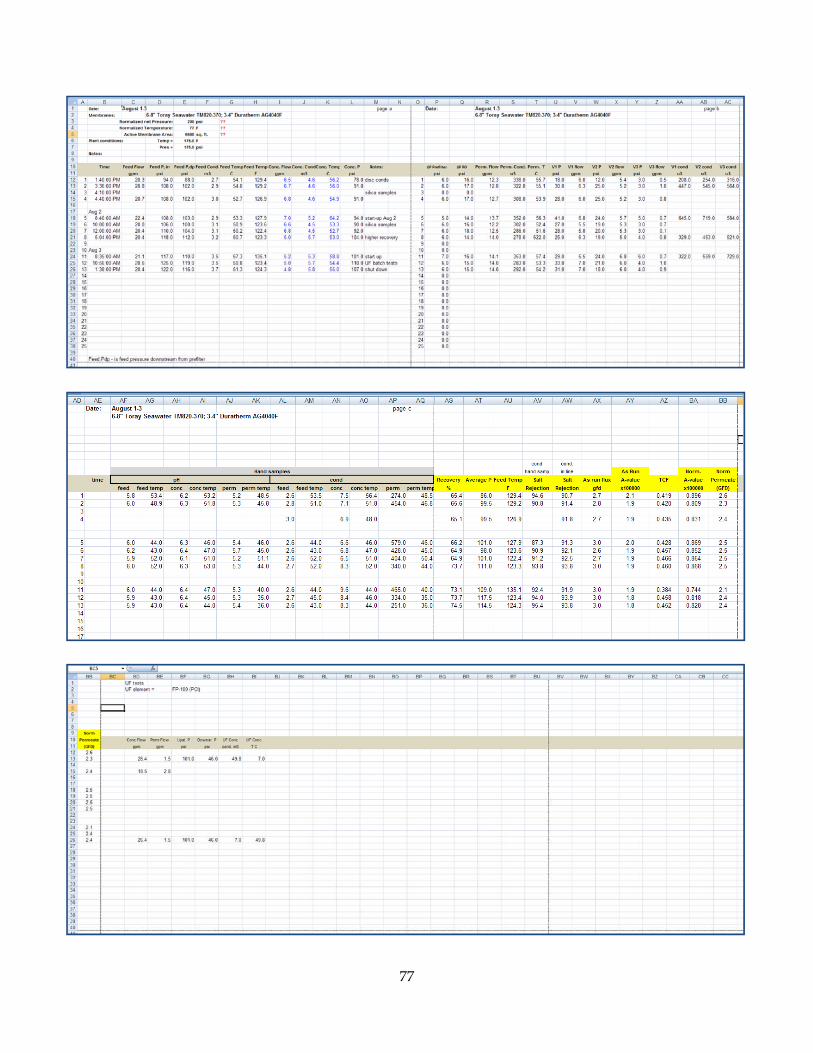
77
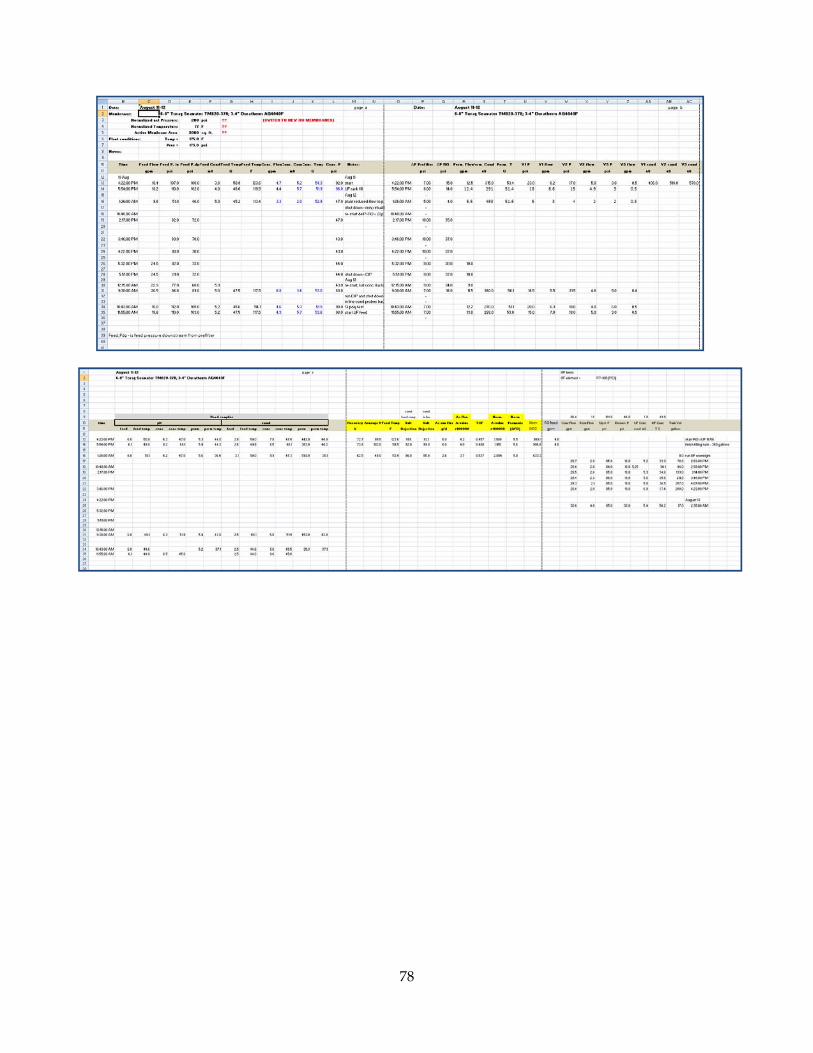
78
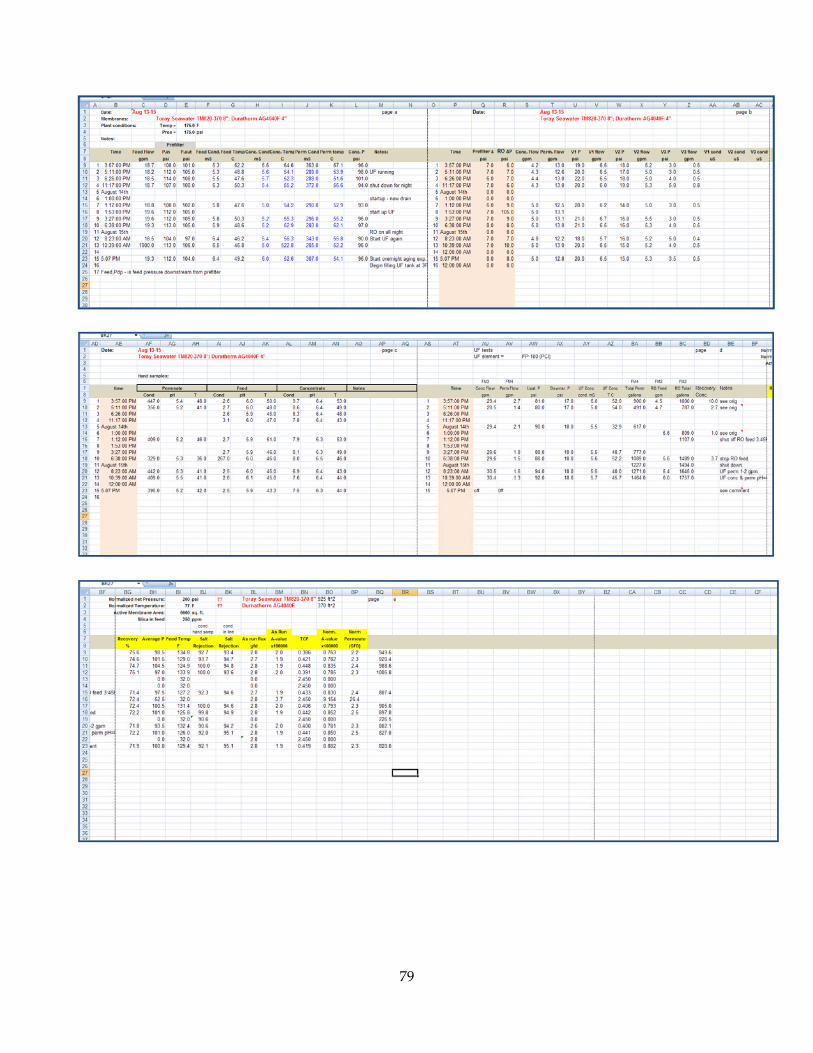
79
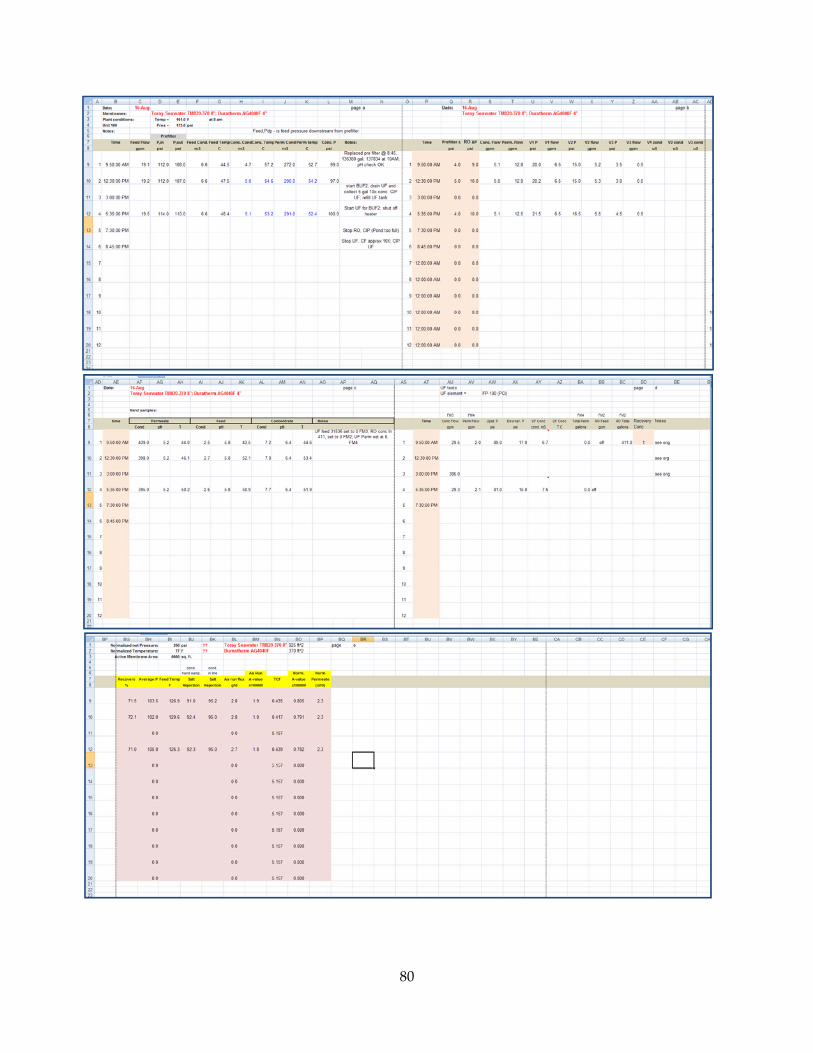
80
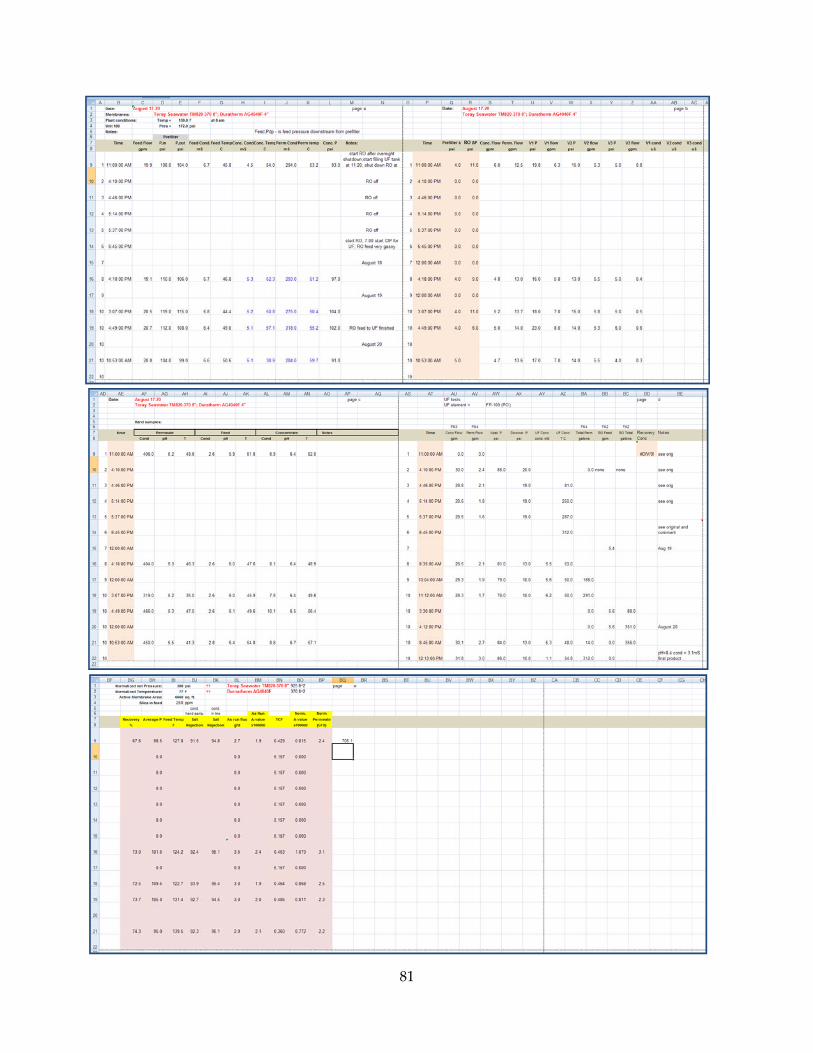
81
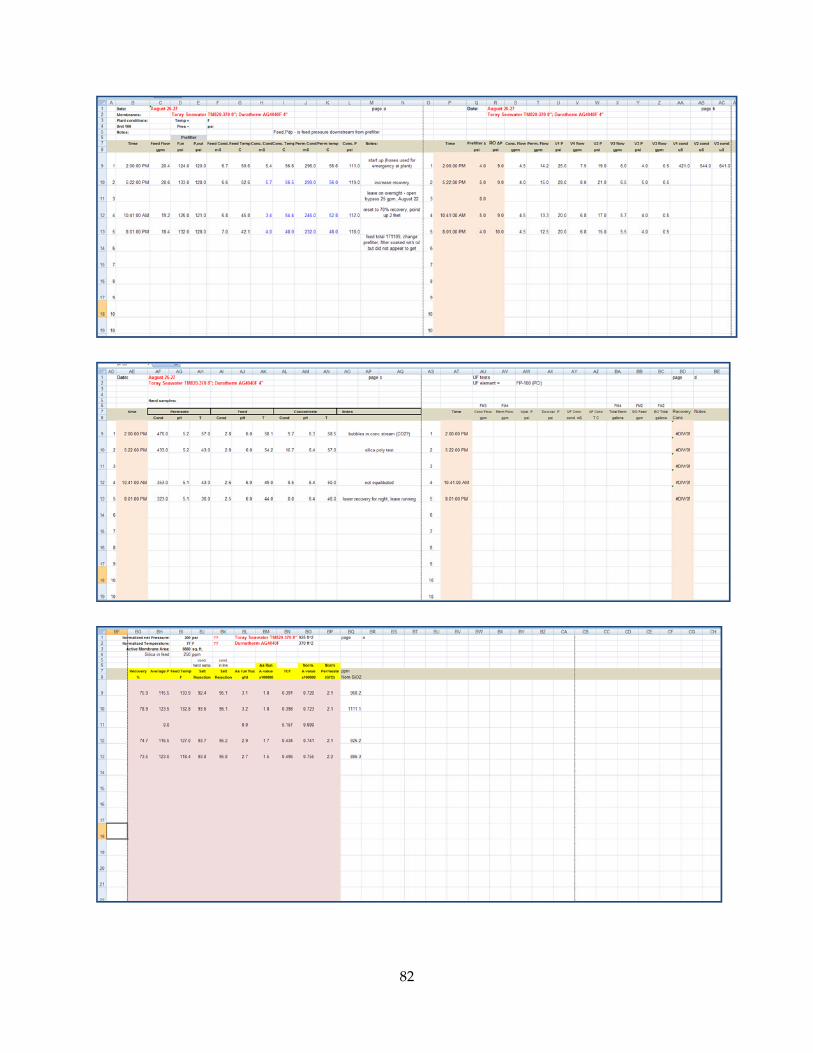
82
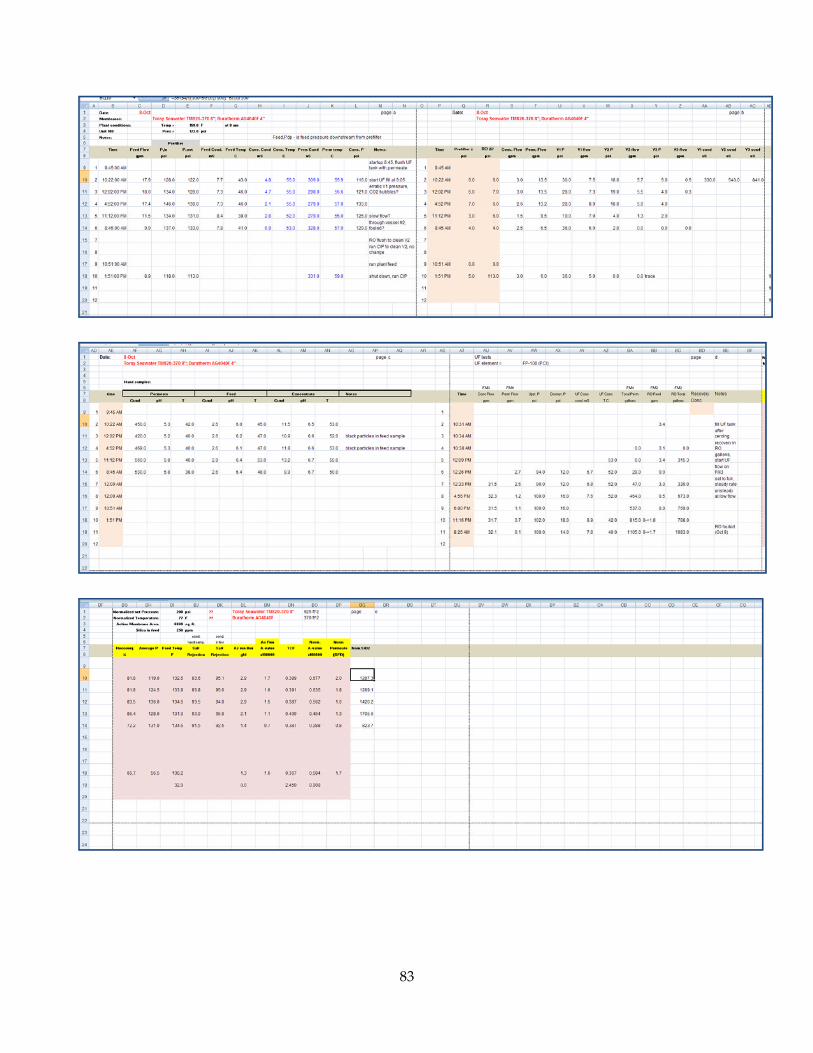
83
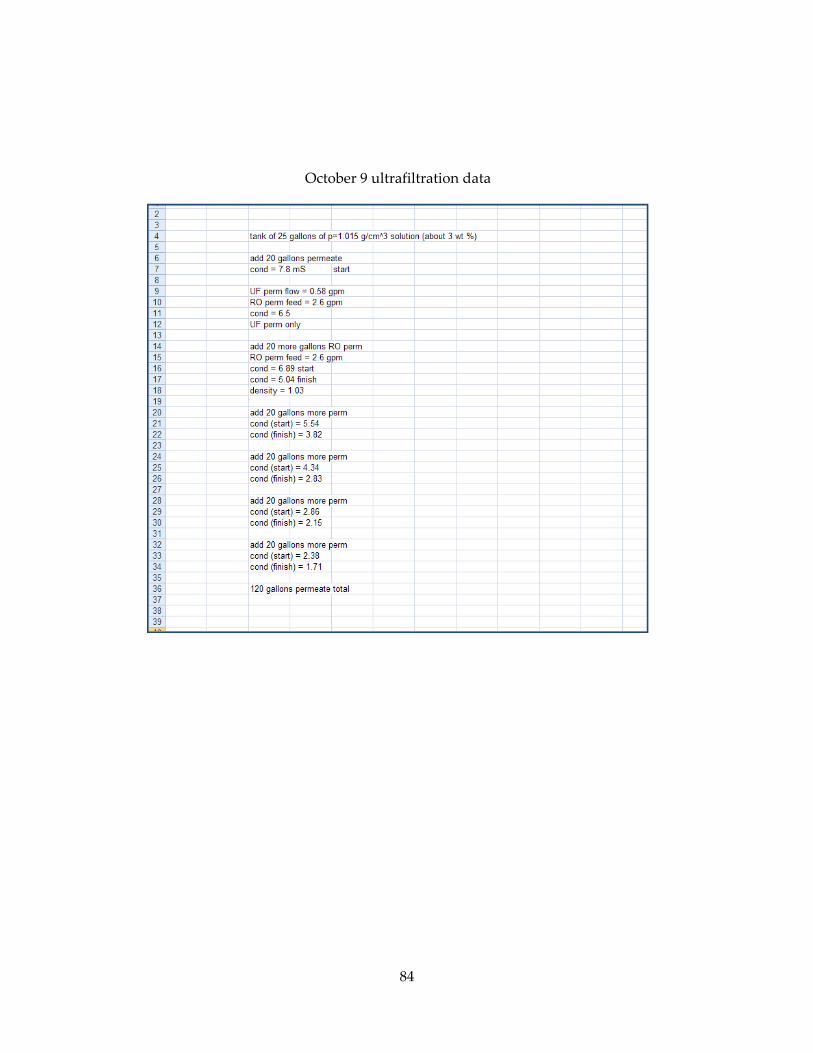
84
October 9 ultrafiltration data