pilot study of inside-out and outside-in hollow fiber uf modules as direct pretreatment of seawater...
TRANSCRIPT

Pilot study of inside-out and outside-in hollow fiberUF modules as direct pretreatment of seawater
at low temperature for reverse osmosis
Jia Xua, Guoling Ruanb, Xueli Gaoa, Xianhui Panb, Baowei Sua, Congjie Gaoa*
aCollege of Chemistry and Chemical Engineering, Ocean University of China, Qingdao 266003, ChinaTel./Fax: +86 (0532) 6678-1872; email: [email protected]
bInstitute of Seawater Desalination and Multi-purpose Utilization, Tianjin 300192, China
Received 3 September 2006; Accepted 19 April 2007
Abstract
The essential point for a successful seawater reverse osmosis (SWRO) plant is pretreatment that providesconsistent and high-quality feed to SWRO membranes. Advances in membrane technology and increasingrequirements on water quality have stimulated the use of ultrafiltration (UF) for SWRO pretreatment. In this study,inside-out (module A) and outside-in (module B) hollow fiber UF modules were adopted as the pretreatment priorto SWRO desalination at Qingdao Jiaozhou Bay, the Yellow Sea of China. The performances of the two moduleswere compared to operation parameters and permeate qualities. Based on the flux data, TMP and permeability, theoutside-in UF module consistently performed better with an air enhanced backwash than the inside-out one usinga chemical enhanced backwash, which was not particularly efficient for the outside-in module. As to permeatequality, both modules met the demand of the SWRO feed.
Keywords: Ultrafiltration; Pretreatment; SWRO; Inside-out; Outside-in
1. Introduction
Worldwide concern of the vast scarcity offresh water is increasing daily. Seawater desali-nation has become an important way to solve the
*Corresponding author.
Currently, reverse osmosis (RO) is one of themost prevalent methods for seawater desalination.However, a crucial drawback is the susceptibilityof RO membrane fouling due to the presence ofcolloidal, particulate, dissolved organics andinorganic matter in feed water and biologicalgrowth in the RO system. As a result, the criticalfactor for a successful SWRO plant is pretreat-
Desalination 219 (2008) 179–189
0011-9164/08/$– See front matter © 2008 Published by Elsevier B.V.
crisis of fresh water resources in the world.
doi:10.1016/j.desal.2007.04.055

J. Xu et al. / Desalination 219 (2008) 179–189180
ment, which can reduce the fouling potential ofthe intake seawater and provide consistently high-quality feed to SWRO membranes.
Ultrafiltration (UF) is a kind of pressure-driven membrane process which has many advan-tages such as smaller dimensions of the overallplant and footprints than conventional pretreat-ment. It consists of coarse screens, sand filters,media filters and microcartridge filters, an abso-lute barrier to suspended particles, colloids,macromolecules, algae and bacteria. It requireslittle or no chemical consumption, and is consis-tent in producing high-quality product waterindependent of raw seawater quality.
According to the separation layer on the innersurface or outer surface of fibers, hollow fiber UFmembranes can be sorted into inside-out andoutside-in mode. An inside-out UF hollow fibermodule means that the separation layer is theinner surface of fibers and the feed water flowsinside the fibers and the permeate flows outsidethe fibers. The outside-in mode means theseparation layer is on the outside surface of thefiber and the feed water flows outside the fibers.
Several researchers have investigated usinghollow fiber UF membranes as a pretreatment ofSWRO. Ahmad et al. [1] concluded that theinside-out hollow fiber UF process promises to bea simple, easy-to-use, and robust alternative to thecumbersome conventional pretreatment. Hoof etal. [2] conducted a pilot in Addur using anX-Flow hollow fiber UF membrane (inside-out)as pretreatment for half a year, which used achemically enhanced backwash (CEB) (nitricacid) and chemical cleaning (an agent based onEDTA and enzymes) to stabilize the transmem-brane pressure (TMP). The inside-out UF pro-vided water with a stable quality of SDI values aslow as 1.5. Chua et al. [3] also concluded that thehollow fiber UF (outside-in) process was anexcellent alternative to conventional pretreatment.The improved maintenance procedures such asfiltrate backwashing and air scouring, complete
flux and pressure recoveries were achievable withminimal use of chemicals during the experiments.Pearce et al. [4] utilized a HYDRAcap UFmodule (inside-out) as an alternative to conven-tional pretreatment to improve RO feed quality.The trial operated at a flux of 95 L m!2h!1 and ata TMP of 0.15–0.2 bar. The UF permeate SDIvalues were well below 2. Merrilee and James [5]successfully supplied a UF–SWRO system to thegovernment of the United Arab Emirates thattreats about 11.4 million liters (3 million gallons)of seawater a day with UF to supply 3.8 millionliters (1 million gallons) to the SWRO system.Though a large number of seawater UF pilotstudies have been conducted, few studies on thecomparison of outside-in and inside-out UFmodules and on low-temperature trails have yet tobe reported.
In this pilot study, an inside-out (module A)and outside-in (module B) UF hollow fiber mem-brane modules operated exclusively in dead-endmode were chosen for the SWRO pretreatment atJiaozhou Bay, Qingdao, China. The objective ofthis paper is to compare the performance of bothUF modules and investigate the feasibility andpracticality of UF membranes at very lowtemperatures (about 2–7EC).
2. UF experiments
2.1. Characteristics and process of the two UFsystems
Both the inside-out and outside-in hollow fibermembrane modules—module A and module B—were applied as SWRO pretreatment. In order toevaluate the anti-pollutant ability and stability ofUF modules, the UF set-up intakes seawaterdirectly only by coarse prescreening to protect themembranes from large debris. UF backwashingwaste was rejected back to the sea. The schematicdiagram of the two UF pilot testing systems isshown in Fig. 1.

J. Xu et al. / Desalination 219 (2008) 179–189 181
Fig. 1. Process flow diagram of the pilot system.
Fig. 2. Photographs of the two UF modules. Left: the inside-out UF module; right: the outside-in UF module.
As shown in Fig.1, each UF system has itsown filtration, and chemically enhanced back-wash (CEB)/air enhanced backwash (AEB)procedure and set-up. For each filtration proce-
dure, raw seawater from the feed tank waspumped by feed pump to the module, the filtrateoverflowed its backwash tank and then wasrejected back to the sea. For each backwash

J. Xu et al. / Desalination 219 (2008) 179–189182
Table 1Characteristics of the UF modules
Items Module A Module B
Membrane materialOperation modeCartridge dimension, mmMolecular weight cut-off, KDaMembrane effective area, m2
Fiber inner/outer diameter, mmAnti-chlorine, ppm Maximum applied pressure, MPaMaximum flow of any module, m3/h
PES/PVPInside-outФ200×1500150400.8/1.5#5000.524
PVDFOutside-inФ225×1810100520.7/1.3#50000.64.3
procedure, filtrate from the backwash tank waspumped by the BW pump to the module. Formodule A, the effluent was discharged alterna-tively from both sides of the module during onebackwash procedure. For module B only effluentwas discharged from the lower side of themodule. Moreover, the AEB was adopted formodule B. For each CEB procedure, filtrate fromthe backwash tank was pumped and mixed withthe chemicals pumped from the chemical tank,and then was fed to the module. The effluent wasdischarged from the lower side of the module. Formodule A, the chemicals used were NaClO andHCl; for module B, only NaClO was used.
Fig. 2 shows photographs of the pilot testingcontainer of the UF modules. Table 1 gives themain characteristics of both membrane systems.
2.2. Experimental procedure
In order to compare and evaluate the stabilityof the two UF modules operated at low tempera-tures (2–7EC), the trial was carried out in fourphases. During each pilot test, dead-end modefiltration operation was used, and backwashfrequency was fixed at 25 min.C Phase 1: operation at each designed flux. The
first phase of the pilot test lasted for 460 h. Inthis phase, the feed to the UF trial set-up was
taken directly from the sea. The UF systemswere operated at each designed flux.
C Phase 2: operation at up to 120% eachdesigned flux. The second phase of the pilottest lasted for 260 h. In order to further inves-tigate the long-term feasibility of the UF sys-tems, the flux of UF was raised up to 120% ofdesigned flux.
C Phase 3: operation at each designed flux underthe condition of CEB. The third phase of thepilot test lasted for 130 h. In this phase, theUF systems were operated at each designedflux. An additional CEB based on NaClO orHCl was made every 12 h. This procedure wascarried out automatically on the pilot set-up.
C Phase 4: operation at up to 120% of everydesigned flux under the condition of CEB.The fourth phase of the trial lasted for 130 hwhere flux of the UF systems was increasedup to 120% for each designed flux. An addi-tional CEB made every 12 h was carried outautomatically on the pilot set-up. The objec-tive of this phase was to investigate theefficiency of CEB/AEB under worst-caseconditions.
2.3. Operation parameters
The main operation parameters of the two UF

J. Xu et al. / Desalination 219 (2008) 179–189 183
Table 2Operation parameters of inside-out UF system (module A)
Parameter Phase 1 Phase 2 Phase 3 Phase 4
Designed permeate flux, Lm!2h!1 75–80 90–95 75–80 90–95Feed pressure, bar 0.15–0.8 0.3–0.9 0.3–0.6 0.4–0.8Filtration duration, min 25 25 25 25Backwash duration, s 40 40 40 40Backwash procedure Flush
backwash flush Flushbackwash flush
Flush backwash flush
Flushbackwash flush
Flow rate of backwash, m3h!1 8 8–10 8–10 8–10Backwash pressure, bar 0.6–0.7 0.6–0.7 0.6–0.7 0.6–0.7CEB duration, s 8 8 8 8Frequency of CEB, h Not certain 24 12 12Chemical of CEB HCl/NaClO HCl/NaClO HCl/NaClO HCl/NaClOHCl, mgL!1 228 228 228 228NaClO, mgL!1 76 76 76 76Recovery, % 90 91.5 89.5 90
Table 3Operation parameters of outside-in UF system (module B)
Parameter Phase 1 Phase 2 Phase 3 Phase 4
Designed permeate flux, Lm!2h!1 45 57 50 60Feed pressure, bar 0.15–0.6 0.5–0.8 0.5–0.6 07–0.9Filtration duration, min 25 25 25 25Backwash duration, s 50 50 50 50Backwash procedure Backwash
(AEB) flushBackwash(AEB) flush
Backwash(AEB) flush
Backwash(AEB) flush
Flow rate of backwash, m3h!1 5.5–6 5.5–6 5.5–6 5.5–6Backwash pressure, bar 0.14–0.16 0.14–0.16 0.14–0.16 0.14–0.16AEB duration, s 50 50 50 50Flow rate of AEB, m3h!1 4 4 4 4Frequency of CEB, h — — 24 24CEB duration, s — — 5 5Chemical of CEB — — NaClO NaClONaClO, mgL!1 — — 5.5 5.5Recovery, % 87–88 92 90 92
modules are presented in Tables 2 and 3,respectively.
3. Results and discussion
3.1. Properties of raw seawater
The pilot test was conducted during the cold-
J. Xu et al. / Desalination 219 (2008) 179–189184
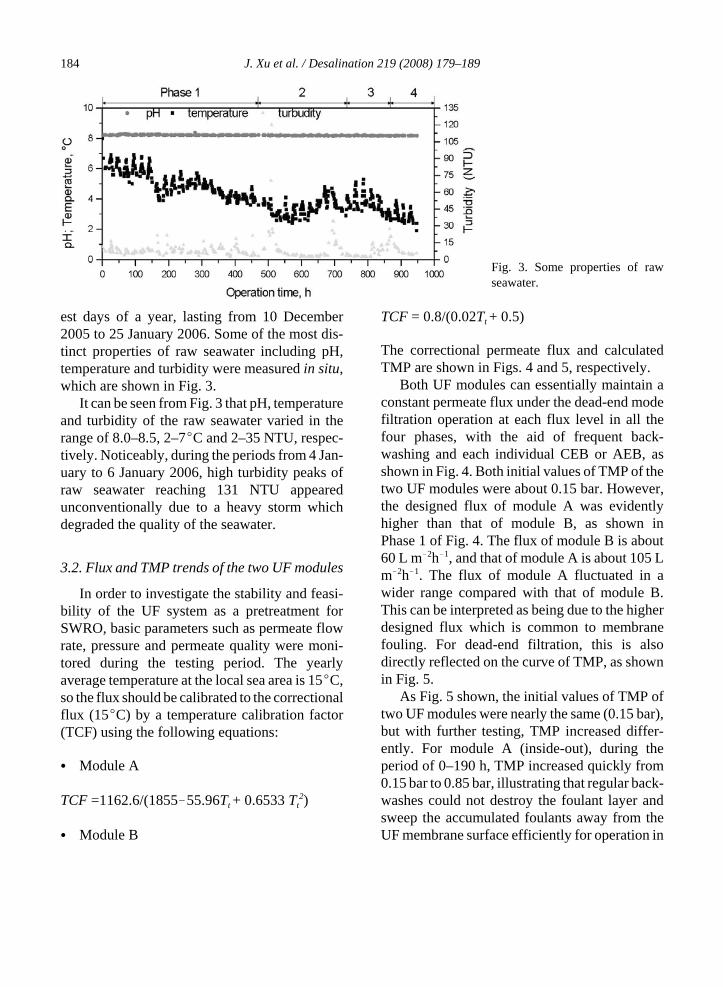
Fig. 3. Some properties of rawseawater.
est days of a year, lasting from 10 December2005 to 25 January 2006. Some of the most dis-tinct properties of raw seawater including pH,temperature and turbidity were measured in situ,which are shown in Fig. 3.
It can be seen from Fig. 3 that pH, temperatureand turbidity of the raw seawater varied in therange of 8.0–8.5, 2–7EC and 2–35 NTU, respec-tively. Noticeably, during the periods from 4 Jan-uary to 6 January 2006, high turbidity peaks ofraw seawater reaching 131 NTU appearedunconventionally due to a heavy storm whichdegraded the quality of the seawater.
3.2. Flux and TMP trends of the two UF modules
In order to investigate the stability and feasi-bility of the UF system as a pretreatment forSWRO, basic parameters such as permeate flowrate, pressure and permeate quality were moni-tored during the testing period. The yearlyaverage temperature at the local sea area is 15EC,so the flux should be calibrated to the correctionalflux (15EC) by a temperature calibration factor(TCF) using the following equations:
C Module A
TCF =1162.6/(1855!55.96Tt + 0.6533 Tt2)
C Module B
TCF = 0.8/(0.02Tt + 0.5)
The correctional permeate flux and calculatedTMP are shown in Figs. 4 and 5, respectively.
Both UF modules can essentially maintain aconstant permeate flux under the dead-end modefiltration operation at each flux level in all thefour phases, with the aid of frequent back-washing and each individual CEB or AEB, asshown in Fig. 4. Both initial values of TMP of thetwo UF modules were about 0.15 bar. However,the designed flux of module A was evidentlyhigher than that of module B, as shown inPhase 1 of Fig. 4. The flux of module B is about60 L m!2h!1, and that of module A is about 105 Lm!2h!1. The flux of module A fluctuated in awider range compared with that of module B.This can be interpreted as being due to the higherdesigned flux which is common to membranefouling. For dead-end filtration, this is alsodirectly reflected on the curve of TMP, as shownin Fig. 5.
As Fig. 5 shown, the initial values of TMP oftwo UF modules were nearly the same (0.15 bar),but with further testing, TMP increased differ-ently. For module A (inside-out), during theperiod of 0–190 h, TMP increased quickly from0.15 bar to 0.85 bar, illustrating that regular back-washes could not destroy the foulant layer andsweep the accumulated foulants away from theUF membrane surface efficiently for operation in

J. Xu et al. / Desalination 219 (2008) 179–189 185
Fig. 4. Correctional flux trends ofthe two UF modules.
Fig. 5. TMP trends of the two UFmodules.
a dead-end mode. A higher TMP promoted cakecompaction and thus made backwashing moredifficult. So, the effective way to decrease TMPis to use a CEB. After a CEB (HCl + NaClO)process, TMP returned to 0.35 bar. From then on,CEB was used as soon as the TMP exceeded0.7 bar. Despite six CEBs, the trend of TMP wasstill increasing. Therefore, at 395 h, a chemicalcleaning was performed and the TMP was suc-cessfully restored to its initial value, indicatingthat no irreversible fouling was deposited on themembrane surface. In phase 2, although theapplied flux was modulated from 105 L/m2h up to135 L/m2h, TMP fluctuated from 0.3 to 0.7 barand had no distinct increase compared with that
of phase 1. The phenomenon might be explainedthat the accumulated foulants were too compactto remove during the initial 0–190 h in phase 1because of no CEB; however, in phase 2, as aresult of more frequent CEB (per 24 h), the foul-ants were swept away and accumulated impactwas not too serious. At the end of phase 2, achemical cleaning was performed once again,which worked well to restore TMP to 0.2 bar,approaching its initial value of 0.15 bar. Inphase 3, the applied flux was reset to the designedflux and the frequency of CEB (HCl + NaClO)was modulated to 12 h. The increase of TMP wasnot that much more than in phases 1 and 2, andfluctuated from 0.25 to 0.7 bar. In phase 4, the

J. Xu et al. / Desalination 219 (2008) 179–189186
condition of CEB was the same as phase 3, butwith the applied flux adjusted to 120% of thedesigned flux, TMP varied from 0.40 to 0.75 bar,significantly higher than that of phase 3.
For module B (outside-in), AEB was per-formed during all testing times and CEB (NaClO)was performed only in phases 3 and 4. As shownin Fig. 5, due to AEB, TMP increased less rapidlythan module A, especially in phase 1. It is thebubbling action during air scouring that serves toloosen the cake layer so that the accumulatedfoulant may be easily removed during the filtratebackwashing. Therefore, AEB is more effectivefor the outside-in UF hollow fiber, module B.
Chemical cleaning was adopted after phase 1,and the TMP decreased from 0.4 to 0.25 bar. Itcan be seen that chemical cleaning is not effectivefor low TMP. That is to say, at the end of phase1, the UF membrane was not seriously fouled.However, after phase 1, TMP increased morequickly, from 0.25 to 0.65 bar, mainly becausethe applied flux was adjusted to 120% of thedesigned flux. Chemical cleaning was adoptedagain after phase 2, and the TMP decreased from0.65to 0.2 bar, which means that chemical clean-ing is only more effective for high TMP. Forphases 3 and 4, with the aid of frequent CEB, theincrease trend of TMP was not as quick as inphase 2.
3.3. Permeability trends of two UF modules
Permeability is an integrative parameter usedto evaluate performance of a membrane relatingflux and TMP. It can be calculated according tothe following equation:
Permeability = flux/TMP, Lm!2h!1bar!1
The high value of permeability represents theoutstanding performance of a membrane, whichmay be attributed to the following aspects:C more permeate can be produced under
comparatively low TMP, so pumping con-
sumption could be lower to economize opera-tional electricity cost.
C As the TMP decreases, concentration polariza-tion is weakened; therefore, the accumulationof matter on the membrane surface is less withthe decrease of TMP, so that lower TMP isprone to simplify the cleaning process andprolong the life span of the membrane.
The results of permeability of two UF modulesare shown in Fig. 6. According to these data,permeability of both modules A and B had adeclining trend to a different extent; but as awhole, permeability of module B was moreconstant than that of module A. For module A,the initial value of permeability was very high(710 Lm!2h!1bar!1), but a quick attenuationappeared from 710 Lm!2h!1bar!1 to less than200 Lm!2h!1bar!1. Similarly, rapid increase of
perm
eability was found immediately after eachCEB. As for module B, the curve of permeabilitywas comparatively balanced and was maintainedin the range of 150–200 Lm!2h!1bar!1. Thus,module B had a more stable performance thanmodule A.
3.4. Membrane integrity testingMembrane integrity testing is an assurance
that the membrane system is intact and arts as aphysical behavior between the filtered water andthe feed water. It is noted that membrane integritytesting can be classified as direct or indirect.Direct integrity test applied pressurized air (about0.8 bar) to the product side of the membranewhich is filled with liquid. If there are bubblesfrom the feed and brine side, this indicates thatsome of the membrane fibers have been broken.Thus, the fiber breakage rate is an importantparameter for evaluating how intact the mem-brane is. With this test, the number of brokenfibers of modules A and B are 2 and 1, respec-tively. The indirect integrity test is about turbiditymonitoring. An intact membrane would be

J. Xu et al. / Desalination 219 (2008) 179–189 187
Fig. 6. Permeability trends of the two UF modules.
expected to show a 90% reduction in turbidityfrom feed to filtrate. The result is shown in Fig. 7.
3.5. Permeate quality of the two UF modules
Apart from the operational parameters above,permeate qualities such as SDI15 and turbiditywere also measured during the long run to deter-mine whether the permeate qualities of these twoUF modules could meet the demands of SWRO.The tendency of SDI15 of the two UF modulespermeate is presented in Fig. 8.
As shown in Fig. 8 for module A, all the SDI15values of UF permeate were below 3.0 and 88%of all measurements less than 2.5; the mean valueof the measurements was 2.3. During the periodof 0–190 h, SDI15 increased with TMP, whichmay indicate that with filtration, the accumulationof foulant on the UF membrane surface increased,causing a higher permeation concentration in thefiltrate. This may be demonstrated by thedecrease of the SDI15 values after each CEB andafter a chemical cleaning. For module B, theSDI15 values were initially about 0.5 but subse-quently increased to about 2.4 and then fluctuatedfrom side to side at 2.0. All the SDI15 data of UFpermeate were below 2.4 and 75% were below2.0 and 12% of all measurement less than 1.0, the
average value was 1.8, lower than that of moduleA, which might bear on the difference of themolecular weight cut-off (MWCO) between twoUF modules. Even through the worst periods, thevalues of SDI15 were no more than 2.5, which cansatisfy the need of RO feed water. We considerthat SDI, one of the most important parametersfor the characterization of RO feed water, wasreduced efficiently by both modules A and B.
Fig. 7 displays the results of permeate tur-bidity and removal ratio of the two UF modules.It can be seen from Fig. 7(a) that for module A,the turbidity of UF permeate and removal ratiovaried in the range of 0.05–0.12 NTU and96.3–99.8%. The average value was 0.78 NTUand 99%, respectively. For module B, turbidity ofUF permeate and removal rate fluctuated in therange of 0.05 to 0.12 NTU and 95.5–99.9% [asshown in Fig. 7(b)]. The average value was0.88 NTU and 98.6%, respectively. It is worthnoticing that very high turbidity peaks (above120 NTU) of raw seawater appeared unconven-tionally during 480 h to 520 h, but the turbidity ofthe module A and B permeate was stable (fluc-tuating from 0.07 to 0.09 NTU and from 0.10 to0.12 NTU, respectively), which demonstrated thatthe UF system was able to face the degraded feedwater in that case.

J. Xu et al. / Desalination 219 (2008) 179–189188
(a)
(b)
Fig. 7. Tendency of turbidity and removal rate of UF permeate.
Fig. 8. SDI15 of UF permeate.

J. Xu et al. / Desalination 219 (2008) 179–189 189
4. Conclusions
Based on the comparison of the inside-out andoutside-in modules, some main conclusions canbe drawn as follows:C Both the outside-in and inside-out UF
modules essentially maintained a constant per-meate flux at each operation flux under dead-end mode filtration operation with the aid offrequent backwashing and individual CEB orAEB. CEB showed no distinct efficiency forthe outside-in module.
C TMP increased with operational time at eachtest phase and increased more quickly in thecase of high operation flux (phases 2 and 4).
C The inside-out module A with higher permea-bility is more apt to foul than the lower per-meability outside-in module B.
C Permeate quality of module B is better thanmodule A, but both can meet the demands ofSWRO feed despite the variation of the rawseawater quality.
C The utilization of hollow fiber UF membranesat very low temperatures (about 2–7EC) isfeasible and practical, the results of whichprovide excellent experience for the applica-tion of UF as pretreatment of SWRO at lowtemperature.
Acknowledgements
The authors would like to express theirappreciation to the Institute of Seawater Desali-nation and Multipurpose Utilization, SOA(Tianjin) and the Huangdao power plant of Chinafor their contribution in the success of the pilottests.
References
[1] M.A. Ahmad and F.A. Aleem, Scale formation andfouling problems effect on the performance of MSFand RO desalination plants in Saudi Arabia.Desalination, 93 (1993) 287–310.
[2] S.V. Hoof, A. Hashim and J.A. Kordes, The effectof ultrafiltration as pretreatment to reverse osmosis inwastewater reuse and seawater desalination applica-tions. Desalination, 124 (1999) 231–242.
[3] T.K. Chua, A.M.N. Hawlader and A. Malek,Pretreatment of seawater: Results of pilot trials inSingapore. Desalination, 159 (2003) 225–243.
[4] G. Pearce, S. Talo, K. Chida, A. Basha and A.Gulamhusein, Pretreatment options for large-scaleSWRO plants: case studies of UF trials at Kindasa,Saudi Arabia, and conventional pretreatment inSpain. Desalination, 167 (2004) 175–189.
[5] G. Merrilee and M. James, Ultrafiltration forseawater reverse osmosis pretreatment. Membr.Technol., 1 (2004) 5–8.