pinti_2014
TRANSCRIPT
lable at ScienceDirect
Journal of Environmental Radioactivity 136 (2014) 206e217
Contents lists avai
Journal of Environmental Radioactivity
journal homepage: www.elsevier .com/locate / jenvrad
222Rn activity in groundwater of the St. Lawrence Lowlands, Quebec,eastern Canada: relation with local geology and health hazard
Daniele L. Pinti a, *, Sophie Retailleau a, Diogo Barnetche a, Floriane Moreira a,Anja M. Moritz b, Marie Larocque a, Yves G�elinas b, Ren�e Lefebvre c, Jean-François H�elie a,Arisai Valadez a
a GEOTOP and D�epartement des sciences de la Terre et de l'atmosph�ere, Universit�e du Qu�ebec �a Montr�eal, CP 8888 Succ. Centre-ville, H3C 3P8, Montr�eal, QC,Canadab GEOTOP and Department of Chemistry and Biogeochemistry, Concordia University, 7141 Sherbrooke Street West, H4B 1R6 Montr�eal, QC, Canadac Institut national de la recherche scientifique, Centre Eau Terre Environnement (INRS-ETE), 490 rue de la Couronne, G1K 9A9 QC, Canada
a r t i c l e i n f o
Article history:Received 27 February 2014Received in revised form8 May 2014Accepted 27 May 2014Available online
Keywords:RadonRadiumGroundwaterQuebecMont-Saint-HilaireHealth hazards
* Corresponding author. Fax: þ1 514 987 3635.E-mail address: [email protected] (D.L. Pinti)
http://dx.doi.org/10.1016/j.jenvrad.2014.05.0210265-931X/© 2014 Elsevier Ltd. All rights reserved.
a b s t r a c t
One hundred ninety-eight groundwater wells were sampled to measure the 222Rn activity in the regionbetween Montreal and Quebec City, eastern Canada. The aim of this study was to relate the spatialdistribution of 222Rn activity to the geology and the hydrogeology of the study area and to estimate thepotential health risks associated with 222Rn in the most populated area of the Province of Quebec. Mostof the groundwater samples show low 222Rn activities with a median value of 8.6 Bq/L. Ninety percent ofsamples show 222Rn activity lower than 100 Bq/L, the exposure limit in groundwater recommended bythe World Health Organization. A few higher 222Rn activities (up to 310 Bq/L) have been measured inwells from the Appalachian Mountains and from the magmatic intrusion of Mont-Saint-Hilaire, knownfor its high level of indoor radon. The spatial distribution of 222Rn activity seems to be related mainly tolithology differences between U-richer metasediments of the Appalachian Mountains and magmaticintrusions and the carbonaceous silty shales of the St. Lawrence Platform. Radon is slightly enriched insodium-chlorine waters that evolved at contact with clay-rich formations. 226Ra, the parent element of222Rn could be easily adsorbed on clays, creating a favorable environment for the production and releaseof 222Rn into groundwater. The contribution of groundwater radon to indoor radon or by ingestion isminimal except for specific areas near Mont-Saint-Hilaire or in the Appalachian Mountains where thiscontribution could reach 45% of the total radioactive annual dose.
© 2014 Elsevier Ltd. All rights reserved.
1. Introduction
Radon (222Rn) is an odorless and colorless radioactive noble gasthat occurs naturally in air, water, rocks and soils (e.g., Ball et al.,1991; Cecil and Green, 2000). 222Rn is an isotope derived fromthe decay chain of 238U and more specifically from the a-particleemission decay of U-daughter element 226Ra adsorbed on soilgrains or contained in minerals. Radon itself decays to 218Po with ahalf-life of 3.8235 days. The decay of 222Rn (and its progeny) resultsin the release of a-particles that are a potential health hazard ifradon is inhaled or ingested (National Research Council, 1999). Arelationship between lung cancer and inhalation of radon decay
.
products has been demonstrated for underground miners (Lubinet al., 1995) and in domestic environments (houses, schools, etc.)(Lubin and Boice, 1997).
Since 1980, when high 222Rn activities were found in homesthroughout the United States, concern has focused on the mecha-nism of 222Rn enrichment in air. However, the majority of 222Rnentering homes is produced underground in rocks and soils and isthen carried to the surface via gas diffusion or groundwatertransport (e.g., Telford, 1983; Nazaroff, 1992). Thus an under-standing of the 222Rn production, escape and transport ingroundwater is of vital importance in predicting health hazards.Radon in groundwater can also contribute, through direct inges-tion, to the indoor annual dose adsorbed by humans (e.g., Vinsonet al., 2008).
Conclusions from several national studies of radon in publicwater supplies and groundwater in the United States (e.g., Horton,
D.L. Pinti et al. / Journal of Environmental Radioactivity 136 (2014) 206e217 207
1983; Hess et al., 1985; Michel and Jordana, 1987; Longtin, 1988)indicate that high radon activity in groundwater occurs inuranium-bearing granite aquifers, in magmatic and metamorphicbedrock aquifers, or when groundwater is present close to faultzones. In the United States, main 222Rn-prone areas include theAppalachian Mountains, the Rocky Mountains and the Basin andRange (National Research Council, 1999). In Canada, 222Rn-proneareas are located in terrains favorable to the emanation of radon,such as magmatic and metamorphic rocks of the Canadian Pre-cambrian shield and their products of alteration (Tilsey et al.,1993).
In Canada, the harsh climate and the limited ventilation ofhomes during the winter season enhance the risk for an increasedconcentration of indoor radon. Voluntary radon surveys in houseswere carried out regularly since 1970 (Health Canada, 2009). Thelatest recommended action level is 200 Becquerel by air cubicmeter (Bq/m3) for indoor radon (Health Canada, 2007). Extendedsurveys for soil gas radon in major Canadian urban areas are brieflysummarized by Chen et al. (2012). The Geological Survey of Canadacarried out detailed studies of radon in ground water since 1980 inSaskatchewan, Ontario and Prince Edwards Island (e.g., Dyck, 1979,1980).
L�evesque et al. (1995) carried out a detailed survey for indoorradon in one thousands homes of the Province of Quebec andshowed that the Gaspe Peninsula and the Appalachian Mountainsregions had the highest222Rn activities, with averages of 120.8 and59.7 Bq/m3 respectively. These data were recently updated byDrolet et al. (2013) to define potential radon emission level mapsin Quebec. Local surveys in homes of the Mount Oka and Mont-Saint-Hilaire areas, two magmatic intrusions located close toMontreal, showed high 222Rn activities (18e10,500 Bq/m3, geo-metric mean of 1245 Bq/m3 in Mount Oka (Savard et al., 1998), and20e1432 Bq/m3, geometric mean of 69 Bq/m3 in Mont-Saint-Hilaire (Dessau et al., 2005)). These high values are due to thehigh U contents in these rocks (Murphy et al., 1978; Savard et al.,1998).
Canadian guidelines for radon in groundwater recommend amaximum activity of 2000 Bq/L. This value is much higher than thelimits recommended in other countries (100 Bq/L is the suggestedvalue by the World Health Organization, 2008). Roireau andZikovsky (1989) carried out a radon survey in 50 drinking waterwells mainly located in a radius of less than 100 km around Mon-treal and in the north of the “Laurentides” region, where Protero-zoic metamorphic rocks of the Grenville Province outcrop. Theymeasured 222Rn activities between 0.2 and 439 Bq/L with a mean of16.9 Bq/L (because the authors did not report all the data, themedian or geometric mean cannot be calculated and reportedhere), and conclude that the measured activities, similar to thosefound in other countries, did not represent a real hazard to waterusers. Chah and Zikovsky (1989) carried out 32 radon measure-ments mostly at the same sites as Roireau and Zikovsky (1989).They measured 222Rn activities between 1.6 and 23.1 Bq/L, exceptfor water samples from the Mount Oka area where the 222Rn ac-tivities ranged from 48 to 627 Bq/L.
Although numerous radon surveys were carried out in theProvince of Quebec, most studies do not provide a spatial analysis ofthe data. This information is important for public health issues. It isalso essential when using 222Rn as a short-term groundwatertracer. This study reports the results of an extensive survey for222Rn in groundwater from local municipal and domestic wells insouthern Quebec (Pinti et al., 2013a). The spatial distribution of222Rn activity in groundwater in relation to the geology and hy-drogeology of the study area and the possible health hazards that222Rn levels could generate in the most populated area of theProvince of Quebec are discussed.
2. Local geology and hydrogeology
The study area covers 15,435 km2 in the St. Lawrence Lowlands,a relatively flat plain between Montreal and Quebec City, delimitedby the Appalachian Mountains to the southeast and by the northshore of the St. Lawrence River to the northwest (Fig. 1). This areacovers totally or partially four administrative regions: Mont�er�egie,Centre-du-Qu�ebec, Chaudi�ere-Appalaches and Mauricie. Threegeological provinces are represented: the Cambrian-Ordovician St.Lawrence Platform; the Ordovician-Devonian Appalachian Moun-tains; and the Cretaceous magmatic intrusions of the MonteregianHills (Fig. 1).
The St. Lawrence Platform corresponds to a Cambrian-LowerOrdovician siliciclastic and carbonate platform having amaximum thickness of ca. 1200 m, overlain by a minimum of ca.1800 m of Middle-Late Ordovician foreland carbonate-clastic de-posits (Lavoie, 2008). Geographically, it corresponds to the flat areabetween Montreal and Quebec City called the St. Lawrence Low-lands. The Ordovician geological units of the St. Lawrence Platformrepresent a regional fractured rock aquifer tapped by the sampledwater wells. The St. Lawrence Platform units of interest in this studyare (Fig. 1): (1) the Utica Shale, a fine-grained limy mudstone withorganic content between 1 and 1.5% targeted for potential shale gasproduction (Lavoie et al., 2013). (2) A turbiditic thick succession (upto 3800 m; Globensky, 1987) of mudstones with subordinatealternating sandstone and siltstone of the Lorraine Group. Thisgroup is the most exposed unit of the St. Lawrence Platform. (3)Finally, the Queenston Group, consisting of post-orogenic shale,sandstone and conglomerate (Globensky, 1987).
The terrains outcropping on the Appalachian Mountains corre-spond to imbricated thrust sheets composed of Cambrian redshales (Shefford Group), followed by alternated dolomitic or calciticschists, quartzites and phyllades (Bennett, Oak Hill and CaldwellGroups). Ordovician terrains are mainly formed by pyritic orgraphitic slates (Stanbridge, Melbourne and Bulstrode formations)to end with black shales alternating with siltstone, sandstone andarkosic greywacke of the Magog Group (Globensky, 1993).
A nearly continuous till sheet, overlaid by discontinuous patchesof unconsolidated Quaternary sediments made of marine andlacustrine silt and clay of the Champlain Sea (11,200e9800 yrs) andsands deposited during marine regression cover the Cambrian-Ordovician sequence of the St. Lawrence Platform (Lamothe, 1989).
The units of the St. Lawrence Platform and the AppalachianMountains are intruded by nine alkaline Cretaceous magmatic in-trusions, named the Monteregian Hills, one of them, Mont-Saint-Hilaire is located in the study area and composed of gabbro, py-roxenite and a few syenite (Eby, 1984).
Most exposed strata in the St. Lawrence Lowlands are sub-horizontal, but are locally affected by mesoscopic open foldingsuch as the Chambly-Fortierville Syncline (Fig. 1). Major structuralfeatures in the study area include the Yamaska Fault, one of themany regional normal faults cutting through the basementeplat-form succession and the Logan's Line (Fig.1) a thrust fault that markthe transition between the St. Lawrence Platform and the Appala-chian Mountains.
The regional aquifers are located in the fractured bedrock ofmoderate hydraulic conductivity (~10�6 to 10�5 m/s). They aresemi-confined or confined. In general, wells in the fracturedbedrock aquifers yield enough water to supply single-familydwellings and, in a few areas, small- to medium-size municipal-ities (Carrier et al., 2013; Larocque et al., 2013a,b). Medium- to high-yield aquifers are found in coarse-grained surficial sediments, suchas the Quaternary glacio-fluvial or fluvial sediments. In areas closeto the St. Lawrence River, most residential wells tap groundwaterfrom the rock aquifer whereas municipal wells tap groundwater

Fig. 1. Geological map of the study area with the location of the sampled wells. Positions of main faults and the Chambly-Fortierville Syncline are also drawn. Redrawn fromS�ejourn�e et al. (2013).
D.L. Pinti et al. / Journal of Environmental Radioactivity 136 (2014) 206e217208
from either the rock or granular aquifers. The main groundwaterflow directions in the bedrock aquifers are SEeNW and follow thegeneral topography, with recharge occurring mostly in the Appa-lachian Mountains and discharge to the St. Lawrence River or itsmain tributaries. Local recharge areas are also distributed in theLowlands, particularly where the impermeable Champlain Seaclays are absent (Carrier et al., 2013; Larocque et al., 2013a,b;Leblanc et al., 2013).
Groundwater chemistry shows the occurrence of low-salinitywater, dominantly of CaeMgeHCO3 type close to the rechargeareas of the Appalachian Mountains. This water evolves into a Na-HCO3 type downstream, probably caused by ion exchange (e.g.,Cloutier et al., 2006), with groundwater electric conductivityranging from 88 to 4466 mS/cm in the study area. Saline ground-water (conductivity from 717 to 31,500 mS/cm) is found in a 10 kmwide zone bordering the St. Lawrence River close to the Chambly-Fortierville syncline (Larocque et al., 2013a,b). This saline ground-water becomes clearly brackish in a 2200 km2 area to the north of
the Mont�eregie Est basin where salinity reaches 5 g/L locally(Beaudry, 2013). 3H-3He ages of the freshwater end-member indi-cate sub-modern water (2e35 yrs old; Pinti et al., 2013b) in theB�ecancour area, while uncorrected 14C activities of the brackishend-member suggest ages of 3000e14,000 years (Beaudry, 2013)corresponding to the Champlain Sea invasion and seawater trap-ping within the clayey Holocene units.
3. Sampling and analytical methods
A total of 198 wells (167 domestic/municipality supply wells, 23drilled observation wells and 8 piezometers) were selected, mostlyon the south shore of the St. Lawrence River, with a few located tothe north of it (Fig. 1). A total of 165 wells tap groundwater from thebasal Ordovician fractured bedrock aquifer system whereas 33wells tap groundwater from sandy Quaternary aquifers. Welldepths range from 20 to 225 m. Most of these wells have also beenstudied as a part of recent groundwater characterization projects
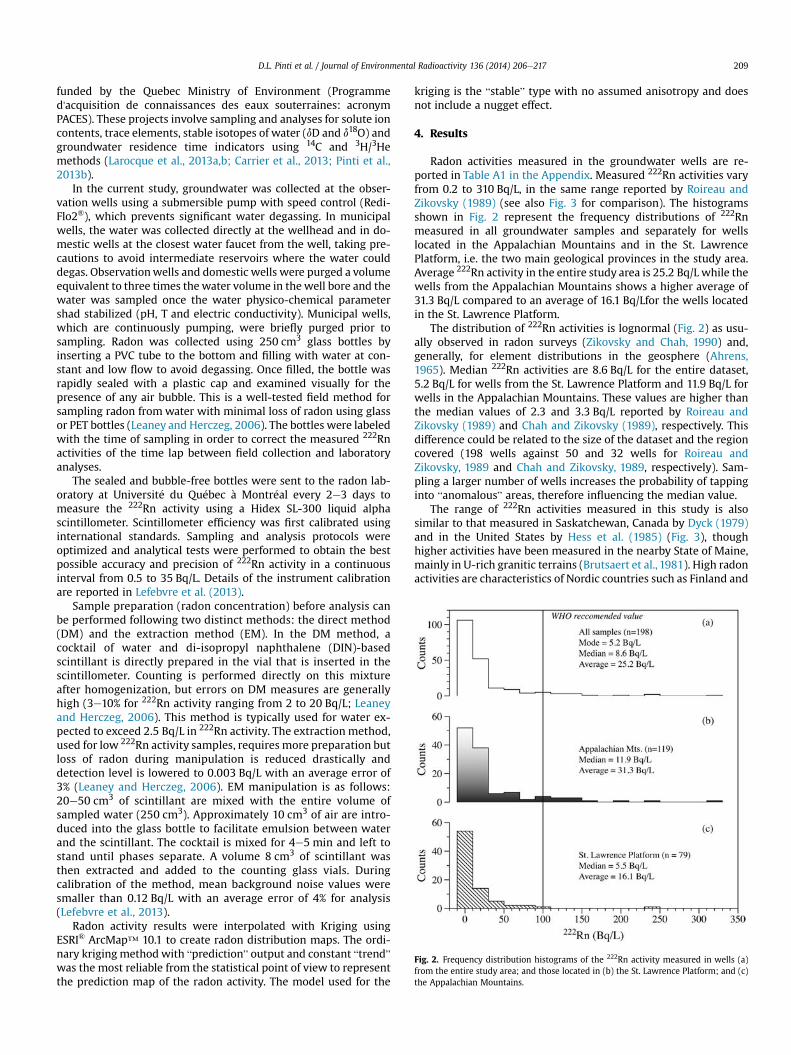
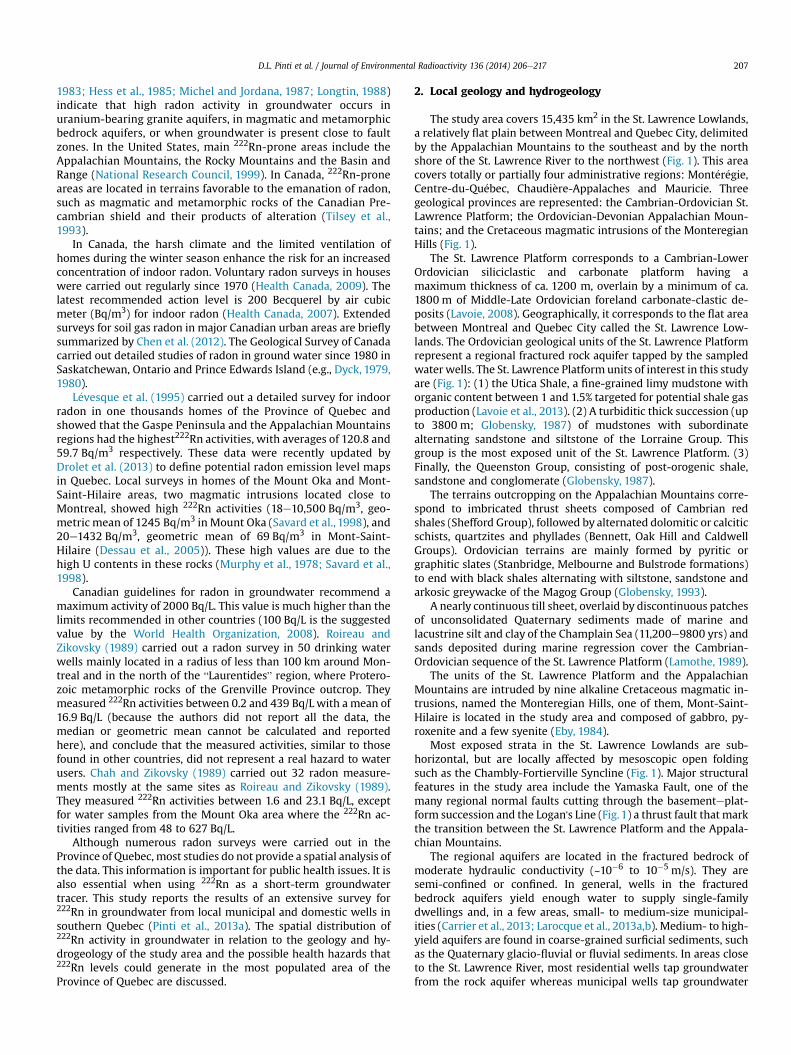
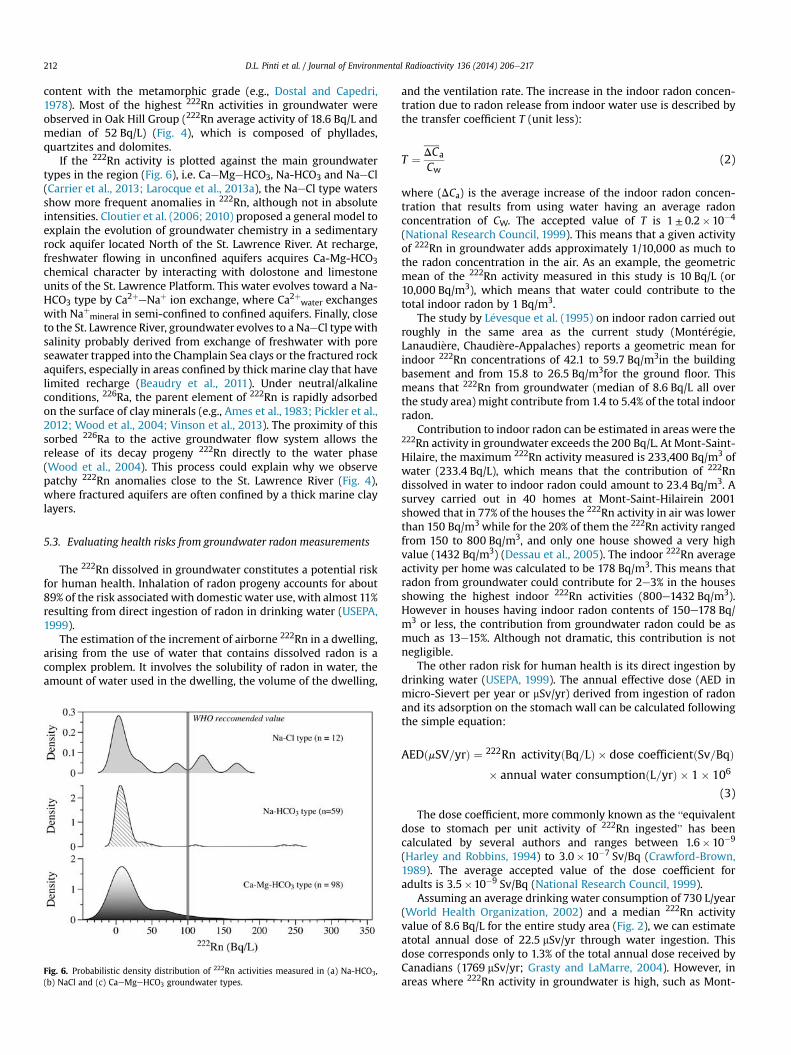
Fig. 2. Frequency distribution histograms of the 222Rn activity measured in wells (a)from the entire study area; and those located in (b) the St. Lawrence Platform; and (c)the Appalachian Mountains.
D.L. Pinti et al. / Journal of Environmental Radioactivity 136 (2014) 206e217 209
funded by the Quebec Ministry of Environment (Programmed'acquisition de connaissances des eaux souterraines: acronymPACES). These projects involve sampling and analyses for solute ioncontents, trace elements, stable isotopes of water (dD and d18O) andgroundwater residence time indicators using 14C and 3H/3Hemethods (Larocque et al., 2013a,b; Carrier et al., 2013; Pinti et al.,2013b).
In the current study, groundwater was collected at the obser-vation wells using a submersible pump with speed control (Redi-Flo2®), which prevents significant water degassing. In municipalwells, the water was collected directly at the wellhead and in do-mestic wells at the closest water faucet from the well, taking pre-cautions to avoid intermediate reservoirs where the water coulddegas. Observationwells and domestic wells were purged a volumeequivalent to three times the water volume in the well bore and thewater was sampled once the water physico-chemical parametershad stabilized (pH, T and electric conductivity). Municipal wells,which are continuously pumping, were briefly purged prior tosampling. Radon was collected using 250 cm3 glass bottles byinserting a PVC tube to the bottom and filling with water at con-stant and low flow to avoid degassing. Once filled, the bottle wasrapidly sealed with a plastic cap and examined visually for thepresence of any air bubble. This is a well-tested field method forsampling radon from water with minimal loss of radon using glassor PET bottles (Leaney and Herczeg, 2006). The bottles were labeledwith the time of sampling in order to correct the measured 222Rnactivities of the time lap between field collection and laboratoryanalyses.
The sealed and bubble-free bottles were sent to the radon lab-oratory at Universit�e du Qu�ebec �a Montr�eal every 2e3 days tomeasure the 222Rn activity using a Hidex SL-300 liquid alphascintillometer. Scintillometer efficiency was first calibrated usinginternational standards. Sampling and analysis protocols wereoptimized and analytical tests were performed to obtain the bestpossible accuracy and precision of 222Rn activity in a continuousinterval from 0.5 to 35 Bq/L. Details of the instrument calibrationare reported in Lefebvre et al. (2013).
Sample preparation (radon concentration) before analysis canbe performed following two distinct methods: the direct method(DM) and the extraction method (EM). In the DM method, acocktail of water and di-isopropyl naphthalene (DIN)-basedscintillant is directly prepared in the vial that is inserted in thescintillometer. Counting is performed directly on this mixtureafter homogenization, but errors on DM measures are generallyhigh (3e10% for 222Rn activity ranging from 2 to 20 Bq/L; Leaneyand Herczeg, 2006). This method is typically used for water ex-pected to exceed 2.5 Bq/L in 222Rn activity. The extraction method,used for low 222Rn activity samples, requires more preparation butloss of radon during manipulation is reduced drastically anddetection level is lowered to 0.003 Bq/L with an average error of3% (Leaney and Herczeg, 2006). EM manipulation is as follows:20e50 cm3 of scintillant are mixed with the entire volume ofsampled water (250 cm3). Approximately 10 cm3 of air are intro-duced into the glass bottle to facilitate emulsion between waterand the scintillant. The cocktail is mixed for 4e5 min and left tostand until phases separate. A volume 8 cm3 of scintillant wasthen extracted and added to the counting glass vials. Duringcalibration of the method, mean background noise values weresmaller than 0.12 Bq/L with an average error of 4% for analysis(Lefebvre et al., 2013).
Radon activity results were interpolated with Kriging usingESRI® ArcMap™ 10.1 to create radon distribution maps. The ordi-nary krigingmethod with “prediction” output and constant “trend”was the most reliable from the statistical point of view to representthe prediction map of the radon activity. The model used for the
kriging is the “stable” type with no assumed anisotropy and doesnot include a nugget effect.
4. Results
Radon activities measured in the groundwater wells are re-ported in Table A1 in the Appendix. Measured 222Rn activities varyfrom 0.2 to 310 Bq/L, in the same range reported by Roireau andZikovsky (1989) (see also Fig. 3 for comparison). The histogramsshown in Fig. 2 represent the frequency distributions of 222Rnmeasured in all groundwater samples and separately for wellslocated in the Appalachian Mountains and in the St. LawrencePlatform, i.e. the two main geological provinces in the study area.Average 222Rn activity in the entire study area is 25.2 Bq/L while thewells from the Appalachian Mountains shows a higher average of31.3 Bq/L compared to an average of 16.1 Bq/Lfor the wells locatedin the St. Lawrence Platform.
The distribution of 222Rn activities is lognormal (Fig. 2) as usu-ally observed in radon surveys (Zikovsky and Chah, 1990) and,generally, for element distributions in the geosphere (Ahrens,1965). Median 222Rn activities are 8.6 Bq/L for the entire dataset,5.2 Bq/L for wells from the St. Lawrence Platform and 11.9 Bq/L forwells in the Appalachian Mountains. These values are higher thanthe median values of 2.3 and 3.3 Bq/L reported by Roireau andZikovsky (1989) and Chah and Zikovsky (1989), respectively. Thisdifference could be related to the size of the dataset and the regioncovered (198 wells against 50 and 32 wells for Roireau andZikovsky, 1989 and Chah and Zikovsky, 1989, respectively). Sam-pling a larger number of wells increases the probability of tappinginto “anomalous” areas, therefore influencing the median value.
The range of 222Rn activities measured in this study is alsosimilar to that measured in Saskatchewan, Canada by Dyck (1979)and in the United States by Hess et al. (1985) (Fig. 3), thoughhigher activities have been measured in the nearby State of Maine,mainly in U-rich granitic terrains (Brutsaert et al., 1981). High radonactivities are characteristics of Nordic countries such as Finland and
Fig. 3. Range of 222Rn activity recorded in groundwater in this study compared tothose measured in Quebec, Canada, the USA and other countries worldwide (whenavailable, the number of samples is shown on the bar corresponding to each study).References are: Dyck (1979) (Canada); Brutsaert et al. (1981) (Maine); Hess et al. (1985)(USA); Graves (1989) (United Kingdom and Italy); Roireau and Zikovsky (1989)(Quebec [1]); Chah and Zikovsky (1989) (Quebec [2]); Soto et al. (1995) (Spain);Freyer et al. (1997) (Germany); Kulich et al. (1997) (Sweden); Morland et al. (1998)(Norwegian, Quaternary); Banks et al. (1998) (Norwegian, bedrock); Alabdula'aly(1999) (Saudi Arabia); Han et al. (2004) (Taiwan); Vesterbacka et al. (2005) (Finland).
D.L. Pinti et al. / Journal of Environmental Radioactivity 136 (2014) 206e217210
Norway (Fig. 4), because of the large outcrops of granitic terrainsbelonging to the Fennoscandia Precambrian Shield (e.g., Bankset al., 1998; Morland et al., 1998; Vesterbacka et al., 2005). It wasnot possible to illustrate the most complete survey ever carried outon Fig. 3 (30,957 wells sampled in Sweden; Knutsson and Olofsson,2002) because no data tables are reported in this work, but 222Rnactivities as high as 57,000 Bq/L have been measured in U-richgranitic terrains in this study.
Fig. 4 presents the radon distribution prediction map in thestudy area. Results show that higher 222Rn activities are recorded intwo areas, the Mont-Saint-Hilaire and the Appalachian Mountains.222Rn activity reaches 233.4 Bq/L in Mont-Saint-Hilaire, a gabbroicintrusion of the CretaceousMonteregian Hills that is already knownfor high indoor radon anomalies (20e1432 Bq/m3; Dessau et al.,2005). The Appalachian Mountains are also known for high in-door radon activities (58 Bq/m3; L�evesque et al., 1995). 222Rn in thisregion varies from 0.3 to 310 Bq/L. A few restricted areas withrelatively high 222Rn activities (30e97 Bq/L) also occur near the St.Lawrence River. The larger anomaly surrounds the town of Sorel inthe northern part of the Mont�er�egie Est region (Fig. 4), and corre-sponds to the 2200 km2 areawhere brackish groundwater has beenfound in the fractured rock aquifer confined by thick marine clay(Beaudry, 2013).
5. Discussion
5.1. Expected radon activity in water
Both the descriptive statistical treatment and the spatial dis-tribution of 222Rn activities (Figs. 2 and 4) clearly show that 222Rnactivities recorded in wells located in the St. Lawrence Platform arelower than those recorded in wells located in the AppalachianMountains. The reason could be simply related to the difference inlithology. Wells in the St. Lawrence Platform collect groundwaterfrom fractured carbonate-shale formations whereas groundwaterfrom the Appalachian Mountains is in contact with graphitic andblack shales and metasediments (slates, schists and phyllades)
which are expected to contain more uranium than the sedimentaryrocks belonging to the St. Lawrence Platform.
The concentration of U needed to produce the measured 222Rnactivities can be estimated by simple calculation. The 222Rn activityin water derives from the radioactive decay of 226Ra (a daughterelement of 238U) adsorbed on the solid grains or contained inminerals (Cecil and Green, 2000). Thus the 222Rn activity in watercan be estimated from the U content of the rock, and assumingsecular equilibrium between 226Ra in the solid phase and 222Rn inthe water phase (25 days; Andrews and Lee, 1979), following theequation modified from, e.g. Bonotto and Caprioglio (2002):
½222Rn�water ¼ 12:469$r$ð1� f=fÞ$ARn$½U�rock (1)
where [222Rn]water is the radon activity in the liquid phase calcu-lated in Bq/L; r is the bulk density of rock (g/cm3); (1� f/f) is thevoid ratio (unit less); ARn is the emanation coefficient of radon (unitless) and [U] the concentration of U in the rock (mg/kg). Theemanation coefficient is the fraction of the total activity of 222Rnproduced by 226Ra decay that escapes from the rock to the pores ofthe medium. The constant 12.496 is the 238U disintegration raterecalculated to take into account the correct units to convert thefinal [222Rn]water to Bq/L (Bonotto and Caprioglio, 2002).
The average aquifer porosity and the radon emanation coeffi-cient are the two parameters that are the most difficult to evaluateand they are source of the larger uncertainties. Based on pumpingtests, Larocque et al. (2013a) suggest porosities of 1e5% for thefractured Ordovician aquifers around B�ecancour (Fig.1). Nowamoozet al. (2013) report porosities for the Lorraine shales (the mostwidespread terrain in the St. Lawrence Lowlands) and the Uticashales of 3.5± 1%. Ryder (2008) reports porosities of the Queenstonshale of 3e4%. These porosity values are on the order of thosemeasured in Cambro-Ordovician lower sandstone and carbonateunit cores of the St. Lawrence Platform, which vary between1.22± 0.24% and 6.22± 0.18% (Tran Ngoc et al., 2014). Cambrio-Ordovician metasedimentary series of the Appalachian Mountainsconstitute aquifers of poor permeability (Simard and Des Rosiers,1979) with porosities equivalent to those of the fractured lithol-ogies of the St. Lawrence Platform, or lower. To cover the entireporosity range encountered in the study area, we assume a porosity(f) from 1 to 5%. The emanation coefficient of 222Rn depends onlithology, temperature and moisture content (e.g., Ball et al., 1991;Nazaroff, 1992). Characteristic emanation coefficients for silty andclayey rocks, which closely relate to the terrains outcropping in thestudy area, range between 11 and 31% (Markkanen and Arvela,1992).
Using the above values of porosity and emanation coefficients,and assuming secular equilibrium, U contents from 0.2 to 2.2 mg/kgfor the rocks of the St. Lawrence Platform and from 0.3 to 2.9 mg/kgfor the rocks of the Appalachian Mountains are needed to producethe 222Rn activities recorded in our water samples. Calculated Ucontents are in agreement with those estimated by Pinti et al.(2011) for the carbonate-silty facies of the St. Lawrence Platform(0.4e2.0 mg/kg of U) and for the gabbro-pyroxenite-diorite in-trusions of the Monteregian Hills such as Mont-Saint-Hilaire(0.3e2.5 mg/kg U) (Pinti et al., 2011).
The U contents in the slate and schistose terrains of the Appa-lachian Mountains are not well known but certainly reach or evenexceed the values estimated above for the rocks of the St. LawrencePlatform. Uranium enrichment in these terrains is clearly evidencedby the occurrence of several U mineralizations along the Appala-chians piedmont and highlands, often at the contact with graniticbodies, as observed in Vermont State, USA (Dahlkamp, 2010). A fewU anomalies have been discovered by the Canadian Johns-ManvilleCompany in 1968 in the area of Thetford Mines, which is just a few
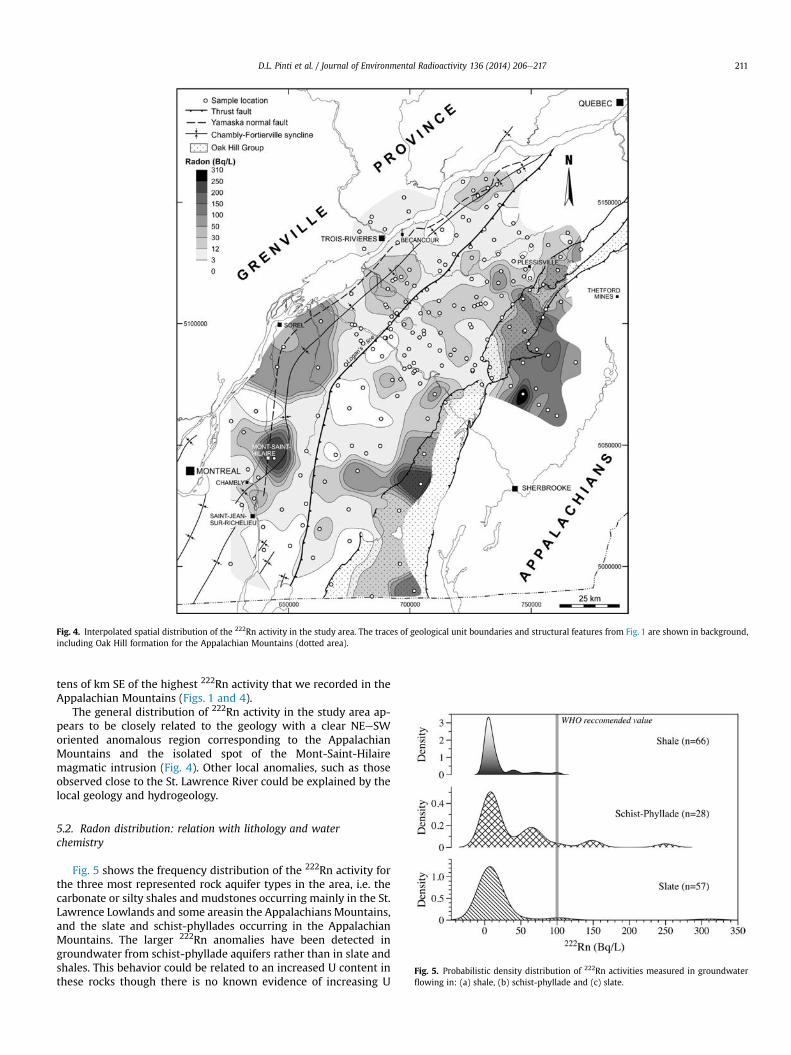
Fig. 4. Interpolated spatial distribution of the 222Rn activity in the study area. The traces of geological unit boundaries and structural features from Fig. 1 are shown in background,including Oak Hill formation for the Appalachian Mountains (dotted area).
D.L. Pinti et al. / Journal of Environmental Radioactivity 136 (2014) 206e217 211
tens of km SE of the highest 222Rn activity that we recorded in theAppalachian Mountains (Figs. 1 and 4).
The general distribution of 222Rn activity in the study area ap-pears to be closely related to the geology with a clear NEeSWoriented anomalous region corresponding to the AppalachianMountains and the isolated spot of the Mont-Saint-Hilairemagmatic intrusion (Fig. 4). Other local anomalies, such as thoseobserved close to the St. Lawrence River could be explained by thelocal geology and hydrogeology.
Fig. 5. Probabilistic density distribution of 222Rn activities measured in groundwaterflowing in: (a) shale, (b) schist-phyllade and (c) slate.
5.2. Radon distribution: relation with lithology and waterchemistry
Fig. 5 shows the frequency distribution of the 222Rn activity forthe three most represented rock aquifer types in the area, i.e. thecarbonate or silty shales and mudstones occurring mainly in the St.Lawrence Lowlands and some areasin the Appalachians Mountains,and the slate and schist-phyllades occurring in the AppalachianMountains. The larger 222Rn anomalies have been detected ingroundwater from schist-phyllade aquifers rather than in slate andshales. This behavior could be related to an increased U content inthese rocks though there is no known evidence of increasing U
D.L. Pinti et al. / Journal of Environmental Radioactivity 136 (2014) 206e217212
content with the metamorphic grade (e.g., Dostal and Capedri,1978). Most of the highest 222Rn activities in groundwater wereobserved in Oak Hill Group (222Rn average activity of 18.6 Bq/L andmedian of 52 Bq/L) (Fig. 4), which is composed of phyllades,quartzites and dolomites.
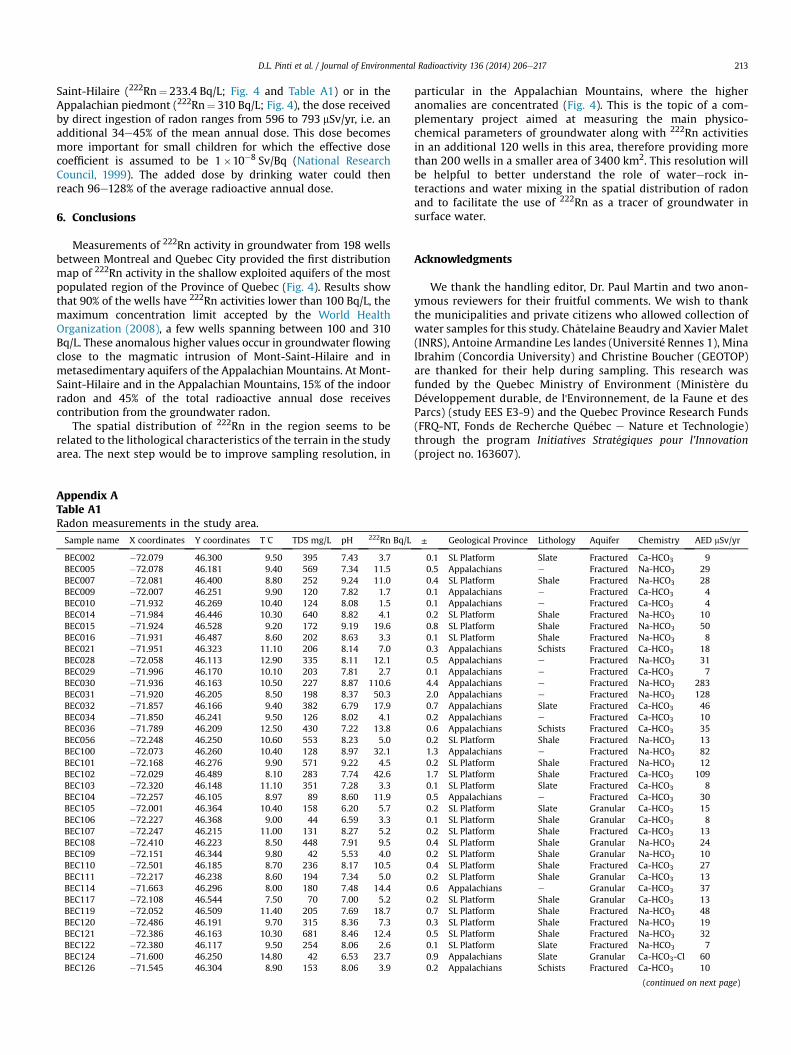
If the 222Rn activity is plotted against the main groundwatertypes in the region (Fig. 6), i.e. CaeMgeHCO3, Na-HCO3 and NaeCl(Carrier et al., 2013; Larocque et al., 2013a), the NaeCl type watersshow more frequent anomalies in 222Rn, although not in absoluteintensities. Cloutier et al. (2006; 2010) proposed a general model toexplain the evolution of groundwater chemistry in a sedimentaryrock aquifer located North of the St. Lawrence River. At recharge,freshwater flowing in unconfined aquifers acquires Ca-Mg-HCO3chemical character by interacting with dolostone and limestoneunits of the St. Lawrence Platform. This water evolves toward a Na-HCO3 type by Ca2þeNaþ ion exchange, where Ca2þwater exchangeswith Naþmineral in semi-confined to confined aquifers. Finally, closeto the St. Lawrence River, groundwater evolves to a NaeCl typewithsalinity probably derived from exchange of freshwater with poreseawater trapped into the Champlain Sea clays or the fractured rockaquifers, especially in areas confined by thick marine clay that havelimited recharge (Beaudry et al., 2011). Under neutral/alkalineconditions, 226Ra, the parent element of 222Rn is rapidly adsorbedon the surface of clay minerals (e.g., Ames et al., 1983; Pickler et al.,2012; Wood et al., 2004; Vinson et al., 2013). The proximity of thissorbed 226Ra to the active groundwater flow system allows therelease of its decay progeny 222Rn directly to the water phase(Wood et al., 2004). This process could explain why we observepatchy 222Rn anomalies close to the St. Lawrence River (Fig. 4),where fractured aquifers are often confined by a thick marine claylayers.
5.3. Evaluating health risks from groundwater radon measurements
The 222Rn dissolved in groundwater constitutes a potential riskfor human health. Inhalation of radon progeny accounts for about89% of the risk associatedwith domestic water use, with almost 11%resulting from direct ingestion of radon in drinking water (USEPA,1999).
The estimation of the increment of airborne 222Rn in a dwelling,arising from the use of water that contains dissolved radon is acomplex problem. It involves the solubility of radon in water, theamount of water used in the dwelling, the volume of the dwelling,
Fig. 6. Probabilistic density distribution of 222Rn activities measured in (a) Na-HCO3,(b) NaCl and (c) CaeMgeHCO3 groundwater types.
and the ventilation rate. The increase in the indoor radon concen-tration due to radon release from indoor water use is described bythe transfer coefficient T (unit less):
T ¼ DCa
Cw(2)
where (DCa) is the average increase of the indoor radon concen-tration that results from using water having an average radonconcentration of CW. The accepted value of T is 1± 0.2�10�4
(National Research Council, 1999). This means that a given activityof 222Rn in groundwater adds approximately 1/10,000 as much tothe radon concentration in the air. As an example, the geometricmean of the 222Rn activity measured in this study is 10 Bq/L (or10,000 Bq/m3), which means that water could contribute to thetotal indoor radon by 1 Bq/m3.
The study by L�evesque et al. (1995) on indoor radon carried outroughly in the same area as the current study (Mont�er�egie,Lanaudi�ere, Chaudi�ere-Appalaches) reports a geometric mean forindoor 222Rn concentrations of 42.1 to 59.7 Bq/m3in the buildingbasement and from 15.8 to 26.5 Bq/m3for the ground floor. Thismeans that 222Rn from groundwater (median of 8.6 Bq/L all overthe study area) might contribute from 1.4 to 5.4% of the total indoorradon.
Contribution to indoor radon can be estimated in areas were the222Rn activity in groundwater exceeds the 200 Bq/L. At Mont-Saint-Hilaire, the maximum 222Rn activity measured is 233,400 Bq/m3 ofwater (233.4 Bq/L), which means that the contribution of 222Rndissolved in water to indoor radon could amount to 23.4 Bq/m3. Asurvey carried out in 40 homes at Mont-Saint-Hilairein 2001showed that in 77% of the houses the 222Rn activity in air was lowerthan 150 Bq/m3 while for the 20% of them the 222Rn activity rangedfrom 150 to 800 Bq/m3, and only one house showed a very highvalue (1432 Bq/m3) (Dessau et al., 2005). The indoor 222Rn averageactivity per home was calculated to be 178 Bq/m3. This means thatradon from groundwater could contribute for 2e3% in the housesshowing the highest indoor 222Rn activities (800e1432 Bq/m3).However in houses having indoor radon contents of 150e178 Bq/m3 or less, the contribution from groundwater radon could be asmuch as 13e15%. Although not dramatic, this contribution is notnegligible.
The other radon risk for human health is its direct ingestion bydrinking water (USEPA, 1999). The annual effective dose (AED inmicro-Sievert per year or mSv/yr) derived from ingestion of radonand its adsorption on the stomach wall can be calculated followingthe simple equation:
AEDðmSV=yrÞ ¼ 222Rn activityðBq=LÞ � dose coefficientðSv=BqÞ� annual water consumptionðL=yrÞ � 1� 106
(3)
The dose coefficient, more commonly known as the “equivalentdose to stomach per unit activity of 222Rn ingested” has beencalculated by several authors and ranges between 1.6�10�9
(Harley and Robbins, 1994) to 3.0�10�7 Sv/Bq (Crawford-Brown,1989). The average accepted value of the dose coefficient foradults is 3.5�10�9 Sv/Bq (National Research Council, 1999).
Assuming an average drinking water consumption of 730 L/year(World Health Organization, 2002) and a median 222Rn activityvalue of 8.6 Bq/L for the entire study area (Fig. 2), we can estimateatotal annual dose of 22.5 mSv/yr through water ingestion. Thisdose corresponds only to 1.3% of the total annual dose received byCanadians (1769 mSv/yr; Grasty and LaMarre, 2004). However, inareas where 222Rn activity in groundwater is high, such as Mont-
D.L. Pinti et al. / Journal of Environmental Radioactivity 136 (2014) 206e217 213
Saint-Hilaire (222Rn¼ 233.4 Bq/L; Fig. 4 and Table A1) or in theAppalachian piedmont (222Rn¼ 310 Bq/L; Fig. 4), the dose receivedby direct ingestion of radon ranges from 596 to 793 mSv/yr, i.e. anadditional 34e45% of the mean annual dose. This dose becomesmore important for small children for which the effective dosecoefficient is assumed to be 1�10�8 Sv/Bq (National ResearchCouncil, 1999). The added dose by drinking water could thenreach 96e128% of the average radioactive annual dose.
6. Conclusions
Measurements of 222Rn activity in groundwater from 198 wellsbetween Montreal and Quebec City provided the first distributionmap of 222Rn activity in the shallow exploited aquifers of the mostpopulated region of the Province of Quebec (Fig. 4). Results showthat 90% of the wells have 222Rn activities lower than 100 Bq/L, themaximum concentration limit accepted by the World HealthOrganization (2008), a few wells spanning between 100 and 310Bq/L. These anomalous higher values occur in groundwater flowingclose to the magmatic intrusion of Mont-Saint-Hilaire and inmetasedimentary aquifers of the Appalachian Mountains. At Mont-Saint-Hilaire and in the Appalachian Mountains, 15% of the indoorradon and 45% of the total radioactive annual dose receivescontribution from the groundwater radon.
The spatial distribution of 222Rn in the region seems to berelated to the lithological characteristics of the terrain in the studyarea. The next step would be to improve sampling resolution, in
Appendix ATable A1Radon measurements in the study area.Sample name X coordinates Y coordinates T�C TDS mg/L pH 222Rn Bq/L
BEC002 �72.079 46.300 9.50 395 7.43 3.7BEC005 �72.078 46.181 9.40 569 7.34 11.5BEC007 �72.081 46.400 8.80 252 9.24 11.0BEC009 �72.007 46.251 9.90 120 7.82 1.7BEC010 �71.932 46.269 10.40 124 8.08 1.5BEC014 �71.984 46.446 10.30 640 8.82 4.1BEC015 �71.924 46.528 9.20 172 9.19 19.6BEC016 �71.931 46.487 8.60 202 8.63 3.3BEC021 �71.951 46.323 11.10 206 8.14 7.0BEC028 �72.058 46.113 12.90 335 8.11 12.1BEC029 �71.996 46.170 10.10 203 7.81 2.7BEC030 �71.936 46.163 10.50 227 8.87 110.6BEC031 �71.920 46.205 8.50 198 8.37 50.3BEC032 �71.857 46.166 9.40 382 6.79 17.9BEC034 �71.850 46.241 9.50 126 8.02 4.1BEC036 �71.789 46.209 12.50 430 7.22 13.8BEC056 �72.248 46.250 10.60 553 8.23 5.0BEC100 �72.073 46.260 10.40 128 8.97 32.1BEC101 �72.168 46.276 9.90 571 9.22 4.5BEC102 �72.029 46.489 8.10 283 7.74 42.6BEC103 �72.320 46.148 11.10 351 7.28 3.3BEC104 �72.257 46.105 8.97 89 8.60 11.9BEC105 �72.001 46.364 10.40 158 6.20 5.7BEC106 �72.227 46.368 9.00 44 6.59 3.3BEC107 �72.247 46.215 11.00 131 8.27 5.2BEC108 �72.410 46.223 8.50 448 7.91 9.5BEC109 �72.151 46.344 9.80 42 5.53 4.0BEC110 �72.501 46.185 8.70 236 8.17 10.5BEC111 �72.217 46.238 8.60 194 7.34 5.0BEC114 �71.663 46.296 8.00 180 7.48 14.4BEC117 �72.108 46.544 7.50 70 7.00 5.2BEC119 �72.052 46.509 11.40 205 7.69 18.7BEC120 �72.486 46.191 9.70 315 8.36 7.3BEC121 �72.386 46.163 10.30 681 8.46 12.4BEC122 �72.380 46.117 9.50 254 8.06 2.6BEC124 �71.600 46.250 14.80 42 6.53 23.7BEC126 �71.545 46.304 8.90 153 8.06 3.9
particular in the Appalachian Mountains, where the higheranomalies are concentrated (Fig. 4). This is the topic of a com-plementary project aimed at measuring the main physico-chemical parameters of groundwater along with 222Rn activitiesin an additional 120 wells in this area, therefore providing morethan 200 wells in a smaller area of 3400 km2. This resolution willbe helpful to better understand the role of watererock in-teractions and water mixing in the spatial distribution of radonand to facilitate the use of 222Rn as a tracer of groundwater insurface water.
Acknowledgments
We thank the handling editor, Dr. Paul Martin and two anon-ymous reviewers for their fruitful comments. We wish to thankthe municipalities and private citizens who allowed collection ofwater samples for this study. Chatelaine Beaudry and Xavier Malet(INRS), Antoine Armandine Les landes (Universit�e Rennes 1), MinaIbrahim (Concordia University) and Christine Boucher (GEOTOP)are thanked for their help during sampling. This research wasfunded by the Quebec Ministry of Environment (Minist�ere duD�eveloppement durable, de l'Environnement, de la Faune et desParcs) (study EES E3-9) and the Quebec Province Research Funds(FRQ-NT, Fonds de Recherche Qu�ebec e Nature et Technologie)through the program Initiatives Strat�egiques pour l'Innovation(project no. 163607).
± Geological Province Lithology Aquifer Chemistry AED mSv/yr
0.1 SL Platform Slate Fractured Ca-HCO3 90.5 Appalachians e Fractured Na-HCO3 290.4 SL Platform Shale Fractured Na-HCO3 280.1 Appalachians e Fractured Ca-HCO3 40.1 Appalachians e Fractured Ca-HCO3 40.2 SL Platform Shale Fractured Na-HCO3 100.8 SL Platform Shale Fractured Na-HCO3 500.1 SL Platform Shale Fractured Na-HCO3 80.3 Appalachians Schists Fractured Ca-HCO3 180.5 Appalachians e Fractured Na-HCO3 310.1 Appalachians e Fractured Ca-HCO3 74.4 Appalachians e Fractured Na-HCO3 2832.0 Appalachians e Fractured Na-HCO3 1280.7 Appalachians Slate Fractured Ca-HCO3 460.2 Appalachians e Fractured Ca-HCO3 100.6 Appalachians Schists Fractured Ca-HCO3 350.2 SL Platform Shale Fractured Na-HCO3 131.3 Appalachians e Fractured Na-HCO3 820.2 SL Platform Shale Fractured Na-HCO3 121.7 SL Platform Shale Fractured Ca-HCO3 1090.1 SL Platform Slate Fractured Ca-HCO3 80.5 Appalachians e Fractured Ca-HCO3 300.2 SL Platform Slate Granular Ca-HCO3 150.1 SL Platform Shale Granular Ca-HCO3 80.2 SL Platform Shale Fractured Ca-HCO3 130.4 SL Platform Shale Granular Na-HCO3 240.2 SL Platform Shale Granular Na-HCO3 100.4 SL Platform Shale Fractured Ca-HCO3 270.2 SL Platform Shale Granular Ca-HCO3 130.6 Appalachians e Granular Ca-HCO3 370.2 SL Platform Shale Granular Ca-HCO3 130.7 SL Platform Shale Fractured Na-HCO3 480.3 SL Platform Shale Fractured Na-HCO3 190.5 SL Platform Shale Fractured Na-HCO3 320.1 SL Platform Slate Fractured Na-HCO3 70.9 Appalachians Slate Granular Ca-HCO3-Cl 600.2 Appalachians Schists Fractured Ca-HCO3 10
(continued on next page)
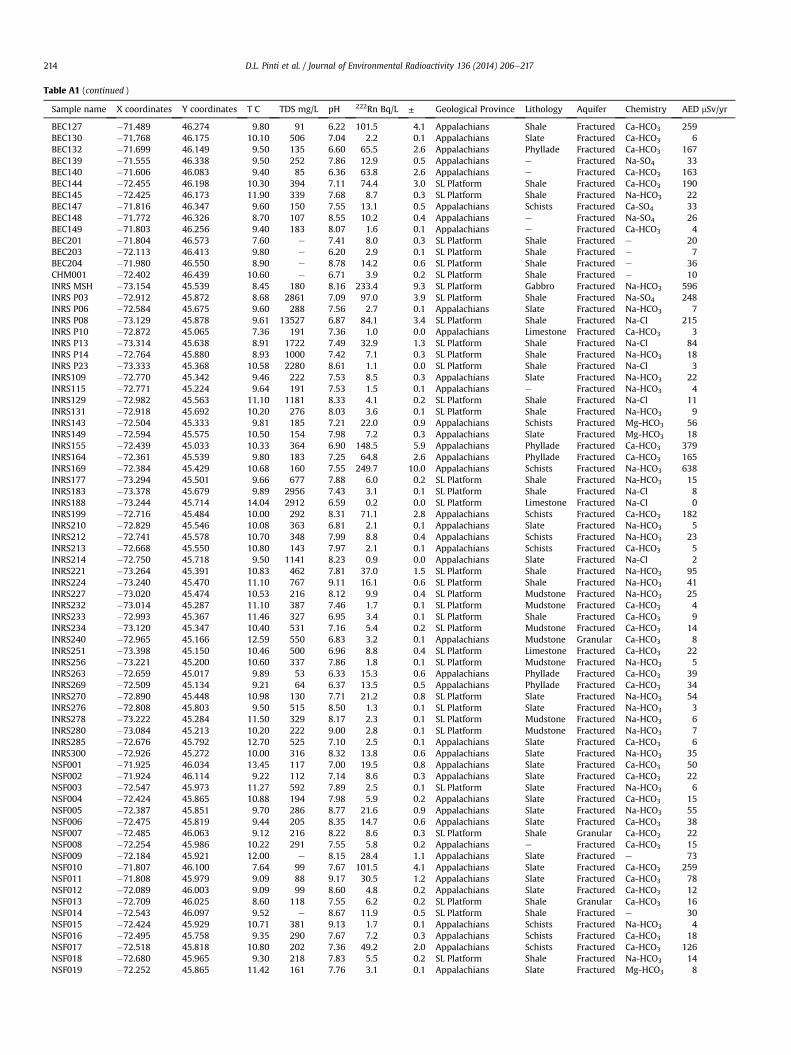
Table A1 (continued )
Sample name X coordinates Y coordinates T�C TDS mg/L pH 222Rn Bq/L ± Geological Province Lithology Aquifer Chemistry AED mSv/yr
BEC127 �71.489 46.274 9.80 91 6.22 101.5 4.1 Appalachians Shale Fractured Ca-HCO3 259BEC130 �71.768 46.175 10.10 506 7.04 2.2 0.1 Appalachians Slate Fractured Ca-HCO3 6BEC132 �71.699 46.149 9.50 135 6.60 65.5 2.6 Appalachians Phyllade Fractured Ca-HCO3 167BEC139 �71.555 46.338 9.50 252 7.86 12.9 0.5 Appalachians e Fractured Na-SO4 33BEC140 �71.606 46.083 9.40 85 6.36 63.8 2.6 Appalachians e Fractured Ca-HCO3 163BEC144 �72.455 46.198 10.30 394 7.11 74.4 3.0 SL Platform Shale Fractured Ca-HCO3 190BEC145 �72.425 46.173 11.90 339 7.68 8.7 0.3 SL Platform Shale Fractured Na-HCO3 22BEC147 �71.816 46.347 9.60 150 7.55 13.1 0.5 Appalachians Schists Fractured Ca-SO4 33BEC148 �71.772 46.326 8.70 107 8.55 10.2 0.4 Appalachians e Fractured Na-SO4 26BEC149 �71.803 46.256 9.40 183 8.07 1.6 0.1 Appalachians e Fractured Ca-HCO3 4BEC201 �71.804 46.573 7.60 e 7.41 8.0 0.3 SL Platform Shale Fractured e 20BEC203 �72.113 46.413 9.80 e 6.20 2.9 0.1 SL Platform Shale Fractured e 7BEC204 �71.980 46.550 8.90 e 8.78 14.2 0.6 SL Platform Shale Fractured e 36CHM001 �72.402 46.439 10.60 e 6.71 3.9 0.2 SL Platform Shale Fractured e 10INRS MSH �73.154 45.539 8.45 180 8.16 233.4 9.3 SL Platform Gabbro Fractured Na-HCO3 596INRS P03 �72.912 45.872 8.68 2861 7.09 97.0 3.9 SL Platform Shale Fractured Na-SO4 248INRS P06 �72.584 45.675 9.60 288 7.56 2.7 0.1 Appalachians Slate Fractured Na-HCO3 7INRS P08 �73.129 45.878 9.61 13527 6.87 84.1 3.4 SL Platform Shale Fractured Na-Cl 215INRS P10 �72.872 45.065 7.36 191 7.36 1.0 0.0 Appalachians Limestone Fractured Ca-HCO3 3INRS P13 �73.314 45.638 8.91 1722 7.49 32.9 1.3 SL Platform Shale Fractured Na-Cl 84INRS P14 �72.764 45.880 8.93 1000 7.42 7.1 0.3 SL Platform Shale Fractured Na-HCO3 18INRS P23 �73.333 45.368 10.58 2280 8.61 1.1 0.0 SL Platform Shale Fractured Na-Cl 3INRS109 �72.770 45.342 9.46 222 7.53 8.5 0.3 Appalachians Slate Fractured Na-HCO3 22INRS115 �72.771 45.224 9.64 191 7.53 1.5 0.1 Appalachians e Fractured Na-HCO3 4INRS129 �72.982 45.563 11.10 1181 8.33 4.1 0.2 SL Platform Shale Fractured Na-Cl 11INRS131 �72.918 45.692 10.20 276 8.03 3.6 0.1 SL Platform Shale Fractured Na-HCO3 9INRS143 �72.504 45.333 9.81 185 7.21 22.0 0.9 Appalachians Schists Fractured Mg-HCO3 56INRS149 �72.594 45.575 10.50 154 7.98 7.2 0.3 Appalachians Slate Fractured Mg-HCO3 18INRS155 �72.439 45.033 10.33 364 6.90 148.5 5.9 Appalachians Phyllade Fractured Ca-HCO3 379INRS164 �72.361 45.539 9.80 183 7.25 64.8 2.6 Appalachians Phyllade Fractured Ca-HCO3 165INRS169 �72.384 45.429 10.68 160 7.55 249.7 10.0 Appalachians Schists Fractured Na-HCO3 638INRS177 �73.294 45.501 9.66 677 7.88 6.0 0.2 SL Platform Shale Fractured Na-HCO3 15INRS183 �73.378 45.679 9.89 2956 7.43 3.1 0.1 SL Platform Shale Fractured Na-Cl 8INRS188 �73.244 45.714 14.04 2912 6.59 0.2 0.0 SL Platform Limestone Fractured Na-Cl 0INRS199 �72.716 45.484 10.00 292 8.31 71.1 2.8 Appalachians Schists Fractured Ca-HCO3 182INRS210 �72.829 45.546 10.08 363 6.81 2.1 0.1 Appalachians Slate Fractured Na-HCO3 5INRS212 �72.741 45.578 10.70 348 7.99 8.8 0.4 Appalachians Schists Fractured Na-HCO3 23INRS213 �72.668 45.550 10.80 143 7.97 2.1 0.1 Appalachians Schists Fractured Ca-HCO3 5INRS214 �72.750 45.718 9.50 1141 8.23 0.9 0.0 Appalachians Slate Fractured Na-Cl 2INRS221 �73.264 45.391 10.83 462 7.81 37.0 1.5 SL Platform Shale Fractured Na-HCO3 95INRS224 �73.240 45.470 11.10 767 9.11 16.1 0.6 SL Platform Shale Fractured Na-HCO3 41INRS227 �73.020 45.474 10.53 216 8.12 9.9 0.4 SL Platform Mudstone Fractured Na-HCO3 25INRS232 �73.014 45.287 11.10 387 7.46 1.7 0.1 SL Platform Mudstone Fractured Ca-HCO3 4INRS233 �72.993 45.367 11.46 327 6.95 3.4 0.1 SL Platform Shale Fractured Ca-HCO3 9INRS234 �73.120 45.347 10.40 531 7.16 5.4 0.2 SL Platform Mudstone Fractured Ca-HCO3 14INRS240 �72.965 45.166 12.59 550 6.83 3.2 0.1 Appalachians Mudstone Granular Ca-HCO3 8INRS251 �73.398 45.150 10.46 500 6.96 8.8 0.4 SL Platform Limestone Fractured Ca-HCO3 22INRS256 �73.221 45.200 10.60 337 7.86 1.8 0.1 SL Platform Mudstone Fractured Na-HCO3 5INRS263 �72.659 45.017 9.89 53 6.33 15.3 0.6 Appalachians Phyllade Fractured Ca-HCO3 39INRS269 �72.509 45.134 9.21 64 6.37 13.5 0.5 Appalachians Phyllade Fractured Ca-HCO3 34INRS270 �72.890 45.448 10.98 130 7.71 21.2 0.8 SL Platform Slate Fractured Na-HCO3 54INRS276 �72.808 45.803 9.50 515 8.50 1.3 0.1 SL Platform Slate Fractured Na-HCO3 3INRS278 �73.222 45.284 11.50 329 8.17 2.3 0.1 SL Platform Mudstone Fractured Na-HCO3 6INRS280 �73.084 45.213 10.20 222 9.00 2.8 0.1 SL Platform Mudstone Fractured Na-HCO3 7INRS285 �72.676 45.792 12.70 525 7.10 2.5 0.1 Appalachians Slate Fractured Ca-HCO3 6INRS300 �72.926 45.272 10.00 316 8.32 13.8 0.6 Appalachians Slate Fractured Na-HCO3 35NSF001 �71.925 46.034 13.45 117 7.00 19.5 0.8 Appalachians Slate Fractured Ca-HCO3 50NSF002 �71.924 46.114 9.22 112 7.14 8.6 0.3 Appalachians Slate Fractured Ca-HCO3 22NSF003 �72.547 45.973 11.27 592 7.89 2.5 0.1 SL Platform Slate Fractured Na-HCO3 6NSF004 �72.424 45.865 10.88 194 7.98 5.9 0.2 Appalachians Slate Fractured Ca-HCO3 15NSF005 �72.387 45.851 9.70 286 8.77 21.6 0.9 Appalachians Slate Fractured Na-HCO3 55NSF006 �72.475 45.819 9.44 205 8.35 14.7 0.6 Appalachians Slate Fractured Ca-HCO3 38NSF007 �72.485 46.063 9.12 216 8.22 8.6 0.3 SL Platform Shale Granular Ca-HCO3 22NSF008 �72.254 45.986 10.22 291 7.55 5.8 0.2 Appalachians e Fractured Ca-HCO3 15NSF009 �72.184 45.921 12.00 e 8.15 28.4 1.1 Appalachians Slate Fractured e 73NSF010 �71.807 46.100 7.64 99 7.67 101.5 4.1 Appalachians Slate Fractured Ca-HCO3 259NSF011 �71.808 45.979 9.09 88 9.17 30.5 1.2 Appalachians Slate Fractured Ca-HCO3 78NSF012 �72.089 46.003 9.09 99 8.60 4.8 0.2 Appalachians Slate Fractured Ca-HCO3 12NSF013 �72.709 46.025 8.60 118 7.55 6.2 0.2 SL Platform Shale Granular Ca-HCO3 16NSF014 �72.543 46.097 9.52 e 8.67 11.9 0.5 SL Platform Shale Fractured e 30NSF015 �72.424 45.929 10.71 381 9.13 1.7 0.1 Appalachians Schists Fractured Na-HCO3 4NSF016 �72.495 45.758 9.35 290 7.67 7.2 0.3 Appalachians Schists Fractured Ca-HCO3 18NSF017 �72.518 45.818 10.80 202 7.36 49.2 2.0 Appalachians Schists Fractured Ca-HCO3 126NSF018 �72.680 45.965 9.30 218 7.83 5.5 0.2 SL Platform Shale Fractured Na-HCO3 14NSF019 �72.252 45.865 11.42 161 7.76 3.1 0.1 Appalachians Slate Fractured Mg-HCO3 8
D.L. Pinti et al. / Journal of Environmental Radioactivity 136 (2014) 206e217214
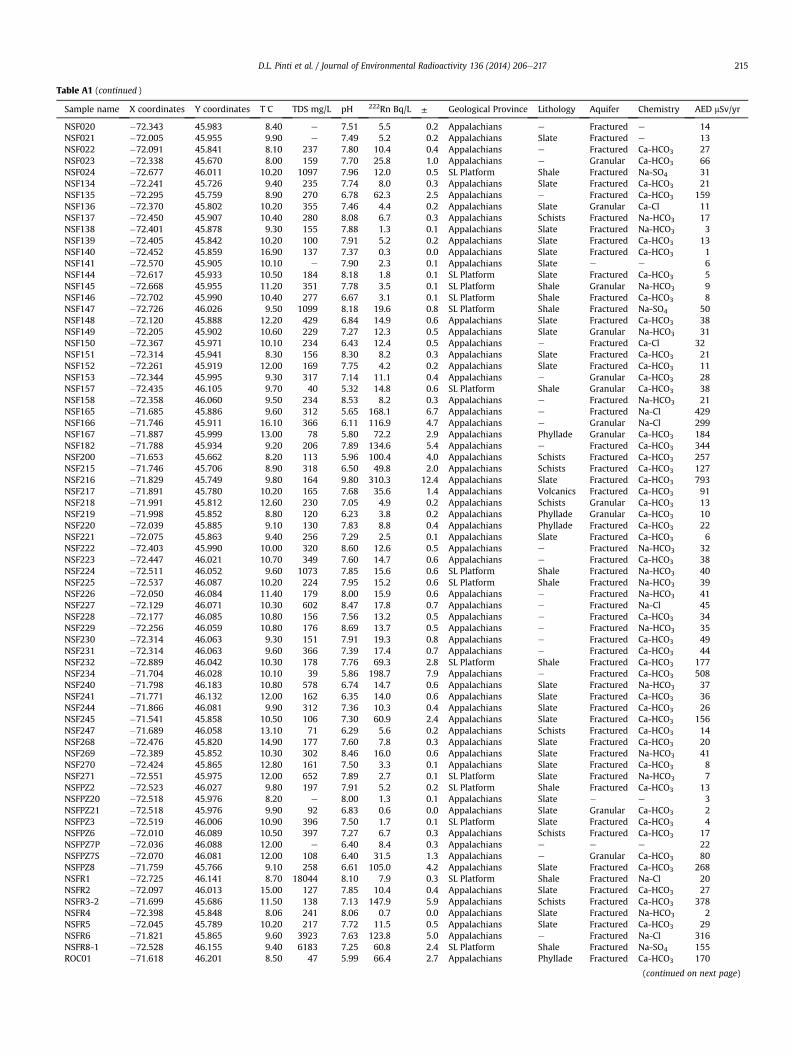
Table A1 (continued )
Sample name X coordinates Y coordinates T�C TDS mg/L pH 222Rn Bq/L ± Geological Province Lithology Aquifer Chemistry AED mSv/yr
NSF020 �72.343 45.983 8.40 e 7.51 5.5 0.2 Appalachians e Fractured e 14NSF021 �72.005 45.955 9.90 e 7.49 5.2 0.2 Appalachians Slate Fractured e 13NSF022 �72.091 45.841 8.10 237 7.80 10.4 0.4 Appalachians e Fractured Ca-HCO3 27NSF023 �72.338 45.670 8.00 159 7.70 25.8 1.0 Appalachians e Granular Ca-HCO3 66NSF024 �72.677 46.011 10.20 1097 7.96 12.0 0.5 SL Platform Shale Fractured Na-SO4 31NSF134 �72.241 45.726 9.40 235 7.74 8.0 0.3 Appalachians Slate Fractured Ca-HCO3 21NSF135 �72.295 45.759 8.90 270 6.78 62.3 2.5 Appalachians e Fractured Ca-HCO3 159NSF136 �72.370 45.802 10.20 355 7.46 4.4 0.2 Appalachians Slate Granular Ca-Cl 11NSF137 �72.450 45.907 10.40 280 8.08 6.7 0.3 Appalachians Schists Fractured Na-HCO3 17NSF138 �72.401 45.878 9.30 155 7.88 1.3 0.1 Appalachians Slate Fractured Na-HCO3 3NSF139 �72.405 45.842 10.20 100 7.91 5.2 0.2 Appalachians Slate Fractured Ca-HCO3 13NSF140 �72.452 45.859 16.90 137 7.37 0.3 0.0 Appalachians Slate Fractured Ca-HCO3 1NSF141 �72.570 45.905 10.10 e 7.90 2.3 0.1 Appalachians Slate e e 6NSF144 �72.617 45.933 10.50 184 8.18 1.8 0.1 SL Platform Slate Fractured Ca-HCO3 5NSF145 �72.668 45.955 11.20 351 7.78 3.5 0.1 SL Platform Shale Granular Na-HCO3 9NSF146 �72.702 45.990 10.40 277 6.67 3.1 0.1 SL Platform Shale Fractured Ca-HCO3 8NSF147 �72.726 46.026 9.50 1099 8.18 19.6 0.8 SL Platform Shale Fractured Na-SO4 50NSF148 �72.120 45.888 12.20 429 6.84 14.9 0.6 Appalachians Slate Fractured Ca-HCO3 38NSF149 �72.205 45.902 10.60 229 7.27 12.3 0.5 Appalachians Slate Granular Na-HCO3 31NSF150 �72.367 45.971 10.10 234 6.43 12.4 0.5 Appalachians e Fractured Ca-Cl 32NSF151 �72.314 45.941 8.30 156 8.30 8.2 0.3 Appalachians Slate Fractured Ca-HCO3 21NSF152 �72.261 45.919 12.00 169 7.75 4.2 0.2 Appalachians Slate Fractured Ca-HCO3 11NSF153 �72.344 45.995 9.30 317 7.14 11.1 0.4 Appalachians e Granular Ca-HCO3 28NSF157 �72.435 46.105 9.70 40 5.32 14.8 0.6 SL Platform Shale Granular Ca-HCO3 38NSF158 �72.358 46.060 9.50 234 8.53 8.2 0.3 Appalachians e Fractured Na-HCO3 21NSF165 �71.685 45.886 9.60 312 5.65 168.1 6.7 Appalachians e Fractured Na-Cl 429NSF166 �71.746 45.911 16.10 366 6.11 116.9 4.7 Appalachians e Granular Na-Cl 299NSF167 �71.887 45.999 13.00 78 5.80 72.2 2.9 Appalachians Phyllade Granular Ca-HCO3 184NSF182 �71.788 45.934 9.20 206 7.89 134.6 5.4 Appalachians e Fractured Ca-HCO3 344NSF200 �71.653 45.662 8.20 113 5.96 100.4 4.0 Appalachians Schists Fractured Ca-HCO3 257NSF215 �71.746 45.706 8.90 318 6.50 49.8 2.0 Appalachians Schists Fractured Ca-HCO3 127NSF216 �71.829 45.749 9.80 164 9.80 310.3 12.4 Appalachians Slate Fractured Ca-HCO3 793NSF217 �71.891 45.780 10.20 165 7.68 35.6 1.4 Appalachians Volcanics Fractured Ca-HCO3 91NSF218 �71.991 45.812 12.60 230 7.05 4.9 0.2 Appalachians Schists Granular Ca-HCO3 13NSF219 �71.998 45.852 8.80 120 6.23 3.8 0.2 Appalachians Phyllade Granular Ca-HCO3 10NSF220 �72.039 45.885 9.10 130 7.83 8.8 0.4 Appalachians Phyllade Fractured Ca-HCO3 22NSF221 �72.075 45.863 9.40 256 7.29 2.5 0.1 Appalachians Slate Fractured Ca-HCO3 6NSF222 �72.403 45.990 10.00 320 8.60 12.6 0.5 Appalachians e Fractured Na-HCO3 32NSF223 �72.447 46.021 10.70 349 7.60 14.7 0.6 Appalachians e Fractured Ca-HCO3 38NSF224 �72.511 46.052 9.60 1073 7.85 15.6 0.6 SL Platform Shale Fractured Na-HCO3 40NSF225 �72.537 46.087 10.20 224 7.95 15.2 0.6 SL Platform Shale Fractured Na-HCO3 39NSF226 �72.050 46.084 11.40 179 8.00 15.9 0.6 Appalachians e Fractured Na-HCO3 41NSF227 �72.129 46.071 10.30 602 8.47 17.8 0.7 Appalachians e Fractured Na-Cl 45NSF228 �72.177 46.085 10.80 156 7.56 13.2 0.5 Appalachians e Fractured Ca-HCO3 34NSF229 �72.256 46.059 10.80 176 8.69 13.7 0.5 Appalachians e Fractured Na-HCO3 35NSF230 �72.314 46.063 9.30 151 7.91 19.3 0.8 Appalachians e Fractured Ca-HCO3 49NSF231 �72.314 46.063 9.60 366 7.39 17.4 0.7 Appalachians e Fractured Ca-HCO3 44NSF232 �72.889 46.042 10.30 178 7.76 69.3 2.8 SL Platform Shale Fractured Ca-HCO3 177NSF234 �71.704 46.028 10.10 39 5.86 198.7 7.9 Appalachians e Fractured Ca-HCO3 508NSF240 �71.798 46.183 10.80 578 6.74 14.7 0.6 Appalachians Slate Fractured Na-HCO3 37NSF241 �71.771 46.132 12.00 162 6.35 14.0 0.6 Appalachians Slate Fractured Ca-HCO3 36NSF244 �71.866 46.081 9.90 312 7.36 10.3 0.4 Appalachians Slate Fractured Ca-HCO3 26NSF245 �71.541 45.858 10.50 106 7.30 60.9 2.4 Appalachians Slate Fractured Ca-HCO3 156NSF247 �71.689 46.058 13.10 71 6.29 5.6 0.2 Appalachians Schists Fractured Ca-HCO3 14NSF268 �72.476 45.820 14.90 177 7.60 7.8 0.3 Appalachians Slate Fractured Ca-HCO3 20NSF269 �72.389 45.852 10.30 302 8.46 16.0 0.6 Appalachians Slate Fractured Na-HCO3 41NSF270 �72.424 45.865 12.80 161 7.50 3.3 0.1 Appalachians Slate Fractured Ca-HCO3 8NSF271 �72.551 45.975 12.00 652 7.89 2.7 0.1 SL Platform Slate Fractured Na-HCO3 7NSFPZ2 �72.523 46.027 9.80 197 7.91 5.2 0.2 SL Platform Shale Fractured Ca-HCO3 13NSFPZ20 �72.518 45.976 8.20 e 8.00 1.3 0.1 Appalachians Slate � e 3NSFPZ21 �72.518 45.976 9.90 92 6.83 0.6 0.0 Appalachians Slate Granular Ca-HCO3 2NSFPZ3 �72.519 46.006 10.90 396 7.50 1.7 0.1 SL Platform Slate Fractured Ca-HCO3 4NSFPZ6 �72.010 46.089 10.50 397 7.27 6.7 0.3 Appalachians Schists Fractured Ca-HCO3 17NSFPZ7P �72.036 46.088 12.00 e 6.40 8.4 0.3 Appalachians e e e 22NSFPZ7S �72.070 46.081 12.00 108 6.40 31.5 1.3 Appalachians e Granular Ca-HCO3 80NSFPZ8 �71.759 45.766 9.10 258 6.61 105.0 4.2 Appalachians Slate Fractured Ca-HCO3 268NSFR1 �72.725 46.141 8.70 18044 8.10 7.9 0.3 SL Platform Shale Fractured Na-Cl 20NSFR2 �72.097 46.013 15.00 127 7.85 10.4 0.4 Appalachians Slate Fractured Ca-HCO3 27NSFR3-2 �71.699 45.686 11.50 138 7.13 147.9 5.9 Appalachians Schists Fractured Ca-HCO3 378NSFR4 �72.398 45.848 8.06 241 8.06 0.7 0.0 Appalachians Slate Fractured Na-HCO3 2NSFR5 �72.045 45.789 10.20 217 7.72 11.5 0.5 Appalachians Slate Fractured Ca-HCO3 29NSFR6 �71.821 45.865 9.60 3923 7.63 123.8 5.0 Appalachians e Fractured Na-Cl 316NSFR8-1 �72.528 46.155 9.40 6183 7.25 60.8 2.4 SL Platform Shale Fractured Na-SO4 155ROC01 �71.618 46.201 8.50 47 5.99 66.4 2.7 Appalachians Phyllade Fractured Ca-HCO3 170
(continued on next page)
D.L. Pinti et al. / Journal of Environmental Radioactivity 136 (2014) 206e217 215

Table A1 (continued )
Sample name X coordinates Y coordinates T�C TDS mg/L pH 222Rn Bq/L ± Geological Province Lithology Aquifer Chemistry AED mSv/yr
ROC02 �71.754 46.296 2.89 131 9.38 1.2 0.0 Appalachians e Fractured Na-SO4 3ROC04 �71.846 46.382 8.50 233 9.12 1.1 0.0 Appalachians Slate Fractured Na-HCO3 3ROC05 �71.914 46.450 8.68 345 8.40 2.3 0.1 SL Platform Shale Fractured Na-HCO3 6ROC07 �71.973 46.516 1.97 259 9.29 39.9 1.6 SL Platform Shale Fractured Na-HCO3 102ROC09 �72.468 46.326 8.70 1444 8.14 5.9 0.2 SL Platform Shale Fractured Na-HCO3 15RS01 �73.093 45.951 9.80 9373 6.70 47.9 1.9 SL Platform Shale Granular Na-Cl-SO4 122SLV001 �72.426 46.492 7.10 e 5.60 4.3 0.2 SL Platform Shale Granular e 11TR001 �72.670 46.371 8.70 e 6.21 3.2 0.1 SL Platform Shale Granular e 8TR002 �72.602 46.424 7.80 e 6.63 3.6 0.1 SL Platform Shale Granular e 9TR003 �72.611 46.405 7.50 e 7.15 3.9 0.2 SL Platform Shale Granular e 10TR004 �72.533 46.376 9.60 e 6.47 3.5 0.1 SL Platform Shale Granular e 9
D.L. Pinti et al. / Journal of Environmental Radioactivity 136 (2014) 206e217216
References
Alabdula'aly, A., 1999. Occurrence of radon in the central region groundwater ofSaudi Arabia. J. Environ. Radioact. 44, 85e95.
Ames, L.L., McGarrah, J.E., Walker, B.A., 1983. Sorption of trace constituents fromaqueous solutions onto secondary minerals. II. Radium. Clay Clay Mineral. 31,335e342.
Andrews, J.N., Lee, D.J., 1979. Inert gases in groundwater from the Bunter Sandstoneof England as indicators of age and palaeoclimatic trends. J. Hydrol. 41,233e252.
Ahrens, L.H., 1965. Distribution of Elements in Our Planet. McGraw-Hill, New York,p. 110.
Ball, T.K., Cameron, D.G., Colman, T.B., Roberts, P.D., 1991. Behaviour of radon in thegeological environment: a review. Q. J. Eng. Geol. 24, 169e182.
Banks, D., Frengstad, B., Midtgård, A.K., Krog, J.R., Strand, T., 1998. The chemistryofNorwegian groundwaters. I. The distribution of radon, major and minor ele-ments in 1604 crystalline bedrock groundwaters. Sci. Total Environ. 222, 71e91.
Beaudry, C., Malet, X., Lefebvre, R., Rivard, C., 2011. D�elimitation des eaux sou-terraines saumatres en Mont�er�egie Est, Qu�ebec, Canada. Geological SurveyCanadaOpen File Report 6970. Available at: http://geogratis.gc.ca/api/fr/nrcan-rncan/ess-sst/bfea4c4c-aca8-5fc5-9b22-7aefb31eb245.html (in French).
Beaudry, C., 2013. Hydrog�eochimie de l'aquif�ere rocheux r�egional en Mont�er�egieest, Qu�ebec. M.Sc. thesis. Institut national de la recherche scientifique (INRS),Quebec, Canada, p. 196. Available at: http://espace.inrs.ca/1363/ (in French).
Bonotto, D.M., Caprioglio, L., 2002. Radon in groundwaters from Guarany aquifer,South America: environmental and exploration implications. Appl. Radiat. Isot.57, 931e940.
Brutsaert, W.F., Norton, S.A., Hess, C.T., Williams, J.S., 1981. Geologic and hydrologicfactors controlling radon-222 ingroundwater inMaine.GroundWater19, 407e417.
Carrier, M.-A., Lefebvre, R., Rivard, C., et al., 2013. Portrait des ressources en eausouterraine en Mont�er�egie Est, Qu�ebec, Canada. Final Report INRS R-1412.Available at. http://espace.inrs.ca/1639/ (in French).
Cecil, D.L., Green, J., 2000. Radon-222. In: Cook, P., Herczeg, A.L. (Eds.), Environ-mental Tracers in Subsurface Hydrology. Kluwer Academic Publisher, Dor-drecht, the Netherlands, 175e194.
Chah, B., Zikovsky, L., 1989. A new method for the determination of radon in waterby scintillation in ortho-xylene. Rev. Sci. Eau 3, 343e354.
Chen, J., Moir, D., MacLellan, K., Leigh, E., Nunez, D., Murphy, S., Ford, K., 2012. Soilradon measurements in the Canadian cities. Radiat. Prot. Dosim. 151, 172e174.
Cloutier, V., Lefebvre, R., Savard, M.M., Bourque, �E., Therrien, R., 2006. Hydro-geochemistry and groundwater origin of the Basses-Laurentides sedimentaryrock aquifer system, St. Lawrence Lowlands, Qu�ebec, Canada. Hydrogeol. J. 14,573e590.
Cloutier, V., Lefebvre, R., Savard, M.M., Therrien, R., 2010. Desalination of a sedi-mentary rock aquifer system invaded by Pleistocene Champlain Sea water andprocesses controlling groundwater geochemistry. Environ. Earth Sci. 59,977e994.
Crawford-Brown, D.J., 1989. The biokinetics and dosimetry of radon-222 in thehuman body following ingestion of ground water. Environ. Geochem. Health 11,10e17.
Dahlkamp, F.J., 2010. Appalachian Highlands and Piedmont. In: Dahlkamp, F.J. (Ed.),Uranium Deposits of the World. USA and Latin America. Springer, Berlin,pp. 357e366. Chapter 9.
Dessau, J.C., Gagnon, F., L�evesque, B., Pr�evost, C., Leclerc, J.-M., Belles-Isles, J.-C.,2005. Radon in Quebec e Evaluation of the Health Risk and Critical Analysis ofIntervention Strategies. Institut National de Sant�e Publique du Qu�ebec, p. 191.Available at: http://www.inspq.qc.ca/pdf/publications/476-RadonInQuebec-Feuillet.pdf (in French with English summary).
Dostal, J., Capedri, S., 1978. Uranium in metamorphic rocks. Contrib. Minerol. Petrol.66, 409e414.
Drolet, J.-P., Martel, R., Poulin, P., Dessau, J.-C., Lavoie, D., Parent, M., L�evesque, B.,2013. An approach to define potential radon emission level maps using indoorradon concentration measurements and radiogeochemical data positive pro-portion relationships. J. Environ. Radioact. 124, 57e67.
Dyck, W., 1979. Application of hydrogeochemistry to the search for uranium.Economic Geology Report. In: Hood, P.J. (Ed.), Geophysics and Geochemistryin the Search for Metallic Ores, 31. Geological Survey of Canada, pp. 489e510.
Dyck, W., 1980. Uranium, radon, helium and other trace elements and gases in wellwaters of parts of the St. Lawrence Lowlands, (Ottawa region) Canada.J. Geochem. Explor. 13, 27e39.
Eby, N., 1984. Monteregian Hills I. Petrography, major and trace elementgeochemistry and strontium isotopic chemistry of the western intrusions: MontRoyal, St. Bruno and Johnson. J. Petrol. 25, 421e452.
Freyer, K., Treutler, H.C., Dehnert, J., Nestler, W., 1997. Sampling and measurement ofradon-222 in water. J. Environ. Radioact. 37, 327e337.
Globensky, Y., 1987. G�eologie des Basses-Terres du Saint-Laurent, Qu�ebec. Minist�eredes Richesses Naturelles du Qu�ebec, p. 63. MM85-02 (in French).
Globensky, Y., 1993. Lexique stratigraphique canadien. In: R�egion des Appalaches,des Basses-Terres du Saint-Laurent et des Iles de la Madeleine, vol. V-B. Min-ist�ere de l'�Energie et des Ressources et Direction G�en�erale de l'Explorationg�eologique et min�erale, p. 327. DV 91e23 (in French).
Grasty, R.L., LaMarre, J.R., 2004. The annual effective dose from natural sources ofionising radiation in Canada. Radiat. Prot. Dosim. 108, 215e226.
Graves, B., 1989. Radon, Radium, and Other Radioactivity in Ground Water. LewisPublishers Inc., Chelsea.
Han, Y.L., Tom Kuo, M.C., Fan, K.C., Chiang, C.J., Lee, Y.P., 2004. Radon distribution ingroundwater of Taiwan. Hydrogeol. J. 14, 173e179.
Harley, N.H., Robbins, E.S., 1994. A biokinetic model for Rn-222 gas distribution andalpha dose in humans following ingestion. Environ. Int. 20, 605e610.
Health Canada, 2007. Radon Guidelines. http://www.hc-sc.gc.ca/ewh-semt/radiation/radon/guidelines_lignes_directrice-eng.php (in English).
Health Canada, 2009. Report on Occupational Radiation Exposures in Canada. In:Canada Publication 5923, ISBN 978-1-100-12713-2. Cat. H128-1/09-581E.
Hess, C.T., Michel, J., Horton, T.R., Prichard, H.M., Coniglio, W.A., 1985. The occur-rence of radioactivity in public water supplies in the United States. Health Phys.48, 553e586.
Horton, T.R., 1983. Methods and Results of EPA's Study of Radon in Drinking Water.Environmental Protection Agency, ,Washington, DC, p. 29. EPA-520/5-83-027.
Knutsson, G., Olofsson, B., 2002. Radon content in groundwater from drilled wells inthe Stockholm region of Sweden. NGU Bull. 439, 79e85.
Kulich, J., M€ore, H., Swedjemark, G.A., 1997. Radon and Radium in Household Water.SSI-rapport 88-11. Swedish Radiation Protection Institute, Stockholm, Sweden(in Swedish).
Lamothe, M., 1989. A new framework for the Pleistocene stratigraphy of the centralSt. Lawrence Lowland, southern Qu�ebec. G�eogr. Phys. Quat. 43, 119e129.
Larocque, M., Gagn�e, S., Tremblay, L., Meyzonnat, G., 2013a. Projet de connaissancedes eaux souterraines du bassin versant de la rivi�ere B�ecancour et de la MRC deB�ecancour. Quebec Ministry of Environment, p. 187. PACES Final Report. Avail-able at: http://www.grobec.org/hydrogeo/pdf/Rapport_synthese_PACES_Becancour_2013.pdf (in French).
Larocque, M., Meyzonnat, G., Gagn�e, S., 2013b. Projet de connaissance des eauxsouterraines de la zone Nicolet et de la partie basse de la zone Saint-François.PACES Final Report. Quebec Ministry of Environment, p. 73 (in French).
Lavoie, D., 2008. Appalachian Foreland Basin in Canada. In: Hsu, K.J., Miall, A.D.(Eds.), Sedimentary Basins of the World, Sedimentary Basins of the World eUSA and Canada, vol. 5. Elsevier, Amsterdam, pp. 65e103.
Lavoie, D., Rivard, C., Lefebvre, R., S�ejourn�e, S., Th�eriault, R., Duchesne, M.J.,Ahad, J.M.E., Wang, B., Benoit, N., Lamontagne, C., 2013. The Utica Shale and gasplay in southern Quebec: geological and hydrogeological syntheses andmethodological approaches to groundwater risk evaluation. Inter. J. Coal Geol.126, 77e91.
Leaney, F.W., Herczeg, A.L., 2006. A rapid field extraction method for determinationof radon-222 in natural waters by liquid scintillation counting. Limnol. Oce-anogr. Methods 4, 254e259.
Leblanc, Y., L�egar�e, G., Lacasse, K., Parent, M., Campeau, S., 2013. Caract�erisationhydrog�eologique du sud-ouest de la Mauricie. Quebec Ministry of Environment,p. 153. PACES Final Report. Available at: http://www.rqes-gries.ca/upload/files/Rapports/PACES-Phase-1/MAUR_Rap_Vulgarise_28juin.pdf (in French).
Lefebvre, K., Barbecot, F., Ghaleb, B., Larocque, M., Gagn�e, S., 2013. Full rangedeterminationof 222Rn at the watershed scale by liquid scintillation counting.Appl. Radiat. Isot. 75, 71e76.
L�evesque, B., Gauvin, D., McGregor, R.G., Martel, R., Gingras, S., Dontigny, A.,Walken,W.B., Lajoie, P.,1995. �Etuded'exposition auRadon-222dans les r�esidencesde la Province de Qu�ebec. Centre de Sant�e Publique de Qu�ebec, p. 55. Report.
D.L. Pinti et al. / Journal of Environmental Radioactivity 136 (2014) 206e217 217
Longtin, J.P., 1988. Occurrence of radon, radium, and uranium in groundwater. J. Am.Water Works Assoc. 80, 84e93.
Lubin, J.H., Boice Jr., J.D., 1997. Lung cancer risk from residential radon: meta-analysis of eight epidemiologic studies. J. Nat. Cancer Inst. 89, 49e57.
Lubin, J.H., Boice Jr., J.D., Edling, C., Hornung, R.W., Howe, G., Kunz, E., Kuziak, R.A.,Morrison, H.I., Radford, E.P., Samet, J.M., Tirmarche, M., Woodward, A., Yao, S.X.,Pierce, D.A., 1995. Lung cancer in radon exposed miners and estimation of riskfrom indoor exposure. J. Nat. Cancer Inst. 87, 817e827.
Markkanen, M., Arvela, H., 1992. Radon emanation from soils. Radiat. Prot. Dosim.45, 269e272.
Michel, J., Jordana, M.J., 1987. Nationwide distribution of Ra-228, Ra-226, Rn-222,and U in groundwater. In: Proceedings of the National Water Well Associa-tion Conference, April 7e9, 1987, pp. 227e240.
Morland, G., Strand, T., Furuhaug, L., Skarphagen, H., Banks, D., 1998. Radon inquaternary aquifers related to underlying bedrock geology. Ground Water 36,143e146.
Murphy, M., Wollenberg, H., Strisower, B., Bowman, H., Flexser, S., Carmichael, I.,1978. Uranium in Alkaline Rocks. LBNL Paper LBL-7029. US DOE, p. 185.
National Research Council, 1999. Risk Assessment of Radon in Drinking Water.NationalAcademies Press, Washington, p. 249.
Nazaroff, W.W., 1992. Radon transport from soil to air. Rev. Geophys. 30, 137e160.Nowamooz, A., Lemieux, J.-M., Therrien, R., 2013. Mod�elisation num�erique de la
migration du m�ethane dans les Basses-Terres du Saint-Laurent. StrategicEnvironmental Evaluation Committee on Shale gas. Report E3-10, p. 126.Available at: http://ees-gazdeschiste.gouv.qc.ca/wordpress/wp-content/uploads/2013/12/Rapport-etude-E3-10_UL.pdf (in French).
Pickler, C., Pinti, D.L., Ghaleb, B., Gardu~no, V.H., Tremblay, A., 2012. Radium deple-tion and 210Pb/226Ra disequilibrium of Marítaro hydrothermal deposits, LosAzufres geothermal field, Mexico. Geochem. J. 46, 493e504.
Pinti, D.L., B�eland-Otis, C., Tremblay, A., Castro, M.C., Hall, C.M., Marcil, J.-S.,Lavoie, J.-Y., Lapointe, R., 2011. Fossil brines preserved in the St-LawrenceLowlands, Qu�ebec, Canada as revealed by their chemistry and noble gas iso-topes. Geochim. Cosmochim. Acta 75, 4228e4243.
Pinti, D.L., G�elinas, Y., Larocque, M., Barnetche, D., Retailleau, S., Moritz, A., H�elie, J.-F., Lefebvre, R., 2013a. Concentrations, sources et m�ecanismes de migrationpr�ef�erentielle des gaz d'origine naturelle (m�ethane, h�elium, radon) dans leseaux souterraines des Basses- Terres du Saint-Laurent. Strategic EnvironmentalEvaluation Committee on Shale Gas. Report E3-9, p. 104. Available at: http://ees-gazdeschiste.gouv.qc.ca/wordpress/wp-content/uploads/2013/11/Rapport-etude-E3-9_Geotop-UQAM.pdf (in French).
Pinti, D.L., Vautour, G., Roulleau, E., Castro, M.C., Sano, Y., 2013b. Helium isotopicgradients in a catchment basin: constraining groundwater flow patterns andresidence times. Mineral. Mag. 77, 1973 (Abstract).
Roireau, N., Zikovsky, L., 1989. Determination of radon in groundwater of Quebec.J. Radioanal. Nucl. Chem. Lett. 137, 79e85.
Ryder, R.T., 2008. Assessment of Appalachian Basin Oil and Gas Resources: Utica-Lower Paleozoic Total Petroleum System, USGS Open-File Report 2008-1287, 52.
Savard, M., Dessau, J.C., Pellerin, E., 1998. Le radon �a Oka. Rapport d'int�ervention desant�e publique. Public Heath commission of Laurentides Region, p. 146. Report.Available at: http://www.inspq.qc.ca/pdf/publications/352-radon_rapport.pdf(in French).
S�ejourn�e, S., Lefebvre, R., Malet, X., Lavoie, D., 2013. Synth�ese g�eologique ethydrog�eologique du Shale d'Utica et des unit�es sus-jacentes (Lorraine, Queen-ston et d�epots meubles), Basses- Terres du Saint-Laurent, Qu�ebec. Open-FileReport 7338. Geological Survey Canada, p. 165.
Simard, G., Des Rosiers, R., 1979. Qualit�e des eaux souterraines au Qu�ebec. Min-ist�ere de l'Environnement du Qu�ebec, Service des eaux souterraines, p. 161.H.G.-13.
Soto, J., Fernandez, P.L., Gomez, J., Rodenas, C., 1995. Study of the occurrence of222Rn and 226Ra in drinking water in Spain. Health Phys. 69, 961e965.
Telford, W.M., 1983. Radon mapping in the search for uranium. In: Fitch, A.A. (Ed.),Developments in Geophysical Exploration Methods, vol. 4. Elsevier, Amsterdam,pp. 155e194.
Tilsey, J.E., Veldhuyzen, H., Nichols, P.R., 1993. Soil Radon Gas Study of SouthernOntario. Open File Report 5847. Ontario Geological Survey, p. 148.
Tran Ngoc, T.D., Lefebvre, R., Konstantinovskaya, E., Malo, M., 2014. Characterizationof deep saline aquifers in the B�ecancour area, St. Lawrence Lowlands, Qu�ebec,Canada: implications for CO2 geological storage. Environ. Earth Sci. http://dx.doi.org/10.1007/s12665-013-2941-7.
USEPA (United States Environmental Protection Agency), 1999. Radon in DrinkingWater: Health Risk Reduction and Cost Analysis. Federal Register 64,Washington.
Vesterbacka, P., M€akel€ainen, I., Arvela, H., 2005. Natural radioactivity in drinkingwater in private wells in Finland. Radiat. Prot. Dosim. 113, 223e232.
Vinson, D.S., Campbell, T.R., Vengosh, A., 2008. Radon transfer from groundwaterused in showers to indoor air. Appl. Geochem. 23, 2676e2685.
Vinson, D.S., Tagma, T., Bouchaou, L., Dwyer, G.S., Warner, N.R., Vengosh, A., 2013.Occurrence and mobilization of radium in fresh to saline coastal groundwaterinferred from geochemical and isotopic tracers (Sr, S, O, H, Ra, Rn). Appl.Geochem. 38, 161e175.
World Health Organization, 2002. Guidelines for Drinking Water Quality: Radio-logical Aspects. Available at: http://www.who.int/water_sanitation_health/dwq/GDW9rev1and2.pdf.
World Health Organization, 2008. Guidelines for Drinking-Water Quality [Elec-tronic Resource]: Incorporating 1st and 2nd Addenda. Recommendations, thirded., vol. 1, ISBN 978 92 4 154761 1
Wood, W.W., Kraemer, T.F., Shapiro, A., 2004. Radon (222Rn) in groundwater offractured rocks: a diffusion/ion exchange model. Ground Water 42, 552e567.
Zikovsky, L., Chah, B., 1990. The lognormal distribution of radon concentration inground water. Ground Water 28, 673e676.