placing our customers in company making process. - latam airlines … · 2018-08-04 · focus on...
TRANSCRIPT


We are constantly adapting, placing our customers in the heart of our decision-making process.
O U R
C O M PA N Y
O U R C O M P A N Y 4
L ATA M
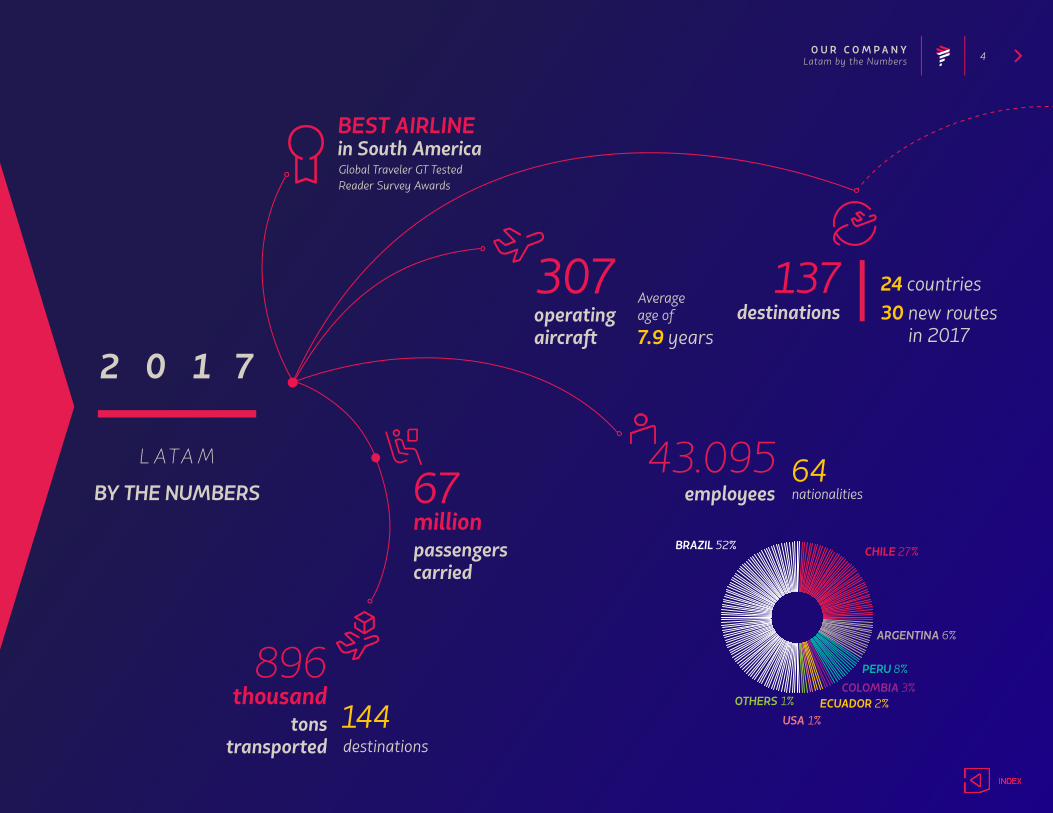
BY THE NUMBERS43.095
employees
307operating aircraft
Averageage of7.9 years
64 nationalities
137destinations
24 countries
tonstransported destinations
144
67millionpassengers carried
30 new routes in 2017
896thousand OTHERS 1%
USA 1%ECUADOR 2%
COLOMBIA 3%PERU 8%
ARGENTINA 6%
CHILE 27%BRAZIL 52%
BEST AIRLINE in South AmericaGlobal Traveler GT Tested Reader Survey Awards
Latam by the Numbers

O U R C O M P A N Y 5
Our commitment is to offer passengers a unique travel experience; this is why all our decisions focus on customer satisfaction. With the current trend aiming towards a customized travel.
IN 2017 WE IMPLEMENTED A NEW BUSINESS MODEL FOR DOMESTIC MARKETS. SUPPORTED
BY “MERCADO LATAM” AND A NEW SEGMENTED FARES STRUCTURE, THIS NEW MODEL BROUGHT TO OVER 85% OF OUR PASSENGERS THE ACCESS TO TARIFFS UP TO 40% LOWER AND A GREATER
FLEXIBILITY IN THEIR TRAVEL. ITS ROLLOUT AMONG OUR DOMESTIC AFFILIATES IMPLIED A
GREAT EFFORT FROM ALL OF US AT LATAM GROUP, AND WE ARE PROUD OF THE POSITIVE RESULTS
WE HAVE OBTAINED.
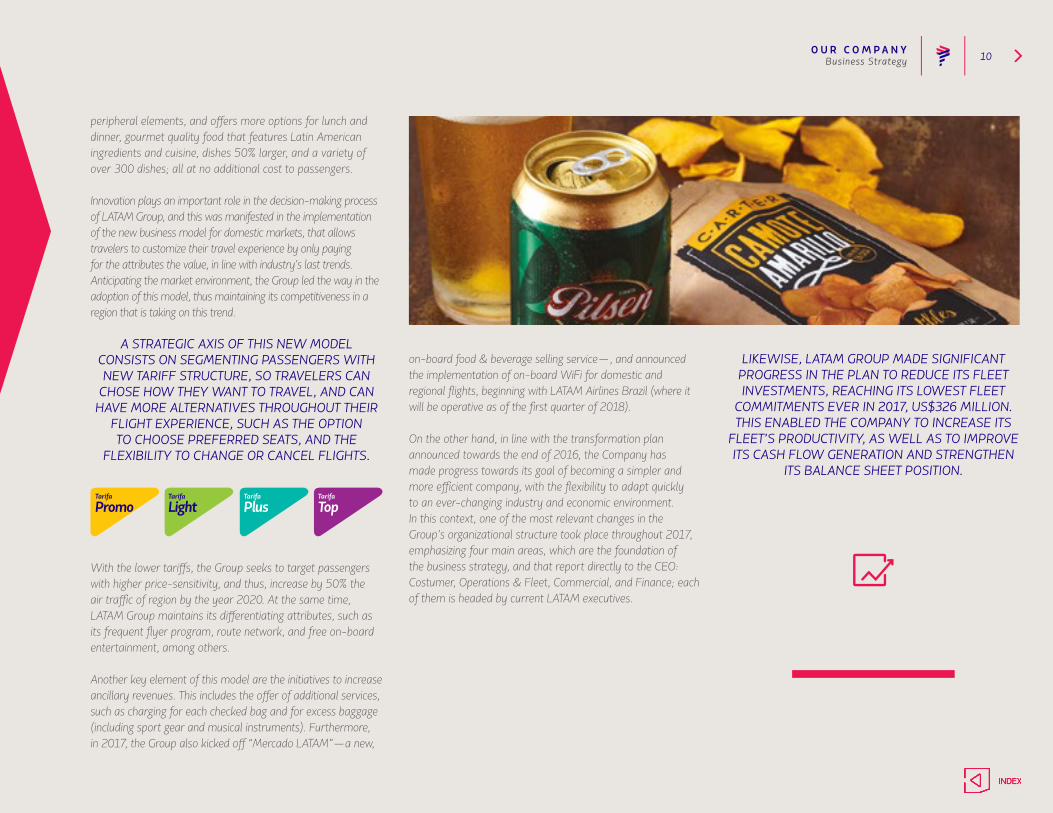
Also, after seeing the great difference to the international travel experience that on-board dining makes, we embarked upon the challenge of redesigning the traditional food tray served on board the Economy cabin of flights lasting over seven hours. As a result, we developed a new dining experience, unique in the industry, that gives our passengers more options to choose from, a more comfortable format, and gourmet quality food that showcase the best of Latin American and international cuisine, with over 300 new dishes. All this is available at no additional cost to our passengers, who have loved the new service.
Along the same line, we have continued to invest in self-service technologies, so that our passengers can tend to themselves in a simple, transparent, and fully independent way. As an example, during 2017 we set up over 700 kiosks throughout more than 80 airports. IATA acknowledged our self-service initiatives and certified us in the “Platinum” category of its “Fast
Welcome Letter
Welcome
Dear shareholders,
I n 2017 we experienced the greatest transformation in our recent history—a process that we undertook with the aim to improve our offer to passengers and move towards a
simpler and more efficient organization. We aspire to become one of the most admired airline groups in the world, and I am certain that the steps we have taken in the last few years in terms of client initiatives, destinations network, productivity, and sustainability have set us on the right path to achieve this.
Enrique Cueto PlazaCEO LATAM Group

O U R C O M P A N Y 6
Travel” program, confirming our commitment with offering a leading travel experience in the industry.
Simultaneously, in 2017 we continued to work towards obtaining the approval of the Joint Business Agreements (JBAs) with American Airlines and IAG (British Airways and Iberia). The antitrust authorities of Brazil, Colombia, and Uruguay have already granted their approval, and we are only awaiting the resolution in Chile and the confirmation of Open Skies in Brazil (which has already been approved by Congress). We expect to complete this process in 2018 so we can begin to implement these new agreements, which will provide our passengers with access to a broader network of destinations, as well as more flights, better connection times, and better prices.
In order to expedite the coordination among our affiliates and streamline the decision-making process, we defined a new organizational structure in 2017, shifting from business units to a functional structure that focuses on four main areas of responsibility—Clients, Operations, Marketing, and Finance. This will enable us to adapt continuously to an evolving industry and a
volatile economic environment, thereby improving our competitiveness.
IN LATAM GROUP WE UPHOLD A LONG-TERM COMMITMENT TO THE REGION, REFLECTED IN ITS SUSTAINABILITY STRATEGY, WHOSE FOCUS
IS BOTH TO COMPENSATE THE ENVIRONMENTAL IMPACT OF OUR OPERATIONS AND TO ACTIVELY
CONTRIBUTE TO SOCIETY.
Accordingly, for the fourth consecutive year, we were included in the “World” category of the Dow Jones Sustainability Index (DJSI), which acknowledges the performance of the top 10% leading companies in sustainability within this index, being among the only three airline groups in this category worldwide.
Welcome Letter
IN 2017, WE MADE GREAT ACHIEVEMENTS IN TERMS OF EXPANDING AND OPTIMIZING OUR
NETWORK, OPENING 30 NEW ROUTES, INCLUDING SANTIAGO-MELBOURNE, WHOSE 15-HOUR
DURATION MAKES IT LATAM’S LONGEST NON-STOP FLIGHT. MOREOVER, WE CONTINUED TO STRENGTHEN OUR HUBS, CONNECTING SAO PAULO TO BARILOCHE AND MORE DOMESTIC
DESTINATIONS IN BRAZIL, LIMA TO RIO DE JANEIRO AND CARTAGENA, BOTH LIMA AND SANTIAGO
TO VARIOUS SECONDARY CITIES THROUGHOUT ARGENTINA, AND SANTIAGO TO ORLANDO AND
SANTA CRUZ.
O U R C O M P A N Y 7
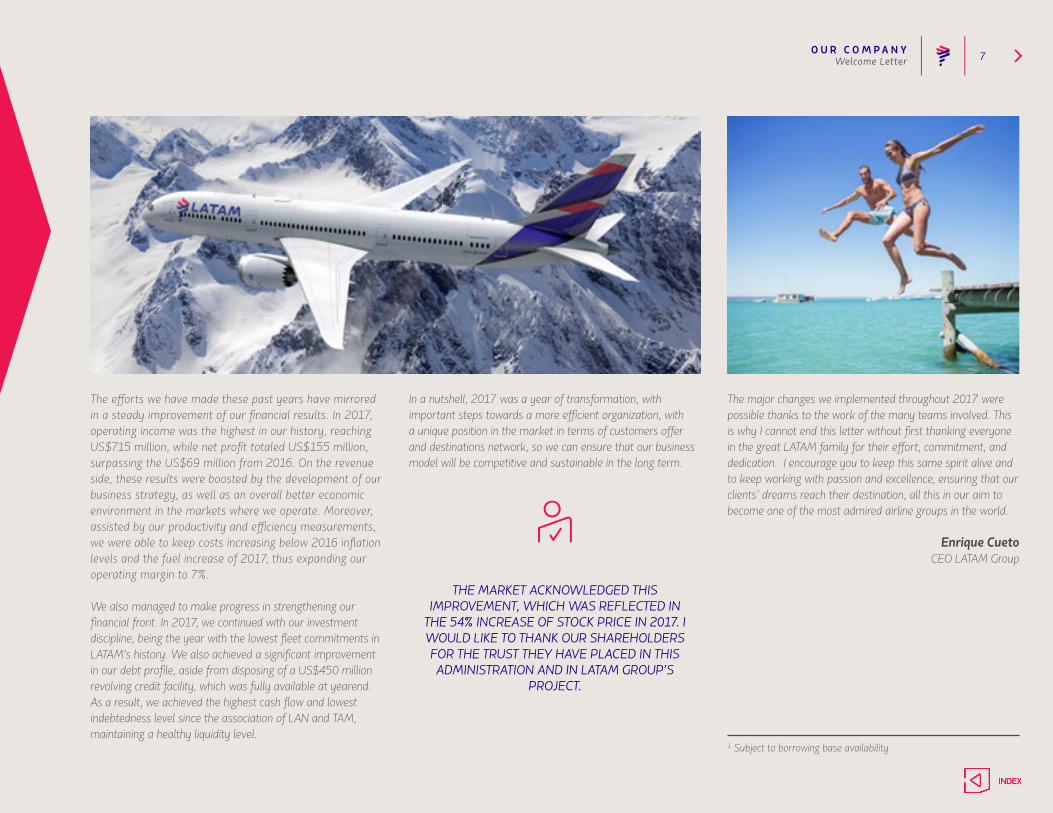
The efforts we have made these past years have mirrored in a steady improvement of our financial results. In 2017, operating income was the highest in our history, reaching US$715 million, while net profit totaled US$155 million, surpassing the US$69 million from 2016. On the revenue side, these results were boosted by the development of our business strategy, as well as an overall better economic environment in the markets where we operate. Moreover, assisted by our productivity and efficiency measurements, we were able to keep costs increasing below 2016 inflation levels and the fuel increase of 2017, thus expanding our operating margin to 7%.
We also managed to make progress in strengthening our financial front. In 2017, we continued with our investment discipline, being the year with the lowest fleet commitments in LATAM’s history. We also achieved a significant improvement in our debt profile, aside from disposing of a US$450 million revolving credit facility, which was fully available at yearend. As a result, we achieved the highest cash flow and lowest indebtedness level since the association of LAN and TAM, maintaining a healthy liquidity level.
In a nutshell, 2017 was a year of transformation, with important steps towards a more efficient organization, with a unique position in the market in terms of customers offer and destinations network, so we can ensure that our business model will be competitive and sustainable in the long term.
THE MARKET ACKNOWLEDGED THIS IMPROVEMENT, WHICH WAS REFLECTED IN
THE 54% INCREASE OF STOCK PRICE IN 2017. I WOULD LIKE TO THANK OUR SHAREHOLDERS FOR THE TRUST THEY HAVE PLACED IN THIS ADMINISTRATION AND IN LATAM GROUP’S
PROJECT.
The major changes we implemented throughout 2017 were possible thanks to the work of the many teams involved. This is why I cannot end this letter without first thanking everyone in the great LATAM family for their effort, commitment, and dedication. I encourage you to keep this same spirit alive and to keep working with passion and excellence, ensuring that our clients’ dreams reach their destination, all this in our aim to become one of the most admired airline groups in the world.
Enrique CuetoCEO LATAM Group
Welcome Letter
1 Subject to borrowing base availability

O U R C O M P A N Y 8
The Group’s business strategy is based on five success pillars that will enable it to guarantee the sustainability of its business in the long term, driving the growth of the region’s air traffic and improving its profitability. These five pillars are: strengthening and leadership in route network; customer experience; passenger segmentation; ancillary revenue; and operating efficiency.
ONE OF THE MAIN STRENGTHS OF LATAM GROUP IS THE BROAD ROUTE NETWORK THAT IT HAS
CREATED THROUGHOUT THE YEARS. THE AIRLINES OF THE GROUP ARE IN SIX DOMESTIC MARKETS
IN THE REGION—BRAZIL, CHILE, ARGENTINA, PERU, COLOMBIA, AND ECUADOR—IN ADDITION
TO OFFERING INTERREGIONAL FLIGHTS, AND INTERNATIONAL FLIGHTS THAT CONNECT SOUTH AMERICA AND THE REST OF THE WORLD. THIS
BROAD NETWORK ENABLES LATAM TO ITS PASSENGERS A WIDE RANGE OF FLIGHTS, WITH
SEVERAL DESTINATIONS, CONNECTIONS, AND ITINERARY OPTIONS.
The Group seeks permanently to develop its route network. In this regard, the most relevant projects are the Joint Business Agreement (JBA) that it expects to complete with IAG Group (British Airways and Iberia) and American Airlines, and which would expand its offer to over 420 destinations. In 2017, the regulatory authorities of Brazil and Colombia gave their green light, following the steps of Uruguay’s authorization in 2016. Thus, the Chilean regulator’s approval for both agreements remains pending; besides the ratification of Open Skies between Brazil and the US, so the authority from the latter country can approve the agreement with American Airlines. Regarding the ratification of Open Skies, it’s worth highlighting that in 2017, both the Chamber of Deputies and the Senate of Brazil authorized this agreement, thus only remaining the approval from the Executive of this country.
Business Strategy
Business
L ATAM is the largest group of passenger and cargo airlines in South America. At December 2017, it was offering passenger transportation services to roughly
137 destinations in 24 countries, and cargo services to around 144 destinations in 29 countries, by operating a fleet of 307 airplanes, while having several bilateral alliances.
O U R C O M P A N Y 9
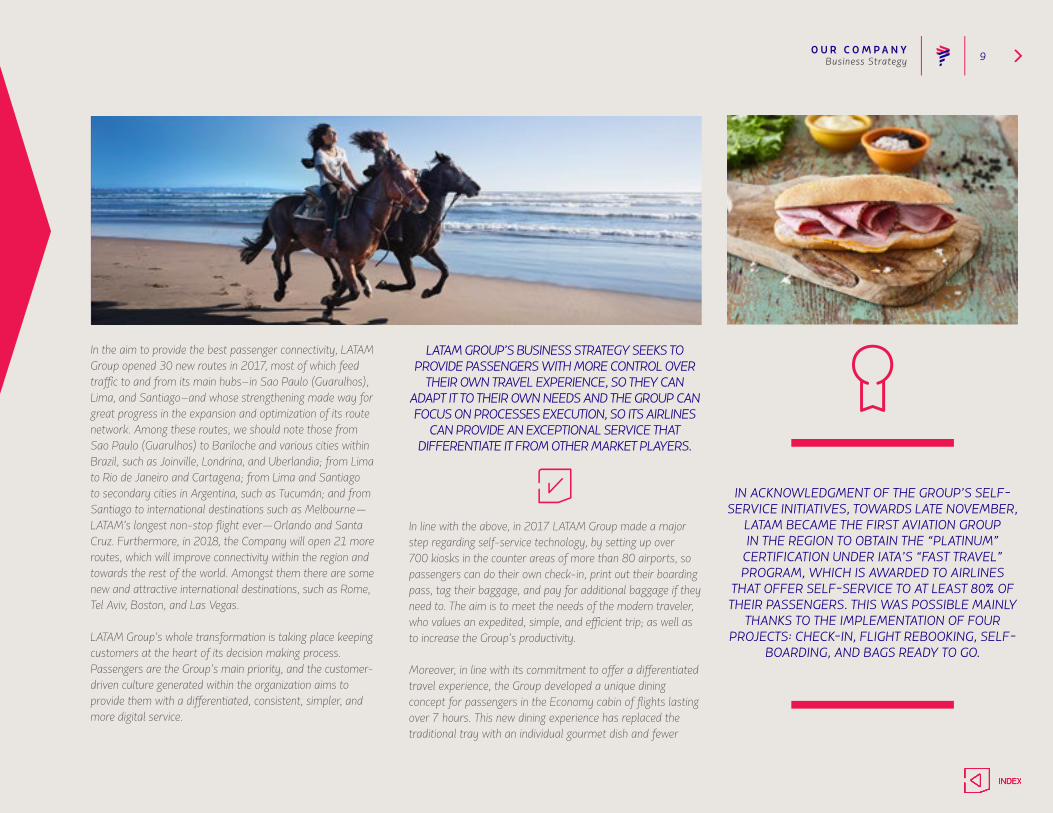
In the aim to provide the best passenger connectivity, LATAM Group opened 30 new routes in 2017, most of which feed traffic to and from its main hubs–in Sao Paulo (Guarulhos), Lima, and Santiago–and whose strengthening made way for great progress in the expansion and optimization of its route network. Among these routes, we should note those from Sao Paulo (Guarulhos) to Bariloche and various cities within Brazil, such as Joinville, Londrina, and Uberlandia; from Lima to Rio de Janeiro and Cartagena; from Lima and Santiago to secondary cities in Argentina, such as Tucumán; and from Santiago to international destinations such as Melbourne—LATAM’s longest non-stop flight ever—Orlando and Santa Cruz. Furthermore, in 2018, the Company will open 21 more routes, which will improve connectivity within the region and towards the rest of the world. Amongst them there are some new and attractive international destinations, such as Rome, Tel Aviv, Boston, and Las Vegas.
LATAM Group’s whole transformation is taking place keeping customers at the heart of its decision making process. Passengers are the Group’s main priority, and the customer-driven culture generated within the organization aims to provide them with a differentiated, consistent, simpler, and more digital service.
LATAM GROUP’S BUSINESS STRATEGY SEEKS TO PROVIDE PASSENGERS WITH MORE CONTROL OVER
THEIR OWN TRAVEL EXPERIENCE, SO THEY CAN ADAPT IT TO THEIR OWN NEEDS AND THE GROUP CAN FOCUS ON PROCESSES EXECUTION, SO ITS AIRLINES
CAN PROVIDE AN EXCEPTIONAL SERVICE THAT DIFFERENTIATE IT FROM OTHER MARKET PLAYERS.
In line with the above, in 2017 LATAM Group made a major step regarding self-service technology, by setting up over 700 kiosks in the counter areas of more than 80 airports, so passengers can do their own check-in, print out their boarding pass, tag their baggage, and pay for additional baggage if they need to. The aim is to meet the needs of the modern traveler, who values an expedited, simple, and efficient trip; as well as to increase the Group’s productivity.
Moreover, in line with its commitment to offer a differentiated travel experience, the Group developed a unique dining concept for passengers in the Economy cabin of flights lasting over 7 hours. This new dining experience has replaced the traditional tray with an individual gourmet dish and fewer
Business Strategy
IN ACKNOWLEDGMENT OF THE GROUP’S SELF-SERVICE INITIATIVES, TOWARDS LATE NOVEMBER,
LATAM BECAME THE FIRST AVIATION GROUP IN THE REGION TO OBTAIN THE “PLATINUM”
CERTIFICATION UNDER IATA’S “FAST TRAVEL” PROGRAM, WHICH IS AWARDED TO AIRLINES
THAT OFFER SELF-SERVICE TO AT LEAST 80% OF THEIR PASSENGERS. THIS WAS POSSIBLE MAINLY
THANKS TO THE IMPLEMENTATION OF FOUR PROJECTS: CHECK-IN, FLIGHT REBOOKING, SELF-
BOARDING, AND BAGS READY TO GO.
O U R C O M P A N Y 10
peripheral elements, and offers more options for lunch and dinner, gourmet quality food that features Latin American ingredients and cuisine, dishes 50% larger, and a variety of over 300 dishes; all at no additional cost to passengers.
Innovation plays an important role in the decision-making process of LATAM Group, and this was manifested in the implementation of the new business model for domestic markets, that allows travelers to customize their travel experience by only paying for the attributes the value, in line with industry’s last trends. Anticipating the market environment, the Group led the way in the adoption of this model, thus maintaining its competitiveness in a region that is taking on this trend.
A STRATEGIC AXIS OF THIS NEW MODEL CONSISTS ON SEGMENTING PASSENGERS WITH NEW TARIFF STRUCTURE, SO TRAVELERS CAN
CHOSE HOW THEY WANT TO TRAVEL, AND CAN HAVE MORE ALTERNATIVES THROUGHOUT THEIR
FLIGHT EXPERIENCE, SUCH AS THE OPTION TO CHOOSE PREFERRED SEATS, AND THE
FLEXIBILITY TO CHANGE OR CANCEL FLIGHTS.
With the lower tariffs, the Group seeks to target passengers with higher price-sensitivity, and thus, increase by 50% the air traffic of region by the year 2020. At the same time, LATAM Group maintains its differentiating attributes, such as its frequent flyer program, route network, and free on-board entertainment, among others.
Another key element of this model are the initiatives to increase ancillary revenues. This includes the offer of additional services, such as charging for each checked bag and for excess baggage (including sport gear and musical instruments). Furthermore, in 2017, the Group also kicked off “Mercado LATAM”—a new,
on-board food & beverage selling service—, and announced the implementation of on-board WiFi for domestic and regional flights, beginning with LATAM Airlines Brazil (where it will be operative as of the first quarter of 2018).
On the other hand, in line with the transformation plan announced towards the end of 2016, the Company has made progress towards its goal of becoming a simpler and more efficient company, with the flexibility to adapt quickly to an ever-changing industry and economic environment. In this context, one of the most relevant changes in the Group’s organizational structure took place throughout 2017, emphasizing four main areas, which are the foundation of the business strategy, and that report directly to the CEO: Costumer, Operations & Fleet, Commercial, and Finance; each of them is headed by current LATAM executives.
Business Strategy
LIKEWISE, LATAM GROUP MADE SIGNIFICANT PROGRESS IN THE PLAN TO REDUCE ITS FLEET INVESTMENTS, REACHING ITS LOWEST FLEET
COMMITMENTS EVER IN 2017, US$326 MILLION. THIS ENABLED THE COMPANY TO INCREASE ITS
FLEET’S PRODUCTIVITY, AS WELL AS TO IMPROVE ITS CASH FLOW GENERATION AND STRENGTHEN
ITS BALANCE SHEET POSITION.
O U R C O M P A N Y 11
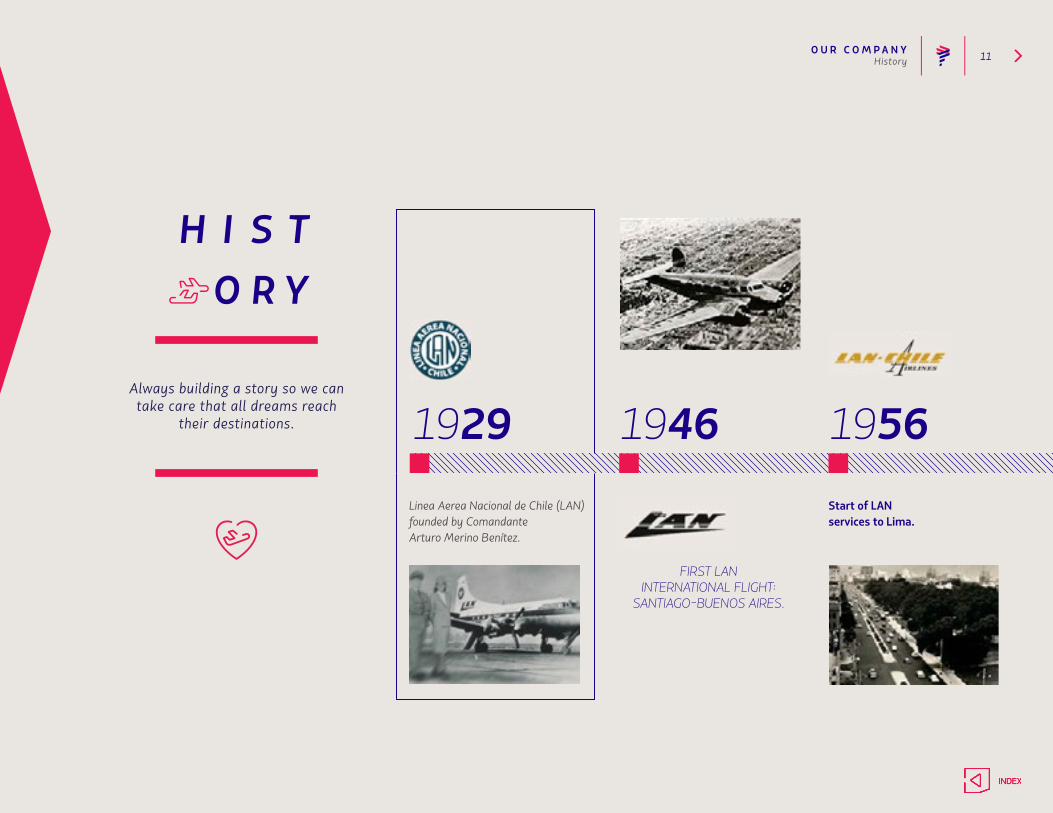
Always building a story so we can take care that all dreams reach
their destinations. 1929 1946 1956Linea Aerea Nacional de Chile (LAN) founded by ComandanteArturo Merino Benítez.
FIRST LANINTERNATIONAL FLIGHT:
SANTIAGO-BUENOS AIRES.
Start of LAN services to Lima.
History
O U R C O M P A N Y 12
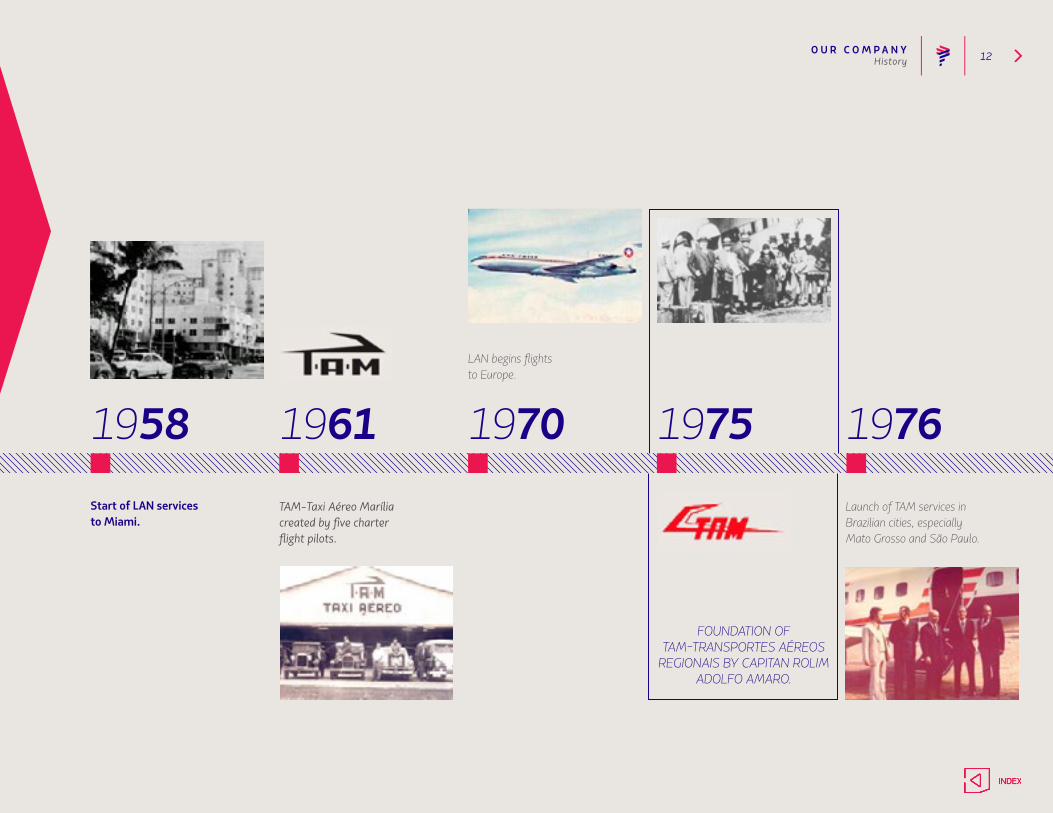
1958 1961 1976Start of LAN servicesto Miami.
1970 1975TAM-Taxi Aéreo Marília created by five charterflight pilots.
LAN begins flightsto Europe.
Launch of TAM services inBrazilian cities, especiallyMato Grosso and São Paulo.
FOUNDATION OFTAM-TRANSPORTES AÉREOS
REGIONAIS BY CAPITAN ROLIM ADOLFO AMARO.
History
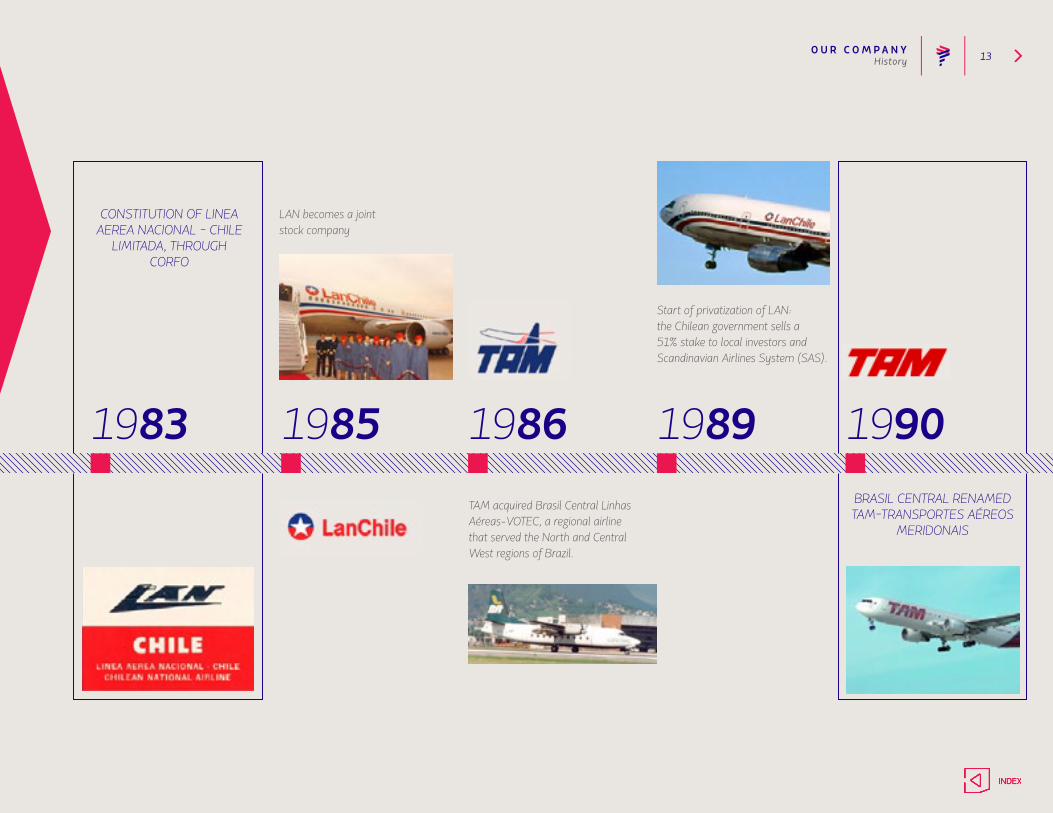
O U R C O M P A N Y 13
1983 1985 19901986 1989
CONSTITUTION OF LINEA AEREA NACIONAL - CHILE
LIMITADA, THROUGH CORFO
LAN becomes a jointstock company
TAM acquired Brasil Central Linhas Aéreas-VOTEC, a regional airline that served the North and Central West regions of Brazil.
Start of privatization of LAN: the Chilean government sells a 51% stake to local investors and Scandinavian Airlines System (SAS).
BRASIL CENTRAL RENAMED TAM-TRANSPORTES AÉREOS
MERIDONAIS
History
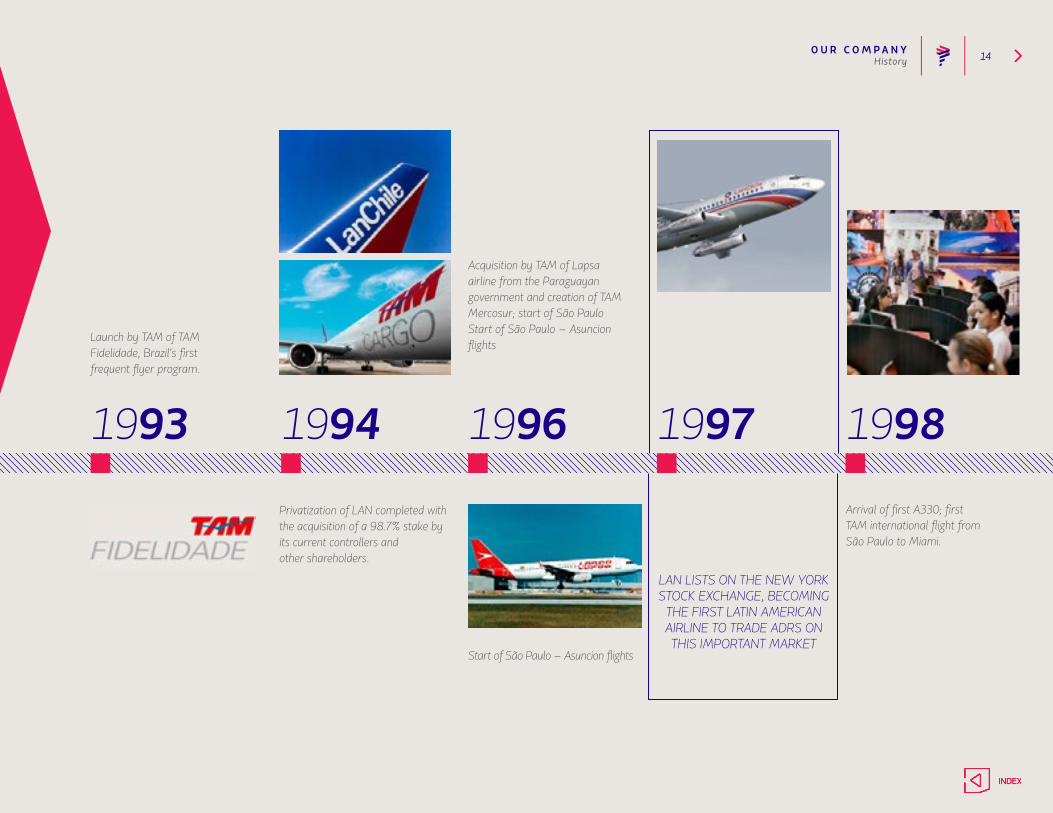
O U R C O M P A N Y 14
1993 1994 19981996 1997
Launch by TAM of TAM Fidelidade, Brazil's firstfrequent flyer program.
Privatization of LAN completed with the acquisition of a 98.7% stake by its current controllers andother shareholders.
Start of São Paulo – Asuncion flights
Acquisition by TAM of Lapsa airline from the Paraguayan government and creation of TAM Mercosur; start of São PauloStart of São Paulo – Asuncion flights
LAN LISTS ON THE NEW YORK STOCK EXCHANGE, BECOMING
THE FIRST LATIN AMERICAN AIRLINE TO TRADE ADRS ON THIS IMPORTANT MARKET
Arrival of first A330; firstTAM international flight fromSão Paulo to Miami.
History
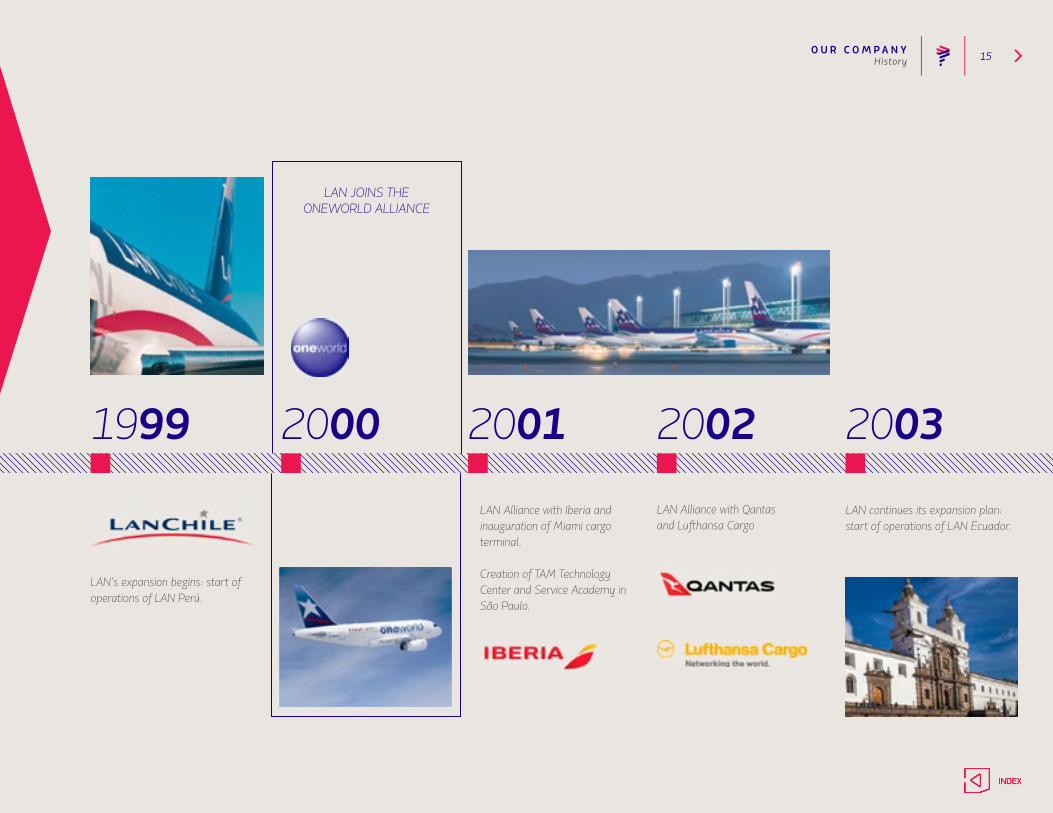
O U R C O M P A N Y 15
1999 2000 20032001 2002
LAN’s expansion begins: start of operations of LAN Perú.
LAN JOINS THE ONEWORLD ALLIANCE
LAN Alliance with Iberia and inauguration of Miami cargo terminal.
Creation of TAM Technology Center and Service Academy in São Paulo.
LAN Alliance with Qantas and Lufthansa Cargo
LAN continues its expansion plan: start of operations of LAN Ecuador.
History
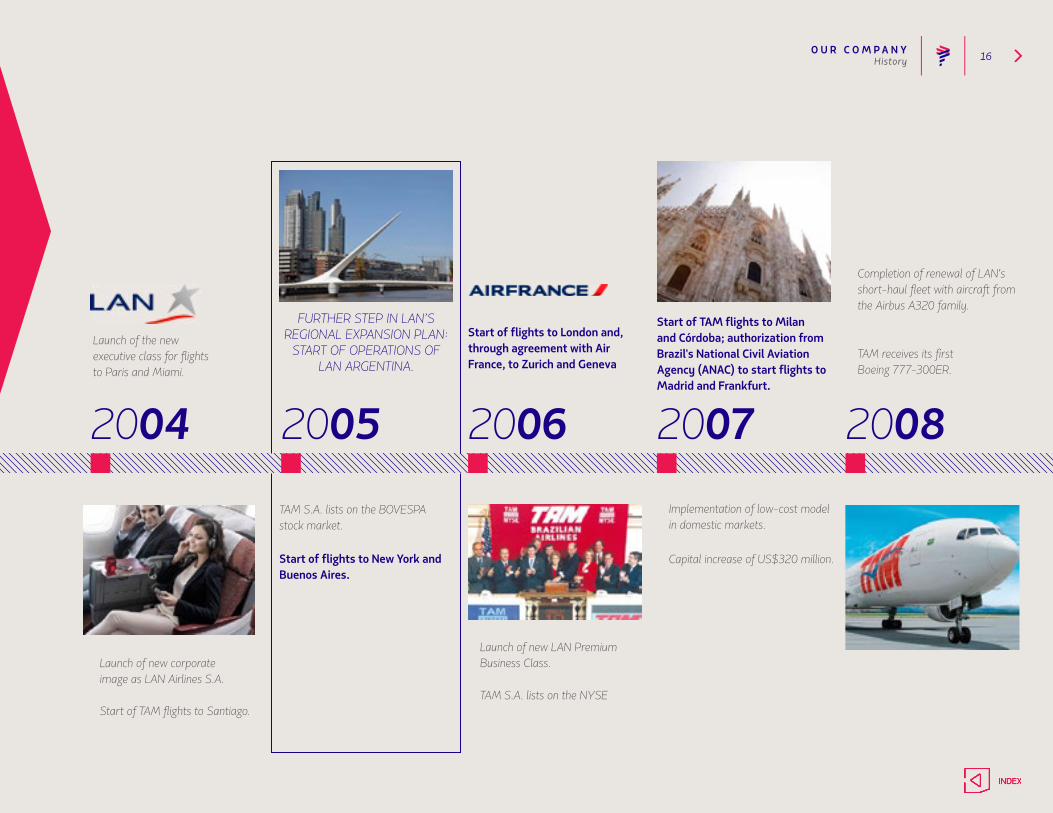
O U R C O M P A N Y 16
2004 2005 20082006 2007
Launch of new corporate image as LAN Airlines S.A.
Start of TAM flights to Santiago.
Start of flights to New York and Buenos Aires.
Start of flights to London and, through agreement with Air France, to Zurich and Geneva
Start of TAM flights to Milan and Córdoba; authorization from Brazil's National Civil Aviation Agency (ANAC) to start flights to Madrid and Frankfurt.
TAM receives its firstBoeing 777-300ER.
FURTHER STEP IN LAN’S REGIONAL EXPANSION PLAN:
START OF OPERATIONS OF LAN ARGENTINA.
TAM S.A. lists on the BOVESPA stock market.
Launch of new LAN Premium Business Class.
TAM S.A. lists on the NYSE
Implementation of low-cost model in domestic markets.
Capital increase of US$320 million.
Completion of renewal of LAN's short-haul fleet with aircraft from the Airbus A320 family.
Launch of the new executive class for flightsto Paris and Miami.
History
O U R C O M P A N Y 17
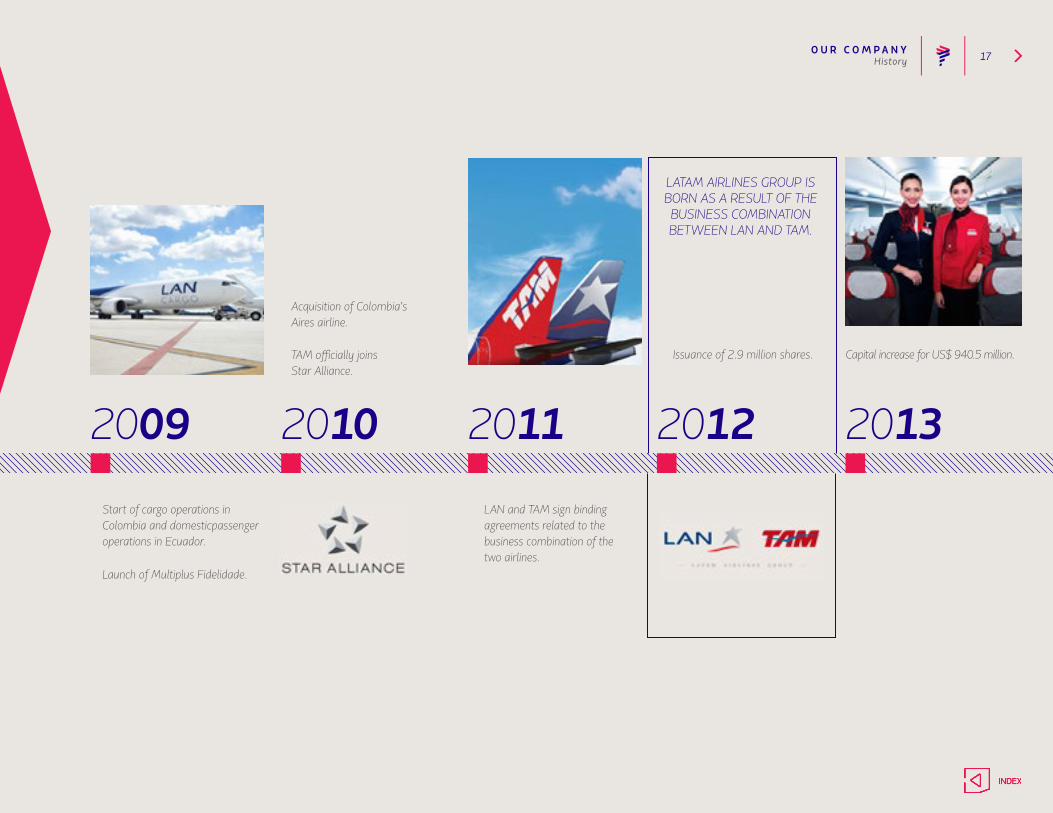
2009 2010 20132011 2012
Start of cargo operations in Colombia and domesticpassenger operations in Ecuador.
Acquisition of Colombia's Aires airline.
LAN and TAM sign binding agreements related to the business combination of the two airlines.
Issuance of 2.9 million shares. Capital increase for US$ 940.5 million.
Launch of Multiplus Fidelidade.
TAM officially joinsStar Alliance.
LATAM AIRLINES GROUP IS BORN AS A RESULT OF THE BUSINESS COMBINATION BETWEEN LAN AND TAM.
History

O U R C O M P A N Y 18
2014 2015 2016 2017
TAM joins oneworld alliance, which becomes LATAM Airlines Group global alliance.
LATAM is Born: The New Brand for LAN Airlines, TAM Airlines and Affiliates.
Capital increase of US $ 608 million with which Qatar Airways acquires 10% of the total of paidand subscribed shares of LATAM.
IMPLEMENTATION OF THE NEW TRAVEL
MODEL BY THE AFFILIATES OF THE
DOMESTIC MARKETS
LATAM launches its 2015- 2018 Strategic Plan.
EETC structured bond issuefor US $ 1,020MM:First in Latin America.
History
O U R C O M P A N Y 19Fleet
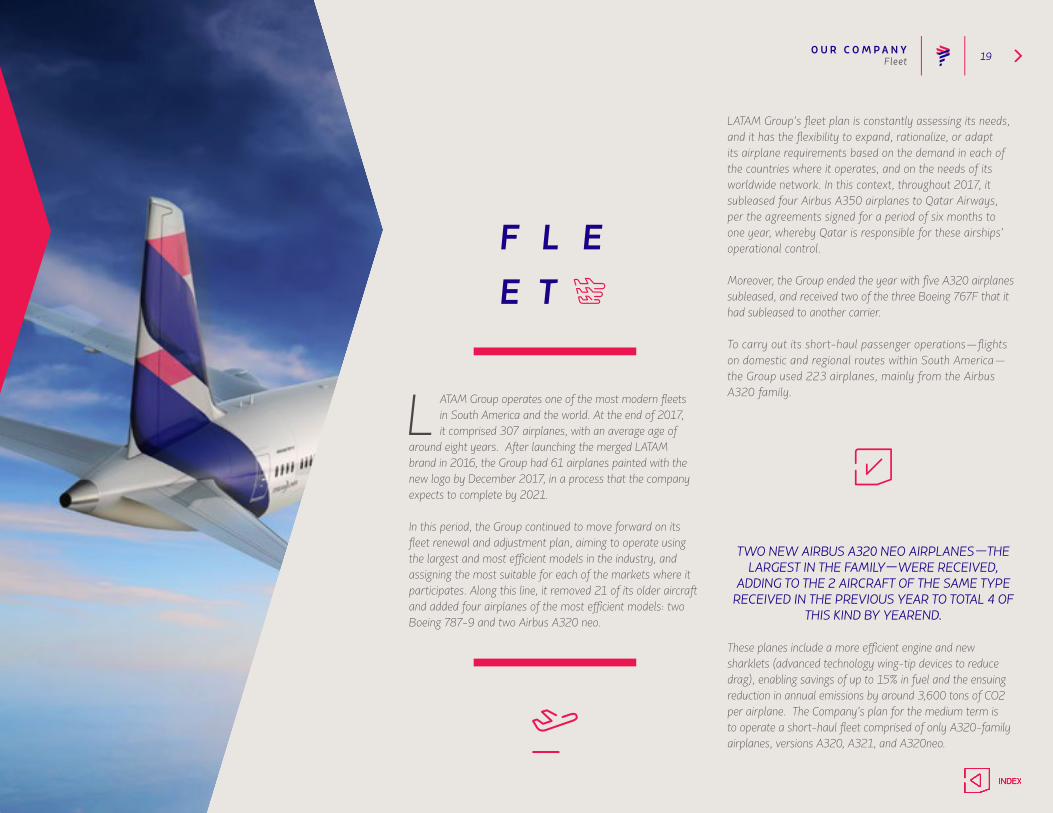
L ATAM Group operates one of the most modern fleets in South America and the world. At the end of 2017, it comprised 307 airplanes, with an average age of
around eight years. After launching the merged LATAM brand in 2016, the Group had 61 airplanes painted with the new logo by December 2017, in a process that the company expects to complete by 2021.
In this period, the Group continued to move forward on its fleet renewal and adjustment plan, aiming to operate using the largest and most efficient models in the industry, and assigning the most suitable for each of the markets where it participates. Along this line, it removed 21 of its older aircraft and added four airplanes of the most efficient models: two Boeing 787-9 and two Airbus A320 neo.
LATAM Group’s fleet plan is constantly assessing its needs, and it has the flexibility to expand, rationalize, or adapt its airplane requirements based on the demand in each of the countries where it operates, and on the needs of its worldwide network. In this context, throughout 2017, it subleased four Airbus A350 airplanes to Qatar Airways, per the agreements signed for a period of six months to one year, whereby Qatar is responsible for these airships’ operational control.
Moreover, the Group ended the year with five A320 airplanes subleased, and received two of the three Boeing 767F that it had subleased to another carrier.
To carry out its short-haul passenger operations—flights on domestic and regional routes within South America—the Group used 223 airplanes, mainly from the Airbus A320 family.
TWO NEW AIRBUS A320 NEO AIRPLANES—THE LARGEST IN THE FAMILY—WERE RECEIVED,
ADDING TO THE 2 AIRCRAFT OF THE SAME TYPE RECEIVED IN THE PREVIOUS YEAR TO TOTAL 4 OF
THIS KIND BY YEAREND.
These planes include a more efficient engine and new sharklets (advanced technology wing-tip devices to reduce drag), enabling savings of up to 15% in fuel and the ensuing reduction in annual emissions by around 3,600 tons of CO2 per airplane. The Company’s plan for the medium term is to operate a short-haul fleet comprised of only A320-family airplanes, versions A320, A321, and A320neo.
O U R C O M P A N Y 20Fleet
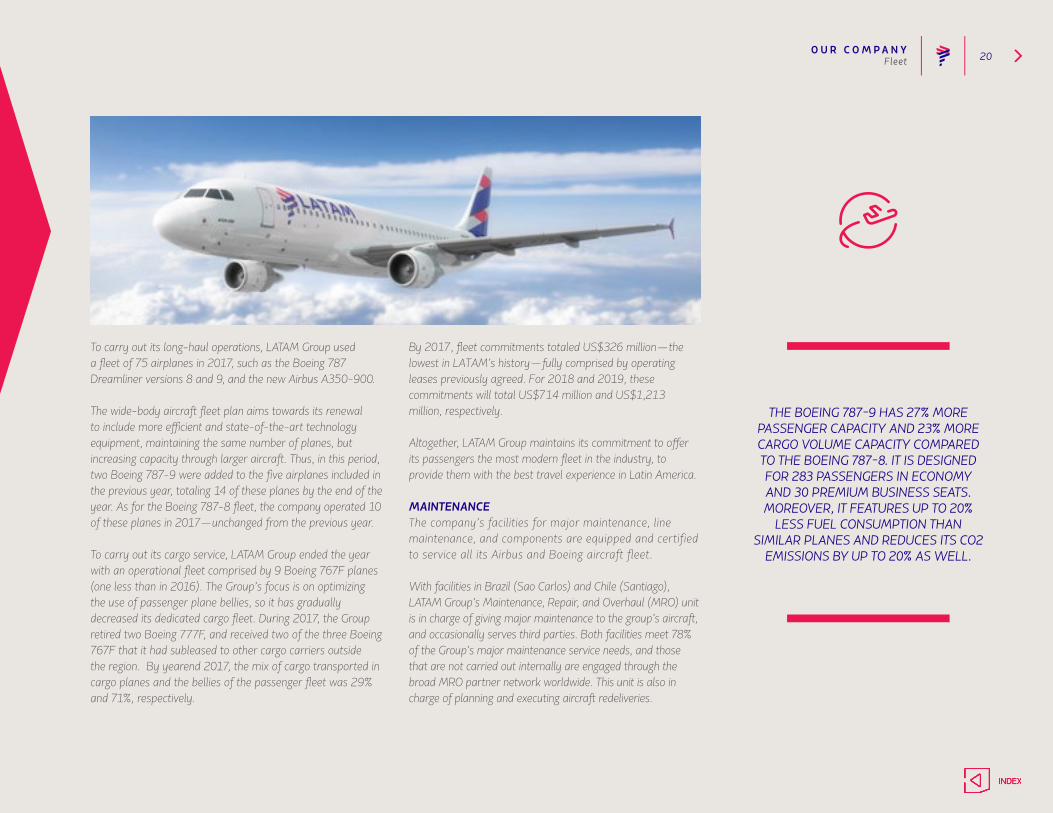
To carry out its long-haul operations, LATAM Group used a fleet of 75 airplanes in 2017, such as the Boeing 787 Dreamliner versions 8 and 9, and the new Airbus A350-900.
The wide-body aircraft fleet plan aims towards its renewal to include more efficient and state-of-the-art technology equipment, maintaining the same number of planes, but increasing capacity through larger aircraft. Thus, in this period, two Boeing 787-9 were added to the five airplanes included in the previous year, totaling 14 of these planes by the end of the year. As for the Boeing 787-8 fleet, the company operated 10 of these planes in 2017—unchanged from the previous year.
To carry out its cargo service, LATAM Group ended the year with an operational fleet comprised by 9 Boeing 767F planes (one less than in 2016). The Group’s focus is on optimizing the use of passenger plane bellies, so it has gradually decreased its dedicated cargo fleet. During 2017, the Group retired two Boeing 777F, and received two of the three Boeing 767F that it had subleased to other cargo carriers outside the region. By yearend 2017, the mix of cargo transported in cargo planes and the bellies of the passenger fleet was 29% and 71%, respectively.
By 2017, fleet commitments totaled US$326 million—the lowest in LATAM’s history—fully comprised by operating leases previously agreed. For 2018 and 2019, these commitments will total US$714 million and US$1,213 million, respectively.
Altogether, LATAM Group maintains its commitment to offer its passengers the most modern fleet in the industry, to provide them with the best travel experience in Latin America.
MAINTENANCE The company’s facilities for major maintenance, line maintenance, and components are equipped and certified to service all its Airbus and Boeing aircraft fleet.
With facilities in Brazil (Sao Carlos) and Chile (Santiago), LATAM Group’s Maintenance, Repair, and Overhaul (MRO) unit is in charge of giving major maintenance to the group’s aircraft, and occasionally serves third parties. Both facilities meet 78% of the Group’s major maintenance service needs, and those that are not carried out internally are engaged through the broad MRO partner network worldwide. This unit is also in charge of planning and executing aircraft redeliveries.
THE BOEING 787-9 HAS 27% MORE PASSENGER CAPACITY AND 23% MORE CARGO VOLUME CAPACITY COMPARED TO THE BOEING 787-8. IT IS DESIGNED FOR 283 PASSENGERS IN ECONOMY AND 30 PREMIUM BUSINESS SEATS. MOREOVER, IT FEATURES UP TO 20%
LESS FUEL CONSUMPTION THAN SIMILAR PLANES AND REDUCES ITS CO2
EMISSIONS BY UP TO 20% AS WELL.
O U R C O M P A N Y 21
At the Brazil MRO, which includes its own support engineering capacity and a full technical training center, the Group is prepared to service up to eight planes simultaneously, with a hangar devoted to stripping and painting. At this facility, it also has 22 technical component shops, including a full shop to repair and overhaul landing gear, hydraulic gear, tires, electronics, electric components, electroplating, compounds, wheels and brakes, interiors, and emergency equipment. It also has an exclusive 1,720-meter runway.
The Santiago MRO, located near the Comodoro Arturo Merino Benítez international airport, has two hangars with capacity to service one wide-body and two narrow-body airplanes simultaneously. It has 10 shops set up to support the hangar, such as cabins, galley, structures, and compound materials, and it has capacity to adapt airplane interiors, including setting up the wireless IFE (In-Flight Entertainment) and winglets.
IN 2017, THE MRO UNIT EFFECTIVELY USED 1.2 MILLION MAN-HOURS, SERVICING OVER 300
AIRPLANES IN LATAM’S FLEET, AND REPAIRING AROUND 55 THOUSAND COMPONENTS DELIVERED
TO THE MAINTENANCE OPERATIONS.
On the other hand, the line maintenance network offers a full range of maintenance services for aircraft to ensure that the fleet is functioning safely and in compliance with all local and international regulation. The network has facilities at the hangars in Santiago, São Carlos, São Paulo (CGH), Lima, Miami, Buenos Aires (AEP), and Brasilia, among others.
In 2017, the line maintenance network effectively used 2.2 million man-hours on preventive and corrective maintenance tasks for the LATAM fleet. The Group also receives services
from certified third parties at some destinations where it is financially convenient, such as Frankfurt, where it is serviced by Lufthansa Technik; Milan, by Air France-KLM; and Johannesburg, by South African Airways.
We should note that, since 2010, maintenance at LATAM follows production and support processes transformed under the LEAN methodology, which has translated into a process automatization and integration, improving both the productivity levels of the technical teams and emergency response times, as well as simplifying and strengthening the maintenance processes, rendering them upgradable and visible to all the organization.
In addition to the development of these IT systems, the Group has delivered over 700 iPads throughout its maintenance network to improve on-site maintenance connectivity.
Built in 2015, the Group also has a hangar at the Miami International Airport. This city offers a strategic geographic advantage for obtaining supplies and services, as well as a broader range of suppliers to carry out complex maintenance tasks. The hangar and surrounding infrastructure cover over 66,000 square feet and implied an investment of US$16.5 million.
Fleet
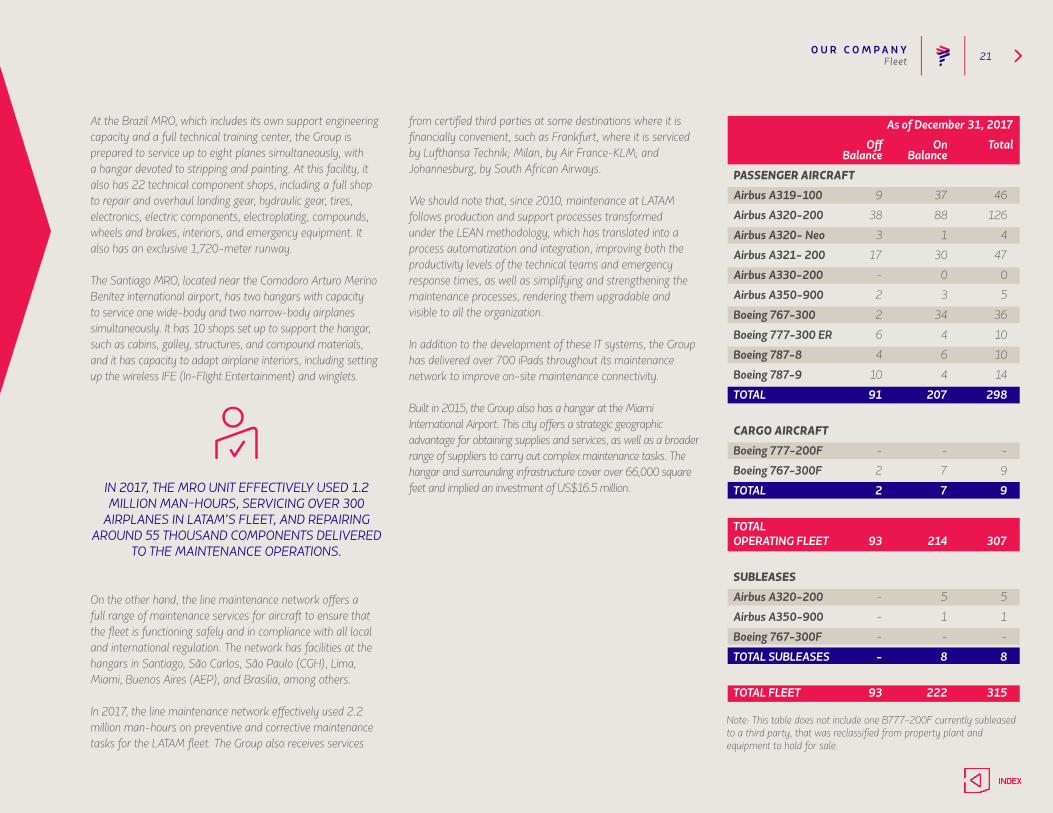
Note: This table does not include one B777-200F currently subleased to a third party, that was reclassified from property plant and equipment to hold for sale.
As of December 31, 2017
Off On Total Balance Balance
PASSENGER AIRCRAFT
Airbus A319-100 9 37 46
Airbus A320-200 38 88 126
Airbus A320- Neo 3 1 4
Airbus A321- 200 17 30 47
Airbus A330-200 - 0 0
Airbus A350-900 2 3 5
Boeing 767-300 2 34 36
Boeing 777-300 ER 6 4 10
Boeing 787-8 4 6 10
Boeing 787-9 10 4 14
TOTAL 91 207 298
CARGO AIRCRAFT
Boeing 777-200F - - -
Boeing 767-300F 2 7 9
TOTAL 2 7 9
TOTALOPERATING FLEET 93 214 307
SUBLEASES
Airbus A320-200 - 5 5
Airbus A350-900 - 1 1
Boeing 767-300F - - -
TOTAL SUBLEASES - 8 8
TOTAL FLEET 93 222 315
O U R C O M P A N Y 22
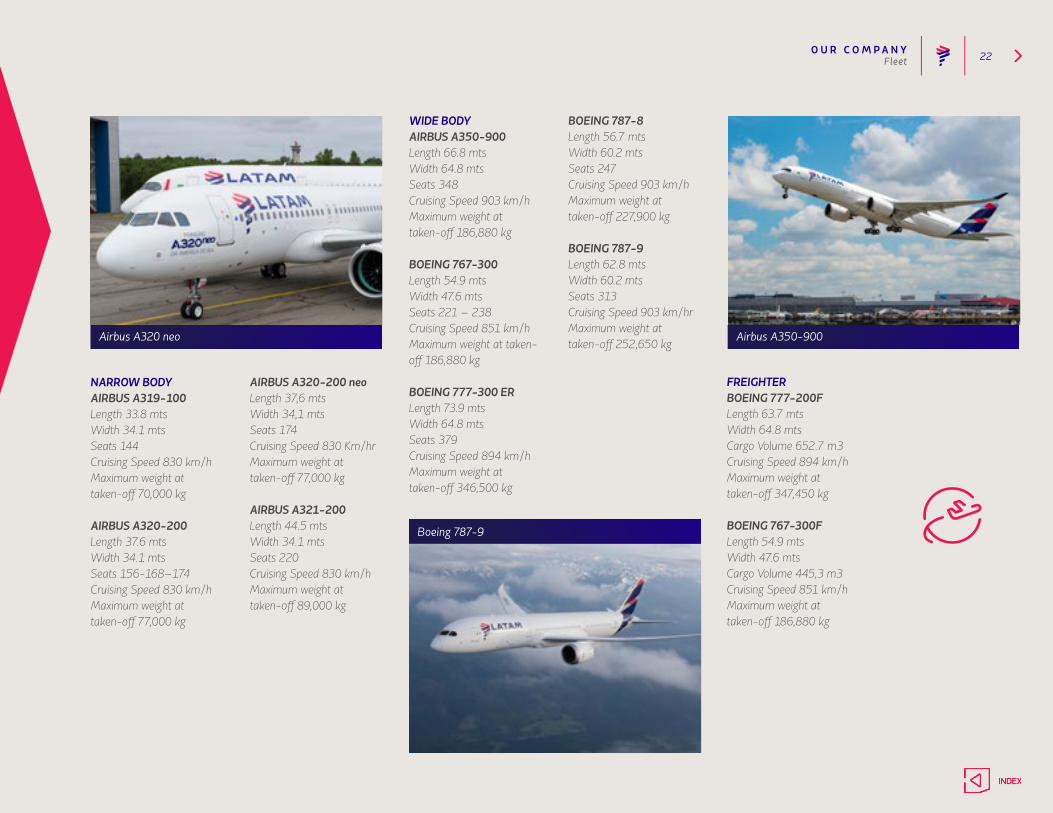
NARROW BODYAIRBUS A319-100Length 33.8 mtsWidth 34.1 mtsSeats 144Cruising Speed 830 km/hMaximum weight attaken-off 70,000 kg
AIRBUS A320-200Length 37.6 mtsWidth 34.1 mtsSeats 156-168–174Cruising Speed 830 km/hMaximum weight attaken-off 77,000 kg
AIRBUS A320-200 neoLength 37,6 mtsWidth 34,1 mtsSeats 174Cruising Speed 830 Km/hrMaximum weight attaken-off 77,000 kg
AIRBUS A321-200Length 44.5 mtsWidth 34.1 mtsSeats 220Cruising Speed 830 km/hMaximum weight attaken-off 89,000 kg
WIDE BODYAIRBUS A350-900Length 66.8 mtsWidth 64.8 mtsSeats 348Cruising Speed 903 km/hMaximum weight attaken-off 186,880 kg
BOEING 767-300Length 54.9 mtsWidth 47.6 mtsSeats 221 – 238Cruising Speed 851 km/hMaximum weight at taken-off 186,880 kg
BOEING 777-300 ERLength 73.9 mtsWidth 64.8 mtsSeats 379Cruising Speed 894 km/hMaximum weight attaken-off 346,500 kg
BOEING 787-8Length 56.7 mtsWidth 60.2 mtsSeats 247Cruising Speed 903 km/hMaximum weight attaken-off 227,900 kg
BOEING 787-9Length 62.8 mtsWidth 60.2 mtsSeats 313Cruising Speed 903 km/hrMaximum weight attaken-off 252,650 kg
FREIGHTERBOEING 777-200FLength 63.7 mtsWidth 64.8 mtsCargo Volume 652.7 m3Cruising Speed 894 km/hMaximum weight attaken-off 347,450 kg
BOEING 767-300FLength 54.9 mtsWidth 47.6 mtsCargo Volume 445,3 m3Cruising Speed 851 km/hMaximum weight attaken-off 186,880 kg
Fleet
Airbus A320 neo
Boeing 787-9
Airbus A350-900
O U R C O M P A N Y 23Destinations
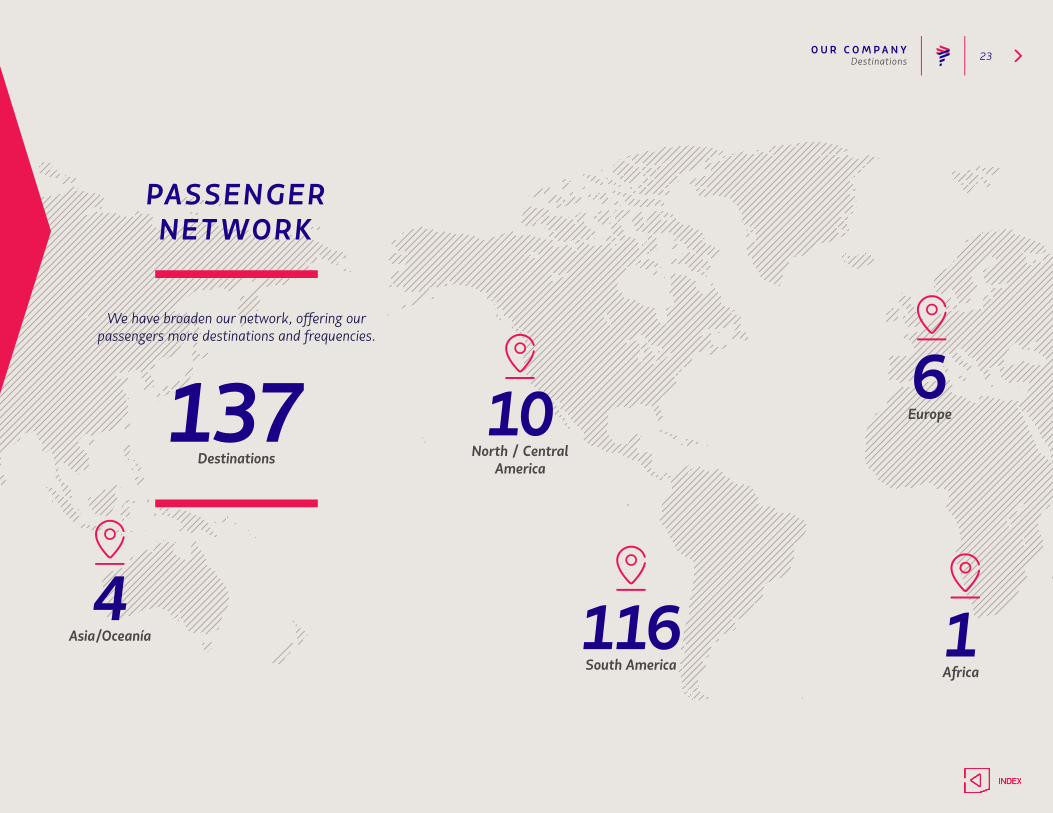
PASSENGERNETWORK
North / Central America
Europe
AfricaSouth America
Asia/Oceanía
10 6
11164
We have broaden our network, offering our passengers more destinations and frequencies.
Destinations137
O U R C O M P A N Y 24Destinations
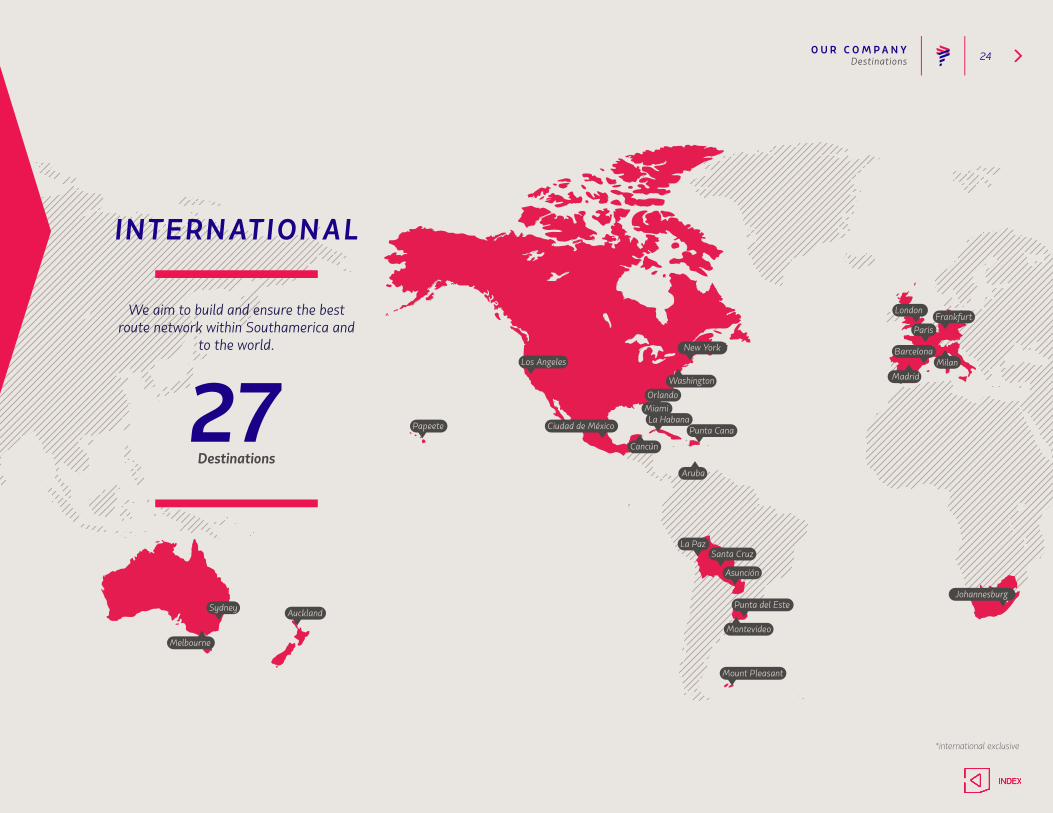
INTERNATIONAL
We aim to build and ensure the best route network within Southamerica and
to the world.
Destinations 27
Punta del EsteAuckland
Orlando
Ciudad de México
Santa Cruz
Johannesburg
London
Asunción
Paris
MiamiLa Habana
La Paz
Sydney
Barcelona
Melbourne
Washington
Punta Cana
Los Angeles
Aruba
Milan
Mount Pleasant
Madrid
New York
Cancún
Montevideo
Papeete
Frankfurt
*international exclusive

O U R C O M P A N Y 25Destinations
BRAZIL
Destinations41 Aracaju
João Pessoa
Brasilia
Río Branco
Ilhéus
Maceió
Curitiba
São José Do Rio Preto
Belém
Manaos
Cuiabá
Río de Janeiro
Joinville
Navegantes
Fortaleza
Salvador
Ribeirão Preto
Porto Alegre
Foz do Iguaçu
Teresina
Bauru
Marabá
Boa Vista
Recife
Jaguaruna
Natal
Florianópolis
São Luís
Belo Horizonte
Macapá
Campo Grande
São PauloLondrina
Palmas
Goiânia
Santarém
Porto Seguro
Porto Velho
Imperatriz
Uberlândia
Vitória
O U R C O M P A N Y 26Destinations
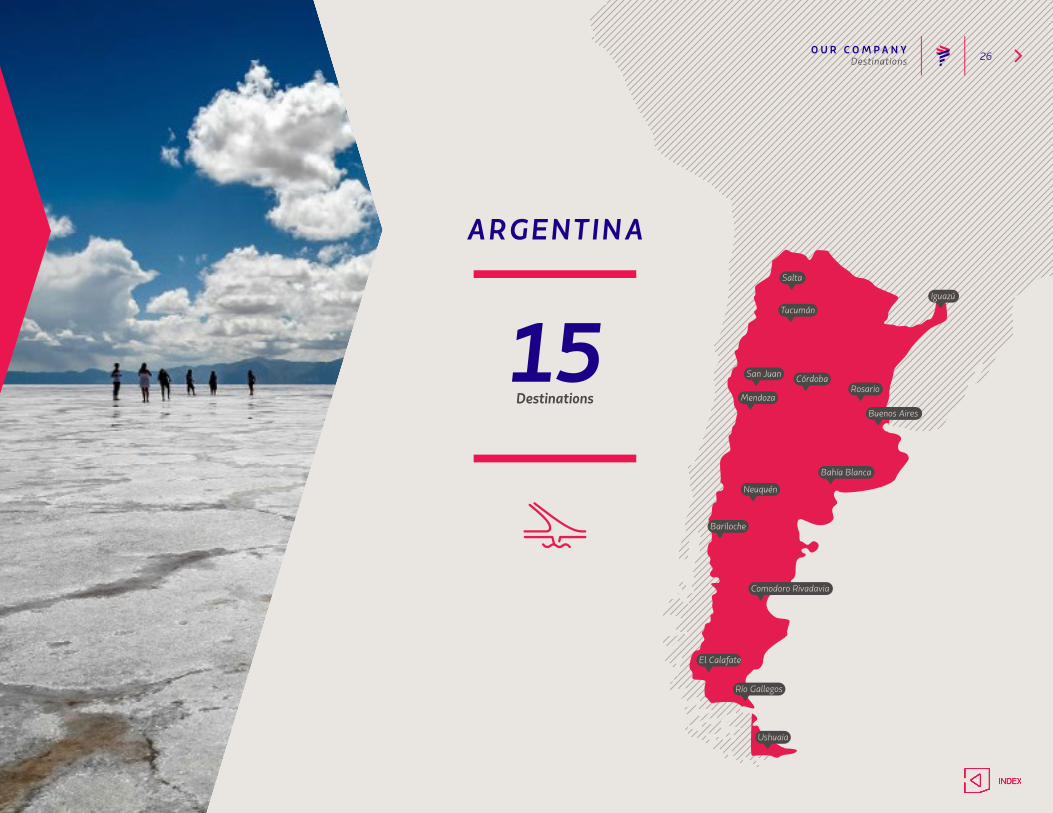
ARGENTINA
Destinations15
Bahía Blanca
Río Gallegos
El Calafate
San Juan
Buenos Aires
Salta
Mendoza
Córdoba
Bariloche
Rosario
Iguazú
Ushuaia
Comodoro Rivadavia
Tucumán
Neuquén
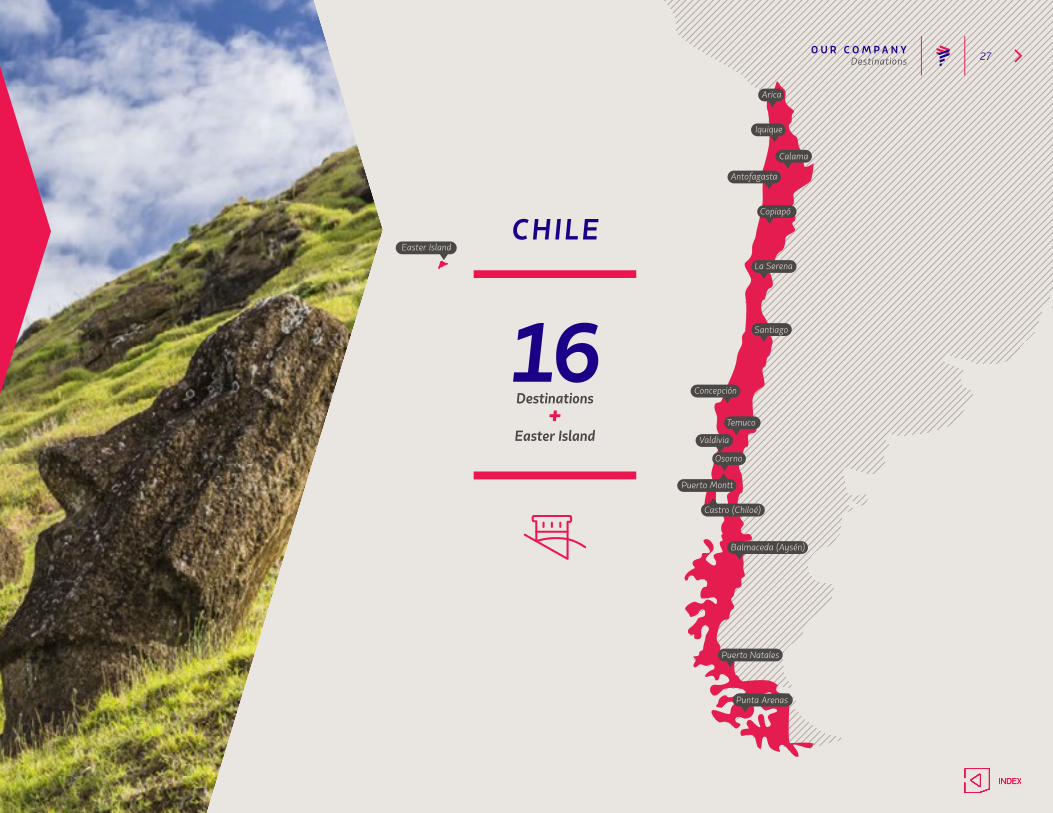
O U R C O M P A N Y 27Destinations
CHILE
Destinations +
Easter Island
16
Iquique
Arica
Castro (Chiloé)
Santiago
Punta Arenas
Valdivia
Puerto Montt
Antofagasta
Calama
Copiapó
La Serena
Concepción
Temuco
Osorno
Balmaceda (Aysén)
Puerto Natales
Easter Island
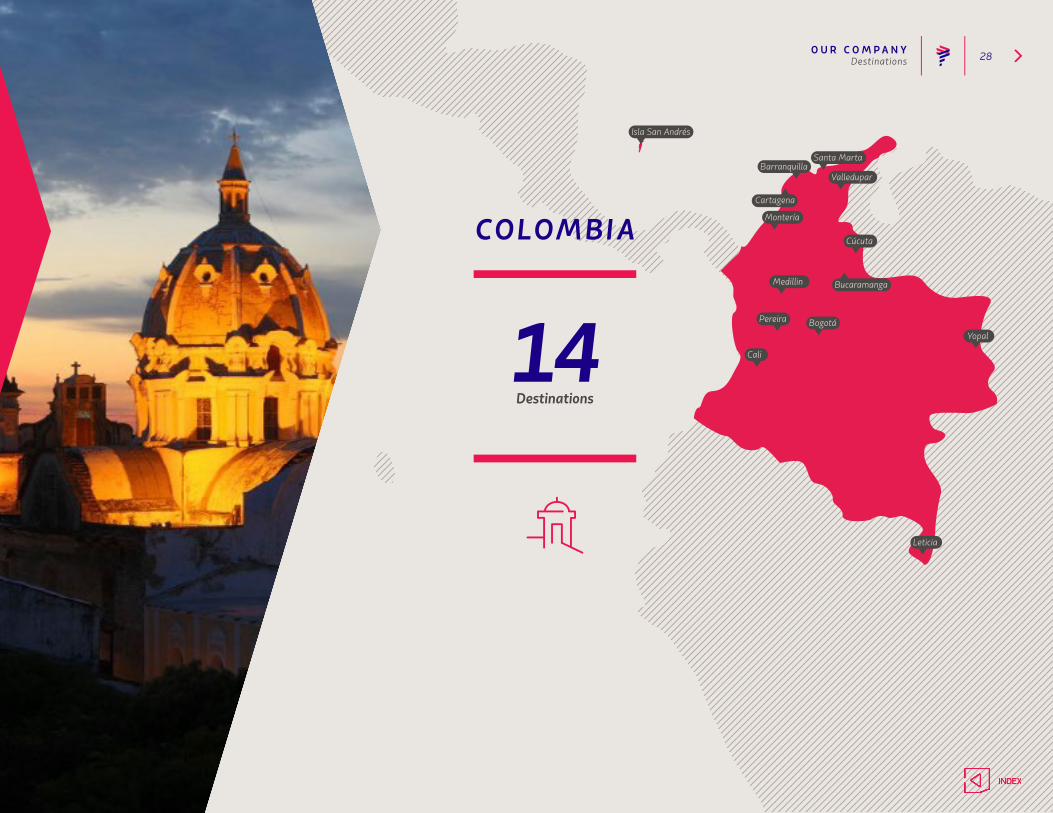
O U R C O M P A N Y 28Destinations
COLOM BIA
Destinations14
Barranquilla
Leticia
Bucaramanga
Montería
Cúcuta
Isla San Andrés
Bogotá
Medillin
Cartagena
Santa Marta
Cali
Pereira
Yopal
Valledupar

O U R C O M P A N Y 29Destinations
ECUADOR
Destinations5
Cuenca
Galápagos San Cristóbal
Galápagos Baltra Quito
Guayaquil
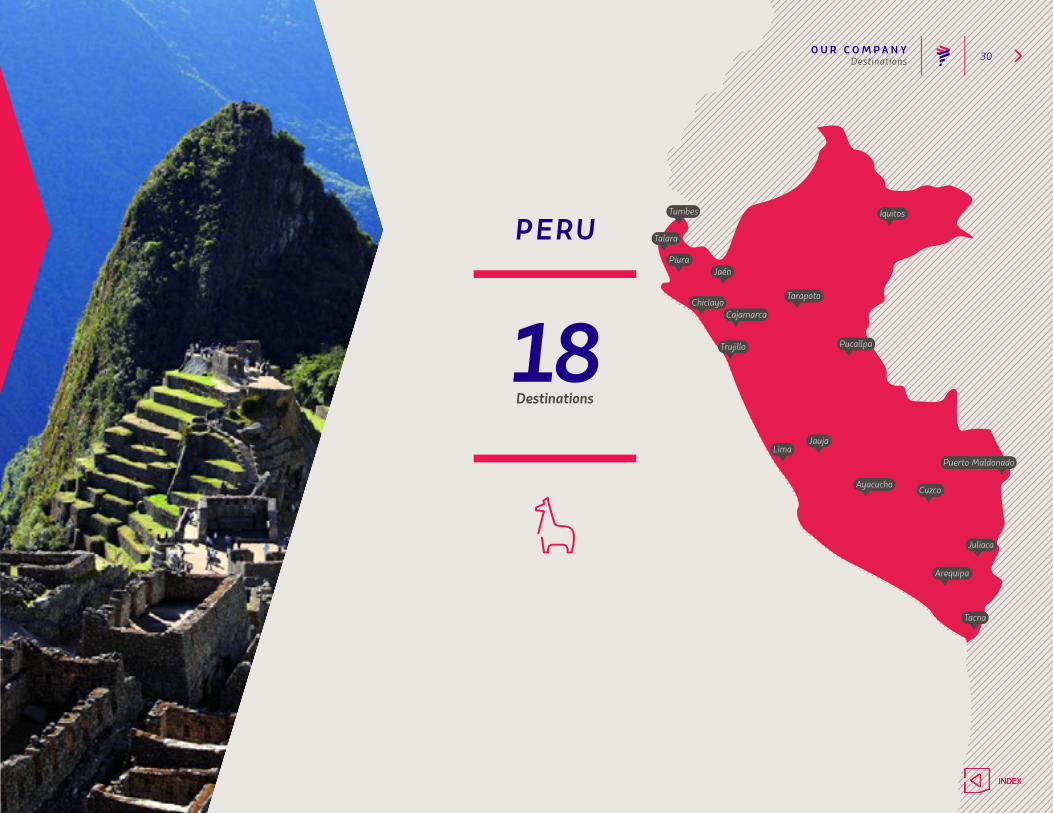
O U R C O M P A N Y 30Destinations
PERU
Destinations18
Arequipa
Cuzco
Iquitos
Trujillo
Talara
Juliaca
Tarapoto
Tumbes
Jaén
Jauja
Tacna
Pucallpa
Chiclayo
Ayacucho
Piura
Lima
Cajamarca
Puerto Maldonado
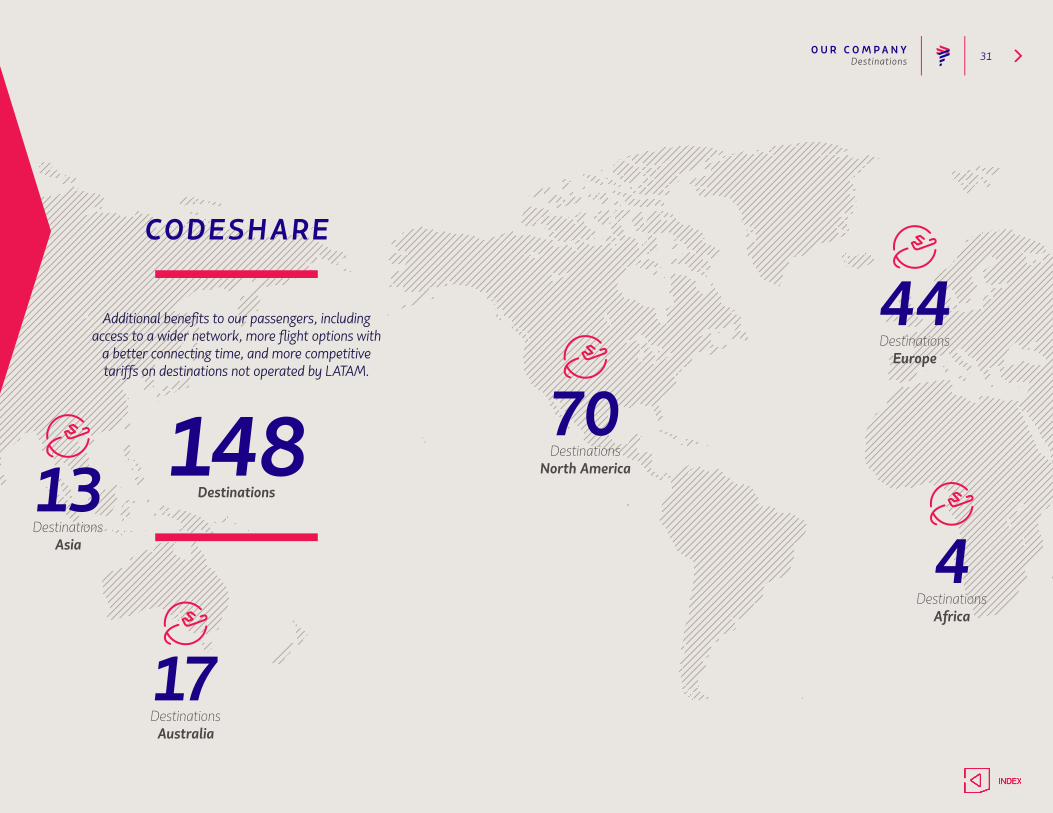
O U R C O M P A N Y 31Destinations
CODESHARE
DestinationsNorth America
DestinationsEurope
Destinations Africa
Destinations Asia
DestinationsAustralia
70
44
413
17
Additional benefits to our passengers, including access to a wider network, more flight options with
a better connecting time, and more competitive tariffs on destinations not operated by LATAM.
Destinations148

O U R C O M P A N Y 32Destinations
CARGO
Destinations*
*cargo exclusive
7We are the largest cargo operator of
the region.
Caracas
Amsterdam
Basel
Cabo Frío
Guatemala City
San Jose
Guadalajara

O U R C O M P A N Y 33Our People
L ATAM is a group of airlines that stands out for the cultural plurality of its human teams. At the end of 2017, its staff comprised over 43 thousand employees—from
64 different nationalities—across 23 countries.
Within the framework of the transformation plan that the Group is carrying out in all its areas in order to position itself as a profitable airline group and gain customers’ preference, 2017 was a milestone in the consolidation of Project Twist, the most relevant initiative regarding people, as it implies a new way of conceiving service rendering.
We build a unique traveling experience by connecting with our customers.
OVERALLEmployees by function
Operations 15,126 35%
Cabin Crew 9,016 21%
Administration 6,922 16%
Maintenance 4,742 11%
Control Crew 3,957 9%
Sales 3,332 8%
Total 43,095 100%
Gross Salary by gender (male/female ratio)
Role
General Role 0.98
Medium Level 1.04
Executive Level 1.40
Our
O U R C O M P A N Y 34Our People
Its main goal is to generate an emotional connection between the Company’s collaborators and its customers, in order to achieve greater passenger loyalty. The method is to adapt the work that the human teams do to the industry’s evolution, customer empowerment, and the size that LATAM Group has achieved, providing them with greater autonomy to answer to clients’ various needs in the different places where it operates, and giving them the ability to bend the service to these realities.
This cultural transformation managed to reach over 140 locations throughout 2017, covering over 20 thousand employees distributed among 130 airports, nine Contact Centers (including internal and outsourced), 7,500 crew members, and 1,800 in-flight service, in addition to participating in the Hub Control Center (HCC) of the main airports—the first population without direct customer contact that the process has included.
In this period, LATAM’s Unique Leadership Model was also launched, conceived as a basic guideline for leading within the Company, which showcases the practices that must be adopted in directing teams, in the understanding that it is they who bring LATAM’s culture to life and get every dream to its destination. The goal is to carry out excellently the daily operations and large projects, and to develop the human teams with a common view, which is to become one of the most admired airlines in the world.
BY IMPLEMENTING THIS LEADERSHIP MODEL, THE GROUP SEEKS TO FOSTER A UNIQUE CULTURE THAT WILL RESPECT INDIVIDUALITY AND EACH OF
ITS LEADERS’ OWN STYLE IN APPLYING IT.
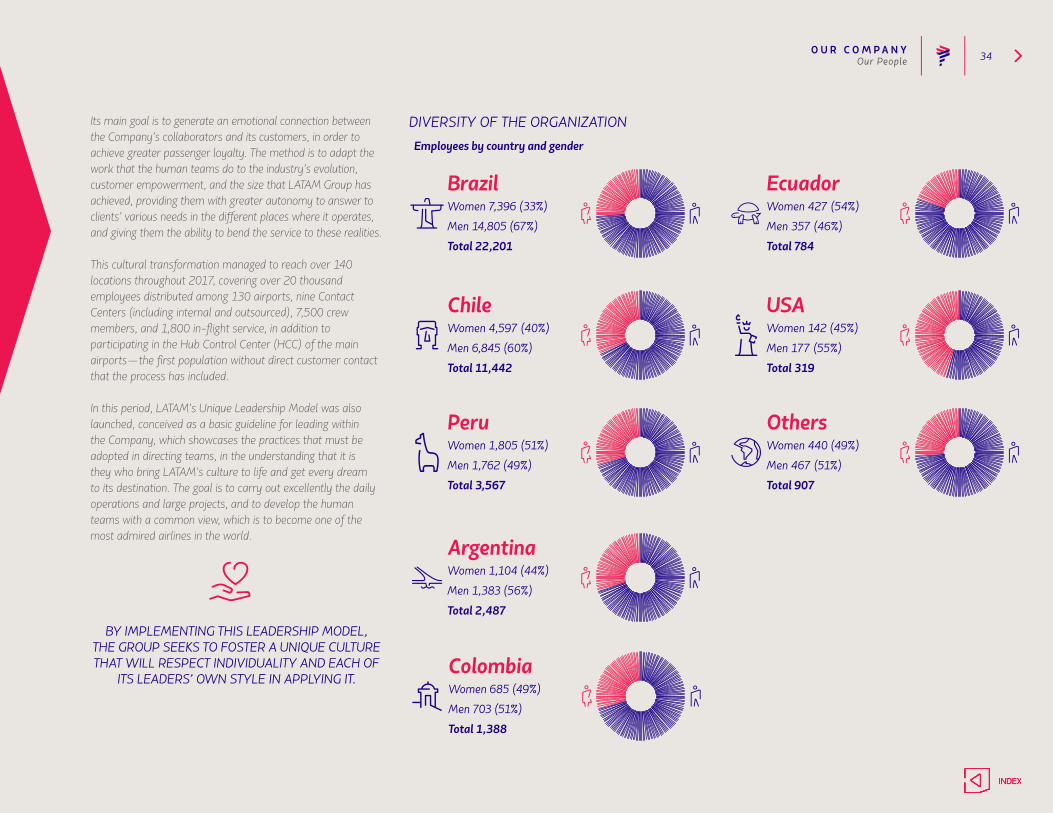
DIVERSITY OF THE ORGANIZATIONEmployees by country and gender
BrazilWomen 7,396 (33%)Men 14,805 (67%)Total 22,201
EcuadorWomen 427 (54%)Men 357 (46%)Total 784
ChileWomen 4,597 (40%)Men 6,845 (60%)Total 11,442
USAWomen 142 (45%)Men 177 (55%)Total 319
PeruWomen 1,805 (51%)Men 1,762 (49%)Total 3,567
OthersWomen 440 (49%)Men 467 (51%)Total 907
ArgentinaWomen 1,104 (44%)Men 1,383 (56%)Total 2,487
ColombiaWomen 685 (49%)Men 703 (51%)Total 1,388
O U R C O M P A N Y 35Our People
In order to move towards an ever more efficient system and to continue to render a quality service, LATAM Group’s Human Resources team launched an online customer service platform known as “RH Connect”, which consolidates within a single site all the information of the department’s processes and services. Through this channel, the Group’s workers can now access information regarding compensation, medical leave, team management, benefits, insurance, agreements, vacation time, processes, tools, and much more, in a quick, simple, and direct manner of their respective employers.
Likewise, in the period, there was significant progress in the LATAM Acknowledgement program started in 2016, destined to reward those who best embody the Group’s guidelines of conduct in the “Security”, “Service”, and “Efficiency” categories. Through this initiative, the to recognize those who embody LATAM’s spirit of service, beyond the position they hold, or the department they work in.
IN 2017, ROUGHLY 53 THOUSAND ACKNOWLEDGMENTS WERE AWARDED BY
LATAM AFFILIATES, 3,154 OF WHICH WERE FOR “SECURITY”, 22,387 FOR “SERVICE”, AND 27,410
FOR “EFFICIENCY”.
On the other hand, in this period, 43 thousand workers were trained, most of who were people in the operations department or crew members. This is in line with the project to transform the business model, which the Group implemented and, among other aspects, changed the way in which airfare tickets are sold (charging for the various features, such as checked baggage), based on each customer’s needs.
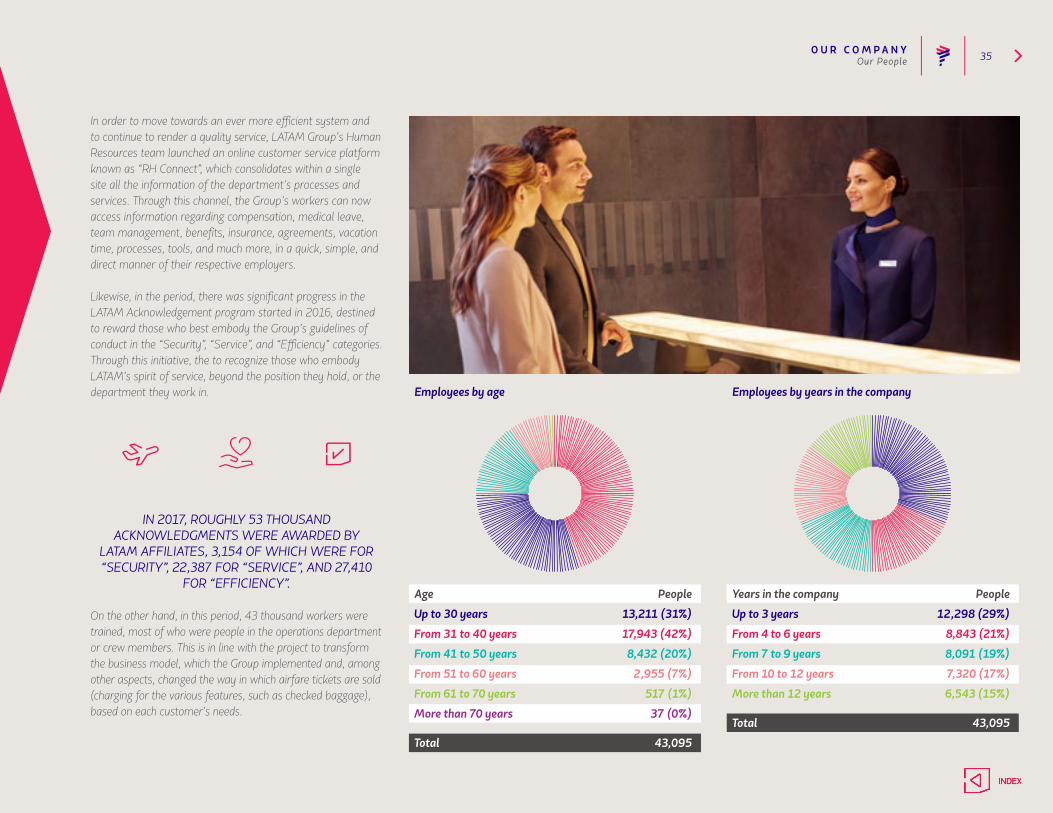
Employees by age Employees by years in the company
Age People
Up to 30 years 13,211 (31%)
From 31 to 40 years 17,943 (42%)
From 41 to 50 years 8,432 (20%)
From 51 to 60 years 2,955 (7%)
From 61 to 70 years 517 (1%)
More than 70 years 37 (0%)
Total 43,095
Years in the company People
Up to 3 years 12,298 (29%)
From 4 to 6 years 8,843 (21%)
From 7 to 9 years 8,091 (19%)
From 10 to 12 years 7,320 (17%)
More than 12 years 6,543 (15%)
Total 43,095
O U R C O M P A N Y 36Our People
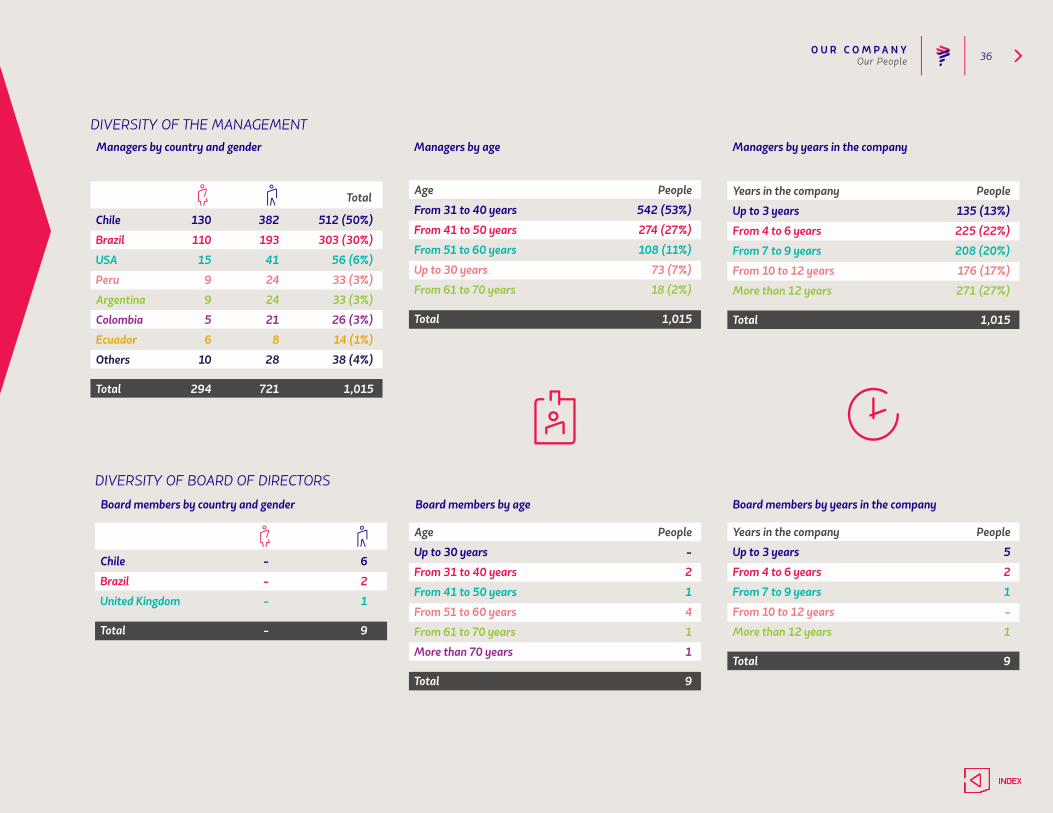
DIVERSITY OF THE MANAGEMENTManagers by country and gender
Chile 130 382 512 (50%)
Brazil 110 193 303 (30%)
USA 15 41 56 (6%)
Peru 9 24 33 (3%)
Argentina 9 24 33 (3%)
Colombia 5 21 26 (3%)
Ecuador 6 8 14 (1%)
Others 10 28 38 (4%)
Total 294 721 1,015
Total
Managers by age
Age People
From 31 to 40 years 542 (53%)
From 41 to 50 years 274 (27%)
From 51 to 60 years 108 (11%)
Up to 30 years 73 (7%)
From 61 to 70 years 18 (2%)
Total 1,015
Managers by years in the company
Years in the company People
Up to 3 years 135 (13%)
From 4 to 6 years 225 (22%)
From 7 to 9 years 208 (20%)
From 10 to 12 years 176 (17%)
More than 12 years 271 (27%)
Total 1,015
DIVERSITY OF BOARD OF DIRECTORSBoard members by country and gender
Chile - 6
Brazil - 2
United Kingdom - 1
Total - 9
Board members by years in the company
Years in the company People
Up to 3 years 5
From 4 to 6 years 2
From 7 to 9 years 1
From 10 to 12 years -
More than 12 years 1
Total 9
Board members by age
Age People
Up to 30 years -
From 31 to 40 years 2
From 41 to 50 years 1
From 51 to 60 years 4
From 61 to 70 years 1
More than 70 years 1
Total 9
O U R C O M P A N Y 37
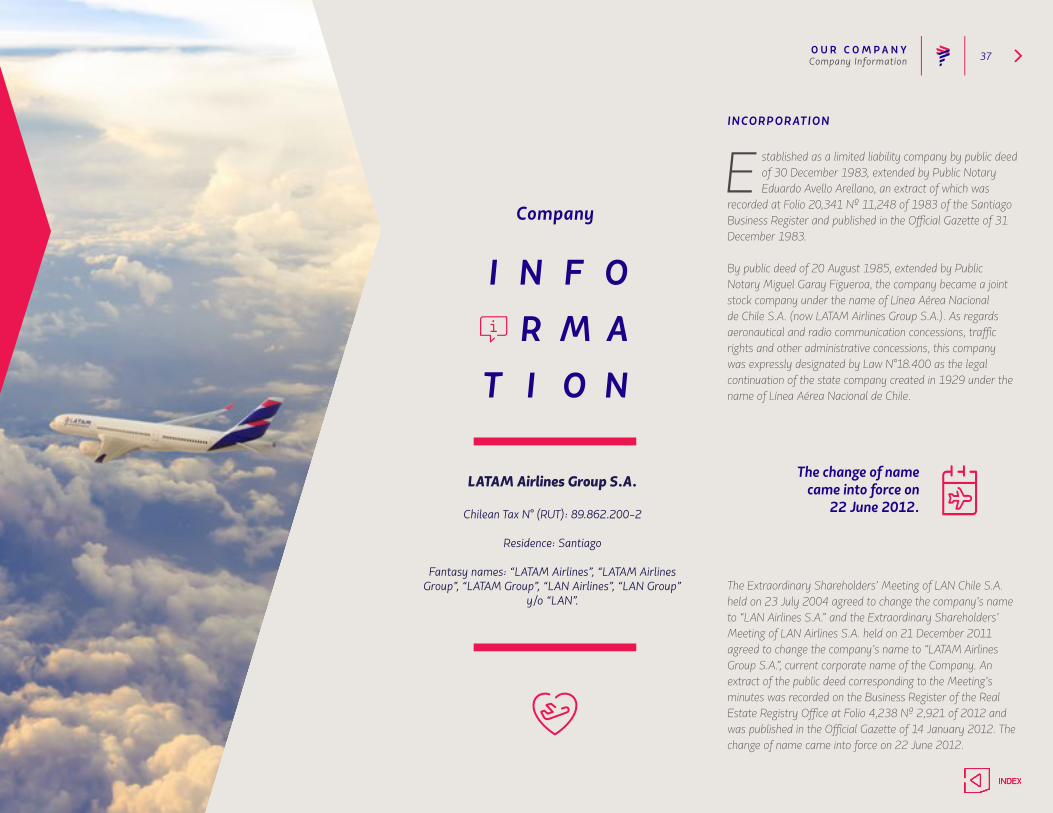
INCORPORATION
E stablished as a limited liability company by public deed of 30 December 1983, extended by Public Notary Eduardo Avello Arellano, an extract of which was
recorded at Folio 20,341 Nº 11,248 of 1983 of the Santiago Business Register and published in the Official Gazette of 31 December 1983.
By public deed of 20 August 1985, extended by Public Notary Miguel Garay Figueroa, the company became a joint stock company under the name of Línea Aérea Nacional de Chile S.A. (now LATAM Airlines Group S.A.). As regards aeronautical and radio communication concessions, traffic rights and other administrative concessions, this company was expressly designated by Law N°18.400 as the legal continuation of the state company created in 1929 under the name of Línea Aérea Nacional de Chile.
Company
LATAM Airlines Group S.A.
Chilean Tax N° (RUT): 89.862.200-2
Residence: Santiago
Fantasy names: “LATAM Airlines”, “LATAM Airlines Group”, “LATAM Group”, “LAN Airlines”, “LAN Group”
y/o “LAN”.
Company Information
The change of namecame into force on
22 June 2012.
The Extraordinary Shareholders’ Meeting of LAN Chile S.A. held on 23 July 2004 agreed to change the company’s name to “LAN Airlines S.A.” and the Extraordinary Shareholders’ Meeting of LAN Airlines S.A. held on 21 December 2011 agreed to change the company’s name to “LATAM Airlines Group S.A.”, current corporate name of the Company. An extract of the public deed corresponding to the Meeting’s minutes was recorded on the Business Register of the Real Estate Registry Office at Folio 4,238 Nº 2,921 of 2012 and was published in the Official Gazette of 14 January 2012. The change of name came into force on 22 June 2012.
O U R C O M P A N Y 38
THE CORPORATE PURPOSE IS:
a) The commerce of air and / or land transport in any of its forms, whether of passengers, cargo, mail and everything that has direct or indirect relation with said activity, inside and outside the country, for own account or others; b) The provision of services related to the maintenance and repair of aircraft, own or third parties; c) The development and exploitation of other activities derived from the corporate purpose and / or related, related, auxiliary or complementary to it; d) The commerce and development of activities related to travel, tourism and hotels; and e) Participation in societies of any type or kind that allow society to fulfill its purposes.
Company Information
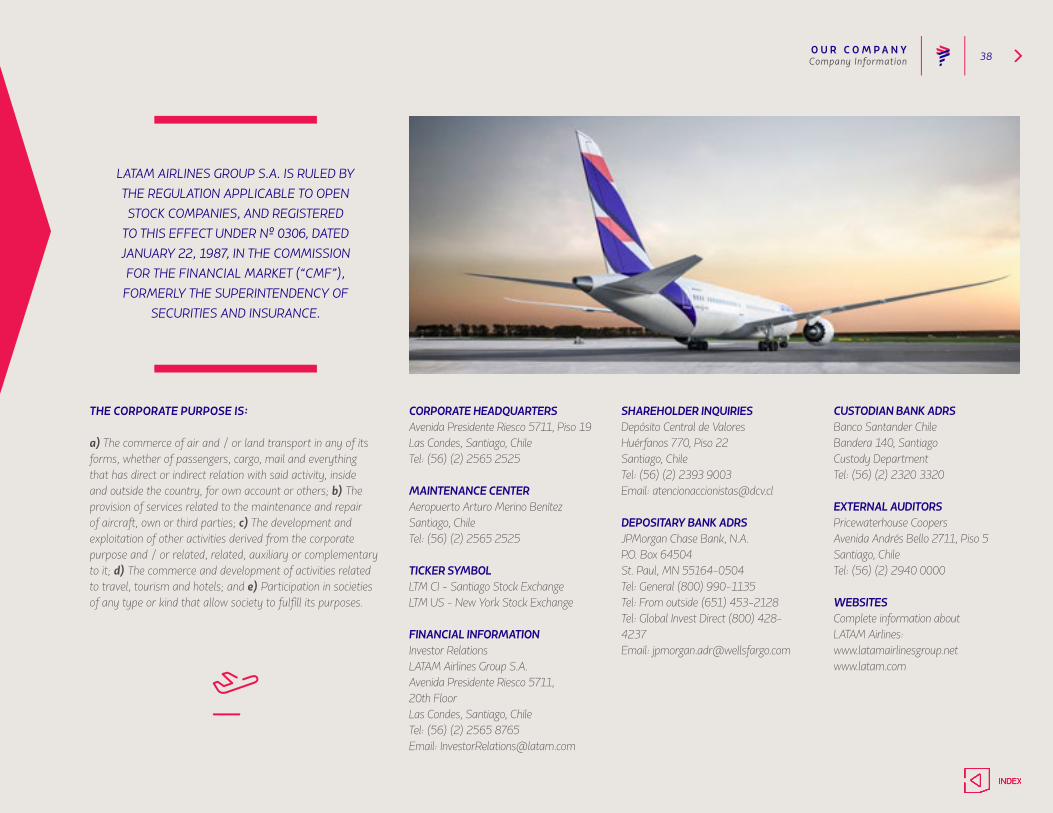
LATAM AIRLINES GROUP S.A. IS RULED BY THE REGULATION APPLICABLE TO OPEN STOCK COMPANIES, AND REGISTERED
TO THIS EFFECT UNDER Nº 0306, DATED JANUARY 22, 1987, IN THE COMMISSION FOR THE FINANCIAL MARKET (“CMF”),
FORMERLY THE SUPERINTENDENCY OF SECURITIES AND INSURANCE.
CORPORATE HEADQUARTERSAvenida Presidente Riesco 5711, Piso 19Las Condes, Santiago, ChileTel: (56) (2) 2565 2525
MAINTENANCE CENTERAeropuerto Arturo Merino BenítezSantiago, ChileTel: (56) (2) 2565 2525
TICKER SYMBOLLTM CI - Santiago Stock ExchangeLTM US - New York Stock Exchange
FINANCIAL INFORMATIONInvestor RelationsLATAM Airlines Group S.A.Avenida Presidente Riesco 5711,20th FloorLas Condes, Santiago, ChileTel: (56) (2) 2565 8765Email: [email protected]
SHAREHOLDER INQUIRIESDepósito Central de ValoresHuérfanos 770, Piso 22Santiago, ChileTel: (56) (2) 2393 9003Email: [email protected]
DEPOSITARY BANK ADRSJPMorgan Chase Bank, N.A.P.O. Box 64504St. Paul, MN 55164-0504Tel: General (800) 990-1135Tel: From outside (651) 453-2128Tel: Global Invest Direct (800) 428-4237Email: [email protected]
CUSTODIAN BANK ADRSBanco Santander ChileBandera 140, SantiagoCustody DepartmentTel: (56) (2) 2320 3320
EXTERNAL AUDITORSPricewaterhouse CoopersAvenida Andrés Bello 2711, Piso 5Santiago, ChileTel: (56) (2) 2940 0000
WEBSITESComplete information aboutLATAM Airlines:www.latamairlinesgroup.netwww.latam.com

Our leaders are committed to improving their teams, so we can be one of the most admired airlines group in the world.
CO R P O RAT E
G O V E R -
N A N C E

C O R P O R AT E G O V E R N A N C E 40Board members
The Board of Directors was electedin the Shareholder’s Meeting of April 27,2017
for a two-year period.
IGNACIO CUETO PLAZA
ChairmanRUT: 7.040.324-2
M r. Ignacio Cueto Plaza joined LATAM’s Board of Directors in April 2017. His career in the airline industry
extends over 30 years. In 1985, Mr. Cueto assumed the position of Vice President of Sales at Fast Air Carrier, a national cargo company of that time.
He led the commercial and service area of the company in the North American market. Mr. Cueto later served on the Board of Directors of Ladeco (from 1994 to 1997) and LAN (from 1995 to 1997), and served as President of LAN Cargo from 1995 to 1998. He served as Chief Executive Officer of Passenger Business from 1999 to 2005, and in 2005 as President and Chief Operating Officer of LAN until the merger with TAM was finalized. Mr. Cueto later served as LAN’s CEO until April 2017. Mr. Cueto also led the establishment of the different affiliates that the company has in South America (Peru, Argentina, Ecuador, and Colombia), as well as the implementation of key alliances with other airlines. Mr. Cueto is part of the Cueto Group, the group of controlling shareholders.
Board

C O R P O R AT E G O V E R N A N C E 41
DirectorRUT: 48.175.668-5
M r. Henri Philippe Reichstul was re-elected to the Board of Directors of LATAM in April 2017. Mr. Reichstul has
served as President of Petrobras and the IPEA-Institute for Economic and Social Planning, and Executive Vice President of Banco Inter American Express S.A. Currently, in addition to being an administrative council member of TAM and LATAM group, he is also a member of the Board of Directors of Peugeot Citroen and chairman of Fives, among others.
Mr. Reichstul is an economist with an undergraduate degree from the Faculty of Economics and Administration, University of São Paulo, and postgraduate work degrees in the same discipline - Hertford College - Oxford University.
DirectorRUT: 6.694.240-6
M r. Juan José Cueto Plaza has served on LAN’s Board of Directors since 1994 and was re-elected to the board
of directors of LATAM in April 2017. Mr. Cueto is the Executive Vice President of Inversiones Costa Verde S.A., a position that he has held since 1990, and also serves on the boards of Consorcio Maderero S.A., Inversiones del Buen Retiro S.A., Costa Verde Aeronáutica S.A., Sinergía Inmobiliaria S.A., Valle Escondido S.A., and Fundación Colunga.
HENRI PHILIPPE REICHSTUL
JUAN JOSÉ CUETO PLAZA
Vice-ChairmanRUT: 8.717.000-4
M r. Carlos Heller Solari, entrepreneur, joined the board of LAN in May 2010 and was re-elected to the
Board of Directors of LATAM in April 2017. Mr. Heller has extensive experience in the sectors of retail, communications, transportation, and agriculture. He is the Chairman of Bethia Group, which in turn owns Axxion S.A. and Betlán Dos S.A., companies with significant shares in LATAM Airlines.
Additionally, he is also the Chairman of Red Televisiva Megavision S.A., Club Hipico de Santiago, Falabella Retail S.A., Sotraser S.A., and Blue Express S.A. Mr. Heller is the major shareholder and Chairman of Azul Azul S.A. which administrates the Corporación de Fútbol Profesional from the Universidad de Chile.
CARLOS HELLER SOLARI
Board members
C O R P O R AT E G O V E R N A N C E 42
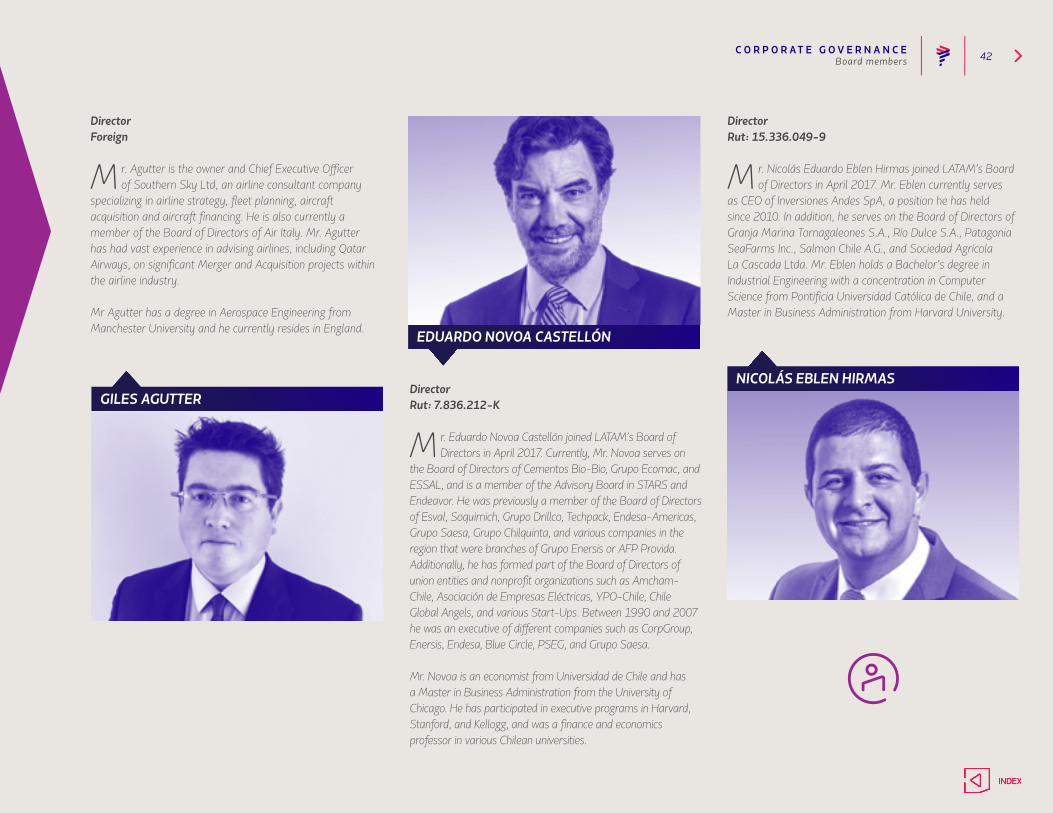
DirectorRut: 15.336.049-9
M r. Nicolás Eduardo Eblen Hirmas joined LATAM’s Board of Directors in April 2017. Mr. Eblen currently serves
as CEO of Inversiones Andes SpA, a position he has held since 2010. In addition, he serves on the Board of Directors of Granja Marina Tornagaleones S.A., Río Dulce S.A., Patagonia SeaFarms Inc., Salmon Chile A.G., and Sociedad Agrícola La Cascada Ltda. Mr. Eblen holds a Bachelor’s degree in Industrial Engineering with a concentration in Computer Science from Pontificia Universidad Católica de Chile, and a Master in Business Administration from Harvard University.
DirectorForeign
M r. Agutter is the owner and Chief Executive Officer of Southern Sky Ltd, an airline consultant company
specializing in airline strategy, fleet planning, aircraft acquisition and aircraft financing. He is also currently a member of the Board of Directors of Air Italy. Mr. Agutter has had vast experience in advising airlines, including Qatar Airways, on significant Merger and Acquisition projects within the airline industry.
Mr Agutter has a degree in Aerospace Engineering from Manchester University and he currently resides in England.
NICOLÁS EBLEN HIRMASGILES AGUTTER
DirectorRut: 7.836.212-K
M r. Eduardo Novoa Castellón joined LATAM’s Board of Directors in April 2017. Currently, Mr. Novoa serves on
the Board of Directors of Cementos Bio-Bio, Grupo Ecomac, and ESSAL, and is a member of the Advisory Board in STARS and Endeavor. He was previously a member of the Board of Directors of Esval, Soquimich, Grupo Drillco, Techpack, Endesa-Americas, Grupo Saesa, Grupo Chilquinta, and various companies in the region that were branches of Grupo Enersis or AFP Provida. Additionally, he has formed part of the Board of Directors of union entities and nonprofit organizations such as Amcham-Chile, Asociación de Empresas Eléctricas, YPO-Chile, Chile Global Angels, and various Start-Ups. Between 1990 and 2007 he was an executive of different companies such as CorpGroup, Enersis, Endesa, Blue Circle, PSEG, and Grupo Saesa.
Mr. Novoa is an economist from Universidad de Chile and has a Master in Business Administration from the University of Chicago. He has participated in executive programs in Harvard, Stanford, and Kellogg, and was a finance and economics professor in various Chilean universities.
EDUARDO NOVOA CASTELLÓN
Board members
C O R P O R AT E G O V E R N A N C E 43
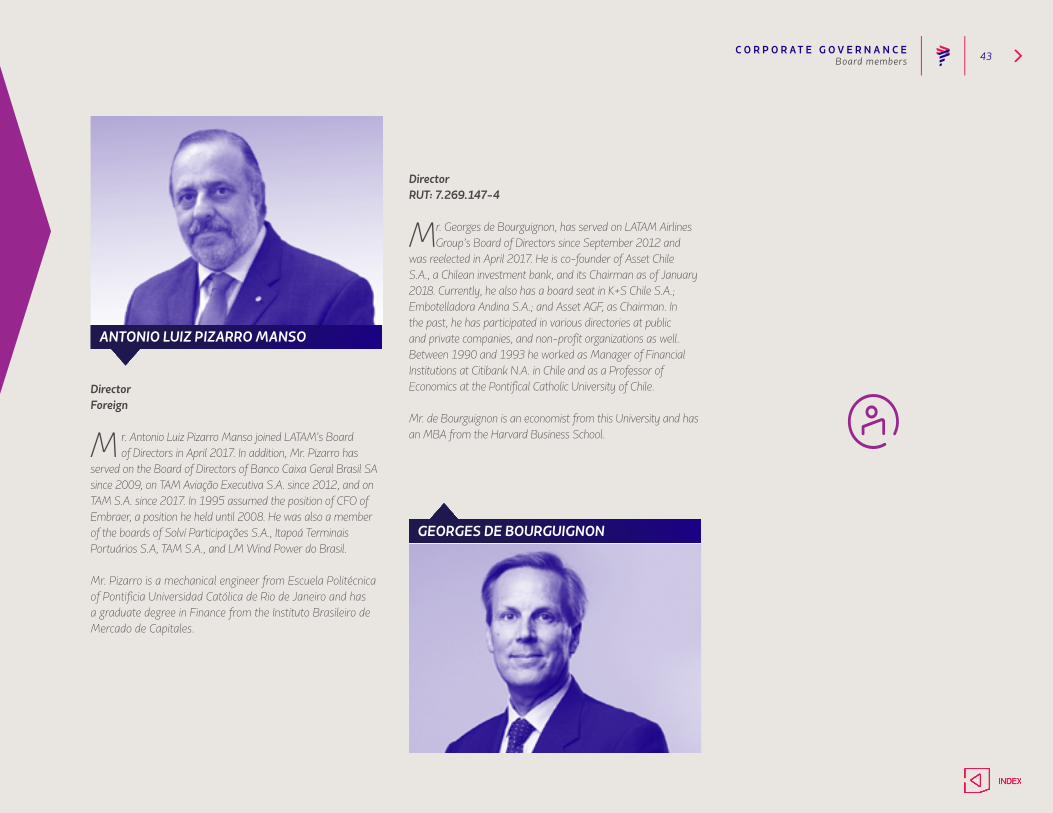
DirectorForeign
M r. Antonio Luiz Pizarro Manso joined LATAM’s Board of Directors in April 2017. In addition, Mr. Pizarro has
served on the Board of Directors of Banco Caixa Geral Brasil SA since 2009, on TAM Aviação Executiva S.A. since 2012, and on TAM S.A. since 2017. In 1995 assumed the position of CFO of Embraer, a position he held until 2008. He was also a member of the boards of Solví Participações S.A., Itapoá Terminais Portuários S.A, TAM S.A., and LM Wind Power do Brasil.
Mr. Pizarro is a mechanical engineer from Escuela Politécnica of Pontificia Universidad Católica de Rio de Janeiro and has a graduate degree in Finance from the Instituto Brasileiro de Mercado de Capitales.
DirectorRUT: 7.269.147-4
Mr. Georges de Bourguignon, has served on LATAM Airlines Group’s Board of Directors since September 2012 and
was reelected in April 2017. He is co-founder of Asset Chile S.A., a Chilean investment bank, and its Chairman as of January 2018. Currently, he also has a board seat in K+S Chile S.A.; Embotelladora Andina S.A.; and Asset AGF, as Chairman. In the past, he has participated in various directories at public and private companies, and non-profit organizations as well. Between 1990 and 1993 he worked as Manager of Financial Institutions at Citibank N.A. in Chile and as a Professor of Economics at the Pontifical Catholic University of Chile.
Mr. de Bourguignon is an economist from this University and has an MBA from the Harvard Business School.
ANTONIO LUIZ PIZARRO MANSO
GEORGES DE BOURGUIGNON
Board members
C O R P O R AT E G O V E R N A N C E 44Executives
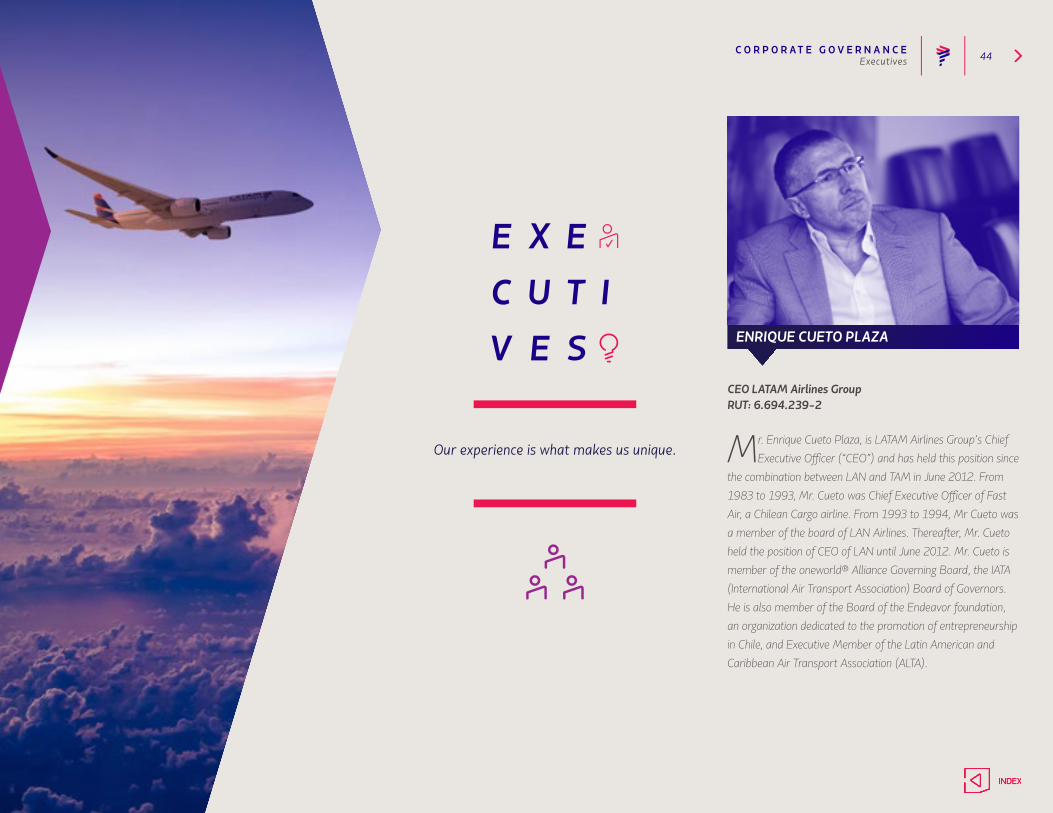
Our experience is what makes us unique.
CEO LATAM Airlines GroupRUT: 6.694.239-2
Mr. Enrique Cueto Plaza, is LATAM Airlines Group’s Chief Executive Officer (“CEO”) and has held this position since
the combination between LAN and TAM in June 2012. From 1983 to 1993, Mr. Cueto was Chief Executive Officer of Fast Air, a Chilean Cargo airline. From 1993 to 1994, Mr Cueto was a member of the board of LAN Airlines. Thereafter, Mr. Cueto held the position of CEO of LAN until June 2012. Mr. Cueto is member of the oneworld® Alliance Governing Board, the IATA (International Air Transport Association) Board of Governors. He is also member of the Board of the Endeavor foundation, an organization dedicated to the promotion of entrepreneurship in Chile, and Executive Member of the Latin American and Caribbean Air Transport Association (ALTA).
ENRIQUE CUETO PLAZA

C O R P O R AT E G O V E R N A N C E 45
Senior Vice-President of CommercialRUT: 8.823.367-0
M r. Roberto Alvo Milosawlewitsch has been the Commercial Senior Vice-President of LATAM since
May 2017, being responsible of the Group’s passenger and cargo revenue management, with all the commercial units reporting to him. Previously, he was Senior Vice-President of International and Alliances at LATAM Airlines since 2015, and Vice-President of Strategic Planning and Development since 2008. Mr Alvo joined LAN Airlines in November 2001, where he served as Chief Financial Officer of LAN Argentin, as Manager of Development and Financial Planning at LAN Airlines, and as Deputy Chief Financial Officer of LAN Airlines. Before 2001, Mr. Alvo held various positions at SociedadQuímica y Minera de Chile S.A., a leading Chilean non-metallic mining company. He is a civil engineer, and MBA from IMD in Lausanne, Switzerland.
Vice President Senior FinancialFleetRut: 22.357.225-1
M r. Ramiro Alfonsín, is LATAM’s Chief Financial Officer (“CFO”), a position he holds since July 2016. Over the
past 16 years, before joining LATAM, he worked for Endesa, a leading utility company, in Spain, Italy and Chile, having served as Deputy Chief Executive Officer and Chief Financial Officer for their Latin American operations. Before joining the utility sector, he worked for 5 years in Corporate and Investment Banking in large European banks. Mr. Alfonsín holds a degree in business administration from Pontificia Universidad Católica de Argentina. ROBERTO ALVO
RAMIRO ALFONSÍN
Executives
Senior Vice-President of CustomersForeign
M rs. Claudia Sender, is the Vice-President of Customers LATAM. Previously, she served as TAM Airlines’
President since May 2013. Mrs. Sender joined the company in December 2011, as Commercial and Marketing Vice-President. After June 2012, with the conclusion of TAM-LAN combination and the creation of LATAM Airlines Group, she became the head of Brazil’s Domestic Business Unit, and her functions were expanded in order to include TAM’s entire Customer Service structure. Prior to joining LATAM Airlines, she was Marketing Vice-President at Whirlpool Latin America for seven years. She also worked as a consultant at Bain & Company, developing projects for large companies in various industries, including TAM Airlines and other players of the global aviation sector. She has a bachelor’s degree in Chemical Engineering from the Polytechnic School at the University of São Paulo (“USP”) and an MBA from Harvard Business School.
CLAUDIA SENDER

C O R P O R AT E G O V E R N A N C E 46
Senior Vice-President of Human ResourcesRUT: 9.908.112-0
M r. Emilio del Real Sota, is LATAM’s Senior Vice-President of Human Resources, a position he
assumed in August 2005. Between 2003 and 2005, Mr. del Real was the Human Resources Manager of D&S, a Chilean retail company. Between 1997 and 2003 Mr. del Real served in various positions in Unilever, including Human Resources Manager of Unilever Chile, and Manager of Training and Recruitment and Management Development for Latin America. Mr. del Real has a Psychology degree from Universidad Gabriela Mistral.
Senior Vice-President of Operations,Maintenance and FleetRut: 21.828.810-3
M r. Hernan Pasman has been the Senior Vice-President of Operations, Maintenance and Fleet of LATAM
airlines group since October, 2015. He joined LAN Airlines in 2005 as a head of strategic planning and financial analysis of the technical areas. Between 2007 and 2010, Mr. Pasman was the Chief operating officer of LAN Argentina, then, in 2011 he served as Chief Executive Officer for LAN Colombia. Prior to joining the company, between 2001 and 2005, Mr. Pasman was a consultant at McKinsey & Company in Chicago. Between 1995 and 2001, Hernan held positions at Citicorp Equity Investments, Telephonic de Argentina and Argentina Motorola. Mr. Pasman is a Civil engineer from ITBA (1995) and an MBA from Kellogg Graduate School of Management (2001).
EMILIO DEL REAL
HERNÁN PASMAN
Executives
Senior Vice President of Legal AffairsRUT: 24.725.433-1
M r. Juan Carlos Mencio is Senior Vice President of Legal Affairs and Compliance for LATAM Airlines Group
since September 1, 2014. Mr. Mencio had previously held the position of General Counsel for North America for LATAM Airlines Group and its related companies, as well as General Counsel for its worldwide Cargo Operations, both since 1998. Prior to joining LAN, he was in private practice in New York and Florida representing various international airlines. Mr. Mencio obtained his Bachelor’s Degree in International Finance and Marketing from the School of Business at the University of Miami and his Juris Doctor Degree from Loyola University.
JUAN CARLOS MENCIÓ
C O R P O R AT E G O V E R N A N C E 47Year 2017
2017
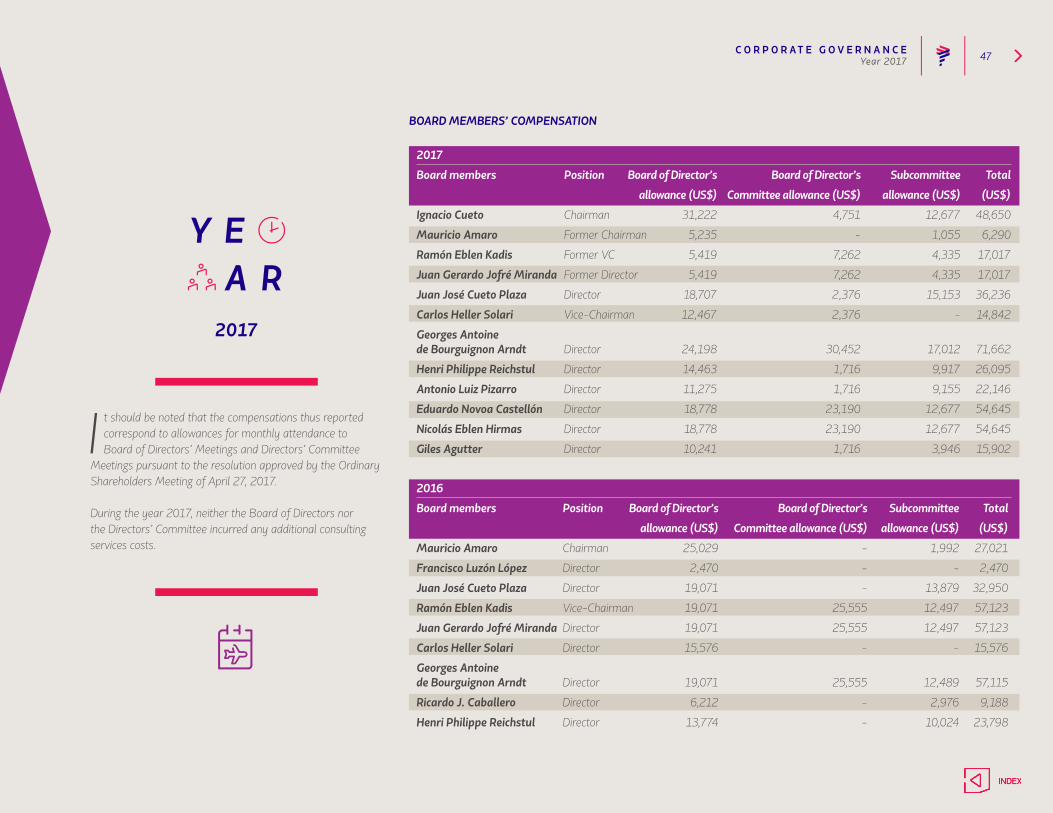
I t should be noted that the compensations thus reported correspond to allowances for monthly attendance to Board of Directors’ Meetings and Directors’ Committee
Meetings pursuant to the resolution approved by the Ordinary Shareholders Meeting of April 27, 2017.
During the year 2017, neither the Board of Directors nor the Directors’ Committee incurred any additional consulting services costs.
BOARD MEMBERS’ COMPENSATION
2017
Board members Position Board of Director’s Board of Director’s Subcommittee Total
allowance (US$) Committee allowance (US$) allowance (US$) (US$)
Ignacio Cueto Chairman 31,222 4,751 12,677 48,650
Mauricio Amaro Former Chairman 5,235 - 1,055 6,290
Ramón Eblen Kadis Former VC 5,419 7,262 4,335 17,017
Juan Gerardo Jofré Miranda Former Director 5,419 7,262 4,335 17,017
Juan José Cueto Plaza Director 18,707 2,376 15,153 36,236
Carlos Heller Solari Vice-Chairman 12,467 2,376 - 14,842
Georges Antoinede Bourguignon Arndt Director 24,198 30,452 17,012 71,662
Henri Philippe Reichstul Director 14,463 1,716 9,917 26,095
Antonio Luiz Pizarro Director 11,275 1,716 9,155 22,146
Eduardo Novoa Castellón Director 18,778 23,190 12,677 54,645
Nicolás Eblen Hirmas Director 18,778 23,190 12,677 54,645
Giles Agutter Director 10,241 1,716 3,946 15,902
2016
Board members Position Board of Director’s Board of Director’s Subcommittee Total
allowance (US$) Committee allowance (US$) allowance (US$) (US$)
Mauricio Amaro Chairman 25,029 - 1,992 27,021
Francisco Luzón López Director 2,470 - - 2,470
Juan José Cueto Plaza Director 19,071 - 13,879 32,950
Ramón Eblen Kadis Vice-Chairman 19,071 25,555 12,497 57,123
Juan Gerardo Jofré Miranda Director 19,071 25,555 12,497 57,123
Carlos Heller Solari Director 15,576 - - 15,576
Georges Antoinede Bourguignon Arndt Director 19,071 25,555 12,489 57,115
Ricardo J. Caballero Director 6,212 - 2,976 9,188
Henri Philippe Reichstul Director 13,774 - 10,024 23,798
C O R P O R AT E G O V E R N A N C E 48Year 2017
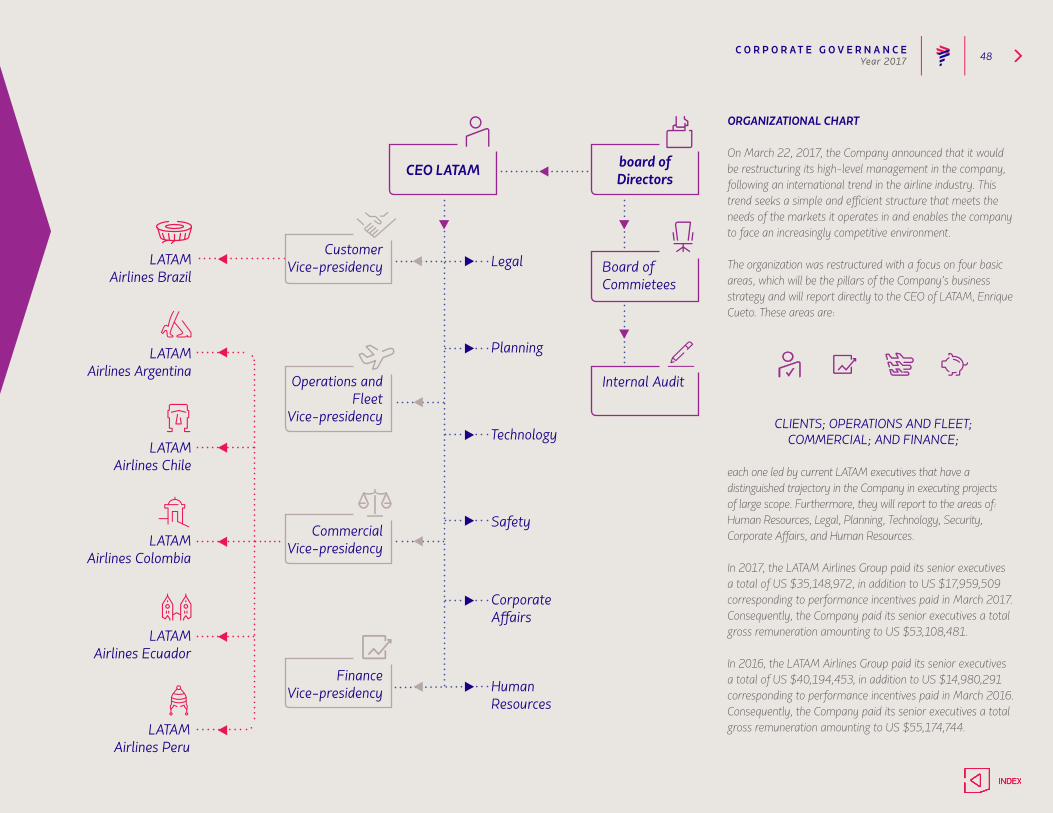
ORGANIZATIONAL CHART
On March 22, 2017, the Company announced that it would be restructuring its high-level management in the company, following an international trend in the airline industry. This trend seeks a simple and efficient structure that meets the needs of the markets it operates in and enables the company to face an increasingly competitive environment.
The organization was restructured with a focus on four basic areas, which will be the pillars of the Company’s business strategy and will report directly to the CEO of LATAM, Enrique Cueto. These areas are:
CLIENTS; OPERATIONS AND FLEET;COMMERCIAL; AND FINANCE;
each one led by current LATAM executives that have a distinguished trajectory in the Company in executing projects of large scope. Furthermore, they will report to the areas of: Human Resources, Legal, Planning, Technology, Security, Corporate Affairs, and Human Resources. In 2017, the LATAM Airlines Group paid its senior executives a total of US $35,148,972, in addition to US $17,959,509 corresponding to performance incentives paid in March 2017. Consequently, the Company paid its senior executives a total gross remuneration amounting to US $53,108,481.
In 2016, the LATAM Airlines Group paid its senior executives a total of US $40,194,453, in addition to US $14,980,291 corresponding to performance incentives paid in March 2016. Consequently, the Company paid its senior executives a total gross remuneration amounting to US $55,174,744.
CEO LATAM board of Directors
LATAMAirlines Brazil
LATAMAirlines Argentina
LATAMAirlines Chile
LATAMAirlines Colombia
LATAMAirlines Ecuador
LATAMAirlines Peru
FinanceVice-presidency
CommercialVice-presidency
Operations and Fleet
Vice-presidency
CustomerVice-presidency Legal
Planning
Technology
Safety
CorporateAffairs
HumanResources
Board ofCommietees
Internal Audit
C O R P O R AT E G O V E R N A N C E 49
COMPENSATION PLANS
(a) Compensation plan for increase of capitalThe compensation plans implemented via stock options for the underwriting and payment of stock options, that have been provided by LATAM Airlines Group S.A. to employees of the Company and its branches, are recognized in the financial statements pursuant to the established in NIIF 2 “Payments based on stock options”. This registers the fair value of the stock options offered in the form of remuneration in a linear form, between the date of offering of said stock options and the date in which they expire.
(a.1) Compensation Plan 2011On December 21, 2016, the subscription and payment period of the 4,800,000 shares corresponding to the compensation plan approved at the Extraordinary Shareholders' Meeting held on December 21, 2011, expired.
Of the total shares allocated to the 2011 Compensation Plan, only 10,282 shares were subscribed and paid, having been placed on the market in January 2014. In view of the above, at the expiration date, the 2011 Compensation Plan had a balance of 4,789,718 shares pending of subscription and payment, which was deducted from the authorized capital of the Company.
(a.2) Compensation Plan 2013At the Extraordinary Shareholders’ Meeting held on June 11, 2013, the Company’s shareholders approved motions including increasing corporate equity, of which 1,500,000 shares were allocated to compensation plans for employees of the Company and its subsidiaries, in conformity with the stipulations established in Article 24 of the Corporations Law.
With regard to this compensation, a defined date for implementation does not exist.
(b) Compensation Plan 2016-2018The company implemented a retention plan long-term
for executives, which lasts until December 2018, with a vesting period between October 2018 and March 2019, which consists of an extraordinary bonus whose calculation formula is based on the variation the value to experience the action of LATAM Airlines Group S.A. for a period of time.
This benefit is recognized in accordance with the provisions of IFRS 2 "Share-based Payments" and has been considered as cash settled award and therefore recorded at fair value as a liability, which is updated to the closing date of each financial statement with effect on profit or loss.
Year 2017

C O R P O R AT E G O V E R N A N C E 50Corporate Governance Practices
LATAM Airlines Group’s Corporate Governance practices follow the contents of Law N° 18,045 of the Securities Market, Law N° 18,046 on Stock Corporations (“LSA”) and its Rules, and the CMF’s regulations, the laws and regulations of the United States of America, and of the Securities and Exchange Commission (“SEC”) of said country, regarding the issuance of ADRs.
LATAM Airlines Group’s Corporate Governance practices are constantly revised so that its internal self-regulation processes may be fully in line with existing regulation and LATAM’s values.
THE BASIS FOR THE BUSINESS DECISIONS AND ACTIVITIES THAT LATAM AIRLINES GROUP CARRIES
OUT IS ITS ETHICAL PRINCIPLES, WHICH ARE STATED WITHIN THE LATAM CODE OF CONDUCT.
As for the main bodies of LATAM Airlines Group’s Corporate Governance, they are the Board of Directors and the Board of Directors’ Committee (which also acts as Audit Committee pursuant to the US Sarbanes-Oxley Act), together with the Strategy, Finance, Leadership, and Costumers and Businesses Committees, created following the merger of LAN and TAM. The main duties of these corporate bodies are detailed below.
LATAM AIRLINES GROUP BOARD OF DIRECTORSLATAM Airlines Group’s Board of Directors, comprising nine permanent members, is the body that analyzes and sets LATAM’s strategic vision, thus fulfilling a key role in the Company’s Corporate Governance. Every two years, all its members are renewed. Pursuant to LATAM Airlines Group’s bylaws, the members of the board are chosen by cumulative voting.
Corporate Governance
L ATAM Airlines Group S.A. is a publicly held stock corporation (sociedad anónima abierta) registered before the Commission for the Financial Market
(“CMF”), formerly the Superintendency of Securities and Insurance, under N° 306, whose stocks are traded on the Santiago Stock Exchange, the Chilean Electronic Exchange, and the Valparaiso Stock Exchange. Moreover, its stocks are traded on the New York Stock Exchange (“NYSE”) as American Depositary Receipts (“ADRs”).
C O R P O R AT E G O V E R N A N C E 51
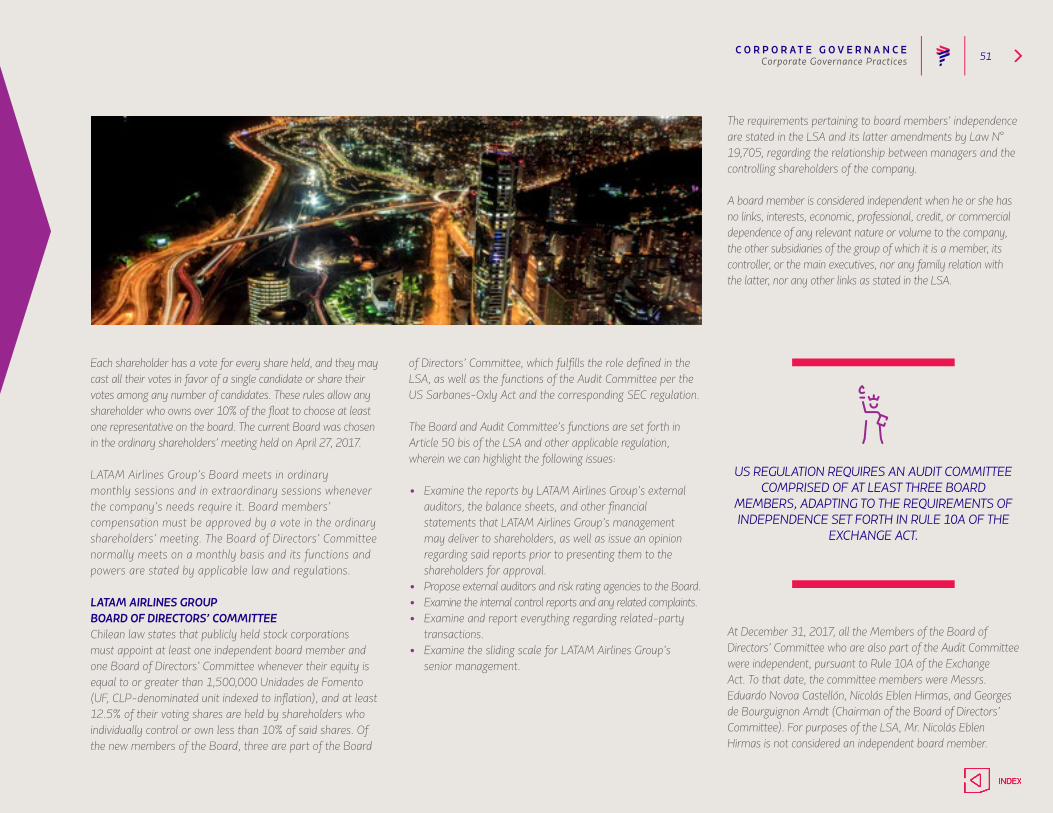
Each shareholder has a vote for every share held, and they may cast all their votes in favor of a single candidate or share their votes among any number of candidates. These rules allow any shareholder who owns over 10% of the float to choose at least one representative on the board. The current Board was chosen in the ordinary shareholders’ meeting held on April 27, 2017.
LATAM Airlines Group’s Board meets in ordinary monthly sessions and in extraordinary sessions whenever the company’s needs require it. Board members’ compensation must be approved by a vote in the ordinary shareholders’ meeting. The Board of Directors’ Committee normally meets on a monthly basis and its functions and powers are stated by applicable law and regulations.
LATAM AIRLINES GROUPBOARD OF DIRECTORS’ COMMITTEEChilean law states that publicly held stock corporations must appoint at least one independent board member and one Board of Directors’ Committee whenever their equity is equal to or greater than 1,500,000 Unidades de Fomento (UF, CLP-denominated unit indexed to inflation), and at least 12.5% of their voting shares are held by shareholders who individually control or own less than 10% of said shares. Of the new members of the Board, three are part of the Board
of Directors’ Committee, which fulfills the role defined in the LSA, as well as the functions of the Audit Committee per the US Sarbanes-Oxly Act and the corresponding SEC regulation.
The Board and Audit Committee’s functions are set forth in Article 50 bis of the LSA and other applicable regulation, wherein we can highlight the following issues:
• Examine the reports by LATAM Airlines Group’s external auditors, the balance sheets, and other financial statements that LATAM Airlines Group’s management may deliver to shareholders, as well as issue an opinion regarding said reports prior to presenting them to the shareholders for approval.
• Propose external auditors and risk rating agencies to the Board.• Examine the internal control reports and any related complaints.• Examine and report everything regarding related-party
transactions.• Examine the sliding scale for LATAM Airlines Group’s
senior management.
The requirements pertaining to board members’ independence are stated in the LSA and its latter amendments by Law N° 19,705, regarding the relationship between managers and the controlling shareholders of the company.
A board member is considered independent when he or she has no links, interests, economic, professional, credit, or commercial dependence of any relevant nature or volume to the company, the other subsidiaries of the group of which it is a member, its controller, or the main executives, nor any family relation with the latter, nor any other links as stated in the LSA.
US REGULATION REQUIRES AN AUDIT COMMITTEE COMPRISED OF AT LEAST THREE BOARD
MEMBERS, ADAPTING TO THE REQUIREMENTS OF INDEPENDENCE SET FORTH IN RULE 10A OF THE
EXCHANGE ACT.
At December 31, 2017, all the Members of the Board of Directors’ Committee who are also part of the Audit Committee were independent, pursuant to Rule 10A of the Exchange Act. To that date, the committee members were Messrs. Eduardo Novoa Castellón, Nicolás Eblen Hirmas, and Georges de Bourguignon Arndt (Chairman of the Board of Directors’ Committee). For purposes of the LSA, Mr. Nicolás Eblen Hirmas is not considered an independent board member.
Corporate Governance Practices
C O R P O R AT E G O V E R N A N C E 52
ANNUAL REPORT OF THE BOARD OF DIRECTORS’ COMMITTEE’S ADMINISTRATIONPursuant to item number 5 of section 8 of article 50 bis of Law N° 18,046 regarding Stock Corporations, the Board of Directors’ Committee of LATAM Airlines Group S.A. issues the following annual report of its administration for 2017.
I. COMPOSITION OF THE BOARD OF DIRECTORS’ COMMITTEE AND SESSIONS.The Board of Directors’ Committee of the Company comprises Messrs. Georges de Bourguignon Arndt, Eduardo Novoa Castellón, and Nicolás Eblen Hirmas, who are deemed independent members under US legislation. Under Chilean legislation, the former two are deemed independent members. The Board of Directors’ Committee is chaired by Mr. Georges de Bourguignon Arndt.
The members were chosen in the Ordinary Shareholders’ Meeting held on April 27, 2017, for a two-year term, pursuant to the Company’s bylaws.
II. COMMITTEE’S ACTIVITY REPORT.During 2017, the Board of Directors’ Committee met in 21 sessions to exercise its powers and fulfill its duties as per article 50 Bis of Law N° 18,046 on Stock Corporations, as well as to see to those other matters that the Board of Directors’ Committee deemed it necessary to examine, review, or evaluate. Below, is a report of the main issues discussed.
Examination and Review of Balance Sheetand Financial Statements.The Board of Directors’ Committee examined and reviewed the Company’s financial statements as at December 31, 2016, as well as at the end of the quarters ended on March 31, June 30, and September 30, 2017, including the examination of the corresponding reports from the Company’s external auditors, as explained below. The Company’s External Auditor participated in the Committee’s sessions regarding the Company’s financial statements as at December 31, 2016 and June 30, in order to deliver
their audit opinion and report the relevant points of their review, the main aspects of internal control, and the communications required by the External Auditor’s regulator including, on each item, the confirmation that (i) they met with no difficulties to carry out the audit, (ii) they had no difference of opinion with Management, and (iii) no events arose that could pose a threat to their independence.
In the ordinary session held on September 29, 2017, the external auditors, Price WaterhouseCoopers (PwC), presented their audit plan for 2017. Likewise, in its capacity as external auditor for TAM S.A. and its affiliates, Ernst & Young (EY) participated in the Board of Directors’ Committee’s sessions of May 31, 2017 and September 29, 2017 to report on the main aspects of the external audit of TAM, the focus of its review process, and aspects of internal control.
Review of Reports on Impairmentof Cash Generating Units.
In the session held on March 6, 2017, the Directors' Committee analyzed the impairment reports prepared by the Company's management and the consulting firm KPMG, hired for that purpose and present at that session, corresponding to the cash-generating units of the Company for certain assets included in the Financial Statements as of December 31, 2016. In the sessions held on May 10, 2017, August 4, 2017, and November 2, 2017, LATAM's Comptroller's area presented to the Board of Directors’ Committee an impairment analysis reports for the Company’s cash generating units regarding certain assets included in the Financial Statements dated March 31, 2017, June 30, 2017, and September 30, 2017, respectively, pursuant to the reports issued by the Company.
At the Board of Directors’ Committee’s session held on May 31, 2017, LATAM’s Comptroller presented to the Board of Directors’ Committee the “Policy for the Control of Signs of Impairment of Air Transport Cash Generating Unit and Multiplus Coalition and Loyalty Program Cash Generating Unit”.
Executive and Workers’ Compensation Systems.
In an ordinary session held on March 23, 2017, the Board of Directors’ Committee examined changes to the compensation systems for executives in relation to the calculation of long-term bonds. In the Board of Directors’ Committee’s session held on April 3, 2017, the reorganization of the senior management was reviewed.
In the session held on August 4, 2017 and on September 1, 2017, the Board of Directors’ Committee reviewed the main topics discussed in the Leadership Committee throughout the year, including the “Headcount Challenge” and LATAM’s new Organizational Structure. In terms of compensation, the LATAM executive compensation strategy was reviewed, beginning at the Director level, including the methodology used to assess the position, the compensation policy defined by the Company, and the average ranking for said positions within the Chilean and Brazilian markets.
Corporate Governance Practices
C O R P O R AT E G O V E R N A N C E 53
Examination of Background Pertainingto Related-Party Transactions
The transactions that are considered or could be considered related-party transactions according to the Company’s applicable legal and accounting rules were examined in the sessions held on January 4, 2017, February 16, 2017, August 4, 2017, and September 1, 2017, whereby the Committee granted the corresponding approvals.
Corporate Governance Practices.
In order to comply with General Rule N° 385 of the Commission for the Financial Market (“CMF”), formerly the Superintendence of Securities and Insurance ("NCG 385”), the Board of Directors’ Committee analyzed and examined LATAM’s corporate governance practices for 2017 in the sessions held on May 31, 2017 and December 7, 2017, January 22, 2018, and March 5, 2018, per the questionnaire included in Appendix I of said NCG 385. In said sessions, improvements to the Company’s corporate governance practices were evaluated, and it was agreed to strengthen the implementation of some practices that have already been approved, and to improve some procedures for meetings with the planning department. With regard to the session held on May 31, 2017, the planning of the Board of Directors’ Committee in coordination with the Board’s activities was reviewed, and in an extraordinary session held on December 13, 2017, a meeting was held with the Company’s “Investor Relations” department review its operation and propose possible improvements to the practices of information delivery to the market.
Training on Matters of Competition.
In the sessions held on January 23, 2017, June 30, 2017, December 7, 2017, and March 5, 2018, the Board of Directors’ Committee reviewed the conclusions of the training carried out on competition to reinforce in this field in the Company’s various business segments.
Updating Sustainability Matters.
In the Board of Directors’ Committee’s session held on November 2, 2017, the Company’s progress in terms of Sustainability was reported, reviewing the company's sustainability strategy, matters of corporate governance regarding the Dow Jones Sustainability Index, and issues regarding corporate citizenship.
Review of Tax and Accounting Topics
In the sessions held on January 23, 2017, March 6, 2017, May 10,2017 and September 29, 2017, the Board of Directors’ Committee reviewed accounting and tax topics including the authority’s oversight, asset reorganization, rules for determining transfer prices, implementation of new IFRS standards, and accounting contingencies
Internal Audit and Internal Controls
In the ordinary sessions of the Directors' Committee held on June 30, 2017 and August 4, 2017, the reports issued by LATAM Internal Audit and the Internal Audit work plan for 2017 were reviewed and revised.
Also, in the sessions of March 23, 2017, August 4, 2017 and December 7, 2017, the Directors' Committee reviewed the conclusions of the review of control systems under the Sarbanes Oxley regulation. The 2017 work plan was also reviewed and progress on internal control was reported. On December 7, 2017, the Directors Committee met with the "Procurement & Supply Chain" area in order to learn more about its operation including a review of the main processes and controls in this area. On November 2 and November 15, 2017, the Directors Committee internalized the progress in the various projects associated with the Revenue Accounting area.
Corporate Risk Management
In the ordinary session held on April 3, 2017, the Directors' Committee reviewed a presentation regarding the risks associated with the Operations Control Center (CCO) in
which the functions of this center were analyzed, as well as the management tasks of the center, contingencies and operational continuity, the teams involved, the evolution of the management of the CCO and matters related to its new organizational format.
Compliance
In the ordinary sessions held on January 23, 2017 and September 1, 2017, the Board of Directors’ Committee received training on the Compliance Program currently in force in the Company. The training included a revisionon its main contents, including the Code of Conduct, different Policies and Procedures, Due Diligence processes for Third Party Intermediaries (TPIs), Crime Prevention Manual, ongoing consulting on Compliance, Ambassador Program, Hotline and internal investigations, and the risk assessment processes, certification, and training.
Board of Directors’ Committee Recommendations.
On the other hand, the Directors' Committee made several recommendations, and section IV of this report indicates those related to the appointment of external auditors of the Company and of private risk rating agencies for the year 2017.
Report of Activities byBoard of Directors’ Committee Session
Notwithstanding the above, the Board of Directors’ Committee met and discussed the opportunities described below, with a brief example of the topics examined at each of these sessions:
1) Extraordinary session N°52 01/04/2017• Examination of aircraft subleasing agreement under wet
lease modality, concerning 4 A350-941 aircraft, to be entered with Qatar Airways Q.E.S.C.
Corporate Governance Practices
C O R P O R AT E G O V E R N A N C E 54Corporate Governance Practices
2) Ordinary session N°173 01/23/2017• Presentation relative to the project for competitiveness training.• Updates on accounting matters.• Presentation of tax matters.• Compliance matters.
3) Extraordinary session N°53 02/16/2017• Review and approval of aircraft subleasing agreement
under dry lease modality, concerning 4 A350-941 aircraft, to be entered with Qatar Airways Q.E.S.C.
4) Ordinary session N°174 03/06/2017• Analysis of impairment test of certain assets included in
the Financial Statements at December 31, 2016.• Updates on accounting matters.• Review of the document required by General Rule 385• Review of legal issues and compliance.Transaction review
relative to a subsidiary Mas Air.
5) Extraordinary session N°54 03/15/2017• Review of Financial Statements at December 31, 2016.
6) Extraordinary session N°55 03/23/2017• Conclusion of SOX review up to December 31, 2016.• Human resources related to modifications in compensation
systems through long-term executive bonds.
7) Ordinary session N°175 04/03/2017• Reorganization of the senior management.• Proposal of hiring external auditors and private risk rating
agencies for 2017.• Review of the functioning of the Directors' Committee for
incoming Directors to the Committee.• Review of legal issues and compliance.• Corporate risk management issues: CCO centralization:
review of the centralization of the Operations Control Center.
8) Ordinary session N°176 05/10/2017• Installing and election of the Committee Chairman.• Review of the functioning of the Directors' Committee for
incoming Directors to the Committee.• Analysis of signs of Impairment of air transport cash
generating unit.• Analysis of future application of accounting rule IFRS 16.• Transaction in relation Transaction review relating to a
subsidiary Mas Air
9) Extraordinary session N°56 05/15/2017• Review of the Financial Statements up to March 31, 2017.
10) Ordinary session N°177 05/31/2017• Policy on signs of impairment and consultation on state
of cash flows.• Presentation of external auditors EY.• Board's annual activity plan.• Analysis of information required by General Rule 385
of the SVS.• Various matters concerning Legal Affairs• Planning of activities of Board of Directors’ Committee
and others.
11) Ordinary session N°178 06/30/2017• Administrative aspects revision regarding the functioning of
the Directors’ Committee.• Review of Internal Audit Reports and work plan of Internal
Audit for the year 2017• Presentation of the Project for competitiveness training.• Revision of legal Affairs topics
12) Extraordinary session N°57 08/01/2017• Review of legal and Compliance matters.
13)Ordinary session N°179 08/04/2017• Review of the Internal Audit work plan for 2017.• Review of Transactions between parties related to the
Frequent Flyer Programs of LATAMPASS and MULTIPLUS.• Analysis of signs of deterioration of the cash-generating
unit of air transport.• Presentation of information on Transactions with related
parties.• SOX 2017 work plan.• Review of legal issues.• Review of topics discussed in the Leadership Committee
related to executive compensation systems.
C O R P O R AT E G O V E R N A N C E 55
14) Extraordinary session N°58 08/17/2017• Review of the Financial Statements up to June 30, 2017.
15) Ordinary session N°180 09/01/2017• Review of the FFP Transactions (between parties related
to the Frequent Flyer Programs of LATAMPASS and MULTIPLUS).
• Review of a Transaction in relation to a subsidiary. Mas Air• Extension Review of the extension of the term of the
sublease contract of aircraft A350-941 to Qatar Airways Q.E.S.C .
• Review of compliance issues.• Presentation of BH Compliance.• Review of topics discussed in the Leadership Committee
related to executive compensation systems.
16)Ordinary session N°181 09/29/2017• Review of progress status of PWC 2017 external audit.• Presentation of the firm EY relative to the audit to TAM S.A.• Presentation of tax issues associated with transfer prices,
asset reorganization, and contingencies.
17) Ordinary session N°182 11/2/2017• Analysis of signs of Impairment of air transport cash
generating unit.• Presentation of the Revenue Accounting area regarding the
current status of the "REVERA" project.• Presentation on LATAM Sustainability and Corporate
Citizenship.• Revision of Legal matters.
18) Extraordinary session N°59 11/15/2017• Review of the Financial Statements up to September 30, 2017 • Presentation of the Revenue Accounting area related to the
progress of the "REVERA" project.
19) Extraordinary session N°60 12/1/2017• Analysis of notice received by TAM Linhas Aéreas S.A.
(“TAM”) from Brazil’s Federal Revenue Office (Secretaria de Receita Federal ).
20) Ordinary session N°183 12/7/2017• Presentation of part of the LATAM Procurement area
related to the processes under its responsibility.• Analysis of the information required by General
Standard 385 of the SVS• Presentation by the Comptroller's Office regarding the
status of the SOX 2017 review• Presentation on the Competency Training Project.• Analysis of the letter received from external auditors
related to internal control issues.
21) Extraordinary session N°61 12/13/2017• Presentation relative to the functioning of the “Investor
Relations” department and the information deliver to the market.
III. BOARD OF DIRECTORS’ COMMITTEE COMPENSATION AND EXPENDITURES.
The Company’s Ordinary Shareholders’ meeting held on April 27, 2017, agreed that each member of the Board of Directors’ Committee should receive the equivalent to 80 Unidades de Fomento (UF) per monthly attendance to the Board of Directors’ Committee’s sessions.
With regard to the functioning of the Board of Directors’ Committee and its advisors, the Stock Corporations law states that their spending budget must be at least equivalent to the annual compensation paid to the Committee members; thus, said Ordinary Shareholders’ Meeting approved a budget of 2,880 UF for 2017, which was not used during the year 2017.
As a result, the Board of Directors’ Committee’s spending is related to the monthly fee for attending the sessions, and members have no other expenses or outlays to report.
IV. BOARD OF DIRECTORS’ COMMITTEE RECOMMENDATIONS.
IV.1 Proposal for Appointment of External Auditors.In the Board of Directors’ Committee’s session held on April 3, 2017, and pursuant to the contents of item 2), section eight of Article 50 Bis of Law N° 18,046 regarding Stock Corporations, the Board of Directors’ Committee agreed to submit to the Board the external auditors suggested at the Company’s Ordinary Shareholders’ Meeting held on April 27, 2017. Thus, the Committee decided to propose to the company’s Board the appointment of PriceWaterhouseCoopers Consultores, Auditores y Cía. Limitada (“PWC”), Ernst & Young Servicios Profesionales de Auditoría y Asesorías Limitada (“EY”), and KPMG Auditores Consultores Ltda (“KPMG”) as Audit Companies for the Company, in that same order of priority, albeit advising to retain PWC as the Audit Company for the year 2017, given the contract with PWC, which is still valid, as it was awarded during the bidding process for External Audit services that the Company held in 2016, and comprises the rendering of said services for the years 2016, 2017, and 2018. On that occasion, the following reasons and arguments were considered to make this decision:
(i) The Company’s management or Board have made no observations or objections to the quality of the services rendered by PWC to LATAM Airlines Group.
(ii) The interaction and coordination between both external auditors, PWC and EY, as external auditors for LATAM Airlines Group and TAM S.A. for the year 2016 is deemed to have been positive.
(iii) While PWC has been the external auditor for LATAM Airlines Group for the last 25 years, this audit company’s degree of independence is guaranteed through the internal control systems that it has implemented and through the policy that PWC follows on an international level of changing the partner
Corporate Governance Practices
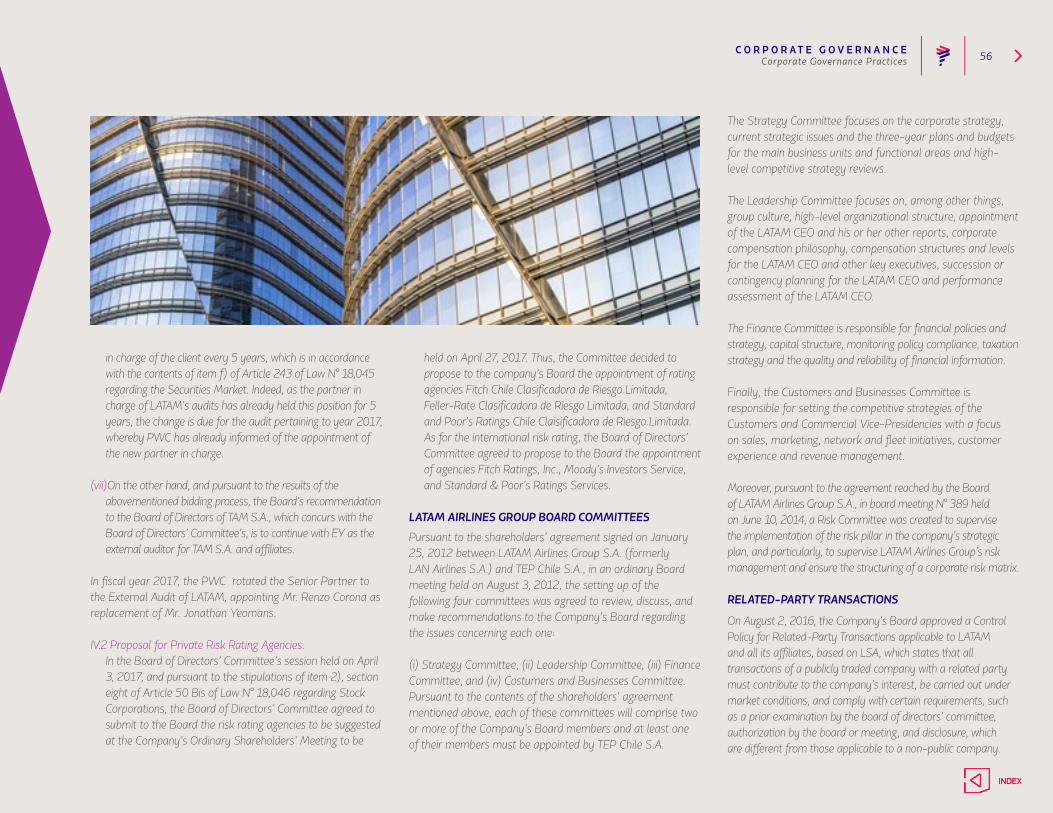
C O R P O R AT E G O V E R N A N C E 56Corporate Governance Practices
in charge of the client every 5 years, which is in accordance with the contents of item f) of Article 243 of Law N° 18,045 regarding the Securities Market. Indeed, as the partner in charge of LATAM’s audits has already held this position for 5 years, the change is due for the audit pertaining to year 2017, whereby PWC has already informed of the appointment of the new partner in charge.
(vii)On the other hand, and pursuant to the results of the abovementioned bidding process, the Board’s recommendation to the Board of Directors of TAM S.A., which concurs with the Board of Directors’ Committee’s, is to continue with EY as the external auditor for TAM S.A. and affiliates.
In fiscal year 2017, the PWC rotated the Senior Partner to the External Audit of LATAM, appointing Mr. Renzo Corona as replacement of Mr. Jonathan Yeomans.
IV.2 Proposal for Private Risk Rating Agencies. In the Board of Directors’ Committee’s session held on April
3, 2017, and pursuant to the stipulations of item 2), section eight of Article 50 Bis of Law N° 18,046 regarding Stock Corporations, the Board of Directors’ Committee agreed to submit to the Board the risk rating agencies to be suggested at the Company’s Ordinary Shareholders’ Meeting to be
held on April 27, 2017. Thus, the Committee decided to propose to the company’s Board the appointment of rating agencies Fitch Chile Clasificadora de Riesgo Limitada, Feller-Rate Clasificadora de Riesgo Limitada, and Standard and Poor's Ratings Chile Claisificadora de Riesgo Limitada. As for the international risk rating, the Board of Directors’ Committee agreed to propose to the Board the appointment of agencies Fitch Ratings, Inc., Moody’s Investors Service, and Standard & Poor’s Ratings Services.
LATAM AIRLINES GROUP BOARD COMMITTEES
Pursuant to the shareholders’ agreement signed on January 25, 2012 between LATAM Airlines Group S.A. (formerly LAN Airlines S.A.) and TEP Chile S.A., in an ordinary Board meeting held on August 3, 2012, the setting up of the following four committees was agreed to review, discuss, and make recommendations to the Company’s Board regarding the issues concerning each one:
(i) Strategy Committee, (ii) Leadership Committee, (iii) Finance Committee, and (iv) Costumers and Businesses Committee. Pursuant to the contents of the shareholders’ agreement mentioned above, each of these committees will comprise two or more of the Company’s Board members and at least one of their members must be appointed by TEP Chile S.A.
The Strategy Committee focuses on the corporate strategy, current strategic issues and the three-year plans and budgets for the main business units and functional areas and high-level competitive strategy reviews.
The Leadership Committee focuses on, among other things, group culture, high-level organizational structure, appointment of the LATAM CEO and his or her other reports, corporate compensation philosophy, compensation structures and levels for the LATAM CEO and other key executives, succession or contingency planning for the LATAM CEO and performance assessment of the LATAM CEO.
The Finance Committee is responsible for financial policies and strategy, capital structure, monitoring policy compliance, taxation strategy and the quality and reliability of financial information.
Finally, the Customers and Businesses Committee is responsible for setting the competitive strategies of the Customers and Commercial Vice-Presidencies with a focus on sales, marketing, network and fleet initiatives, customer experience and revenue management.
Moreover, pursuant to the agreement reached by the Board of LATAM Airlines Group S.A., in board meeting N° 389 held on June 10, 2014, a Risk Committee was created to supervise the implementation of the risk pillar in the company’s strategic plan, and particularly, to supervise LATAM Airlines Group’s risk management and ensure the structuring of a corporate risk matrix.
RELATED-PARTY TRANSACTIONS
On August 2, 2016, the Company’s Board approved a Control Policy for Related-Party Transactions applicable to LATAM and all its affiliates, based on LSA, which states that all transactions of a publicly traded company with a related party must contribute to the company’s interest, be carried out under market conditions, and comply with certain requirements, such as a prior examination by the board of directors’ committee, authorization by the board or meeting, and disclosure, which are different from those applicable to a non-public company.
C O R P O R AT E G O V E R N A N C E 57
This policy includes the Board’s definition of the transactions considered habitual, which was approved in the board meeting held on December 29, 2009 and reported on said date to the CMF via a communiqué. The transactions declared to be habitual may be executed without the requirement of prior examination and approval by the board or meeting.
LATAM Airlines Group has performed various transactions with its affiliates, including the companies held or controlled by some of its majority shareholders. During the normal course of LATAM’s business, various types of services have been rendered and received to and from related companies, including aircraft leasing and exchange, cargo transportation, and booking services.
LATAM Airlines Group’s policy considers not carrying out transactions with, or in favor of any shareholder or Board member, or with any entity controlled by said persons, or where they hold a significant economic stake, except when said transaction is related to LATAM and the price and other terms are, at least, as favorable for the company as those it could obtain from a third party under market conditions.
Said transactions are summarized in the audited consolidated financial statements for the fiscal year ended on December 31, 2017.
PRINCIPLES OF A GOOD CORPORATE GOVERNANCE
The good Corporate Governance of LATAM Airlines Group is a result of the interaction among various people and stakeholders.
While compliance with the highest of ethical and regulatory standards set by the Board of LATAM Airlines Group must be observed by all its employees, initially, the persons responsible for a good Corporate Governance are the Board, the Board of Directors’ Committee, and the Senior Executives of LATAM Airlines Group. Thereby, LATAM Airlines Group is committed to offer transparency and compliance with the ethical and regulatory standards set by the Board for this purpose.
PILLARS OF THE CORPORATE GOVERNANCEOF LATAM AIRLINES GROUP
In order to ensure a proper Corporate Governance at LATAM Airlines Group, and notwithstanding the responsibilities of the Board and the Board of Directors’ Committee of LATAM, its management has taken a series of steps, including the following:
1. Publication of a single LATAM Airlines Group Code of Conduct for all its collaborators, whose goal is to ensure compliance with the highest ethical, transparency, and regulatory standards required by LATAM Airlines Group.
LATAM Group has a Channel to Report Ethical Breaches (www.etica-grupolatam.com) where workers can file their concerns directly via electronic media, in a private way, and certain that their concerns will be duly dealt with and investigated, guaranteeing that there will be no retaliation against the person who filed the report.
2. Code of Ethics for senior financial executives, which fosters honest and ethical conduct in the presentation of financial information, regulation compliance, and absence of conflicts of interest.
3. Manual for Handling Relevant Information, a requirement of the CMF and, based on the contents of Law N° 20,382 on Corporate Governments, a requirement of the Chilean law regarding the Securities Market as well. Aside from the rules, LATAM Airlines Group regulates the criteria for the disclosure of transactions, voluntary blackout periods for the purchase and sale of LATAM stocks, the mechanisms for the ongoing distribution of relevant information to the market, and mechanisms for safekeeping confidential information by LATAM employees and executives.
4. Compliance Program, whereby LATAM’s Compliance Management, which is part of the Legal Affairs Vice-Presidency of LATAM Airlines Group, in coordination with the Board and its Committee and supervised by them, ensures compliance with the laws and regulations applicable to LATAM Airlines Group's businesses and activities in the various countries where it operates.
CORPORATE GOVERNANCE PRACTICES
On March 30, 2018, the Company’s Corporate Practices Report was submitted to the CMF, approved by the Board of LATAM Airlines Group S.A. and prepared pursuant to CMF General Rule N° 385, formerly N° 341, dated June 8, 2015. The duty of information disclosure stated in this rule is set to cover up to December 31 of each year, to be presented no later than March 31 of the following year.
The information delivered on an annual basis to the CMF must regard the following issues:
• Board of Directors’ Committee Functioning.• The relations between the company, shareholders, and
the public.• Substitution and compensation of senior executives.• Definition, implementation, and supervision of the
company’s internal control and risk management policies and procedures.
Corporate Governance Practices
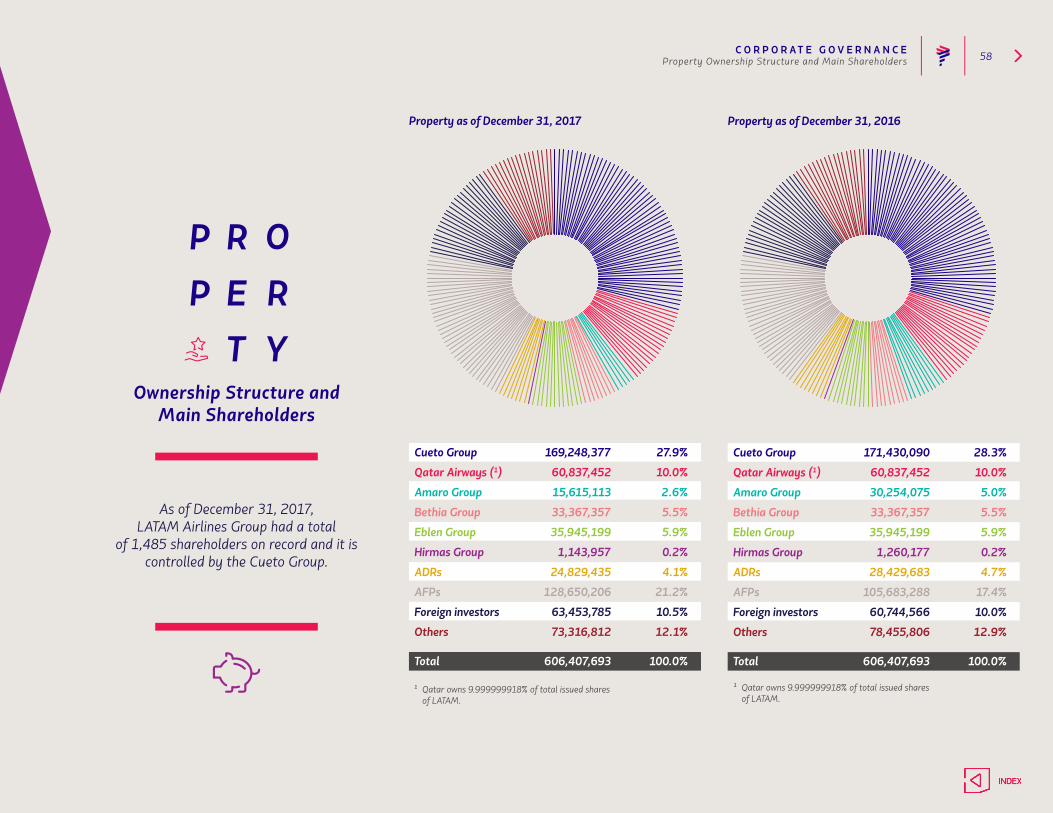
C O R P O R AT E G O V E R N A N C E 58Property Ownership Structure and Main Shareholders
Ownership Structure andMain Shareholders
As of December 31, 2017,LATAM Airlines Group had a total
of 1,485 shareholders on record and it is controlled by the Cueto Group.
Property as of December 31, 2017
Cueto Group 169,248,377 27.9%
Qatar Airways (1) 60,837,452 10.0%
Amaro Group 15,615,113 2.6%
Bethia Group 33,367,357 5.5%
Eblen Group 35,945,199 5.9%
Hirmas Group 1,143,957 0.2%
ADRs 24,829,435 4.1%
AFPs 128,650,206 21.2%
Foreign investors 63,453,785 10.5%
Others 73,316,812 12.1%
Total 606,407,693 100.0%
1 Qatar owns 9.999999918% of total issued shares of LATAM.
Property as of December 31, 2016
Cueto Group 171,430,090 28.3%
Qatar Airways (1) 60,837,452 10.0%
Amaro Group 30,254,075 5.0%
Bethia Group 33,367,357 5.5%
Eblen Group 35,945,199 5.9%
Hirmas Group 1,260,177 0.2%
ADRs 28,429,683 4.7%
AFPs 105,683,288 17.4%
Foreign investors 60,744,566 10.0%
Others 78,455,806 12.9%
Total 606,407,693 100.0%
1 Qatar owns 9.999999918% of total issued shares of LATAM.

C O R P O R AT E G O V E R N A N C E 59
12 Main Shareholders by December 31, 2017
Name or Shares paid and subscribed PercentageBusiness name as of Jan 31, 2017 (%)
Costa VerdeAeronáutica S.A 88,259,650 14.6%
Qatar AirwaysInvestments (uk) Ltd. 60,837,452 10.0%
Costa VerdeAeronáutica tres SpA 35,300,000 5.8%
Banco de Chilepor cuenta de tercerosno residentes 26,868,034 4.4%
JP Morgan Chase Bank 25,087,789 4.1%
Inversiones NuevaCosta Verde Aeronáutica Ltda. 23,578,077 3.9%
Banco Itaú Corpbancapor cuenta deinversionistas extranjeros 22,101,009 3.6%
Axxion S.A 18,473,333 3.0%
Inversiones Andes SpA 17,146,529 2.8%
TEP Chile S.A 15,615,113 2.6%
Inversiones HS SpA 14,894,024 2.5%
Banco Santanderpor cuenta deinversionistas extranjeros 13,309,477 2.2%
Name or Shares paid and subscribed PercentageBusiness name as of Dec 31, 2015 (%)
Costa VerdeAeronáutica S.A 90,427,620 14.9%
Qatar AirwaysInvestments (uk) Ltd. 60,837,452 10.0%
Costa VerdeAeronáutica tres SpA 35,300,000 5.8%
TEP Chile S.A 30,254,075 5.0%
Banco de Chilepor cuenta de tercerosno residentes 28,532,253 4.7%
JP Morgan Chase Bank 28,429,683 4.7%
InversionesNueva Costa VerdeAeronáutica Ltda. 23,578,077 3.9%
Banco Itaú Corpbancapor cuenta deinversionistas extranjeros 21,157,885 3.5%
Axxion S.A 18,473,333 3.0%
Inversiones Andes SpA 17,146,529 2.8%
Inversiones HS SpA 14,894,024 2.5%
Costa VerdeAeronáutica SpA 12,000,000 2.0%
12 Main Shareholders by December 31, 2016
Property Ownership Structure and Main Shareholders
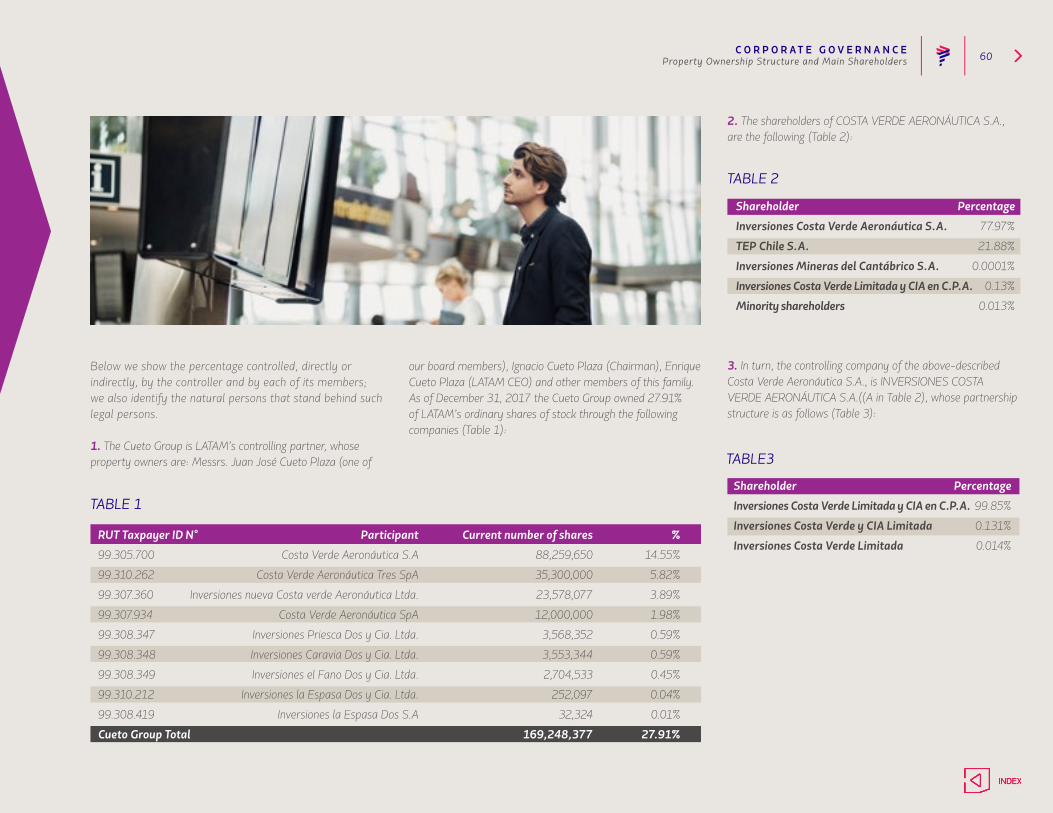
C O R P O R AT E G O V E R N A N C E 60
Below we show the percentage controlled, directly or indirectly, by the controller and by each of its members; we also identify the natural persons that stand behind such legal persons.
1. The Cueto Group is LATAM’s controlling partner, whose property owners are: Messrs. Juan José Cueto Plaza (one of
our board members), Ignacio Cueto Plaza (Chairman), Enrique Cueto Plaza (LATAM CEO) and other members of this family. As of December 31, 2017 the Cueto Group owned 27.91% of LATAM’s ordinary shares of stock through the following companies (Table 1):
RUT Taxpayer ID N° Participant Current number of shares %
99.305.700 Costa Verde Aeronáutica S.A 88,259,650 14.55%
99.310.262 Costa Verde Aeronáutica Tres SpA 35,300,000 5.82%
99.307.360 Inversiones nueva Costa verde Aeronáutica Ltda. 23,578,077 3.89%
99.307.934 Costa Verde Aeronáutica SpA 12,000,000 1.98%
99.308.347 Inversiones Priesca Dos y Cia. Ltda. 3,568,352 0.59%
99.308.348 Inversiones Caravia Dos y Cia. Ltda. 3,553,344 0.59%
99.308.349 Inversiones el Fano Dos y Cia. Ltda. 2,704,533 0.45%
99.310.212 Inversiones la Espasa Dos y Cia. Ltda. 252,097 0.04%
99.308.419 Inversiones la Espasa Dos S.A 32,324 0.01%
Cueto Group Total 169,248,377 27.91%
TABLE 1
2. The shareholders of COSTA VERDE AERONÁUTICA S.A., are the following (Table 2):
3. In turn, the controlling company of the above-described Costa Verde Aeronáutica S.A., is INVERSIONES COSTA VERDE AERONÁUTICA S.A.((A in Table 2), whose partnership structure is as follows (Table 3):
Shareholder Percentage
Inversiones Costa Verde Aeronáutica S.A. 77.97%
TEP Chile S.A. 21.88%
Inversiones Mineras del Cantábrico S.A. 0.0001%
Inversiones Costa Verde Limitada y CIA en C.P.A. 0.13%
Minority shareholders 0.013%
TABLE 2
TABLE3
Shareholder Percentage
Inversiones Costa Verde Limitada y CIA en C.P.A. 99.85%
Inversiones Costa Verde y CIA Limitada 0.131%
Inversiones Costa Verde Limitada 0.014%
Property Ownership Structure and Main Shareholders
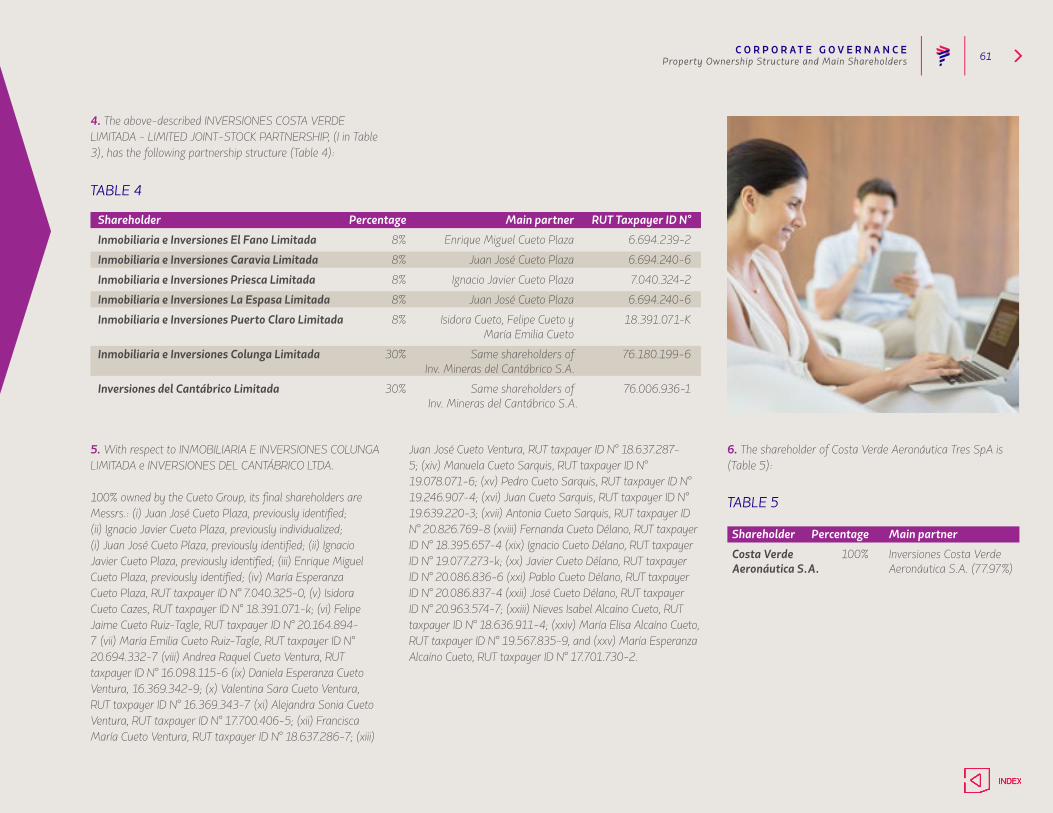
C O R P O R AT E G O V E R N A N C E 61
5. With respect to INMOBILIARIA E INVERSIONES COLUNGA LIMITADA e INVERSIONES DEL CANTÁBRICO LTDA.
100% owned by the Cueto Group, its final shareholders are Messrs.: (i) Juan José Cueto Plaza, previously identified; (ii) Ignacio Javier Cueto Plaza, previously individualized; (i) Juan José Cueto Plaza, previously identified; (ii) Ignacio Javier Cueto Plaza, previously identified; (iii) Enrique Miguel Cueto Plaza, previously identified; (iv) María Esperanza Cueto Plaza, RUT taxpayer ID N° 7.040.325-0, (v) Isidora Cueto Cazes, RUT taxpayer ID N° 18.391.071-k; (vi) Felipe Jaime Cueto Ruiz-Tagle, RUT taxpayer ID N° 20.164.894-7 (vii) María Emilia Cueto Ruiz-Tagle, RUT taxpayer ID N° 20.694.332-7 (viii) Andrea Raquel Cueto Ventura, RUT taxpayer ID N° 16.098.115-6 (ix) Daniela Esperanza Cueto Ventura, 16.369.342-9; (x) Valentina Sara Cueto Ventura, RUT taxpayer ID N° 16.369.343-7 (xi) Alejandra Sonia Cueto Ventura, RUT taxpayer ID N° 17.700.406-5; (xii) Francisca María Cueto Ventura, RUT taxpayer ID N° 18.637.286-7; (xiii)
Juan José Cueto Ventura, RUT taxpayer ID N° 18.637.287-5; (xiv) Manuela Cueto Sarquis, RUT taxpayer ID N° 19.078.071-6; (xv) Pedro Cueto Sarquis, RUT taxpayer ID N° 19.246.907-4; (xvi) Juan Cueto Sarquis, RUT taxpayer ID N° 19.639.220-3; (xvii) Antonia Cueto Sarquis, RUT taxpayer ID N° 20.826.769-8 (xviii) Fernanda Cueto Délano, RUT taxpayer ID N° 18.395.657-4 (xix) Ignacio Cueto Délano, RUT taxpayer ID N° 19.077.273-k; (xx) Javier Cueto Délano, RUT taxpayer ID N° 20.086.836-6 (xxi) Pablo Cueto Délano, RUT taxpayer ID N° 20.086.837-4 (xxii) José Cueto Délano, RUT taxpayer ID N° 20.963.574-7; (xxiii) Nieves Isabel Alcaíno Cueto, RUT taxpayer ID N° 18.636.911-4; (xxiv) María Elisa Alcaíno Cueto, RUT taxpayer ID N° 19.567.835-9, and (xxv) María Esperanza Alcaíno Cueto, RUT taxpayer ID N° 17.701.730-2.
4. The above-described INVERSIONES COSTA VERDE LIMITADA - LIMITED JOINT-STOCK PARTNERSHIP, (I in Table 3), has the following partnership structure (Table 4):
TABLE 4
Shareholder Percentage Main partner RUT Taxpayer ID N°
Inmobiliaria e Inversiones El Fano Limitada 8% Enrique Miguel Cueto Plaza 6.694.239-2
Inmobiliaria e Inversiones Caravia Limitada 8% Juan José Cueto Plaza 6.694.240-6
Inmobiliaria e Inversiones Priesca Limitada 8% Ignacio Javier Cueto Plaza 7.040.324-2
Inmobiliaria e Inversiones La Espasa Limitada 8% Juan José Cueto Plaza 6.694.240-6
Inmobiliaria e Inversiones Puerto Claro Limitada 8% Isidora Cueto, Felipe Cueto y 18.391.071-K María Emilia Cueto
Inmobiliaria e Inversiones Colunga Limitada 30% Same shareholders of 76.180.199-6 Inv. Mineras del Cantábrico S.A.
Inversiones del Cantábrico Limitada 30% Same shareholders of 76.006.936-1 Inv. Mineras del Cantábrico S.A.
TABLE 5
Shareholder Percentage Main partner
Costa Verde 100% Inversiones Costa VerdeAeronáutica S.A. Aeronáutica S.A. (77.97%)
6. The shareholder of Costa Verde Aeronáutica Tres SpA is (Table 5):
Property Ownership Structure and Main Shareholders
C O R P O R AT E G O V E R N A N C E 62
8. The shareholders of COSTA VERDE AERONÁUTICA SpA are the following (Table 7):
11. The partners of INVERSIONES EL FANO DOS Y CIA. LTDA. are the following (Table 10):
12. The partners of INVERSIONES LA ESPASA DOS Y CIA. LTDA. are the following (Table 11):
13. The partners of INVERSIONES LA ESPASA DOS S.A. are the following Table 12):
9. The partners of INVERSIONES PRIESCA DOS Y CIA. LTDA. are the following (Table 8):
TABLE 7
Shareholder PercentageInversiones Nueva CostaVerde Aeronáutica Dos S.A. 100%
TABLE 8
Shareholder Percentage
Ignacio Cueto 99%
Others 1%
10. The partners of INVERSIONES CARAVIA DOS Y CIA. LTDA. are the following (Table 9):
TABLE 9
Shareholder Percentage
Juan José Cueto 99%
Others 1%
TABLE 10
Shareholder Percentage
Enrique Cueto 99%
Others 1%
TABLE 11
Partners Percentage
Inversiones La Espasa Dos S.A. 99%
María Esperanza Alcaíno Cueto Uno y Cia. Ltda. 1%
TABLE 12Shareholder Percentage
Inmobiliaria e Inversiones La Espasa Limitada 99%
María Esperanza Alcaíno Cueto 1%Uno y Compañía Limitada
Property Ownership Structure and Main Shareholders
7. The shareholders of INVERSIONES NUEVA COSTA VERDE AERONÁUTICA LIMITADA are the following (Table 6):
TABLE 6
Partners Percentage Main partner
Costa Verde 99.99% Inversiones Costa VerdeAeronáutica S.A. Aeronáutica S.A. (77.97%)
Inversiones Costa 0.01% Inmobiliaria & Inversiones El Verde Limitada Fano Limitada, Inmobiliaria & Inversiones Caravia Limitada e Inmobiliaria & Inversiones Priesca Limitada (33.33% each)
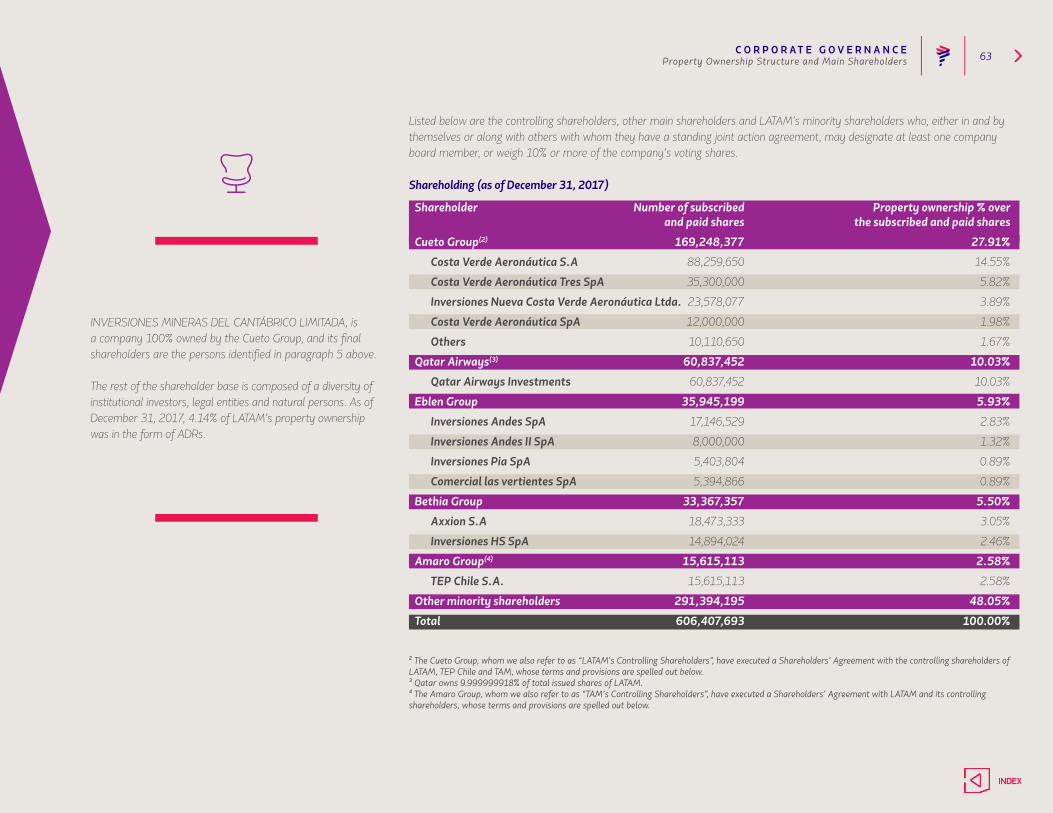
C O R P O R AT E G O V E R N A N C E 63
INVERSIONES MINERAS DEL CANTÁBRICO LIMITADA, is a company 100% owned by the Cueto Group, and its final shareholders are the persons identified in paragraph 5 above.
The rest of the shareholder base is composed of a diversity of institutional investors, legal entities and natural persons. As of December 31, 2017, 4.14% of LATAM’s property ownership was in the form of ADRs.
2 The Cueto Group, whom we also refer to as “LATAM’s Controlling Shareholders”, have executed a Shareholders’ Agreement with the controlling shareholders of LATAM, TEP Chile and TAM, whose terms and provisions are spelled out below.3 Qatar owns 9.999999918% of total issued shares of LATAM.4 The Amaro Group, whom we also refer to as “TAM’s Controlling Shareholders”, have executed a Shareholders’ Agreement with LATAM and its controlling shareholders, whose terms and provisions are spelled out below.
Listed below are the controlling shareholders, other main shareholders and LATAM’s minority shareholders who, either in and by themselves or along with others with whom they have a standing joint action agreement, may designate at least one company board member, or weigh 10% or more of the company’s voting shares.
Shareholding (as of December 31, 2017)
Property Ownership Structure and Main Shareholders
Shareholder Number of subscribed Property ownership % over and paid shares the subscribed and paid shares
Cueto Group(2) 169,248,377 27.91%
Costa Verde Aeronáutica S.A 88,259,650 14.55%
Costa Verde Aeronáutica Tres SpA 35,300,000 5.82%
Inversiones Nueva Costa Verde Aeronáutica Ltda. 23,578,077 3.89%
Costa Verde Aeronáutica SpA 12,000,000 1.98%
Others 10,110,650 1.67%
Qatar Airways(3) 60,837,452 10.03%
Qatar Airways Investments 60,837,452 10.03%
Eblen Group 35,945,199 5.93%
Inversiones Andes SpA 17,146,529 2.83%
Inversiones Andes II SpA 8,000,000 1.32%
Inversiones Pia SpA 5,403,804 0.89%
Comercial las vertientes SpA 5,394,866 0.89%
Bethia Group 33,367,357 5.50%
Axxion S.A 18,473,333 3.05%
Inversiones HS SpA 14,894,024 2.46%
Amaro Group(4) 15,615,113 2.58%
TEP Chile S.A. 15,615,113 2.58%
Other minority shareholders 291,394,195 48.05%
Total 606,407,693 100.00%
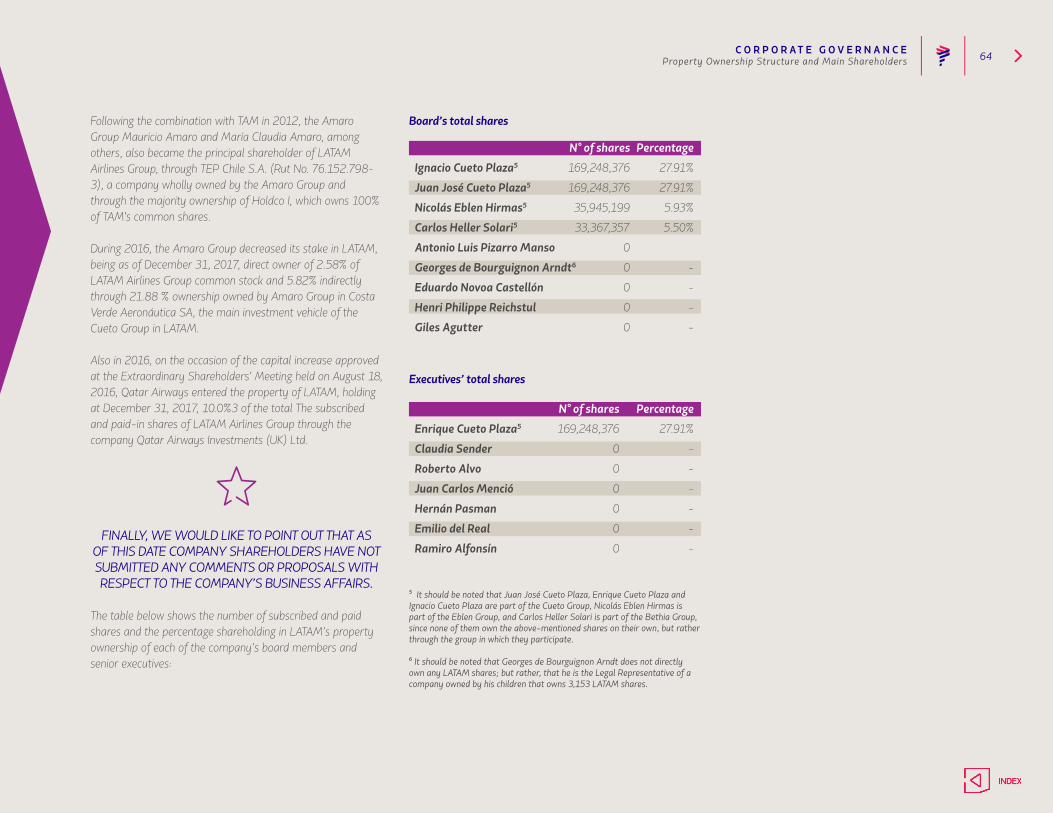
C O R P O R AT E G O V E R N A N C E 64
Following the combination with TAM in 2012, the Amaro Group Mauricio Amaro and María Claudia Amaro, among others, also became the principal shareholder of LATAM Airlines Group, through TEP Chile S.A. (Rut No. 76.152.798-3), a company wholly owned by the Amaro Group and through the majority ownership of Holdco I, which owns 100% of TAM's common shares.
During 2016, the Amaro Group decreased its stake in LATAM, being as of December 31, 2017, direct owner of 2.58% of LATAM Airlines Group common stock and 5.82% indirectly through 21.88 % ownership owned by Amaro Group in Costa Verde Aeronáutica SA, the main investment vehicle of the Cueto Group in LATAM.
Also in 2016, on the occasion of the capital increase approved at the Extraordinary Shareholders' Meeting held on August 18, 2016, Qatar Airways entered the property of LATAM, holding at December 31, 2017, 10.0%3 of the total The subscribed and paid-in shares of LATAM Airlines Group through the company Qatar Airways Investments (UK) Ltd.
FINALLY, WE WOULD LIKE TO POINT OUT THAT AS OF THIS DATE COMPANY SHAREHOLDERS HAVE NOT SUBMITTED ANY COMMENTS OR PROPOSALS WITH RESPECT TO THE COMPANY’S BUSINESS AFFAIRS.
The table below shows the number of subscribed and paid shares and the percentage shareholding in LATAM’s property ownership of each of the company’s board members and senior executives:
Board’s total shares
N° of shares Percentage
Ignacio Cueto Plaza5 169,248,376 27.91%
Juan José Cueto Plaza5 169,248,376 27.91%
Nicolás Eblen Hirmas5 35,945,199 5.93%
Carlos Heller Solari5 33,367,357 5.50%
Antonio Luis Pizarro Manso 0
Georges de Bourguignon Arndt6 0 -
Eduardo Novoa Castellón 0 -
Henri Philippe Reichstul 0 -
Giles Agutter 0 -
5 It should be noted that Juan José Cueto Plaza, Enrique Cueto Plaza and Ignacio Cueto Plaza are part of the Cueto Group, Nicolás Eblen Hirmas is part of the Eblen Group, and Carlos Heller Solari is part of the Bethia Group, since none of them own the above-mentioned shares on their own, but rather through the group in which they participate.
6 It should be noted that Georges de Bourguignon Arndt does not directly own any LATAM shares; but rather, that he is the Legal Representative of a company owned by his children that owns 3,153 LATAM shares.
Property Ownership Structure and Main Shareholders
Executives’ total shares
N° of shares Percentage
Enrique Cueto Plaza5 169,248,376 27.91%
Claudia Sender 0 -
Roberto Alvo 0 -
Juan Carlos Menció 0 -
Hernán Pasman 0 -
Emilio del Real 0 -
Ramiro Alfonsín 0 -
C O R P O R AT E G O V E R N A N C E 65
SHAREHOLDERS’ AGREEMENTFollowing the combination between LAN and TAM in June 2012, LAN Airlines S.A. was transformed into "LATAM Airlines Group S.A." and TAM continues to exist as a subsidiary Holdco I and LATAM. In order to execute this combination, TAM’s controlling shareholders created four new closely-held stock companies pursuant to Chilean law: TEP Chile, Holdco I, Holdco II and Sister Holdco. Upon execution of the above-referred transaction, Holdco II and Sister Holdco ceased to exist.
Prior to such business combination, LATAM Airlines Group and its controlling shareholders executed several shareholders’ agreements with TAM, its shareholders (acting through TEP Chile) and Holdco I, thus establishing agreements and restrictions related to corporate governance in an attempt to balance the interests of the LATAM Airlines Group, as the owner of substantially all economic rights in TAM, and TAM’s controlling shareholders, as the continuing controlling shareholders of TAM pursuant to Brazilian law. In order to achieve these objectives, the various shareholders’ agreements prohibited undertaking certain actions and making important corporate decisions without the prior approval of a qualified majority of its shareholders and/or the Board of Directors of Holdco I or TAM. Moreover, these shareholders’ agreements also establish the parties’ covenants regarding the governance and management of the LATAM Airlines Group, subsequent to the combination of LAN and TAM businesses.
THE LATAM GROUP’S GOVERNANCE AND MANAGEMENT
Insofar as the governance and management of the LATAM Group is concerned, there are different shareholders’ agreements:1. Shareholders’ agreement of the controlling group: executed
between the controlling shareholders of LATAM and TEP Chile, establishing agreements with respect to the corporate governance, control and operation of LATAM, Holdco I, TAM and their respective subsidiaries. It also
governs the votes and transfers of the ordinary shares of the LATAM Airlines Group and the voting shares of Holdco I owned by TEP Chile.
2. Shareholders’ agreement between the LATAM Airlines Group and TEP: executed between LATAM and TEP Chile; wherein, among other subject matters, it establishes agreements regarding the corporate governance, management and operation of LATAM. It also governs the relationships between LATAM and other LATAM Group members.
3. Shareholders’ agreement of Holdco I: executed between LATAM, Holdco I and TEP Chile establishing agreements with respect to the corporate governance, management and operation of Holdco I, as well as the votes and transfer of the voting shares of Holdco I.
4. Shareholders’ agreement of TAM: executed between LATAM, Holdco I, TAM and TEP Chile, establishing the agreements related to the corporate governance, management and operation of TAM and its subsidiaries.
Following the combination of the business of LAN and TAM, the Holdco I and the TAM shareholders’ agreements establish the covenants between the parties with respect to
the governance and management of Holdco I, TAM and its subsidiaries (collectively, the “TAM Group”).
Following are the key provisions of the Shareholders’ agreements referred to in paragraphs 1 and 2 above. It is important to note, however, that the rights and obligations of the members of the Controlling Group are indeed governed by the terms and conditions of such shareholders’ agreements and not by the summary of any of such agreements contained in this annual report.
BOARD MEMBERSHIP OFTHE LATAM AIRLINES GROUP
Since April 2017, there no restrictions in the Shareholders agreement in regards to the Board Member of LATAM Airlines Group. Once chosen the board members, in compliance with the Chilean regulation, LATAM Airlines Group’s board has the right to designate any of its members as the Chairman thereof, in compliance the governing statues. Thereby, in May 2017, Mr. Ignacio Cueto Plaza was voted Chairman of the Board. In April 2017, Mr. Mauricio Amaro left the Board of LATAM Airlines Group, with Mr. Henri Philippe Reichstul being re-elected as board member in April 2017 with the votes of TEP Chile S.A., in compliance with the local regulation.
Property Ownership Structure and Main Shareholders
C O R P O R AT E G O V E R N A N C E 66
MANAGEMENT OF THE LATAM AIRLINES GROUP
In June 2012, Enrique Cueto Plaza became LATAM’s CEO ("LATAM CEO"). The position of LATAM CEO is the top-ranking position in the LATAM Airlines Group, who reports directly to the LATAM’s Board of Directors. The LATAM CEO is in charge of overall supervision, direction and control of the LATAM Airlines Group’s business and certain other responsibilities set forth in the Shareholders’ Agreement of the LATAM Airlines Group and TEP. Upon the eventual departure of LATAM’s current CEO, the LATAM Board of Directors will appoint his successor after receiving a recommendation from the Leadership Committee.
THE MAIN HEADQUARTERS OF THE LATAM AIRLINES GROUP ARE STILL LOCATED IN SANTIAGO, CHILE.
Following are the key provisions of the Shareholders’ agreements referred to in the preceding paragraphs 3 and 4. It is important to note, however, that the rights and obligations of the members of the Controlling Group are indeed governed
by the terms and conditions of such shareholders’ agreements and not by the summary of any of such agreements contained in this a.
BOARD MEMBERSHIP OFHOLDCO I AND TAM
The shareholders’ agreement of Holdco I and the shareholders’ agreement of TAM provide, in general terms, identical board memberships and the same Holdco I and TAM CEO; whereupon LATAM appoints two board members and TAM appoints four board members (including the Chairman of the Board).
Maria Cláudia Oliveira Amaro resigned from her position as board member on September 8, 2014 and in her replacement, the Board appointed, Mr. Henri Philippe Reichstul. TAM’s Board membership was totally renewed on April 2015.
The shareholders’ agreement of the controlling group establishes that the persons elected by or on behalf of LATAM’s controlling shareholders or TAM’s controlling shareholders, as board members of LATAM’s Board of Directors, will also serve as members of the Board of Directors of Holdco I and TAM.
MANAGEMENT OF HOLDCO I AND TAM
The affairs and day-to-day business of Holdco I shall be managed by the CEO of the TAM Group under the supervision of the Board of Directors of Holdco I. The affairs and day-to-day business of TAM will be managed by the Board of Directors of TAM under the supervision of the Board of Directors of TAM. The "TAM Board" shall be comprised of the TAM Group’s CEO, TAM’s CFO, TAM’s COO and TAM’s CCO. Currently, the position of TAM CEO is being performed by Ms. Claudia Sender. The TAM Group’s CEO will be in charge of overall supervision, direction and control over the business and operations of the TAM Group (on matters not related to the LATAM Group’s international passenger business) and will perform all orders and resolutions issued by TAM board members. The initial TAM CEO, “CFO of TAM’S CFO” has been
jointly appointed by LATAM and TEP Chile and any successor of the CFO shall be designated by TEP Chile from among three candidates proposed by LATAM. The TAM COO, “TAM’s COO”, and the commercial manager of TAM, “TAM’s CCO”, shall be jointly appointed and recommended to TAM’s Board of Directors by the CEO of the TAM Group and TAM’s CFO; additionally, he/she must be approved by TAM’s Board of Directors. These shareholders’ agreements also govern the composition of the board of directors of TAM’s subsidiaries.
FOLLOWING THE COMBINATION, TAM STILL HAS ITS MAIN HEADQUARTERS LOCATED IN SÃO
PAULO, BRAZIL.
ACTIONS REQUIRING QUALIFIED MAJORITY VOTES
Certain actions of Holdco I or TAM require approval by a qualified majority of the board or the shareholders of Holdco I or TAM; which, indeed require the approval of LATAM and TEP Chile before such actions can be carried out.
Those actions requiring qualified majority votes by the boards of Holdco I or TAM are the following:
• approving the annual budget and business plan and the multi-year business (collectively known as the "Approved Plans"), and also the amendments to these plans;
• carrying out or agreeing to carry out any action that causes, or that may reasonably cause, individually or in aggregate form any capital, operational or other costs of any TAM company and its subsidiaries greater than (i) the lesser of 1% of revenues or 10% of the profits under the Approved Plans, with respect to actions affecting income statement items; or (ii) the lesser of 2% of assets or 10% of cash and cash equivalents (as defined by the IFRS) as established
Property Ownership Structure and Main Shareholders
C O R P O R AT E G O V E R N A N C E 67
in the provisions of the Approved Plans and in effect, in relation to actions affecting the cash flow statement;
• the creation, disposal or admission of new shareholders in one of the subsidiaries of the relevant company, except to the extent that it is expressly contemplated in the Approved Plans;
• approving the acquisition, disposal, modification or encumbrance by any TAM company of any assets above $15 million or of any share value or securities convertible into shares of any TAM company or of the Company, except to the extent that it is expressly contemplated in the Approved Plans;
• approving any investment in assets not related to the corporate purpose of any TAM company, except to the extent that it is expressly contemplated in the Approved Plans;
• executing any contract amount in excess of $15 million, except to the extent that it is expressly contemplated in the Approved Plans;
• executing any contract related to the distribution of profits, company associations, business collaborations, alliance memberships, code-sharing agreements, with the exception of those approved in the business plans and budget, except to the extent that they are expressly contemplated in the Approved Plans;
• setting, modifying or waiving any right or claim of a relevant company or its subsidiaries in excess of $15 million, except to the extent that it is expressly contemplated in the Approved Plans;
• starting, participating in, committing or establishing any important action with respect to any litigation or legal proceeding in excess of $15 million, related to the relevant company, except to the extent that it is expressly contemplated in the Approved Plans;
• approving the execution, modification, termination or ratification of agreements with third parties, except to the extent that they are expressly contemplated in the Approved Plans;
• approving any financial statement, modifications, or any accounting policy, regarding dividends or taxes relevant to the company;
• approving the granting of any interest of securities or guarantees of third party obligations;
• appointing executives other than the CEO of Holdco I or the Board of Directors of TAM or re-electing TAM’s current CEO or CFO; and
• approving any voting of the relevant company or its subsidiaries in their capacity as shareholders.
Those actions requiring qualified majority votes by the shareholders are the following:
• approving any modification of the bylaws of any relevant company or its subsidiaries in relation to the following subject matters: (i) corporate objectives; (ii) corporate equity capital; (iii) rights inherent to each class of shares and their shareholders; (iv) the powers of ordinary shareholder meetings or limitations to the powers of the board of directors; (vi) the deadline; (vii) the change of the main headquarters of a relevant company; (viii) the composition, powers and commitments of the management of any relevant company; and dividends and other distributions;
• approving the dissolution, settlement or liquidation of a relevant company;
• approving the transformation, merger, division or any type of corporate reorganization of a relevant company;
• paying or distributing dividends or any other type of distribution to shareholders;
• approving the issue, withdrawal or amortization of debt instruments, shares or convertible securities;
• approving a disposal plan for the sale, encumbrance or other involving 50% or more of the assets, as determined by the previous-year balance sheet of Holdco I;
• approving the disposal for the sale, encumbrance or other involving over 50% of the assets of a Holdco I subsidiary representing at least 20% of Holdco I or approving to sell, encumber or dispose of shares in a manner such that Holdco I would lose control.
• approving the concession of interests over instruments of guarantees toward guaranteeing obligations in excess of
50% of the assets of a relevant company; and• approving the execution, modification, terms or ratification
of acts or agreements with related parties, but only in those cases in which the applicable law requires the approval of such matters.
VOTING AGREEMENTS, TRANSFERS AND OTHER AGREEMENTS.
The controlling group of LATAM and TEP Chile has agreed, in the Shareholders’ Agreement of the Controlling Group, to vote their respective ordinary LATAM Airlines Group shares as follows:
• until that moment, TEP Chile sells any of its ordinary LAN shares (other than the exempt shares, as defined herein below, and owned by TEP Chile), the Controlling Group of LATAM Airlines Group will vote its ordinary LATAM Airlines Group shares to elect to the Board of Directors of LATAM Airlines Group any person designated by TEP Chile, unless TEP Chile owns enough ordinary shares of LATAM Airlines Group in order to directly elect two board members of the
Property Ownership Structure and Main Shareholders
C O R P O R AT E G O V E R N A N C E 68
LATAM Airlines Group; • the parties agree to vote their ordinary LATAM Airlines
Group shares to support the other parties in removing or replacing board members or others designated by the Board of LATAM Airlines Group;
• the parties agree to consult among them and make use of their good faith efforts to achieve agreements and act jointly in all actions (except in those actions that require majority approval pursuant to the Chilean law) and be considered by the Board of Directors of the LATAM Airlines Group or by the shareholders of the LATAM Airlines Group;
• the parties agree to maintain the size of the Board of Directors of the LATAM Airlines Group at a total of nine (9) board members and maintain the quorum required by the majority of the Board of Directors of the LATAM Airlines Group; and
• in case that, after endeavoring in good faith efforts aimed at reaching an agreement with respect to any action requiring a qualified majority vote pursuant to the Chilean law and a period of mediation, the parties do not reach such agreement, then, TEP Chile has agreed to give its vote to the subject matter requiring a qualified majority vote as indicated by the controlling shareholders of the LATAM Airlines Group; which we refer to as “direct vote”.
The number of TEP Chile “exempt shares” means that the number of ordinary shares of the LATAM Airlines Group that TEP Chile owns immediately after the effective date in excess of 12.5% of the valid ordinary shares of LATAM Airlines Group shall be determined on the basis of a total dilution.
THE PARTIES TO THE HOLDCO I SHAREHOLDERS’ AGREEMENT AND TO THE TAM SHAREHOLDERS’
AGREEMENT HAVE AGREED TO VOTE THEIR HOLDCO I VOTING SHARES AND TAM SHARES SO AS
TO MAKE EFFECTIVE THE AGREEMENTS RELATED TO THE ABOVE-DISCUSSED REPRESENTATION OF
THE BOARD OF DIRECTORS OF TAM.
RESTRICTIONS TO THE TRANSFERS.
Pursuant to the Shareholders’ Agreement of the Controlling Group, the controlling shareholders of the LATAM Airlines Group and TEP Chile are subject to certain restrictions regarding the sale, transfer and encumbrance of the ordinary shares of the LATAM Airlines Group and (only in the case of TEP Chile) the voting shares of Holdco I. With the exception of a limited amount of the ordinary shares of the LATAM Airlines Group, neither the controlling shareholders of the LATAM Airlines Group nor those of TEP Chile are authorized to sell the ordinary shares of the LATAM Airlines Group, nor can TEP Chile sell its shareholding rights to Holdco I until June 2015. Subsequently, the sale of the ordinary shares of the LATAM Airlines Group by any of the parties shall be allowed, subject to (i) certain limitations of volume and frequency of such sale, and (ii) only in the case of TEP Chile, the latter company must meet certain minimum property ownership requirements. After June 2022, TEP Chile shall be entitled to sell all its shares of the LATAM Airlines Group and shareholding rights over Holdco I in one block, subject to the following conditions: (i) LATAM Board’s approval of the assignee; (ii) that the sale does not have an adverse effect; and (iii) that the preferred purchase option be in favor of the controlling shareholders of the LATAM Airlines
Property Ownership Structure and Main Shareholders
C O R P O R AT E G O V E R N A N C E 69
Group; conditions to which we refer, collectively, as “block sale provisions”. An “adverse effect” is so defined in the Shareholders’ Agreement of the Controlling Group as a significant adverse effect in the capacity of Holdco I to receive the total benefits of the property ownership of TAM and its subsidiaries in order to operate the airline business worldwide. The controlling group of the LATAM Airlines Group has agreed to transfer all the voting shares of Holdco I acquired pursuant to LATAM’s preferred purchase option, for the same price paid for such shares.
Additionally, TEP Chile is entitled to sell as of June 2015 all the ordinary shares of the LATAM Airlines Group and voting shares of Holdco I, subject to meeting the block sale clause, should a liberation event (as described previously) should occur or if TEP Chile is required to exercise one or more directed votes during any 24-month period in two (consecutive or not) shareholders’ meetings of the LATAM Airlines Group held at least 12 months apart, and if the LATAM Airlines Group would not have totally exercised the conversion of options described previously. A “disclosure event” will occur if: (i) there is a capital increase of the LATAM Airlines Group; (ii) TEP Chile does not exercise all its preferred rights granted pursuant to the applicable Chilean law with respect to the capital increase in relation to all of LATAM Airlines Group’s restricted ordinary shares; and, (iii) after completing the capital increase, the person designated by TEP Chile for the voting of the Board of Directors of the LATAM Airlines Group with the collaboration of the Controlling Group of the LATAM Airlines Group, is not elected as board member of the LATAM Airlines Group.
Additionally, after June 22, 2022 and before the capitalization date of the entire property (as described below under Section “Conversion option”), TEP Chile could sell all or part of its LATAM Airlines Group’s ordinary shares, subject to: (i) the preferred option right in favor of LATAM’s controlling shareholders; and (ii) the restrictions to the sale of ordinary shares of the LATAM Airlines Group more than once during a 12-month period.
THE SHAREHOLDERS’ AGREEMENT OF THE CONTROLLING GROUP PROVIDES CERTAIN
EXCEPTIONS TO THESE TRANSFER RESTRICTIONS FOR CERTAIN PLEDGED SHARES OF THE LATAM
AIRLINES GROUP REALIZED BY THE PARTIES AND FOR TRANSFERS TO SUBSIDIARY COMPANIES,
IN EACH CASE OPEN TO CERTAIN LIMITED CIRCUMSTANCES.
Additionally, TEP Chile accepted, in the Shareholders’ Agreement of Holdco I, not to vote its Holdco I voting shares, or take any action in support of any transfer on the part of Holdco I of shares or convertible securities into shares issued by them or by TAM or by any of its subsidiaries without LATAM’s prior written consent.
RESTRICTIONS TO TAM SHARES TRANSFERS
In the Shareholders’ Agreement of Holdco I, LATAM agreed not to sell or transfer TAM shares to any person (other than our subsidiaries), for as long as TEP Chile owns Holdco I voting shares. Without prejudice of the foregoing, LATAM shall be entitled to carry out such sales or transfers if, simultaneously with such sales or transfers, LATAM (or its assignee) would acquire all of Holdco I’s voting shares owned by TEP Chile for an amount equal to TEP Chile’s then in effect taxable base with respect to such shares and pay any cost in which TEP Chile might have to incur in order to carry out such sale or transfer. TEP Chile has irrevocable assigned to LATAM the assignable right to acquire all of Holdco I’s voting shares owned by TEP Chile related to such sale.
CONVERSION OPTION
Pursuant to the Shareholders’ Agreement of the Controlling Group and the Shareholders’ Agreement of Holdco I, LATAM
is unilaterally entitled to convert our non-voting Holdco I shares into Holdco I voting shares up to the maximum allowed by law, and to increase our representation in the Boards of Directors of both TAM and Holdco I as permitted by the Brazilian laws that govern foreign property ownerships and by other applicable laws if the conversion would not have an adverse effect (as previously defined in the section on “Transfer Restrictions”).
During or after June 2022, and after LATAM would have totally converted all its Holdco I non-voting shares into Hold I voting shares, as allowed by Brazilian laws and other applicable laws, LATAM shall be entitled to acquire all of Holdco I’s voting shares owned by TAM’s controlling shareholders for an amount equal to their taxable base with respect to such shares and pay any cost that might be incurred in order to materialize such sale; an amount to which we shall refer as “sale consideration”. If LATAM does not exercise its right to acquire such shares on a timely basis, or if, after June 2022 LATAM should be entitled, pursuant to Brazilian laws and other applicable laws, to convert all of
Property Ownership Structure and Main Shareholders
C O R P O R AT E G O V E R N A N C E 70
Holdco I’s non-voting shares into Holdco I voting shares, and if such conversion would not have an adverse effect but we would not have exercised such right fully and totally during a specific period of time, then, the controlling shareholders of TAM would be entitled to offer us their Holdco I voting shares for an amount equal to the sale price.
ACQUISITION OF TAM’S SHARES.
The parties hereto have agreed that all acquisitions of TAM’s ordinary shares by the LATAM Airlines Group, Holdco I, TAM or any of their respective subsidiaries as of and after the effective date of business combination shall be carried out by Holdco I. Insofar as the main organs of Corporate Governance of the LATAM Airlines Group are concerned, they are: the Board of Directors and the Directors’ Committee (which, additionally, embodies the functions of Audit Committee for the purposes of the Sarbanes-Oxley Act of the United States of America), along with the Committees of Strategy, Finance, Leadership and Product, Brand and Frequent Flyer Program created following the association between LAN and TAM. The main powers of such corporate organs are specified below.
DIVIDENDSIn terms of dividends, the Company has established that they shall be equal to the minimum legally required; namely 30% of profits pursuant to current regulations. The foregoing is not inconsistent with the distribution of dividends over and above such mandatory minimum, in consideration of the peculiarities and circumstances of fact that might be perceived throughout the year.
Going forward, the Company does not expect any changes in its dividend distribution policy.
During the years 2014 and 2015, the Company did not show profits; consequently, no dividends were distributed. On May 18, 2017, the Company distributed a total dividend of US$20,766,119 charged to the profits of 2016.
Property Ownership Structure and Main Shareholders
C O R P O R AT E G O V E R N A N C E 71
LATAM Airlines Group’s Financial Policy aims for the following goals:• To ensure a minimum liquidity level for operations. To
preserve and maintain suitable cash flow levels to ensure that requirements for operations and growth are covered. To maintain a suitable level of credit lines with local and foreign banks to face contingencies.
• To keep an optimal debt level and profile that matches the growth of its operations, and considering the goal to minimize financing costs.
• Capitalize excess cash flow through financial investments that will guarantee a risk and liquidity level consistent with the Financial Investment Policy.
• To reduce the effects of market risks, such as variations in fuel prices, exchange rates, and interest rates on the Company’s net profit margin.
• To reduce Counterparty Risk through the diversification and limits on investments and transactions with counterparties.
• To maintain, at all times, a long-term view of the Company’s projected financial situation to anticipate situations of covenant breaches, low liquidity, deterioration of the financial ratios agreed with rating agencies, etc.
The Financial Policy delivers guidelines and restrictions to manage Liquidity and Financial Investment transactions, Financing Activities, and Market Risk Management.
LIQUIDITY AND FINANCIAL INVESTMENT POLICYDuring 2017, LATAM Airlines Group maintained suitable liquidity levels to hedge against potential external shocks and volatility, as well as the industry’s inherent cycles. Thus, it ended December 2017 with a liquidity ratio of 20.3% of total revenues for the last 12 months. This liquidity includes a revolving credit facility for a total of US$450 million with eleven financial institutions—both local and international—and was fully available at yearend.
Moreover, during 2017, a significant part of the pre-delivery payments, related to the Boeing and Airbus aircraft that LATAM will receive in the future, was financed with the
Financial Policy
T he Corporate Finance Department is responsible for managing the Company’s Financial Policy. This Policy makes it possible to effectively face changes in
conditions outside the business’ normal operation and thus maintain and anticipate a stable flow of funds to ensure the operation’s continuity.
Moreover, the Finance Committee, comprising the Executive Vice-Presidency and members of LATAM’s Board of Directors, meets periodically to review and propose to the Board the approval of issues that are not regulated by the Financial Policy.
Financial
C O R P O R AT E G O V E R N A N C E 72
Company’s own resources. The balance as at December 31, 2017, stood at US$276 million in pre-delivery payments funded through own resources.
WITH REGARD TO THE FINANCIAL INVESTMENT POLICY, THE GOAL IS TO CENTRALIZE INVESTMENT DECISIONS TO OPTIMIZE PROFITABILITY, ADJUSTED
FOR CURRENCY RISK, SUBJECT TO MAINTAINING SUITABLE SECURITY AND LIQUIDITY LEVELS.
Moreover, the aim is to manage risk through the diversification of counterparties, maturities, currencies, and instruments.
FINANCING POLICYThe scope of LATAM’s Financing Policy is to centralize financing activities and balance the assets’ useful life against debt maturities.
Throughout 2017, the Company succeeded in reducing the balance of its total gross debt by roughly US$713 million, explained by the payment of a debt maturity for about US$2.0 billion, and the issuing of new debt worth around US$1.3
billion. The main financing activities carried out during 2017 were related to debt restructuring, including the issuance of an international corporate bond for US$700 million in April at a rate of 6.875%, whose funds were used for general purposes of the Company. Likewise, in April, the Company paid the US$300 million principal of the bond issued by TAM Capital Inc, which was due that same month.
Moreover, during August, TAM issued an unsecured bond in Chile’s local market for approximately US$350 million denominated in UF (Unidades de Fomento), maturing in 2022 and 2028. The funds from this issuance were fully used to call TAM’s last corporate bond, worth US$500 million at a rate of 8.375% maturing in 2021, whereby the call option was exercised in September. The balance outstanding for the call came from other financing activities and the Company’s cash balance.
MOST OF THE INVESTMENTS THAT LATAM AIRLINES GROUP HAS MADE PERTAIN TO
THE FLEET ACQUISITION PROGRAMS, WHICH ARE GENERALLY FINANCED THROUGH A
COMBINATION OF OWN RESOURCES AND LONG-TERM STRUCTURED FINANCIAL DEBT.
Normally, LATAM finances between 80% and 85% of the value of the assets through bank loans, bonds covered by the export promotion agencies, or bonds secured by aircrafts such as the EETC, where the remaining part is funded through commercial loans or the Company’s own funds. The payment maturities of the various financing structures are mainly 12 years long. Moreover, LATAM contracts a significant percentage of its fleet acquisition commitments through operating leases as an additional source of financing.
During 2017, the whole fleet received accounted for operating leases, so there was no financing for the new fleet.
Financial Policy

C O R P O R AT E G O V E R N A N C E 73
As for short-term financing, at December 31, 2017, LATAM held 3% of its total debt in loans to exporters and importers to finance working capital needs.
Some of the Financing Policy’s other goals are to ensure a stable debt maturity and leasing commitment profile, including debt servicing and the payments on fleet leasing, which is consistent with LATAM’s operating cash flow.
MARKET RISK POLICYGiven the nature of its operations, LATAM Airlines Group is subject to market risks, such as: (i) fuel price risk, (ii) interest rate risk, and (iii) exchange rate risk. In order to hedge fully or partially against these risks, LATAM uses financial derivatives to reduce the adverse effects that these risks could cause. Market Risk management is carried out comprehensively and considers the correlation with each market factor to which LATAM is exposed. In order to do business with each counterparty, the company must have an approved line, and a signed framework agreement with the chosen one. The counterparties must have a Risk Rating issued by one of the international Risk Rating agencies that is equal to, or greater than the equivalent of an “A-” rating.
i. Fuel price risk:Variations in fuel prices depend significantly on oil supply and demand in the world, as well as on the decisions made by the Organization of the Petroleum Exporting Countries (“OPEC"), the refining capacity worldwide, inventory levels, and the occurrence of climatic or geopolitical events. LATAM purchases fuel for airplanes, known as Jet Fuel. In order to execute fuel hedges, there is a benchmark index on the international market for this core asset, which is Jet Fuel 54 US Gulf Coast. This index was mainly used by LATAM Airlines Group for its hedges during 2017.
LATAM also undertook hedging through NYMEX Heating Oil, whose core index is included the Fuel Hedging Policy, given the high correlation it was with the Jet Fuel 54.
The Fuel Hedging Policy sets a minimum and a maximum hedging range for the Company’s fuel consumption, based on the capacity to pass through fuel price variations to airfares, anticipated sales, and the competition scenario. Moreover, this Policy sets hedging zones, a premiums budget, and other strategic restrictions that are assessed and presented periodically before the LATAM Finance Committee.
With regard to fuel hedging instruments, the Policy makes it possible to contract combined Swaps and Options only for hedging purposes, and does not allow the net sale of options.
ii. Interest rate risk on cash flows:Interest rate variations depend largely on the state of the global economy. An improvement in the long-term economic outlook drives long-term interest rates upward, while a deterioration causes a drop due to market effects. However, when we consider government interventions, in a period of economic contraction, benchmark rates are usually decreased to boost aggregate demand by making credit more affordable and increasing production ( just as there are hikes in the benchmark rate in times of economic expansion).
The uncertainty surrounding how the market and the governments will behave, and thus, how the interest rate will change, leads to a risk related to LATAM’s debt subject to variable interest, its investments, and the new issuances it may make. Interest rate risk on existing debt is equivalent to future cash flow risk on financial instruments, given the interest rate fluctuations on the markets.
LATAM’s exposure to the risk from market interest rate fluctuations is mainly related to long-term obligations with variable rates.
In order to reduce the risk from an eventual hike in interest rates, LATAM Airlines Group has interest rate swap contracts. At December 31, 2017, the market value of interest rate derivatives positions totaled US$6.6 million (negative). The instruments approved in the Interest Rate Hedging Policy are interest rate Swaps and Options.
iii. Exchange rate risks:The functional currency used by the controlling company is the US dollar in terms of price-setting for its services, the composition of its statement of financial position, and the effects on the results of operations. There are two types of
Financial Policy
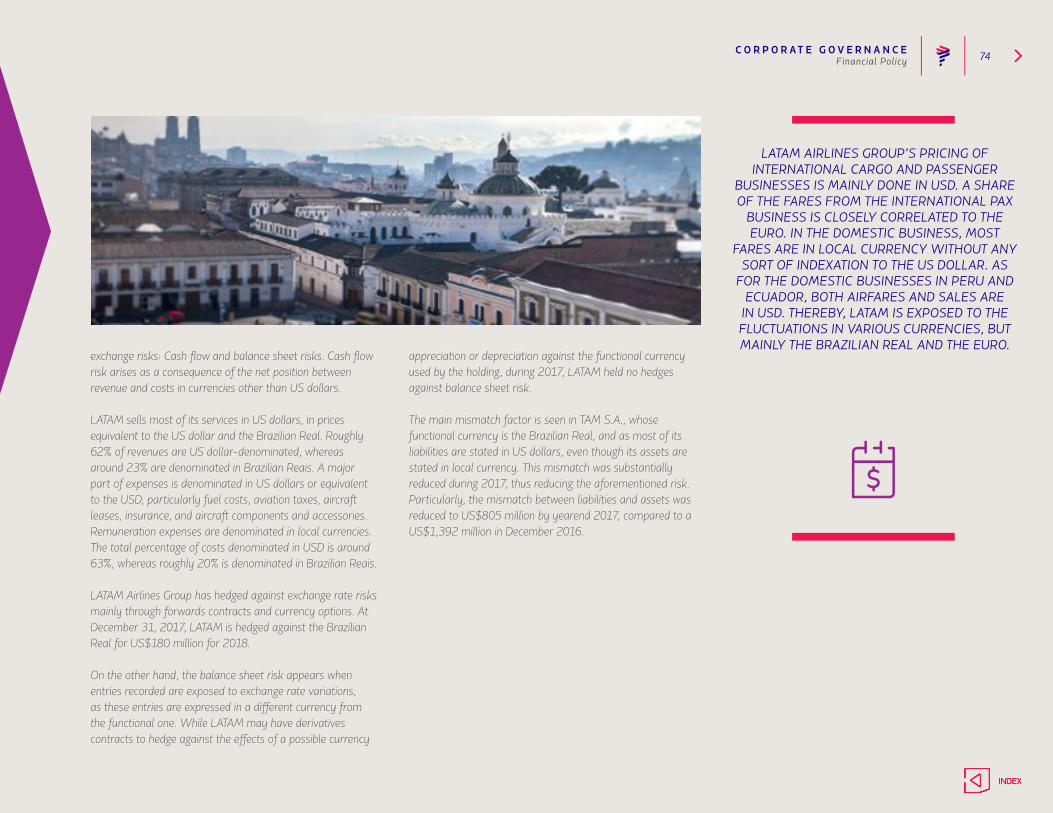
C O R P O R AT E G O V E R N A N C E 74Financial Policy
exchange risks: Cash flow and balance sheet risks. Cash flow risk arises as a consequence of the net position between revenue and costs in currencies other than US dollars.
LATAM sells most of its services in US dollars, in prices equivalent to the US dollar and the Brazilian Real. Roughly 62% of revenues are US dollar-denominated, whereas around 23% are denominated in Brazilian Reais. A major part of expenses is denominated in US dollars or equivalent to the USD, particularly fuel costs, aviation taxes, aircraft leases, insurance, and aircraft components and accessories. Remuneration expenses are denominated in local currencies. The total percentage of costs denominated in USD is around 63%, whereas roughly 20% is denominated in Brazilian Reais.
LATAM Airlines Group has hedged against exchange rate risks mainly through forwards contracts and currency options. At December 31, 2017, LATAM is hedged against the Brazilian Real for US$180 million for 2018.
On the other hand, the balance sheet risk appears when entries recorded are exposed to exchange rate variations, as these entries are expressed in a different currency from the functional one. While LATAM may have derivatives contracts to hedge against the effects of a possible currency
appreciation or depreciation against the functional currency used by the holding, during 2017, LATAM held no hedges against balance sheet risk.
The main mismatch factor is seen in TAM S.A., whose functional currency is the Brazilian Real, and as most of its liabilities are stated in US dollars, even though its assets are stated in local currency. This mismatch was substantially reduced during 2017, thus reducing the aforementioned risk. Particularly, the mismatch between liabilities and assets was reduced to US$805 million by yearend 2017, compared to a US$1,392 million in December 2016.
LATAM AIRLINES GROUP’S PRICING OF INTERNATIONAL CARGO AND PASSENGER
BUSINESSES IS MAINLY DONE IN USD. A SHARE OF THE FARES FROM THE INTERNATIONAL PAX
BUSINESS IS CLOSELY CORRELATED TO THE EURO. IN THE DOMESTIC BUSINESS, MOST
FARES ARE IN LOCAL CURRENCY WITHOUT ANY SORT OF INDEXATION TO THE US DOLLAR. AS
FOR THE DOMESTIC BUSINESSES IN PERU AND ECUADOR, BOTH AIRFARES AND SALES ARE
IN USD. THEREBY, LATAM IS EXPOSED TO THE FLUCTUATIONS IN VARIOUS CURRENCIES, BUT MAINLY THE BRAZILIAN REAL AND THE EURO.

LATAM is the biggest airlines group in Latin America, and one of the largest worldwide.
O P E R A -
T I O N S

O P E R AT I O N S 76
L ATAM Group’s international passenger operations include the regional flights within South America and the Caribbean, and long-haul flights between this
subcontinent and the rest of the world.
At December 2017, the Group serves 27 international destinations in 18 countries: five in the United States, six in Europe, 11 in other countries in Latin America and the Caribbean, four in Asia-Pacific, and one in the African continent, with a broad network of connections that no other airline in South America can offer.
Air operations in this period developed within a sound context, driven mainly by more stable currencies and the recovery of the Brazilian economy—the largest market in the region—after two consecutive years of contraction. As a result, significant improvements were achieved on the yields of the routes from Brazil to the US, that also benefited from the sharp adjustments in capacity carried out in 2016 and the first half of 2017, and Europe.
IN 2017, LATAM GROUP TRANSPORTED 16.1 MILLION PEOPLE IN INTERNATIONAL FLIGHTS,
A 6.3% INCREASE COMPARED TO 2016. CONSOLIDATED PASSENGER TRAFFIC (MEASURED IN RPK) GREW 4.7% COMPARED TO THE PREVIOUS YEAR, WHEREAS CAPACITY (MEASURED IN ASK) ROSE 3.8%. AS A RESULT, LOAD FACTOR SETTLED AT A SOUND 86.9% (AN INCREASE OF 0.7 BASIS
POINTS COMPARED TO 2016).
To develop its international operations, LATAM Group used a fleet comprising 120 aircraft, on average, during the period. In order to serve the regional routes, it operated 66 airplanes, mainly from the Airbus A320 family, whereas for long-haul flights, it used 54 airships including Boeing 767 and 787 (versions 8 and 9) and Airbus A350.
International Business
International
Thirteen new internationalroutes in 2017
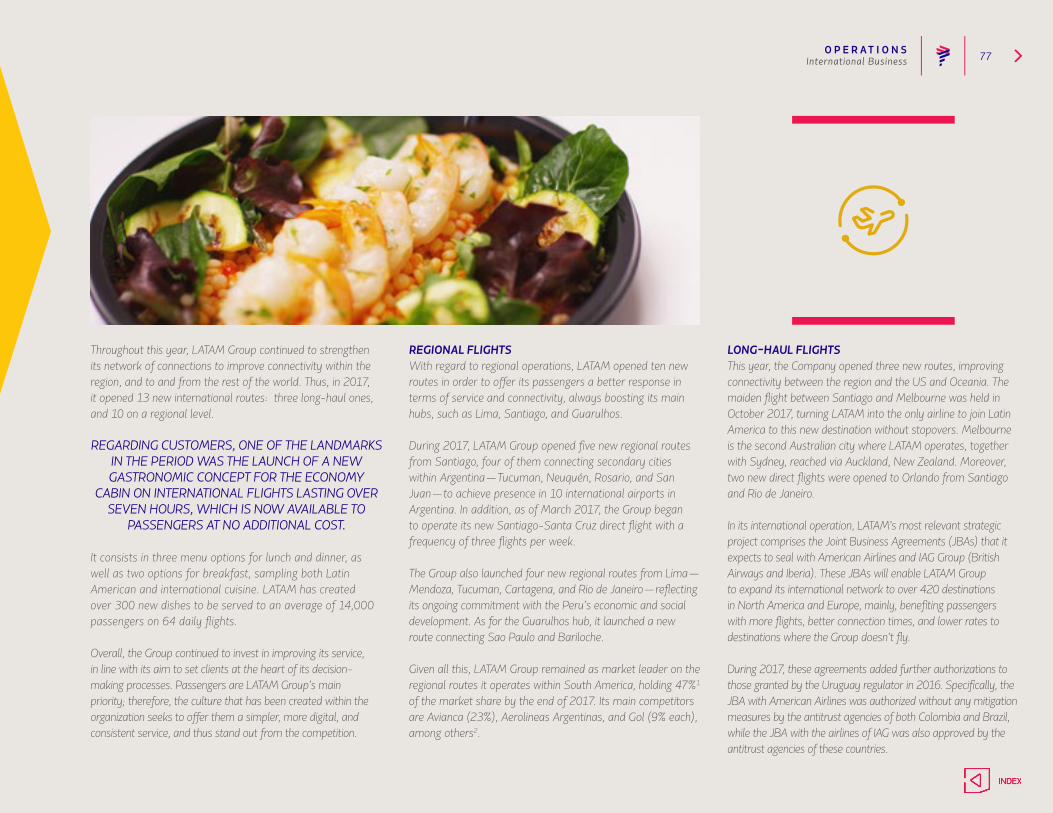
O P E R AT I O N S 77
Throughout this year, LATAM Group continued to strengthen its network of connections to improve connectivity within the region, and to and from the rest of the world. Thus, in 2017, it opened 13 new international routes: three long-haul ones, and 10 on a regional level.
REGARDING CUSTOMERS, ONE OF THE LANDMARKS IN THE PERIOD WAS THE LAUNCH OF A NEW GASTRONOMIC CONCEPT FOR THE ECONOMY
CABIN ON INTERNATIONAL FLIGHTS LASTING OVER SEVEN HOURS, WHICH IS NOW AVAILABLE TO
PASSENGERS AT NO ADDITIONAL COST.
It consists in three menu options for lunch and dinner, as well as two options for breakfast, sampling both Latin American and international cuisine. LATAM has created over 300 new dishes to be served to an average of 14,000 passengers on 64 daily flights.
Overall, the Group continued to invest in improving its service, in line with its aim to set clients at the heart of its decision-making processes. Passengers are LATAM Group’s main priority; therefore, the culture that has been created within the organization seeks to offer them a simpler, more digital, and consistent service, and thus stand out from the competition.
REGIONAL FLIGHTSWith regard to regional operations, LATAM opened ten new routes in order to offer its passengers a better response in terms of service and connectivity, always boosting its main hubs, such as Lima, Santiago, and Guarulhos.
During 2017, LATAM Group opened five new regional routes from Santiago, four of them connecting secondary cities within Argentina—Tucuman, Neuquén, Rosario, and San Juan—to achieve presence in 10 international airports in Argentina. In addition, as of March 2017, the Group began to operate its new Santiago-Santa Cruz direct flight with a frequency of three flights per week.
The Group also launched four new regional routes from Lima—Mendoza, Tucuman, Cartagena, and Rio de Janeiro—reflecting its ongoing commitment with the Peru’s economic and social development. As for the Guarulhos hub, it launched a new route connecting Sao Paulo and Bariloche.
Given all this, LATAM Group remained as market leader on the regional routes it operates within South America, holding 47%1 of the market share by the end of 2017. Its main competitors are Avianca (23%), Aerolineas Argentinas, and Gol (9% each), among others2.
LONG-HAUL FLIGHTS This year, the Company opened three new routes, improving connectivity between the region and the US and Oceania. The maiden flight between Santiago and Melbourne was held in October 2017, turning LATAM into the only airline to join Latin America to this new destination without stopovers. Melbourne is the second Australian city where LATAM operates, together with Sydney, reached via Auckland, New Zealand. Moreover, two new direct flights were opened to Orlando from Santiago and Rio de Janeiro.
In its international operation, LATAM’s most relevant strategic project comprises the Joint Business Agreements (JBAs) that it expects to seal with American Airlines and IAG Group (British Airways and Iberia). These JBAs will enable LATAM Group to expand its international network to over 420 destinations in North America and Europe, mainly, benefiting passengers with more flights, better connection times, and lower rates to destinations where the Group doesn’t fly.
During 2017, these agreements added further authorizations to those granted by the Uruguay regulator in 2016. Specifically, the JBA with American Airlines was authorized without any mitigation measures by the antitrust agencies of both Colombia and Brazil, while the JBA with the airlines of IAG was also approved by the antitrust agencies of these countries.
International Business
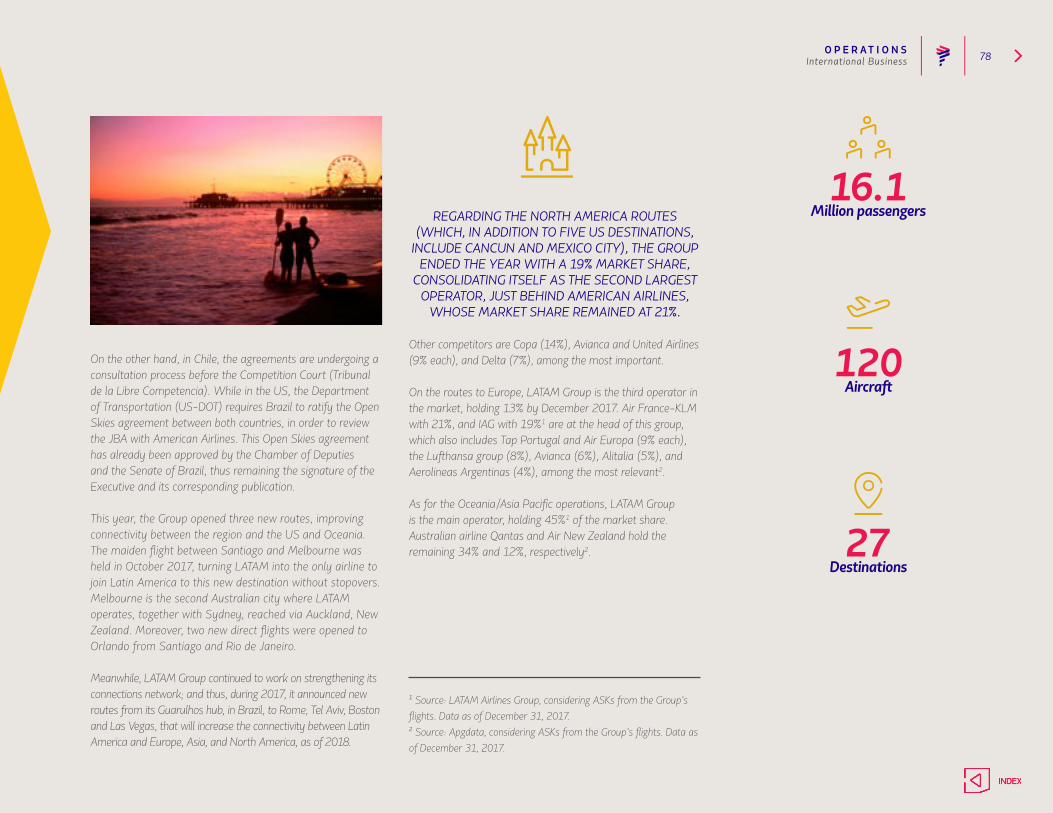
O P E R AT I O N S 78
On the other hand, in Chile, the agreements are undergoing a consultation process before the Competition Court (Tribunal de la Libre Competencia). While in the US, the Department of Transportation (US-DOT) requires Brazil to ratify the Open Skies agreement between both countries, in order to review the JBA with American Airlines. This Open Skies agreement has already been approved by the Chamber of Deputies and the Senate of Brazil, thus remaining the signature of the Executive and its corresponding publication.
This year, the Group opened three new routes, improving connectivity between the region and the US and Oceania. The maiden flight between Santiago and Melbourne was held in October 2017, turning LATAM into the only airline to join Latin America to this new destination without stopovers. Melbourne is the second Australian city where LATAM operates, together with Sydney, reached via Auckland, New Zealand. Moreover, two new direct flights were opened to Orlando from Santiago and Rio de Janeiro.
Meanwhile, LATAM Group continued to work on strengthening its connections network; and thus, during 2017, it announced new routes from its Guarulhos hub, in Brazil, to Rome, Tel Aviv, Boston and Las Vegas, that will increase the connectivity between Latin America and Europe, Asia, and North America, as of 2018.
REGARDING THE NORTH AMERICA ROUTES (WHICH, IN ADDITION TO FIVE US DESTINATIONS,
INCLUDE CANCUN AND MEXICO CITY), THE GROUP ENDED THE YEAR WITH A 19% MARKET SHARE,
CONSOLIDATING ITSELF AS THE SECOND LARGEST OPERATOR, JUST BEHIND AMERICAN AIRLINES,
WHOSE MARKET SHARE REMAINED AT 21%.
Other competitors are Copa (14%), Avianca and United Airlines (9% each), and Delta (7%), among the most important.
On the routes to Europe, LATAM Group is the third operator in the market, holding 13% by December 2017. Air France-KLM with 21%, and IAG with 19%1 are at the head of this group, which also includes Tap Portugal and Air Europa (9% each), the Lufthansa group (8%), Avianca (6%), Alitalia (5%), and Aerolineas Argentinas (4%), among the most relevant2. As for the Oceania/Asia Pacific operations, LATAM Group is the main operator, holding 45%1 of the market share. Australian airline Qantas and Air New Zealand hold the remaining 34% and 12%, respectively2.
Million passengers16.1
Aircraft120
Destinations27
International Business
1 Source: LATAM Airlines Group, considering ASKs from the Group’s flights. Data as of December 31, 2017.2 Source: Apgdata, considering ASKs from the Group’s flights. Data as of December 31, 2017.
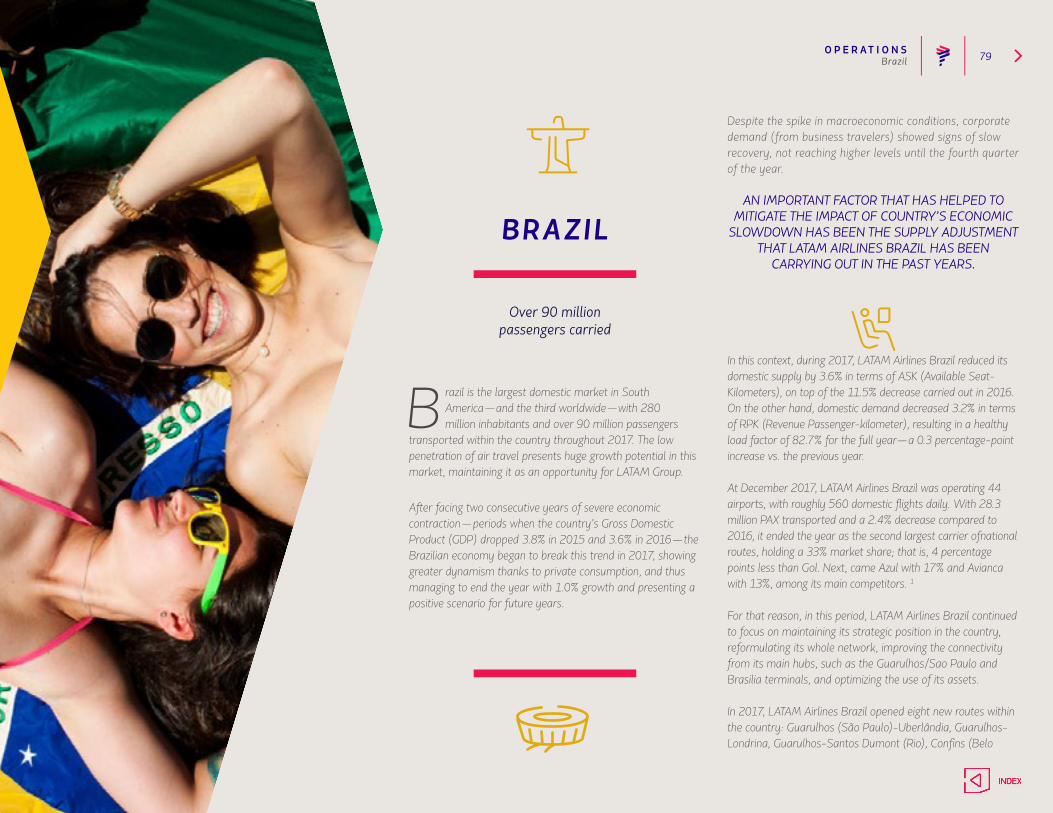
O P E R AT I O N S 79
B razil is the largest domestic market in South America—and the third worldwide—with 280 million inhabitants and over 90 million passengers
transported within the country throughout 2017. The low penetration of air travel presents huge growth potential in this market, maintaining it as an opportunity for LATAM Group.
After facing two consecutive years of severe economic contraction—periods when the country’s Gross Domestic Product (GDP) dropped 3.8% in 2015 and 3.6% in 2016—the Brazilian economy began to break this trend in 2017, showing greater dynamism thanks to private consumption, and thus managing to end the year with 1.0% growth and presenting a positive scenario for future years.
BRAZIL
Brazil
Over 90 millionpassengers carried
Despite the spike in macroeconomic conditions, corporate demand (from business travelers) showed signs of slow recovery, not reaching higher levels until the fourth quarter of the year.
AN IMPORTANT FACTOR THAT HAS HELPED TO MITIGATE THE IMPACT OF COUNTRY’S ECONOMIC
SLOWDOWN HAS BEEN THE SUPPLY ADJUSTMENT THAT LATAM AIRLINES BRAZIL HAS BEEN
CARRYING OUT IN THE PAST YEARS.
In this context, during 2017, LATAM Airlines Brazil reduced its domestic supply by 3.6% in terms of ASK (Available Seat-Kilometers), on top of the 11.5% decrease carried out in 2016. On the other hand, domestic demand decreased 3.2% in terms of RPK (Revenue Passenger-kilometer), resulting in a healthy load factor of 82.7% for the full year—a 0.3 percentage-point increase vs. the previous year.
At December 2017, LATAM Airlines Brazil was operating 44 airports, with roughly 560 domestic flights daily. With 28.3 million PAX transported and a 2.4% decrease compared to 2016, it ended the year as the second largest carrier ofnational routes, holding a 33% market share; that is, 4 percentage points less than Gol. Next, came Azul with 17% and Avianca with 13%, among its main competitors. 1
For that reason, in this period, LATAM Airlines Brazil continued to focus on maintaining its strategic position in the country, reformulating its whole network, improving the connectivity from its main hubs, such as the Guarulhos/Sao Paulo and Brasilia terminals, and optimizing the use of its assets.
In 2017, LATAM Airlines Brazil opened eight new routes within the country: Guarulhos (São Paulo)-Uberlândia, Guarulhos-Londrina, Guarulhos-Santos Dumont (Rio), Confins (Belo
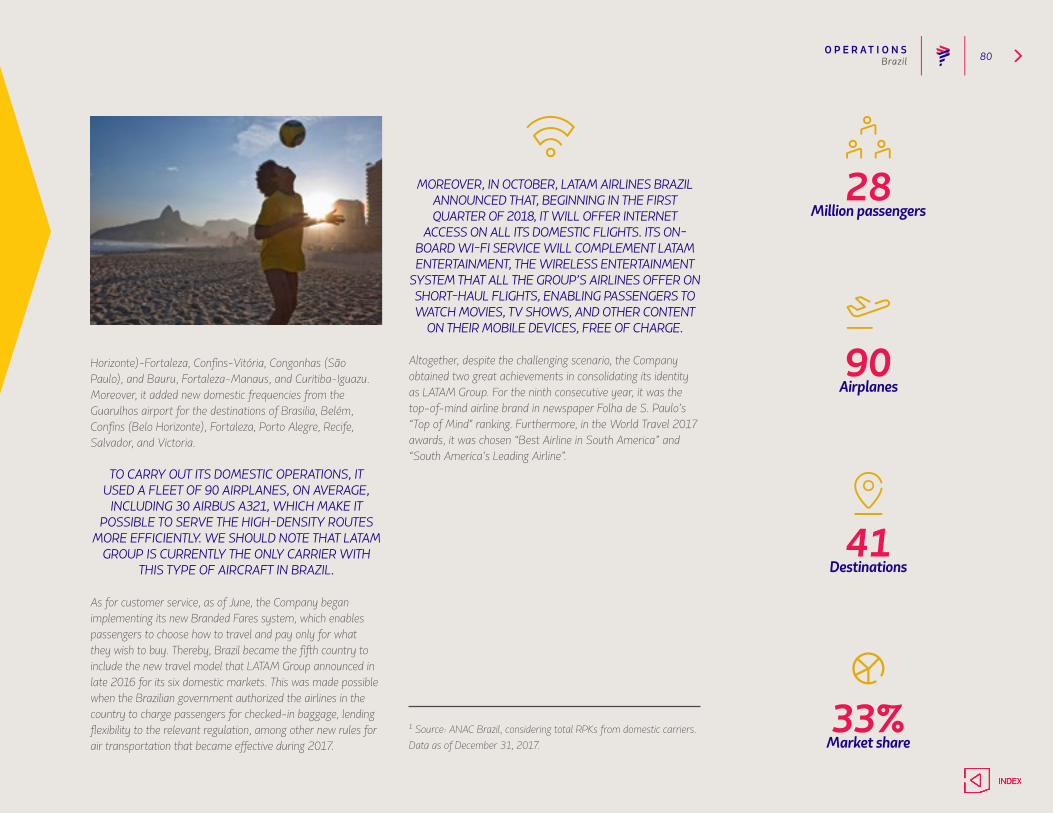
O P E R AT I O N S 80
Horizonte)-Fortaleza, Confins-Vitória, Congonhas (São Paulo), and Bauru, Fortaleza-Manaus, and Curitiba-Iguazu. Moreover, it added new domestic frequencies from the Guarulhos airport for the destinations of Brasilia, Belém, Confins (Belo Horizonte), Fortaleza, Porto Alegre, Recife, Salvador, and Victoria.
TO CARRY OUT ITS DOMESTIC OPERATIONS, IT USED A FLEET OF 90 AIRPLANES, ON AVERAGE,
INCLUDING 30 AIRBUS A321, WHICH MAKE IT POSSIBLE TO SERVE THE HIGH-DENSITY ROUTES
MORE EFFICIENTLY. WE SHOULD NOTE THAT LATAM GROUP IS CURRENTLY THE ONLY CARRIER WITH
THIS TYPE OF AIRCRAFT IN BRAZIL.
As for customer service, as of June, the Company began implementing its new Branded Fares system, which enables passengers to choose how to travel and pay only for what they wish to buy. Thereby, Brazil became the fifth country to include the new travel model that LATAM Group announced in late 2016 for its six domestic markets. This was made possible when the Brazilian government authorized the airlines in the country to charge passengers for checked-in baggage, lending flexibility to the relevant regulation, among other new rules for air transportation that became effective during 2017.
MOREOVER, IN OCTOBER, LATAM AIRLINES BRAZIL ANNOUNCED THAT, BEGINNING IN THE FIRST QUARTER OF 2018, IT WILL OFFER INTERNET
ACCESS ON ALL ITS DOMESTIC FLIGHTS. ITS ON-BOARD WI-FI SERVICE WILL COMPLEMENT LATAM ENTERTAINMENT, THE WIRELESS ENTERTAINMENT
SYSTEM THAT ALL THE GROUP’S AIRLINES OFFER ON SHORT-HAUL FLIGHTS, ENABLING PASSENGERS TO WATCH MOVIES, TV SHOWS, AND OTHER CONTENT
ON THEIR MOBILE DEVICES, FREE OF CHARGE.
Altogether, despite the challenging scenario, the Company obtained two great achievements in consolidating its identity as LATAM Group. For the ninth consecutive year, it was the top-of-mind airline brand in newspaper Folha de S. Paulo’s “Top of Mind" ranking. Furthermore, in the World Travel 2017 awards, it was chosen “Best Airline in South America” and “South America’s Leading Airline”.
Million passengers28
Airplanes90
Destinations41
Market share33%
Brazil
1 Source: ANAC Brazil, considering total RPKs from domestic carriers. Data as of December 31, 2017.
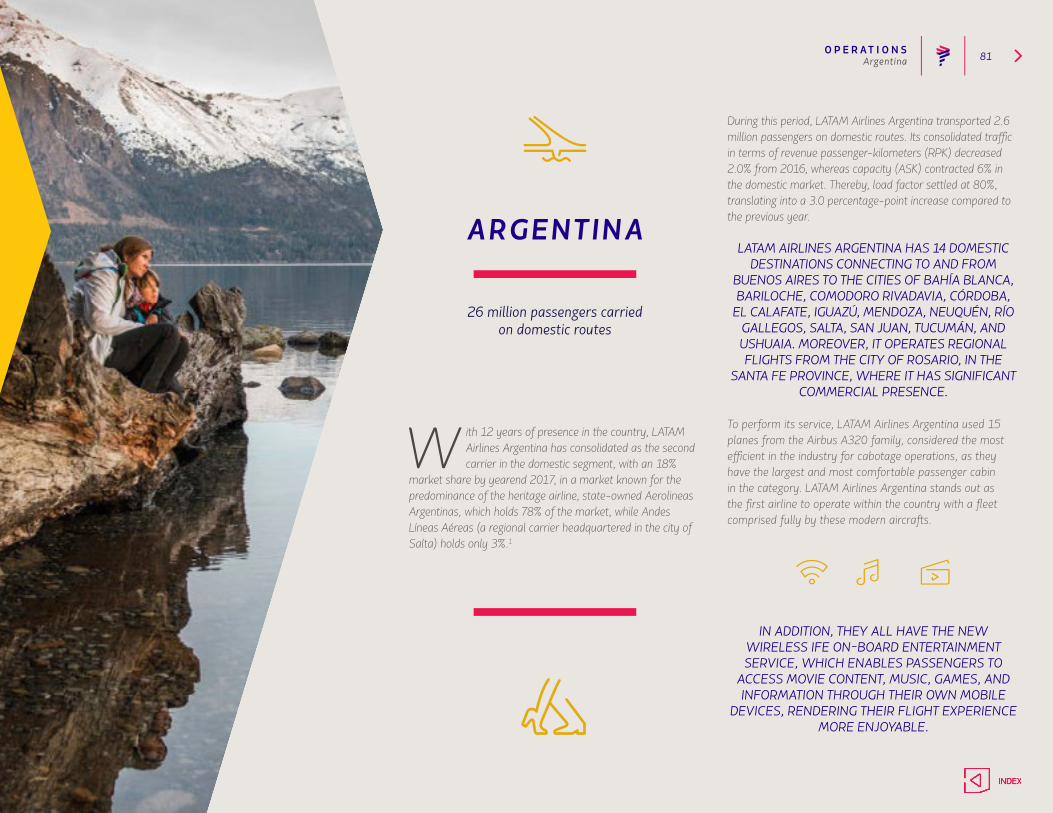
O P E R AT I O N S 81
ARGENTINA
Argentina
26 million passengers carriedon domestic routes
W ith 12 years of presence in the country, LATAM Airlines Argentina has consolidated as the second carrier in the domestic segment, with an 18%
market share by yearend 2017, in a market known for the predominance of the heritage airline, state-owned Aerolineas Argentinas, which holds 78% of the market, while Andes Líneas Aéreas (a regional carrier headquartered in the city of Salta) holds only 3%.1
During this period, LATAM Airlines Argentina transported 2.6 million passengers on domestic routes. Its consolidated traffic in terms of revenue passenger-kilometers (RPK) decreased 2.0% from 2016, whereas capacity (ASK) contracted 6% in the domestic market. Thereby, load factor settled at 80%, translating into a 3.0 percentage-point increase compared to the previous year.
LATAM AIRLINES ARGENTINA HAS 14 DOMESTIC DESTINATIONS CONNECTING TO AND FROM
BUENOS AIRES TO THE CITIES OF BAHÍA BLANCA, BARILOCHE, COMODORO RIVADAVIA, CÓRDOBA,
EL CALAFATE, IGUAZÚ, MENDOZA, NEUQUÉN, RÍO GALLEGOS, SALTA, SAN JUAN, TUCUMÁN, AND USHUAIA. MOREOVER, IT OPERATES REGIONAL FLIGHTS FROM THE CITY OF ROSARIO, IN THE
SANTA FE PROVINCE, WHERE IT HAS SIGNIFICANT COMMERCIAL PRESENCE.
To perform its service, LATAM Airlines Argentina used 15 planes from the Airbus A320 family, considered the most efficient in the industry for cabotage operations, as they have the largest and most comfortable passenger cabin in the category. LATAM Airlines Argentina stands out as the first airline to operate within the country with a fleet comprised fully by these modern aircrafts.
IN ADDITION, THEY ALL HAVE THE NEW WIRELESS IFE ON-BOARD ENTERTAINMENT SERVICE, WHICH ENABLES PASSENGERS TO
ACCESS MOVIE CONTENT, MUSIC, GAMES, AND INFORMATION THROUGH THEIR OWN MOBILE
DEVICES, RENDERING THEIR FLIGHT EXPERIENCE MORE ENJOYABLE.
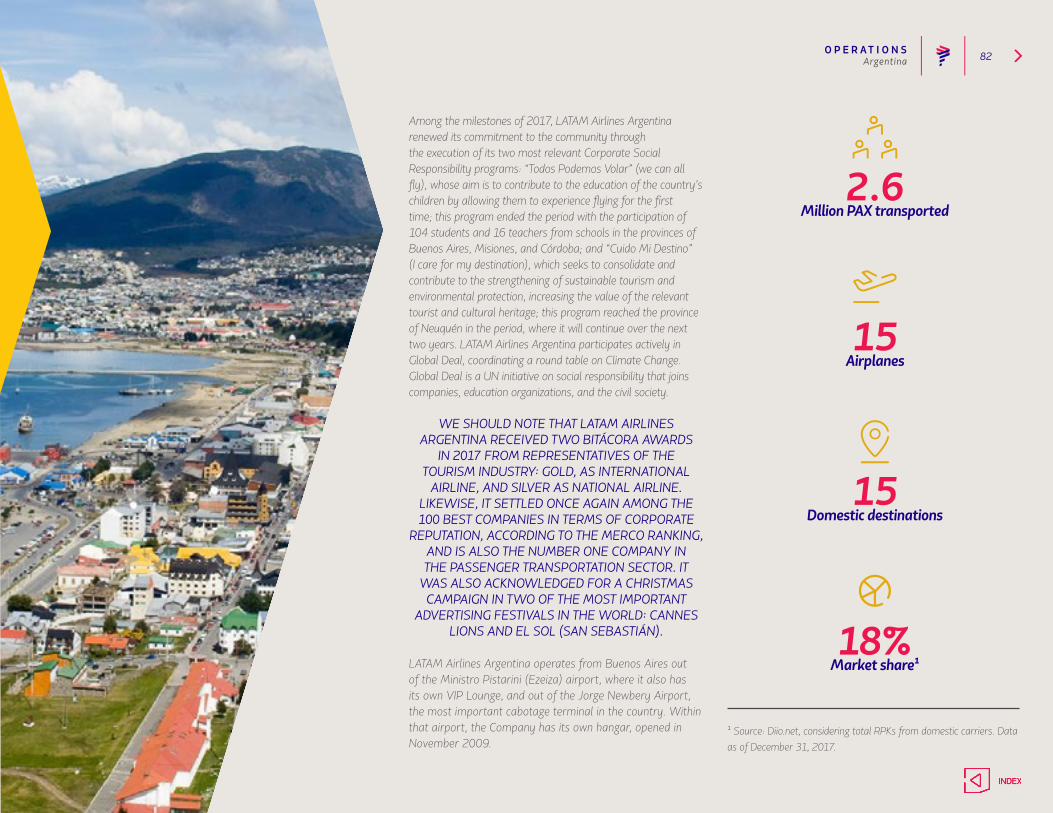
O P E R AT I O N S 82Argentina
Among the milestones of 2017, LATAM Airlines Argentina renewed its commitment to the community through the execution of its two most relevant Corporate Social Responsibility programs: “Todos Podemos Volar” (we can all fly), whose aim is to contribute to the education of the country’s children by allowing them to experience flying for the first time; this program ended the period with the participation of 104 students and 16 teachers from schools in the provinces of Buenos Aires, Misiones, and Córdoba; and “Cuido Mi Destino” (I care for my destination), which seeks to consolidate and contribute to the strengthening of sustainable tourism and environmental protection, increasing the value of the relevant tourist and cultural heritage; this program reached the province of Neuquén in the period, where it will continue over the next two years. LATAM Airlines Argentina participates actively in Global Deal, coordinating a round table on Climate Change. Global Deal is a UN initiative on social responsibility that joins companies, education organizations, and the civil society.
WE SHOULD NOTE THAT LATAM AIRLINES ARGENTINA RECEIVED TWO BITÁCORA AWARDS
IN 2017 FROM REPRESENTATIVES OF THE TOURISM INDUSTRY: GOLD, AS INTERNATIONAL
AIRLINE, AND SILVER AS NATIONAL AIRLINE. LIKEWISE, IT SETTLED ONCE AGAIN AMONG THE 100 BEST COMPANIES IN TERMS OF CORPORATE
REPUTATION, ACCORDING TO THE MERCO RANKING, AND IS ALSO THE NUMBER ONE COMPANY IN THE PASSENGER TRANSPORTATION SECTOR. IT
WAS ALSO ACKNOWLEDGED FOR A CHRISTMAS CAMPAIGN IN TWO OF THE MOST IMPORTANT
ADVERTISING FESTIVALS IN THE WORLD: CANNES LIONS AND EL SOL (SAN SEBASTIÁN).
LATAM Airlines Argentina operates from Buenos Aires out of the Ministro Pistarini (Ezeiza) airport, where it also has its own VIP Lounge, and out of the Jorge Newbery Airport, the most important cabotage terminal in the country. Within that airport, the Company has its own hangar, opened in November 2009.
Million PAX transported2.6
Airplanes15
Domestic destinations15
Market share118%
1 Source: Diio.net, considering total RPKs from domestic carriers. Data as of December 31, 2017.
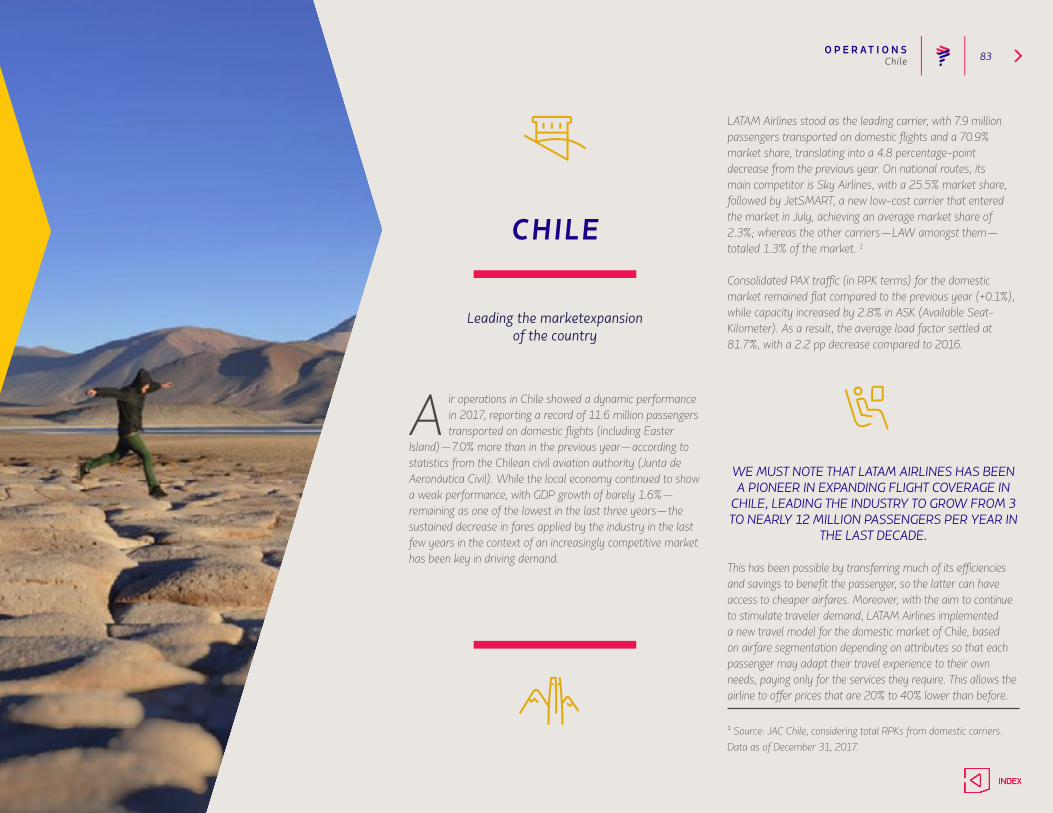
O P E R AT I O N S 83
LATAM Airlines stood as the leading carrier, with 7.9 million passengers transported on domestic flights and a 70.9% market share, translating into a 4.8 percentage-point decrease from the previous year. On national routes, its main competitor is Sky Airlines, with a 25.5% market share, followed by JetSMART, a new low-cost carrier that entered the market in July, achieving an average market share of 2.3%; whereas the other carriers—LAW amongst them—totaled 1.3% of the market. 1
Consolidated PAX traffic (in RPK terms) for the domestic market remained flat compared to the previous year (+0.1%), while capacity increased by 2.8% in ASK (Available Seat-Kilometer). As a result, the average load factor settled at 81.7%, with a 2.2 pp decrease compared to 2016.
WE MUST NOTE THAT LATAM AIRLINES HAS BEEN A PIONEER IN EXPANDING FLIGHT COVERAGE IN
CHILE, LEADING THE INDUSTRY TO GROW FROM 3 TO NEARLY 12 MILLION PASSENGERS PER YEAR IN
THE LAST DECADE.
This has been possible by transferring much of its efficiencies and savings to benefit the passenger, so the latter can have access to cheaper airfares. Moreover, with the aim to continue to stimulate traveler demand, LATAM Airlines implemented a new travel model for the domestic market of Chile, based on airfare segmentation depending on attributes so that each passenger may adapt their travel experience to their own needs, paying only for the services they require. This allows the airline to offer prices that are 20% to 40% lower than before.
Chile
CHILE
Leading the marketexpansionof the country
A ir operations in Chile showed a dynamic performance in 2017, reporting a record of 11.6 million passengers transported on domestic flights (including Easter
Island)—7.0% more than in the previous year—according to statistics from the Chilean civil aviation authority (Junta de Aeronáutica Civil). While the local economy continued to show a weak performance, with GDP growth of barely 1.6%—remaining as one of the lowest in the last three years—the sustained decrease in fares applied by the industry in the last few years in the context of an increasingly competitive market has been key in driving demand.
1 Source: JAC Chile, considering total RPKs from domestic carriers. Data as of December 31, 2017.
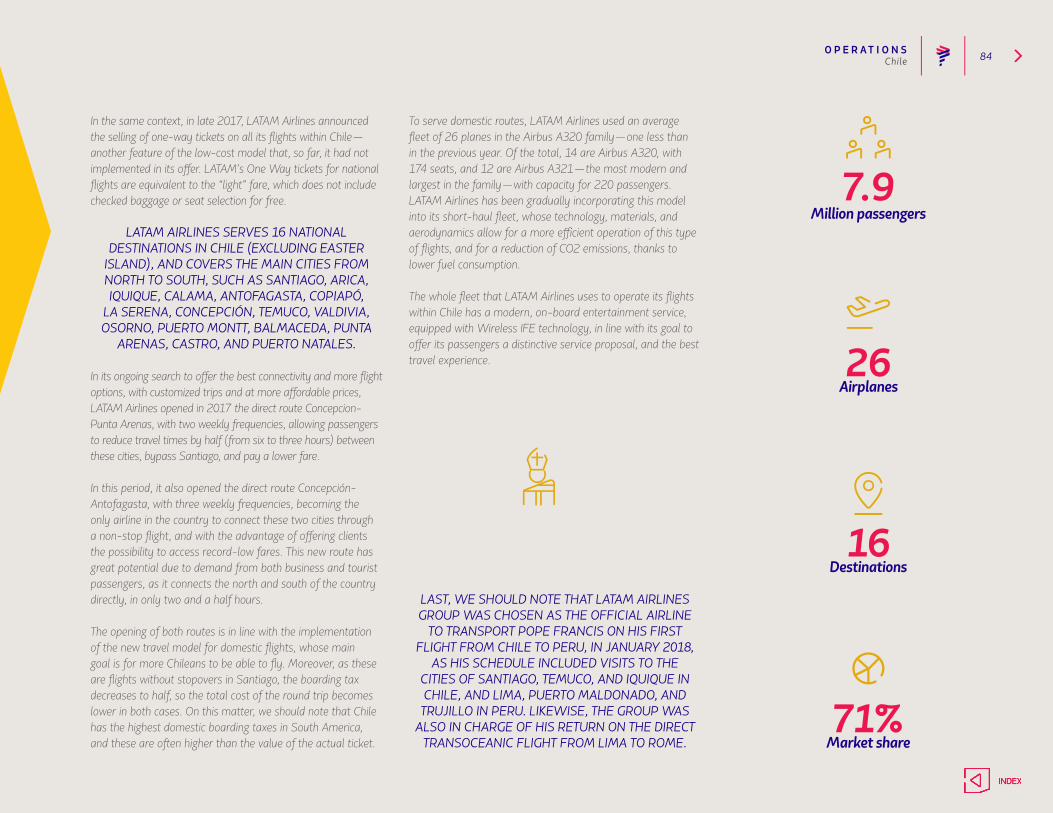
O P E R AT I O N S 84
In the same context, in late 2017, LATAM Airlines announced the selling of one-way tickets on all its flights within Chile—another feature of the low-cost model that, so far, it had not implemented in its offer. LATAM’s One Way tickets for national flights are equivalent to the “light” fare, which does not include checked baggage or seat selection for free.
LATAM AIRLINES SERVES 16 NATIONAL DESTINATIONS IN CHILE (EXCLUDING EASTER
ISLAND), AND COVERS THE MAIN CITIES FROM NORTH TO SOUTH, SUCH AS SANTIAGO, ARICA, IQUIQUE, CALAMA, ANTOFAGASTA, COPIAPÓ,
LA SERENA, CONCEPCIÓN, TEMUCO, VALDIVIA, OSORNO, PUERTO MONTT, BALMACEDA, PUNTA
ARENAS, CASTRO, AND PUERTO NATALES.
In its ongoing search to offer the best connectivity and more flight options, with customized trips and at more affordable prices, LATAM Airlines opened in 2017 the direct route Concepcion-Punta Arenas, with two weekly frequencies, allowing passengers to reduce travel times by half (from six to three hours) between these cities, bypass Santiago, and pay a lower fare.
In this period, it also opened the direct route Concepción-Antofagasta, with three weekly frequencies, becoming the only airline in the country to connect these two cities through a non-stop flight, and with the advantage of offering clients the possibility to access record-low fares. This new route has great potential due to demand from both business and tourist passengers, as it connects the north and south of the country directly, in only two and a half hours.
The opening of both routes is in line with the implementation of the new travel model for domestic flights, whose main goal is for more Chileans to be able to fly. Moreover, as these are flights without stopovers in Santiago, the boarding tax decreases to half, so the total cost of the round trip becomes lower in both cases. On this matter, we should note that Chile has the highest domestic boarding taxes in South America, and these are often higher than the value of the actual ticket.
To serve domestic routes, LATAM Airlines used an average fleet of 26 planes in the Airbus A320 family—one less than in the previous year. Of the total, 14 are Airbus A320, with 174 seats, and 12 are Airbus A321—the most modern and largest in the family—with capacity for 220 passengers. LATAM Airlines has been gradually incorporating this model into its short-haul fleet, whose technology, materials, and aerodynamics allow for a more efficient operation of this type of flights, and for a reduction of CO2 emissions, thanks to lower fuel consumption.
The whole fleet that LATAM Airlines uses to operate its flights within Chile has a modern, on-board entertainment service, equipped with Wireless IFE technology, in line with its goal to offer its passengers a distinctive service proposal, and the best travel experience.
LAST, WE SHOULD NOTE THAT LATAM AIRLINES GROUP WAS CHOSEN AS THE OFFICIAL AIRLINE
TO TRANSPORT POPE FRANCIS ON HIS FIRST FLIGHT FROM CHILE TO PERU, IN JANUARY 2018,
AS HIS SCHEDULE INCLUDED VISITS TO THE CITIES OF SANTIAGO, TEMUCO, AND IQUIQUE IN CHILE, AND LIMA, PUERTO MALDONADO, AND TRUJILLO IN PERU. LIKEWISE, THE GROUP WAS
ALSO IN CHARGE OF HIS RETURN ON THE DIRECT TRANSOCEANIC FLIGHT FROM LIMA TO ROME.
Chile
Million passengers 7.9
Airplanes26
Destinations16
Market share71%

O P E R AT I O N S 85Colombia
COLOM BIA
Four new domestic routesin 2017
S ince it began operations in the country, in 2012, LATAM Airlines Colombia has gradually positioned itself as the second carrier in the domestic market,
acknowledged as one of the most competitive in Latin America. Colombia is the fourth economy in the region and the second largest passenger market, just below Brazil.
In the last five years, air transportation has experienced a significant expansion in the country, and is a sector with appealing growth potential.
In 2017, LATAM Airlines Colombia transported nearly 4.8 million passengers on national flights, translating into a 0.4% increase over the previous year, to reach a 22.4% market share—1.2 percentage points higher than in 2016. Its main competitors are heritage airline Avianca, whose market share decreased to 54.2% in the period, Viva Colombia (14.8%), Satena (3.3%), Wingo (2.6%), and Easy Fly (2.2%)1.
ITS CONSOLIDATED PAX TRAFFIC (RPK) GREW 6.6% IN THE DOMESTIC MARKET, WHILE CAPACITY INCREASED 3.1%. THUS, LOAD FACTOR SETTLED AT
A SOUND 83%, WITH A 2.7 PERCENTAGE-POINT INCREASE COMPARED TO 2016.
LATAM Airlines Colombia currently serves 14 destinations within Colombia, with 20 routes, offering a broad connectivity from Bogota and Medellin. In this period, it opened four new domestic routes—namely Medellin-Santa Marta, Medellin-Barranquilla, Cartagena-San Andres, and Cartagena-Cali—expanding its service through flights connecting cities other than Bogotá and strengthening its presence in more tourist destinations.
To carry out its short-haul operations within the country, it ended the year with 16 airplanes of the Airbus A320 family, all equipped with its on-board wireless entertainment system to offer its clients the best travel experience.
In addition to strengthening the domestic routes, in 2017 LATAM Airlines Colombia was the first of the Group's affiliates to launch “Mercado LATAM”, after launching in February its new service offering on-board food & beverage purchases on all domestic flights. This was the first step in the evolution of the airline’s new travel model to offer passengers more options, flexible rates, and a customized trip, where they only pay for the attributes they choose.
Focused on its permanent goal to improve its value proposal, in 2017 LATAM Airlines Colombia implemented a trip tracking system for minors, in real time, through a website link provided upon purchasing the service, which can be viewed on a mobile device or computer. Nearly 1,900 minors used the system in the last six months of 2017. This
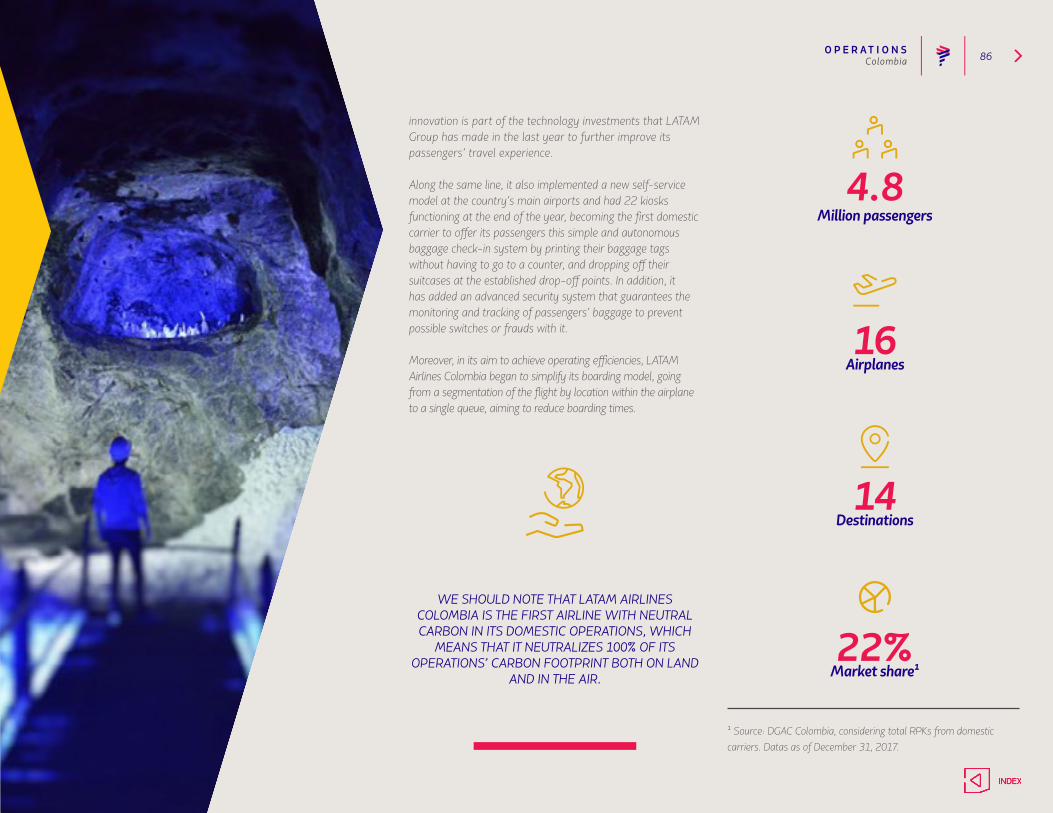
O P E R AT I O N S 86
innovation is part of the technology investments that LATAM Group has made in the last year to further improve its passengers’ travel experience.
Along the same line, it also implemented a new self-service model at the country’s main airports and had 22 kiosks functioning at the end of the year, becoming the first domestic carrier to offer its passengers this simple and autonomous baggage check-in system by printing their baggage tags without having to go to a counter, and dropping off their suitcases at the established drop-off points. In addition, it has added an advanced security system that guarantees the monitoring and tracking of passengers’ baggage to prevent possible switches or frauds with it.
Moreover, in its aim to achieve operating efficiencies, LATAM Airlines Colombia began to simplify its boarding model, going from a segmentation of the flight by location within the airplane to a single queue, aiming to reduce boarding times.
WE SHOULD NOTE THAT LATAM AIRLINES COLOMBIA IS THE FIRST AIRLINE WITH NEUTRAL CARBON IN ITS DOMESTIC OPERATIONS, WHICH
MEANS THAT IT NEUTRALIZES 100% OF ITS OPERATIONS’ CARBON FOOTPRINT BOTH ON LAND
AND IN THE AIR.
Colombia
Million passengers4.8
Airplanes16
Destinations14
Market share122%
1 Source: DGAC Colombia, considering total RPKs from domestic carriers. Datas as of December 31, 2017.
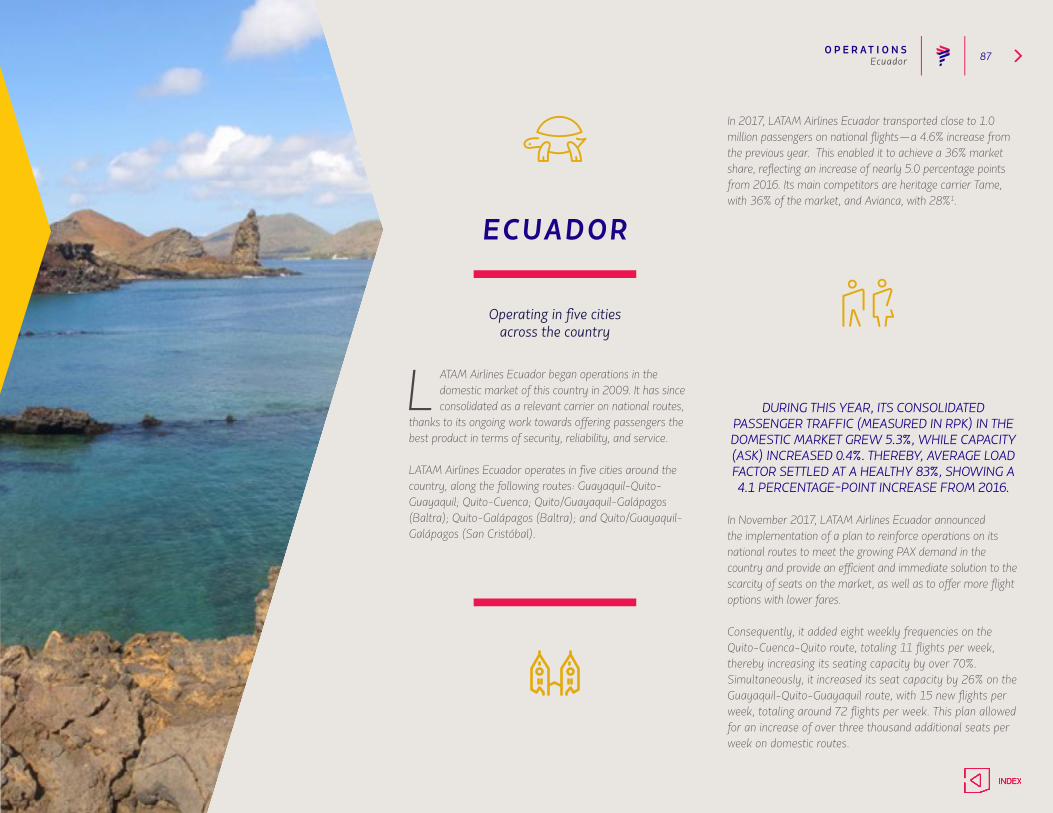
O P E R AT I O N S 87
In 2017, LATAM Airlines Ecuador transported close to 1.0 million passengers on national flights—a 4.6% increase from the previous year. This enabled it to achieve a 36% market share, reflecting an increase of nearly 5.0 percentage points from 2016. Its main competitors are heritage carrier Tame, with 36% of the market, and Avianca, with 28%1.
DURING THIS YEAR, ITS CONSOLIDATED PASSENGER TRAFFIC (MEASURED IN RPK) IN THE DOMESTIC MARKET GREW 5.3%, WHILE CAPACITY (ASK) INCREASED 0.4%. THEREBY, AVERAGE LOAD FACTOR SETTLED AT A HEALTHY 83%, SHOWING A 4.1 PERCENTAGE-POINT INCREASE FROM 2016.
In November 2017, LATAM Airlines Ecuador announced the implementation of a plan to reinforce operations on its national routes to meet the growing PAX demand in the country and provide an efficient and immediate solution to the scarcity of seats on the market, as well as to offer more flight options with lower fares.
Consequently, it added eight weekly frequencies on the Quito-Cuenca-Quito route, totaling 11 flights per week, thereby increasing its seating capacity by over 70%. Simultaneously, it increased its seat capacity by 26% on the Guayaquil-Quito-Guayaquil route, with 15 new flights per week, totaling around 72 flights per week. This plan allowed for an increase of over three thousand additional seats per week on domestic routes.
ECUADOR
Ecuador
Operating in five citiesacross the country
L ATAM Airlines Ecuador began operations in the domestic market of this country in 2009. It has since consolidated as a relevant carrier on national routes,
thanks to its ongoing work towards offering passengers the best product in terms of security, reliability, and service.
LATAM Airlines Ecuador operates in five cities around the country, along the following routes: Guayaquil-Quito-Guayaquil; Quito-Cuenca; Quito/Guayaquil-Galápagos (Baltra); Quito-Galápagos (Baltra); and Quito/Guayaquil-Galápagos (San Cristóbal).
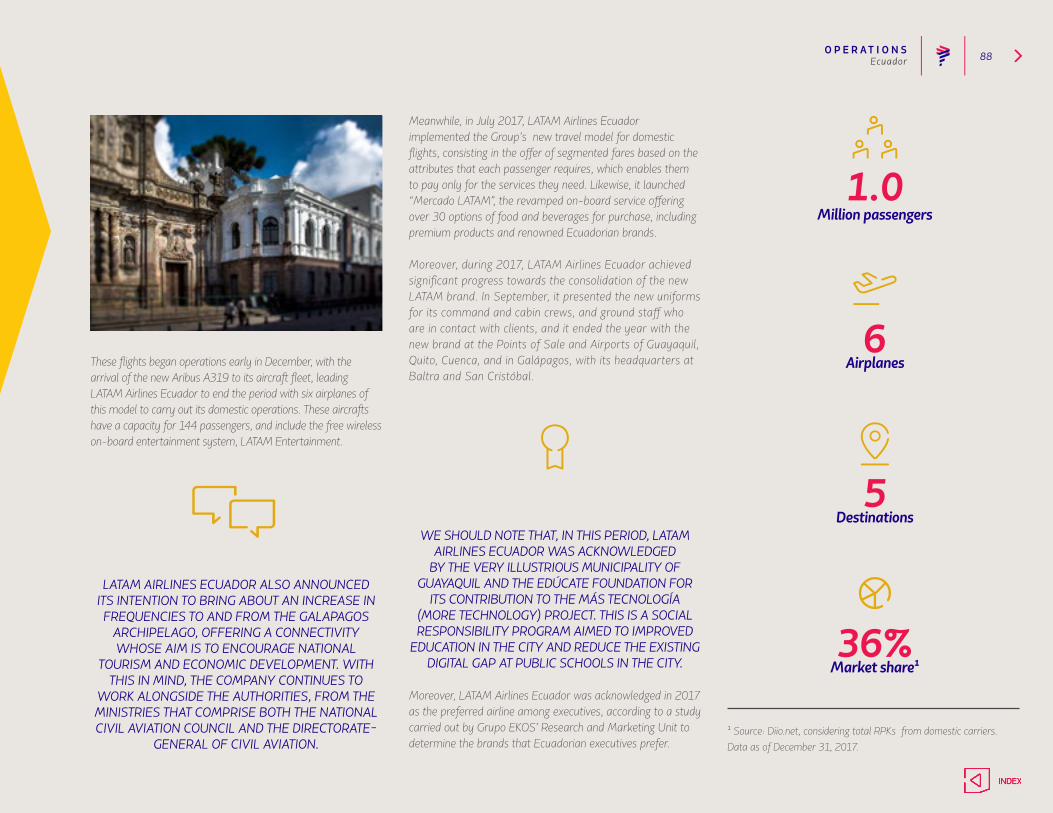
O P E R AT I O N S 88
These flights began operations early in December, with the arrival of the new Aribus A319 to its aircraft fleet, leading LATAM Airlines Ecuador to end the period with six airplanes of this model to carry out its domestic operations. These aircrafts have a capacity for 144 passengers, and include the free wireless on-board entertainment system, LATAM Entertainment.
LATAM AIRLINES ECUADOR ALSO ANNOUNCED ITS INTENTION TO BRING ABOUT AN INCREASE IN FREQUENCIES TO AND FROM THE GALAPAGOS
ARCHIPELAGO, OFFERING A CONNECTIVITY WHOSE AIM IS TO ENCOURAGE NATIONAL
TOURISM AND ECONOMIC DEVELOPMENT. WITH THIS IN MIND, THE COMPANY CONTINUES TO
WORK ALONGSIDE THE AUTHORITIES, FROM THE MINISTRIES THAT COMPRISE BOTH THE NATIONAL CIVIL AVIATION COUNCIL AND THE DIRECTORATE-
GENERAL OF CIVIL AVIATION.
Meanwhile, in July 2017, LATAM Airlines Ecuador implemented the Group’s new travel model for domestic flights, consisting in the offer of segmented fares based on the attributes that each passenger requires, which enables them to pay only for the services they need. Likewise, it launched “Mercado LATAM”, the revamped on-board service offering over 30 options of food and beverages for purchase, including premium products and renowned Ecuadorian brands.
Moreover, during 2017, LATAM Airlines Ecuador achieved significant progress towards the consolidation of the new LATAM brand. In September, it presented the new uniforms for its command and cabin crews, and ground staff who are in contact with clients, and it ended the year with the new brand at the Points of Sale and Airports of Guayaquil, Quito, Cuenca, and in Galápagos, with its headquarters at Baltra and San Cristóbal.
WE SHOULD NOTE THAT, IN THIS PERIOD, LATAM AIRLINES ECUADOR WAS ACKNOWLEDGED
BY THE VERY ILLUSTRIOUS MUNICIPALITY OF GUAYAQUIL AND THE EDÚCATE FOUNDATION FOR
ITS CONTRIBUTION TO THE MÁS TECNOLOGÍA (MORE TECHNOLOGY) PROJECT. THIS IS A SOCIAL RESPONSIBILITY PROGRAM AIMED TO IMPROVED
EDUCATION IN THE CITY AND REDUCE THE EXISTING DIGITAL GAP AT PUBLIC SCHOOLS IN THE CITY.
Moreover, LATAM Airlines Ecuador was acknowledged in 2017 as the preferred airline among executives, according to a study carried out by Grupo EKOS’ Research and Marketing Unit to determine the brands that Ecuadorian executives prefer.
Ecuador
Million passengers1.0
Airplanes6
Destinations5
Market share136%
1 Source: Diio.net, considering total RPKs from domestic carriers. Data as of December 31, 2017.

O P E R AT I O N S 89
PERU
Peru
Socially Responsible Company awardfor the fourth consecutive year
W ith 18 years of presence in Peru, LATAM Airlines Peru has consolidated as the leading carrier in the domestic market, with a market share
of around 57.7%1 in 2017. In that year, it transported 6.7 million passengers within the country—a record figure for the Company—showing a 1.8% increase from the previous year.
During 2017, Peru experienced a slowdown in activity compared to the previous year, particularly in the first half of 2017, even though its economy remained among the most dynamic in the region, ending the period with annual growth of 2.7%. In this context, PAX traffic in the domestic market continued to rise, surpassing 9.7 million PAX transported, which means a 7.6% increase from 2016.
LATAM Airlines Peru’s consolidated passenger traffic (RPK) grew 1.4%, while capacity (ASK) decreased 1.5% compared to 2016, in the domestic market. Thereby, load factor settled at 82.8%, showing a 2.4 percentage-point increase from the previous year.
LATAM AIRLINES PERU’S CONSOLIDATED PASSENGER TRAFFIC (RPK) GREW 1.4%, WHILE CAPACITY (ASK) DECREASED 1.5% COMPARED TO 2016, IN THE DOMESTIC MARKET. THEREBY, LOAD FACTOR SETTLED AT 82.8%, SHOWING A 2.4 PERCENTAGE-POINT INCREASE FROM THE
PREVIOUS YEAR.
In the period, LATAM Airlines Peru opened flights to Jauja, from Lima, with seven weekly frequencies, increasing its destinations within the country to 18. The launch of this new destination reflects LATAM Group’s ongoing commitment to Peru’s economic and social development, in line with its goal to keep improving national air connectivity. Jauja is a commercial hub between the Peruvian coast and its mountain region.
Moreover, in July, it began operating new domestic routes without connecting in Lima, such as Cusco-Trujillo through a direct flight with three weekly frequencies, enabling a 56% reduction in travel times compared to the Cusco-Trujillo route via Lima. Cusco is a center that draws hundreds of national and foreign tourists each year, and this new flight is expected to bring more visitors from the north part of the country to
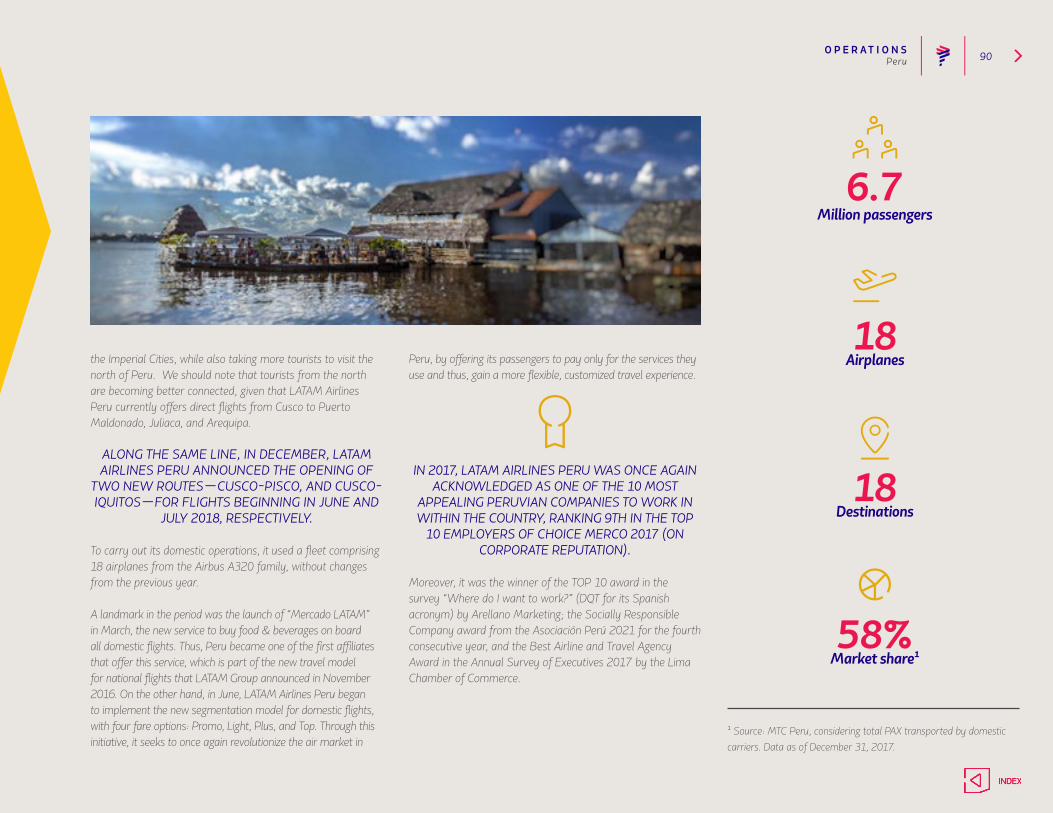
O P E R AT I O N S 90
the Imperial Cities, while also taking more tourists to visit the north of Peru. We should note that tourists from the north are becoming better connected, given that LATAM Airlines Peru currently offers direct flights from Cusco to Puerto Maldonado, Juliaca, and Arequipa.
ALONG THE SAME LINE, IN DECEMBER, LATAM AIRLINES PERU ANNOUNCED THE OPENING OF
TWO NEW ROUTES—CUSCO-PISCO, AND CUSCO-IQUITOS—FOR FLIGHTS BEGINNING IN JUNE AND
JULY 2018, RESPECTIVELY.
To carry out its domestic operations, it used a fleet comprising 18 airplanes from the Airbus A320 family, without changes from the previous year.
A landmark in the period was the launch of “Mercado LATAM” in March, the new service to buy food & beverages on board all domestic flights. Thus, Peru became one of the first affiliates that offer this service, which is part of the new travel model for national flights that LATAM Group announced in November 2016. On the other hand, in June, LATAM Airlines Peru began to implement the new segmentation model for domestic flights, with four fare options: Promo, Light, Plus, and Top. Through this initiative, it seeks to once again revolutionize the air market in
Peru, by offering its passengers to pay only for the services they use and thus, gain a more flexible, customized travel experience.
IN 2017, LATAM AIRLINES PERU WAS ONCE AGAIN ACKNOWLEDGED AS ONE OF THE 10 MOST
APPEALING PERUVIAN COMPANIES TO WORK IN WITHIN THE COUNTRY, RANKING 9TH IN THE TOP
10 EMPLOYERS OF CHOICE MERCO 2017 (ON CORPORATE REPUTATION).
Moreover, it was the winner of the TOP 10 award in the survey “Where do I want to work?” (DQT for its Spanish acronym) by Arellano Marketing; the Socially Responsible Company award from the Asociación Perú 2021 for the fourth consecutive year, and the Best Airline and Travel Agency Award in the Annual Survey of Executives 2017 by the Lima Chamber of Commerce.
Peru
Million passengers 6.7
Airplanes18
Destinations18
Market share158%
1 Source: MTC Peru, considering total PAX transported by domestic carriers. Data as of December 31, 2017.

O P E R AT I O N S 91
The objective of LATAM Cargo is to contribute to LATAM Group’s profitability by maximizing cargo transport in the belly of passenger aircraft. To accomplish this, LATAM Cargo is focused on developing and delivering an attractive an attractive proposition for cargo clients, as well as on the continuous pursuit of higher levels of efficiency and productivity. Due to the above, 60% of the cargo was carried in the belly of passenger aircraft, and 40% in dedicated freighters. The latter aircraft seek to complement the group’s passenger offer, and to accomplish this in the most effective way, LATAM Cargo carried a restructuring process in order to homologate its fleet around the Boring 767-300F aircraft, given the advantage they have when operating the main markets within South America and between this region and abroad. With this end in mind, during 2017 kicked off the face-out of its Boeing 777-200F fleet, with the retirement of the last two airplanes of this model.
THROUGHOUT THE YEAR, CARGO REVENUES INCREASED 0.8% FROM THE PREVIOUS YEAR, WHEREAS THE OFFER—MEASURED IN ATKS (AVAILABLE TON KILOMETER)—DECREASED BY 7.1%. CARGO REVENUES PER ATK ROSE 8.5% COMPARED TO 2016, THANKS TO A 3.2
PERCENTAGE-POINT INCREASE IN LOAD FACTOR, WHICH SETTLED AT 54.9%.
In 2017, its consolidated cargo traffic—measured in RTKs— decreased by 1.3% compared to the previous year, mainly due to the decrease in dedicated cargo fleet. In fact, cargo traffic transported in the bellies of passenger planes increased 7%.
The recovery in revenues is mainly due to the capacity adjustments that LATAM Cargo Group has been implementing over the last few years, and to the ongoing improvement of imports from North America and Europe to Brazil—namely,
L ATAM Cargo and related enterprises is the largest carrier of air cargo in Latin America, offering its clients the broadest point-to-point connectivity between the
region and the rest of the world, with 144 destinations in 29 countries. LATAM Cargo Group transports cargo in the bellies of 298 passenger planes and in 9 dedicated cargo freighters.
Cargo
First airline in the Americas to be awardedthe CEIV Pharma Certification
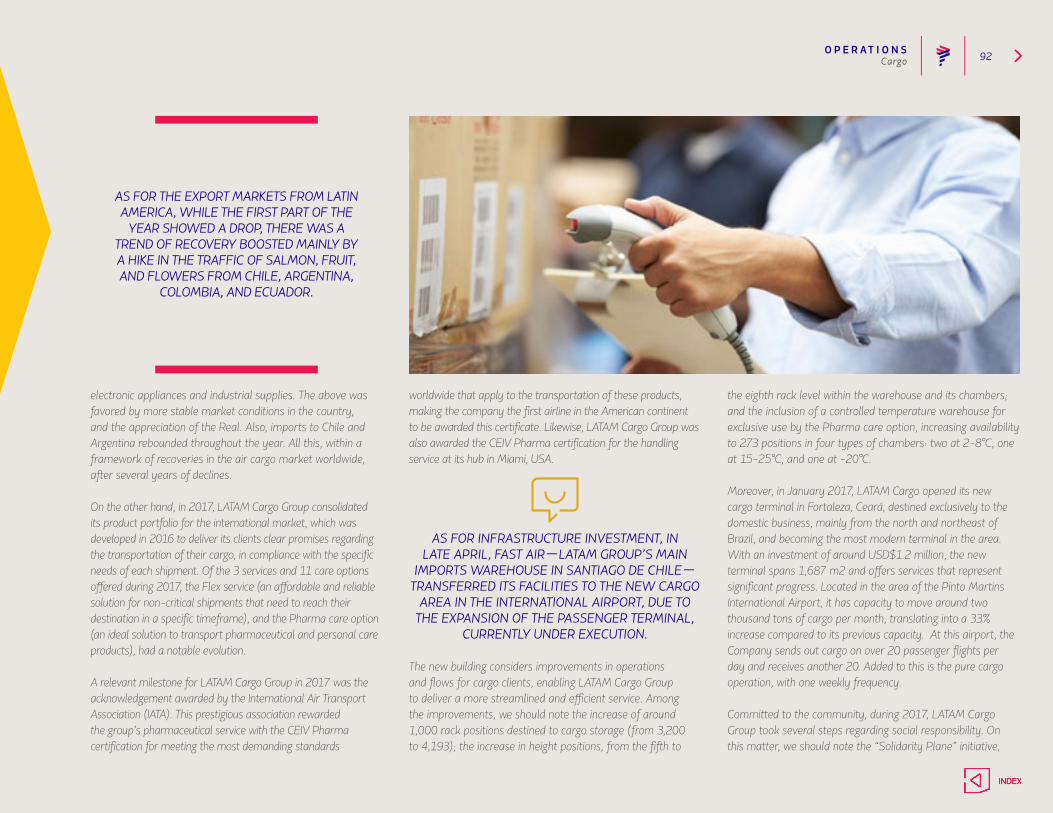
O P E R AT I O N S 92
electronic appliances and industrial supplies. The above was favored by more stable market conditions in the country, and the appreciation of the Real. Also, imports to Chile and Argentina rebounded throughout the year. All this, within a framework of recoveries in the air cargo market worldwide, after several years of declines.
On the other hand, in 2017, LATAM Cargo Group consolidated its product portfolio for the international market, which was developed in 2016 to deliver its clients clear promises regarding the transportation of their cargo, in compliance with the specific needs of each shipment. Of the 3 services and 11 care options offered during 2017, the Flex service (an affordable and reliable solution for non-critical shipments that need to reach their destination in a specific timeframe), and the Pharma care option (an ideal solution to transport pharmaceutical and personal care products), had a notable evolution.
A relevant milestone for LATAM Cargo Group in 2017 was the acknowledgement awarded by the International Air Transport Association (IATA). This prestigious association rewarded the group’s pharmaceutical service with the CEIV Pharma certification for meeting the most demanding standards
worldwide that apply to the transportation of these products, making the company the first airline in the American continent to be awarded this certificate. Likewise, LATAM Cargo Group was also awarded the CEIV Pharma certification for the handling service at its hub in Miami, USA.
AS FOR INFRASTRUCTURE INVESTMENT, IN LATE APRIL, FAST AIR—LATAM GROUP’S MAIN
IMPORTS WAREHOUSE IN SANTIAGO DE CHILE—TRANSFERRED ITS FACILITIES TO THE NEW CARGO
AREA IN THE INTERNATIONAL AIRPORT, DUE TO THE EXPANSION OF THE PASSENGER TERMINAL,
CURRENTLY UNDER EXECUTION.
The new building considers improvements in operations and flows for cargo clients, enabling LATAM Cargo Group to deliver a more streamlined and efficient service. Among the improvements, we should note the increase of around 1,000 rack positions destined to cargo storage (from 3,200 to 4,193); the increase in height positions, from the fifth to
the eighth rack level within the warehouse and its chambers; and the inclusion of a controlled temperature warehouse for exclusive use by the Pharma care option, increasing availability to 273 positions in four types of chambers: two at 2-8°C, one at 15-25°C, and one at -20°C.
Moreover, in January 2017, LATAM Cargo opened its new cargo terminal in Fortaleza, Ceará, destined exclusively to the domestic business, mainly from the north and northeast of Brazil, and becoming the most modern terminal in the area. With an investment of around USD$1.2 million, the new terminal spans 1,687 m2 and offers services that represent significant progress. Located in the area of the Pinto Martins International Airport, it has capacity to move around two thousand tons of cargo per month, translating into a 33% increase compared to its previous capacity. At this airport, the Company sends out cargo on over 20 passenger flights per day and receives another 20. Added to this is the pure cargo operation, with one weekly frequency.
Committed to the community, during 2017, LATAM Cargo Group took several steps regarding social responsibility. On this matter, we should note the “Solidarity Plane” initiative,
AS FOR THE EXPORT MARKETS FROM LATIN AMERICA, WHILE THE FIRST PART OF THE
YEAR SHOWED A DROP, THERE WAS A TREND OF RECOVERY BOOSTED MAINLY BY A HIKE IN THE TRAFFIC OF SALMON, FRUIT, AND FLOWERS FROM CHILE, ARGENTINA,
COLOMBIA, AND ECUADOR.
Cargo
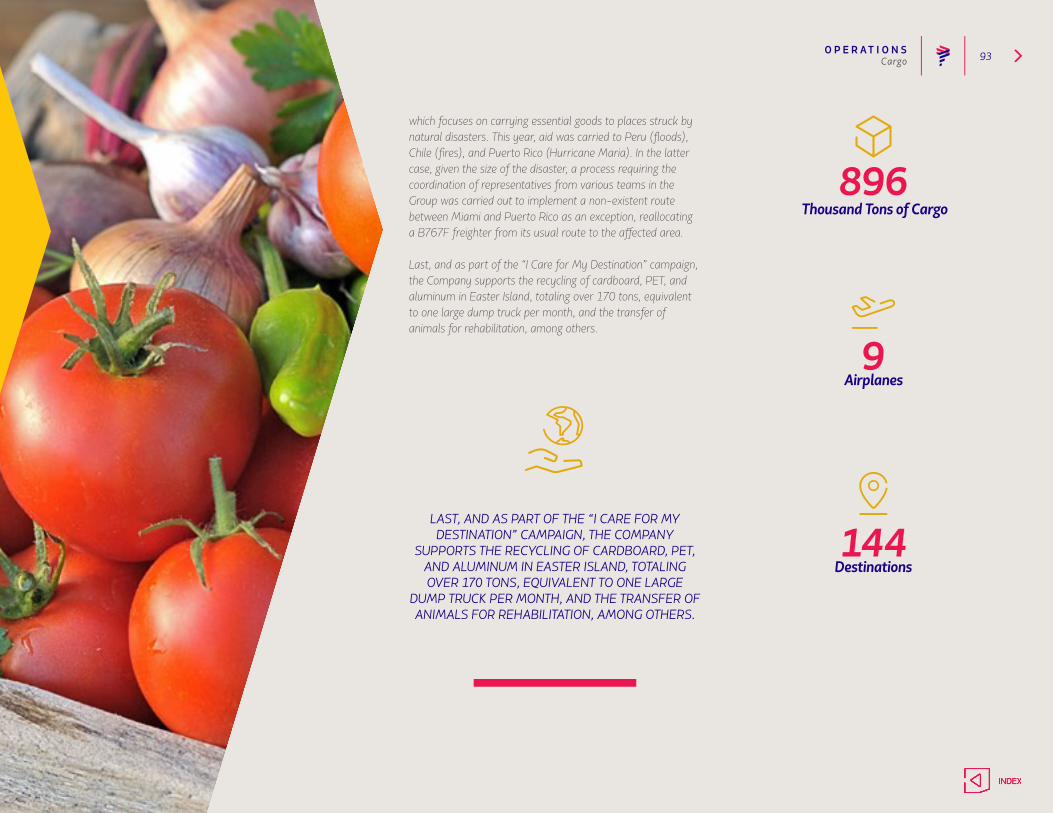
O P E R AT I O N S 93Cargo
which focuses on carrying essential goods to places struck by natural disasters. This year, aid was carried to Peru (floods), Chile (fires), and Puerto Rico (Hurricane Maria). In the latter case, given the size of the disaster, a process requiring the coordination of representatives from various teams in the Group was carried out to implement a non-existent route between Miami and Puerto Rico as an exception, reallocating a B767F freighter from its usual route to the affected area.
Last, and as part of the “I Care for My Destination” campaign, the Company supports the recycling of cardboard, PET, and aluminum in Easter Island, totaling over 170 tons, equivalent to one large dump truck per month, and the transfer of animals for rehabilitation, among others.
Airplanes9
Destinations144
Thousand Tons of Cargo896
LAST, AND AS PART OF THE “I CARE FOR MY DESTINATION” CAMPAIGN, THE COMPANY
SUPPORTS THE RECYCLING OF CARDBOARD, PET, AND ALUMINUM IN EASTER ISLAND, TOTALING OVER 170 TONS, EQUIVALENT TO ONE LARGE
DUMP TRUCK PER MONTH, AND THE TRANSFER OF ANIMALS FOR REHABILITATION, AMONG OTHERS.

O P E R AT I O N S 94
During the process of merging the LATAM brand and the LATAM Pass and LATAM Fidelidade loyalty programs, the rules and benefits were homogenized and simplified to significantly improve the travel experience of LATAM Group’s customers in all the countries where it operates.
Among the first modifications made in this period is the switch in the LATAM Pass KMS and Multiplus Points earning model from a distance-based system to a revenue-based one.
THIS MEANS THAT, FROM NOW ON, LATAM MEMBERS’ KILOMETER ACCUMULATION (UNDER
BOTH PROGRAMS) WILL DEPEND ON THE MEMBER CATEGORY AND THE DOLLAR VALUE OF THE TICKET. THUS, THE FOCUS WILL BE ON THE TICKET RATHER THAN ON THE KILOMETERS TRAVELED, AS WAS THE
CASE IN THE PREVIOUS MODEL.
On the other hand, the Group announced a unique coalition per country, whereby Multiplus becomes the coalition for Brazil, Paraguay, Mexico, the US, and Europe, while LATAM Pass becomes the coalition for South America (except Paraguay and Brazil) and other countries. Member migration between coalitions will take place throughout 2018. This new model will make it possible to deliver a unique experience to members from a single country. Moreover, the Company announced the unification of the redemption network so that both coalitions will have access to LATAM’s entire network, generating more flight and destination options for its members.
Furthermore, in January 2018, LATAM Pass switched its program currency from kilometers to miles, whereby 1 LATAM Pass Mile is now equivalent to 1.6 LATAM Pass KMS. This change is purely nominative and is in line with the trend of loyalty programs in the airline industry worldwide. Although
Loyalty Programs
Programs
T he goal of frequent flyer programs is to reward the loyalty of those passengers who make the most use of LATAM Group’s airlines, through various benefits and prizes;
people must sign up as members to receive these rewards. This is how airlines can thank their clients for their business, which makes it a highly valued attribute among passengers.
Over 29 million members
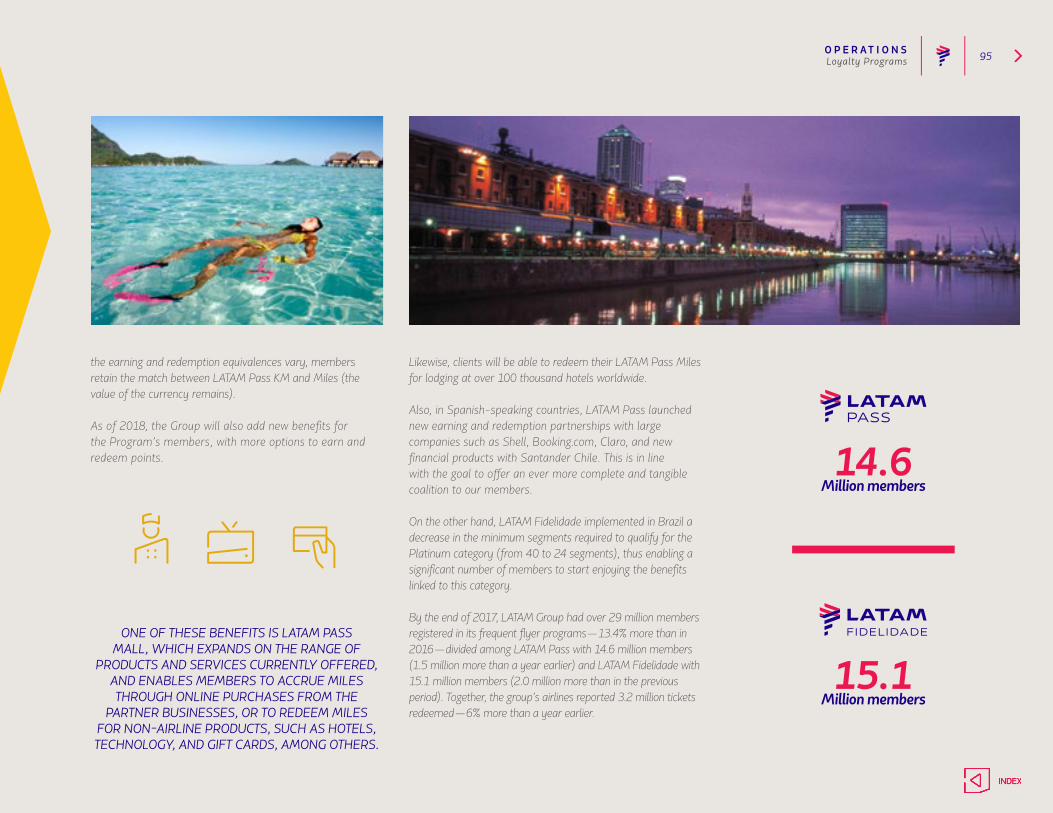
O P E R AT I O N S 95
the earning and redemption equivalences vary, members retain the match between LATAM Pass KM and Miles (the value of the currency remains).
As of 2018, the Group will also add new benefits for the Program’s members, with more options to earn and redeem points.
ONE OF THESE BENEFITS IS LATAM PASS MALL, WHICH EXPANDS ON THE RANGE OF
PRODUCTS AND SERVICES CURRENTLY OFFERED, AND ENABLES MEMBERS TO ACCRUE MILES THROUGH ONLINE PURCHASES FROM THE
PARTNER BUSINESSES, OR TO REDEEM MILES FOR NON-AIRLINE PRODUCTS, SUCH AS HOTELS, TECHNOLOGY, AND GIFT CARDS, AMONG OTHERS.
Likewise, clients will be able to redeem their LATAM Pass Miles for lodging at over 100 thousand hotels worldwide.
Also, in Spanish-speaking countries, LATAM Pass launched new earning and redemption partnerships with large companies such as Shell, Booking.com, Claro, and new financial products with Santander Chile. This is in line with the goal to offer an ever more complete and tangible coalition to our members.
On the other hand, LATAM Fidelidade implemented in Brazil a decrease in the minimum segments required to qualify for the Platinum category (from 40 to 24 segments), thus enabling a significant number of members to start enjoying the benefits linked to this category.
By the end of 2017, LATAM Group had over 29 million members registered in its frequent flyer programs—13.4% more than in 2016—divided among LATAM Pass with 14.6 million members (1.5 million more than a year earlier) and LATAM Fidelidade with 15.1 million members (2.0 million more than in the previous period). Together, the group’s airlines reported 3.2 million tickets redeemed—6% more than a year earlier.
Loyalty Programs
Million members14.6
Million members15.1
O P E R AT I O N S 96
CHILE
VenueOur main facilities are located near the international Comodoro Arturo Merino Benítez Airport. The complex includes offices, conference rooms and training facilities, dining rooms and simulation cabins used for crew instruction. Our corporate offices are located in a more central area of Santiago, Chile.
Maintenance baseOur Maintenance base is located in the grounds of the International Comodoro Arturo Merino Benítez Airport. These facilities include our aircraft hangar, warehouses, workshops and offices, and parking space for parking up to:
Other facilitiesWe have a flight training center right beside the International Comodoro Arturo Merino Benítez Airport. We also developed a recreational facility for our employees, with the support of Airbus. The facility, denominated “LAN Park", is located in an area of our property near the International Comodoro Arturo Merino Benítez Airport.
Properties, Plant and Equipment
Plant and Equipment
short-rangeaircraft
long-rangeaircraft
30 o r 10
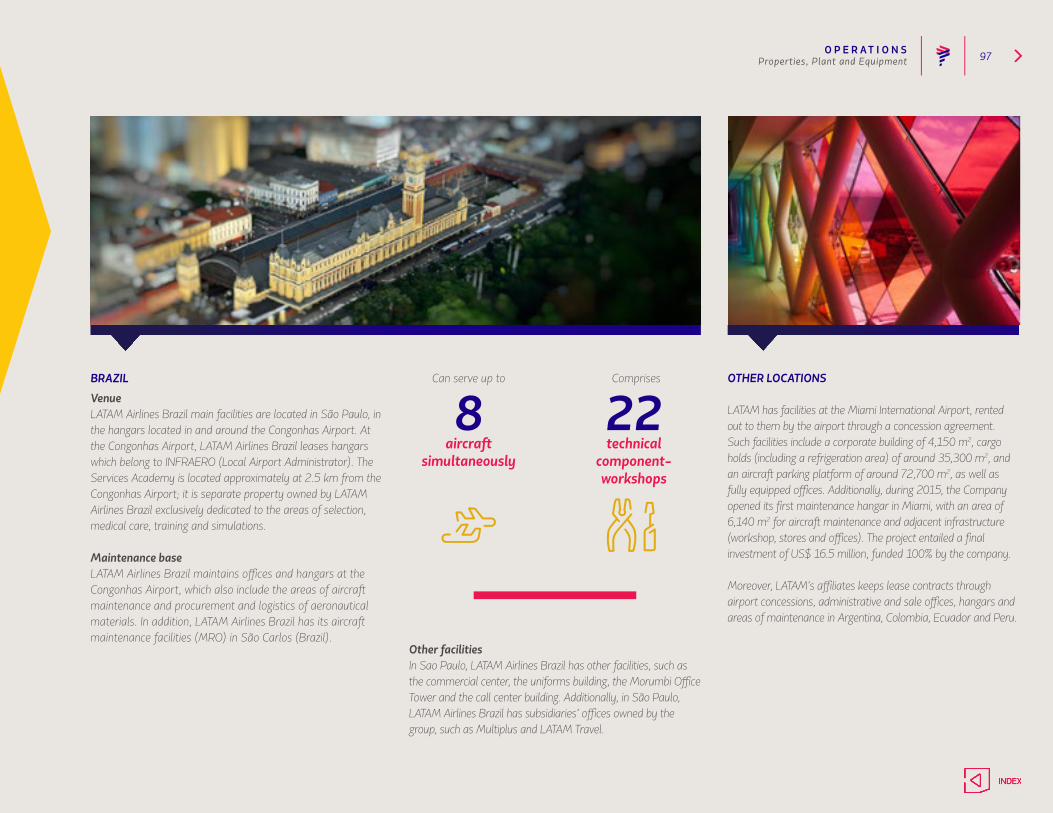
O P E R AT I O N S 97
BRAZIL
VenueLATAM Airlines Brazil main facilities are located in São Paulo, in the hangars located in and around the Congonhas Airport. At the Congonhas Airport, LATAM Airlines Brazil leases hangars which belong to INFRAERO (Local Airport Administrator). The Services Academy is located approximately at 2.5 km from the Congonhas Airport; it is separate property owned by LATAM Airlines Brazil exclusively dedicated to the areas of selection, medical care, training and simulations.
Maintenance baseLATAM Airlines Brazil maintains offices and hangars at the Congonhas Airport, which also include the areas of aircraft maintenance and procurement and logistics of aeronautical materials. In addition, LATAM Airlines Brazil has its aircraft maintenance facilities (MRO) in São Carlos (Brazil).
Other facilitiesIn Sao Paulo, LATAM Airlines Brazil has other facilities, such as the commercial center, the uniforms building, the Morumbi Office Tower and the call center building. Additionally, in São Paulo, LATAM Airlines Brazil has subsidiaries’ offices owned by the group, such as Multiplus and LATAM Travel.
OTHER LOCATIONS
LATAM has facilities at the Miami International Airport, rented out to them by the airport through a concession agreement. Such facilities include a corporate building of 4,150 m2, cargo holds (including a refrigeration area) of around 35,300 m2, and an aircraft parking platform of around 72,700 m2, as well as fully equipped offices. Additionally, during 2015, the Company opened its first maintenance hangar in Miami, with an area of 6,140 m2 for aircraft maintenance and adjacent infrastructure (workshop, stores and offices). The project entailed a final investment of US$ 16.5 million, funded 100% by the company.
Moreover, LATAM’s affiliates keeps lease contracts through airport concessions, administrative and sale offices, hangars and areas of maintenance in Argentina, Colombia, Ecuador and Peru.
Properties, Plant and Equipment
aircraftsimultaneously
8Can serve up to
technicalcomponent-workshops
22Comprises
Committed to take care that drams reach their destination.
M A N A -
G E M E N T
2 0 1 7
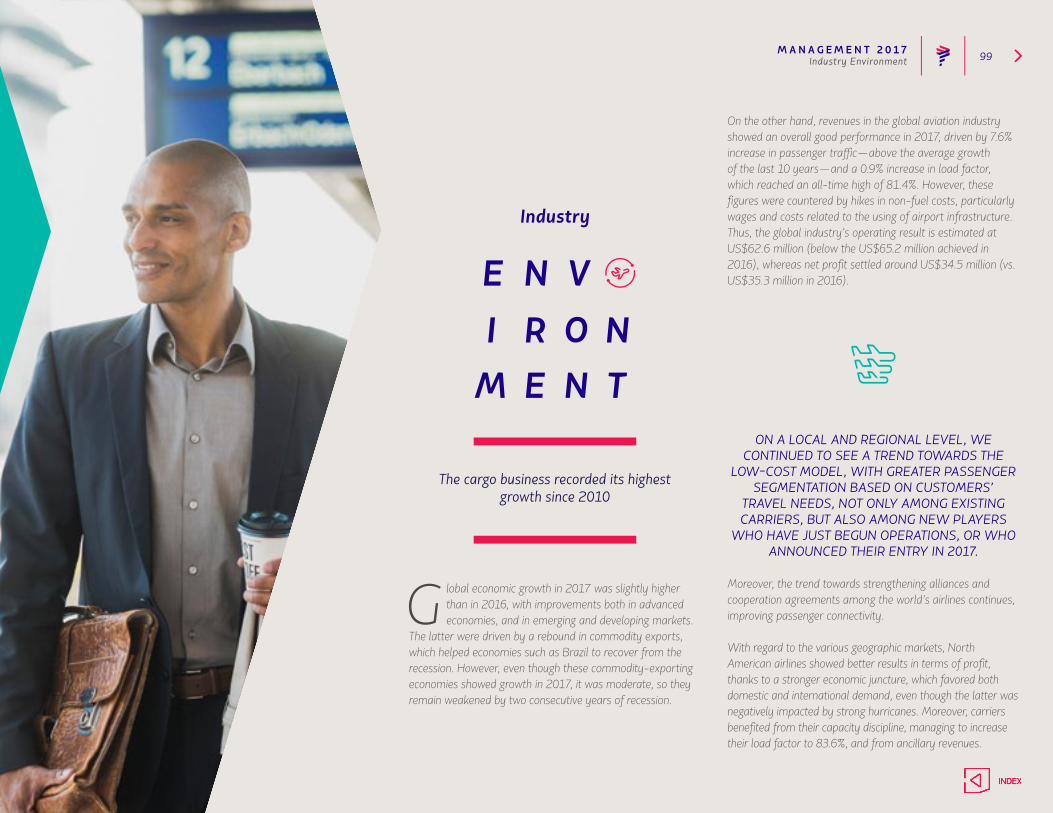
M A N A G E M E N T 2 0 1 7 99Industry Environment
On the other hand, revenues in the global aviation industry showed an overall good performance in 2017, driven by 7.6% increase in passenger traffic—above the average growth of the last 10 years—and a 0.9% increase in load factor, which reached an all-time high of 81.4%. However, these figures were countered by hikes in non-fuel costs, particularly wages and costs related to the using of airport infrastructure. Thus, the global industry’s operating result is estimated at US$62.6 million (below the US$65.2 million achieved in 2016), whereas net profit settled around US$34.5 million (vs. US$35.3 million in 2016).
ON A LOCAL AND REGIONAL LEVEL, WE CONTINUED TO SEE A TREND TOWARDS THE
LOW-COST MODEL, WITH GREATER PASSENGER SEGMENTATION BASED ON CUSTOMERS’
TRAVEL NEEDS, NOT ONLY AMONG EXISTING CARRIERS, BUT ALSO AMONG NEW PLAYERS
WHO HAVE JUST BEGUN OPERATIONS, OR WHO ANNOUNCED THEIR ENTRY IN 2017.
Moreover, the trend towards strengthening alliances and cooperation agreements among the world’s airlines continues, improving passenger connectivity.
With regard to the various geographic markets, North American airlines showed better results in terms of profit, thanks to a stronger economic juncture, which favored both domestic and international demand, even though the latter was negatively impacted by strong hurricanes. Moreover, carriers benefited from their capacity discipline, managing to increase their load factor to 83.6%, and from ancillary revenues.
Industry
The cargo business recorded its highestgrowth since 2010
G lobal economic growth in 2017 was slightly higher than in 2016, with improvements both in advanced economies, and in emerging and developing markets.
The latter were driven by a rebound in commodity exports, which helped economies such as Brazil to recover from the recession. However, even though these commodity-exporting economies showed growth in 2017, it was moderate, so they remain weakened by two consecutive years of recession.
M A N A G E M E N T 2 0 1 7 100
In Europe, the aviation industry’s profit showed a spike from the previous year, partly because in 2016, growth was hampered by the various terrorist attacks in the region, but also given an improvement in passenger traffic (as it was the second region with the highest growth, just behind Asia Pacific), together with the highest load factor in the industry (83.9%). This managed to counter the low yields resulting from strong competition as a consequence of being an open aviation area, and due to the high regulation costs.
Asia Pacific was the region with the most growth in terms of PAX traffic, driven by the large domestic markets of the region (India, China, and Russia). Overall, Asian airlines reported higher profit than in 2016, aided by improvements in the cargo business.
As for Latin America, the economies in recession (Brazil, Argentina, and Ecuador) showed some recovery in 2017. Together with their currencies’ appreciation (thanks to stronger commodity prices), this managed to counter the weaker growth seen in Chile, Peru, and Colombia. On the other hand, the aviation industry benefited from traffic growth both in domestic and international markets (despite the natural disasters experienced throughout the year). Together with the overall industry’s sound capacity discipline, this helped to increase the
load factor to 81.8%. Thereby, airlines in the Latin American industry managed to keep their profits at US$0.7 billion.
AS FOR THE CARGO BUSINESS, TRAFFIC ROSE 9.0% IN 2017—THE LARGEST EXPANSION SINCE 2010—DRIVEN BY HIGH DEMAND FOR MANUFACTURED
PRODUCTS, MAINLY FROM EUROPE (WHOSE CARGO TRAFFIC INCREASED BY 11.8%).
Added to the industry’s capacity discipline, this led to a recovery in load factor, which settled at 45.5%. On the other hand, after two consecutive years of declines, the cargo business in Latin America reported traffic growth (+5.7%) aided by a recovery in the Brazilian economy.
Given the industry’s current structure, the International Air Transport Association (IATA) expects better net profits for the worlds aviation industry in 2018, settling around US$38.4 billion, with an operating margin of 8.1%. This improvement
could be mainly explained by strong economic growth worldwide, which would drive traffic growth above capacity expansions. Nonetheless, this would be largely countered by the higher fuel prices expected in 2018, as well as a sustained increase in unit costs ex-fuel. We must note that emerging economies, mainly Asia Pacific, Middle East, and Latin America, will remain the drivers of global traffic growth in 2018. This trend should remain for the next 20 years, given the economic growth projections of these regions, as well as the low penetration of air travel in their countries.
Industry Environment
M A N A G E M E N T 2 0 1 7 101Regulatory Framework
CHILE’S AERONAUTIC REGULATIONSBoth the General Bureau of Civil Aviation (DGAC, in its Spanish acronym) as well as the Civil Aeronautics Board (JAC, in its Spanish acronym) supervise and regulate Chile’s aviation industry. The DGAC reports directly to the Chilean Air Force and is responsible for ensuring compliance of the country’s laws and regulations governing aviation. The JAC is Chile’s civil aviation authority.
Primarily by virtue of Executive Order N° 2,564, that governs civil aviation, the JAC regulates the allocation of domestic and international routes and the DGAC regulates flight operations, which include personnel, aircraft, security levels, air traffic control and airport management.
WE OBTAINED AND CONTINUE TO HAVE THE AUTHORIZATION THAT IS REQUIRED BY THE CHILEAN GOVERNMENT TO PERFORM FLIGHT OPERATIONS, INCLUDING THE JAC
CERTIFICATES AND THE DGAC OPERATIVE AND TECHNICAL CERTIFICATES, WHOSE PERIOD OF EFFECTIVENESS ARE SUBJECT TO THE
CONTINUOUS COMPLIANCE WITH THE STATUTES, RULES AND REGULATIONS THAT GOVERN THE
AERONAUTIC INDUSTRY, INCLUDING ANY RULE OR REGULATION TO BE ISSUED IN THE FUTURE.
Chile is a signatory state as well as a permanent member of the International Civil Aviation Organization (ICAO), a United Nations organization established in 1947 aimed at assisting in the planning and development of international air transport.
The ICAO establishes the international aeronautic industry’s technical guidelines; which, in turn, have been incorporated into our country’s laws and regulations by the Chilean authorities.
In the absence of an applicable Chilean standard related to security or maintenance matters, the DGAC has incorporated most of OACI’s technical guidelines by way of references. We are certain to comply with all relevant technical guidelines.
ROUTING RIGHTSNational routesChilean Airlines are not required to obtain permits to transport passengers or cargo on domestic routes, but only to comply with the technical and insurance requirements established by the DGAC and the JAC, respectively. Nevertheless, there are no regulatory barriers preventing foreign airlines to create a Chilean subsidiary company and enter the country’s domestic market via such subsidiary. On January 18, 2012, Chile’s Transportation Ministry and Economics Ministry announced that the country was adopting a unilateral open skies policy. The foregoing was subsequently confirmed on November 2013 and remains in effect to this date.
International routes
AS AN AIRLINE THAT PROVIDES SERVICES IN INTERNATIONAL ROUTES, LATAM AIRLINES IS ALSO SUBJECT TO A NUMBER OF BILATERAL
INTERNATIONAL CIVIL TRANSPORTATION AGREEMENTS THAT ESTABLISH RECIPROCAL AIR TRAFFIC RIGHTS BETWEEN CHILE AND SEVERAL
OTHER COUNTRIES.
Since there is no guarantee whatsoever that such currently existing bilateral agreements between Chile and those foreign governments will remain in effect, a modification, suspension or revocation of one or more of such international agreements could damage our operations and financial results.
International route rights, as well as their corresponding landing rights, are derived from a number of international transport agreements negotiated between Chile and other foreign governments. By virtue of such agreements, the government of one of such countries grants another government the right to assign the operation of scheduled flight services between certain destinations of that country to one or more of its domestic airlines.
Regulatory
B elow we provide a brief reference about the important effects of ae ronautic regulations, free competition and other type of regulations that ap ply in Chile.
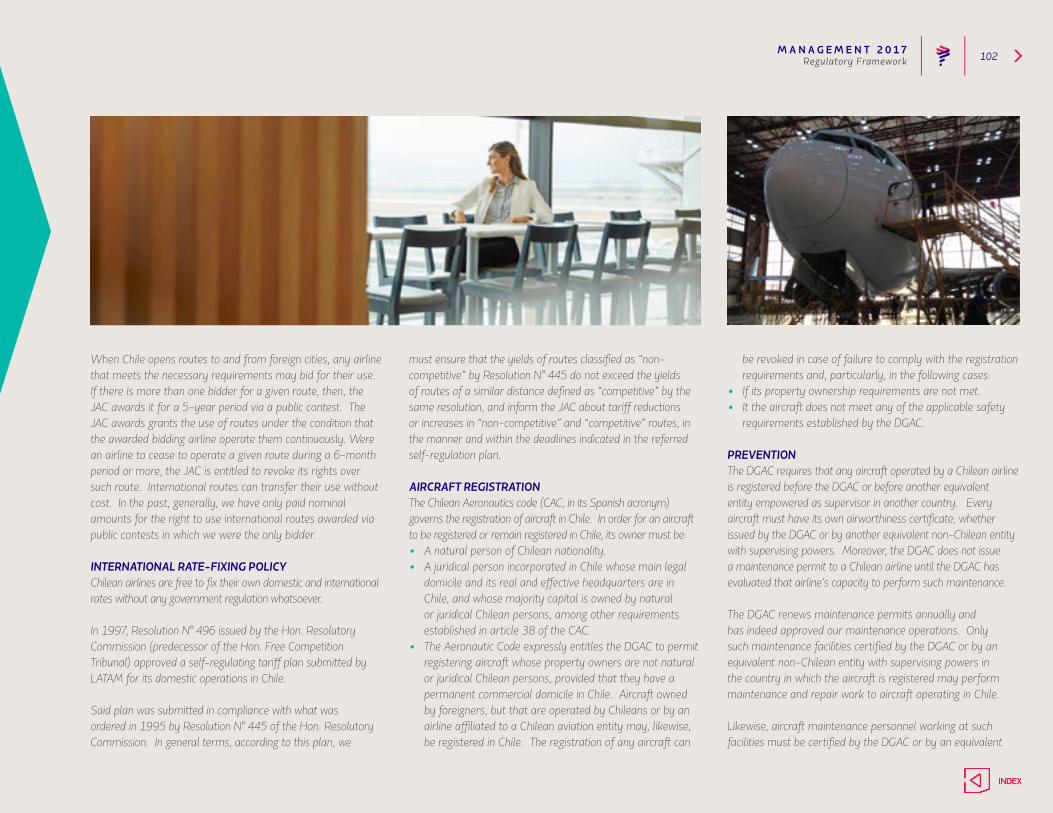
M A N A G E M E N T 2 0 1 7 102
When Chile opens routes to and from foreign cities, any airline that meets the necessary requirements may bid for their use. If there is more than one bidder for a given route, then, the JAC awards it for a 5-year period via a public contest. The JAC awards grants the use of routes under the condition that the awarded bidding airline operate them continuously. Were an airline to cease to operate a given route during a 6-month period or more, the JAC is entitled to revoke its rights over such route. International routes can transfer their use without cost. In the past, generally, we have only paid nominal amounts for the right to use international routes awarded via public contests in which we were the only bidder.
INTERNATIONAL RATE-FIXING POLICYChilean airlines are free to fix their own domestic and international rates without any government regulation whatsoever.
In 1997, Resolution N° 496 issued by the Hon. Resolutory Commission (predecessor of the Hon. Free Competition Tribunal) approved a self-regulating tariff plan submitted by LATAM for its domestic operations in Chile.
Said plan was submitted in compliance with what was ordered in 1995 by Resolution N° 445 of the Hon. Resolutory Commission. In general terms, according to this plan, we
must ensure that the yields of routes classified as “non-competitive” by Resolution N° 445 do not exceed the yields of routes of a similar distance defined as “competitive” by the same resolution, and inform the JAC about tariff reductions or increases in “non-competitive” and “competitive” routes, in the manner and within the deadlines indicated in the referred self-regulation plan.
AIRCRAFT REGISTRATIONThe Chilean Aeronautics code (CAC, in its Spanish acronym) governs the registration of aircraft in Chile. In order for an aircraft to be registered or remain registered in Chile, its owner must be:• A natural person of Chilean nationality.• A juridical person incorporated in Chile whose main legal
domicile and its real and effective headquarters are in Chile, and whose majority capital is owned by natural or juridical Chilean persons, among other requirements established in article 38 of the CAC.
• The Aeronautic Code expressly entitles the DGAC to permit registering aircraft whose property owners are not natural or juridical Chilean persons, provided that they have a permanent commercial domicile in Chile. Aircraft owned by foreigners, but that are operated by Chileans or by an airline affiliated to a Chilean aviation entity may, likewise, be registered in Chile. The registration of any aircraft can
be revoked in case of failure to comply with the registration requirements and, particularly, in the following cases:
• If its property ownership requirements are not met. • It the aircraft does not meet any of the applicable safety
requirements established by the DGAC.
PREVENTIONThe DGAC requires that any aircraft operated by a Chilean airline is registered before the DGAC or before another equivalent entity empowered as supervisor in another country. Every aircraft must have its own airworthiness certificate; whether issued by the DGAC or by another equivalent non-Chilean entity with supervising powers. Moreover, the DGAC does not issue a maintenance permit to a Chilean airline until the DGAC has evaluated that airline’s capacity to perform such maintenance.
The DGAC renews maintenance permits annually and has indeed approved our maintenance operations. Only such maintenance facilities certified by the DGAC or by an equivalent non-Chilean entity with supervising powers in the country in which the aircraft is registered may perform maintenance and repair work to aircraft operating in Chile.
Likewise, aircraft maintenance personnel working at such facilities must be certified by the DGAC or by an equivalent
Regulatory Framework
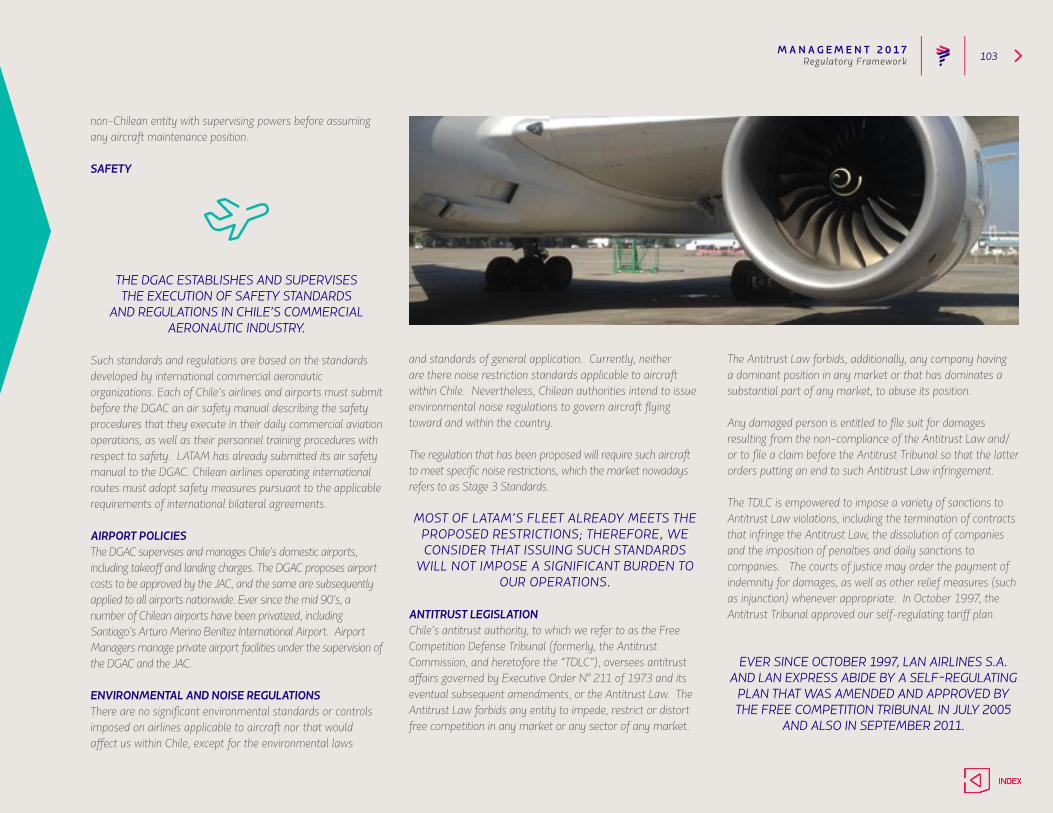
M A N A G E M E N T 2 0 1 7 103
non-Chilean entity with supervising powers before assuming any aircraft maintenance position.
SAFETY
THE DGAC ESTABLISHES AND SUPERVISES THE EXECUTION OF SAFETY STANDARDS
AND REGULATIONS IN CHILE’S COMMERCIAL AERONAUTIC INDUSTRY.
Such standards and regulations are based on the standards developed by international commercial aeronautic organizations. Each of Chile’s airlines and airports must submit before the DGAC an air safety manual describing the safety procedures that they execute in their daily commercial aviation operations, as well as their personnel training procedures with respect to safety. LATAM has already submitted its air safety manual to the DGAC. Chilean airlines operating international routes must adopt safety measures pursuant to the applicable requirements of international bilateral agreements.
AIRPORT POLICIESThe DGAC supervises and manages Chile’s domestic airports, including takeoff and landing charges. The DGAC proposes airport costs to be approved by the JAC, and the same are subsequently applied to all airports nationwide. Ever since the mid 90’s, a number of Chilean airports have been privatized, including Santiago’s Arturo Merino Benítez International Airport. Airport Managers manage private airport facilities under the supervision of the DGAC and the JAC.
ENVIRONMENTAL AND NOISE REGULATIONSThere are no significant environmental standards or controls imposed on airlines applicable to aircraft nor that would affect us within Chile, except for the environmental laws
and standards of general application. Currently, neither are there noise restriction standards applicable to aircraft within Chile. Nevertheless, Chilean authorities intend to issue environmental noise regulations to govern aircraft flying toward and within the country.
The regulation that has been proposed will require such aircraft to meet specific noise restrictions, which the market nowadays refers to as Stage 3 Standards.
MOST OF LATAM’S FLEET ALREADY MEETS THE PROPOSED RESTRICTIONS; THEREFORE, WE CONSIDER THAT ISSUING SUCH STANDARDS
WILL NOT IMPOSE A SIGNIFICANT BURDEN TO OUR OPERATIONS.
ANTITRUST LEGISLATIONChile’s antitrust authority, to which we refer to as the Free Competition Defense Tribunal (formerly, the Antitrust Commission, and heretofore the “TDLC”), oversees antitrust affairs governed by Executive Order N° 211 of 1973 and its eventual subsequent amendments, or the Antitrust Law. The Antitrust Law forbids any entity to impede, restrict or distort free competition in any market or any sector of any market.
The Antitrust Law forbids, additionally, any company having a dominant position in any market or that has dominates a substantial part of any market, to abuse its position.
Any damaged person is entitled to file suit for damages resulting from the non-compliance of the Antitrust Law and/or to file a claim before the Antitrust Tribunal so that the latter orders putting an end to such Antitrust Law infringement.
The TDLC is empowered to impose a variety of sanctions to Antitrust Law violations, including the termination of contracts that infringe the Antitrust Law, the dissolution of companies and the imposition of penalties and daily sanctions to companies. The courts of justice may order the payment of indemnity for damages, as well as other relief measures (such as injunction) whenever appropriate. In October 1997, the Antitrust Tribunal approved our self-regulating tariff plan.
EVER SINCE OCTOBER 1997, LAN AIRLINES S.A. AND LAN EXPRESS ABIDE BY A SELF-REGULATING
PLAN THAT WAS AMENDED AND APPROVED BY THE FREE COMPETITION TRIBUNAL IN JULY 2005
AND ALSO IN SEPTEMBER 2011.
Regulatory Framework

M A N A G E M E N T 2 0 1 7 104
In February 2010, the National Economic Affairs Investigation Bureau (FNE, in its Spanish Acronym) completed the investigation initiated in 2007 with respect to our compliance with our self-regulating plan and no further observations were made.
By virtue of Resolution N° 37/2011, issued on September 21, 2011 (the “Resolution”), Chile’s Hon. Free Competition Defense Tribunal approved the association between LAN and TAM, imposing 14 mitigation measures to LATAM, whose scope and regulation is established in the Resolution, as summarized below by way of reference:
1. To exchange 4 pairs of daily slots at the Guarulhos Airport in Sao Paulo, to be used exclusively for servicing non-stop flights along the SCL-GRU route.
2. To extend for a 5-year period its frequent flyer program to those airlines that operate (or state their interest in operating) the Santiago-Sao Paulo, Santiago-Río de Janeiro, Santiago-Montevideo and Santiago-Asunción routes, that apply to LATAM for an extension of the referred program for such route(s).
3. To execute inter-line agreements along the Santiago-Sao Paulo, Santiago-Río de Janeiro, and/or Santiago-Asunción routes, with those airlines interested in operating such routes and that so request it.
4. To adhere to certain temporary capacity and supply restrictions along the Santiago-Sao Paulo route.
5. To introduce and execute certain amendments into
LATAM’s Self-regulatory Tariff Plan, applicable to its domestic operations.
6. To renounce, before June 22, 2014, to one of the two worldwide alliances that LAN and TAM belonged to prior to the date of the Resolution.
7. To adhere to certain restrictions in the execution and maintenance of code-sharing agreements (without prior consultation with the Free Competition Defense Tribunal) along certain routes and with member airlines or associates of an alliance other than that to which LATAM belongs.
Regulatory Framework
M A N A G E M E N T 2 0 1 7 105
8. To adhere to certain restrictions, in their future bidding contest bids, regarding 3rd, 4th and 5th freedom rights between Santiago and Lima; and to renounce to four 5th freedom frequencies to Lima.
9. To express before air transport authorities their favorable opinion regarding Chile’s unilateral open skies policy for domestic air traffic by airlines of other States, without requiring reciprocity.
10. To commit, in all pertinent matters, to promote the growth and normal operations of the airports of Guarulhos in São Paulo and Arturo Merino Benítez in Santiago.
11. To adhere to certain guidelines in the granting of incentives to travel agencies.
12. To temporarily maintain, except in cases of force majeure: i) at least 12 non-stop round-trip flights per week, directly operated by LATAM, in the routes between Chile and the United States; and, ii) at least 7 non-stop round-trip flights per week, directly operated by LATAM, in the routes between Chile and Europe.
13. To adhere to certain restrictions: in the average price of passenger transport airfares, corresponding to the Santiago-Sao Paulo and Santiago Río de Janeiro routes; and in the rates in effect and published, as of the date of the Resolution, for the transport of cargo in each of the routes between Chile and Brazil.
14. To hire an independent consultant, so that such third party provides advice to the FNE for a 3-year period in the supervision of LATAM’s compliance with the Resolution.
Brazil’s Administrative Council for Economic Defense (CADE, in its Portuguese acronym) unanimously approved the association between LAN and TAM at its meeting on December 14, 2011, subject to the following conditions:
1. The new group (LATAM) must renounce to one of the two worldwide alliances in which it heretofore participated (Star Alliance or OneWorld);
2. and, it must offer to exchange 2 pairs of slots at the Gaurulhos International Airport for them to be used by a third-party interested in offering direct non-stop flights between Sao Paulo and Santiago, Chile.
The aforementioned conditions are consistent with the mitigation measures adopted in Chile by the TDLC.
Regulatory Framework
ADDITIONALLY, THE ASSOCIATION BETWEEN LAN AND TAM WAS SUBMITTED BEFORE THE
FREE COMPETITION AUTHORITIES OF GERMANY, ITALY AND SPAIN. ALL THESE JURISDICTIONS
GRANTED THEIR UNCONDITIONAL APPROVAL OF THIS OPERATION.
M A N A G E M E N T 2 0 1 7 106
Revenues totaled US$10.163 billion in 2017—a 6.7% growth compared to 2016—and the first annual increase in revenues since the business combination of LAN and TAM. This is mainly explained by a 7.8% increase in PAX revenues, added to a 0.8% rise in cargo revenues and a 2.1% advance in others.
THIS GROWTH WAS MAINLY DUE TO A 6.7% RISE IN RASK, GIVEN A 5.9% EXPANSION IN YIELDS
AND A 0.6 PERCENTAGE-POINT ADVANCE IN LOAD FACTOR, WHICH SETTLED AT 84.8%, COMPARED
THE PREVIOUS YEAR.
In 2017, we recorded improvements in revenues per ASK across all the passenger business units of the Group (International, Brazil Domestic, and Spanish Speaking Countries Domestic). These improvements were boosted by the development of our business strategy, and capacity discipline in weakened markets; together with an overall better economic environment in the markets were we operate, and the appreciation of local currencies (especially the Brazilian Real and the Chilean Peso).
As for capacity, it rose 1.1% in 2017, driven by a 3.8% increase in the international business’ capacity, focused on strengthening our international hubs from where we have started to operate new routes, including Santiago-Melbourne (whose 15-hour duration makes it LATAM’ longest non-stop flight), countered by a contraction in routes with lower demand, such as operations between Brazil and the US. On the other hand, capacity in the Spanish-speaking domestic markets decreased 0.1%, mainly affected by the Argentinean and Peruvian markets.
Moreover, during 2017, we continued to adjust the size of our operations in the Brazilian domestic market, achieving a 3.8% reduction in our supply.
Financial Results
Financial
LATAM Group Airlines reported an operating income of US$714.5 million in 2017—a 25.8% increase compared to 2016. Operating margin reached 7.0%, translating into
a 1.0 percentage-point increase from the previous year. The improvement in LATAM’s results was mainly due to a recovery in unit revenues throughout its business units, countering the hike in costs resulting from an increase in fuel prices.

M A N A G E M E N T 2 0 1 7 107
Cargo revenues rose to US$1.119 billion, translating into a 0.8% increase vs. 2016. This recovery is attributed to a 2.1% hike in cargo yields, added to a 3.2 percentage-point improvement in load factor compared to 2016, to settle at 54.9%. These results were seen in the context of an improvement in the global air cargo market, following several years of declines, added to the capacity adjustments that LATAM Cargo Group has been implementing over the last few years, and to the ongoing improvement of imports from North America and Europe to Brazil—namely, electronic appliances and spare parts.
Operating costs in 2017 reached US$9.449 billion—a 5.5% increase compared to 2016—resulting in a 4.4% advance in the cost per ASK. The cost increase is mainly due to the 21.1% hike in fuel prices, which was partially countered by the cost-reduction program that LATAM Group has been implementing.
Fuel expenses increased 12.7% in 2017, totaling $2.318 billion. The increase is mainly due to the hike in fuel prices, which was partially countered by a 3.5% reduction in fuel consumption per ASK, as a result of the fuel efficiency programs and an increasingly more efficient fleet.
Moreover, in 2017, the Company recognized a US$15.2 million gain from fuel hedges, compared to a US$48.1 million loss in 2016. As for FX hedges, the Company reported a US$9.9 million loss in this line in 2017, compared to a US$40.1 million exchange loss in the previous year.
WAGES AND BENEFITS EXPENSES INCREASED 3.7% IN 2017, DUE TO INFLATION ADJUSTMENTS (USING 2016 RATES), PARTICULARLY IN BRAZIL,
AND THE APPRECIATION OF LOCAL CURRENCIES.
This was partially countered by a 9.7% reduction in the average payroll during 2017, in line with the decrease in domestic offer carried out by LATAM Airlines Brazil, and the efficiency initiatives that the Group is implementing.
As for non-operating results, the Company reported a non-cash loss of US$18.7 million in foreign exchange in 2017, explained mainly by the depreciation of the Brazilian real in the last quarter of the year, compared to a US$121.7 million gain in 2016.
Thus, LATAM reported a net gain of US$155.3 million, attributable to controlling shareholders, compared to a US$69.2 million gain in 2016. This implies a positive net margin of 1.5%, translating into a 0.8 percentage-point increase compared to the net margin reported in 2016.
Financial Results
THE COST INCREASE IS MAINLY DUE TO THE 21.1% HIKE IN FUEL PRICES, WHICH
WAS PARTIALLY COUNTERED BY THE COST-REDUCTION PROGRAM THAT THE COMPANY HAS
BEEN IMPLEMENTING.
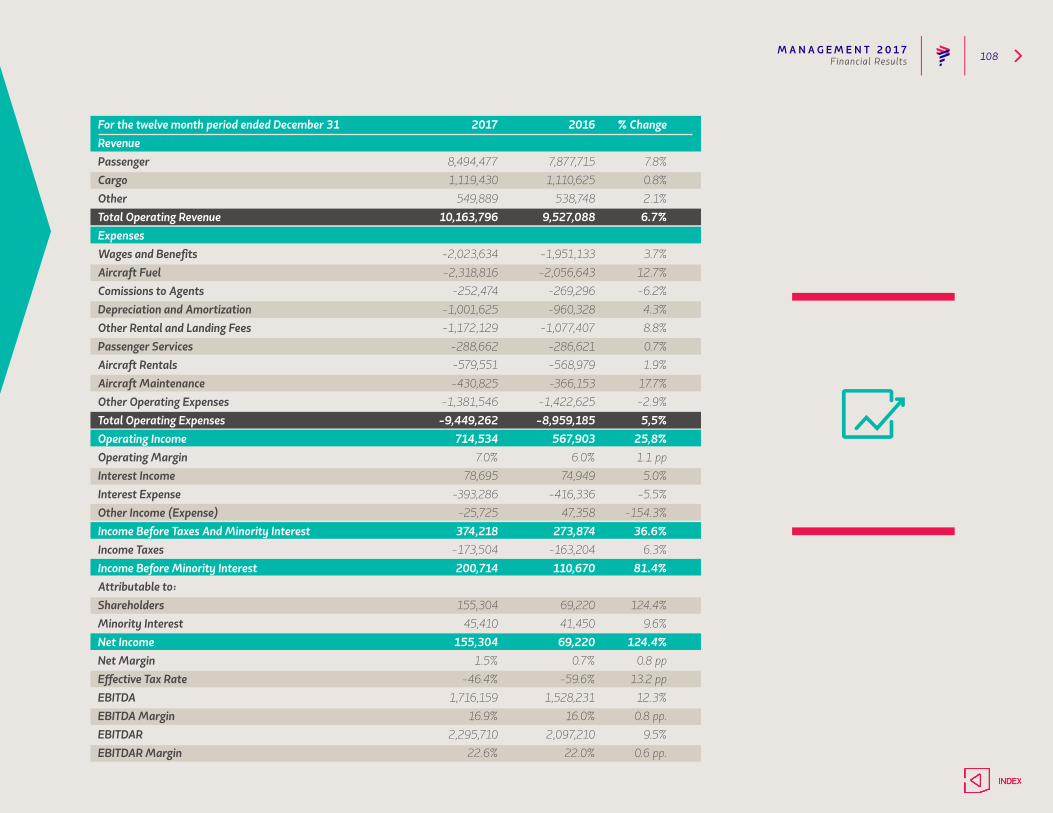
M A N A G E M E N T 2 0 1 7 108Financial Results
For the twelve month period ended December 31 2017 2016 % ChangeRevenuePassenger 8,494,477 7,877,715 7.8%Cargo 1,119,430 1,110,625 0.8%Other 549,889 538,748 2.1%Total Operating Revenue 10,163,796 9,527,088 6.7%ExpensesWages and Benefits -2,023,634 -1,951,133 3.7%Aircraft Fuel -2,318,816 -2,056,643 12.7%Comissions to Agents -252,474 -269,296 -6.2%Depreciation and Amortization -1,001,625 -960,328 4.3%Other Rental and Landing Fees -1,172,129 -1,077,407 8.8%Passenger Services -288,662 -286,621 0.7%Aircraft Rentals -579,551 -568,979 1.9%Aircraft Maintenance -430,825 -366,153 17.7%Other Operating Expenses -1,381,546 -1,422,625 -2.9%Total Operating Expenses -9,449,262 -8,959,185 5,5%Operating Income 714,534 567,903 25,8%Operating Margin 7.0% 6.0% 1.1 ppInterest Income 78,695 74,949 5.0%Interest Expense -393,286 -416,336 -5.5%Other Income (Expense) -25,725 47,358 -154.3%Income Before Taxes And Minority Interest 374,218 273,874 36.6%Income Taxes -173,504 -163,204 6.3%Income Before Minority Interest 200,714 110,670 81.4%Attributable to:Shareholders 155,304 69,220 124.4%Minority Interest 45,410 41,450 9.6%Net Income 155,304 69,220 124.4%Net Margin 1.5% 0.7% 0.8 ppEffective Tax Rate -46.4% -59.6% 13.2 ppEBITDA 1,716,159 1,528,231 12.3%EBITDA Margin 16.9% 16.0% 0.8 pp.EBITDAR 2,295,710 2,097,210 9.5%EBITDAR Margin 22.6% 22.0% 0.6 pp.
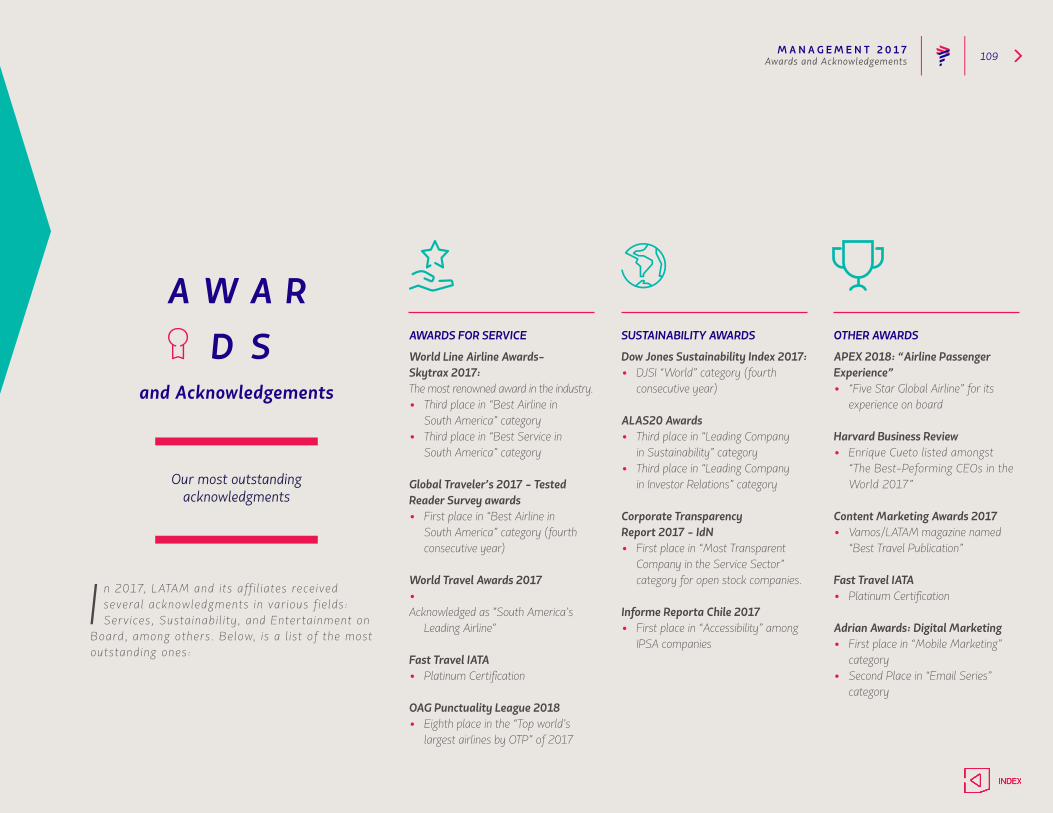
M A N A G E M E N T 2 0 1 7 109
AWARDS FOR SERVICE
World Line Airline Awards-Skytrax 2017:The most renowned award in the industry.• Third place in “Best Airline in South America” category• Third place in “Best Service in South America” category
Global Traveler’s 2017 - TestedReader Survey awards• First place in “Best Airline in
South America” category (fourth consecutive year)
World Travel Awards 2017• Acknowledged as "South America’s
Leading Airline"
Fast Travel IATA• Platinum Certification
OAG Punctuality League 2018• Eighth place in the “Top world’s
largest airlines by OTP” of 2017
SUSTAINABILITY AWARDS
Dow Jones Sustainability Index 2017:• DJSI “World” category (fourth
consecutive year)
ALAS20 Awards• Third place in “Leading Company in Sustainability” category• Third place in “Leading Company in Investor Relations” category
Corporate TransparencyReport 2017 - IdN• First place in “Most Transparent
Company in the Service Sector” category for open stock companies.
Informe Reporta Chile 2017• First place in “Accessibility” among
IPSA companies
OTHER AWARDS
APEX 2018: “Airline Passenger Experience”• “Five Star Global Airline” for its
experience on board
Harvard Business Review• Enrique Cueto listed amongst
“The Best-Peforming CEOs in the World 2017”
Content Marketing Awards 2017• Vamos/LATAM magazine named
“Best Travel Publication”
Fast Travel IATA• Platinum Certification
Adrian Awards: Digital Marketing • First place in “Mobile Marketing”
category• Second Place in “Email Series”
category
Awards and Acknowledgements
and Acknowledgements
Our most outstandingacknowledgments
I n 2017, LATAM and i ts aff i l iates received several acknowledgments in var ious f ie lds: Serv ices, Sustainabi l i ty, and Enter tainment on
Board, among others. Below, is a l ist of the most outstanding ones:

M A N A G E M E N T 2 0 1 7 110Material Facts
JANUARY 24 CHANGES IN MANAGEMENT
In accordance with Articles 9 and the second paragraph of Article 10 of the Securities Market Law, and pursuant to General Regulation N° 30 of the Commissioner, the undersigned, duly authorized, reports the following MATERIAL FACT from LATAM Airlines Group S.A. ("LATAM" or the “Company”), Securities Registry No. 306:
Today the Company’s Board of Directors decided to appoint Mr. Giles Agutter as director in the vacant position left by Mr. Ricardo Caballero following his resignation last June; a position that had been unfilled to date.
Notwithstanding this appointment, and as reported at the time of Mr. Caballero's resignation, the Company's Board of Directors must be completely renewed at the next LATAM Regular Shareholders' Meeting.
Facts
MARCH 15 CHANGES IN MANAGEMENT
In accordance with Articles 9 and the second paragraph of Article 10 of the Securities Market Law, and pursuant to General Regulation N° 30 of the Commissioner, the undersigned, duly authorized, reports the following MATERIAL FACT from LATAM Airlines Group S.A. ("LATAM" or the “Company”), Securities Registry No. 306:
AS PART OF LATAM’S REORGANIZATION IN SEVERAL DIVISIONS OF ITS BUSINESS AND WITH
THE OBJECTIVE OF PREPARING THE ORGANIZATION FOR FUTURE CHALLENGES, THE COMPANY
ANNOUNCES THAT MR. IGNACIO JAVIER CUETO PLAZA, CEO OF LAN AIRLINES S.A., WILL LEAVE
THE COMPANY IN APRIL 15, 2017.
APRIL 05 DEFINITIVE DIVIDEND DISTRIBUTION PROPOSAL
In accordance with the provisions of Circular No. 660, dated October 22, 1986, of your Superintendency, and duly authorized, I comply with informing this Superintendency, as a Material Fact, that in meeting held on April 4, 2017, the Board of Directors resolved to propose to the Ordinary Shareholders' Meeting, summoned for April 27, 2017, the distribution of Dividend No. 48, Definitive, up to complete the 30% of net income for the year 2016, that is, the equivalent amount in Chilean pesos of USD 20,766,119.39, which means to distribute a dividend of USD 0.0342444854 per share, payable on Thursday, May 18, 2017, in its equivalent in Chilean pesos according to the exchange rate "observed", published in the Official Journal on the fifth business day prior to the distribution day, that is, on May 12, 2017. In the event that the dividend is approved in the terms proposed by the Board of Directors, will be entitled to receive the dividend
INDEX
M A N A G E M E N T 2 0 1 7 111Material Facts
the shareholders registered at the Shareholders' Registry at midnight on May 12, 2017.
APRIL 6 PLACEMENT OF SECURITIES IN INTERNATIONAL AND/OR DOMESTIC MARKETS
In accordance with the provisions of Articles 9 and 10 of Law No. 18,045 on Securities Market and General Rule No. 30 of the Superintendence under its responsibility, the undersigned, duly empowered for this purpose, reports as a Material Fact, the following:
(a) On this date, LATAM Finance Limited (the "Issuer"), an exempted company incorporated in the Cayman Islands with limited liability and a wholly owned subsidiary of LATAM Airlines Group S.A. (“LATAM”), has agreed to issue and place on the international market, pursuant to Rule 144-A and Regulation S of the securities laws of the United States of America, senior unsecured notes of US $ 700,000,000 aggregate principal amount, with maturity in the year 2024, at an initial annual interest rate of 6.875% (the “144-A Notes” or the “Issuance”); and
(b) The Issue and placement of the 144-A Notes shall be intended to finance general corporate purposes of LATAM.
In accordance with what is established in Circular No. 988 of the Superintendence of Securities and Insurance, we inform you that at this moment it is not possible to quantify the effects that this operation will have on the results of LATAM, in the event of materialization.
APRIL 27 CHANGES IN MANAGEMENT
As provided in Articles 9 and 10 of Securities Market Law 18045 and in General Rule #30 of the Commission of 1989, please be advised that at an Ordinary Shareholders Meeting (“Meeting”) of LATAM Airlines Group S.A. (“LATAM”) held on April 27, 2017, LATAM’s shareholders elected the members of LATAM’s Board of Directors, who will hold office for two years.
The following individuals were elected Directors at the Meeting:
1. Antonio Luiz Pizarro Manzo;2. Carlos Heller Solari;3. Nicolás Eblen Hirmas;4. Giles Edward Agutter; 5. Henri Philippe Reichstul;6. Ignacio Cueto Plaza; 7. Juan José Cueto Plaza;8. Georges de Bourguignon Arndt; and9. Eduardo Novoa Castellón
The Directors named in numbers 8 and 9 above were elected as independent directors, according to article 50-bis of Companies Law No. 18.046 of the Republic of Chile.
APRIL 27 DEFINITIVE DIVIDEND
In accordance with articles 9 and 10 under the Securities Market Law N°18,045, and as established under the Superintendence’s General Norm No. 30 of 1989, I hereby inform you as material information that at the Ordinary Shareholders Meeting (the “Meeting”) of LATAM Airlines Group S.A. (“ LATAM ”) held today, April 27 th of 2017, the shareholders of LATAM approved the distribution of the final dividend proposed by the Board in the session held last April 4 th , which consists in distributing 30% of the earnings obtained in 2016, equivalent to US$20.766.119,39.
As required by the Superintendence’s Resolution N° 660 of 1986, the Exhibit 1 -that explains in detail the aforementioned final dividend- is attached hereto.
MAY 9 OTHERS
In accordance with Article 9 and the second paragraph of Article 10 of Law No. 18,045 on the Securities Market and with Section II, numeral 2.2 of the Superintendency’s General Rule No. 30 of 1989, and as duly authorized by the Board of the Directors (the “Board of Directors”) of LATAM Airlines Group S.A. (“LATAM”), I inform you as a material fact that, at a meeting of the Board of Directors held today, the following was agreed:
1. To designate the director Mr. Ignacio Cueto Plaza as president of the Board of Directors of LATAM and the director Mr. Carlos Heller Solari as vice-president of the Board of Directors of LATAM.
INDEX
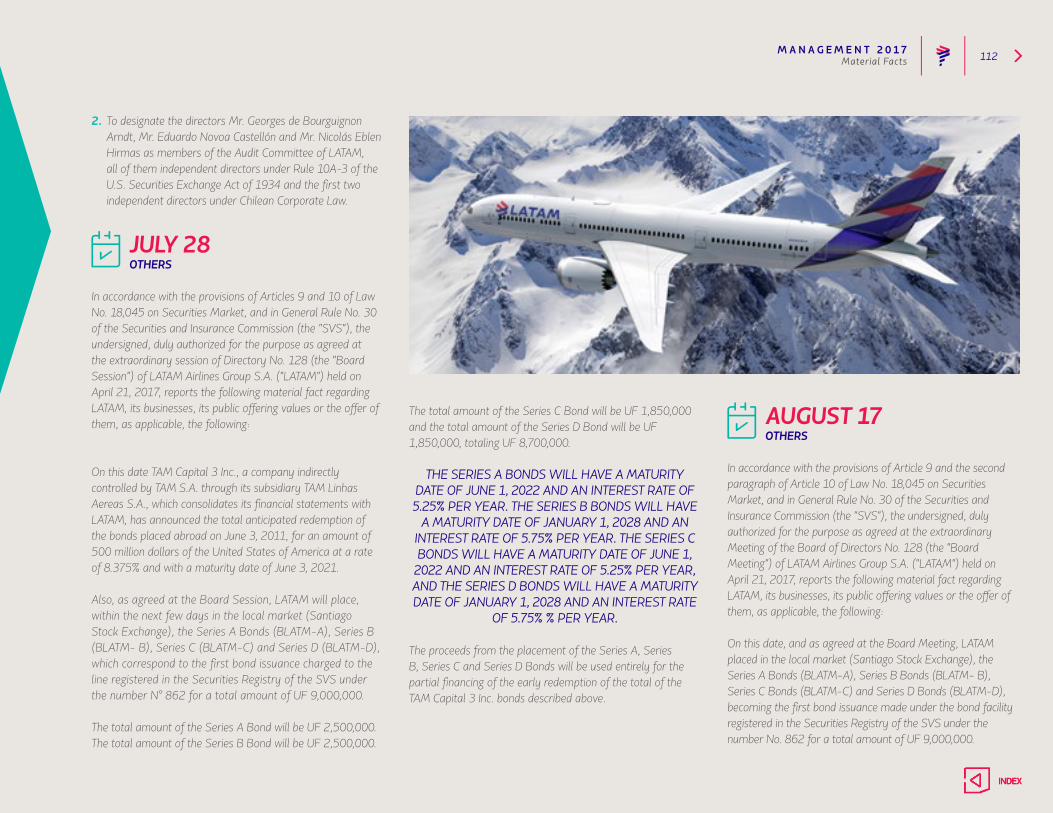
M A N A G E M E N T 2 0 1 7 112Material Facts
2. To designate the directors Mr. Georges de Bourguignon Arndt, Mr. Eduardo Novoa Castellón and Mr. Nicolás Eblen Hirmas as members of the Audit Committee of LATAM, all of them independent directors under Rule 10A-3 of the U.S. Securities Exchange Act of 1934 and the first two independent directors under Chilean Corporate Law.
JULY 28 OTHERS
In accordance with the provisions of Articles 9 and 10 of Law No. 18,045 on Securities Market, and in General Rule No. 30 of the Securities and Insurance Commission (the "SVS"), the undersigned, duly authorized for the purpose as agreed at the extraordinary session of Directory No. 128 (the "Board Session") of LATAM Airlines Group S.A. ("LATAM") held on April 21, 2017, reports the following material fact regarding LATAM, its businesses, its public offering values or the offer of them, as applicable, the following:
On this date TAM Capital 3 Inc., a company indirectly controlled by TAM S.A. through its subsidiary TAM Linhas Aereas S.A., which consolidates its financial statements with LATAM, has announced the total anticipated redemption of the bonds placed abroad on June 3, 2011, for an amount of 500 million dollars of the United States of America at a rate of 8.375% and with a maturity date of June 3, 2021.
Also, as agreed at the Board Session, LATAM will place, within the next few days in the local market (Santiago Stock Exchange), the Series A Bonds (BLATM-A), Series B (BLATM- B), Series C (BLATM-C) and Series D (BLATM-D), which correspond to the first bond issuance charged to the line registered in the Securities Registry of the SVS under the number N° 862 for a total amount of UF 9,000,000.
The total amount of the Series A Bond will be UF 2,500,000. The total amount of the Series B Bond will be UF 2,500,000.
The total amount of the Series C Bond will be UF 1,850,000 and the total amount of the Series D Bond will be UF 1,850,000, totaling UF 8,700,000.
THE SERIES A BONDS WILL HAVE A MATURITY DATE OF JUNE 1, 2022 AND AN INTEREST RATE OF 5.25% PER YEAR. THE SERIES B BONDS WILL HAVE
A MATURITY DATE OF JANUARY 1, 2028 AND AN INTEREST RATE OF 5.75% PER YEAR. THE SERIES C BONDS WILL HAVE A MATURITY DATE OF JUNE 1,
2022 AND AN INTEREST RATE OF 5.25% PER YEAR, AND THE SERIES D BONDS WILL HAVE A MATURITY DATE OF JANUARY 1, 2028 AND AN INTEREST RATE
OF 5.75% % PER YEAR.
The proceeds from the placement of the Series A, Series B, Series C and Series D Bonds will be used entirely for the partial financing of the early redemption of the total of the TAM Capital 3 Inc. bonds described above.
AUGUST 17 OTHERS
In accordance with the provisions of Article 9 and the second paragraph of Article 10 of Law No. 18,045 on Securities Market, and in General Rule No. 30 of the Securities and Insurance Commission (the "SVS"), the undersigned, duly authorized for the purpose as agreed at the extraordinary Meeting of the Board of Directors No. 128 (the "Board Meeting") of LATAM Airlines Group S.A. ("LATAM") held on April 21, 2017, reports the following material fact regarding LATAM, its businesses, its public offering values or the offer of them, as applicable, the following:
On this date, and as agreed at the Board Meeting, LATAM placed in the local market (Santiago Stock Exchange), the Series A Bonds (BLATM-A), Series B Bonds (BLATM- B), Series C Bonds (BLATM-C) and Series D Bonds (BLATM-D), becoming the first bond issuance made under the bond facility registered in the Securities Registry of the SVS under the number No. 862 for a total amount of UF 9,000,000.
INDEX
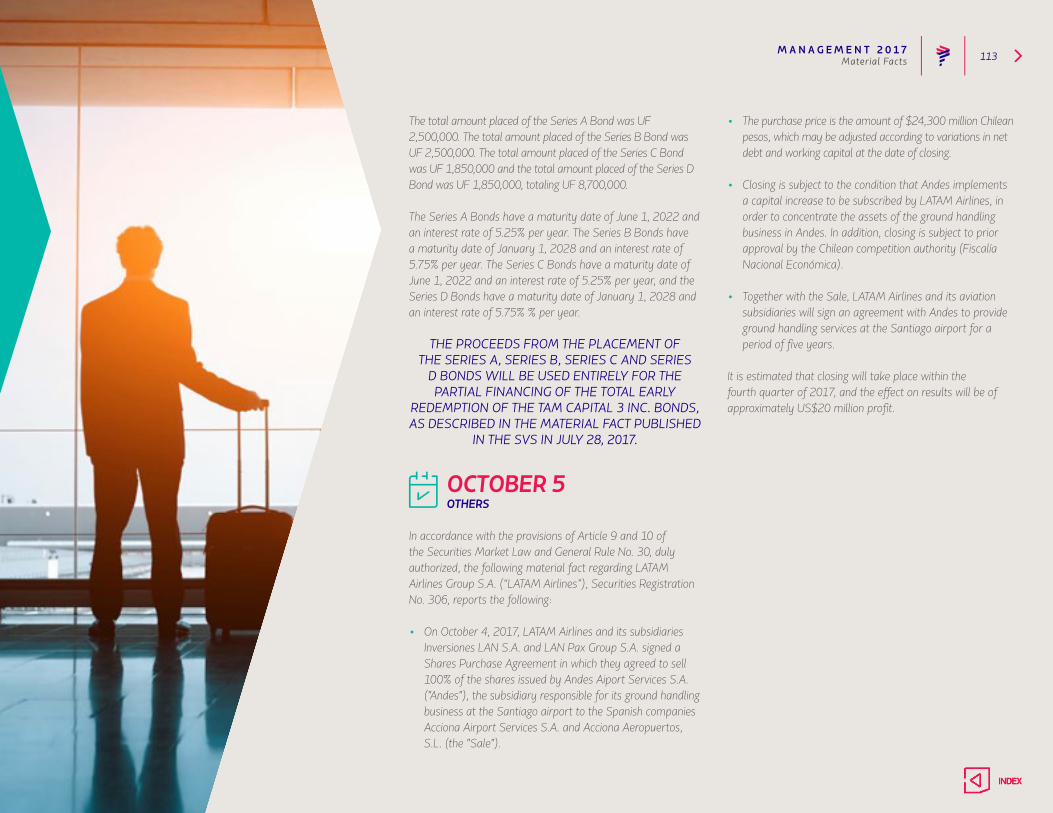
M A N A G E M E N T 2 0 1 7 113
The total amount placed of the Series A Bond was UF 2,500,000. The total amount placed of the Series B Bond was UF 2,500,000. The total amount placed of the Series C Bond was UF 1,850,000 and the total amount placed of the Series D Bond was UF 1,850,000, totaling UF 8,700,000.
The Series A Bonds have a maturity date of June 1, 2022 and an interest rate of 5.25% per year. The Series B Bonds have a maturity date of January 1, 2028 and an interest rate of 5.75% per year. The Series C Bonds have a maturity date of June 1, 2022 and an interest rate of 5.25% per year, and the Series D Bonds have a maturity date of January 1, 2028 and an interest rate of 5.75% % per year.
THE PROCEEDS FROM THE PLACEMENT OF THE SERIES A, SERIES B, SERIES C AND SERIES
D BONDS WILL BE USED ENTIRELY FOR THE PARTIAL FINANCING OF THE TOTAL EARLY
REDEMPTION OF THE TAM CAPITAL 3 INC. BONDS, AS DESCRIBED IN THE MATERIAL FACT PUBLISHED
IN THE SVS IN JULY 28, 2017.
OCTOBER 5 OTHERS
In accordance with the provisions of Article 9 and 10 of the Securities Market Law and General Rule No. 30, duly authorized, the following material fact regarding LATAM Airlines Group S.A. (“LATAM Airlines”), Securities Registration No. 306, reports the following:
• On October 4, 2017, LATAM Airlines and its subsidiaries Inversiones LAN S.A. and LAN Pax Group S.A. signed a Shares Purchase Agreement in which they agreed to sell 100% of the shares issued by Andes Aiport Services S.A. ("Andes"), the subsidiary responsible for its ground handling business at the Santiago airport to the Spanish companies Acciona Airport Services S.A. and Acciona Aeropuertos, S.L. (the "Sale").
• The purchase price is the amount of $24,300 million Chilean pesos, which may be adjusted according to variations in net debt and working capital at the date of closing.
• Closing is subject to the condition that Andes implements a capital increase to be subscribed by LATAM Airlines, in order to concentrate the assets of the ground handling business in Andes. In addition, closing is subject to prior approval by the Chilean competition authority (Fiscalía Nacional Económica).
• Together with the Sale, LATAM Airlines and its aviation subsidiaries will sign an agreement with Andes to provide ground handling services at the Santiago airport for a period of five years.
It is estimated that closing will take place within the fourth quarter of 2017, and the effect on results will be of approximately US$20 million profit.
Material Facts
INDEX
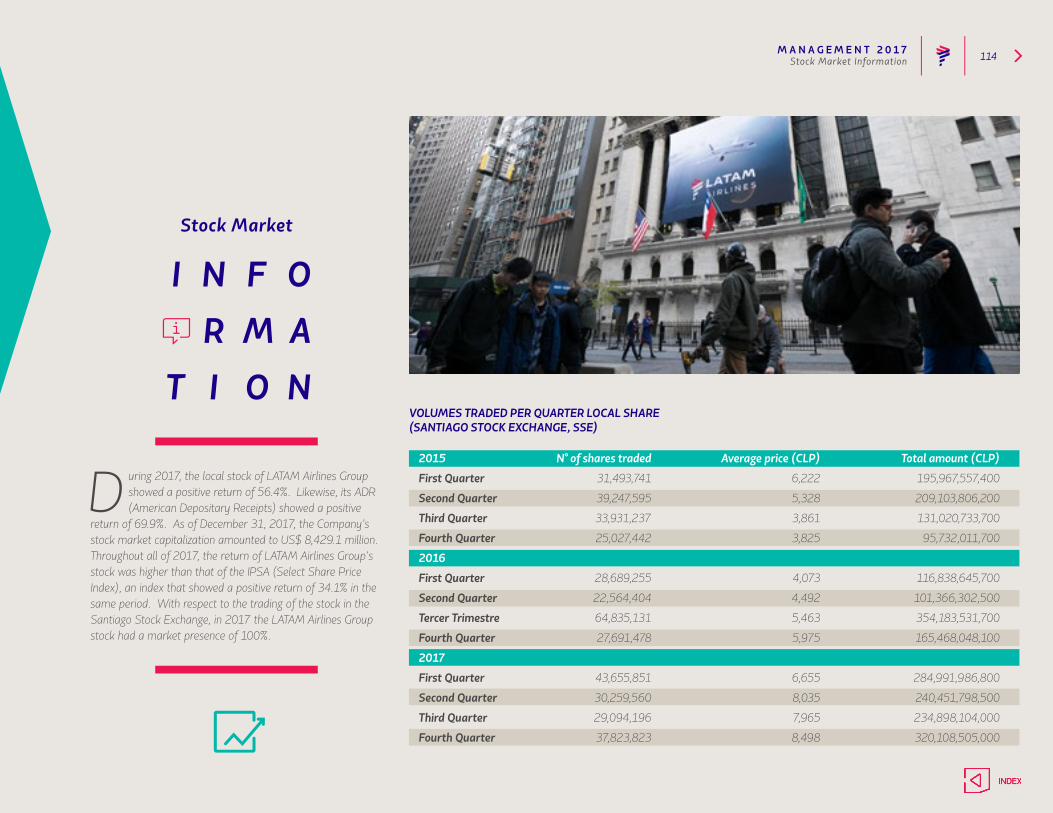
M A N A G E M E N T 2 0 1 7 114
Stock Market
Stock Market Information
D uring 2017, the local stock of LATAM Airlines Group showed a positive return of 56.4%. Likewise, its ADR (American Depositary Receipts) showed a positive
return of 69.9%. As of December 31, 2017, the Company’s stock market capitalization amounted to US$ 8,429.1 million. Throughout all of 2017, the return of LATAM Airlines Group’s stock was higher than that of the IPSA (Select Share Price Index), an index that showed a positive return of 34.1% in the same period. With respect to the trading of the stock in the Santiago Stock Exchange, in 2017 the LATAM Airlines Group stock had a market presence of 100%.
VOLUMES TRADED PER QUARTER LOCAL SHARE(SANTIAGO STOCK EXCHANGE, SSE)
2015 N° of shares traded Average price (CLP) Total amount (CLP)
First Quarter 31,493,741 6,222 195,967,557,400
Second Quarter 39,247,595 5,328 209,103,806,200
Third Quarter 33,931,237 3,861 131,020,733,700
Fourth Quarter 25,027,442 3,825 95,732,011,700
2016
First Quarter 28,689,255 4,073 116,838,645,700
Second Quarter 22,564,404 4,492 101,366,302,500
Tercer Trimestre 64,835,131 5,463 354,183,531,700
Fourth Quarter 27,691,478 5,975 165,468,048,100
2017
First Quarter 43,655,851 6,655 284,991,986,800
Second Quarter 30,259,560 8,035 240,451,798,500
Third Quarter 29,094,196 7,965 234,898,104,000
Fourth Quarter 37,823,823 8,498 320,108,505,000
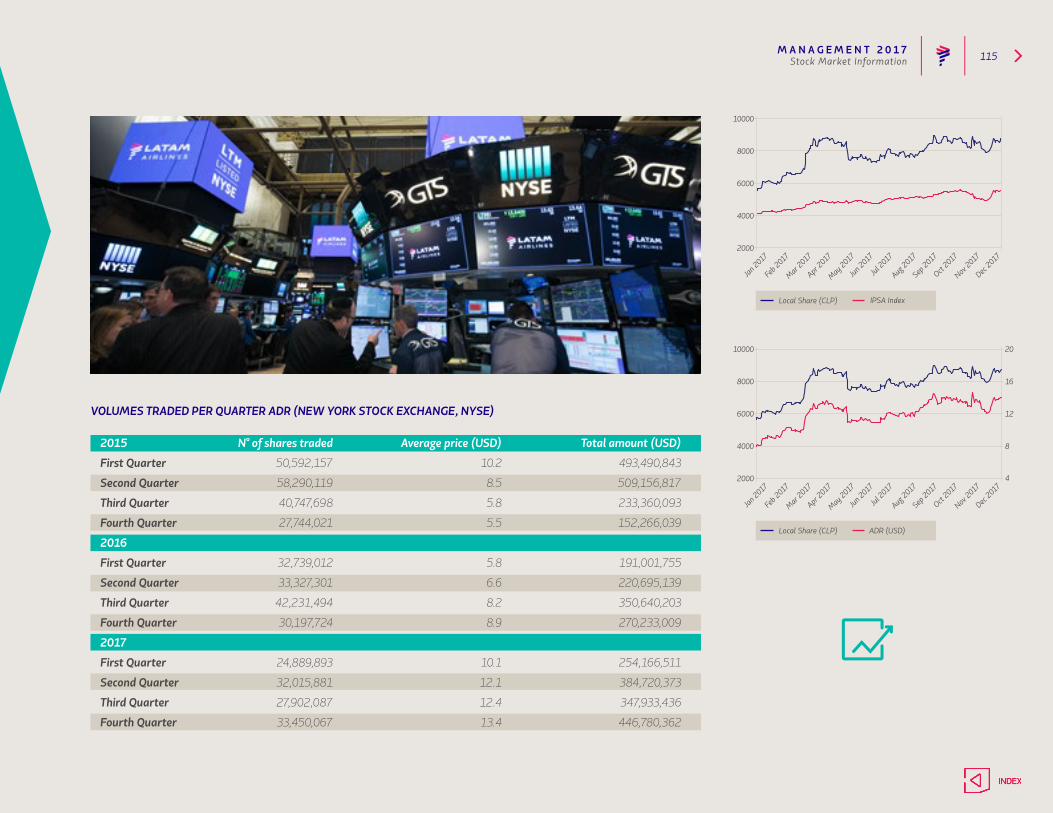
M A N A G E M E N T 2 0 1 7 115
VOLUMES TRADED PER QUARTER ADR (NEW YORK STOCK EXCHANGE, NYSE)
2015 N° of shares traded Average price (USD) Total amount (USD)
First Quarter 50,592,157 10.2 493,490,843
Second Quarter 58,290,119 8.5 509,156,817
Third Quarter 40,747,698 5.8 233,360,093
Fourth Quarter 27,744,021 5.5 152,266,039
2016
First Quarter 32,739,012 5.8 191,001,755
Second Quarter 33,327,301 6.6 220,695,139
Third Quarter 42,231,494 8.2 350,640,203
Fourth Quarter 30,197,724 8.9 270,233,009
2017
First Quarter 24,889,893 10.1 254,166,511
Second Quarter 32,015,881 12.1 384,720,373
Third Quarter 27,902,087 12.4 347,933,436
Fourth Quarter 33,450,067 13.4 446,780,362
Stock Market Information
Local Share (CLP) ADR (USD)
Local Share (CLP) IPSA Index
M A N A G E M E N T 2 0 1 7 116Risk Factors
factors
T he following important factors, and those important factors described in other reports we submit to or file with the Securities and Exchange Commission (“SEC”),
could affect our actual results and could cause our actual results to differ materially from those expressed in any forward-looking statements made by us or on our behalf. In particular, as we are a non-U.S. company, there are risks associated with investing in our ADSs that are not typical for investments in the shares of U.S. companies. Prior to making an investment decision, you should carefully consider all of the information contained in this document, including the following risk factors.
RISK FACTORS RELATINGTO OUR COMPANY
LATAM does not control the voting shares or board of directors of TAM.
Due to Brazilian law restrictions on foreign ownership of Brazilian airlines, LATAM does not control the voting shares or board of directors of TAM. As of December 31, 2017, the ownership structure of TAM is as follows: • Holdco I owns 100% of the TAM common shares
previously outstanding; » the Amaro family (the “Amaro Group”) own
approximately 51% of the outstanding Holdco I voting shares through TEP Chile S.A. (“TEP Chile”,
a Chilean entity wholly owned by the TAM Controlling Shareholders) and LATAM owns the remainder of the voting shares;
» LATAM owns 100% of the outstanding Holdco I non-voting shares, entitling it to substantially all of the economic rights in respect of the TAM common shares held by Holdco I as well as approximately 49% of the outstanding Holdco I voting shares; and
• LATAM owns 100% of the TAM preferred shares previously outstanding.
As a result of this ownership structure:• The Amaro Group retains voting and board control of TAM
and each subsidiary of TAM; and • LATAM is entitled to substantially all of the economic
rights in TAM. LATAM Airlines Group and TEP Chile and other parties have entered into shareholders’ agreements that establish agreements and restrictions relating to corporate governance with respect to TAM. Certain specified actions require supermajority approval, which in turn means they require the prior approval of both LATAM and TEP Chile. Examples of actions requiring supermajority approval by the board of directors of Holdco I or TAM include, among others, entering into acquisitions or business collaborations, amending or approving budgets, business plans, financial statements and
M A N A G E M E N T 2 0 1 7 117Risk Factors
accounting policies, incurring indebtedness, encumbering assets, entering into certain agreements, making certain investments, modifying rights or claims, entering into settlements, appointing executives, creating security interests, issuing, redeeming or repurchasing securities and voting on matters as a shareholder of affiliates of TAM. Actions requiring supermajority shareholder approval of Holdco I or TAM include, among others, certain changes to the by-laws of Holdco I, TAM or TAM’s affiliates or any dissolution/liquidation, corporate reorganization, payment of dividends, issuance of securities, disposal or encumbrance of certain assets, creation of security interests or entering into guarantees and agreements with related parties.
OUR ASSETS INCLUDE A SIGNIFICANTAMOUNT OF GOODWILL.
Our assets included US$2,672.6 million of goodwill as of December 31, 2017. Under IFRS, goodwill is subject to an annual impairment test and may be required to be tested more frequently if events or circumstances indicate a potential impairment. In 2017, mainly as a result of the depreciation of the Brazilian real against the U.S. dollar during 2017, the value of our goodwill decreased by 1.4% as compared with 2016. Any impairment could result in the recognition of a significant charge to earnings in our statement
of income, which could materially and adversely impact our consolidated results for the period in which the impairment occurs.
A FAILURE TO SUCCESSFULLY IMPLEMENT OUR STRATEGY OR A FAILURE ADJUSTING THE
STRATEGY TO THE CURRENT ECONOMIC SITUATION WOULD HARM OUR BUSINESS AND THE MARKET
VALUE OF OUR ADSS AND COMMON SHARES.
We have developed a strategic plan with the goal of becoming one of the most admired airlines in the world and renewing our commitment to sustained profitability and superior returns to shareholders. Our strategy requires us to identify value propositions that are attractive to our clients, to find efficiencies in our daily operations, and to transform ourselves into a stronger and more risk-resilient company. A tenet of our strategic plan is the adoption of a new travel model for domestic services (in the six countries where we have domestic operations) to address the changing dynamics of customers and the industry, and to increase our competitiveness. The new travel model is based on a continued reduction in air fares that makes air travel accessible to a wider audience, and in particular to those wish to fly more frequently. This model requires continued cost reduction efforts and increasing revenues from ancillary
activities. In connection with these efforts, the Company is implementing a series of initiatives to reduce cost per ASK in all its domestic operations as well as developing new ancillary revenue initiatives.
Difficulties in implementing our strategy may adversely affect our business, results of operation and the market value of our ADSs and common shares.
A FAILURE TO SUCCESSFULLY TRANSFER THE VALUE PROPOSITION OF THE LAN AND TAM BRANDS TO A NEW SINGLE BRAND, MAY ADVERSELY AFFECT
OUR BUSINESS AND THE MARKET VALUE OF OUR ADSS AND COMMON SHARES.
Following the combination in 2012, LAN and TAM continued to operate with their original brands. During 2016, we began the transition of LAN and TAM into a single brand. LAN and TAM had different value propositions, and there can be no assurances that we will be able to fully transfer the value of the original LAN and TAM brands to our new single brand “LATAM”. Difficulties in implementing our single brand may prevent us from consolidating as a customer preferred carrier and may adversely affect our business and results of operations and the market value of our ADSs and common shares.
M A N A G E M E N T 2 0 1 7 118
IT MAY TAKE TIME TO COMBINE THE FREQUENT FLYER PROGRAMS OF LAN AND TAM.
We have integrated the separate frequent flyer programs of LAN and TAM so that passengers can use frequent flyer miles or points earned with either LAN or TAM interchangeably. During 2016, LAN and TAM announced their revamped frequent flyer programs, which have new names: LATAM Pass and LATAM Fidelidade, respectively. The change is part of the process of consolidating the airline group’s new brand identity (LATAM) and the evolution of the programs, which enhances existing benefits and introduces new benefits for program members. However, there is no guarantee that full integration of the two plans will be completed in the near term or at all. Even if the integration occurs, the successful integration of these programs will involve some time and expense. Moreover, during 2016, LATAM Pass and LATAM Fidelidade approved changes in their mileage earning policy which may impact the attractiveness of the programs to passengers. Until we effectively combine these programs, passengers may prefer frequent flyer programs offered by other airlines, which may adversely affect our business.
OUR FINANCIAL RESULTS ARE EXPOSED TO FOREIGN CURRENCY FLUCTUATIONS.
We prepare and present our consolidated financial statements in U.S. dollars. LATAM and its affiliates operate in numerous countries and face the risk of variation in foreign currency exchange rates against the U.S. dollar or between the currencies of these various countries. Changes in the exchange rate between the U.S. dollar and the currencies in the countries in which we operate could adversely affect our business, financial condition and results of operations. If the value of the Brazilian real, Chilean peso or other currencies in which revenues are denominated
declines against the U.S. dollar, our results of operations and financial condition will be affected. The exchange rate of the Chilean peso, Brazilian real and other currencies against the U.S. dollar may fluctuate significantly in the future. Changes in Chilean, Brazilian and other governmental economic policies affecting foreign exchange rates could also adversely affect our business, financial condition, results of operations and the return to our shareholders on their common shares or ADSs.
WE DEPEND ON STRATEGIC ALLIANCES OR COMMERCIAL RELATIONSHIPS IN MANY OF THE COUNTRIES IN WHICH WE OPERATE,
AND OUR BUSINESS MAY SUFFER IF ANY OF OUR STRATEGIC ALLIANCES OR COMMERCIAL
RELATIONSHIPS TERMINATES.
We maintain a number of alliances and other commercial relationships in many of the jurisdictions in which LATAM and its affiliates operate. These alliances or commercial relationships allow us to enhance our network and, in some cases, to offer our customers services that we could not otherwise offer. If any of our strategic alliances or commercial relationships deteriorates, or any of these agreements are terminated, our business, financial condition and results of operations could be adversely affected.
OUR BUSINESS AND RESULTS OF OPERATIONS MAY SUFFER IF WE FAIL TO OBTAIN AND MAINTAIN ROUTES, SUITABLE AIRPORT ACCESS, SLOTS AND
OTHER OPERATING PERMITS.
Also, technical and operational problems with the airport infrastructure of cities in which we have a focus may have a material adverse effect on us.
Our business depends upon our access to key routes and airports. Bilateral aviation agreements between countries, open skies laws and local aviation approvals frequently involve political and other considerations outside of our control. Our
operations could be constrained by any delay or inability to gain access to key routes or airports, including: • limitations on our ability to process more passengers;• the imposition of flight capacity restrictions; • the inability to secure or maintain route rights in local
markets or under bilateral agreements; or• the inability to maintain our existing slots and obtain
additional slots.
We operate numerous international routes subject to bilateral agreements, as well as domestic flights within Chile, Peru, Brazil, Argentina, Ecuador and Colombia, subject to local route and airport access approvals.
There can be no assurance that existing bilateral agreements with the countries in which our companies are based and permits from foreign governments will continue. A modification, suspension or revocation of one or more bilateral agreements could have a material adverse effect on our business, financial condition and results of operations. The suspension of our permission to operate in certain airports,
Risk Factors
M A N A G E M E N T 2 0 1 7 119
destinations or slots, or the imposition of other sanctions could also have a material adverse effect. A change in the administration of current laws and regulations or the adoption of new laws and regulations in any of the countries in which we operate that restrict our route, airport or other access may have a material adverse effect on our business, financial condition and results of operations.
Moreover, our operations and growth strategy are dependent on the facilities and infrastructure of key airports, including Santiago’s International Airport, São Paulo’s Guarulhos and Congonhas International Airports, Brasilia’s International Airport and Lima’s Jorge Chavez International Airport.
Santiago’s Comodoro Arturo Merino Benítez International Airport is currently facing an important expansion, which is expected to be completed by 2020. If the expansion is not carried out timely, this will likely reduce significantly our operations and adversely affect our ability to remain competitive.
One of the major operational risks we face on a daily basis at Lima’s Jorge Chavez International Airport is the limited number of parking positions. Additionally, the indoor infrastructure of the airport limits our ability to manage connections and launch new flights due to the lack of gates
and increasing security and immigration controls. We expect that for the next few years, Lima’s airport’s capacity will remain as it is today, limiting our ability to grow and affecting our competitiveness in the country and in the region.
Moreover, Lima’s airport will undergo an expansion, as there are plans to expand the airport’s capacity with a second runway, more parking positions and a new terminal for passengers. Therefore, we expect that for the next few years, Lima’s airport’s capacity will remain as it is today, limiting our ability to grow and affecting our competitiveness in the country and in the region.
Brazilian airports, such as the Brasília, and São Paulo (Guarulhos) international airports, have limited the number of slots per day due to infrastructural limitations. Any condition that would prevent or delay our access to airports or routes that are vital to our strategy, or our inability to maintain our existing slots and obtain additional slots, could materially adversely affect our operations.
A SIGNIFICANT PORTION OF OUR CARGO REVENUE COMES FROM RELATIVELY FEW PRODUCT TYPES AND MAY BE IMPACTED BY EVENTS AFFECTING
THEIR PRODUCTION, TRADE OR DEMAND.
Our cargo demand, especially from Latin American exporters, is concentrated in a small number of product categories, such as exports of fish, sea products and fruits from Chile, asparagus from Peru and fresh flowers from Ecuador and Colombia. Events that adversely affect the production, trade or demand for these goods may adversely affect the volume of goods that we transport and may have a significant impact on our results of operations. Future trade protection measures may have an impact in cargo traffic volumes and adversely affect our financial results. Some of our cargo products are sensitive to foreign exchange rates and, therefore, traffic volumes could be impacted by the appreciation or depreciation of local currencies.
OUR OPERATIONS ARE SUBJECT TO FLUCTUATIONS IN THE SUPPLY AND COST OF JET FUEL, WHICH
COULD ADVERSELY IMPACT OUR BUSINESS.
Higher jet fuel prices could have a materially adverse effect on our business, financial condition and results of operations. Jet fuel costs have historically accounted for a significant amount of our operating expenses, and accounted for 24.5% of our operating expenses in 2017. Both the cost and availability of fuel are subject to many economic and political factors and events that we can neither control nor predict, including international political and economic circumstances such as the political
Risk Factors
M A N A G E M E N T 2 0 1 7 120
instability in major oil-exporting countries. Any future fuel supply shortage (for example, as a result of production curtailments by the Organization of the Petroleum Exporting Countries, or “OPEC”), a disruption of oil imports, supply disruptions resulting from severe weather or natural disasters, the continued unrest in the Middle East or other events could result in higher fuel prices or further reductions in scheduled airline services. We cannot ensure that we would be able to offset any increases in the price of fuel by increasing our fares. In addition, lower fuel prices may result in lower fares through the reduction or elimination of fuel surcharges. We have entered into fuel hedging arrangements, but there can be no assurance that such arrangements will be adequate to protect us from an increase in fuel prices in the near future or in the long term.
Also, while these hedging arrangements are designed to limit the effect of an increase in fuel prices, our hedging methods may also limit our ability to take advantage of any decrease in fuel prices, as was the case in 2015 and, to a lesser extent, in 2016.
WE RELY ON MAINTAINING A HIGH AIRCRAFT UTILIZATION RATE TO INCREASE OUR REVENUES AND ABSORB OUR FIXED COSTS, WHICH MAKES
US ESPECIALLY VULNERABLE TO DELAYS.
A key element of our strategy is to maintain a high daily aircraft utilization rate, which measures the number of hours we use our aircraft per day. High daily aircraft utilization allows us to maximize the amount of revenue we generate from our aircraft and absorb the fixed costs associated with our fleet and is achieved, in part, by reducing turnaround times at airports and developing schedules that enable us to increase the average hours flown per day. Our rate of aircraft utilization could be adversely affected by a number of different
factors that are beyond our control, including air traffic and airport congestion, adverse weather conditions, unanticipated maintenance and delays by third-party service providers relating to matters such as fueling and ground handling. If an aircraft falls behind schedule, the resulting delays could cause a disruption in our operating performance and have a financial impact on our results.
WE FLY AND DEPEND UPON AIRBUS AND BOEING AIRCRAFT, AND OUR BUSINESS COULD SUFFER IF WE DO NOT RECEIVE TIMELY DELIVERIES OF
AIRCRAFT, IF AIRCRAFT FROM THESE COMPANIES BECOME UNAVAILABLE OR IF THE PUBLIC NEGATIVELY PERCEIVES OUR AIRCRAFT.
As our fleet has grown, our reliance on Airbus and Boeing has also grown. As of December 31, 2017, LATAM Airlines Group has a fleet of 235 Airbus and 80 Boeing aircraft. Risks relating to Airbus and Boeing include: • our failure or inability to obtain Airbus or Boeing aircraft,
parts or related support services on a timely basis because of high demand or other factors;
• the interruption of fleet service as a result of unscheduled or unanticipated maintenance requirements for these aircraft;
• the issuance by the Chilean or other aviation authorities of directives restricting or prohibiting the use of our Airbus or Boeing aircraft, or requiring time-consuming inspections and maintenance;
• adverse public perception of a manufacturer as a result of safety concerns, negative publicity or other problems, whether real or perceived, in the event of an accident; or
• delays between the time we realize the need for new aircraft and the time it takes us to arrange for Airbus and Boeing or for a third-party provider to deliver this aircraft.
The occurrence of any one or more of these factors could restrict our ability to use aircraft to generate profits, respond to increased demands, or could otherwise limit our operations and adversely affect our business.
IF WE ARE UNABLE TO INCORPORATE LEASED AIRCRAFT INTO OUR FLEET AT ACCEPTABLE RATES
AND TERMS IN THE FUTURE, OUR BUSINESS COULD BE ADVERSELY AFFECTED.
A large portion of our aircraft fleet is subject to long-term operating leases. Our operating leases typically run from three to 12 years from the date of delivery. We may face more competition for, or a limited supply of, leased aircraft, making it difficult for us to negotiate on competitive terms upon expiration of our current operating leases or to lease additional capacity required for our targeted level of operations. If we are forced to pay higher lease rates in the future to maintain our capacity and the number of aircraft in our fleet, our profitability could be adversely affected.
OUR BUSINESS MAY BE ADVERSELY AFFECTED IF WE ARE UNABLE TO SERVICE OUR DEBT OR MEET
OUR FUTURE FINANCING REQUIREMENTS.
We have a high degree of debt and payment obligations under our aircraft operating leases and financial debt arrangements. We require significant amounts of financing to meet our aircraft capital requirements and may require additional financing to fund our other business needs. We cannot guarantee that we will have access to or be able to arrange for financing in the future on favorable terms. Higher financing costs could affect our ability to expand or renew our fleet, which in turn could adversely affect our business.
In addition, the majority of our property and equipment is subject to liens securing our indebtedness. In the event that we fail to make payments on secured indebtedness, creditors’ enforcement of liens could limit or end our ability to use the affected property and equipment to fulfill our operational needs and thus generate revenue.
Moreover, external conditions in the financial and credit markets may limit the availability of funding at particular times or increase its costs, which could adversely affect our
Risk Factors
M A N A G E M E N T 2 0 1 7 121
profitability, our competitive position and result in lower net interest margins, earnings and cash flows, as well as lower returns on shareholders’ equity and invested capital. Factors that may affect the availability of funding or cause an increase in our funding costs include global macro-economic crises, reduction of our credit rating, and other potential market disruptions.
WE HAVE SIGNIFICANT EXPOSURE TO LIBOR AND OTHER FLOATING INTEREST RATES; INCREASES
IN INTEREST RATES WILL INCREASE OUR FINANCING COSTS AND MAY HAVE ADVERSE EFFECTS ON OUR FINANCIAL CONDITION AND
RESULTS OF OPERATIONS.
We are exposed to the risk of interest rate variations, principally in relation to the U.S. dollar London Interbank Offer Rate (“LIBOR”). Many of our financial leases are denominated in U.S. dollars and bear interest at a floating rate. 36.9% of our outstanding consolidated debt as of December 31, 2017 bears interest at a floating rate after giving effect to interest rate hedging agreements. Volatility in LIBOR or other reference rates could increase our periodic interest and lease payments and have an adverse effect on our total financing costs. We may be unable to adequately adjust our prices to offset any increased financing
costs, which would have an adverse effect on our revenues and our results of operations.
INCREASES IN INSURANCE COSTS AND/OR SIGNIFICANT REDUCTIONS IN COVERAGE COULD HARM OUR FINANCIAL CONDITION AND RESULTS
OF OPERATIONS.
Major events affecting the aviation insurance industry (such as terrorist attacks, hijackings or airline crashes) may result in significant increases of airlines’ insurance premiums or in significant decreases of insurance coverage, as occurred after the September 11, 2001 terrorist attacks. As a result, further increases in insurance costs or reductions in available insurance coverage could have an adverse impact on our financial results and results of operations and increases the risk that we experience uncovered losses.
PROBLEMS WITH AIR TRAFFIC CONTROL SYSTEMS OR OTHER TECHNICAL FAILURES COULD
INTERRUPT OUR OPERATIONS AND HAVE A MATERIAL ADVERSE EFFECT ON OUR BUSINESS.
Our operations, including our ability to deliver customer service, are dependent on the effective operation of our equipment, including our aircraft, maintenance systems and reservation systems. Our operations are also dependent on the effective operation of domestic and international air traffic control systems and the air traffic control infrastructure by the corresponding authorities in the markets in which we operate. Equipment failures, personnel shortages, air traffic control problems and other factors that could interrupt operations could adversely affect our operations and financial results as well as our reputation.
WE DEPEND ON A LIMITED NUMBER OF SUPPLIERS FOR CERTAIN AIRCRAFT AND ENGINE PARTS.
We depend on a limited number of suppliers for aircraft, aircraft engines and many aircraft and engine parts. As a result, we are vulnerable to any problems associated with the supply of those aircraft, parts and engines, including design defects, mechanical problems, contractual performance by the suppliers, or adverse perception by the public that would result unscheduled maintenance requirements, in customer avoidance or in actions
Risk Factors
M A N A G E M E N T 2 0 1 7 122Risk Factors
by the aviation authorities resulting in an inability to operate our aircraft. During the year 2017, LATAM Airlines’s main suppliers were aircraft manufacturers Airbus and Boeing.
In addition to Airbus and Boeing, LATAM Airlines has a number of other suppliers, primarily related to aircraft accessories, spare parts, and components, including Pratt & Whitney, MTU Maintenance, Rolls-Royce, and Pratt and Whitney Canada.
As of February 9, 2018, Airbus has been experiencing difficulties in the delivery of A320neo aircraft worldwide which we understand is stated to be due to problems with the aircraft’s Pratt & Whitney engines. We are currently expecting delivery of seven A320neo and 2 A321neo aircraft during 2018, and any delays in the delivery of theses could adversely affect our operations. In addition, we currently have four A320neo aircraft in our fleet, and problems associated with the lack of availability of these engines could potentially prevent these aircrafts from remaining operational.
We understand that Rolls Royce is experiencing problems with the availability of Rolls Royce Trent 1000 engines in connection with engine maintenance programs, affecting our Boeing 787 aircraft and potentially our A350 aircraft. Any prolonged problems, could adversely affect our operations.
OUR BUSINESS RELIES EXTENSIVELY ON THIRD-PARTY SERVICE PROVIDERS. FAILURE OF
THESE PARTIES TO PERFORM AS EXPECTED, OR INTERRUPTIONS IN OUR RELATIONSHIPS WITH
THESE PROVIDERS OR THEIR PROVISION OF SERVICES TO US, COULD HAVE AN ADVERSE EFFECT ON OUR FINANCIAL POSITION AND
RESULTS OF OPERATIONS.
We have engaged a significant number of third-party service providers to perform a large number of functions that are integral to our business, including regional operations, operation of customer service call centers, distribution and sale of airline seat inventory, provision of information technology infrastructure and services, provision of aircraft maintenance and repairs, catering, ground services, and provision of various utilities and performance of aircraft fueling operations, among other vital functions and services. We do not directly control these third-party service providers, although we do enter into agreements with many of them that define expected service performance.
Any of these third-party service providers, however, may materially fail to meet their Wservice performance
commitments, may suffer disruptions to their systems that could impact their services, or the agreements with such providers may be terminated. For example, flight reservations booked by customers and/or travel agencies via third-party GDSs (Global Distribution Systems) may be adversely affected by disruptions in our business relationships with GDS operators. Such disruptions, including a failure to agree upon acceptable contract terms when contracts expire or otherwise become subject to renegotiation, may cause the carriers’ flight information to be limited or unavailable for display, significantly increase fees for both us and GDS users, and impair our relationships with customers and travel agencies.
The failure of any of our third-party service providers to adequately perform their service obligations, or other interruptions of services, may reduce our revenues and increase our expenses or prevent us from operating our flights and providing other services to our customers. In addition, our business, financial performance and reputation could be materially harmed if our customers believe that our services are unreliable or unsatisfactory.
DISRUPTIONS OR SECURITY BREACHES OF OUR INFORMATION TECHNOLOGY INFRASTRUCTURE
OR SYSTEMS COULD INTERFERE WITH OUR OPERATIONS, COMPROMISE PASSENGER OR
EMPLOYEE INFORMATION, AND EXPOSE US TO LIABILITY, POSSIBLY CAUSING OUR BUSINESS AND
REPUTATION TO SUFFER.
A serious internal technology error or failure impacting systems hosted internally at our data centers or externally at third-party locations, or large-scale interruption in technology infrastructure we depend on, such as power, telecommunications or the internet, may disrupt our technology network with potential impact on our operations.
M A N A G E M E N T 2 0 1 7 123Risk Factors
Our technology systems and related data may also be vulnerable to a variety of sources of interruption, including natural disasters, terrorist attacks, telecommunications failures, computer viruses, hackers and other security issues. These systems include our computerized airline reservation system, flight operations system, telecommunications systems, website, maintenance systems, check-in kiosks, in-flight entertainment systems and data centers.
In addition, as a part of our ordinary business operations, we collect and store sensitive data, including personal information of our passengers and employees and information of our business partners. The secure operation of the networks and systems on which this type of information is stored, processed and maintained is critical to our business operations and strategy. Unauthorized parties may attempt to gain access to our systems or information through fraud or deception. Hardware or software we develop or acquire may contain defects that could unexpectedly compromise information security. The compromise of our technology systems resulting in the loss, disclosure, misappropriation of, or access to, customers’, employees’ or business partners’ information could result in legal claims or proceedings, liability or regulatory penalties under laws protecting the privacy of personal information, disruption to our operations and damage to our reputation, any or all of which could adversely affect our business.
INCREASES IN OUR LABOR COSTS, WHICH CONSTITUTE A SUBSTANTIAL PORTION OF OUR TOTAL OPERATING EXPENSES, COULD DIRECTLY
IMPACT OUR EARNINGS.
Labor costs constitute a significant percentage of our total operating expenses (21.4% in 2017) and at times in our operating history we have experienced pressure to increase wages and benefits for our employees. A significant increase in our labor costs could result in a material reduction in our earnings.
OUR BUSINESS MAY EXPERIENCE ADVERSE CONSEQUENCES IF WE ARE UNABLE TO REACH
SATISFACTORY COLLECTIVE BARGAINING AGREEMENTS WITH OUR UNIONIZED EMPLOYEES.
As of December 31, 2017, approximately 75% of LATAM Group’s employees, including administrative personnel, cabin crew, flight attendants, pilots and maintenance technicians are members of unions and have contracts and collective bargaining agreements which expire on a regular basis. Our business, financial condition and results of operations could be materially adversely affected by a failure to reach agreement with any labor union representing such employees or by an agreement with a labor union that contains terms that are not in line with our expectations or that prevent us from competing effectively with other airlines.
COLLECTIVE ACTION BY EMPLOYEES COULD CAUSE OPERATING DISRUPTIONS AND ADVERSELY
IMPACT OUR BUSINESS.
Certain employee groups such as pilots, flight attendants, mechanics and our airport personnel have highly specialized skills. As a consequence, actions by these groups, such as strikes, walk-outs or stoppages, could severely disrupt our operations and adversely impact our operating and financial performance, as well as our image.
A strike, work interruption or stoppage or any prolonged dispute with our employees who are represented by any of these unions could have an adverse impact on our operations. These risks are typically exacerbated during periods of renegotiation with the unions, which typically occurs every two to four years depending on the jurisdiction and the union. Any renegotiated collective bargaining agreement could feature significant wage increases and a consequent increase in our operating expenses. Any failure to reach an agreement during negotiations with unions may require us to enter into arbitration proceedings, use financial and management resources, and potentially agree to terms that are less
M A N A G E M E N T 2 0 1 7 124Risk Factors
favorable to us than our existing agreements. Employees who are not currently members of unions may also form new unions that may seek further wage increases or benefits.
WE MAY EXPERIENCE DIFFICULTY FINDING, TRAINING AND RETAINING EMPLOYEES.
Our business is labor intensive. We employ a large number of pilots, flight attendants, maintenance technicians and other operating and administrative personnel. The airline industry has, from time to time, experienced a shortage of qualified personnel, especially pilots and maintenance technicians. In addition, as is common with most of our competitors, we may, from time to time, face considerable turnover of our employees. Should the turnover of employees, particularly pilots and maintenance technicians, sharply increase, our training costs will be significantly higher.
We cannot assure you that we will be able to recruit, train and retain the managers, pilots, technicians and other qualified employees that we need to continue our current operations or replace departing employees. An increase in turnover or failure to recruit, train and retain qualified employees at a reasonable cost could materially adversely affect our business, financial condition, and results of operations.
RISKS RELATED TO THE AIRLINEINDUSTRY AND THE COUNTRIESIN WHICH WE OPERATE
OUR PERFORMANCE IS HEAVILY DEPENDENT ON ECONOMIC CONDITIONS IN THE COUNTRIES IN
WHICH WE DO BUSINESS. NEGATIVE ECONOMIC CONDITIONS IN THOSE COUNTRIES COULD
ADVERSELY IMPACT OUR BUSINESS AND RESULTS OF OPERATIONS AND CAUSE THE MARKET PRICE OF
OUR COMMON SHARES AND ADSS TO DECREASE.
Passenger and cargo demand is heavily cyclical and highly dependent on global and local economic growth, economic expectations and foreign exchange rate variations, among other things. In the past, our business has been adversely affected by global economic recessionary conditions, weak economic growth in Chile, recession in Brazil and Argentina and poor economic performance in certain emerging market countries in which we operate. The occurrence of similar
events in the future could adversely affect our business. We plan to continue to expand our operations based in Latin America and our performance will, therefore, continue to depend heavily on economic conditions in the region.
Any of the following factors could adversely affect our business, financial condition and results of operations in the countries in which we operate: • changes in economic or other governmental policies; • changes in regulatory, legal or administrative practices;• weak economic performance, including, but not limited to, a
slowdown in the Brazilian economy and political instability low economic growth, low consumption and/or investment rates, and increased inflation rates; or
• other political or economic developments over which we have no control.
No assurance can be given that capacity reductions or other steps we may take in response to weakened demand will be adequate to offset any future reduction in our cargo and/or air travel demand in markets in which we operate. Sustained weak demand may adversely impact our revenues, results of operations or financial condition.

M A N A G E M E N T 2 0 1 7 125Risk Factors
An adverse economic environment, whether global, regional or in a particular country, could result in a reduction in passenger traffic, as well as a reduction in our cargo business, and could also impact our ability to raise fares, which in turn would materially and negatively affect our financial condition and results of operations.
WE ARE EXPOSED TO INCREASES IN LANDING FEES AND OTHER AIRPORT SERVICE CHARGES THAT COULD ADVERSELY AFFECT OUR MARGIN
AND COMPETITIVE POSITION.
Also, it cannot be assured that in the future we will have access to adequate facilities and landing rights necessary to achieve our expansion plans. We must pay fees to airport operators for the use of their facilities. Any substantial increase in airport charges, including at Guarulhos International Airport in São Paulo, Jorge Chavez International Airport in Lima or Comodoro Arturo Merino Benitez International Airport in Santiago, could have a material adverse impact on our results of operations. Passenger taxes and airport charges have
increased substantially in recent years. We cannot assure you that the airports in which we operate will not increase or maintain high passenger taxes and service charges in the future. Such increases could have an adverse effect on our financial condition and results of operations.
Certain airports that we serve (or that we plan to serve in the future) are subject to capacity constraints and impose various restrictions, including slot restrictions during certain periods of the day and limits on aircraft noise levels. We cannot be certain that we will be able to obtain a sufficient number of slots, gates and other facilities at airports to expand our services in line with our growth strategy. It is also possible that airports not currently subject to capacity constraints may become so in the future. In addition, an airline must use its slots on a regular and timely basis or risk having those slots re-allocated to others. Where slots or other airport resources are not available or their availability is restricted in some way, we may have to amend our schedules, change routes or reduce aircraft utilization. Any of these alternatives could have an adverse financial impact on our operations.
We cannot ensure that airports at which there are no such restrictions may not implement restrictions in the future or that, where such restrictions exist, they may not become more onerous. Such restrictions may limit our ability to continue to provide or to increase services at such airports.
OUR BUSINESS IS HIGHLY REGULATED AND CHANGES IN THE REGULATORY ENVIRONMENT
IN THE COUNTRIES IN WHICH WE OPERATE MAY ADVERSELY AFFECT OUR BUSINESS AND RESULTS
OF OPERATIONS.
Our business is highly regulated and depends substantially upon the regulatory environment in the countries in which we operate or intend to operate. For example, price controls on fares may limit our ability to effectively apply customer segmentation profit maximization techniques (“passenger revenue management”) and adjust prices to reflect cost pressures. High levels of government regulation may limit the scope of our operations and our growth plans. The possible failure of aviation authorities to maintain the required governmental authorizations or our failure to comply with applicable regulations, may adversely affect our business and results of operations.
OUR BUSINESS, FINANCIAL CONDITION, RESULTS OF OPERATIONS AND THE PRICE OF PREFERRED
SHARES AND ADSS MAY BE ADVERSELY AFFECTED BY CHANGES IN POLICY OR REGULATIONS AT THE
FEDERAL, STATE OR MUNICIPAL LEVEL IN THE COUNTRIES IN WHICH WE OPERATE, INVOLVING
OR AFFECTING FACTORS SUCH AS:
• interest rates;• currency fluctuations;• monetary policies;• inflation;• liquidity of capital and lending markets;• tax and social security policies;• labor regulations;• energy and water shortages and rationing; and• other political, social and economic developments in
or affecting Brazil, Chile, Peru, and the United States, among others.
For example, the Brazilian federal government has frequently intervened in the domestic economy and made drastic changes in policy and regulations to control inflation and affect other policies and regulations. This required the federal government to increase interest rates, change taxes and social security policies, implement price controls, currency exchange and remittance controls, devaluations, capital controls and limits on imports.

M A N A G E M E N T 2 0 1 7 126Risk Factors
Uncertainty over whether the Brazilian federal government will implement changes in policy or regulation affecting these or other factors may contribute to economic uncertainty in Brazil and to heightened volatility in the Brazilian securities markets and securities issued abroad by Brazilian companies. These and other developments in the Brazilian economy and governmental policies may adversely affect us and our business and results of operations and may adversely affect the trading price of our preferred shares and ADSs.
We are also subject to international bilateral air transport agreements that provide for the exchange of air traffic rights between the countries where we operate, and we must obtain permission from the applicable foreign governments to provide service to foreign destinations. There can be no assurance that such existing bilateral agreements will continue, or that we will be able to obtain more route rights under those agreements to accommodate our future expansion plans.
Any modification, suspension or revocation of one or more bilateral agreements could have a material adverse effect on our business, financial condition and results of operations. The suspension of our permits to operate to certain airports or destinations, the inability for us to obtain favorable take-off and landing authorizations at certain high-density airports or
the imposition of other sanctions could also have a negative impact on our business. We cannot be certain that a change in a foreign government’s administration of current laws and regulations or the adoption of new laws and regulations will not have a material adverse effect on our business, financial condition and results of operations.
LOSSES AND LIABILITIES IN THE EVENT OF AN ACCIDENT INVOLVING ONE OR MORE OF OUR AIRCRAFT COULD MATERIALLY AFFECT OUR
BUSINESS.
We are exposed to potential catastrophic losses in the event of an aircraft accident, terrorist incident or any other similar event. There can be no assurance that, as a result of an aircraft accident or significant incident: • we will not need to increase our insurance coverage;• our insurance premiums will not increase significantly;
• our insurance coverage will fully cover all of our liability; or • we will not be forced to bear substantial losses.
Substantial claims resulting from an accident or significant incident in excess of our related insurance coverage could have a material adverse effect on our business, financial condition and results of operations. Moreover, any aircraft accident, even if fully insured, could cause the negative public perception that our aircraft are less safe or reliable than those operated by other airlines, or by other flight operators, which could have a material adverse effect on our business, financial condition and results of operations.
Insurance premiums may also increase due to an accident or incident affecting one of our alliance partners or other airlines, or due to aperception of increased risk in the industry related to concerns about war or terrorist attacks.
HIGH LEVELS OF COMPETITION IN THE AIRLINE INDUSTRY, SUCH AS THE PRESENCE OF LOW-COST CARRIERS IN THE DOMESTIC MARKETS IN WHICH
WE OPERATE, MAY ADVERSELY AFFECT OUR LEVEL OF OPERATIONS.
Our business, financial condition and results of operations could be adversely affected by high levels of competition within the industry, particularly the entrance of new competitors into the markets in which we operate. Airlines compete primarily over fare levels, frequency and dependability of service, brand recognition, passenger amenities (such as frequent flyer programs) and the availability and convenience of other passenger or cargo services. New and existing airlines (and companies providing ground cargo or passenger transportation) could enter our markets and compete with us on any of these bases, including by offering lower prices, more attractive services or increasing their route offerings in an effort to gain greater market share.
Low-cost carriers have an important impact in the industry’s revenues given their low unit costs. Lower costs allow low-
M A N A G E M E N T 2 0 1 7 127
cost carriers to offer inexpensive fares which, in turn, allow price sensitive customers to fly or to shift from large to low cost carriers. In past years we have seen more interest in the development of the low-cost model throughout Latin America. For example, in the Chilean domestic market, Sky Airlines, our main competitor, has been migrating to a low-cost model since 2015, while in July 2017, JetSmart, a new low-cost airline, started operations. In the Peruvian domestic market, VivaAir Peru, a new low-cost airline, started operations in May 2017. In Colombia, low-cost competitor VivaColombia has been operating in the domestic market since May 2012. Low-cost competitor Flybondi began operations in the Argentinian domestic market during 2018, while Norwegian began international operations between London and Buenos Aires in 2018. A number of low-cost carriers have announced growth strategies including commitments to acquire significant numbers of aircraft for delivery in the next few years. The entry of the low-cost carriers local into markets in which we compete, including those described above, could have a material adverse effect on our operations and financial performance.
Our international strategic growth plans rely, in part, upon receipt of regulatory approvals of the countries in which we plan to expand our operations of certain Joint Business Agreements (JBAs). We may not be able to obtain those approvals, while other competitors might be approved. Accordingly, we might not be able to compete for the same routes as our competitors, which could diminish our market share and adversely impact our financial results. No assurances can be given as to any benefits, if any, that we may derive from such agreements.
SOME OF OUR COMPETITORS MAY RECEIVE EXTERNAL SUPPORT, WHICH COULD ADVERSELY
IMPACT OUR COMPETITIVE POSITION.
Some of our competitors may receive support from external sources, such as their national governments, which may be unavailable to us. Support may include, among others, subsidies, financial aid or tax waivers. This support could place us at a competitive disadvantage and
adversely affect our operations and financial performance. For example, Aerolineas Argentinas has historically been government subsidized.
Moreover, as a result of the competitive environment, there may be further consolidation in the Latin American and global airline industry, whether by means of acquisitions, joint ventures, partnerships or strategic alliances. We cannot predict the effects of further consolidation on the industry. Furthermore, consolidation in the airline industry and changes in international alliances will continue to affect the competitive landscape in the industry and may result in the development of airlines and alliances with increased financial resources, more extensive global networks and reduced cost structures.
OUR OPERATIONS ARE SUBJECT TO LOCAL, NATIONAL AND INTERNATIONAL
ENVIRONMENTAL REGULATIONS; COSTS OF COMPLIANCE WITH APPLICABLE REGULATIONS, OR THE CONSEQUENCES OF NONCOMPLIANCE, COULD ADVERSELY AFFECT OUR RESULTS, OUR
BUSINESS OR OUR REPUTATION.
Our operations are affected by environmental regulations at local, national and international levels. These regulations cover, among other things, emissions to the atmosphere, disposal of solid waste and aqueous effluents, aircraft noise and other activities incident to our business. Future operations and financial results may vary as a result of such regulations. Compliance with these regulations and new or existing regulations that may be applicable to us in the future could increase our cost base and adversely affect our operations and financial results. In addition, failure to comply with these regulations could adversely affect us in a variety of ways, including adverse effects on our reputation.
In 2016, the International Civil Aviation Organization (“ICAO”) adopted a resolution creating the Carbon Offsetting and Reduction Scheme for International Aviation (CORSIA), providing a framework for a global market-based measure to stabilize carbon dioxide (“CO2”) emissions in international civil
aviation (i.e., civil aviation flights that depart in one country and arrive in a different country). CORSIA will be implemented in phases, starting with the participation of ICAO member states on a voluntary basis during a pilot phase (from 2021 through 2023), followed by a first phase (from 2024 through 2026) and a second phase (from 2027). Currently, CORSIA focuses on defining standards for monitoring, reporting and verification of emissions from air operators, as well as on defining steps to offset CO2 emissions after 2020. To the extent most of the countries in which we operate continue to be ICAO member states, in the future we may be affected by regulations adopted pursuant to the CORSIA framework.
The proliferation of national regulations and taxes on CO2 emissions in the countries that we have domestic operations, including environmental regulations that the airline industry is facing in Colombia, may also affect our costs of operations and our margins.
OUR BUSINESS MAY BE ADVERSELY AFFECTED BY A DOWNTURN IN THE AIRLINE INDUSTRY
CAUSED BY EXOGENOUS EVENTS THAT AFFECT TRAVEL BEHAVIOR OR INCREASE COSTS,
SUCH AS OUTBREAK OF DISEASE, WEATHER CONDITIONS AND NATURAL DISASTERS, WAR OR
TERRORIST ATTACKS.
Demand for air transportation may be adversely impacted by exogenous events, such as adverse weather conditions and natural disasters, epidemics (such as Ebola and Zika), terrorist attacks, war or political and social instability. Situations such as these in one or more of the markets in which we operate could have a material impact on our business, financial condition and results of operations. Furthermore, these types of situations could have a prolonged effect on air transportation demand and on certain cost items.
Risk Factors
M A N A G E M E N T 2 0 1 7 128Risk Factors
After the terrorist attacks in the United States on September 11, 2001, the Company made the decision to reduce its flights to the United States. In connection with the reduction in service, the Company reduced its workforce resulting in additional expenses due to severance payments to terminated employees during 2001. Therefore, any future terrorist attacks or threat of attacks, whether or not involving commercial aircraft, any increase in hostilities relating to reprisals against terrorist organizations or otherwise and any related economic impact could result in decreased passenger traffic and materially and negatively affect our business, financial condition and results of operations.
After the 2001 terrorist attacks, airlines have experienced increased costs resulting from additional security measures that may be made even more rigorous in the future. In addition to measures imposed by the U.S. Department of Homeland Security and the TSA, IATA and certain foreign governments have also begun to institute additional security measures at foreign airports we serve.
Revenues for airlines depend on the number of passengers carried, the fare paid by each passenger and service factors, such as the timeliness of flight departures and arrivals. During periods of fog, ice, low temperatures, storms or other adverse
weather conditions, some or all of our flights may be cancelled or significantly delayed, reducing our profitability. In addition, fuel prices and supplies, which constitute a significant cost for us, may increase as a result of any future terrorist attacks, a general increase in hostilities or a reduction in output of fuel, voluntary or otherwise, by oil-producing countries. Such increases may result in both higher airline ticket prices and decreased demand for air travel generally, which could have an adverse effect on our revenues and results of operations.
WE ARE SUBJECT TO RISKS RELATED TO LITIGATION AND ADMINISTRATIVE PROCEEDINGS THAT
COULD ADVERSELY AFFECT OUR BUSINESS AND FINANCIAL PERFORMANCE IN THE EVENT OF AN
UNFAVORABLE RULING.
The nature of our business exposes us to litigation relating to labor, insurance and safety matters, regulatory, tax and administrative proceedings, governmental investigations, tort claims and contract disputes. Litigation is inherently costly and unpredictable, making it difficult to accurately estimate the outcome among other matters. Currently, as in the past, we are subject to proceedings or investigations of actual or potential litigation. Although we establish provisions as we deem necessary, the amounts that we reserve could vary
significantly from any amounts we actually pay due to the inherent uncertainties in the estimation process. We cannot assure you that these or other legal proceedings will not materially affect our business.
We are subject to anti-corruption, anti-bribery, anti-money laundering and antitrust laws and regulations in Chile, Brazil, the United States and in the various countries we operate. Violations of any such laws or regulations could have a material adverse impact on our reputation and results of operations and financial condition.
We are subject to anti-corruption, anti-bribery, anti-money laundering, antitrust and other international laws and regulations and are required to comply with the applicable laws and regulations of all jurisdictions where we operate. In addition, we are subject to economic sanctions regulations that restrict our dealings with certain sanctioned countries, individuals and entities. There can be no assurance that our internal policies and procedures will be sufficient to prevent or detect all inappropriate practices, fraud or violations of law by our affiliates, employees, directors, officers, partners, agents and service providers or that any such persons will not take actions in violation of our policies and procedures. Any violations by us of anti-bribery and
M A N A G E M E N T 2 0 1 7 129Risk Factors
anti-corruption laws or sanctions regulations could have a material adverse effect on our business, reputation, results of operations and financial condition.
THE BRAZILIAN GOVERNMENT HAS EXERCISED, AND MAY CONTINUE TO EXERCISE, SIGNIFICANT
INFLUENCE OVER THE BRAZILIAN ECONOMY, WHICH MAY HAVE AN ADVERSE IMPACT ON OUR BUSINESS, FINANCIAL CONDITION AND RESULTS
OF OPERATIONS. The Brazilian economy has been characterized by the significant involvement of the Brazilian government, which often changes monetary, credit, fiscal and other policies to influence Brazil’s economy. The Brazilian government’s actions to control inflation and implement other policies have involved wage and price controls, depreciation of the real, controls over remittance of funds abroad, intervention by the Central Bank to affect base interest rates and other measures. We have no control over, and cannot predict what measures or policies the Brazilian government may take in the future.
THE PERUVIAN GOVERNMENT HAS EXERCISED, AND MAY CONTINUE TO EXERCISE, SIGNIFICANT
INFLUENCE OVER THE PERUVIAN ECONOMY, WHICH MAY HAVE AN ADVERSE IMPACT ON OUR BUSINESS, FINANCIAL CONDITION AND RESULTS
OF OPERATIONS.
In the past, Peru has experienced periods of severe economic recession, currency devaluation, high inflation, and political
instability, which have led to adverse economic consequences. We cannot assure you that Peru will not experience similar adverse developments in the future even though for some years now, several democratic procedures have been completed without any violence. We cannot assure you that the current or any future administration will maintain business-friendly and open-market economic policies or policies that stimulate economic growth and social stability. Any changes in the Peruvian economy or the Peruvian government’s economic policies may have a negative effect on our business, financial condition and results of operations.
INSTABILITY AND POLITICAL UNREST IN LATIN AMERICA MAY ADVERSELY AFFECT OUR BUSINESS.
We operate primarily within Latin America and are thus subject to a full range of risks associated with our operations in this region. These risks may include unstable political or economic conditions, lack of well-established or reliable legal systems, exchange controls and other limits on our ability to repatriate earnings and changeable legal and regulatory requirements. In Venezuela, for example, foreign companies may only repatriate cash through specific governmental programs, which may effectively preclude us from repatriating cash for periods of time.
Although conditions throughout Latin America vary from country to country, our customers’ reactions to developments in Latin America generally may result in a reduction in passenger traffic, which could materially and negatively affect our financial condition and results of operations
RISKS RELATED TO OURCOMMON SHARES AND ADSS
OUR MAJOR SHAREHOLDERS MAY HAVE INTERESTS THAT DIFFER FROM THOSE OF OUR
OTHER SHAREHOLDERS.
One of our major shareholder groups, the Cueto Group (the “LATAM Controlling Shareholders”),which as of December 31, 2017, beneficially owned 27.91% of our common shares, is entitled to elect three of the nine members of our board of directors and is in a position to direct our management. In addition, the LATAM Controlling Shareholders have entered into a shareholders agreement with the Amaro Group, which as of December 31, 2017, held 2.58% of LATAM shares through TEP Chile, in addition to the indirect stake it has through the 21.88% interest it holds in Costa Verde Aeronáutica S.A., the main legal vehicle through which the Cueto Group holds LATAM shares, pursuant to which these two major shareholder groups have agreed to vote together to elect individuals to our board of directors in accordance with their direct and indirect shareholder interest in LATAM.
Pursuant to a shareholders’ agreement, the LATAM Controlling Shareholders and the Amaro Group have also agreed to use their good faith efforts to reach an agreement and act jointly on all actions to be taken by our board of directors or shareholders meeting, and if unable to reach to such agreement, to follow the proposals made by our board of directors. Decisions by the Company that require supermajority votes under Chilean law are also subject to voting arrangements by the LATAM Controlling Shareholders and the Amaro Group. In addition, another major shareholder, Qatar Airways Investments (UK) Ltd., which as of December 31, 2017, held 10.03% of our common shares, is entitled to appoint one individual to our board of directors. The interests of our major shareholders may differ from those of our other shareholders.
Under the terms of the deposit agreement governing the ADSs, if holders of ADSs do not provide JP Morgan Chase
M A N A G E M E N T 2 0 1 7 130Risk Factors
Bank, N.A., in its capacity as depositary for the ADSs, with timely instructions on the voting of the common shares underlying their ADRs, the depositary will be deemed to have been instructed to give a person designated by the board of directors the discretionary right to vote those common shares. The person designated by the board of directors to exercise this discretionary voting right may have interests that are aligned with our controlling shareholders, which may differ from those of our other shareholders. Historically, our board of directors has designated its chairman. The members of the new board of Directors elected by the shareholders in 2017 designated Ignacio Cueto, to serve in this role. TRADING OF OUR ADSS AND COMMON SHARES IN THE SECURITIES MARKETS IS LIMITED AND
COULD EXPERIENCE FURTHER ILLIQUIDITY AND PRICE VOLATILITY.
Our common shares are listed on the various Chilean stock exchanges. Chilean securities markets are substantially smaller, less liquid and more volatile than major securities markets in the United States. In addition, Chilean securities markets may be materially affected by developments in other emerging markets, particularly other countries in Latin America. Accordingly, although you are entitled to withdraw the common shares underlying the ADSs from the depositary at any time, your ability to sell the common shares underlying ADSs in the amount and at the price and time of your choice may be substantially limited. This limited trading market may also increase the price volatility of the ADSs or the common shares underlying the ADSs. HOLDERS OF ADRS MAY BE ADVERSELY AFFECTED
BY CURRENCY DEVALUATIONS AND FOREIGN EXCHANGE FLUCTUATIONS.
If the Chilean peso exchange rate falls relative to the U.S. dollar, the value of the ADSs and any distributions made thereon from the depositary could be adversely affected. Cash distributions made in respect of the ADSs are received by the depositary
(represented by the custodian bank in Chile) in pesos, converted by the custodian bank into U.S. dollars at the then-prevailing exchange rate and distributed by the depositary to the holders of the ADRs evidencing those ADSs. In addition, the depositary will incur foreign currency conversion costs (to be borne by the holders of the ADRs) in connection with the foreign currency conversion and subsequent distribution of dividends or other payments with respect to the ADSs.
FUTURE CHANGES IN CHILEAN FOREIGN INVESTMENT CONTROLS AND WITHHOLDING
TAXES COULD NEGATIVELY AFFECT NON-CHILEAN RESIDENTS THAT INVEST IN OUR SHARES.
Equity investments in Chile by non-Chilean residents have been subject in the past to various exchange control regulations that govern investment repatriation and earnings thereon. Although not currently in effect, regulations of the Central Bank of Chile have in the past required, and could again require, foreign investors acquiring securities in the secondary market in Chile to maintain a cash reserve or to pay a fee upon conversion of foreign currency to purchase such securities. Furthermore, future changes in withholding taxes could negatively affect non-Chilean residents that invest in our shares.
We cannot assure you that additional Chilean restrictions applicable to the holders of ADRs, the disposition of the common shares underlying ADSs or the repatriation of the proceeds from an acquisition, a disposition or a dividend payment, will not be imposed or required in the future, nor could we make an assessment as to the duration or impact, were any such restrictions to be imposed or required.
OUR ADS HOLDERS MAY NOT BE ABLE TO EXERCISE PREEMPTIVE RIGHTS IN CERTAIN
CIRCUMSTANCES.
The Chilean Corporation Law provides that preemptive rights shall be granted to all shareholders whenever a company issues new shares for cash, giving such holders the right to purchase a sufficient number of shares to maintain their existing ownership percentage. We will not be able to offer shares to holders of ADSs and shareholders located in the United States pursuant to the preemptive rights granted to shareholders in connection with any future issuance of shares unless a registration statement under the U.S. Securities Act of 1933, as amended, (the “Securities Act”), is effective with respect to such rights and shares, or an exemption from the registration requirements of the Securities Act is available.
At the time of any rights offering, we will evaluate the potential costs and liabilities associated with any such registration statement in light of any indirect benefit to us of enabling U.S. holders of ADRs evidencing ADSs and shareholders located in the United States to exercise preemptive rights, as well as any other factors that may be considered appropriate at that time, and we will then make a decision as to whether we will file a registration statement. We cannot assure you that we will decide to file a registration statement or that such rights will be available to ADS holders and shareholders located in the United States.
WE ARE NOT REQUIRED TO DISCLOSE AS MUCH INFORMATION TO INVESTORS AS A U.S. ISSUER IS REQUIRED TO DISCLOSE AND, AS A
RESULT, YOU MAY RECEIVE LESS INFORMATION ABOUT US THAN YOU WOULD RECEIVE FROM A
COMPARABLE U.S. COMPANY.

M A N A G E M E N T 2 0 1 7 131Risk Factors
The corporate disclosure requirements that apply to us may not be equivalent to the disclosure requirements that apply to a U.S. company and, as a result, you may receive less information about us than you would receive from a comparable U.S. company. We are subject to the reporting requirements of the Securities Exchange Act of 1934, as amended, or the Exchange Act. The disclosure requirements applicable to foreign issuers under the Exchange Act are more limited than the disclosure requirements applicable to U.S. issuers. Publicly available information about issuers of securities listed on Chilean stock exchanges also provides less detail in certain respects than the information regularly published by listed companies in the United States or in certain other countries. Furthermore, there is a lower level of regulation of the Chilean securities market and of the activities of investors in such markets as compared with the level of regulation of the securities markets in the United States and in certain other developed countries.

M A N A G E M E N T 2 0 1 7 132Additional information
Additional
Our strategic partners allow us to achieveoperating efficiency while taking care
of our employees’ security
SUPPLIERS
During the year 2017, and just like in previous years, the main suppliers of LATAM Airlines were the aircraft manufacturers, Airbus and Boeing.
ALONG WITH THEM, LATAM AIRLINES HAS A NUMBER OF OTHER SUPPLIERS, PRIMARILY
RELATED TO AIRCRAFT ACCESSORIES, SPARE PARTS AND COMPONENTS, SUCH AS:
Pratt & Whitney, MTU Maintenance, Rolls-Royce, Pratt and Whitney Canada, CFM International, General Electric Comercial Aviation Services Ltd., General Electric Celma, General Electric Engines Service, Honeywell, Israel Aerospace Industries, Air France/KLM (engines and APU); Zodiac Seats US, Recaro, Thompson Aero Seating (seats); Honeywell y Rockwell Collins (Avionics); Air France/KLM, LUFTHANSA Technik (MRO components); Zodiac Inflight Innovations, Panasonic, Thales (On-board entertainment); SAFRAN Landing Systems, AAR Corp (trains and brakes); UTC Aerospace Nordam (nacelles). To these, we must be added our fuel suppliers, such as Raizen, Petrobras, Air BP-Copec, World Fuel Services, PBF, Shell, YPF, Terpel, Repsol, CEPSA, Vitol, among others.
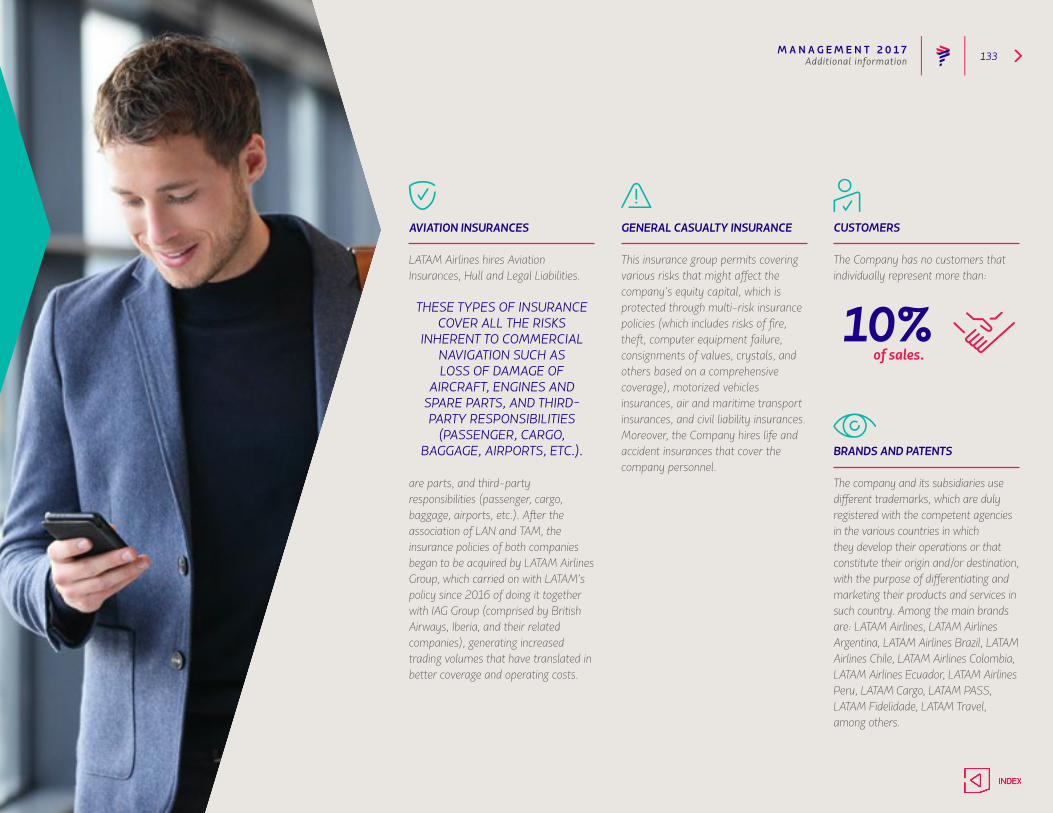
M A N A G E M E N T 2 0 1 7 133
AVIATION INSURANCES
LATAM Airlines hires Aviation Insurances, Hull and Legal Liabilities.
THESE TYPES OF INSURANCE COVER ALL THE RISKS
INHERENT TO COMMERCIAL NAVIGATION SUCH AS LOSS OF DAMAGE OF
AIRCRAFT, ENGINES AND SPARE PARTS, AND THIRD-PARTY RESPONSIBILITIES
(PASSENGER, CARGO, BAGGAGE, AIRPORTS, ETC.).
are parts, and third-party responsibilities (passenger, cargo, baggage, airports, etc.). After the association of LAN and TAM, the insurance policies of both companies began to be acquired by LATAM Airlines Group, which carried on with LATAM’s policy since 2016 of doing it together with IAG Group (comprised by British Airways, Iberia, and their related companies), generating increased trading volumes that have translated in better coverage and operating costs.
GENERAL CASUALTY INSURANCE
This insurance group permits covering various risks that might affect the company’s equity capital, which is protected through multi-risk insurance policies (which includes risks of fire, theft, computer equipment failure, consignments of values, crystals, and others based on a comprehensive coverage), motorized vehicles insurances, air and maritime transport insurances, and civil liability insurances. Moreover, the Company hires life and accident insurances that cover the company personnel.
CUSTOMERS
The Company has no customers that individually represent more than:
BRANDS AND PATENTS
The company and its subsidiaries use different trademarks, which are duly registered with the competent agencies in the various countries in which they develop their operations or that constitute their origin and/or destination, with the purpose of differentiating and marketing their products and services in such country. Among the main brands are: LATAM Airlines, LATAM Airlines Argentina, LATAM Airlines Brazil, LATAM Airlines Chile, LATAM Airlines Colombia, LATAM Airlines Ecuador, LATAM Airlines Peru, LATAM Cargo, LATAM PASS, LATAM Fidelidade, LATAM Travel, among others.
of sales.10%
Additional information

M A N A G E M E N T 2 0 1 7 134Investment Plan
We adapt to the market conditions
L ATAM continues to have a flexible view regarding its fleet plan, adapting to operational requirements and to market conditions. In the last few years, the Company
has been adjusting its future fleet commitments by postponing or canceling aircraft orders. This led the Company to achieve in 2017 the lowest fleet commitment in its recent history, with US$326 million related to the delivery of two Airbus A320neo and two Boeing 787-9 planes.
These reductions have translated into a significant improvement in the Company’s balance sheet position and cash flow generation, due to lower rentals and capital expenditures, as well as lower financing needs.
IN 2018, THE COMPANY’S FLEET COMMITMENTS TOTAL US$714 MILLION, RELATED TO THE DELIVERY OF SIX AIRBUS A320NEO, TWO A321NEO, AND TWO
A350. FOR 2019, FLEET COMMITMENTS AMOUNT TO US$1,213 MILLION, RELATED TO THE DELIVERY OF FOUR AIRBUS A320NEO, FOUR A321NEO, FOUR
AIRBUS A350, AND TWO BOEING 787-9.
Plan
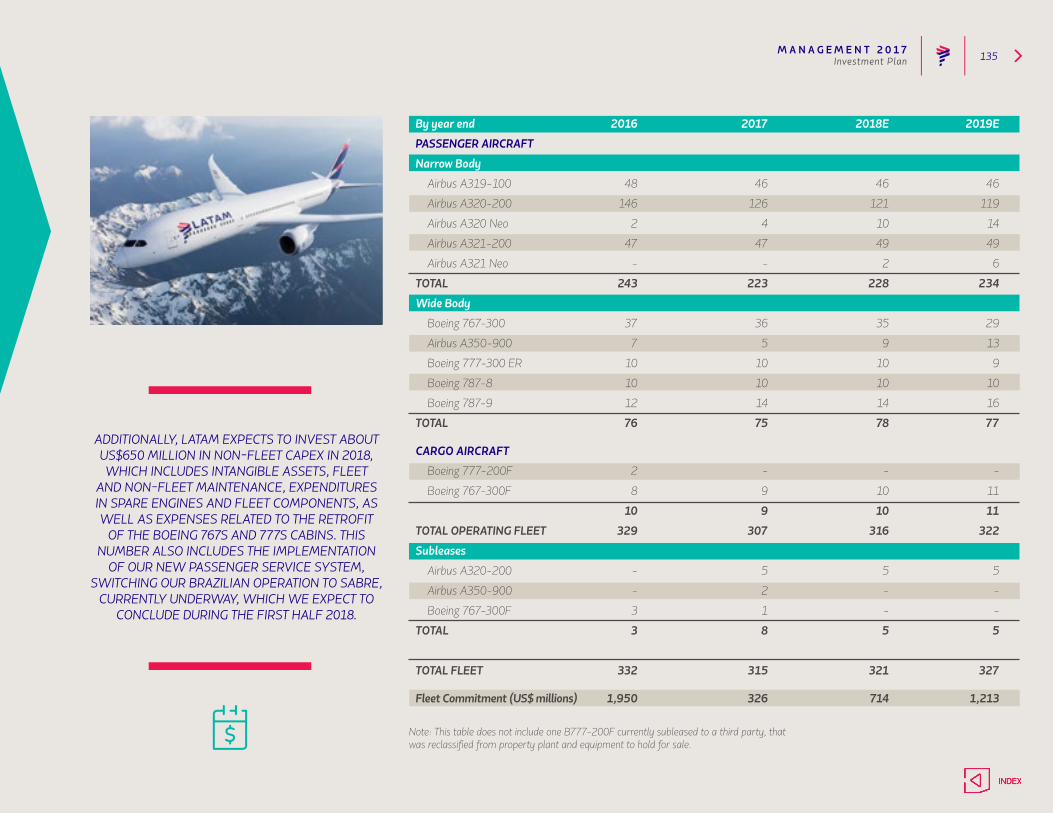
M A N A G E M E N T 2 0 1 7 135
By year end 2016 2017 2018E 2019E
PASSENGER AIRCRAFT
Narrow Body
Airbus A319-100 48 46 46 46
Airbus A320-200 146 126 121 119
Airbus A320 Neo 2 4 10 14
Airbus A321-200 47 47 49 49
Airbus A321 Neo - - 2 6
TOTAL 243 223 228 234
Wide Body
Boeing 767-300 37 36 35 29
Airbus A350-900 7 5 9 13
Boeing 777-300 ER 10 10 10 9
Boeing 787-8 10 10 10 10
Boeing 787-9 12 14 14 16
TOTAL 76 75 78 77
CARGO AIRCRAFT
Boeing 777-200F 2 - - -
Boeing 767-300F 8 9 10 11
10 9 10 11
TOTAL OPERATING FLEET 329 307 316 322
Subleases
Airbus A320-200 - 5 5 5
Airbus A350-900 - 2 - -
Boeing 767-300F 3 1 - -
TOTAL 3 8 5 5
TOTAL FLEET 332 315 321 327
Fleet Commitment (US$ millions) 1,950 326 714 1,213
Investment Plan
ADDITIONALLY, LATAM EXPECTS TO INVEST ABOUT US$650 MILLION IN NON-FLEET CAPEX IN 2018, WHICH INCLUDES INTANGIBLE ASSETS, FLEET
AND NON-FLEET MAINTENANCE, EXPENDITURES IN SPARE ENGINES AND FLEET COMPONENTS, AS WELL AS EXPENSES RELATED TO THE RETROFIT
OF THE BOEING 767S AND 777S CABINS. THIS NUMBER ALSO INCLUDES THE IMPLEMENTATION
OF OUR NEW PASSENGER SERVICE SYSTEM, SWITCHING OUR BRAZILIAN OPERATION TO SABRE,
CURRENTLY UNDERWAY, WHICH WE EXPECT TO CONCLUDE DURING THE FIRST HALF 2018.
Note: This table does not include one B777-200F currently subleased to a third party, that was reclassified from property plant and equipment to hold for sale.

We innovate by using latest technology, and promote humanitarian and ecological initiatives.
S U S TA I N A-
B I L I T Y
S U S T A I N A B I L I T Y 137Sustainability vision
vision
W ith the Sustainability Policy in place, in 2017 the Group focused its efforts on raising awareness and engaging leaders and teams in implementing the
economic, social and environmental dimensions in work routines and decision-making processes. Presentations were made to the Executive Committee and to specific areas, such as Legal, Human Resources, Marketing, and Safety, among others.
The sustainability goals and targets are monitored by the Board of Directors. In 2017, the board started to assess how to enhance the current governance structure, including the incorporation of diversity-related questions. It should be noted that whenever an executive assumes a senior management position at LATAM, he or she undergoes an immersion process on business strategy which, based on this intersecting model, includes a specific module on managing sustainability.
The Sustainability Policy establishes the three dimensions in which the Sustainability Strategy is structured:
• Governance: this establishes how the group should position itself in relation to its sustainability commitments and targets, as well as defining the spheres responsible for decision making, execution, and monitoring results.
• Climate change: the concept put forward seeks a balance between mitigating risks and identifying new opportunities for managing environmental aspects (actual and potential), stressing reduction of the operations’ carbon footprint and the promotion of eco-efficient practices.
• Corporate citizenship: this is aimed at transforming the business and the agents in the group’s value chain into drivers of social progress, economic development, and environmental preservation in the regions where LATAM operates.
Each dimension encompasses a series of areas to be developed by LATAM. These are broken down into goals and targets. To measure development in these areas, LATAM uses its performance on the Dow Jones Sustainability Index (DJSI), whose Best in Class methodology assesses the performance of publicly traded companies in different sectors in terms of managing governance, social, and environmental practices. The analysis, conducted by the investment consultancy specialized in sustainability, RobecoSAM, generates a final list featuring the organizations considered to be references in the aspects mentioned.
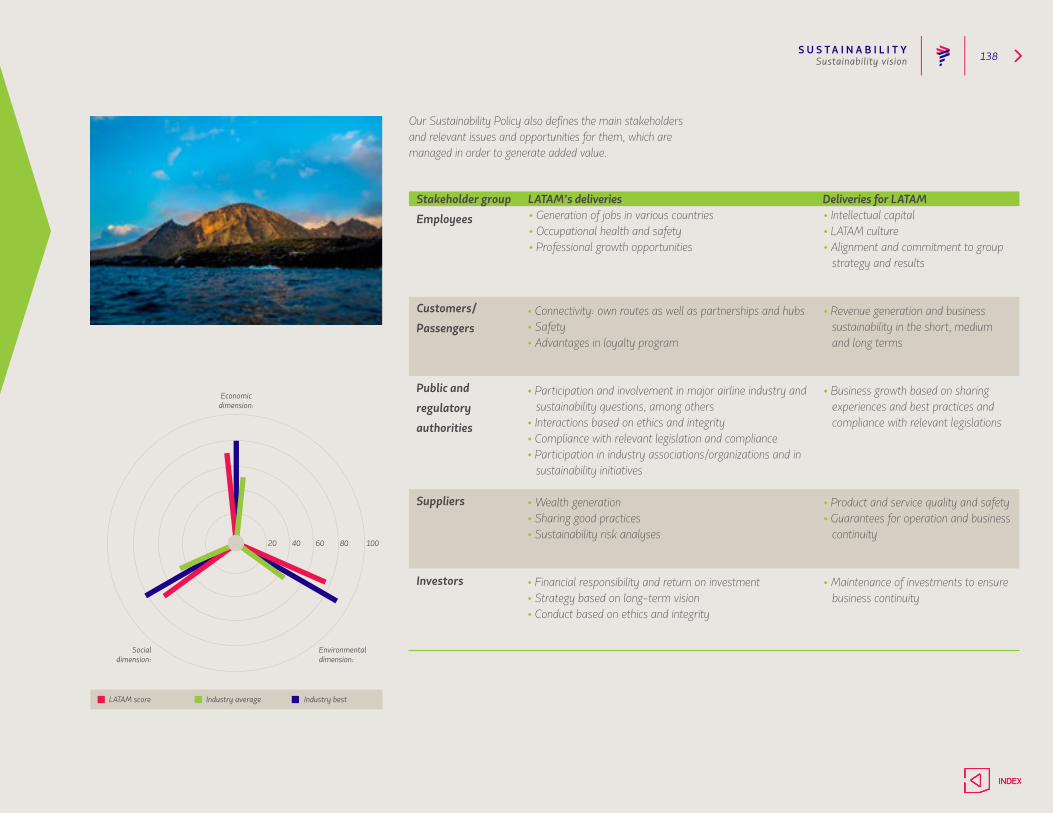
S U S T A I N A B I L I T Y 138Sustainability vision
Our Sustainability Policy also defines the main stakeholders and relevant issues and opportunities for them, which are managed in order to generate added value.
Economicdimension:
Environmental dimension:
Socialdimension:
LATAM score Industry average Industry best
Stakeholder group
Employees
Customers/
Passengers
Public and
regulatory
authorities
Suppliers
Investors
Deliveries for LATAM• Intellectual capital• LATAM culture• Alignment and commitment to group
strategy and results
• Revenue generation and business sustainability in the short, medium and long terms
• Business growth based on sharing experiences and best practices and compliance with relevant legislations
• Product and service quality and safety• Guarantees for operation and business
continuity
• Maintenance of investments to ensure business continuity
LATAM’s deliveries• Generation of jobs in various countries• Occupational health and safety • Professional growth opportunities
• Connectivity: own routes as well as partnerships and hubs• Safety• Advantages in loyalty program
• Participation and involvement in major airline industry and sustainability questions, among others
• Interactions based on ethics and integrity• Compliance with relevant legislation and compliance• Participation in industry associations/organizations and in
sustainability initiatives
• Wealth generation • Sharing good practices• Sustainability risk analyses
• Financial responsibility and return on investment • Strategy based on long-term vision• Conduct based on ethics and integrity
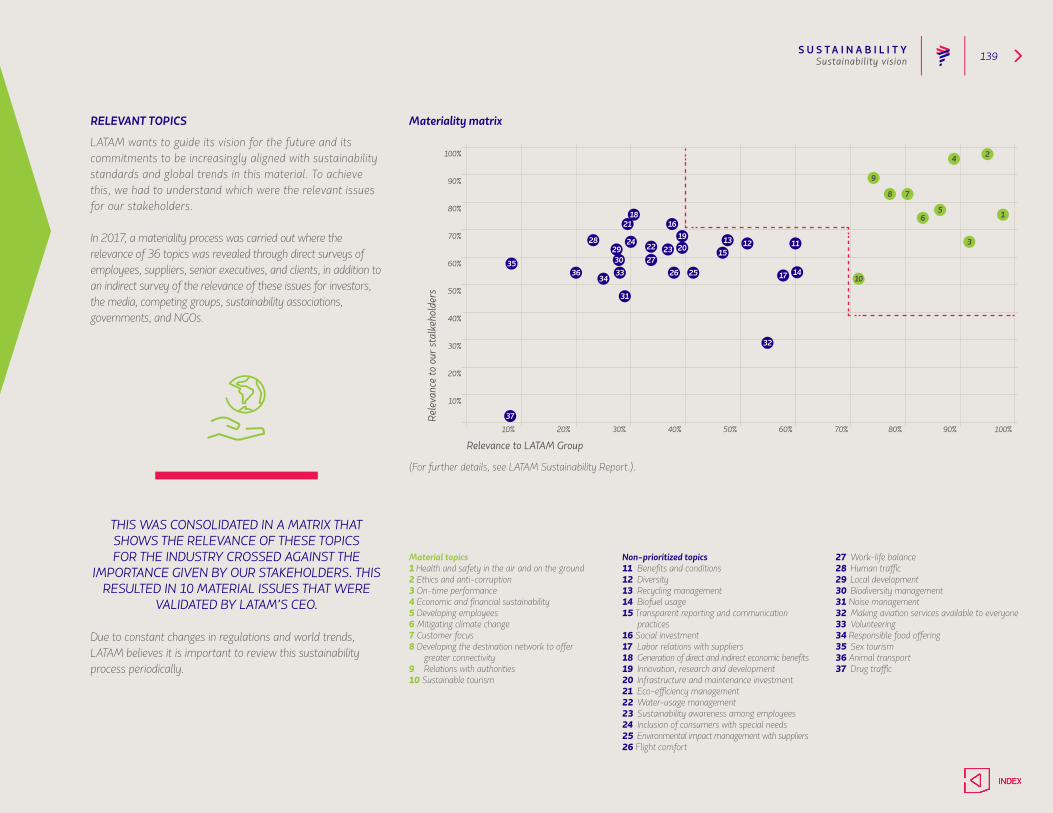
S U S T A I N A B I L I T Y 139
RELEVANT TOPICS
LATAM wants to guide its vision for the future and its commitments to be increasingly aligned with sustainability standards and global trends in this material. To achieve this, we had to understand which were the relevant issues for our stakeholders.
In 2017, a materiality process was carried out where the relevance of 36 topics was revealed through direct surveys of employees, suppliers, senior executives, and clients, in addition to an indirect survey of the relevance of these issues for investors, the media, competing groups, sustainability associations, governments, and NGOs.
THIS WAS CONSOLIDATED IN A MATRIX THAT SHOWS THE RELEVANCE OF THESE TOPICS FOR THE INDUSTRY CROSSED AGAINST THE
IMPORTANCE GIVEN BY OUR STAKEHOLDERS. THIS RESULTED IN 10 MATERIAL ISSUES THAT WERE
VALIDATED BY LATAM’S CEO.
Due to constant changes in regulations and world trends, LATAM believes it is important to review this sustainability process periodically.
Materiality matrix
(For further details, see LATAM Sustainability Report.).
Material topics1 Health and safety in the air and on the ground2 Ethics and anti-corruption3 On-time performance4 Economic and financial sustainability5 Developing employees6 Mitigating climate change7 Customer focus8 Developing the destination network to offer
greater connectivity9 Relations with authorities10 Sustainable tourism
Non-prioritized topics11 Benefits and conditions12 Diversity13 Recycling management14 Biofuel usage15 Transparent reporting and communication
practices16 Social investment17 Labor relations with suppliers18 Generation of direct and indirect economic benefits19 Innovation, research and development20 Infrastructure and maintenance investment21 Eco-efficiency management22 Water-usage management23 Sustainability awareness among employees24 Inclusion of consumers with special needs25 Environmental impact management with suppliers26 Flight comfort
27 Work-life balance28 Human traffic29 Local development30 Biodiversity management31 Noise management32 Making aviation services available to everyone33 Volunteering34 Responsible food offering35 Sex tourism36 Animal transport37 Drug traffic
Sustainability vision
Relevance to LATAM GroupRe
leva
nce
to o
ur st
alke
hold
ers
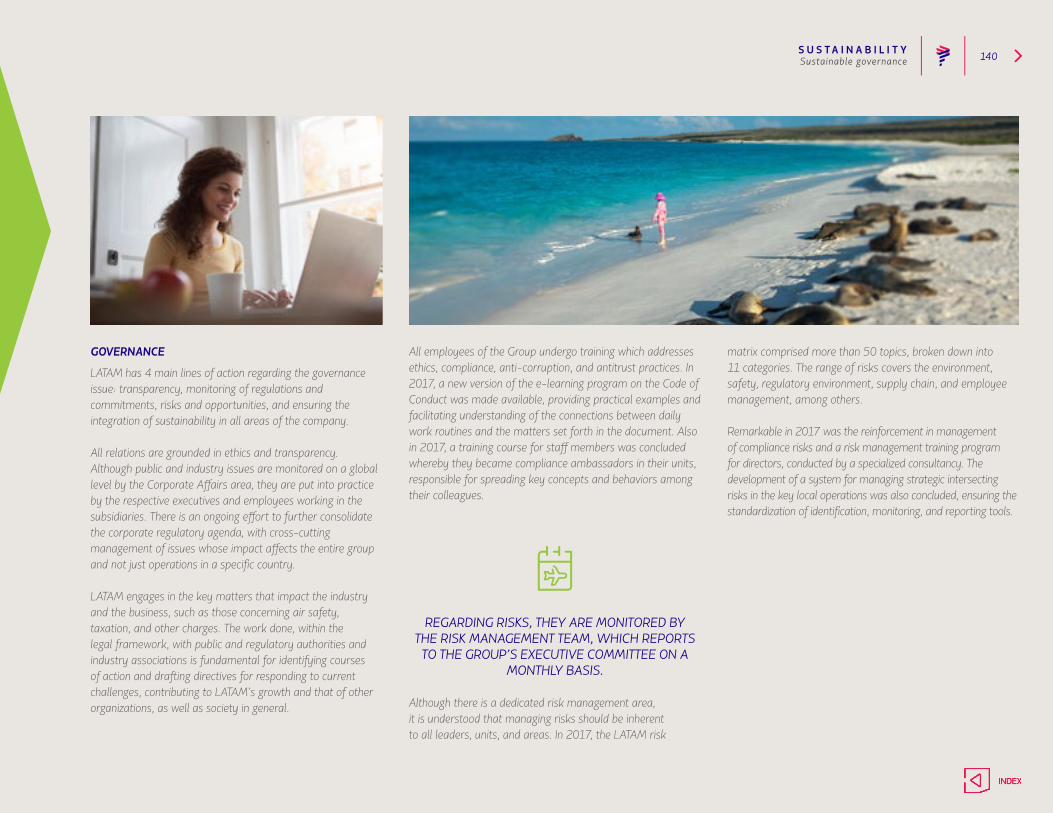
S U S T A I N A B I L I T Y 140Sustainable governance
GOVERNANCE
LATAM has 4 main lines of action regarding the governance issue: transparency, monitoring of regulations and commitments, risks and opportunities, and ensuring the integration of sustainability in all areas of the company.
All relations are grounded in ethics and transparency. Although public and industry issues are monitored on a global level by the Corporate Affairs area, they are put into practice by the respective executives and employees working in the subsidiaries. There is an ongoing effort to further consolidate the corporate regulatory agenda, with cross-cutting management of issues whose impact affects the entire group and not just operations in a specific country.
LATAM engages in the key matters that impact the industry and the business, such as those concerning air safety, taxation, and other charges. The work done, within the legal framework, with public and regulatory authorities and industry associations is fundamental for identifying courses of action and drafting directives for responding to current challenges, contributing to LATAM’s growth and that of other organizations, as well as society in general.
All employees of the Group undergo training which addresses ethics, compliance, anti-corruption, and antitrust practices. In 2017, a new version of the e-learning program on the Code of Conduct was made available, providing practical examples and facilitating understanding of the connections between daily work routines and the matters set forth in the document. Also in 2017, a training course for staff members was concluded whereby they became compliance ambassadors in their units, responsible for spreading key concepts and behaviors among their colleagues.
REGARDING RISKS, THEY ARE MONITORED BY THE RISK MANAGEMENT TEAM, WHICH REPORTS
TO THE GROUP’S EXECUTIVE COMMITTEE ON A MONTHLY BASIS.
Although there is a dedicated risk management area, it is understood that managing risks should be inherent to all leaders, units, and areas. In 2017, the LATAM risk
matrix comprised more than 50 topics, broken down into 11 categories. The range of risks covers the environment, safety, regulatory environment, supply chain, and employee management, among others.
Remarkable in 2017 was the reinforcement in management of compliance risks and a risk management training program for directors, conducted by a specialized consultancy. The development of a system for managing strategic intersecting risks in the key local operations was also concluded, ensuring the standardization of identification, monitoring, and reporting tools.
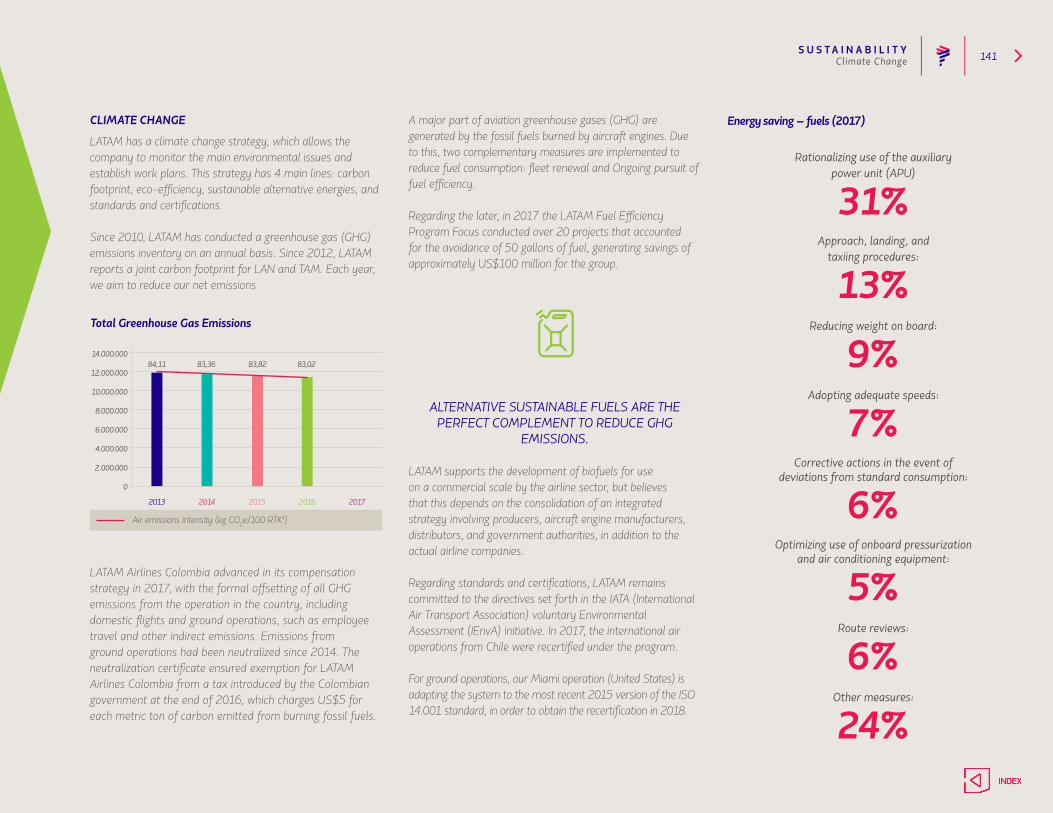
S U S T A I N A B I L I T Y 141
CLIMATE CHANGE
LATAM has a climate change strategy, which allows the company to monitor the main environmental issues and establish work plans. This strategy has 4 main lines: carbon footprint, eco-efficiency, sustainable alternative energies, and standards and certifications.
Since 2010, LATAM has conducted a greenhouse gas (GHG) emissions inventory on an annual basis. Since 2012, LATAM reports a joint carbon footprint for LAN and TAM. Each year, we aim to reduce our net emissions
LATAM Airlines Colombia advanced in its compensation strategy in 2017, with the formal offsetting of all GHG emissions from the operation in the country, including domestic flights and ground operations, such as employee travel and other indirect emissions. Emissions from ground operations had been neutralized since 2014. The neutralization certificate ensured exemption for LATAM Airlines Colombia from a tax introduced by the Colombian government at the end of 2016, which charges US$5 for each metric ton of carbon emitted from burning fossil fuels.
A major part of aviation greenhouse gases (GHG) are generated by the fossil fuels burned by aircraft engines. Due to this, two complementary measures are implemented to reduce fuel consumption: fleet renewal and Ongoing pursuit of fuel efficiency.
Regarding the later, in 2017 the LATAM Fuel Efficiency Program Focus conducted over 20 projects that accounted for the avoidance of 50 gallons of fuel, generating savings of approximately US$100 million for the group.
ALTERNATIVE SUSTAINABLE FUELS ARE THE PERFECT COMPLEMENT TO REDUCE GHG
EMISSIONS.
LATAM supports the development of biofuels for use on a commercial scale by the airline sector, but believes that this depends on the consolidation of an integrated strategy involving producers, aircraft engine manufacturers, distributors, and government authorities, in addition to the actual airline companies.
Regarding standards and certifications, LATAM remains committed to the directives set forth in the IATA (International Air Transport Association) voluntary Environmental Assessment (IEnvA) initiative. In 2017, the international air operations from Chile were recertified under the program.
For ground operations, our Miami operation (United States) is adapting the system to the most recent 2015 version of the ISO 14.001 standard, in order to obtain the recertification in 2018.
Energy saving – fuels (2017)
Rationalizing use of the auxiliary power unit (APU)
31%Approach, landing, and
taxiing procedures:
13%Reducing weight on board:
9%Adopting adequate speeds:
7%Corrective actions in the event of
deviations from standard consumption:
6%Optimizing use of onboard pressurization
and air conditioning equipment:
5%Route reviews:
6%
Other measures:
24%
Climate Change
Total Greenhouse Gas Emissions
Air emissions intensity (kg CO2e/100 RTK4)
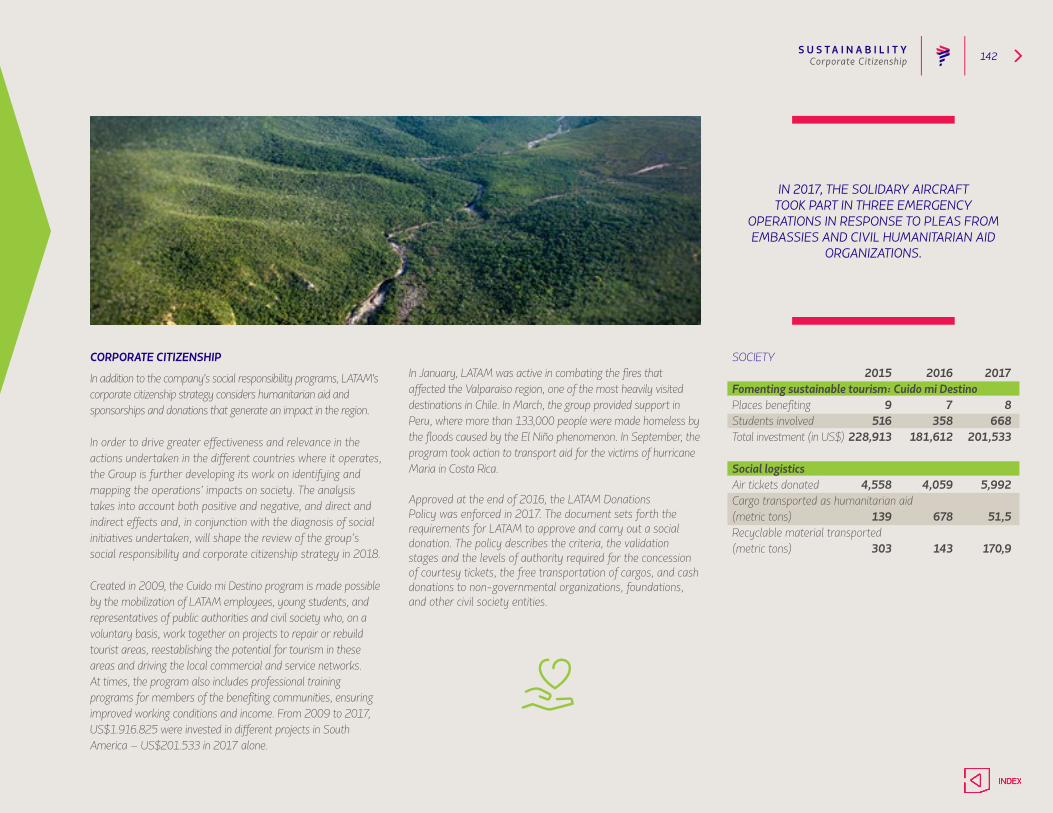
S U S T A I N A B I L I T Y 142
CORPORATE CITIZENSHIP
In addition to the company's social responsibility programs, LATAM's corporate citizenship strategy considers humanitarian aid and sponsorships and donations that generate an impact in the region.
In order to drive greater effectiveness and relevance in the actions undertaken in the different countries where it operates, the Group is further developing its work on identifying and mapping the operations’ impacts on society. The analysis takes into account both positive and negative, and direct and indirect effects and, in conjunction with the diagnosis of social initiatives undertaken, will shape the review of the group’s social responsibility and corporate citizenship strategy in 2018.
Created in 2009, the Cuido mi Destino program is made possible by the mobilization of LATAM employees, young students, and representatives of public authorities and civil society who, on a voluntary basis, work together on projects to repair or rebuild tourist areas, reestablishing the potential for tourism in these areas and driving the local commercial and service networks. At times, the program also includes professional training programs for members of the benefiting communities, ensuring improved working conditions and income. From 2009 to 2017, US$1.916.825 were invested in different projects in South America – US$201.533 in 2017 alone.
In January, LATAM was active in combating the fires that affected the Valparaiso region, one of the most heavily visited destinations in Chile. In March, the group provided support in Peru, where more than 133,000 people were made homeless by the floods caused by the El Niño phenomenon. In September, the program took action to transport aid for the victims of hurricane Maria in Costa Rica.
Approved at the end of 2016, the LATAM Donations Policy was enforced in 2017. The document sets forth the requirements for LATAM to approve and carry out a social donation. The policy describes the criteria, the validation stages and the levels of authority required for the concession of courtesy tickets, the free transportation of cargos, and cash donations to non-governmental organizations, foundations, and other civil society entities.
SOCIETY 2015 2016 2017Fomenting sustainable tourism: Cuido mi DestinoPlaces benefiting 9 7 8Students involved 516 358 668Total investment (in US$) 228,913 181,612 201,533
Social logisticsAir tickets donated 4,558 4,059 5,992Cargo transported as humanitarian aid(metric tons) 139 678 51,5Recyclable material transported(metric tons) 303 143 170,9
IN 2017, THE SOLIDARY AIRCRAFT TOOK PART IN THREE EMERGENCY
OPERATIONS IN RESPONSE TO PLEAS FROM EMBASSIES AND CIVIL HUMANITARIAN AID
ORGANIZATIONS.
Corporate Citizenship

We made great achievements, supported by the implementation of the initiatives from our transformation plan.
F I N A N C I A L
S TAT E -
M E N T S
F I N A N C I A L S T AT E M E N T S 144Consolidated Financial Statements
LATAM AIRLINES GROUP S.A. AND SUBSIDIARIES CONSOLIDATED FINANCIAL STATEMENTS DECEMBER 31, 2017 CONTENTS Consolidated Statement of Financial Position Consolidated Statement of Income by Function Consolidated Statement of Comprehensive Income Consolidated Statement of Changes in Equity Consolidated Statement of Cash Flows - Direct Method Notes to the Consolidated Financial Statements CLP - CHILEAN PESO ARS - ARGENTINE PESO US$ - UNITED STATES DOLLAR THUS$ - THOUSANDS OF UNITED STATES DOLLARS COP - COLOMBIAN PESO BRL/R$ - BRAZILIAN REAL THR$ - THOUSANDS OF BRAZILIAN REAL MXN - MEXICAN PESO VEF - STRONG BOLIVAR
REPORT OF INDEPENDENT AUDITORS (Free translation from the original in Spanish) Santiago, March 14, 2018 To the Board of Directors and Shareholders Latam Airlines Group S.A. We have audited the accompanying consolidated financial statements of Latam Airlines Group S.A. and subsidiaries, which comprise the consolidated statement of financial position as at December 31, 2017 and 2016 and the related statements of income, comprehensive income, changes in equity and cash flows for the years then ended, and the corresponding notes to the consolidate financial statements. Management’s responsibility for the consolidated financial statements Management is responsible for the preparation and fair presentation of these consolidated financial statements in accordance with the International Financial Reporting Standards (IFRS). This responsibility includes the design, implementation and maintenance of a relevant internal control for the preparation and fair presentation of consolidated financial statements that are free from material misstatement, whether due to fraud or error. Auditor’s responsibility Our responsibility is to express an opinion on these consolidated financial statements based on our audits. We conducted our audits in accordance with Chilean Generally Accepted Auditing Standards. Those standards require that we plan and perform the audit to obtain reasonable assurance about whether the consolidated financial statements are free from material misstatement. An audit involves performing procedures to obtain audit evidence about the amounts and disclosures in the consolidated financial statements. The procedures selected depend on the auditor’s judgment, including the assessment of the risks of material misstatement of the consolidated financial statements, whether due to fraud or error. In making those risk assessments, the auditor considers internal control relevant to the entity’s preparation and fair presentation of the consolidated financial statements in order to design audit procedures that are appropriate in the circumstances, but not for the purpose of expressing an opinion on the effectiveness of the entity’s internal control. As a consequence we do not express that kind of opinion. An audit also includes evaluating the appropriateness of accounting policies used and the reasonableness of accounting estimates made by management, as well as evaluating the overall presentation of the consolidated financial statements. We believe that the audit evidence we have obtained is sufficient and appropriate to provide a basis for our audit opinion.

F I N A N C I A L S T AT E M E N T S 145Consolidated Financial Statements
Santiago, March 14, 2018 Latam Airlines Group S.A. 2 Opinion In our opinion, the consolidated financial statements present fairly, in all material respects the financial position of Latam Airlines Group S.A. and subsidiaries as at December 31, 2017 and 2016, and the results of operations and cash flows for the years then ended in accordance with the International Financial Reporting Standards (IFRS). Renzo Corona Spedaliere RUT: 6.373.028-9
Contents of the notes to the consolidated financial statements of LATAM Airlines Group S.A. and Subsidiaries.
Notes Page 1 - General information ....................................................................................................................... 1 2 - Summary of significant accounting policies .................................................................................. 5
2.1. Basis of Preparation ................................................................................................................. 5 2.2. Basis of Consolidation ............................................................................................................. 8 2.3. Foreign currency transactions .................................................................................................. 9 2.4. Property, plant and equipment ............................................................................................... 10 2.5. Intangible assets other than goodwill ..................................................................................... 11 2.6. Goodwill ................................................................................................................................. 11 2.7. Borrowing costs ..................................................................................................................... 12 2.8. Losses for impairment of non-financial assets ....................................................................... 12 2.9. Financial assets ....................................................................................................................... 12 2.10. Derivative financial instruments and hedging activities ...................................................... 13 2.11. Inventories ............................................................................................................................ 14 2.12. Trade and other accounts receivable .................................................................................... 14 2.13. Cash and cash equivalents .................................................................................................... 15 2.14. Capital .................................................................................................................................. 15 2.15. Trade and other accounts payables ....................................................................................... 15 2.16. Interest-bearing loans ........................................................................................................... 15 2.17. Current and deferred taxes ................................................................................................... 15 2.18. Employee benefits ................................................................................................................ 16 2.19. Provisions ............................................................................................................................. 16 2.20. Revenue recognition ............................................................................................................. 17 2.21. Leases ................................................................................................................................... 17 2.22. Non-current assets (or disposal groups) classified as held for sale ...................................... 18 2.23. Maintenance ......................................................................................................................... 18 2.24. Environmental costs ............................................................................................................. 18
3 - Financial risk management .......................................................................................................... 19 3.1. Financial risk factors .............................................................................................................. 19 3.2. Capital risk management ........................................................................................................ 33 3.3. Estimates of fair value ............................................................................................................ 33
4 - Accounting estimates and judgments ........................................................................................... 35 5 - Segmental information ................................................................................................................. 39 6 - Cash and cash equivalents ........................................................................................................... 42 7 - Financial instruments ................................................................................................................... 43
7.1. Financial instruments by category .......................................................................................... 43 7.2. Financial instruments by currency ......................................................................................... 45
8 - Trade, other accounts receivable and non-current accounts receivable ....................................... 46 9 - Accounts receivable from/payable to related entities .................................................................. 49 10 - Inventories ................................................................................................................................. 50 11 - Other financial assets ................................................................................................................. 51 12 - Other non-financial assets .......................................................................................................... 52 13 - Non-current assets and disposal group classified as held for sale ............................................. 53 14 - Investments in subsidiaries ........................................................................................................ 54
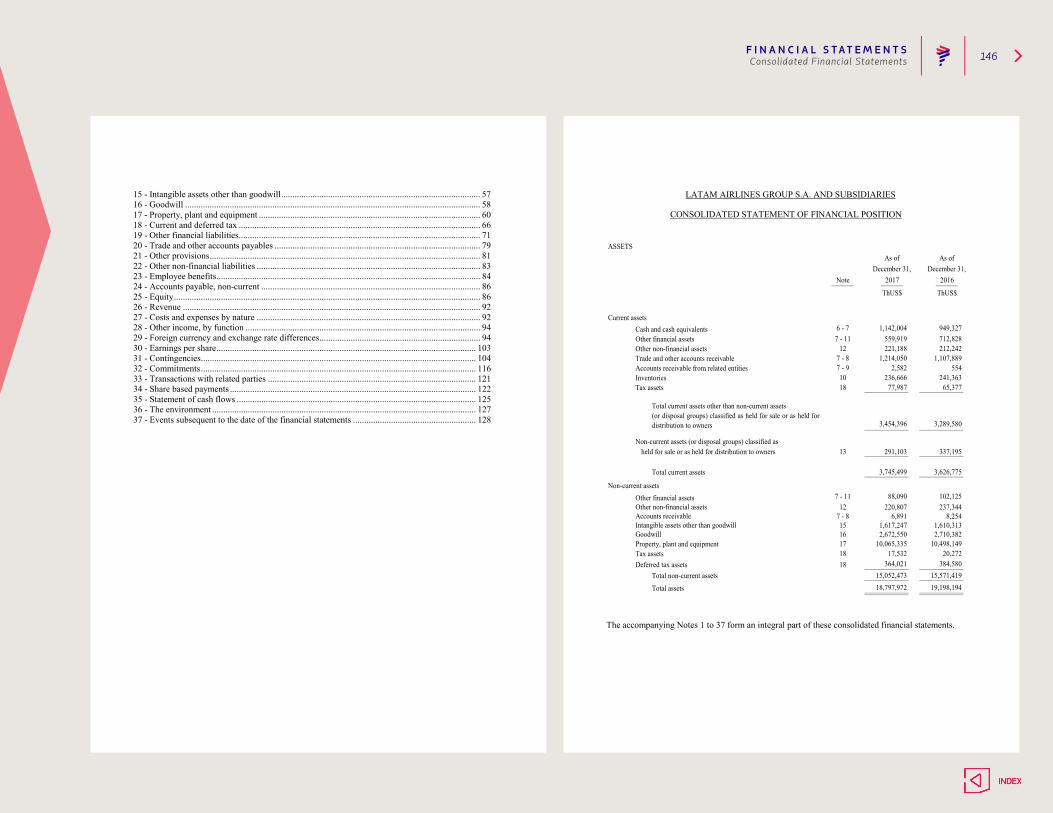
F I N A N C I A L S T AT E M E N T S 146Consolidated Financial Statements
15 - Intangible assets other than goodwill ......................................................................................... 57 16 - Goodwill .................................................................................................................................... 58 17 - Property, plant and equipment ................................................................................................... 60 18 - Current and deferred tax ............................................................................................................ 66 19 - Other financial liabilities ............................................................................................................ 71 20 - Trade and other accounts payables ............................................................................................ 79 21 - Other provisions ......................................................................................................................... 81 22 - Other non-financial liabilities .................................................................................................... 83 23 - Employee benefits ...................................................................................................................... 84 24 - Accounts payable, non-current .................................................................................................. 86 25 - Equity ......................................................................................................................................... 86 26 - Revenue ..................................................................................................................................... 92 27 - Costs and expenses by nature .................................................................................................... 92 28 - Other income, by function ......................................................................................................... 94 29 - Foreign currency and exchange rate differences ........................................................................ 94 30 - Earnings per share .................................................................................................................... 103 31 - Contingencies ........................................................................................................................... 104 32 - Commitments ........................................................................................................................... 116 33 - Transactions with related parties ............................................................................................. 121 34 - Share based payments .............................................................................................................. 122 35 - Statement of cash flows ........................................................................................................... 125 36 - The environment ...................................................................................................................... 127 37 - Events subsequent to the date of the financial statements ....................................................... 128
LATAM AIRLINES GROUP S.A. AND SUBSIDIARIES
CONSOLIDATED STATEMENT OF FINANCIAL POSITION
15,052,47318,797,972
18Deferred tax assetsTotal non-current assets
GoodwillProperty, plant and equipment
1617
364,021
Total assets
Tax assets 18 17,532
220,8076,891
1,617,2472,672,550
10,065,335
Tax assets 18
Other non-financial assetsAccounts receivable
Other financial assets
Intangible assets other than goodwill 15
127 - 8
7 - 11
3,745,499
88,090Non-current assets
Total current assets
Total current assets other than non-current assets (or disposal groups) classified as held for sale or as held fordistribution to owners 3,454,396
291,103
77,987
As ofDecember 31,
7 - 9
Other financial assetsOther non-financial assetsTrade and other accounts receivableAccounts receivable from related entities
10
7 - 8
Cash and cash equivalents7 - 11
12
6 - 7
December 31,2017
As of
1,142,004559,919221,188
ASSETS
13
Inventories
1,214,0502,582
236,666
Non-current assets (or disposal groups) classified as held for sale or as held for distribution to owners
ThUS$
Note
Current assets
2016
ThUS$
949,327712,828212,242
1,107,889554
1,610,3132,710,382
10,498,14920,272
384,58015,571,41919,198,194
241,36365,377
3,289,580
337,195
3,626,775
102,125237,344
8,254
The accompanying Notes 1 to 37 form an integral part of these consolidated financial statements.

F I N A N C I A L S T AT E M E N T S 147Consolidated Financial Statements
LATAM AIRLINES GROUP S.A. AND SUBSIDIARIES
CONSOLIDATED STATEMENT OF FINANCIAL POSITION
Liabilities included in disposal groups classified as held for sale
Total liabilities
Treasury Shares
Total equityTotal liabilities and equity
91,1474,267,236
18,797,9724,185,304
422,494915,759
82,322
(178)
19,198,194
Non-controlling interest 14 88,644Parent's ownership interest
213,781
Deferred tax liabilities 18
8,790,699
3,149,564Share capital 25 3,146,265EQUITY
949,697101,087
14,530,736 15,012,890Total non-current liabilities 8,688,022
2,762,245
6,222,191
6,605,508498,832
6,796,952359,391
Other non-financial liabilities 22
Non-current liabilities
Accounts payable 7 - 24Other financial liabilities
6,212,039
15,546 10,15213
Employee benefits
Current liabilities
Total current liabilities
23Other non-financial liabilities 22 158,305
7 - 19
1,695,202760
2,7833,511
Other provisions 21 374,593
5,842,714
2,823,963
21Tax liabilities 18
5,827,168
2,64314,286
LIABILITIES AND EQUITY
LIABILITIES Note 2017 2016December 31, December 31,
As of As of
ThUS$ ThUS$
Other provisions
Other reserves4,096,660
25475,118
(178)554,884
4,176,089
366,404
580,870
Retained earnings 25
Other financial liabilities 7 - 19Trade and other accounts payables 7 - 20Accounts payable to related entities 7 - 9
1,300,949 1,839,5281,593,068
269
The accompanying Notes 1 to 37 form an integral part of these consolidated financial statements.
LATAM AIRLINES GROUP S.A. AND SUBSIDIARIES
CONSOLIDATED STATEMENT OF INCOME BY FUNCTION
0,25610
For the period ended
78,695(393,286)
(368,883)(7,754)
706,779
ThUS$
(7,441,849)
2,172,058
8,988,340(6,967,037)
2,021,303
538,748(747,426)(872,954)(373,738)
(72,634)
493,299
110,670
0.126650.12665
Revenue 26 9,613,907
Distribution costsOther income 28 549,889
(699,600)(938,931)
Gross margin
Cost of sales
Administrative expenses
Note 2017December 31,
2016
ThUS$
Financial income
Other gains/(losses)Other expenses
Income from operation activities
74,949
for using the equity method
Financial costs 27Share of profit of investments accounted
Result of indexation unitsForeign exchange gains/(losses) 29
- (18,718)
748
(416,336)
- 121,651
311
Income (loss) tax expense / benefit 18Income (loss) before taxes 374,218
(173,504)273,874
(163,204)
NET INCOME (LOSS) FOR THE PERIOD
of the parentIncome (loss) attributable to owners
200,714
155,304 69,220
110,670
non-controlling interest 14Income (loss) attributable to
45,410 41,450
Net income (loss) for the year
Diluted earnings (losses) per share (US$)Basic earnings (losses) per share (US$) 30
30
EARNINGS PER SHARE
200,714
0,25610
The accompanying Notes 1 to 37 form an integral part of these consolidated financial statements.

F I N A N C I A L S T AT E M E N T S 148Consolidated Financial Statements
LATAM AIRLINES GROUP S.A. AND SUBSIDIARIES
CONSOLIDATED STATEMENT OF COMPREHENSIVE INCOME
that will not be reclassified to income before taxes
-
-
that will be reclassified to income before taxes
-
-
584,873695,543
127,390
621,752
618,647
(34,695)
(1,770)Income taxes related to components of other
921
Income tax relating to other comprehensive income
NET INCOME (LOSS)Components of other comprehensive income
Currency translation differences
Other comprehensive income, before taxes,
on defined benefit plans 25Total other comprehensive income
that will not be reclassified to income before taxes
gains (losses) by new measurements
Note
Gains (losses) on currency translation, before tax 29
Components of other comprehensive income
2017
For the period endedDecember 31,
ThUS$2016
ThUS$200,714
(47,495)
110,670
(3,105)
(3,105)
494,362
2,763
2,763
(47,495) currency translation differences 494,362
127,390
(34,695)
that will be reclassified to income Income tax relating to other comprehensive income
Total other comprehensive income that will be reclassified to income before taxes (29,151)
Income tax relating to new measurements
Comprehensive income (loss) attributable to
(28,943)171,771
Total Other comprehensive income comprehensive incomethat will be reclassified to income
Total comprehensive income (loss)
Comprehensive income (loss) attributable to owners of the parent 128,876 648,539
47,004non-controlling interests 42,895171,771 695,543TOTAL COMPREHENSIVE INCOME (LOSS)
Other comprehensive income (losses), 18,344
Other components of other comprehensiveincome (loss), before taxes
before taxes, cash flow hedges
(26,388)
comprehensive income Income tax related to cash flow hedges in other
(1,770)
18,344 Gains (losses) on cash flow hedges before taxes 19
Other comprehensive income, before taxes,
on defined benefit plans 18 (785)
Cash flow hedges
that will not be reclassified to income
921to other comprehensive income
Accumulate income tax relating
that will not be reclassified to income (785)
The accompanying Notes 1 to 37 form an integral part of these consolidated financial statements.
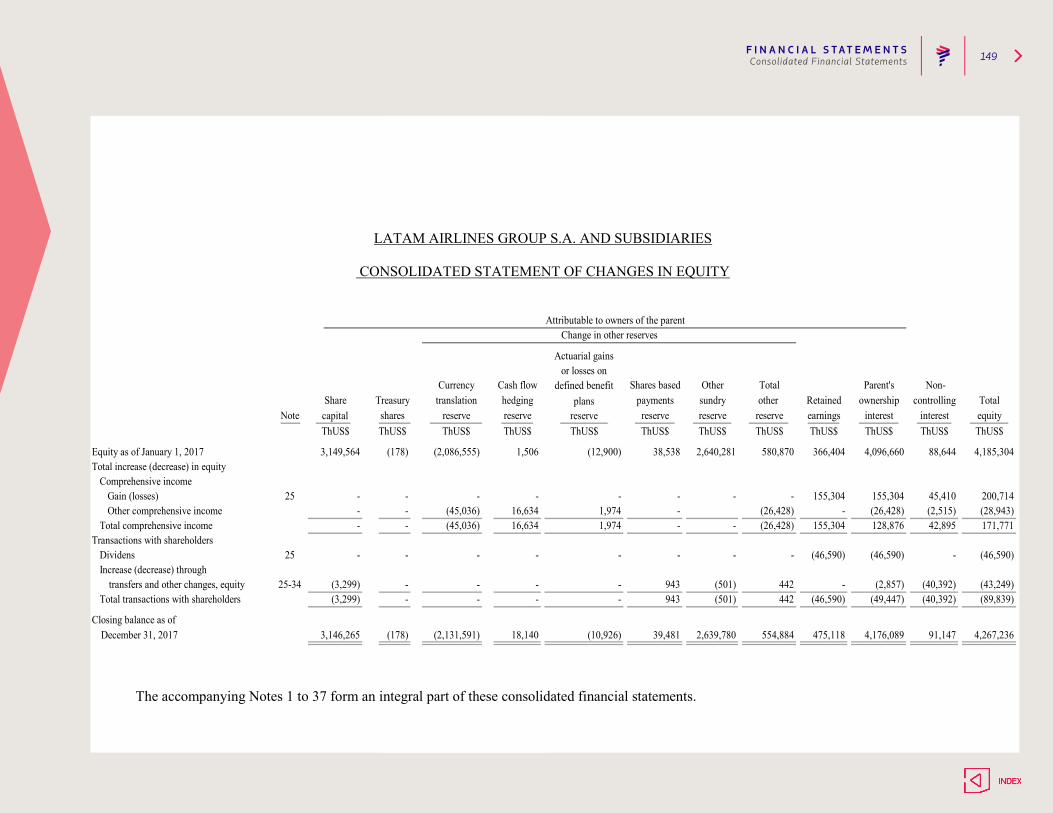
F I N A N C I A L S T AT E M E N T S 149Consolidated Financial Statements
LATAM AIRLINES GROUP S.A. AND SUBSIDIARIES
CONSOLIDATED STATEMENT OF CHANGES IN EQUITY
Actuarial gains
Change in other reserves
(49,447) (89,839)
42,895
(501)-
88,644
(26,428)155,304
Cash flow
ThUS$
128,876(26,428)
366,404
155,304-
reserveThUS$
2,640,281 580,870
-
ThUS$
(12,900)
-1,974
(2,086,555)
-
38,538
-
155,304
-(46,590)(46,590)-
(2,515)(26,428)45,410
Attributable to owners of the parent
Note capital reserveTreasury
shares interestownership
Parent'sTotalother
reserveShare hedging
Currency
transfers and other changes, equity
3,149,564
Total comprehensive income --
Transactions with shareholders
Gain (losses) 25 -
25Dividens
ThUS$
25-34
Equity as of January 1, 2017
Other comprehensive income
translation
16,6341,974
reserve
16,634(45,036)
Shares based
ThUS$reserve
payments
or losses ondefined benefit
plans
ThUS$
-
(3,299) - -
1,506
--(45,036)
(3,299)
(178)
-
December 31, 2017
Increase (decrease) through
Comprehensive income Total increase (decrease) in equity
-
3,146,265 (178)
-
--
Closing balance as of
Total transactions with shareholders
(2,131,591) 18,140 39,481
943943
--
2,639,780
--
-
--
(10,926)
-
442 (40,392)
- -
(40,392)
(46,590)
442 (2,857)-
-
(501)
554,884
ThUS$
4,185,3044,096,660
(46,590)
475,118 4,176,089 91,147 4,267,236
200,714(28,943)171,771
(43,249)
-
TotalequityThUS$
sundryreserveThUS$
Other
ThUS$earningsRetained
ThUS$ ThUS$
Non-controlling
interest
The accompanying Notes 1 to 37 form an integral part of these consolidated financial statements.
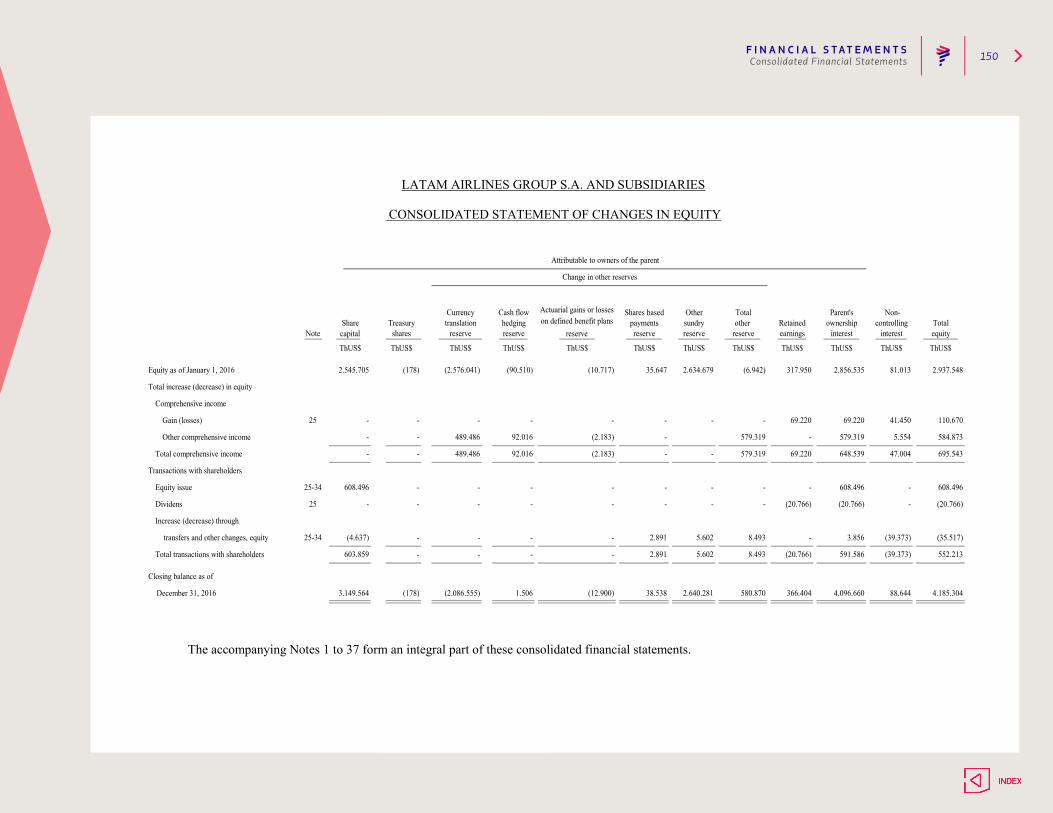
F I N A N C I A L S T AT E M E N T S 150
LATAM AIRLINES GROUP S.A. AND SUBSIDIARIES
CONSOLIDATED STATEMENT OF CHANGES IN EQUITY
Change in other reserves
591.586 552.213
47.004
5.602-
81.013
579.319
69.220
Cash flow
ThUS$
648.539579.319
41.450
317.950
69.220
-
reserve
ThUS$
2.634.679 (6.942)
-
ThUS$
(10.717)
-
(2.183)
(2.576.041)
-
35.647
-
69.220
-(20.766)(20.766)-
5.554579.319
Attributable to owners of the parent
Note capital reserveTreasuryshares interest
ownershipParent'sTotal
other reserve
Share hedgingCurrency
transfers and other changes, equity
2.545.705
Total comprehensive income -
-
Transactions with shareholders
Gain (losses) 25 -
25Dividens
ThUS$
25-34
Equity as of January 1, 2016
-
translation
92.016
(2.183)
Actuarial gains or losses on defined benefit plans
reserve
Shares based
ThUS$
reservepayments
ThUS$
-
(4.637) - -
(90.510)
-
-489.486
603.859
(178)
-
December 31, 2016
Increase (decrease) through
Comprehensive income
Total increase (decrease) in equity
-
3.149.564 (178)
-
-
-
Closing balance as of
Total transactions with shareholders
Other comprehensive income
Equity issue 25-34 608.496 -
(2.086.555) 1.506 38.538
2.891
2.891
-
-
92.016
5.602
2.640.281
--
-
-
-
(12.900)
489.486
8.493 (39.373)
- -
(39.373)
(20.766)
8.493 3.856-
-
580.870
ThUS$
2.937.5482.856.535
(20.766)
366.404 4.096.660 88.644 4.185.304
110.670
584.873
695.543
(35.517)
-
Totalequity
ThUS$
sundryreserve
ThUS$
Other
ThUS$
earningsRetained
ThUS$ ThUS$
Non-controlling
interest
608.496- - - - - - - 608.496 -
The accompanying Notes 1 to 37 form an integral part of these consolidated financial statements.
Consolidated Financial Statements

F I N A N C I A L S T AT E M E N T S 151Consolidated Financial Statements
LATAM AIRLINES GROUP S.A. AND SUBSIDIARIES
CONSOLIDATED STATEMENT OF CASH FLOWS DIRECT – METHOD
11,242
(59,556)(209,269)
980,884
Other cash inflows (outflows)
Payments for operating activitiesPayments to suppliers for goods and servicesPayments to and on behalf of employees
ThUS$
Proceeds from sales of goods and servicesOther cash receipts from operating activities
2016
ThUS$
Amounts raised from sale of intangible assets
Amounts raised from short-term loans
Purchases of intangible assetsInterest received
(87,318)
Net cash flows from operating activities
35
-
Amounts raised from sale of property, plant and equipmentor debt instruments of other entities
Cash flows from losses of control of subsidiaries or other businesses
(9,223)
Cash flows from operating activitiesCash collection from operating activities
Note
Payments of finance lease liabilities
Interest paid
Loans repayments
Net cash flow from (used in) investing activities
35Other cash inflows (outflows)
Amounts raised from issuance of sharesCash flows from (used in) financing activities
1,142,004
For the periods endedDecember 31,
2017
Income taxes refunded (paid)
(6,722,713)(1,955,310)
10,595,71873,668
9,918,58970,359
(6,756,121)(1,820,279)
(162,839)Other payments for operating activities
CASH AND CASH EQUIVALENTS AT END OF PERIOD 66CASH AND CASH EQUIVALENTS AT BEGINNING OF PERIOD
Net increase (decrease) in cash and cash equivalents
200,230(7,553)
13,706
192,677
949,327
(1,179,088)Net cash flows from (used in) financing activities
(229,163)
(396,279)
before effect of exchanges rate change Effects of variation in the exchange rate on cash and cash equivalents
Net increase (decrease) in cash and cash equivalents152,816
195,830949,327
(389,724)35
Amounts raised from long-term loans132,280
(1,829,191)(344,901)
35
1,305,384
(66,642)Dividends paid
Other cash inflows (outflows)
(287,422)
(8,931)
1,666,740
6,503Cash flows used in investing activities
-
Other cash receipts from sales of equity or debt instruments of other entities
Purchases of property, plant and equipment
Other payments to acquire equity
12,684
(223,706)(91,986)
(3,106,411)51,316
(403,666)
3,248,693
-
2,969,731
(2,706,733)76,084
(694,370)
753,497
608,4961,820,016
279,593(2,121,130)
(314,580)(41,223)
(398,288)
843
(431,789)
1(88,587)
43,014
The accompanying Notes 1 to 37 form an integral part of these consolidated financial statements.
1
LATAM AIRLINES GROUP S.A. AND SUBSIDIARIES
NOTES TO THE CONSOLIDATED FINANCIAL STATEMENTS
AS OF DECEMBER 31, 2017
NOTE 1 - GENERAL INFORMATION LATAM Airlines Group S.A. (the “Company”) is a public company registered with the Commission for the Financial Market (1), under No.306, whose shares are quoted in Chile on the Stock Brokers - Stock Exchange (Valparaíso) - the Chilean Electronic Stock Exchange and the Santiago Stock Exchange; it is also quoted in the United States of America on the New York Stock Exchange (“NYSE”) in New York in the form of American Depositary Receipts (“ADRs”).
Its principal business is passenger and cargo air transportation, both in the domestic markets of Chile, Peru, Argentina, Colombia, Ecuador and Brazil and in a developed series of regional and international routes in America, Europe and Oceania. These businesses are developed directly or by their subsidiaries in different countries. In addition, the Company has subsidiaries operating in the freight business in Mexico, Brazil and Colombia.
The Company is located in Santiago, Chile, at Avenida Américo Vespucio Sur No. 901, commune of Renca.
Corporate Governance practices of the Company are set in accordance with Securities Market Law the Corporations Law and its regulations, and the regulations of the Commission for the Financial Market (1) and the laws and regulations of the United States of America and the U.S. Securities and Exchange Commission (“SEC”) of that country, with respect to the issuance of ADRs (2).
At December 31, 2017, the Company's capital stock is represented by 608,374,525 shares, all common shares, without par value, which is divided into: (a) the 606,407,693 subscribed and paid shares; and (b) 1,966,832 shares pending of subscription and payment, of which: (i) 1,500,000 shares are allocated to compensation stock option plan; And (ii) 466,832 correspond to the balance of shares pending of placement of the last capital increase approved at the extraordinary meeting of shareholders of August 18, 2016.
(1) On February 23, 2017 the Law No. 21,000 was published in the Official Journal, creating the new Commission for the Financial Market (CMF), a collegiate and technical entity that replaced the Superintendency of Securities and Insurance (SVS).
(2) As reported in due course, during 2016, LATAM discontinued its Brazilian receipts program - BDR level III, currently LATAM not counting with securities in the Brazilian market.
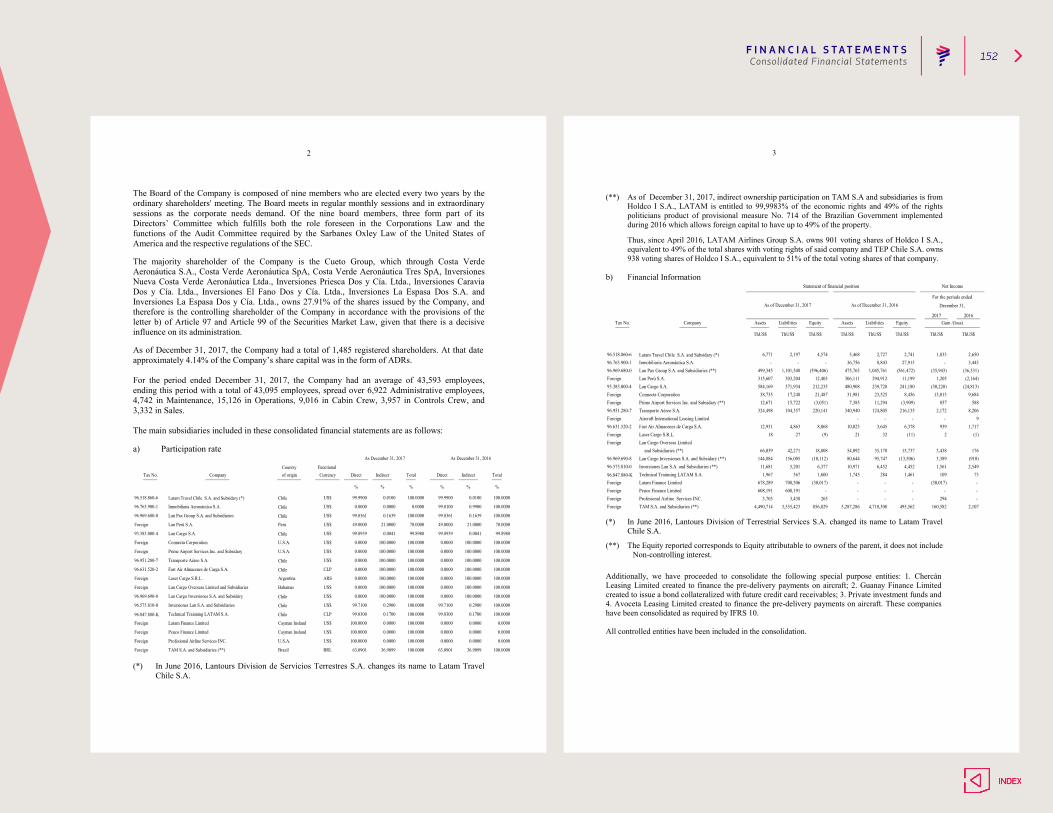
F I N A N C I A L S T AT E M E N T S 152Consolidated Financial Statements
2 The Board of the Company is composed of nine members who are elected every two years by the ordinary shareholders' meeting. The Board meets in regular monthly sessions and in extraordinary sessions as the corporate needs demand. Of the nine board members, three form part of its Directors’ Committee which fulfills both the role foreseen in the Corporations Law and the functions of the Audit Committee required by the Sarbanes Oxley Law of the United States of America and the respective regulations of the SEC.
The majority shareholder of the Company is the Cueto Group, which through Costa Verde Aeronáutica S.A., Costa Verde Aeronáutica SpA, Costa Verde Aeronáutica Tres SpA, Inversiones Nueva Costa Verde Aeronáutica Ltda., Inversiones Priesca Dos y Cía. Ltda., Inversiones Caravia Dos y Cía. Ltda., Inversiones El Fano Dos y Cía. Ltda., Inversiones La Espasa Dos S.A. and Inversiones La Espasa Dos y Cía. Ltda., owns 27.91% of the shares issued by the Company, and therefore is the controlling shareholder of the Company in accordance with the provisions of the letter b) of Article 97 and Article 99 of the Securities Market Law, given that there is a decisive influence on its administration.
As of December 31, 2017, the Company had a total of 1,485 registered shareholders. At that date approximately 4.14% of the Company’s share capital was in the form of ADRs. For the period ended December 31, 2017, the Company had an average of 43,593 employees, ending this period with a total of 43,095 employees, spread over 6,922 Administrative employees, 4,742 in Maintenance, 15,126 in Operations, 9,016 in Cabin Crew, 3,957 in Controls Crew, and 3,332 in Sales. The main subsidiaries included in these consolidated financial statements are as follows: a) Participation rate
Latam Travel Chile S.A. and Subsidary (*) Chile
Chile
Chile
Chile
Chile
Chile
Chile
Chile
96.847.880-K Chile
0.0000
Foreign Latam Finance Limited Cayman Insland US$ 100.0000 0.0000 100.0000 0.0000 0.0000 0.0000
100.0000
100.0000 100.0000
63.0901 36.9099 100.0000
0.0000
Foreign Peuco Finance Limited Cayman Insland US$ 100.0000 0.0000 100.0000 0.0000 0.0000 0.0000
Foreign Profesional Airline Services INC. U.S.A. US$ 0.0000
100.000063.0901 36.9099
Technical Trainning LATAM S.A.
As December 31, 2016
Direct Indirect Total
% % %
99.0100 0.9900 100.0000
99.8361 0.1639 100.0000
49.0000 21.0000 70.0000
99.8939 0.0041 99.8980
0.0000
Foreign TAM S.A. and Subsidiaries (**) Brazil BRL
99.7100 0.2900 100.0000 99.7100 0.2900 100.0000
99.8300 0.1700 100.0000
0.0000100.0000
CLP
96.969.690-8 Lan Cargo Inversiones S.A. and Subsidary US$
96.575.810-0 Inversiones Lan S.A. and Subsidiaries US$
0.0000 100.0000 100.0000
99.8300 0.1700 100.0000
0.0000 100.0000 100.0000
Foreign Lan Cargo Overseas Limited and Subsidiaries Bahamas US$
Foreign Laser Cargo S.R.L. Argentina ARS 0.0000 100.0000 100.0000
0.0000 100.0000 100.0000
0.0000 100.0000 100.0000
0.0000
96.631.520-2 Fast Air Almacenes de Carga S.A. CLP 0.0000 100.0000 100.00000.0000 100.0000 100.0000
0.0000 100.0000 100.0000
Prime Airport Services Inc. and Subsidary U.S.A. US$ 0.0000 100.0000 100.0000
100.0000 100.0000
0.0000 100.0000 100.0000
0.000096.951.280-7 Transporte Aéreo S.A. US$
Foreign
100.0000 100.0000
99.8939 0.0041 99.8980
Foreign Lan Perú S.A. Peru US$ 49.0000 21.0000 70.0000
Foreign Connecta Corporation U.S.A. US$
93.383.000-4 Lan Cargo S.A. US$
0.0000 100.0000 100.0000
96.969.680-0 Lan Pax Group S.A. and Subsidiaries US$
96.763.900-1 Inmobiliaria Aeronáutica S.A. US$ 0.0000 0.0000 0.0000
99.8361 0.1639 100.0000
US$ 99.9900 0.0100 100.000096.518.860-6 99.9900 0.0100 100.0000
% % %
CompanyTax No. of origin CurrencyCountry Functional
As December 31, 2017
Direct Indirect Total
(*) In June 2016, Lantours Division de Servicios Terrestres S.A. changes its name to Latam Travel Chile S.A.
3 (**) As of December 31, 2017, indirect ownership participation on TAM S.A and subsidiaries is from
Holdco I S.A., LATAM is entitled to 99,9983% of the economic rights and 49% of the rights politicians product of provisional measure No. 714 of the Brazilian Government implemented during 2016 which allows foreign capital to have up to 49% of the property.
Thus, since April 2016, LATAM Airlines Group S.A. owns 901 voting shares of Holdco I S.A., equivalent to 49% of the total shares with voting rights of said company and TEP Chile S.A. owns 938 voting shares of Holdco I S.A., equivalent to 51% of the total voting shares of that company.
b) Financial Information
Latam Travel Chile S.A. and Subsidary (*)
96.847.880-K
- 2,107
2016
ThUS$
2,6503,443
(36,331)(2,164)
(24,813)9,684
5888,206
91,717
(1)
176
Gain /(loss)
(910)2,549
939
- - - 5,287,286 4,710,308 495,562
54,092 35,178 15,73780,644 95,747 (13,506)
1,461
23,525
124,805 216,135
480,908 239,728 241,180
6,771 2,197 4,574
ThUS$ ThUS$ ThUS$
Foreign Lan Cargo Overseas Limited
8,06827 32 (11)
6,378Foreign Laser Cargo S.R.L. 18 2
96.951.280-7 Transporte Aéreo S.A. 324,498 104,357
21(9)96.631.520-2 Fast Air Almacenes de Carga S.A. 12,931 4,863
220,141Foreign Aircraft International Leasing Limited -
10,023 3,645
340,940 - - -
Foreign TAM S.A. and Subsidiaries (**) 4,490,714 3,555,423 856,829Foreign Profesional Airline Services INC. 3,703 3,438 265
160,582
and Subsidiaries (**) 66,039 42,271 18,808 3,43896.969.690-8 Lan Cargo Inversiones S.A. and Subsidary (**) 144,884 156,005 (10,112) 3,38996.575.810-0 Inversiones Lan S.A. and Subsidiaries (**) 11,681 5,201 6,377 1,56110,971 6,452 4,452
1,745 284
17,248 21,48793.383.000-4 Lan Cargo S.A. 584,169 371,934 212,235
Foreign Prime Airport Services Inc. and Subsidary (**) 12,671 15,722 (3,051)Foreign Connecta Corporation 38,735
Foreign Lan Perú S.A. 315,607 303,204 12,403 1,205306,111 294,912 11,19996.969.680-0 Lan Pax Group S.A. and Subsidiaries (**) 499,345 1,101,548 (596,406) (35,943)475,763 1,045,761 (561,472)96.763.900-1 Inmobiliaria Aeronáutica S.A. - - - - 96.518.860-6
8,843 27,9135,468 2,727 2,741
36,756
Tax No. Company Assets Liabilities Equity
1,833
ThUS$ThUS$
Statement of financial position Net Income
ThUS$
For the periods endedAs of December 31, 2017 December 31,As of December 31, 2016
Assets Liabilities Equity
31,981
2017
ThUS$
8572,172
294
109 73(30,017) - - - -
- -
13,013(30,220)
8,4567,385 11,294 (3,909)
Foreign Peuco Finance Limited 608,191 608,191 - - - -
Technical Trainning LATAM S.A. 1,967 367 1,600Foreign Latam Finance Limited 678,289 708,306 (30,017)
(*) In June 2016, Lantours Division of Terrestrial Services S.A. changed its name to Latam Travel Chile S.A.
(**) The Equity reported corresponds to Equity attributable to owners of the parent, it does not include Non-controlling interest.
Additionally, we have proceeded to consolidate the following special purpose entities: 1. Chercán Leasing Limited created to finance the pre-delivery payments on aircraft; 2. Guanay Finance Limited created to issue a bond collateralized with future credit card receivables; 3. Private investment funds and 4. Avoceta Leasing Limited created to finance the pre-delivery payments on aircraft. These companies have been consolidated as required by IFRS 10. All controlled entities have been included in the consolidation.
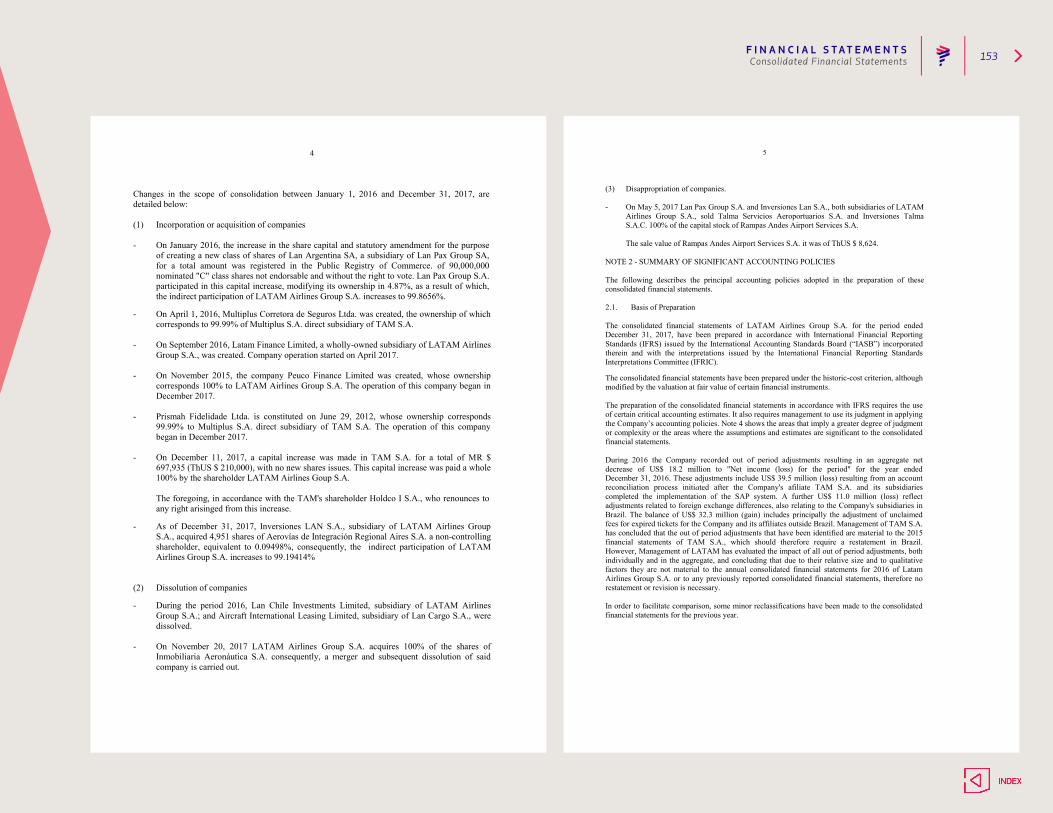
F I N A N C I A L S T AT E M E N T S 153Consolidated Financial Statements
4 Changes in the scope of consolidation between January 1, 2016 and December 31, 2017, are detailed below: (1) Incorporation or acquisition of companies - On January 2016, the increase in the share capital and statutory amendment for the purpose
of creating a new class of shares of Lan Argentina SA, a subsidiary of Lan Pax Group SA, for a total amount was registered in the Public Registry of Commerce. of 90,000,000 nominated "C" class shares not endorsable and without the right to vote. Lan Pax Group S.A. participated in this capital increase, modifying its ownership in 4.87%, as a result of which, the indirect participation of LATAM Airlines Group S.A. increases to 99.8656%.
- On April 1, 2016, Multiplus Corretora de Seguros Ltda. was created, the ownership of which
corresponds to 99.99% of Multiplus S.A. direct subsidiary of TAM S.A.
- On September 2016, Latam Finance Limited, a wholly-owned subsidiary of LATAM Airlines Group S.A., was created. Company operation started on April 2017.
- On November 2015, the company Peuco Finance Limited was created, whose ownership
corresponds 100% to LATAM Airlines Group S.A. The operation of this company began in December 2017.
- Prismah Fidelidade Ltda. is constituted on June 29, 2012, whose ownership corresponds
99.99% to Multiplus S.A. direct subsidiary of TAM S.A. The operation of this company began in December 2017.
- On December 11, 2017, a capital increase was made in TAM S.A. for a total of MR $
697,935 (ThUS $ 210,000), with no new shares issues. This capital increase was paid a whole 100% by the shareholder LATAM Airlines Goup S.A.
The foregoing, in accordance with the TAM's shareholder Holdco I S.A., who renounces to any right arisinged from this increase.
- As of December 31, 2017, Inversiones LAN S.A., subsidiary of LATAM Airlines Group
S.A., acquired 4,951 shares of Aerovías de Integración Regional Aires S.A. a non-controlling shareholder, equivalent to 0.09498%, consequently, the indirect participation of LATAM Airlines Group S.A. increases to 99.19414%
(2) Dissolution of companies
- During the period 2016, Lan Chile Investments Limited, subsidiary of LATAM Airlines Group S.A.; and Aircraft International Leasing Limited, subsidiary of Lan Cargo S.A., were dissolved.
- On November 20, 2017 LATAM Airlines Group S.A. acquires 100% of the shares of
Inmobiliaria Aeronáutica S.A. consequently, a merger and subsequent dissolution of said company is carried out.
5 (3) Disappropriation of companies. - On May 5, 2017 Lan Pax Group S.A. and Inversiones Lan S.A., both subsidiaries of LATAM
Airlines Group S.A., sold Talma Servicios Aeroportuarios S.A. and Inversiones Talma S.A.C. 100% of the capital stock of Rampas Andes Airport Services S.A.
The sale value of Rampas Andes Airport Services S.A. it was of ThUS $ 8,624.
NOTE 2 - SUMMARY OF SIGNIFICANT ACCOUNTING POLICIES The following describes the principal accounting policies adopted in the preparation of these consolidated financial statements. 2.1. Basis of Preparation The consolidated financial statements of LATAM Airlines Group S.A. for the period ended December 31, 2017, have been prepared in accordance with International Financial Reporting Standards (IFRS) issued by the International Accounting Standards Board (“IASB”) incorporated therein and with the interpretations issued by the International Financial Reporting Standards Interpretations Committee (IFRIC). The consolidated financial statements have been prepared under the historic-cost criterion, although modified by the valuation at fair value of certain financial instruments. The preparation of the consolidated financial statements in accordance with IFRS requires the use of certain critical accounting estimates. It also requires management to use its judgment in applying the Company’s accounting policies. Note 4 shows the areas that imply a greater degree of judgment or complexity or the areas where the assumptions and estimates are significant to the consolidated financial statements. During 2016 the Company recorded out of period adjustments resulting in an aggregate net decrease of US$ 18.2 million to "Net income (loss) for the period" for the year ended December 31, 2016. These adjustments include US$ 39.5 million (loss) resulting from an account reconciliation process initiated after the Company's afiliate TAM S.A. and its subsidiaries completed the implementation of the SAP system. A further US$ 11.0 million (loss) reflect adjustments related to foreign exchange differences, also relating to the Company's subsidiaries in Brazil. The balance of US$ 32.3 million (gain) includes principally the adjustment of unclaimed fees for expired tickets for the Company and its affiliates outside Brazil. Management of TAM S.A. has concluded that the out of period adjustments that have been identified are material to the 2015 financial statements of TAM S.A., which should therefore require a restatement in Brazil. However, Management of LATAM has evaluated the impact of all out of period adjustments, both individually and in the aggregate, and concluding that due to their relative size and to qualitative factors they are not material to the annual consolidated financial statements for 2016 of Latam Airlines Group S.A. or to any previously reported consolidated financial statements, therefore no restatement or revision is necessary. In order to facilitate comparison, some minor reclassifications have been made to the consolidated financial statements for the previous year.
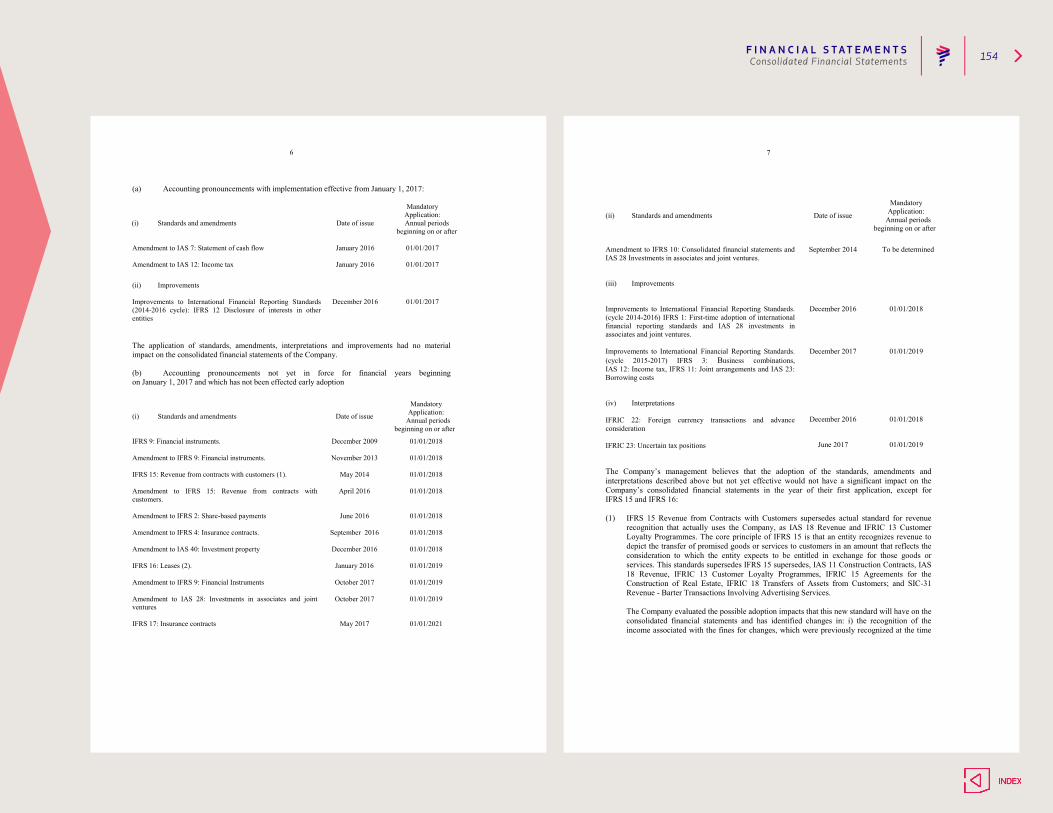
F I N A N C I A L S T AT E M E N T S 154Consolidated Financial Statements
6 (a) Accounting pronouncements with implementation effective from January 1, 2017:
(i) Standards and amendments
Date of issue
Mandatory Application: Annual periods
beginning on or after Amendment to IAS 7: Statement of cash flow
January 2016
01/01/2017
Amendment to IAS 12: Income tax
January 2016
01/01/2017
(ii) Improvements
Improvements to International Financial Reporting Standards (2014-2016 cycle): IFRS 12 Disclosure of interests in other entities
December 2016
01/01/2017
The application of standards, amendments, interpretations and improvements had no material impact on the consolidated financial statements of the Company. (b) Accounting pronouncements not yet in force for financial years beginning on January 1, 2017 and which has not been effected early adoption (i) Standards and amendments
Date of issue
Mandatory Application:
Annual periods beginning on or after
IFRS 9: Financial instruments. Amendment to IFRS 9: Financial instruments. IFRS 15: Revenue from contracts with customers (1). Amendment to IFRS 15: Revenue from contracts with customers. Amendment to IFRS 2: Share-based payments Amendment to IFRS 4: Insurance contracts. Amendment to IAS 40: Investment property IFRS 16: Leases (2). Amendment to IFRS 9: Financial Instruments Amendment to IAS 28: Investments in associates and joint ventures IFRS 17: Insurance contracts
December 2009
November 2013
May 2014
April 2016
June 2016
September 2016
December 2016
January 2016
October 2017
October 2017
May 2017
01/01/2018
01/01/2018
01/01/2018
01/01/2018
01/01/2018
01/01/2018
01/01/2018
01/01/2019
01/01/2019
01/01/2019
01/01/2021
7 (ii) Standards and amendments
Date of issue
Mandatory Application:
Annual periods beginning on or after
Amendment to IFRS 10: Consolidated financial statements and IAS 28 Investments in associates and joint ventures.
September 2014 To be determined
(iii) Improvements
Improvements to International Financial Reporting Standards. (cycle 2014-2016) IFRS 1: First-time adoption of international financial reporting standards and IAS 28 investments in associates and joint ventures. Improvements to International Financial Reporting Standards. (cycle 2015-2017) IFRS 3: Business combinations, IAS 12: Income tax, IFRS 11: Joint arrangements and IAS 23: Borrowing costs (iv) Interpretations
IFRIC 22: Foreign currency transactions and advance consideration IFRIC 23: Uncertain tax positions
December 2016
December 2017
December 2016
June 2017
01/01/2018
01/01/2019
01/01/2018
01/01/2019
The Company’s management believes that the adoption of the standards, amendments and interpretations described above but not yet effective would not have a significant impact on the Company’s consolidated financial statements in the year of their first application, except for IFRS 15 and IFRS 16: (1) IFRS 15 Revenue from Contracts with Customers supersedes actual standard for revenue
recognition that actually uses the Company, as IAS 18 Revenue and IFRIC 13 Customer Loyalty Programmes. The core principle of IFRS 15 is that an entity recognizes revenue to depict the transfer of promised goods or services to customers in an amount that reflects the consideration to which the entity expects to be entitled in exchange for those goods or services. This standards supersedes IFRS 15 supersedes, IAS 11 Construction Contracts, IAS 18 Revenue, IFRIC 13 Customer Loyalty Programmes, IFRIC 15 Agreements for the Construction of Real Estate, IFRIC 18 Transfers of Assets from Customers; and SIC-31 Revenue - Barter Transactions Involving Advertising Services. The Company evaluated the possible adoption impacts that this new standard will have on the consolidated financial statements and has identified changes in: i) the recognition of the income associated with the fines for changes, which were previously recognized at the time
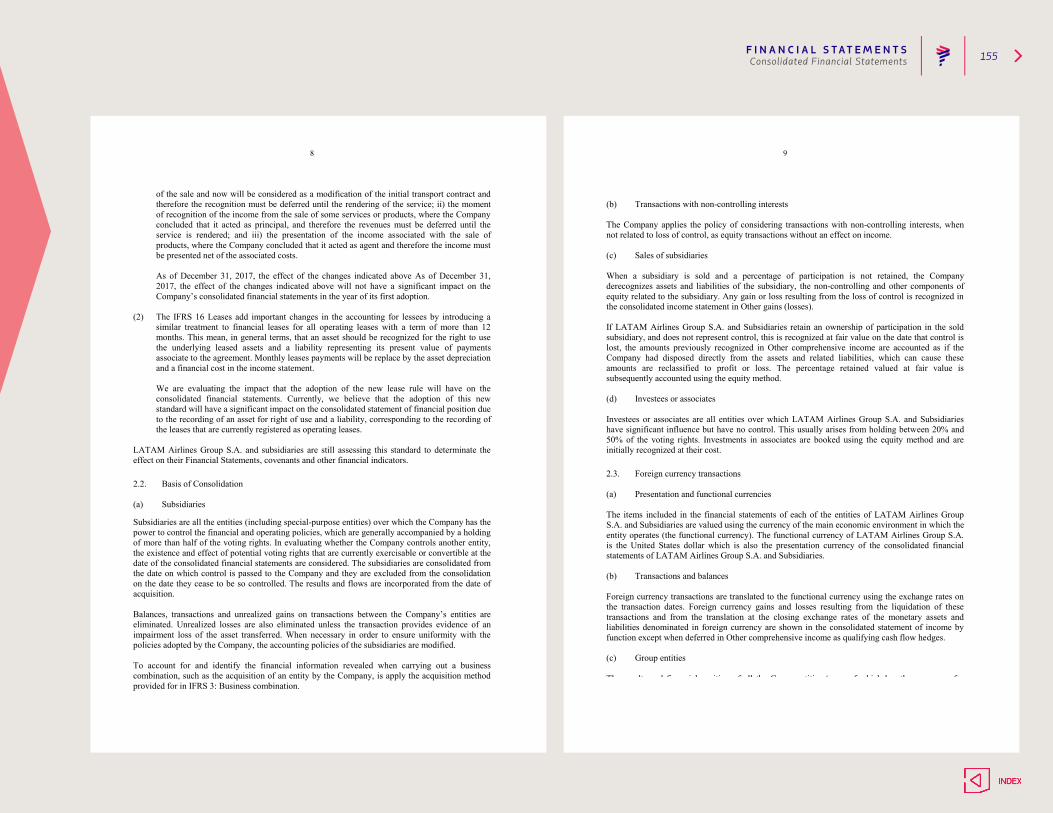
F I N A N C I A L S T AT E M E N T S 155Consolidated Financial Statements
8
of the sale and now will be considered as a modification of the initial transport contract and therefore the recognition must be deferred until the rendering of the service; ii) the moment of recognition of the income from the sale of some services or products, where the Company concluded that it acted as principal, and therefore the revenues must be deferred until the service is rendered; and iii) the presentation of the income associated with the sale of products, where the Company concluded that it acted as agent and therefore the income must be presented net of the associated costs. As of December 31, 2017, the effect of the changes indicated above As of December 31, 2017, the effect of the changes indicated above will not have a significant impact on the Company’s consolidated financial statements in the year of its first adoption.
(2) The IFRS 16 Leases add important changes in the accounting for lessees by introducing a similar treatment to financial leases for all operating leases with a term of more than 12 months. This mean, in general terms, that an asset should be recognized for the right to use the underlying leased assets and a liability representing its present value of payments associate to the agreement. Monthly leases payments will be replace by the asset depreciation and a financial cost in the income statement.
We are evaluating the impact that the adoption of the new lease rule will have on the
consolidated financial statements. Currently, we believe that the adoption of this new standard will have a significant impact on the consolidated statement of financial position due to the recording of an asset for right of use and a liability, corresponding to the recording of the leases that are currently registered as operating leases.
LATAM Airlines Group S.A. and subsidiaries are still assessing this standard to determinate the effect on their Financial Statements, covenants and other financial indicators. 2.2. Basis of Consolidation (a) Subsidiaries Subsidiaries are all the entities (including special-purpose entities) over which the Company has the power to control the financial and operating policies, which are generally accompanied by a holding of more than half of the voting rights. In evaluating whether the Company controls another entity, the existence and effect of potential voting rights that are currently exercisable or convertible at the date of the consolidated financial statements are considered. The subsidiaries are consolidated from the date on which control is passed to the Company and they are excluded from the consolidation on the date they cease to be so controlled. The results and flows are incorporated from the date of acquisition. Balances, transactions and unrealized gains on transactions between the Company’s entities are eliminated. Unrealized losses are also eliminated unless the transaction provides evidence of an impairment loss of the asset transferred. When necessary in order to ensure uniformity with the policies adopted by the Company, the accounting policies of the subsidiaries are modified. To account for and identify the financial information revealed when carrying out a business combination, such as the acquisition of an entity by the Company, is apply the acquisition method provided for in IFRS 3: Business combination.
9 (b) Transactions with non-controlling interests The Company applies the policy of considering transactions with non-controlling interests, when not related to loss of control, as equity transactions without an effect on income. (c) Sales of subsidiaries When a subsidiary is sold and a percentage of participation is not retained, the Company derecognizes assets and liabilities of the subsidiary, the non-controlling and other components of equity related to the subsidiary. Any gain or loss resulting from the loss of control is recognized in the consolidated income statement in Other gains (losses). If LATAM Airlines Group S.A. and Subsidiaries retain an ownership of participation in the sold subsidiary, and does not represent control, this is recognized at fair value on the date that control is lost, the amounts previously recognized in Other comprehensive income are accounted as if the Company had disposed directly from the assets and related liabilities, which can cause these amounts are reclassified to profit or loss. The percentage retained valued at fair value is subsequently accounted using the equity method. (d) Investees or associates Investees or associates are all entities over which LATAM Airlines Group S.A. and Subsidiaries have significant influence but have no control. This usually arises from holding between 20% and 50% of the voting rights. Investments in associates are booked using the equity method and are initially recognized at their cost. 2.3. Foreign currency transactions (a) Presentation and functional currencies The items included in the financial statements of each of the entities of LATAM Airlines Group S.A. and Subsidiaries are valued using the currency of the main economic environment in which the entity operates (the functional currency). The functional currency of LATAM Airlines Group S.A. is the United States dollar which is also the presentation currency of the consolidated financial statements of LATAM Airlines Group S.A. and Subsidiaries. (b) Transactions and balances Foreign currency transactions are translated to the functional currency using the exchange rates on the transaction dates. Foreign currency gains and losses resulting from the liquidation of these transactions and from the translation at the closing exchange rates of the monetary assets and liabilities denominated in foreign currency are shown in the consolidated statement of income by function except when deferred in Other comprehensive income as qualifying cash flow hedges. (c) Group entities The results and financial position of all the Group entities (none of which has the currency of a
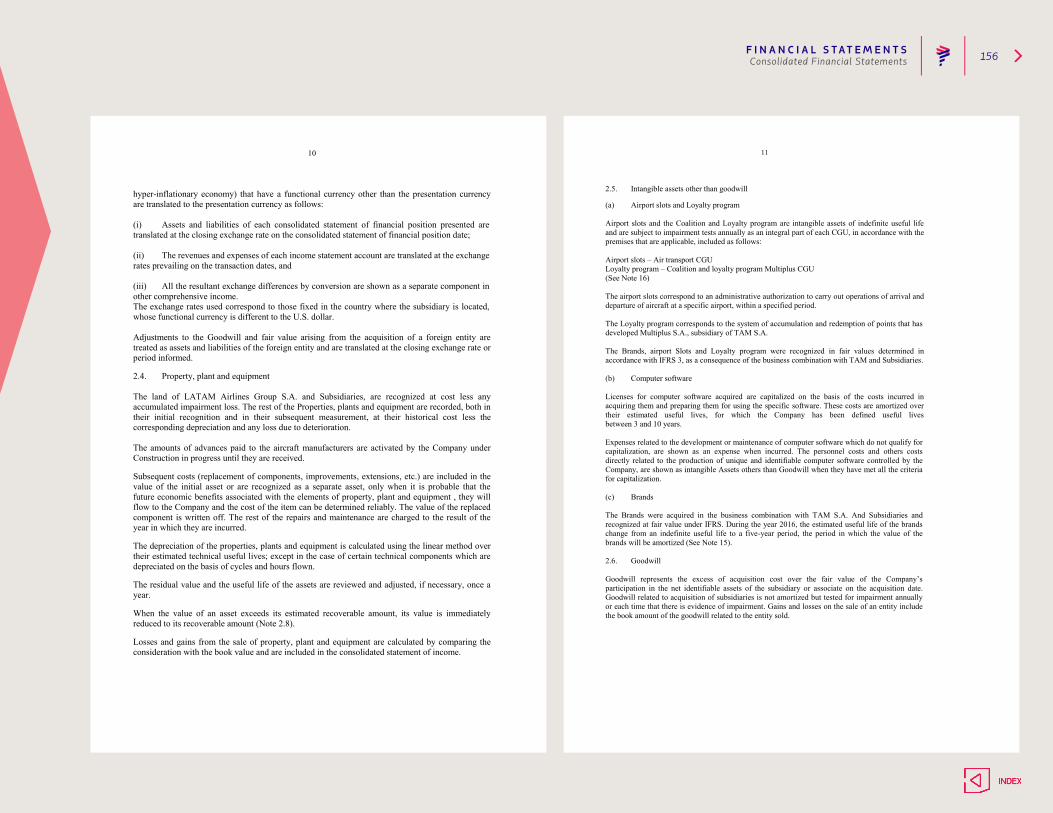
F I N A N C I A L S T AT E M E N T S 156Consolidated Financial Statements
10 hyper-inflationary economy) that have a functional currency other than the presentation currency are translated to the presentation currency as follows: (i) Assets and liabilities of each consolidated statement of financial position presented are translated at the closing exchange rate on the consolidated statement of financial position date; (ii) The revenues and expenses of each income statement account are translated at the exchange rates prevailing on the transaction dates, and (iii) All the resultant exchange differences by conversion are shown as a separate component in other comprehensive income. The exchange rates used correspond to those fixed in the country where the subsidiary is located, whose functional currency is different to the U.S. dollar. Adjustments to the Goodwill and fair value arising from the acquisition of a foreign entity are treated as assets and liabilities of the foreign entity and are translated at the closing exchange rate or period informed.
2.4. Property, plant and equipment The land of LATAM Airlines Group S.A. and Subsidiaries, are recognized at cost less any accumulated impairment loss. The rest of the Properties, plants and equipment are recorded, both in their initial recognition and in their subsequent measurement, at their historical cost less the corresponding depreciation and any loss due to deterioration. The amounts of advances paid to the aircraft manufacturers are activated by the Company under Construction in progress until they are received.
Subsequent costs (replacement of components, improvements, extensions, etc.) are included in the value of the initial asset or are recognized as a separate asset, only when it is probable that the future economic benefits associated with the elements of property, plant and equipment , they will flow to the Company and the cost of the item can be determined reliably. The value of the replaced component is written off. The rest of the repairs and maintenance are charged to the result of the year in which they are incurred.
The depreciation of the properties, plants and equipment is calculated using the linear method over their estimated technical useful lives; except in the case of certain technical components which are depreciated on the basis of cycles and hours flown.
The residual value and the useful life of the assets are reviewed and adjusted, if necessary, once a year.
When the value of an asset exceeds its estimated recoverable amount, its value is immediately reduced to its recoverable amount (Note 2.8).
Losses and gains from the sale of property, plant and equipment are calculated by comparing the consideration with the book value and are included in the consolidated statement of income.
11 2.5. Intangible assets other than goodwill
(a) Airport slots and Loyalty program Airport slots and the Coalition and Loyalty program are intangible assets of indefinite useful life and are subject to impairment tests annually as an integral part of each CGU, in accordance with the premises that are applicable, included as follows: Airport slots – Air transport CGU Loyalty program – Coalition and loyalty program Multiplus CGU (See Note 16) The airport slots correspond to an administrative authorization to carry out operations of arrival and departure of aircraft at a specific airport, within a specified period. The Loyalty program corresponds to the system of accumulation and redemption of points that has developed Multiplus S.A., subsidiary of TAM S.A. The Brands, airport Slots and Loyalty program were recognized in fair values determined in accordance with IFRS 3, as a consequence of the business combination with TAM and Subsidiaries. (b) Computer software Licenses for computer software acquired are capitalized on the basis of the costs incurred in acquiring them and preparing them for using the specific software. These costs are amortized over their estimated useful lives, for which the Company has been defined useful lives between 3 and 10 years. Expenses related to the development or maintenance of computer software which do not qualify for capitalization, are shown as an expense when incurred. The personnel costs and others costs directly related to the production of unique and identifiable computer software controlled by the Company, are shown as intangible Assets others than Goodwill when they have met all the criteria for capitalization. (c) Brands The Brands were acquired in the business combination with TAM S.A. And Subsidiaries and recognized at fair value under IFRS. During the year 2016, the estimated useful life of the brands change from an indefinite useful life to a five-year period, the period in which the value of the brands will be amortized (See Note 15). 2.6. Goodwill Goodwill represents the excess of acquisition cost over the fair value of the Company’s participation in the net identifiable assets of the subsidiary or associate on the acquisition date. Goodwill related to acquisition of subsidiaries is not amortized but tested for impairment annually or each time that there is evidence of impairment. Gains and losses on the sale of an entity include the book amount of the goodwill related to the entity sold.
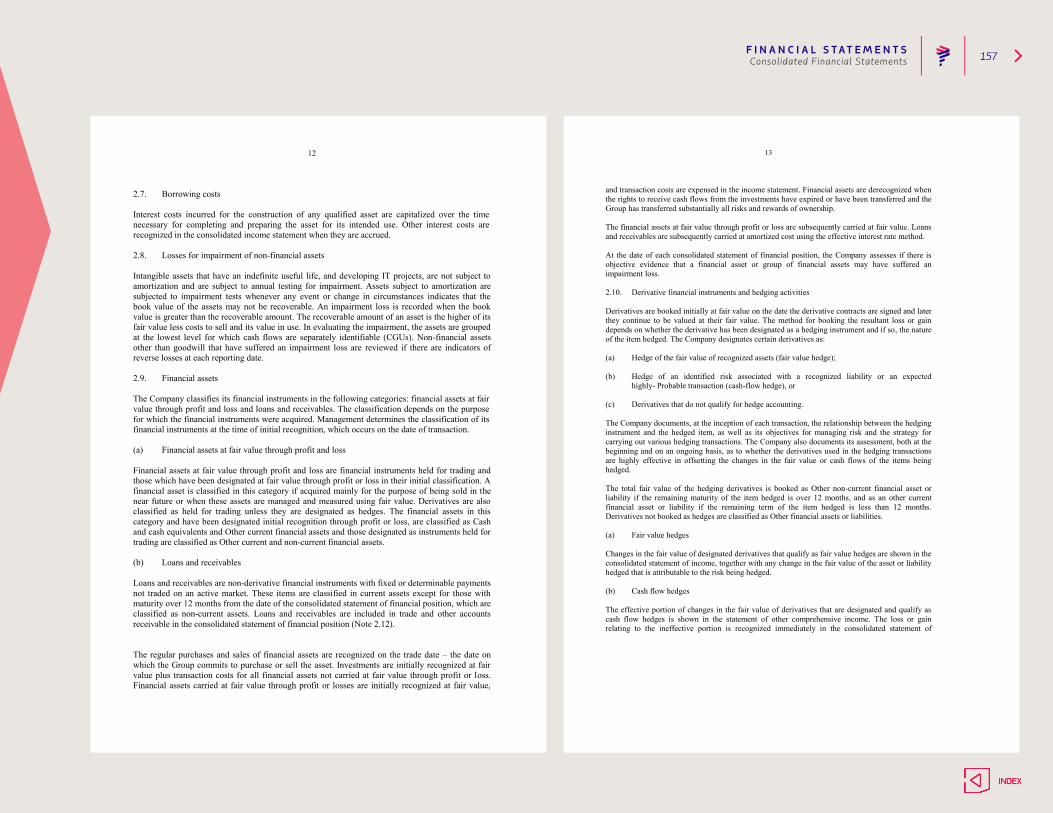
F I N A N C I A L S T AT E M E N T S 157Consolidated Financial Statements
12 2.7. Borrowing costs Interest costs incurred for the construction of any qualified asset are capitalized over the time necessary for completing and preparing the asset for its intended use. Other interest costs are recognized in the consolidated income statement when they are accrued. 2.8. Losses for impairment of non-financial assets Intangible assets that have an indefinite useful life, and developing IT projects, are not subject to amortization and are subject to annual testing for impairment. Assets subject to amortization are subjected to impairment tests whenever any event or change in circumstances indicates that the book value of the assets may not be recoverable. An impairment loss is recorded when the book value is greater than the recoverable amount. The recoverable amount of an asset is the higher of its fair value less costs to sell and its value in use. In evaluating the impairment, the assets are grouped at the lowest level for which cash flows are separately identifiable (CGUs). Non-financial assets other than goodwill that have suffered an impairment loss are reviewed if there are indicators of reverse losses at each reporting date. 2.9. Financial assets The Company classifies its financial instruments in the following categories: financial assets at fair value through profit and loss and loans and receivables. The classification depends on the purpose for which the financial instruments were acquired. Management determines the classification of its financial instruments at the time of initial recognition, which occurs on the date of transaction. (a) Financial assets at fair value through profit and loss Financial assets at fair value through profit and loss are financial instruments held for trading and those which have been designated at fair value through profit or loss in their initial classification. A financial asset is classified in this category if acquired mainly for the purpose of being sold in the near future or when these assets are managed and measured using fair value. Derivatives are also classified as held for trading unless they are designated as hedges. The financial assets in this category and have been designated initial recognition through profit or loss, are classified as Cash and cash equivalents and Other current financial assets and those designated as instruments held for trading are classified as Other current and non-current financial assets. (b) Loans and receivables Loans and receivables are non-derivative financial instruments with fixed or determinable payments not traded on an active market. These items are classified in current assets except for those with maturity over 12 months from the date of the consolidated statement of financial position, which are classified as non-current assets. Loans and receivables are included in trade and other accounts receivable in the consolidated statement of financial position (Note 2.12). The regular purchases and sales of financial assets are recognized on the trade date – the date on which the Group commits to purchase or sell the asset. Investments are initially recognized at fair value plus transaction costs for all financial assets not carried at fair value through profit or loss. Financial assets carried at fair value through profit or losses are initially recognized at fair value,
13 and transaction costs are expensed in the income statement. Financial assets are derecognized when the rights to receive cash flows from the investments have expired or have been transferred and the Group has transferred substantially all risks and rewards of ownership. The financial assets at fair value through profit or loss are subsequently carried at fair value. Loans and receivables are subsequently carried at amortized cost using the effective interest rate method. At the date of each consolidated statement of financial position, the Company assesses if there is objective evidence that a financial asset or group of financial assets may have suffered an impairment loss. 2.10. Derivative financial instruments and hedging activities Derivatives are booked initially at fair value on the date the derivative contracts are signed and later they continue to be valued at their fair value. The method for booking the resultant loss or gain depends on whether the derivative has been designated as a hedging instrument and if so, the nature of the item hedged. The Company designates certain derivatives as: (a) Hedge of the fair value of recognized assets (fair value hedge); (b) Hedge of an identified risk associated with a recognized liability or an expected
highly- Probable transaction (cash-flow hedge), or (c) Derivatives that do not qualify for hedge accounting. The Company documents, at the inception of each transaction, the relationship between the hedging instrument and the hedged item, as well as its objectives for managing risk and the strategy for carrying out various hedging transactions. The Company also documents its assessment, both at the beginning and on an ongoing basis, as to whether the derivatives used in the hedging transactions are highly effective in offsetting the changes in the fair value or cash flows of the items being hedged. The total fair value of the hedging derivatives is booked as Other non-current financial asset or liability if the remaining maturity of the item hedged is over 12 months, and as an other current financial asset or liability if the remaining term of the item hedged is less than 12 months. Derivatives not booked as hedges are classified as Other financial assets or liabilities. (a) Fair value hedges Changes in the fair value of designated derivatives that qualify as fair value hedges are shown in the consolidated statement of income, together with any change in the fair value of the asset or liability hedged that is attributable to the risk being hedged. (b) Cash flow hedges The effective portion of changes in the fair value of derivatives that are designated and qualify as cash flow hedges is shown in the statement of other comprehensive income. The loss or gain relating to the ineffective portion is recognized immediately in the consolidated statement of
F I N A N C I A L S T AT E M E N T S 158Consolidated Financial Statements
14 income under other gains (losses). Amounts accumulated in equity are reclassified to profit or loss in the periods when the hedged item affects profit or loss. In case of variable interest-rate hedges, the amounts recognized in the statement of other comprehensive income are reclassified to results within financial costs at the same time the associated debts accrue interest. For fuel price hedges, the amounts shown in the statement of other comprehensive income are reclassified to results under the line item Cost of sales to the extent that the fuel subject to the hedge is used. For foreign currency hedges, the amounts recognized in the statement of other comprehensive income are reclassified to income as deferred revenue resulting from the use of points, are recognized as Income. When hedging instruments mature or are sold or when they do not meet the requirements to be accounted for as hedges, any gain or loss accumulated in the statement of Other comprehensive income until that moment remains in the statement of other comprehensive income and is reclassified to the consolidated statement of income when the hedged transaction is finally recognized. When it is expected that the hedged transaction is no longer going to occur, the gain or loss accumulated in the statement of other comprehensive income is taken immediately to the consolidated statement of income as “Other gains (losses)”. (c) Derivatives not booked as a hedge The changes in fair value of any derivative instrument that is not booked as a hedge are shown immediately in the consolidated statement of income in “Other gains (losses)”. 2.11. Inventories Inventories, detailed in Note 10, are shown at the lower of cost and their net realizable value. The cost is determined on the basis of the weighted average cost method (WAC). The net realizable value is the estimated selling price in the normal course of business, less estimated costs necessary to make the sale. 2.12. Trade and other accounts receivable Trade accounts receivable are shown initially at their fair value and later at their amortized cost in accordance with the effective interest rate method, less the allowance for impairment losses. An allowance for impairment loss of trade accounts receivable is made when there is objective evidence that the Company will not be able to recover all the amounts due according to the original terms of the accounts receivable. The existence of significant financial difficulties on the part of the debtor, the probability that the debtor is entering bankruptcy or financial reorganization and the default or delay in making payments are considered indicators that the receivable has been impaired. The amount of the provision is the difference between the book value of the assets and the present value of the estimated future cash flows, discounted at the original effective interest rate. The book value of the asset is reduced by the amount of the allowance and the loss is shown in the consolidated statement
15 of income in Cost of sales. When an account receivable is written off, it is charged to the allowance account for accounts receivable. 2.13. Cash and cash equivalents Cash and cash equivalents include cash and bank balances, time deposits in financial institutions, and other short-term and highly liquid investments. 2.14. Capital The common shares are classified as net equity. Incremental costs directly attributable to the issuance of new shares or options are shown in net equity as a deduction from the proceeds received from the placement of shares. 2.15. Trade and other accounts payables Trade payables and other accounts payable are initially recognized at fair value and subsequently at amortized cost. 2.16. Interest-bearing loans Financial liabilities are shown initially at their fair value, net of the costs incurred in the transaction. Later, these financial liabilities are valued at their amortized cost; any difference between the proceeds obtained (net of the necessary arrangement| costs) and the repayment value, is shown in the consolidated statement of income during the term of the debt, according to the effective interest rate method. Financial liabilities are classified in current and non-current liabilities according to the contractual payment dates of the nominal principal. 2.17. Current and deferred taxes The expense by current tax is comprised of income and deferred taxes. The charge for current tax is calculated based on tax laws in force on the date of statement of financial position, in the countries in which the subsidiaries and associates operate and generate taxable income. Deferred taxes are calculated using the liability method, on the temporary differences arising between the tax bases of assets and liabilities and their book values. However, if the temporary differences arise from the initial recognition of a liability or an asset in a transaction different from a business combination that at the time of the transaction does not affect the accounting result or the tax gain or loss, they are not booked. The deferred tax is determined using the tax rates (and laws) that have been enacted or substantially enacted at the consolidated financial statements close, and are expected to apply when the related deferred tax asset is realized or the deferred tax liability discharged.
F I N A N C I A L S T AT E M E N T S 159Consolidated Financial Statements
16 Deferred tax assets are recognized when it is probable that there will be sufficient future tax earnings with which to compensate the temporary differences. The tax (current and deferred) is recognized in income by function, unless it relates to an item recognized in other comprehensive income, directly in equity or from business combination. In that case the tax is also recognized in other comprehensive income, directly in income by function or goodwill, respectively. 2.18. Employee benefits (a) Personnel vacations The Company recognizes the expense for personnel vacations on an accrual basis. (b) Share-based compensation The compensation plans implemented based on the shares of the Company are recognized in the consolidated financial statements in accordance with IFRS 2: Share-based payments, for plans based on the granting of options, the effect of fair value is recorded in equity with a charge to remuneration in a linear manner between the date of grant of said options and the date on which they become irrevocable, for the plans considered as cash settled award the fair value, updated as of the closing date of each reporting period, is recorded as a liability with charge to remuneration. (c) Post-employment and other long-term benefits Provisions are made for these obligations by applying the method of the projected unit credit method, and taking into account estimates of future permanence, mortality rates and future wage increases determined on the basis of actuarial calculations. The discount rates are determined by reference to market interest-rate curves. Actuarial gains or losses are shown in other comprehensive income. (d) Incentives The Company has an annual incentives plan for its personnel for compliance with objectives and individual contribution to the results. The incentives eventually granted consist of a given number or portion of monthly remuneration and the provision is made on the basis of the amount estimated for distribution. 2.19. Provisions Provisions are recognized when: (i) The Company has a present legal or implicit obligation as a result of past events;
(ii) It is probable that payment is going to be necessary to settle an obligation; and
(iii) The amount has been reliably estimated.
17 2.20. Revenue recognition Revenues include the fair value of the proceeds received or to be received on sales of goods and rendering services in the ordinary course of the Company’s business. Revenues are shown net of refunds, rebates and discounts. (a) Rendering of services (i) Passenger and cargo transport The Company shows revenue from the transportation of passengers and cargo once the service has been provided.
Consistent with the foregoing, the Company presents the deferred revenues, generated by anticipated sale of flight tickets and freight services, in heading other non - financial liabilities in the Consolidated Statement of Financial Position. (ii) Frequent flyer program The Company currently has a frequent flyer programs, whose objective is customer loyalty through the delivery of kilometers or points fly whenever the programs holders make certain flights, use the services of entities registered with the program or make purchases with an associated credit card. The kilometers or points earned can be exchanged for flight tickets or other services of associated entities. The consolidated financial statements include liabilities for this concept (deferred income), according to the estimate of the valuation established for the kilometers or points accumulated pending use at that date, in accordance with IFRIC 13: Customer loyalty programs. (iii) Other revenues The Company records revenues for other services when these have been provided. (b) Dividend income Dividend income is booked when the right to receive the payment is established. 2.21. Leases (a) When the Company is the lessee – financial lease The Company leases certain Property, plant and equipment in which it has substantially all the risk and benefits deriving from the ownership; they are therefore classified as financial leases. Financial leases are initially recorded at the lower of the fair value of the asset leased and the present value of the minimum lease payments. Every lease payment is separated between the liability component and the financial expenses so as to obtain a constant interest rate over the outstanding amount of the debt. The corresponding leasing obligations, net of financial charges, are included in other financial liabilities. The element
F I N A N C I A L S T AT E M E N T S 160Consolidated Financial Statements
18 of interest in the financial cost is charged to the consolidated statement of income over the lease period so that it produces a constant periodic rate of interest on the remaining balance of the liability for each year. The asset acquired under a financial lease is depreciated over its useful life and is included in Property, plant and equipment. (b) When the Company is the lessee – operating lease Leases, in which the lessor retains an important part of the risks and benefits deriving from ownership, are classified as operating leases. Payments with respect to operating leases (net of any incentive received from the lessor) are charged in the consolidated statement of income on a straight-line basis over the term of the lease. 2.22. Non-current assets or disposal groups classified as held for sale Non-current assets (or disposal groups) classified as assets held for sale are shown at the lesser of their book value and the fair value less costs to sell. 2.23. Maintenance The costs incurred for scheduled heavy maintenance of the aircraft’s fuselage and engines are capitalized and depreciated until the next maintenance. The depreciation rate is determined on technical grounds, according to the use of the aircraft expressed in terms of cycles and flight hours. In case of own aircraft or under financial leases, these maintenance cost are capitalized as Property, plant and equipment, while in the case of aircraft under operating leases, a liability is accrued based on the use of the main components is recognized, since a contractual obligation with the lessor to return the aircraft on agreed terms of maintenance levels exists. These are recognized as Cost of sales. Additionally, some leases establish the obligation of the lessee to make deposits to the lessor as a guarantee of compliance with the maintenance and return conditions. These deposits, often called maintenance reserves, accumulate until a major maintenance is performed, once made, the recovery is requested to the lessor. At the end of the contract period, there is comparison between the reserves that have been paid and required return conditions, and compensation between the parties are made if applicable. The unscheduled maintenance of aircraft and engines, as well as minor maintenance, are charged to results as incurred. 2.24. Environmental costs Disbursements related to environmental protection are charged to results when incurred.
19 NOTE 3 - FINANCIAL RISK MANAGEMENT 3.1. Financial risk factors The Company is exposed to different financial risks: (a) market risk, (b) credit risk, and (c) liquidity risk. The program overall risk management of the Company aims to minimize the adverse effects of financial risks affecting the company. (a) Market risk Due to the nature of its operations, the Company is exposed to market factors such as: (i) fuel-price risk, (ii) exchange -rate risk, and (iii) interest -rate risk. The Company has developed policies and procedures for managing market risk, which aim to identify, quantify, monitor and mitigate the adverse effects of changes in market factors mentioned above. For this, the Administration monitors the evolution of price levels, exchange rates and interest rates, and quantifies their risk exposures (Value at Risk), and develops and implements hedging strategies. (i) Fuel-price risk: Exposition: For the execution of its operations the Company purchases a fuel called Jet Fuel grade 54 USGC, which is subject to the fluctuations of international fuel prices. Mitigation: To cover the risk exposure fuel, the Company operates with derivative instruments (swaps and options) whose underlying assets may be different from Jet Fuel, being possible use West Texas Intermediate (“WTI”) crude, Brent (“BRENT”) crude and distillate Heating Oil (“HO”), which have a high correlation with Jet Fuel and greater liquidity. Fuel Hedging Results: During the period ended December 31, 2017, the Company recognized gains of US $ 15.1 million for fuel net premium coverage. During the same period of 2016, the Company recognized losses of US $ 48.0 million for the same concept. As of December 31, 2017, the market value of fuel positions amounted to US $ 10.7 million (positive). At the end of December 2016, this market value was US $ 8.1 million (positive).

F I N A N C I A L S T AT E M E N T S 161Consolidated Financial Statements
20 The following tables show the level of hedge for different periods:
Positions as of December 31, 2017 (*) Maturities Q118 Q218 Q318 Total
Percentage of coverage over the expected volume of consumption 19% 12% 5% 12%
(*) The volume shown in the table considers all the hedging instruments (swaps and options). Positions as of December 31, 2016 (*) Maturities
Q117
Q217
Total
Percentage of coverage over the expected volume of consumption 21% 16% 18%
(*) The volume shown in the table considers all the hedging instruments (swaps and options). Sensitivity analysis A drop in fuel price positively affects the Company through a reduction in costs. However, also negatively affects contracted positions as these are acquired to protect the Company against the risk of a rise in price. The policy therefore is to maintain a hedge-free percentage in order to be competitive in the event of a drop in price. The current hedge positions they are booked as cash flow hedge contracts, so a variation in the fuel price has an impact on the Company’s net equity. The following table shows the sensitivity analysis of the financial instruments according to reasonable changes in the fuel price and their effect on equity. The term of the projection was defined until the end of the last current fuel hedge contract, being the last business day of the third quarter of 2018. The calculations were made considering a parallel movement of US$ 5 per barrel in the curve of the BRENT and JET crude futures benchmark price at the end of December 2017 and the end of December, 2016.
Positions as of December 31, 2017
Positions as of December 31, 2016
Benchmark price
effect on equity
effect on equity (US$ per barrel)
(millions of US$)
(millions of US$)
+5
+1.8
+3.12 -5
- 3.3
-4.78
Given the structure of fuel coverage during 2017, considers a hedge-free portion, a vertical drop of 5 dollars in the JET reference price (considered as the monthly average), would have meant an approximate impact US $ 109.7 million of lower fuel costs. For the same period, a vertical rise of $ 5 in the JET reference price (considered as the monthly average) would have meant an impact of approximately US $ 110.5 million of higher fuel costs.
21 (ii) Foreign exchange rate risk: Exposition: The functional and presentation currency of the Financial Statements of the Parent Company is the US dollar, so that the risk of the Transactional and Conversion exchange rate arises mainly from the Company's business, strategic and accounting operating activities that are expressed in a monetary unit other than the functional currency. The subsidiaries of LATAM are also exposed to foreign exchange risk whose impact affects the Company's Consolidated Income. The largest operational exposure to LATAM's exchange risk comes from the concentration of businesses in Brazil, which are mostly denominated in Brazilian Real (BRL), and are actively managed by the company. At a lower concentration, the Company is also exposed to the fluctuation of other currencies, such as: euro, pound sterling, Australian dollar, Colombian peso, Chilean peso, Argentine peso, Paraguayan guarani, Mexican peso, Peruvian nuevo sol and New Zealand dollar. Mitigation: The Company mitigates currency risk exposures by contracting derivative instruments or through natural hedges or execution of internal operations. FX Hedging Results: In order to reduce the exposure to the exchange rate risk in the operational cash flows of 2017, and to ensure the operating margin, LATAM makes hedges using FX derivatives. As of December 31, 2017, the market value of FX derivative positions amounted to US $ 4.4 million (positive). At the end of December 2016, this market value was US $ 1.1 million (negative). During the period ended December 31, 2017, the Company recognized losses of US $ 9.7 million for FX net premium coverage. During the same period of 2016, the company recognized losses of US $ 40.3 million for this concept. As of December 31, 2017, the Company has contracted FX derivatives for US $ 180 million for BRL. By the end of December 2016, the company had contracted FX derivatives for US $ 60 million for BRL, and US $ 10 million for GBP. Sensitivity analysis: A depreciation of the R $ / US $ exchange rate, negatively affects the Company's operating cash flows, however, also positively affects the value of the positions of derivatives contracted. FX derivatives are recorded as cash flow hedge contracts; therefore, a variation in the exchange rate has an impact on the market value of the derivatives, the changes of which affect the Company's net equity.
F I N A N C I A L S T AT E M E N T S 162Consolidated Financial Statements
22 The following table shows the awareness of FX derivative instruments according to reasonable changes in the exchange rate and its effect on equity. The projection term was defined until the end of the last contract of coverage in force, being the last business day of the second quarter of the year 2018:
Appreciation (depreciation)* Effect at December 31, 2017 Effect at December 31, 2016 of R$ Millions of US$ Millions of US$
-10%
-10.7 -1.02 +10%
+9.7 +3.44
(*)Both currencies (BRL and GBP) only apply period to the closing of 2016. During 2017, the Company contracted derivative currency swaps to hedge debt issued the same year for a notional UF 8.7 million. As of December 31, 2017, the market value of derivative positions of currency swaps amounted to US$ 30.6 million (positive). As of December 31, 2017, the Company has recorded an amount for ineffectiveness in the consolidated statement of income for this type of hedges for US $ 6.2 million (positive). In the case of TAM S.A, whose functional currency is the Brazilian real, a large part of its liabilities are expressed in US dollars. Therefore, when converting financial assets and liabilities, from dollars to reais, they have an impact on the result of TAM S.A., which is consolidated in the Company's Income Statement. With the objective of reducing the impact on the Company's results caused by appreciations or depreciations of R$/US $, the Company has executed internal operations to reduce the net exposure in US$ for TAM S.A. The following table shows the variation of financial performance to appreciate or depreciate 10% exchange rate R$/US$:
Appreciation (depreciation)* Effect at December 31, 2017 Effect at December 31, 2016 of R$/US$ Millons of US$ Millons of US$
-10%
+80.5 +119.2 +10%
-80.5 -119.2
(*) Appreciation (depreciation) of US$ regard to the covered currencies. Effects of exchange rate derivatives in the Financial Statements
The profit or losses caused by changes in the fair value of hedging instruments are segregated between intrinsic value and temporary value. The intrinsic value is the actual percentage of cash flow covered, initially shown in equity and later transferred to income, while the hedge transaction is recorded in income. The temporary value corresponds to the ineffective portion of cash flow hedge which is recognized in the financial results of the Company (Note 19).
23 Due to the functional currency of TAM S.A. and Subsidiaries is the Brazilian real, the Company presents the effects of the exchange rate fluctuations in Other comprehensive income by converting the Statement of financial position and Income statement of TAM S.A. and Subsidiaries from their functional currency to the U.S. dollar, which is the presentation currency of the consolidated financial statement of LATAM Airlines Group S.A. and Subsidiaries. The Goodwill generated in the Business combination is recognized as an asset of TAM S.A. and Subsidiaries in Brazilian real whose conversion to U.S. dollar also produces effects in other comprehensive income. The following table shows the change in Other comprehensive income recognized in Total equity in the case of appreciate or depreciate 10% the exchange rate R$/US$:
Appreciation (depreciation) Effect at December 31, 2017
Effect at December 31, 2016
of R$/US$
Millions of US$
Millions of US$
-10%
+386.62
+351.04 +10%
-316.33
-287.22
(iii) Interest -rate risk:
Exposition: The Company is exposed to fluctuations in interest rates affecting the markets future cash flows of the assets, and current and future financial liabilities. The Company is exposed in one portion to the variations of London Inter-Bank Offer Rate (“LIBOR”) and other interest rates of less relevance are Brazilian Interbank Deposit Certificate ("ILC"). Mitigation: In order to reduce the risk of an eventual rise in interest rates, the Company has signed interest-rate swap and call option contracts. Currently a 63% (63% at December 31, 2016) of the debt is fixed to fluctuations in interest rate. Rate Hedging Results: At December 31, 2017, the market value of the positions of interest rate derivatives amounted to US$ 6.6 million (negative). At end of December 2016 this market value was US$ 17.2 million (negative).
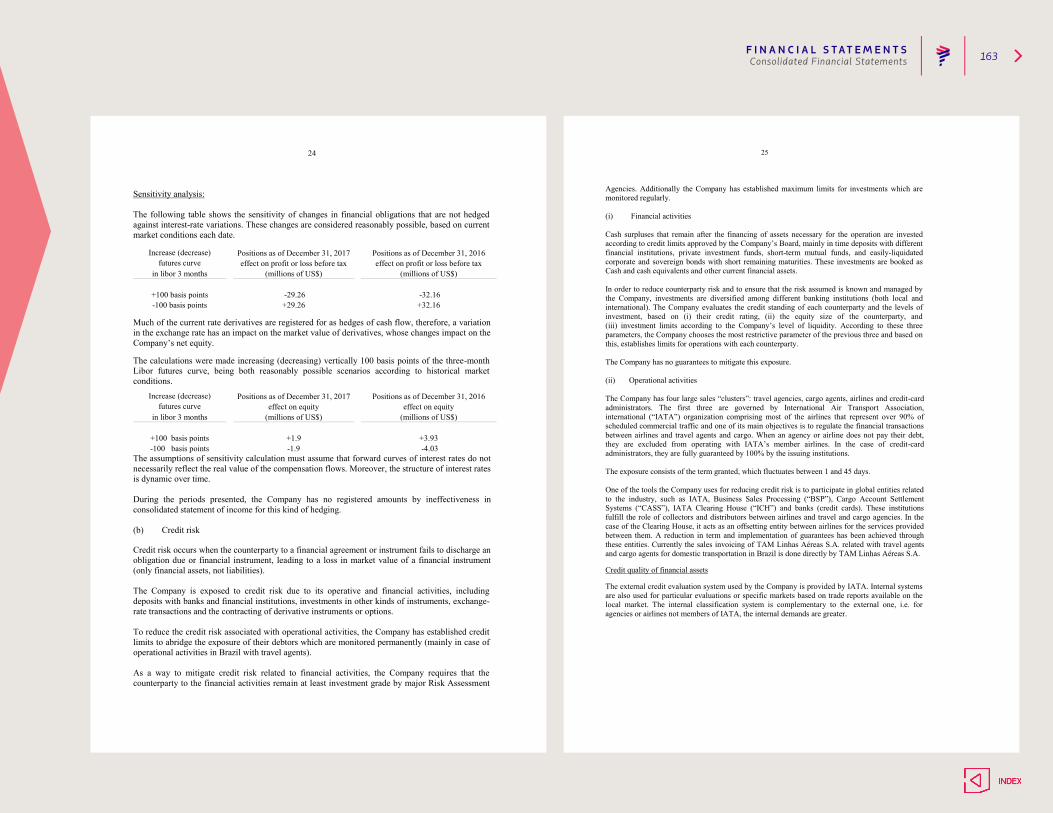
F I N A N C I A L S T AT E M E N T S 163Consolidated Financial Statements
24 Sensitivity analysis: The following table shows the sensitivity of changes in financial obligations that are not hedged against interest-rate variations. These changes are considered reasonably possible, based on current market conditions each date.
Increase (decrease) Positions as of December 31, 2017
Positions as of December 31, 2016 futures curve effect on profit or loss before tax
effect on profit or loss before tax
in libor 3 months
(millions of US$)
(millions of US$)
+100 basis points
-29.26
-32.16 -100 basis points
+29.26
+32.16
Much of the current rate derivatives are registered for as hedges of cash flow, therefore, a variation in the exchange rate has an impact on the market value of derivatives, whose changes impact on the Company’s net equity. The calculations were made increasing (decreasing) vertically 100 basis points of the three-month Libor futures curve, being both reasonably possible scenarios according to historical market conditions.
Increase (decrease) Positions as of December 31, 2017
Positions as of December 31, 2016 futures curve effect on equity
effect on equity
in libor 3 months
(millions of US$)
(millions of US$)
+100 basis points
+1.9
+3.93 -100 basis points
-1.9
-4.03
The assumptions of sensitivity calculation must assume that forward curves of interest rates do not necessarily reflect the real value of the compensation flows. Moreover, the structure of interest rates is dynamic over time. During the periods presented, the Company has no registered amounts by ineffectiveness in consolidated statement of income for this kind of hedging. (b) Credit risk
Credit risk occurs when the counterparty to a financial agreement or instrument fails to discharge an obligation due or financial instrument, leading to a loss in market value of a financial instrument (only financial assets, not liabilities). The Company is exposed to credit risk due to its operative and financial activities, including deposits with banks and financial institutions, investments in other kinds of instruments, exchange-rate transactions and the contracting of derivative instruments or options. To reduce the credit risk associated with operational activities, the Company has established credit limits to abridge the exposure of their debtors which are monitored permanently (mainly in case of operational activities in Brazil with travel agents). As a way to mitigate credit risk related to financial activities, the Company requires that the counterparty to the financial activities remain at least investment grade by major Risk Assessment
25 Agencies. Additionally the Company has established maximum limits for investments which are monitored regularly. (i) Financial activities Cash surpluses that remain after the financing of assets necessary for the operation are invested according to credit limits approved by the Company’s Board, mainly in time deposits with different financial institutions, private investment funds, short-term mutual funds, and easily-liquidated corporate and sovereign bonds with short remaining maturities. These investments are booked as Cash and cash equivalents and other current financial assets. In order to reduce counterparty risk and to ensure that the risk assumed is known and managed by the Company, investments are diversified among different banking institutions (both local and international). The Company evaluates the credit standing of each counterparty and the levels of investment, based on (i) their credit rating, (ii) the equity size of the counterparty, and (iii) investment limits according to the Company’s level of liquidity. According to these three parameters, the Company chooses the most restrictive parameter of the previous three and based on this, establishes limits for operations with each counterparty. The Company has no guarantees to mitigate this exposure. (ii) Operational activities The Company has four large sales “clusters”: travel agencies, cargo agents, airlines and credit-card administrators. The first three are governed by International Air Transport Association, international (“IATA”) organization comprising most of the airlines that represent over 90% of scheduled commercial traffic and one of its main objectives is to regulate the financial transactions between airlines and travel agents and cargo. When an agency or airline does not pay their debt, they are excluded from operating with IATA’s member airlines. In the case of credit-card administrators, they are fully guaranteed by 100% by the issuing institutions. The exposure consists of the term granted, which fluctuates between 1 and 45 days. One of the tools the Company uses for reducing credit risk is to participate in global entities related to the industry, such as IATA, Business Sales Processing (“BSP”), Cargo Account Settlement Systems (“CASS”), IATA Clearing House (“ICH”) and banks (credit cards). These institutions fulfill the role of collectors and distributors between airlines and travel and cargo agencies. In the case of the Clearing House, it acts as an offsetting entity between airlines for the services provided between them. A reduction in term and implementation of guarantees has been achieved through these entities. Currently the sales invoicing of TAM Linhas Aéreas S.A. related with travel agents and cargo agents for domestic transportation in Brazil is done directly by TAM Linhas Aéreas S.A.
Credit quality of financial assets
The external credit evaluation system used by the Company is provided by IATA. Internal systems are also used for particular evaluations or specific markets based on trade reports available on the local market. The internal classification system is complementary to the external one, i.e. for agencies or airlines not members of IATA, the internal demands are greater.
F I N A N C I A L S T AT E M E N T S 164Consolidated Financial Statements
26 To reduce the credit risk associated with operational activities, the Company has established credit limits to abridge the exposure of their debtors which are monitored permanently (mainly in case of operational activities of TAM Linhas Aéreas S.A. with travel agents).The bad-debt rate in the principal countries where the Company has a presence is insignificant. (c) Liquidity risk Liquidity risk represents the risk that the Company has no sufficient funds to meet its obligations. Because of the cyclical nature of the business, the operation, and its investment and financing needs related to the acquisition of new aircraft and renewal of its fleet, plus the financing needs, the Company requires liquid funds, defined as cash and cash equivalents plus other short term financial assets, to meet its payment obligations. The liquid funds, the future cash generation and the capacity to obtain additional funding, through bond issuance and banking loans, will allow the Company to obtain sufficient alternatives to face its investment and financing future commitments. At December 31, 2017 is US$ 1,614 million (US$ 1,486 million at December 31, 2016), invested in short term instruments through financial high credit rating levels entities. In addition to the liquid funds, the Company has access to short term credit line. As of December 31, 2017, LATAM has working capital credit lines with multiple banks and additionally has a US$ 450 million undrawn committed credit line (US$ 325 million at December 31, 2016) subject to borrowing base availability.
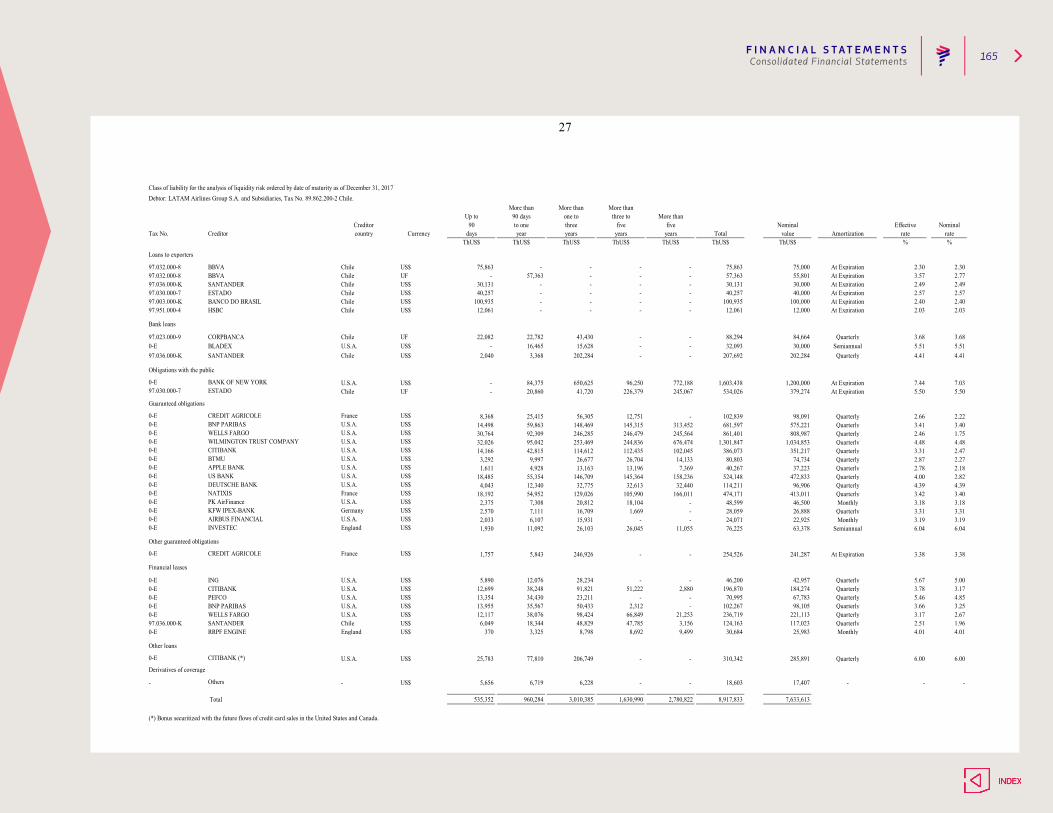
F I N A N C I A L S T AT E M E N T S 165Consolidated Financial Statements
27
Class of liability for the analysis of liquidity risk ordered by date of maturity as of December 31, 2017 Debtor: LATAM Airlines Group S.A. and Subsidiaries, Tax No. 89.862.200-2 Chile.
More than More than More thanUp to 90 days one to three to More than
Creditor 90 to one three five five Nominal Effective NominalTax No. Creditor country Currency days year years years years Total value Amortization rate rate
ThUS$ ThUS$ ThUS$ ThUS$ ThUS$ ThUS$ ThUS$ % %
Loans to exporters
97.032.000-8 BBVA Chile US$ 75,863 - - - - 75,863 75,000 At Expiration 2.30 2.3097.032.000-8 BBVA Chile UF - 57,363 - - - 57,363 55,801 At Expiration 3.57 2.7797.036.000-K SANTANDER Chile US$ 30,131 - - - - 30,131 30,000 At Expiration 2.49 2.4997.030.000-7 ESTADO Chile US$ 40,257 - - - - 40,257 40,000 At Expiration 2.57 2.5797.003.000-K BANCO DO BRASIL Chile US$ 100,935 - - - - 100,935 100,000 At Expiration 2.40 2.4097.951.000-4 HSBC Chile US$ 12,061 - - - - 12,061 12,000 At Expiration 2.03 2.03
Bank loans
97.023.000-9 CORPBANCA Chile UF 22,082 22,782 43,430 - - 88,294 84,664 Quarterly 3.68 3.680-E BLADEX U.S.A. US$ - 16,465 15,628 - - 32,093 30,000 Semiannual 5.51 5.5197.036.000-K SANTANDER Chile US$ 2,040 3,368 202,284 - - 207,692 202,284 Quarterly 4.41 4.41
Obligations with the public
0-E BANK OF NEW YORK U.S.A. US$ - 84,375 650,625 96,250 772,188 1,603,438 1,200,000 At Expiration 7.44 7.0397.030.000-7 ESTADO Chile UF - 20,860 41,720 226,379 245,067 534,026 379,274 At Expiration 5.50 5.50
Guaranteed obligations
0-E CREDIT AGRICOLE France US$ 8,368 25,415 56,305 12,751 - 102,839 98,091 Quarterly 2.66 2.220-E BNP PARIBAS U.S.A. US$ 14,498 59,863 148,469 145,315 313,452 681,597 575,221 Quarterly 3.41 3.400-E WELLS FARGO U.S.A. US$ 30,764 92,309 246,285 246,479 245,564 861,401 808,987 Quarterly 2.46 1.750-E WILMINGTON TRUST COMPANY U.S.A. US$ 32,026 95,042 253,469 244,836 676,474 1,301,847 1,034,853 Quarterly 4.48 4.480-E CITIBANK U.S.A. US$ 14,166 42,815 114,612 112,435 102,045 386,073 351,217 Quarterly 3.31 2.470-E BTMU U.S.A. US$ 3,292 9,997 26,677 26,704 14,133 80,803 74,734 Quarterly 2.87 2.270-E APPLE BANK U.S.A. US$ 1,611 4,928 13,163 13,196 7,369 40,267 37,223 Quarterly 2.78 2.180-E US BANK U.S.A. US$ 18,485 55,354 146,709 145,364 158,236 524,148 472,833 Quarterly 4.00 2.820-E DEUTSCHE BANK U.S.A. US$ 4,043 12,340 32,775 32,613 32,440 114,211 96,906 Quarterly 4.39 4.390-E NATIXIS France US$ 18,192 54,952 129,026 105,990 166,011 474,171 413,011 Quarterly 3.42 3.400-E PK AirFinance U.S.A. US$ 2,375 7,308 20,812 18,104 - 48,599 46,500 Monthly 3.18 3.180-E KFW IPEX-BANK Germany US$ 2,570 7,111 16,709 1,669 - 28,059 26,888 Quarterly 3.31 3.310-E AIRBUS FINANCIAL U.S.A. US$ 2,033 6,107 15,931 - - 24,071 22,925 Monthly 3.19 3.190-E INVESTEC England US$ 1,930 11,092 26,103 26,045 11,055 76,225 63,378 Semiannual 6.04 6.04
Other guaranteed obligations
0-E CREDIT AGRICOLE France US$ 1,757 5,843 246,926 - - 254,526 241,287 At Expiration 3.38 3.38
Financial leases
0-E ING U.S.A. US$ 5,890 12,076 28,234 - - 46,200 42,957 Quarterly 5.67 5.000-E CITIBANK U.S.A. US$ 12,699 38,248 91,821 51,222 2,880 196,870 184,274 Quarterly 3.78 3.170-E PEFCO U.S.A. US$ 13,354 34,430 23,211 - - 70,995 67,783 Quarterly 5.46 4.850-E BNP PARIBAS U.S.A. US$ 13,955 35,567 50,433 2,312 - 102,267 98,105 Quarterly 3.66 3.250-E WELLS FARGO U.S.A. US$ 12,117 38,076 98,424 66,849 21,253 236,719 221,113 Quarterly 3.17 2.6797.036.000-K SANTANDER Chile US$ 6,049 18,344 48,829 47,785 3,156 124,163 117,023 Quarterly 2.51 1.960-E RRPF ENGINE England US$ 370 3,325 8,798 8,692 9,499 30,684 25,983 Monthly 4.01 4.01
Other loans
0-E CITIBANK (*) U.S.A. US$ 25,783 77,810 206,749 - - 310,342 285,891 Quarterly 6.00 6.00Derivatives of coverage
- Others - US$ 5,656 6,719 6,228 - - 18,603 17,407 - - -
Total 535,352 960,284 3,010,385 1,630,990 2,780,822 8,917,833 7,633,613
(*) Bonus securitized with the future flows of credit card sales in the United States and Canada.
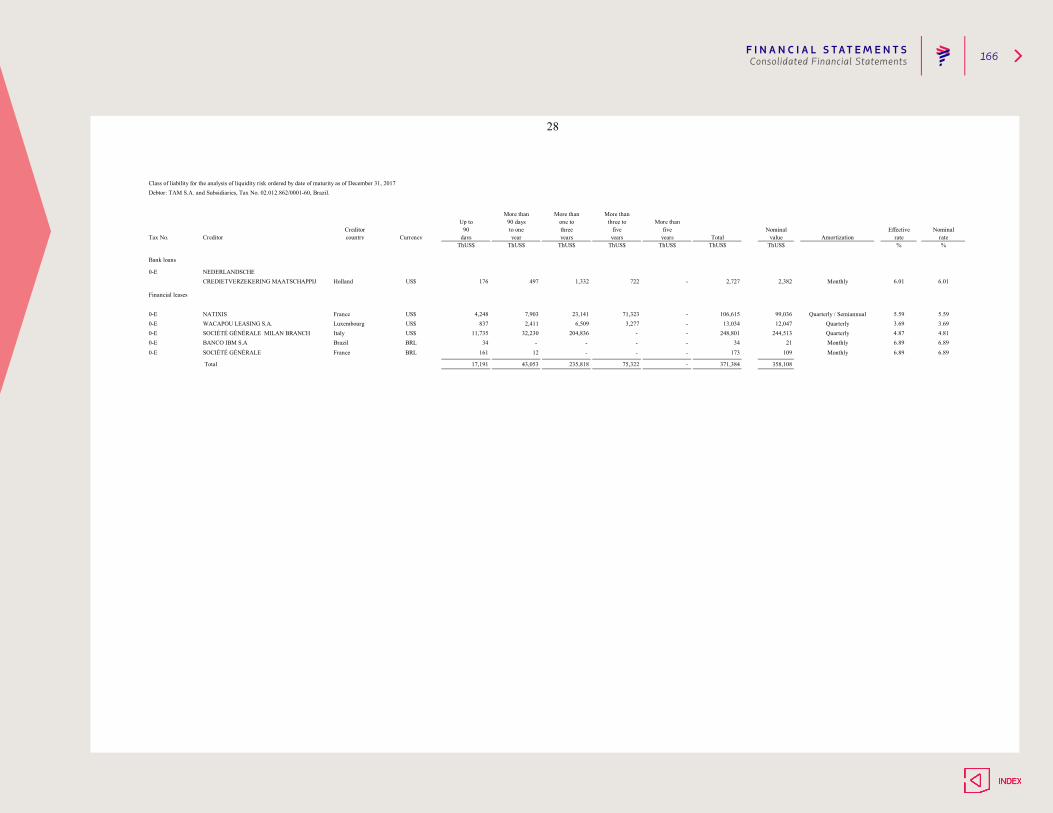
F I N A N C I A L S T AT E M E N T S 166Consolidated Financial Statements
28
Class of liability for the analysis of liquidity risk ordered by date of maturity as of December 31, 2017Debtor: TAM S.A. and Subsidiaries, Tax No. 02.012.862/0001-60, Brazil.
More than More than More thanUp to 90 days one to three to More than
Creditor 90 to one three five five Nominal Effective NominalTax No. Creditor country Currency days year years years years Total value Amortization rate rate
ThUS$ ThUS$ ThUS$ ThUS$ ThUS$ ThUS$ ThUS$ % %
Bank loans
0-E NEDERLANDSCHECREDIETVERZEKERING MAATSCHAPPIJ Holland US$ 176 497 1,332 722 - 2,727 2,382 Monthly 6.01 6.01
Financial leases
0-E NATIXIS France US$ 4,248 7,903 23,141 71,323 - 106,615 99,036 Quarterly / Semiannual 5.59 5.590-E WACAPOU LEASING S.A. Luxembourg US$ 837 2,411 6,509 3,277 - 13,034 12,047 Quarterly 3.69 3.690-E SOCIÉTÉ GÉNÉRALE MILAN BRANCH Italy US$ 11,735 32,230 204,836 - - 248,801 244,513 Quarterly 4.87 4.810-E BANCO IBM S.A Brazil BRL 34 - - - - 34 21 Monthly 6.89 6.89
0-E SOCIÉTÉ GÉNÉRALE France BRL 161 12 - - - 173 109 Monthly 6.89 6.89
Total 17,191 43,053 235,818 75,322 - 371,384 358,108
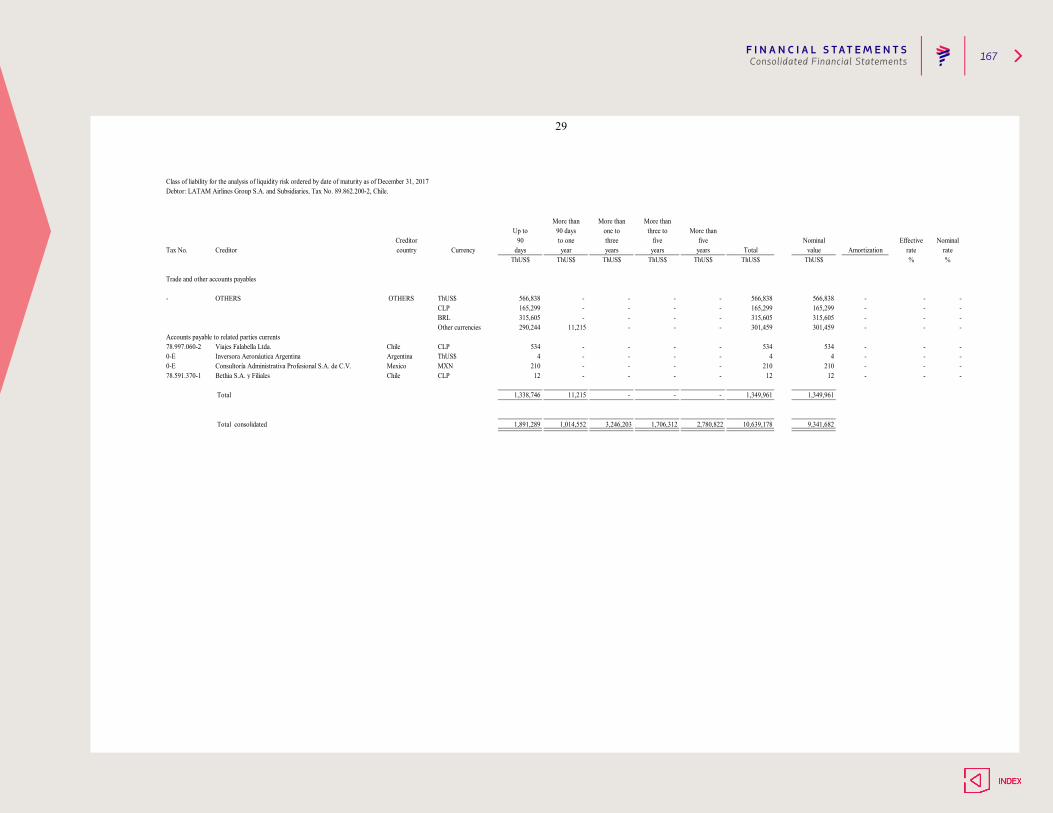
F I N A N C I A L S T AT E M E N T S 167Consolidated Financial Statements
29
Class of liability for the analysis of liquidity risk ordered by date of maturity as of December 31, 2017 Debtor: LATAM Airlines Group S.A. and Subsidiaries, Tax No. 89.862.200-2, Chile.
More than More than More thanUp to 90 days one to three to More than
Creditor 90 to one three five five Nominal Effective NominalTax No. Creditor country Currency days year years years years Total value Amortization rate rate
ThUS$ ThUS$ ThUS$ ThUS$ ThUS$ ThUS$ ThUS$ % %
Trade and other accounts payables
- OTHERS OTHERS ThUS$ 566,838 - - - - 566,838 566,838 - - -CLP 165,299 - - - - 165,299 165,299 - - -BRL 315,605 - - - - 315,605 315,605 - - -Other currencies 290,244 11,215 - - - 301,459 301,459 - - -
Accounts payable to related parties currents78.997.060-2 Viajes Falabella Ltda. Chile CLP 534 - - - - 534 534 - - -0-E Inversora Aeronáutica Argentina Argentina ThUS$ 4 - - - - 4 4 - - -0-E Consultoría Administrativa Profesional S.A. de C.V. Mexico MXN 210 - - - - 210 210 - - -78.591.370-1 Bethia S.A. y Filiales Chile CLP 12 - - - - 12 12 - - -
Total 1,338,746 11,215 - - - 1,349,961 1,349,961
Total consolidated 1,891,289 1,014,552 3,246,203 1,706,312 2,780,822 10,639,178 9,341,682
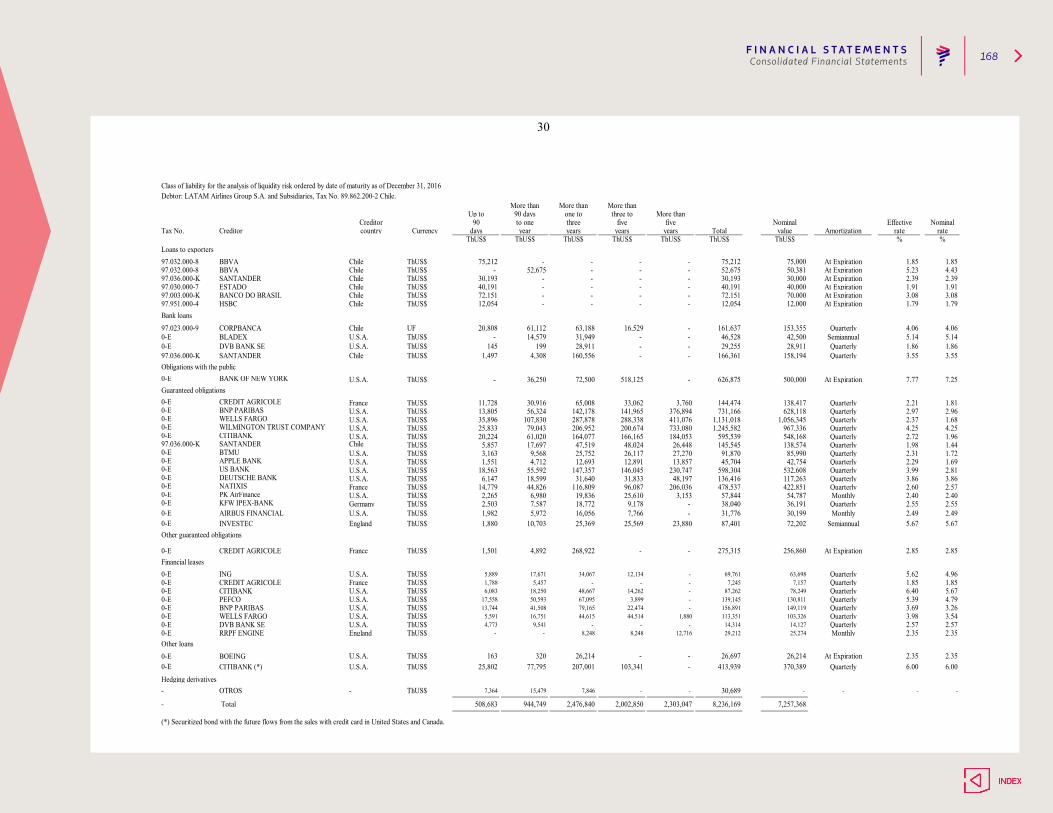
F I N A N C I A L S T AT E M E N T S 168Consolidated Financial Statements
30
Class of liability for the analysis of liquidity risk ordered by date of maturity as of December 31, 2016Debtor: LATAM Airlines Group S.A. and Subsidiaries, Tax No. 89.862.200-2 Chile.
More than More than More thanUp to 90 days one to three to More than
Creditor 90 to one three five five Nominal Effective NominalTax No. Creditor country Currency days year years years years Total value Amortization rate rate
ThUS$ ThUS$ ThUS$ ThUS$ ThUS$ ThUS$ ThUS$ % %Loans to exporters97.032.000-8 BBVA Chile ThUS$ 75,212 - - - - 75,212 75,000 At Expiration 1.85 1.8597.032.000-8 BBVA Chile ThUS$ - 52,675 - - - 52,675 50,381 At Expiration 5.23 4.4397.036.000-K SANTANDER Chile ThUS$ 30,193 - - - - 30,193 30,000 At Expiration 2.39 2.3997.030.000-7 ESTADO Chile ThUS$ 40,191 - - - - 40,191 40,000 At Expiration 1.91 1.9197.003.000-K BANCO DO BRASIL Chile ThUS$ 72,151 - - - - 72,151 70,000 At Expiration 3.08 3.0897.951.000-4 HSBC Chile ThUS$ 12,054 - - - - 12,054 12,000 At Expiration 1.79 1.79Bank loans97.023.000-9 CORPBANCA Chile UF 20,808 61,112 63,188 16,529 - 161,637 153,355 Quarterly 4.06 4.060-E BLADEX U.S.A. ThUS$ - 14,579 31,949 - - 46,528 42,500 Semiannual 5.14 5.140-E DVB BANK SE U.S.A. ThUS$ 145 199 28,911 - - 29,255 28,911 Quarterly 1.86 1.8697.036.000-K SANTANDER Chile ThUS$ 1,497 4,308 160,556 - - 166,361 158,194 Quarterly 3.55 3.55Obligations with the public0-E BANK OF NEW YORK U.S.A. ThUS$ - 36,250 72,500 518,125 - 626,875 500,000 At Expiration 7.77 7.25Guaranteed obligations0-E CREDIT AGRICOLE France ThUS$ 11,728 30,916 65,008 33,062 3,760 144,474 138,417 Quarterly 2.21 1.810-E BNP PARIBAS U.S.A. ThUS$ 13,805 56,324 142,178 141,965 376,894 731,166 628,118 Quarterly 2.97 2.960-E WELLS FARGO U.S.A. ThUS$ 35,896 107,830 287,878 288,338 411,076 1,131,018 1,056,345 Quarterly 2.37 1.680-E WILMINGTON TRUST COMPANY U.S.A. ThUS$ 25,833 79,043 206,952 200,674 733,080 1,245,582 967,336 Quarterly 4.25 4.250-E CITIBANK U.S.A. ThUS$ 20,224 61,020 164,077 166,165 184,053 595,539 548,168 Quarterly 2.72 1.9697.036.000-K SANTANDER Chile ThUS$ 5,857 17,697 47,519 48,024 26,448 145,545 138,574 Quarterly 1.98 1.440-E BTMU U.S.A. ThUS$ 3,163 9,568 25,752 26,117 27,270 91,870 85,990 Quarterly 2.31 1.720-E APPLE BANK U.S.A. ThUS$ 1,551 4,712 12,693 12,891 13,857 45,704 42,754 Quarterly 2.29 1.690-E US BANK U.S.A. ThUS$ 18,563 55,592 147,357 146,045 230,747 598,304 532,608 Quarterly 3.99 2.810-E DEUTSCHE BANK U.S.A. ThUS$ 6,147 18,599 31,640 31,833 48,197 136,416 117,263 Quarterly 3.86 3.860-E NATIXIS France ThUS$ 14,779 44,826 116,809 96,087 206,036 478,537 422,851 Quarterly 2.60 2.570-E PK AirFinance U.S.A. ThUS$ 2,265 6,980 19,836 25,610 3,153 57,844 54,787 Monthly 2.40 2.400-E KFW IPEX-BANK Germany ThUS$ 2,503 7,587 18,772 9,178 - 38,040 36,191 Quarterly 2.55 2.550-E AIRBUS FINANCIAL U.S.A. ThUS$ 1,982 5,972 16,056 7,766 - 31,776 30,199 Monthly 2.49 2.490-E INVESTEC England ThUS$ 1,880 10,703 25,369 25,569 23,880 87,401 72,202 Semiannual 5.67 5.67Other guaranteed obligations
0-E CREDIT AGRICOLE France ThUS$ 1,501 4,892 268,922 - - 275,315 256,860 At Expiration 2.85 2.85Financial leases0-E ING U.S.A. ThUS$ 5,889 17,671 34,067 12,134 - 69,761 63,698 Quarterly 5.62 4.960-E CREDIT AGRICOLE France ThUS$ 1,788 5,457 - - - 7,245 7,157 Quarterly 1.85 1.850-E CITIBANK U.S.A. ThUS$ 6,083 18,250 48,667 14,262 - 87,262 78,249 Quarterly 6.40 5.670-E PEFCO U.S.A. ThUS$ 17,558 50,593 67,095 3,899 - 139,145 130,811 Quarterly 5.39 4.790-E BNP PARIBAS U.S.A. ThUS$ 13,744 41,508 79,165 22,474 - 156,891 149,119 Quarterly 3.69 3.260-E WELLS FARGO U.S.A. ThUS$ 5,591 16,751 44,615 44,514 1,880 113,351 103,326 Quarterly 3.98 3.540-E DVB BANK SE U.S.A. ThUS$ 4,773 9,541 - - - 14,314 14,127 Quarterly 2.57 2.570-E RRPF ENGINE England ThUS$ - - 8,248 8,248 12,716 29,212 25,274 Monthly 2.35 2.35Other loans0-E BOEING U.S.A. ThUS$ 163 320 26,214 - - 26,697 26,214 At Expiration 2.35 2.350-E CITIBANK (*) U.S.A. ThUS$ 25,802 77,795 207,001 103,341 - 413,939 370,389 Quarterly 6.00 6.00Hedging derivatives- OTROS - ThUS$ 7,364 15,479 7,846 - - 30,689 - - - -
- Total 508,683 944,749 2,476,840 2,002,850 2,303,047 8,236,169 7,257,368
(*) Securitized bond with the future flows from the sales with credit card in United States and Canada.
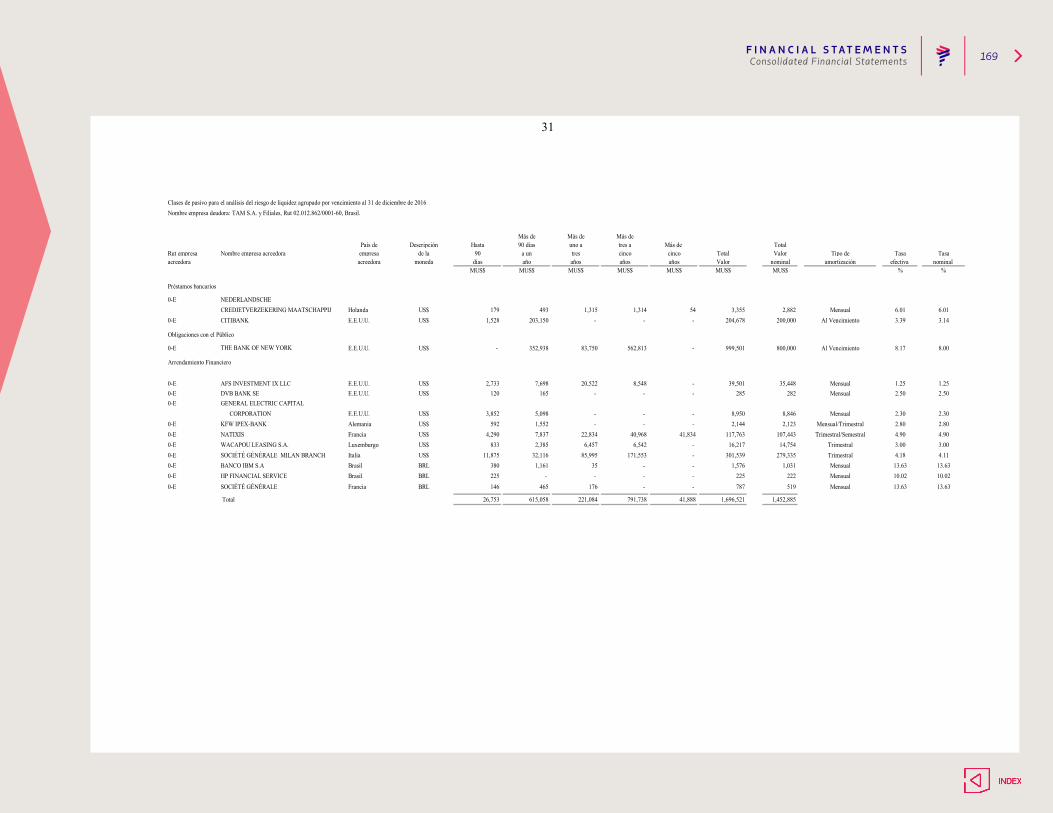
F I N A N C I A L S T AT E M E N T S 169Consolidated Financial Statements
31
Clases de pasivo para el análisis del riesgo de liquidez agrupado por vencimiento al 31 de diciembre de 2016Nombre empresa deudora: TAM S.A. y Filiales, Rut 02.012.862/0001-60, Brasil.
Más de Más de Más dePaís de Descripción Hasta 90 días uno a tres a Más de Total
Rut empresa Nombre empresa acreedora empresa de la 90 a un tres cinco cinco Total Valor Tipo de Tasa Tasaacreedora acreedora moneda días año años años años Valor nominal amortización efectiva nominal
MUS$ MUS$ MUS$ MUS$ MUS$ MUS$ MUS$ % %
Préstamos bancarios
0-E NEDERLANDSCHECREDIETVERZEKERING MAATSCHAPPIJ Holanda US$ 179 493 1,315 1,314 54 3,355 2,882 Mensual 6.01 6.01
0-E CITIBANK E.E.U.U. US$ 1,528 203,150 - - - 204,678 200,000 Al Vencimiento 3.39 3.14
Obligaciones con el Público
0-E THE BANK OF NEW YORK E.E.U.U. US$ - 352,938 83,750 562,813 - 999,501 800,000 Al Vencimiento 8.17 8.00
Arrendamiento Financiero
0-E AFS INVESTMENT IX LLC E.E.U.U. US$ 2,733 7,698 20,522 8,548 - 39,501 35,448 Mensual 1.25 1.250-E DVB BANK SE E.E.U.U. US$ 120 165 - - - 285 282 Mensual 2.50 2.500-E GENERAL ELECTRIC CAPITAL
CORPORATION E.E.U.U. US$ 3,852 5,098 - - - 8,950 8,846 Mensual 2.30 2.300-E KFW IPEX-BANK Alemania US$ 592 1,552 - - - 2,144 2,123 Mensual/Trimestral 2.80 2.800-E NATIXIS Francia US$ 4,290 7,837 22,834 40,968 41,834 117,763 107,443 Trimestral/Semestral 4.90 4.900-E WACAPOU LEASING S.A. Luxemburgo US$ 833 2,385 6,457 6,542 - 16,217 14,754 Trimestral 3.00 3.000-E SOCIÉTÉ GÉNÉRALE MILAN BRANCH Italia US$ 11,875 32,116 85,995 171,553 - 301,539 279,335 Trimestral 4.18 4.110-E BANCO IBM S.A Brasil BRL 380 1,161 35 - - 1,576 1,031 Mensual 13.63 13.630-E HP FINANCIAL SERVICE Brasil BRL 225 - - - - 225 222 Mensual 10.02 10.02
0-E SOCIÉTÉ GÉNÉRALE Francia BRL 146 465 176 - - 787 519 Mensual 13.63 13.63
Total 26,753 615,058 221,084 791,738 41,888 1,696,521 1,452,885
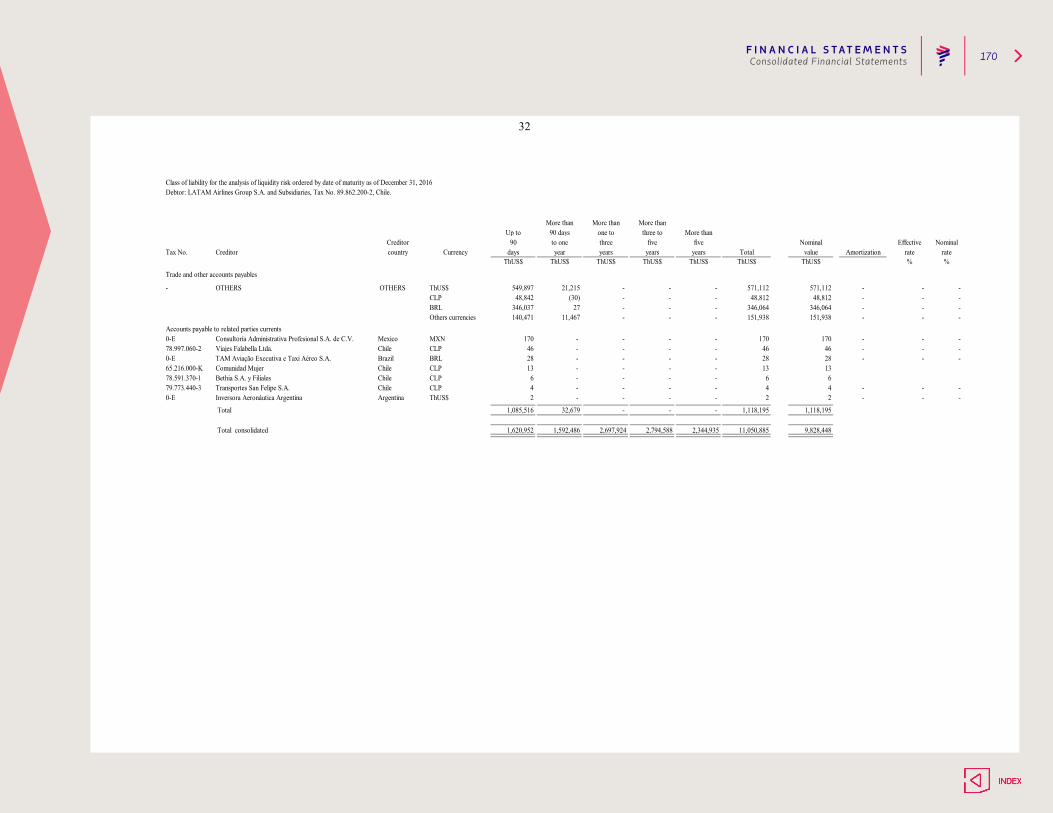
F I N A N C I A L S T AT E M E N T S 170Consolidated Financial Statements
32
Class of liability for the analysis of liquidity risk ordered by date of maturity as of December 31, 2016Debtor: LATAM Airlines Group S.A. and Subsidiaries, Tax No. 89.862.200-2, Chile.
More than More than More thanUp to 90 days one to three to More than
Creditor 90 to one three five five Nominal Effective NominalTax No. Creditor country Currency days year years years years Total value Amortization rate rate
ThUS$ ThUS$ ThUS$ ThUS$ ThUS$ ThUS$ ThUS$ % %
Trade and other accounts payables
- OTHERS OTHERS ThUS$ 549,897 21,215 - - - 571,112 571,112 - - -CLP 48,842 (30) - - - 48,812 48,812 - - -BRL 346,037 27 - - - 346,064 346,064 - - -Others currencies 140,471 11,467 - - - 151,938 151,938 - - -
Accounts payable to related parties currents0-E Consultoría Administrativa Profesional S.A. de C.V. Mexico MXN 170 - - - - 170 170 - - -78.997.060-2 Viajes Falabella Ltda. Chile CLP 46 - - - - 46 46 - - -0-E TAM Aviação Executiva e Taxi Aéreo S.A. Brazil BRL 28 - - - - 28 28 - - -65.216.000-K Comunidad Mujer Chile CLP 13 - - - - 13 1378.591.370-1 Bethia S.A. y Filiales Chile CLP 6 - - - - 6 679.773.440-3 Transportes San Felipe S.A. Chile CLP 4 - - - - 4 4 - - -0-E Inversora Aeronáutica Argentina Argentina ThUS$ 2 - - - - 2 2 - - -
Total 1,085,516 32,679 - - - 1,118,195 1,118,195
Total consolidated 1,620,952 1,592,486 2,697,924 2,794,588 2,344,935 11,050,885 9,828,448
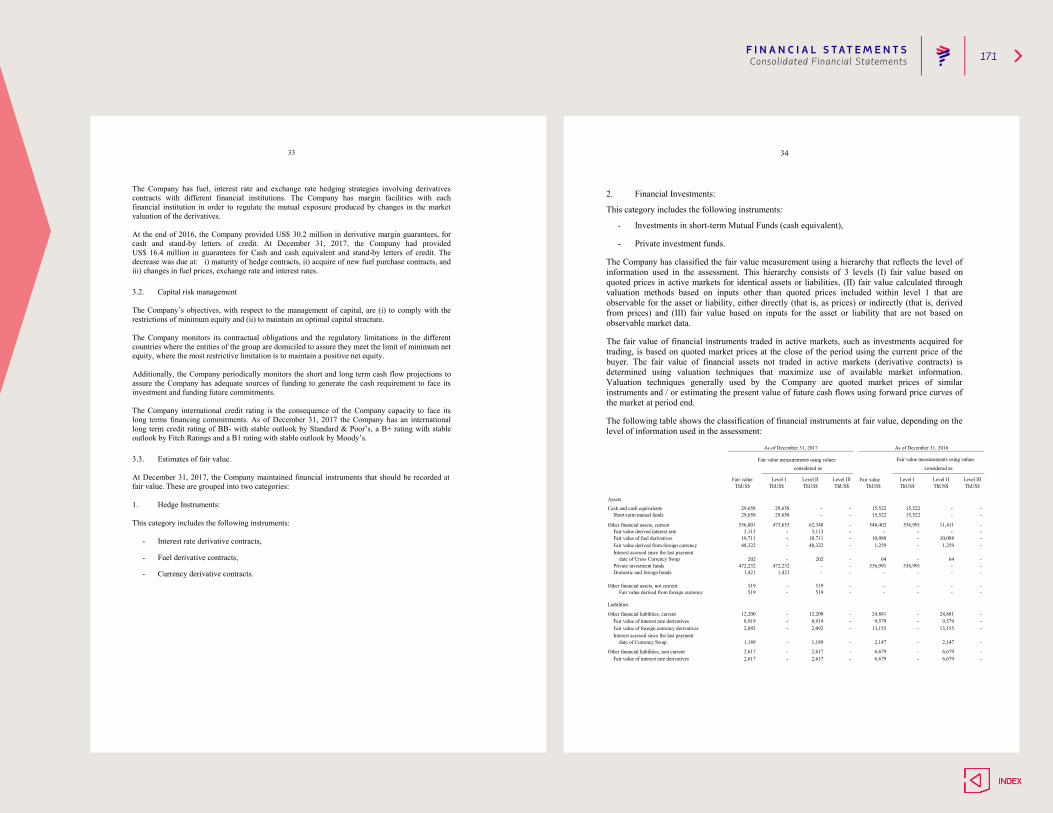
F I N A N C I A L S T AT E M E N T S 171Consolidated Financial Statements
33
The Company has fuel, interest rate and exchange rate hedging strategies involving derivatives contracts with different financial institutions. The Company has margin facilities with each financial institution in order to regulate the mutual exposure produced by changes in the market valuation of the derivatives. At the end of 2016, the Company provided US$ 30.2 million in derivative margin guarantees, for cash and stand-by letters of credit. At December 31, 2017, the Company had provided US$ 16.4 million in guarantees for Cash and cash equivalent and stand-by letters of credit. The decrease was due at: i) maturity of hedge contracts, ii) acquire of new fuel purchase contracts, and iii) changes in fuel prices, exchange rate and interest rates. 3.2. Capital risk management The Company’s objectives, with respect to the management of capital, are (i) to comply with the restrictions of minimum equity and (ii) to maintain an optimal capital structure. The Company monitors its contractual obligations and the regulatory limitations in the different countries where the entities of the group are domiciled to assure they meet the limit of minimum net equity, where the most restrictive limitation is to maintain a positive net equity. Additionally, the Company periodically monitors the short and long term cash flow projections to assure the Company has adequate sources of funding to generate the cash requirement to face its investment and funding future commitments. The Company international credit rating is the consequence of the Company capacity to face its long terms financing commitments. As of December 31, 2017 the Company has an international long term credit rating of BB- with stable outlook by Standard & Poor’s, a B+ rating with stable outlook by Fitch Ratings and a B1 rating with stable outlook by Moody’s. 3.3. Estimates of fair value. At December 31, 2017, the Company maintained financial instruments that should be recorded at fair value. These are grouped into two categories: 1. Hedge Instruments: This category includes the following instruments:
- Interest rate derivative contracts,
- Fuel derivative contracts,
- Currency derivative contracts.
34
2. Financial Investments:
This category includes the following instruments:
- Investments in short-term Mutual Funds (cash equivalent),
- Private investment funds.
The Company has classified the fair value measurement using a hierarchy that reflects the level of information used in the assessment. This hierarchy consists of 3 levels (I) fair value based on quoted prices in active markets for identical assets or liabilities, (II) fair value calculated through valuation methods based on inputs other than quoted prices included within level 1 that are observable for the asset or liability, either directly (that is, as prices) or indirectly (that is, derived from prices) and (III) fair value based on inputs for the asset or liability that are not based on observable market data.
The fair value of financial instruments traded in active markets, such as investments acquired for trading, is based on quoted market prices at the close of the period using the current price of the buyer. The fair value of financial assets not traded in active markets (derivative contracts) is determined using valuation techniques that maximize use of available market information. Valuation techniques generally used by the Company are quoted market prices of similar instruments and / or estimating the present value of future cash flows using forward price curves of the market at period end.
The following table shows the classification of financial instruments at fair value, depending on the level of information used in the assessment:
Fair value measurements using values
Fair value
Cash and cash equivalents
Other financial assets, current
Other financial assets, not current
Other financial liabilities, current
Other financial liabilities, non current
considered as considered as
Fair value Level II Level III Level I Level II
As of December 31, 2017 As of December 31, 2016
Fair value measurements using values
Level IIIThUS$ ThUS$ ThUS$ ThUS$ ThUS$
Assets
29,658 29,658 - - 15,522 15,522 - -
ThUS$ ThUS$ ThUS$
Short-term mutual funds 29,658 29,658 - - 15,522 15,522 - -
11,411 - 536,001 473,653 62,348 - 548,402 536,991
Fair value of fuel derivatives 10,711 - 10,711 - 10,088 - 10,088 - - - - Fair value derived interest rate 3,113 - 3,113 - -
Fair value derived from foreign currency 48,322 - 48,322 - 1,259Interest accrued since the last payment
date of Cross Currency Swap 202 - 202 -
- 1,259 -
64 - 64 - Private investment funds 472,232 472,232 - - 536,991 536,991 - - Domestic and foreign bonds 1,421 1,421 - - - - - -
519 - 519 - - - - - - - - Fair value derived from foreign currency 519 - 519 - -
12,200 - 12,200 - 24,881 -
Liabilities
24,881 - - 9,579 - Fair value of interest rate derivatives 8,919 - 8,919 - 9,579
Fair value of foreign currency derivatives 2,092 - 2,092 - 13,155Interest accrued since the last payment
date of Currency Swap 1,189 - 1,189 -
- 13,155 -
2,147 - 2,147 -
2,617 - 2,617 - 6,679 - 2,617 - 2,617 - 6,679
6,679 -
Level I
- 6,679 - Fair value of interest rate derivatives
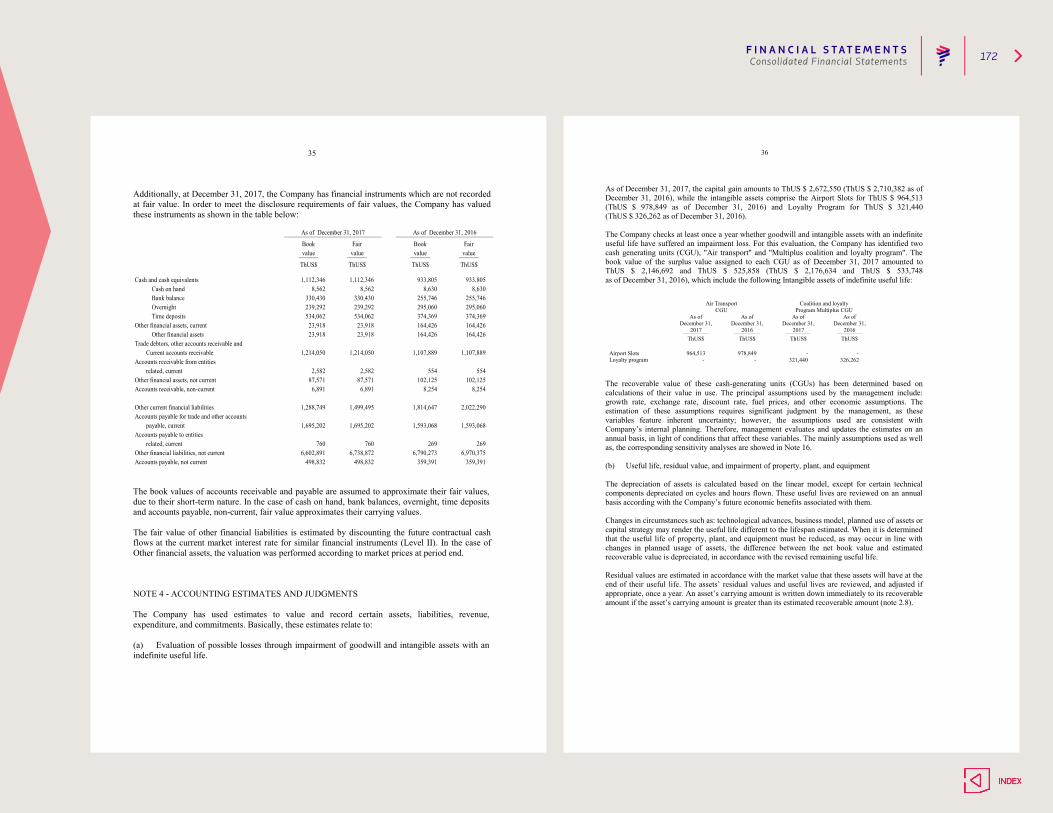
F I N A N C I A L S T AT E M E N T S 172Consolidated Financial Statements
35
Additionally, at December 31, 2017, the Company has financial instruments which are not recorded at fair value. In order to meet the disclosure requirements of fair values, the Company has valued these instruments as shown in the table below:
Cash and cash equivalentsCash on handBank balanceOvernightTime deposits
Other financial assets, currentOther financial assets
Trade debtors, other accounts receivable andCurrent accounts receivable
Accounts receivable from entitiesrelated, current
Other financial assets, not currentAccounts receivable, non-current
Other current financial liabilitiesAccounts payable for trade and other accounts
payable, currentAccounts payable to entities
related, currentOther financial liabilities, not currentAccounts payable, not current 498,832 498,832 359,391 359,391
760 760 269 269 6,602,891 6,738,872 6,790,273 6,970,375
1,288,749 1,499,495 1,814,647 2,022,290
1,695,202 1,695,202 1,593,068 1,593,068
87,571 87,571 102,125 102,125 6,891 6,891 8,254 8,254
1,214,050 1,214,050 1,107,889 1,107,889
2,582 2,582 554 554
23,918 23,918 164,426 164,426 23,918 23,918 164,426 164,426
534,062 534,062 374,369 374,369
330,430 330,430 255,746 255,746 239,292 239,292 295,060 295,060
1,112,346 1,112,346 933,805 933,805 8,562 8,562 8,630 8,630
value value value value
ThUS$ ThUS$ ThUS$ ThUS$
As of December 31, 2017 As of December 31, 2016
Book Fair Book Fair
The book values of accounts receivable and payable are assumed to approximate their fair values, due to their short-term nature. In the case of cash on hand, bank balances, overnight, time deposits and accounts payable, non-current, fair value approximates their carrying values. The fair value of other financial liabilities is estimated by discounting the future contractual cash flows at the current market interest rate for similar financial instruments (Level II). In the case of Other financial assets, the valuation was performed according to market prices at period end. NOTE 4 - ACCOUNTING ESTIMATES AND JUDGMENTS The Company has used estimates to value and record certain assets, liabilities, revenue, expenditure, and commitments. Basically, these estimates relate to: (a) Evaluation of possible losses through impairment of goodwill and intangible assets with an indefinite useful life.
36
As of December 31, 2017, the capital gain amounts to ThUS $ 2,672,550 (ThUS $ 2,710,382 as of December 31, 2016), while the intangible assets comprise the Airport Slots for ThUS $ 964,513 (ThUS $ 978,849 as of December 31, 2016) and Loyalty Program for ThUS $ 321,440 (ThUS $ 326,262 as of December 31, 2016). The Company checks at least once a year whether goodwill and intangible assets with an indefinite useful life have suffered an impairment loss. For this evaluation, the Company has identified two cash generating units (CGU), "Air transport" and "Multiplus coalition and loyalty program". The book value of the surplus value assigned to each CGU as of December 31, 2017 amounted to ThUS $ 2,146,692 and ThUS $ 525,858 (ThUS $ 2,176,634 and ThUS $ 533,748 as of December 31, 2016), which include the following Intangible assets of indefinite useful life:
Air Transport
CGU Coalition and loyalty
Program Multiplus CGU As of As of As of As of December 31, December 31, December 31, December 31, 2017 2016 2017 2016
ThUS$ ThUS$ ThUS$ ThUS$ Airport Slots 964,513 978,849 - - Loyalty program - - 321,440 326,262
The recoverable value of these cash-generating units (CGUs) has been determined based on calculations of their value in use. The principal assumptions used by the management include: growth rate, exchange rate, discount rate, fuel prices, and other economic assumptions. The estimation of these assumptions requires significant judgment by the management, as these variables feature inherent uncertainty; however, the assumptions used are consistent with Company’s internal planning. Therefore, management evaluates and updates the estimates on an annual basis, in light of conditions that affect these variables. The mainly assumptions used as well as, the corresponding sensitivity analyses are showed in Note 16. (b) Useful life, residual value, and impairment of property, plant, and equipment The depreciation of assets is calculated based on the linear model, except for certain technical components depreciated on cycles and hours flown. These useful lives are reviewed on an annual basis according with the Company’s future economic benefits associated with them. Changes in circumstances such as: technological advances, business model, planned use of assets or capital strategy may render the useful life different to the lifespan estimated. When it is determined that the useful life of property, plant, and equipment must be reduced, as may occur in line with changes in planned usage of assets, the difference between the net book value and estimated recoverable value is depreciated, in accordance with the revised remaining useful life. Residual values are estimated in accordance with the market value that these assets will have at the end of their useful life. The assets’ residual values and useful lives are reviewed, and adjusted if appropriate, once a year. An asset’s carrying amount is written down immediately to its recoverable amount if the asset’s carrying amount is greater than its estimated recoverable amount (note 2.8).
F I N A N C I A L S T AT E M E N T S 173Consolidated Financial Statements
37
(c) Recoverability of deferred tax assets Deferred taxes are calculated according to the liability method, on the temporary differences that arise between the tax bases of assets and liabilities and their carrying amounts. Deferred tax assets on tax losses are recognized to the extent that it is probable that future tax benefits will be available with which to offset the temporary differences. The Company makes financial and fiscal projections to evaluate the realization in time of this deferred tax asset. Additionally, it ensures that these projections are consistent with those used to measure other long-lived assets. As of December 31, 2017, the Company has recognized deferred tax assets of ThUS $ 364,021 (ThUS $ 384,580 as of December 31, 2016) and has ceased to recognize deferred tax assets on tax losses of ThUS $ 81,155 (ThUS $ 115,801). December 31, 2016) (Note 18). (d) Air tickets sold that are not actually used. The Company register advance sales of tickets as deferred revenue. Revenue from ticket sales is recognized in the income statement when the service is provided or when the tickets expires unused, reducing the corresponding deferred revenue. The Company evaluates monthly the probability that tickets expiry unused, based on the history of used tickets. Changes in the exchange probability would have an impact our revenue in the year in which the change occurs and in future years. As of December 31, 2017, deferred revenue associated with air tickets sold amounted to ThUS$ 1,550,447 (ThUS$ 1,535,229 as of December 31, 2016). An hypothetical change of 1% in passenger behavior regarding to the ticket usage, that is, if during the next six months after sells probability of used were 89% rather than 90%, as we consider, it would lead to a change in the expiry period from six to seven months, which, would have an impact of up to ThUS$ 20,000 in the results of 2017. (e) Valuation of loyalty points and kilometers granted to loyalty program members, pending usage. As of December 31, 2017 and 2016 the Company operated the following loyalty programs: LATAM Pass, LATAM Fidelidade and Multiplus, with the objective of enhancing customer loyalty by offering points or kilometers (see Note 22). The members of these programs accumulate kilometers when they fly with LATAM Airlines Group or any other airline member of the onewordl® program, as well as use the services of the associated entities. When kilometers and points are redeemed for products and services other than the services provided by the Company, revenue is recognized immediately; when they are redeemed for air tickets on airlines from to LATAM Airlines Group S.A. and subsidiaries, revenue is deferred until the transport service is provided or the corresponding tickets expired. Deferred revenue from loyalty programs at the closing date corresponds to the valuation of points and kilometers granted to loyalty program members, pending of use, weighted by the probability to be redeemed. According to IFRIC-13, kilometers and points value that the Company estimate are not likely to be redeemed (“breakage”), they recognize the associated value proportionally during the period in which the remaining kilometers or points are expected to be redeemed. The Company uses
38
statistical models to estimate the breakage, based on historical redemption patterns Changes in the breakage would have a significant impact on our revenue in the year in which the change occurs and in future years. As of December 31, 2017, the deferred revenue associated with the LATAM Pass loyalty program amounts to ThUS $ 853,505 (ThUS $ 896,190 as of December 31, 2016). A hypothetical change of one percentage point in the exchange probability would result in an impact as of December 31, 2017 of ThUS $ 25,000 (ThUS $ 30,632 as of December 31, 2016). While the deferred revenues associated with the loyalty programs LATAM Fidelidade and Multiplus amount to ThUS $ 364,866 (ThUS $ 392,107 as of December 31, 2016). A hypothetical change of two percentage points in the number of points pending to be exchanged would result in an impact as of December 31, 2017 of ThUS $ 16,700 (ThUS $ 14,639 as of December 31, 2016). The fair value of kilometers and other associated components are determined by the Company on the basis of fair value analysis of them past. As of December 31, 2017 a hypothetical change of one percentage point in the fair value of the unused kilometers would result in an impact of ThUS$ 8,000 in 2017 (ThUS$ 8,400 in 2016). (f) Provisions needs, and their valuation when required Known contingencies are recognized when: the Company has a present legal or constructive obligation as a result of past events; it is probable that an outflow of resources will be required to settle the obligation and the amount has been reliably estimated. The Company applies professional judgment, experience, and knowledge to use available information to determine these values, in light of the specific characteristics of known risks. This process facilitates the early assessment and valuation of potential risks in individual cases or in the development of contingent eventualities. (g) Investment in subsidiary (TAM) The management has applied its judgment in determining that LATAM Airlines Group S.A. controls TAM S.A. and Subsidiaries, for accounting purposes, and has therefore consolidated the financial statements. The grounds for this decision are that LATAM issued ordinary shares in exchange for the majority of circulating ordinary and preferential shares in TAM, except for those TAM shareholders who did not accept the exchange, which were subject to a squeeze out, entitling LATAM to substantially all economic benefits generated by the LATAM Group, and thus exposing it to substantially all risks relating to the operations of TAM. This exchange aligns the economic interests of LATAM and all of its shareholders, including the controlling shareholders of TAM, thus insuring that the shareholders and directors of TAM shall have no incentive to exercise their rights in a manner that would be beneficial to TAM but detrimental to LATAM. Furthermore, all significant actions necessary of the operation of the airlines require votes in favor by the controlling shareholders of both LATAM and TAM. Since the integration of LAN and TAM operations, the most critical airline operations in Brazil have been managed by the CEO of TAM while global activities have been managed by the CEO of LATAM, who is in charge of the operation of the LATAM Group as a whole and reports to the LATAM Board.
F I N A N C I A L S T AT E M E N T S 174Consolidated Financial Statements
39
The CEO of LATAM also evaluates the performance of LATAM Group executives and, together with the LATAM Board, determines compensation. Although Brazilian law currently imposes restrictions on the percentages of voting rights that may be held by foreign investors, LATAM believes that the economic basis of these agreements meets the requirements of accounting standards in force, and that the consolidation of the operations of LAN and LATAM is appropriate. These estimates were made based on the best information available relating to the matters analyzed. In any case, it is possible that events that may take place in the future could lead to their modification in future reporting periods, which would be made in a prospective manner. NOTE 5 - SEGMENTAL INFORMATION The Company has determined that it has two operating segments: the air transportation business and the coalition and loyalty program Multiplus.
The Air transport segment corresponds to the route network for air transport and it is based on the way that the business is run and managed, according to the centralized nature of its operations, the ability to open and close routes and reallocate resources (aircraft, crew, staff, etc..) within the network, which is a functional relationship between all of them, making them inseparable. This segment definition is the most common level used by the global airline industry.
The segment of loyalty coalition called Multiplus, unlike LATAM Pass and LATAM Fidelidade, is a frequent flyer programs which operate as a unilateral system of loyalty that offers a flexible coalition system, interrelated among its members, with 19.4 million of members, along with being a regulated entity with a separately business and not directly related to air transport.

F I N A N C I A L S T AT E M E N T S 175Consolidated Financial Statements
40
For the periods ended
LAN passengerTAM passengerFreight
2016
ThUS$
-
- - -
(466,537)
-
(10,718)
2016
ThUS$
400,568
- 400,568
-
65,969
174,197
58,380
2016
ThUS$
8,988,340
4,104,3483,773,3671,110,625
-
538,748
74,949
2017
ThUS$ ThUS$ ThUS$ ThUS$
2017 2017 20172016
ThUS$
1,119,430 - -
308,937
At December 31, At December 31, At December 31, At December 31,
Coalition andAir loyalty program
Eliminations ConsolidatedMultiplustransportation
Income from ordinary activities fromexternal customers (*) 9,159,031 454,876 - 9,613,907
3,726,314 454,876 - 4,313,287 - - 4,313,287
8,587,772
4,104,3483,372,799 4,181,190
240,952 - 549,889
67,554 (522,430)
1,110,625
400,568
364,551
Interest income 28,184 50,511
Income from ordinary activities fromtransactions with other operating segments 454,876
27,287 78,695
1,119,430
-
Other operating income
(427,054) - 10,718
-
- (1,001,625)
(416,336)
(341,387)Total net interest expense (365,102) 50,511 -
Interest expense (393,286)
(314,591)
(393,286) -
(399,767) 58,380
Material non-cash items other thandepreciation and amortization (75,479) (145) - (75,624)
(960,328)
9,07810,069 (991)
Depreciation and amortization (994,416) (7,209) -
-
(952,285) (8,043)
Disposal of fixed assets and inventory losses (39,238) - - (39,238) (82,734)(82,734) - - Doubtful accounts (18,272) (144) - (18,416) (30,150)(29,674) (476) - Exchange differences (18,717) (1) - (18,718) 121,651122,129 (478) - Result of indexation units 748 - - 748 311348 (37) -
Income (loss) atributable to owners of the parents (3,482) 158,783 - 155,301 69,220(83,653) 152,873 -
Expenses for income tax (104,376) (69,128) - (173,504) (163,204)(92,476) (70,728) - Segment profit / (loss) 41,931 158,783 - 200,714 110,670(42,203) 152,873 - Assets of segment 17,430,937 1,373,049 (6,014) 18,797,972 19,198,19417,805,749 1,400,432 (7,987)
Amount of non-current asset additions 412,846 - - 412,846 1,481,0901,481,090 - -
Property, plant and equipment 325,513 - - 325,513 1,390,7301,390,730 - - Intangibles other than goodwill 87,333 - - 87,333 90,36090,360 - -
Segment liabilities 14,007,916 563,849 (41,029) 14,530,736 15,012,89014,469,505 572,065 (28,680)
Purchase of non-monetary assetsof segment 490,983 - - 490,983 782,957782,957 - -
(*) The Company does not have any interest revenue that should be recognized as income from ordinary activities by interest.
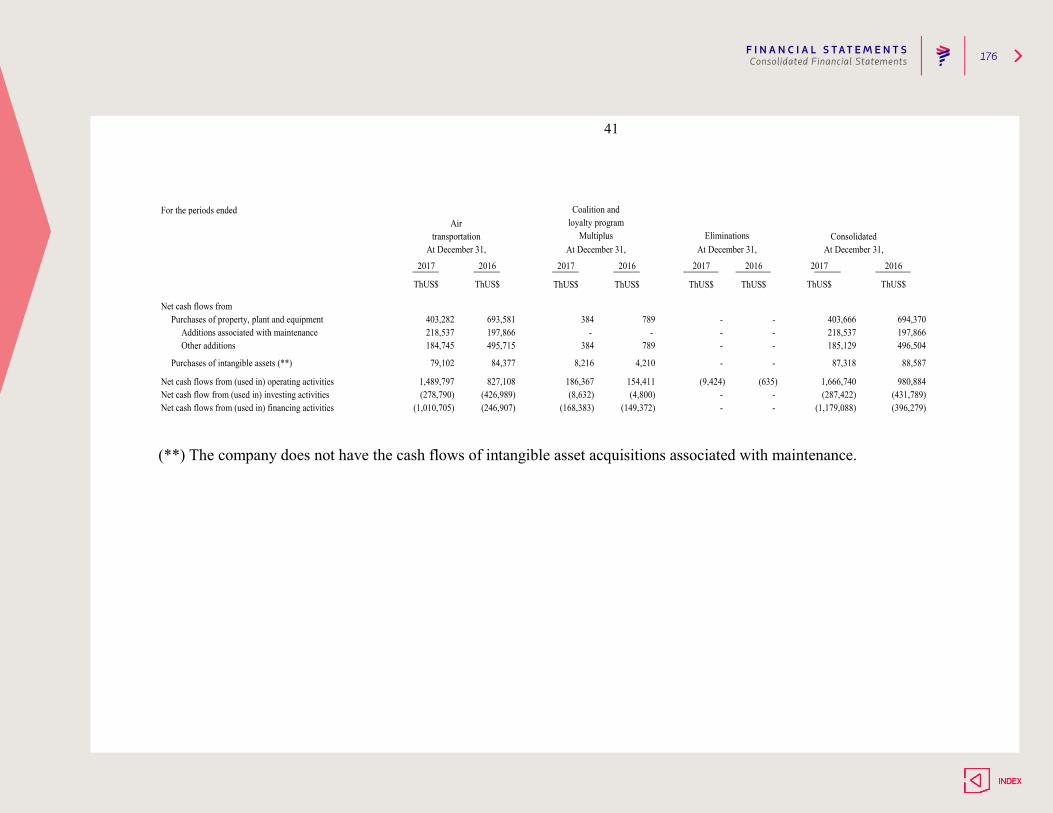
F I N A N C I A L S T AT E M E N T S 176Consolidated Financial Statements
41
For the periods ended
Additions associated with maintenanceOther additions
- - 87,318 88,587Purchases of intangible assets (**) 79,102 84,377 8,216 4,210
980,8841,489,797 827,108 186,367 154,411
(1,179,088) (396,279)Net cash flows from (used in) financing activities (1,010,705) (246,907) (168,383) (149,372) - - - - (287,422) (431,789)Net cash flow from (used in) investing activities (278,790) (426,989)
Net cash flows from (used in) operating activities (9,424) (635) 1,666,740(8,632) (4,800)
218,537 197,866 - - 184,745 495,715 384 789 - -
- - 218,537 197,866185,129 496,504
Net cash flows fromPurchases of property, plant and equipment 403,282 693,581 384 789 - - 403,666 694,370
ThUS$ ThUS$ ThUS$ ThUS$ThUS$ ThUS$ ThUS$ ThUS$
2017 2016 2017 20162017 2016 2017 2016
Eliminations ConsolidatedAt December 31, At December 31, At December 31, At December 31,
Coalition andAir loyalty program
transportation Multiplus
(**) The company does not have the cash flows of intangible asset acquisitions associated with maintenance.
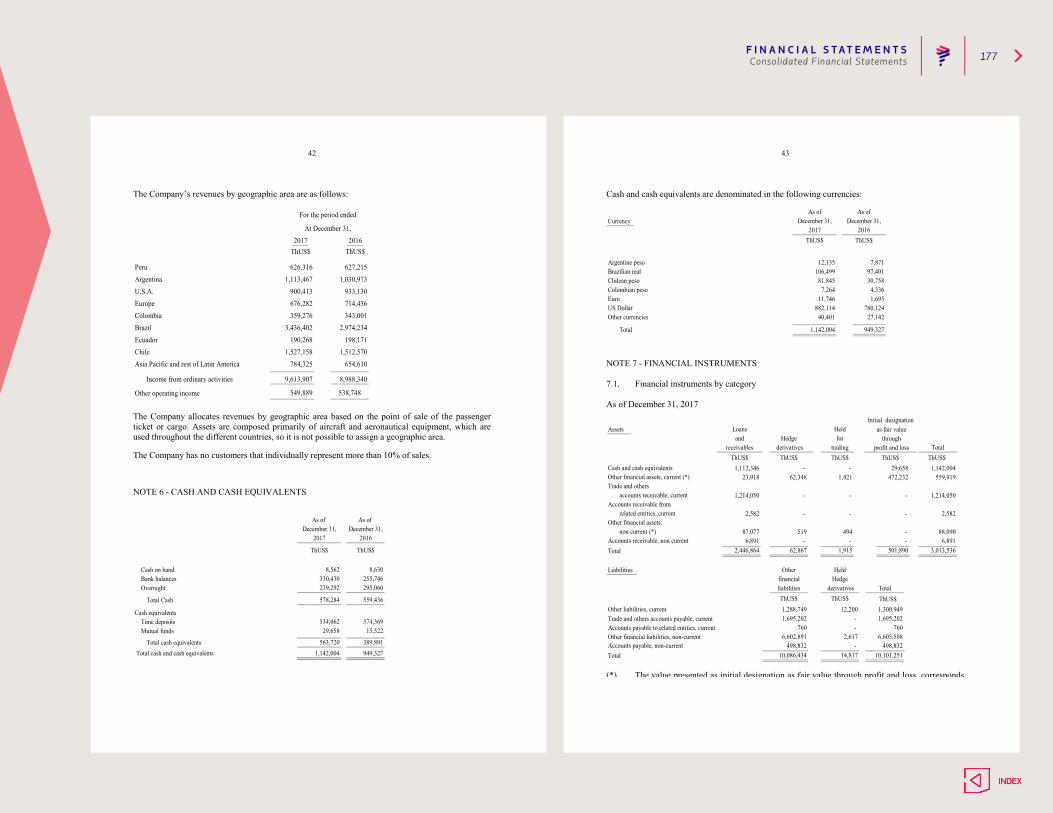
F I N A N C I A L S T AT E M E N T S 177Consolidated Financial Statements
43
Cash and cash equivalents are denominated in the following currencies:
Currency
Total
Colombian peso
US DollarEuro
ThUS$ ThUS$
Argentine peso
Other currencies
Brazilian realChilean peso
12,135106,499
81,845
7,87197,40130,758
27,142
As ofDecember 31,
2017
As ofDecember 31,
2016
949,327
40,401
1,142,004
7,26411,746
882,114
4,3361,695
780,124
NOTE 7 - FINANCIAL INSTRUMENTS 7.1. Financial instruments by category As of December 31, 2017
Trade and others accounts payable, currentAccounts payable to related entities, currentOther financial liabilities, non-current
Assets
Liabilities
Other liabilities, current
Accounts receivable, non currentnon current (*)
Other financial assets,related entities, current
Accounts receivable fromaccounts receivable, current
Trade and others
Cash and cash equivalentsOther financial assets, current (*)
10,086,434 14,817Accounts payable, non-currentTotal
559,919
HeldHedge
2,446,864
derivativesliabilitiesThUS$
1,214,050 1,214,050
3,013,536
Other
Total
financial
ThUS$
6,89188,090
2,582
62,867
1,112,34623,918
2,582
87,0776,891
-
-
519 -
- 62,348
- 1,421
29,658472,232
Initial designation
Hedge derivatives
ThUS$
Loans and
receivablesThUS$
Heldfor
tradingThUS$ ThUS$
as fair value through
profit and loss
1,915 501,890
ThUS$
-
-
494 -
-
-
- -
1,288,7491,695,202
7606,602,891
498,832
12,200 - -
2,617 -
1,300,9491,695,202
7606,605,508
498,83210,101,251
Total
Total
ThUS$1,142,004
(*) The value presented as initial designation as fair value through profit and loss, corresponds mainly to private investment funds; and loans and receivables corresponds to guarantees given.
42
The Company’s revenues by geographic area are as follows:
PeruArgentinaU.S.A.EuropeColombiaBrazilEcuadorChileAsia Pacific and rest of Latin America
Income from ordinary activities
Other operating income
784,325
9,613,907
549,889
654,610
8,988,340
538,748
3,436,402190,268
1,527,158
2,974,234198,171
1,512,570
900,413676,282359,276
933,130714,436343,001
626,3161,113,467
627,2151,030,973
For the period ended
At December 31,2017
ThUS$2016
ThUS$
The Company allocates revenues by geographic area based on the point of sale of the passenger ticket or cargo. Assets are composed primarily of aircraft and aeronautical equipment, which are used throughout the different countries, so it is not possible to assign a geographic area.
The Company has no customers that individually represent more than 10% of sales.
NOTE 6 - CASH AND CASH EQUIVALENTS
Total Cash
Overnight
29,658
Cash equivalents
8,630 Bank balances Cash on hand
Total cash and cash equivalents
Time deposits Mutual funds
Total cash equivalents
15,522
389,891949,327
239,292330,430
578,284
534,062
563,7201,142,004
255,746295,060
559,436
374,369
2016
ThUS$
As of December 31,
ThUS$
8,562
As of December 31,
2017
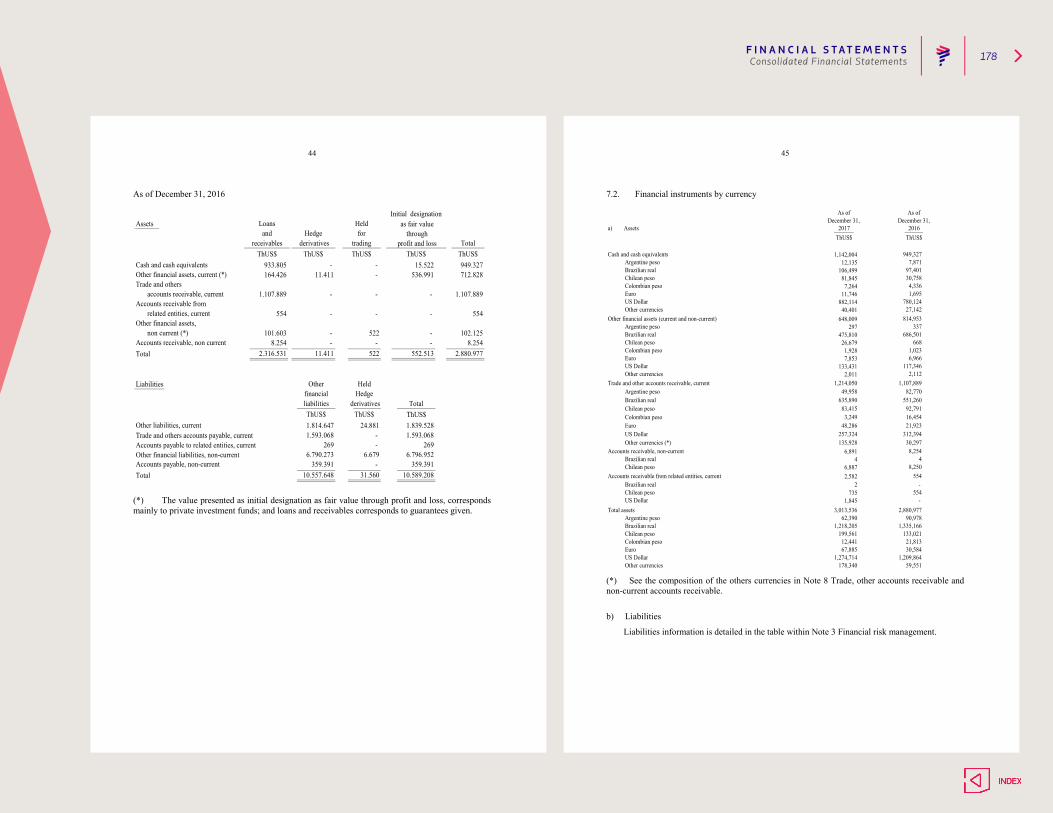
F I N A N C I A L S T AT E M E N T S 178Consolidated Financial Statements
44
As of December 31, 2016
Trade and others accounts payable, currentAccounts payable to related entities, currentOther financial liabilities, non-current
Assets
Liabilities
Other liabilities, current
Accounts receivable, non currentnon current (*)
Other financial assets,related entities, current
Accounts receivable fromaccounts receivable, current
Trade and others
Cash and cash equivalentsOther financial assets, current (*)
2.880.977Total
ThUS$
HeldHedge
derivativesThUS$
8.254102.125
8.254
-
-
- -
10.557.648Accounts payable, non-currentTotal
Otherfinancial
2.316.531
liabilities
1.107.889
TotalThUS$
933.805164.426
554
101.603
712.828
1.107.889
554
949.327 - 11.411
- -
15.522536.991
Initial designationLoans and
receivablesThUS$ ThUS$
Heldfor
tradingThUS$
Hedge derivatives
ThUS$
as fair value through
profit and loss
11.411 522 552.513
-
-
522 -
-
-
- -
1.814.6471.593.068
2696.790.273
359.391
24.881 - -
6.679 -
TotalThUS$
31.560
1.839.5281.593.068
2696.796.952
359.39110.589.208
(*) The value presented as initial designation as fair value through profit and loss, corresponds mainly to private investment funds; and loans and receivables corresponds to guarantees given.
45
7.2. Financial instruments by currency
178,340
1,8453,013,536
62,3901,218,205
199,56112,441
6,8914
6,8872,582
67,8851,274,714
7352
2,0111,214,050
49,958635,890
83,415
686,501668
1,0236,966
117,3462,112
1,107,88982,770
551,26092,791
40,401648,009
297475,810
26,6791,9287,853
133,431
21,923312,394
30,297
3,24948,286
257,324135,928
16,454
59,551
8,2544
8,250554
554 -
21,81330,584
1,209,864
2,880,97790,978
1,335,166133,021
-
Other financial assets (current and non-current)
Colombian pesoEuro
Argentine peso
Other currencies
949,3277,871
97,40130,758
4,3361,695
780,12427,142
814,953337
1,142,00412,135
106,49981,845
7,26411,746
882,114
Brazilian real
US DollarEuroColombian peso
Other currencies (*)
Chilean peso
Argentine peso
Chilean peso
EuroUS Dollar
Colombian peso
Brazilian real
Other currenciesTrade and other accounts receivable, current
a) AssetsThUS$
Cash and cash equivalentsArgentine peso
As of December 31,
US Dollar
Brazilian realChilean peso
2016
As of December 31,
2017ThUS$
US DollarOther currencies
Colombian pesoEuro
Brazilian realChilean peso
Total assetsArgentine peso
Accounts receivable from related entities, current
Accounts receivable, non-currentBrazilian realChilean peso
Chilean pesoUS Dollar
Brazilian real
(*) See the composition of the others currencies in Note 8 Trade, other accounts receivable and non-current accounts receivable.
b) Liabilities
Liabilities information is detailed in the table within Note 3 Financial risk management.
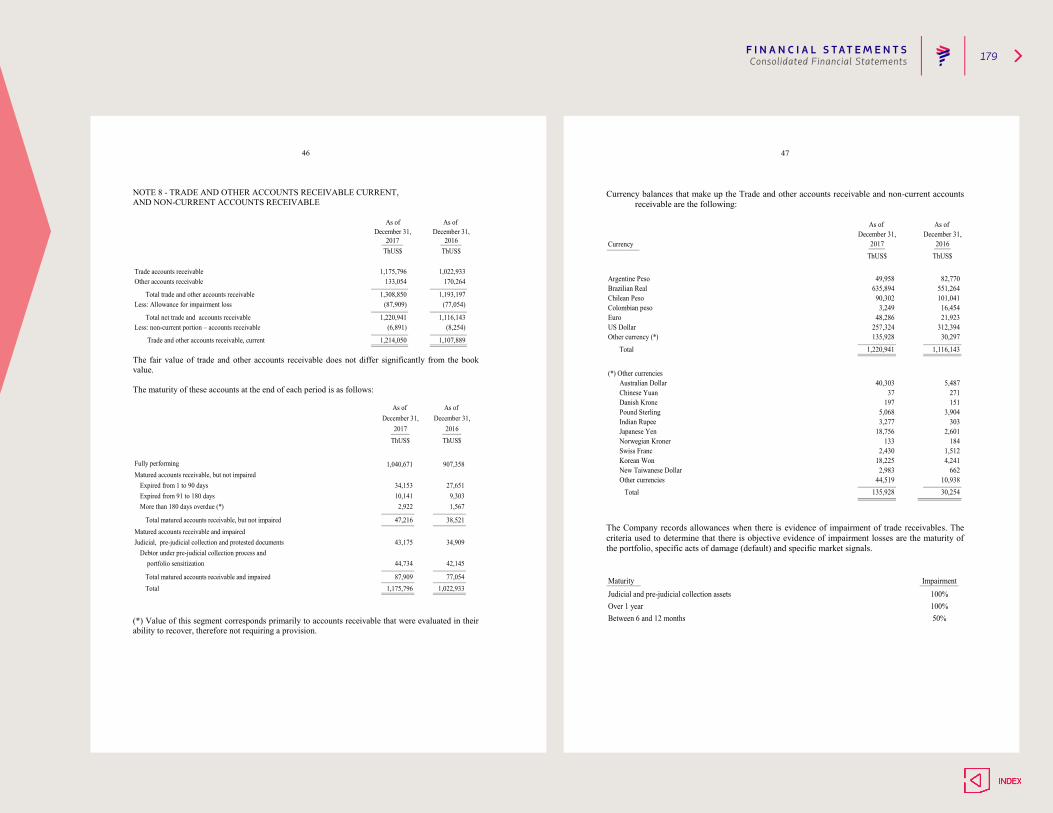
F I N A N C I A L S T AT E M E N T S 179Consolidated Financial Statements
46
NOTE 8 - TRADE AND OTHER ACCOUNTS RECEIVABLE CURRENT, AND NON-CURRENT ACCOUNTS RECEIVABLE
2016
As ofDecember 31,
Other accounts receivable
ThUS$
Trade accounts receivable
December 31,As of
170,2641,022,9331,175,796
133,054
2017ThUS$
Total trade and other accounts receivable 1,193,197Less: Allowance for impairment loss (77,054)
1,308,850(87,909)
1,220,941(6,891)
1,214,050 Trade and other accounts receivable, current 1,107,889
Total net trade and accounts receivable 1,116,143Less: non-current portion – accounts receivable (8,254)
The fair value of trade and other accounts receivable does not differ significantly from the book value. The maturity of these accounts at the end of each period is as follows:
Total 1,175,796 1,022,933
47,216 38,521Total matured accounts receivable, but not impaired
Total matured accounts receivable and impaired
Judicial, pre-judicial collection and protested documents
portfolio sensitization
34,909
42,145
77,054
Debtor under pre-judicial collection process and44,734
87,909
Fully performing
Expired from 1 to 90 days
907,358
27,651
1,040,671
34,153Matured accounts receivable, but not impaired
Matured accounts receivable and impaired
Expired from 91 to 180 daysMore than 180 days overdue (*)
9,3031,567
10,1412,922
As of As of December 31,December 31,
43,175
20162017ThUS$ThUS$
(*) Value of this segment corresponds primarily to accounts receivable that were evaluated in their ability to recover, therefore not requiring a provision.
47
Currency balances that make up the Trade and other accounts receivable and non-current accounts receivable are the following:
Total
635,89490,302
As of As of December 31,December 31,
ThUS$ThUS$
551,264
30,297
2016
101,04116,45421,923
312,394
1841,5124,241
Argentine Peso
Euro
Chilean Peso
US Dollar
Brazilian Real
Other currency (*)
1,220,941
3,24948,286
257,324
82,770
135,928
Indian RupeeJapanese YenNorwegian KronerSwiss FrancKorean Won
(*) Other currenciesAustralian DollarChinese YuanDanish Krone Pound Sterling
1,116,143
135,928
18,756133
2,43018,225
2,983 662
5,487271151
3,904303
10,93830,254
2,601
Other currenciesNew Taiwanese Dollar
2017
44,519
40,30337
1975,0683,277
Total
Colombian peso
Currency
49,958
The Company records allowances when there is evidence of impairment of trade receivables. The criteria used to determine that there is objective evidence of impairment losses are the maturity of the portfolio, specific acts of damage (default) and specific market signals.
Impairment100%100%50%
Judicial and pre-judicial collection assetsOver 1 yearBetween 6 and 12 months
Maturity

F I N A N C I A L S T AT E M E N T S 180Consolidated Financial Statements
48
Movement in the allowance for impairment loss of Trade and other accounts receivables are the following:
(87,909)From January 1 to December 31, 2017 (77,054)20,9108,249
(60,072)From January 1 to December 31, 2016 (77,054)(37,892)(19,104)
Closing
Periodsbalance balanceOpening
Write-offsThUS$ThUS$ ThUS$
(Increase)DecreaseThUS$
Once pre-judicial and judicial collection efforts are exhausted, the assets are written off against the allowance. The Company only uses the allowance method rather than direct write-off, to ensure control. Historic and current re-negotiations are not relevant and the policy is to analyze case by case in order to classify them according to the existence of risk, determining whether it is appropriate to re-classify accounts to pre-judicial recovery. If such re-classification is justified, an allowance is made for the account, whether overdue or falling due. The maximum credit-risk exposure at the date of presentation of the information is the fair value of each one of the categories of accounts receivable indicated above.
balanceThUS$ ThUS$
exposureThUS$
concentrationsThUS$
balance concentrationsThUS$
exposureThUS$
Gross Exposure net Gross exposureaccording to
As of December 31, 2016
impaired of risk
As of December 31, 2017
according toGross exposure
of riskImpairedGross Exposure net
(77,054)
170,264 -
945,879
receivable
Trade accounts receivable Other accounts
1,175,796
133,054 170,264
1,087,887
133,054
(87,909)
-
1,022,933
There are no relevant guarantees covering credit risk and these are valued when they are settled; no materially significant direct guarantees exist. Existing guarantees, if appropriate, are made through IATA.
49
NOTE 9 - ACCOUNTS RECEIVABLE FROM/PAYABLE TO RELATED ENTITIES (a) Accounts Receivable
Tax No.
Qatar Airways
TAM Aviação Executiva e Taxi Aéreo S.A.
Ltda. y CPA. CLP 2
Total current assets
96.810.370-9 Inversiones Costa Verde
2,582 554
2
Currency
87.752.000-5 Granja Marina Tornagaleones S.A. Common shareholder CLP
Foreign
Country
QatarIndirect shareholder
Related party Relationship
Chile
of origin
78.591.370-1Foreign
As of December 31,
2017
ThUS$
December 31,2016
ThUS$
As of
-
Related director Chile
1,845
5
728Bethia S.A. and Subsidiaries Related director Chile CLPThU$
14
538
Related director Brazil BRL 2 -
(b) Accounts payable
Tax No. Currency
Related directorRelated directorRelated directorRelated director
Related company México MXN
Related directorCommon property
46
28
1326
2016
ThUS$
December 31, Country December 31, As of As of
of origin
78.997.060-2 Viajes Falabella Ltda.
2017Related party Relationship
ThUS$
Chile CLP 534
Foreign Inversora Aeronáutica Argentina S.A.
Foreign Consultoría Administrativa Profesional S.A. de C.V.
Comunidad Mujer Chile
Chile79.773.440-3
170
4
Foreign
CLP -
210
BRL
Total current liabilities 269
-
Transportes San Felipe S.A
760
- Brazile Taxi Aéreo S.A.
TAM Aviação Executiva
Argentina78.591.370-1 Bethia S.A. and Subsidiaries
65.216.000-K
12
CLP
Chile CLP4ThUS$
Transactions between related parties have been carried out on free-trade conditions between interested and duly-informed parties. The transaction times are between 30 and 45 days, and the nature of settlement of the transactions is monetary.
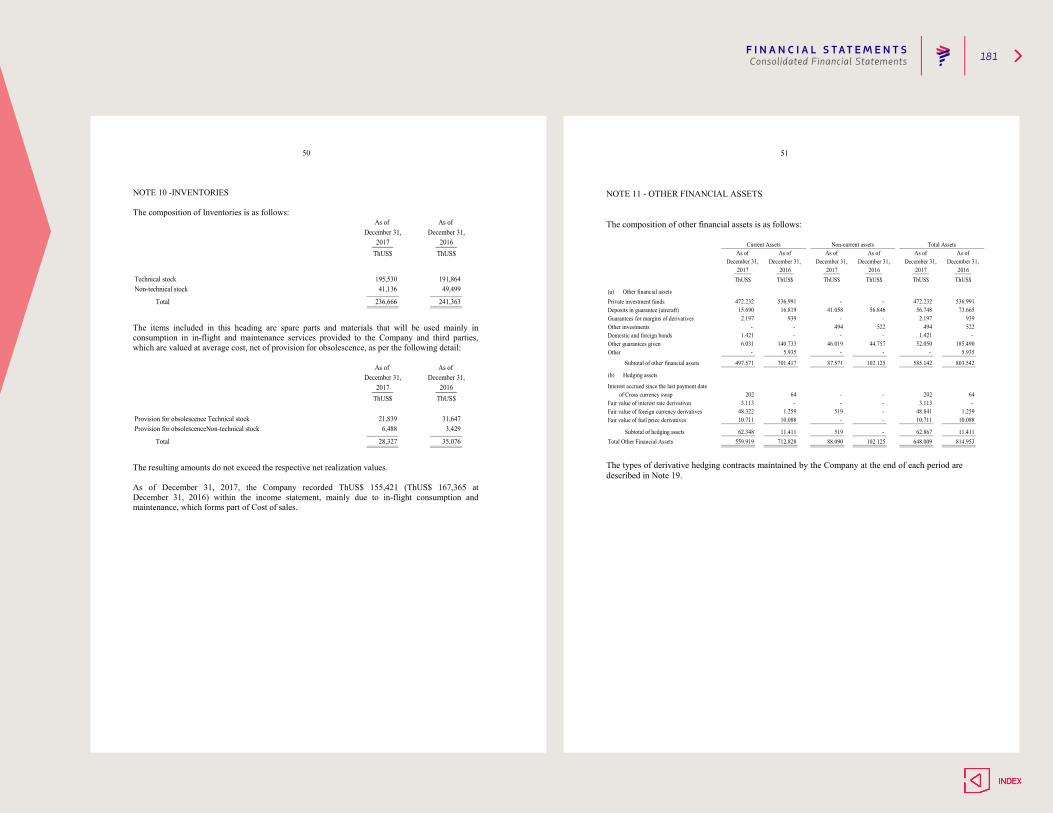
F I N A N C I A L S T AT E M E N T S 181Consolidated Financial Statements
50
NOTE 10 -INVENTORIES The composition of Inventories is as follows:
Technical stockNon-technical stock
Total
As of As of December 31, December 31,
2017 2016
41,136
236,666
49,499
241,363
ThUS$ ThUS$
195,530 191,864
The items included in this heading are spare parts and materials that will be used mainly in consumption in in-flight and maintenance services provided to the Company and third parties, which are valued at average cost, net of provision for obsolescence, as per the following detail:
Provision for obsolescence Technical stockProvision for obsolescenceNon-technical stock
Total
6,488
28,327
3,429
35,076
ThUS$ ThUS$
21,839 31,647
As of As of December 31, December 31,
2017 2016
The resulting amounts do not exceed the respective net realization values. As of December 31, 2017, the Company recorded ThUS$ 155,421 (ThUS$ 167,365 at December 31, 2016) within the income statement, mainly due to in-flight consumption and maintenance, which forms part of Cost of sales.
51
NOTE 11 - OTHER FINANCIAL ASSETS The composition of other financial assets is as follows:
Private investment fundsDeposits in guarantee (aircraft)Guarantees for margins of derivativesOther investments Domestic and foreign bondsOther guarantees givenOther
Interest accrued since the last payment date of Cross currency swap
Fair value of interest rate derivativesFair value of foreign currency derivatives Fair value of fuel price derivatives
Total Other Financial Assets 559.919 712.828 88.090 102.125 648.009 814.95311.411Subtotal of hedging assets 62.348 11.411 519 - 62.867
10.711 10.088 - - 10.711 10.08848.322 1.259 519 - 48.841 1.259
3.113 - - - 3.113 - 202 64 - - 202 64
803.542
(b) Hedging assets
Subtotal of other financial assets 497.571 701.417 87.571 102.125 585.142
- - 494 522 494 522
- 5.935 - - - 5.935
1.421 - - - 1.421 - 6.031 140.733 46.019 44.757 52.050 185.490
2.197 939 - - 2.197 939
(a) Other financial assets
15.690 16.819 41.058 56.846 56.748 73.665472.232 536.991 - - 472.232 536.991
ThUS$ ThUS$ ThUS$ ThUS$ ThUS$ ThUS$2017 2016 2017 2016 2017 2016
December 31, December 31, December 31, December 31, December 31, December 31,
Current Assets Non-current assets Total AssetsAs of As of As of As of As of As of
The types of derivative hedging contracts maintained by the Company at the end of each period are described in Note 19.
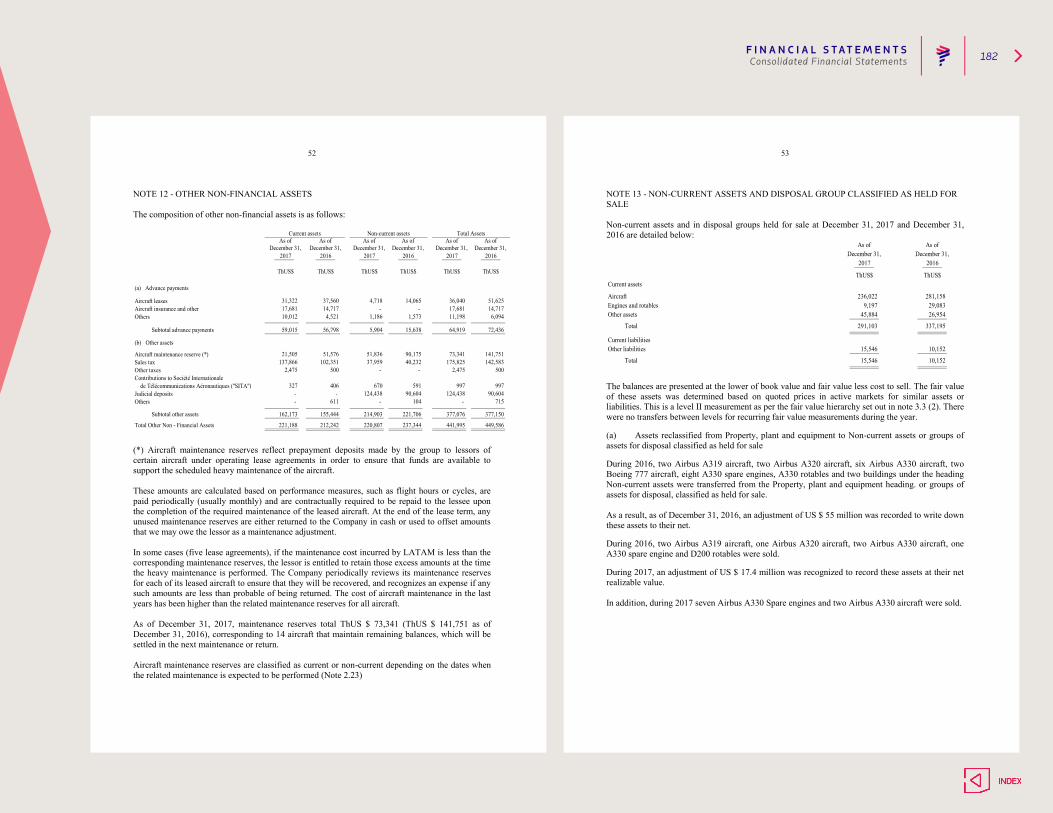
F I N A N C I A L S T AT E M E N T S 182Consolidated Financial Statements
52
NOTE 12 - OTHER NON-FINANCIAL ASSETS The composition of other non-financial assets is as follows:
Aircraft leasesAircraft insurance and otherOthers
Aircraft maintenance reserve (*)Sales taxOther taxesContributions to Société Internationale
de Télécommunications Aéronautiques ("SITA")Judicial depositsOthers
Total Other Non - Financial Assets
377,076 377,150
221,188 212,242 220,807 237,344 441,995 449,586
997 - - 124,438 90,604 124,438 90,604
327 406 670 591 997
142,583
Subtotal other assets 162,173 155,444 214,903 221,706
715 - 611 - 104 -
2,475 500 - - 2,475 500137,866 102,351 37,959 40,232 175,825
21,505 51,576 51,836 90,175 73,341 141,751
5,904 15,638 64,919 72,436
(b) Other assets
11,198 6,09410,012 4,521 1,186 1,573
Subtotal advance payments 59,015 56,798
51,62517,681 14,717 - - 17,681 14,71731,322 37,560 4,718 14,065 36,040
ThUS$ ThUS$ ThUS$ ThUS$ ThUS$
(a) Advance payments
December 31,2016
Current assets Non-current assets Total AssetsAs of As of As of As of As of As of
2017 2016 2017 2016 2017December 31, December 31, December 31, December 31, December 31,
ThUS$
(*) Aircraft maintenance reserves reflect prepayment deposits made by the group to lessors of certain aircraft under operating lease agreements in order to ensure that funds are available to support the scheduled heavy maintenance of the aircraft. These amounts are calculated based on performance measures, such as flight hours or cycles, are paid periodically (usually monthly) and are contractually required to be repaid to the lessee upon the completion of the required maintenance of the leased aircraft. At the end of the lease term, any unused maintenance reserves are either returned to the Company in cash or used to offset amounts that we may owe the lessor as a maintenance adjustment. In some cases (five lease agreements), if the maintenance cost incurred by LATAM is less than the corresponding maintenance reserves, the lessor is entitled to retain those excess amounts at the time the heavy maintenance is performed. The Company periodically reviews its maintenance reserves for each of its leased aircraft to ensure that they will be recovered, and recognizes an expense if any such amounts are less than probable of being returned. The cost of aircraft maintenance in the last years has been higher than the related maintenance reserves for all aircraft. As of December 31, 2017, maintenance reserves total ThUS $ 73,341 (ThUS $ 141,751 as of December 31, 2016), corresponding to 14 aircraft that maintain remaining balances, which will be settled in the next maintenance or return. Aircraft maintenance reserves are classified as current or non-current depending on the dates when the related maintenance is expected to be performed (Note 2.23)
53
NOTE 13 - NON-CURRENT ASSETS AND DISPOSAL GROUP CLASSIFIED AS HELD FOR SALE Non-current assets and in disposal groups held for sale at December 31, 2017 and December 31, 2016 are detailed below:
Current assets
Current liabilities
10,152
15,546
Engines and rotablesAircraft
Total 291,103
Total
Other assets 45,884
Other liabilities
15,546
26,954
2016
As ofDecember 31,
As ofDecember 31,
2017
10,152
337,195
ThUS$
281,15829,083
ThUS$
9,197236,022
The balances are presented at the lower of book value and fair value less cost to sell. The fair value of these assets was determined based on quoted prices in active markets for similar assets or liabilities. This is a level II measurement as per the fair value hierarchy set out in note 3.3 (2). There were no transfers between levels for recurring fair value measurements during the year.
(a) Assets reclassified from Property, plant and equipment to Non-current assets or groups of assets for disposal classified as held for sale
During 2016, two Airbus A319 aircraft, two Airbus A320 aircraft, six Airbus A330 aircraft, two Boeing 777 aircraft, eight A330 spare engines, A330 rotables and two buildings under the heading Non-current assets were transferred from the Property, plant and equipment heading. or groups of assets for disposal, classified as held for sale. As a result, as of December 31, 2016, an adjustment of US $ 55 million was recorded to write down these assets to their net.
During 2016, two Airbus A319 aircraft, one Airbus A320 aircraft, two Airbus A330 aircraft, one A330 spare engine and D200 rotables were sold.
During 2017, an adjustment of US $ 17.4 million was recognized to record these assets at their net realizable value. In addition, during 2017 seven Airbus A330 Spare engines and two Airbus A330 aircraft were sold.
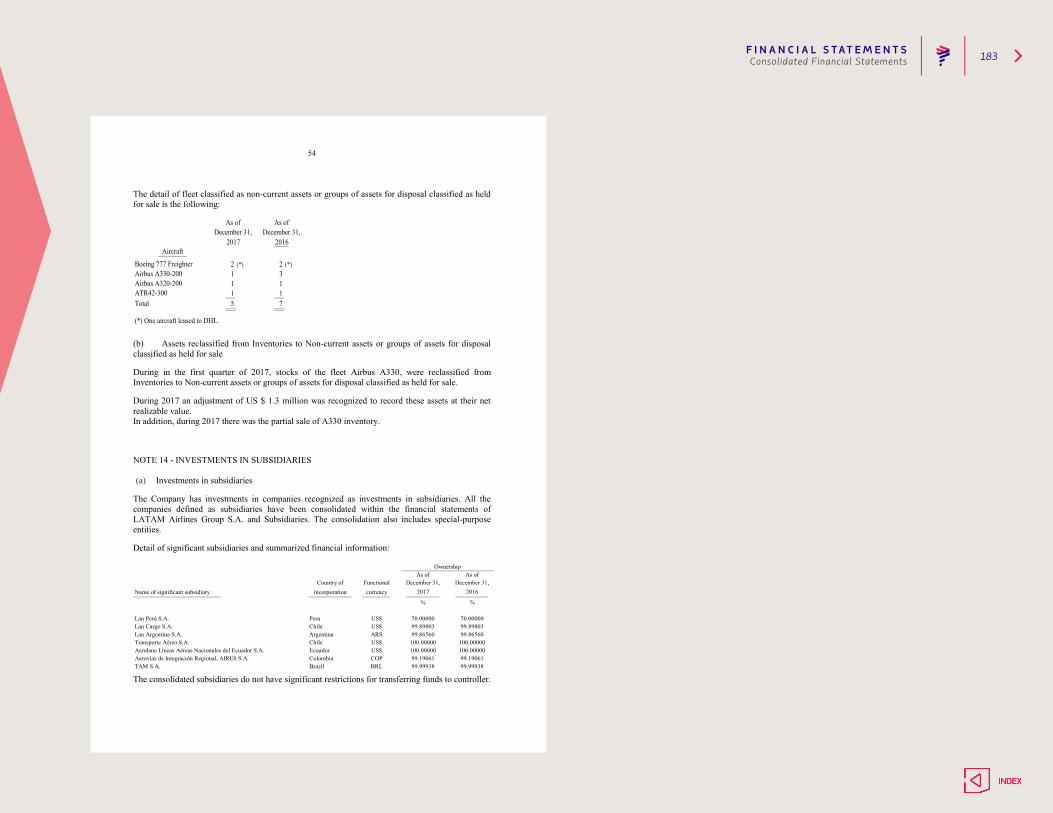
F I N A N C I A L S T AT E M E N T S 183Consolidated Financial Statements
54
The detail of fleet classified as non-current assets or groups of assets for disposal classified as held for sale is the following:
(*) (*)
(*) One aircraft leased to DHL.
Total 5 7
3Airbus A330-200 1
1ATR42-300 1Airbus A320-200 1 1
Aircraft
As of
2
As of
2017 2016December 31, December 31,
Boeing 777 Freighter 2
(b) Assets reclassified from Inventories to Non-current assets or groups of assets for disposal classified as held for sale
During in the first quarter of 2017, stocks of the fleet Airbus A330, were reclassified from Inventories to Non-current assets or groups of assets for disposal classified as held for sale.
During 2017 an adjustment of US $ 1.3 million was recognized to record these assets at their net realizable value. In addition, during 2017 there was the partial sale of A330 inventory.
NOTE 14 - INVESTMENTS IN SUBSIDIARIES (a) Investments in subsidiaries
The Company has investments in companies recognized as investments in subsidiaries. All the companies defined as subsidiaries have been consolidated within the financial statements of LATAM Airlines Group S.A. and Subsidiaries. The consolidation also includes special-purpose entities.
Detail of significant subsidiaries and summarized financial information:
Name of significant subsidiary incorporation currency
Aerovías de Integración Regional, AIRES S.A. COPTAM S.A.
ColombiaBRLBrazil
Lan Argentina S.A.Transporte Aéreo S.A.Aerolane Líneas Aéreas Nacionales del Ecuador S.A.
ARSArgentinaChileEcuador
US$US$
Lan Cargo S.A.
Country of
US$US$
PeruChile
Functional December 31,
70.0000070.00000Lan Perú S.A.
% %
OwnershipAs of
2016
As of
2017December 31,
99.1906199.99938
99.8980399.8980399.86560
100.00000100.00000
99.99938
99.86560100.00000100.0000099.19061
The consolidated subsidiaries do not have significant restrictions for transferring funds to controller.
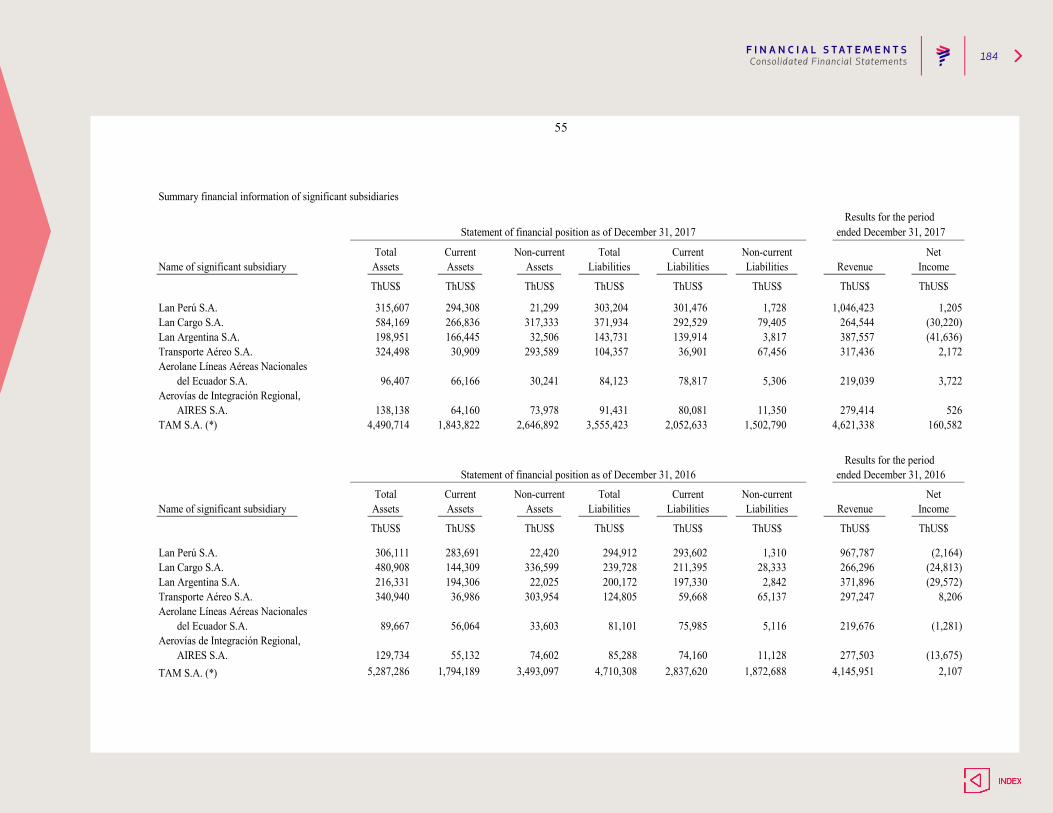
F I N A N C I A L S T AT E M E N T S 184Consolidated Financial Statements
55
(13,675)TAM S.A. (*) 5,287,286 1,794,189 3,493,097 2,837,620 1,872,688 4,145,951 2,107
85,2884,710,308
Aerovías de Integración Regional, AIRES S.A. 129,734 55,132 74,602 74,160 11,128 277,503
Aerolane Líneas Aéreas Nacionalesdel Ecuador S.A. 89,667 56,064 33,603 75,985 5,116 219,676 (1,281)81,101
294,912239,728
371,896 (29,572)Transporte Aéreo S.A. 340,940 36,986 303,954 59,668 65,137 297,247 8,206
200,172124,805
Summary financial information of significant subsidiaries
Aerovías de Integración Regional,
Lan Perú S.A.
del Ecuador S.A.
ThUS$
Results for the period
CurrentAssets
Non-current
64,160 73,978 80,081 11,350 279,414 5264,621,338 160,582
Name of significant subsidiary Assets LiabilitiesNon-current
AssetsTotal
ThUS$ ThUS$
ThUS$
Statement of financial position as of December 31, 2016 ended December 31, 2016
ThUS$
TotalLiabilities
ThUS$
CurrentLiabilities
ThUS$ ThUS$ ThUS$
Revenue Net
Income
ThUS$ ThUS$
1,046,423 1,205
Results for the periodStatement of financial position as of December 31, 2017 ended December 31, 2017
Name of significant subsidiary Total Current Non-current Total Current Non-current Net
Assets Assets Assets Liabilities Liabilities Liabilities Revenue Income
ThUS$ThUS$ ThUS$ ThUS$ ThUS$
Lan Cargo S.A. 584,169 266,836 317,333 292,529 79,405371,934315,607 294,308 21,299 301,476 1,728303,204
2,172104,357
264,544 (30,220)Lan Argentina S.A. 198,951 166,445 32,506 139,914 3,817 387,557 (41,636)143,731
91,4313,555,423
Transporte Aéreo S.A. 324,498 30,909 293,589 36,901 67,456 317,436Aerolane Líneas Aéreas Nacionales
AIRES S.A. 138,138TAM S.A. (*) 4,490,714 1,843,822 2,646,892 2,052,633 1,502,790
96,407 66,166 30,241 78,817 5,306 219,039 3,72284,123
Lan Perú S.A. 306,111 283,691 22,420 293,602 1,310
Lan Argentina S.A. 216,331 194,306 22,025 197,330 2,842
967,787 (2,164)Lan Cargo S.A. 480,908 144,309 336,599 211,395 28,333 266,296 (24,813)
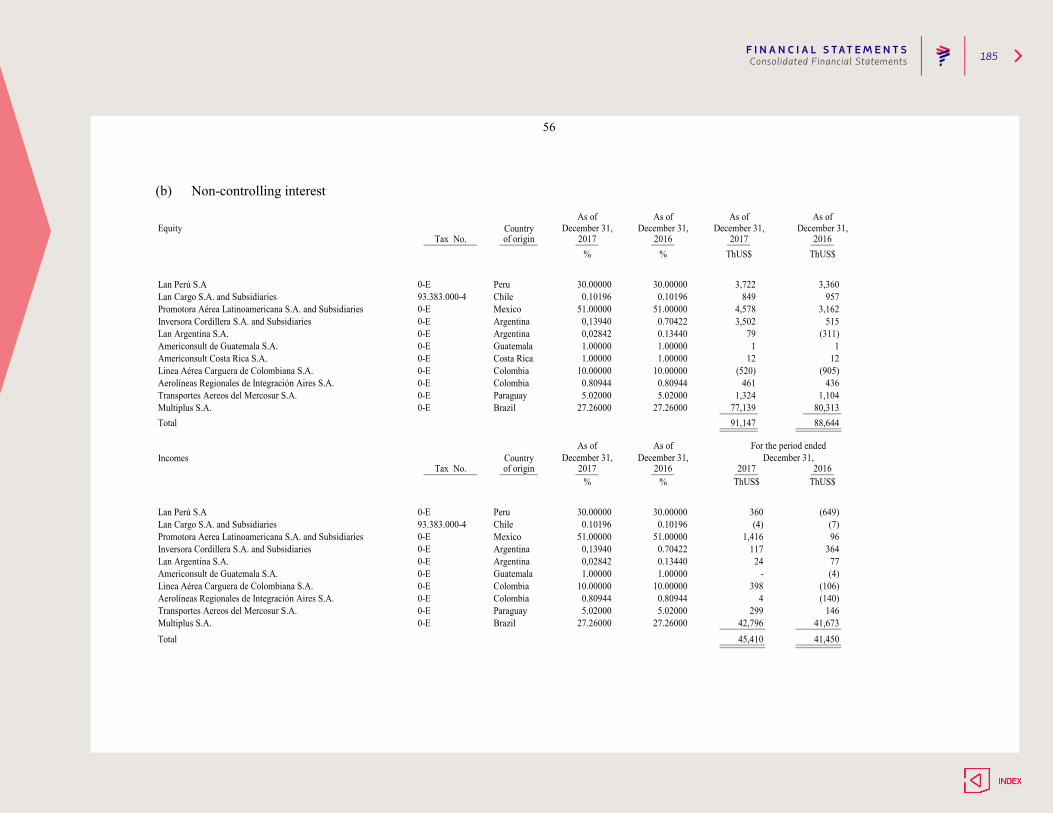
F I N A N C I A L S T AT E M E N T S 185Consolidated Financial Statements
56
(b) Non-controlling interest
27.26000
2016ThUS$
(649)(7)96
36477(4)
(106)(140)
14641,67341,450
0.1019651.00000
515
3,722
CountryAs of
1
December 31, December 31, December 31,2016 2017
December 31,2016
ThUS$
Lan Cargo S.A. and Subsidiaries 93.383.000-4 Chile 0.10196 0.10196 8493,360
957
As of As of As of
Lan Perú S.A 0-E Peru 30.00000 30.00000
% % ThUS$Tax No. of origin 2017
Equity
3,162Promotora Aérea Latinoamericana S.A. and Subsidiaries 0-E Mexico 51.00000 51.00000 4,578Inversora Cordillera S.A. and Subsidiaries 0-E Argentina 0,13940 0.70422 3,502Lan Argentina S.A. 0-E Argentina 0,02842 0.13440 79 (311)Americonsult de Guatemala S.A. 0-E Guatemala 1.00000 1.00000 1Americonsult Costa Rica S.A. 0-E Costa Rica 1.00000 1.00000 12Linea Aérea Carguera de Colombiana S.A. 0-E Colombia 10.00000 10.00000 (520)
12(905)
Transportes Aereos del Mercosur S.A. 0-E Paraguay 5.02000 5.02000 1,324Aerolíneas Regionales de Integración Aires S.A. 0-E Colombia 0.80944 0.80944 461 436
1,104Multiplus S.A. 0-E Brazil 27.26000 27.26000 77,139 80,313Total 91,147 88,644
As of For the period endedIncomes December 31, December 31,Country
As ofDecember 31,
Tax No. of origin 2017 2017
360Lan Perú S.A 0-E Peru 30.00000
% ThUS$2016
%
30.00000
Promotora Aerea Latinoamericana S.A. and Subsidiaries 0-E Mexico 51.00000 1,416Lan Cargo S.A. and Subsidiaries 93.383.000-4 Chile 0.10196 (4)
Lan Argentina S.A. 0-E Argentina 0,02842 24Inversora Cordillera S.A. and Subsidiaries 0-E Argentina 0,13940 117
0.134400.70422
Americonsult de Guatemala S.A. 0-E Guatemala 1.00000 -1.00000
Transportes Aereos del Mercosur S.A. 0-E Paraguay0.809445.02000
Linea Aérea Carguera de Colombiana S.A. 0-E Colombia 10.00000 39810.00000
Total 45,410Multiplus S.A. 0-E Brazil 27.26000 42,796
5.02000 299Aerolíneas Regionales de Integración Aires S.A. 0-E Colombia 0.80944 4
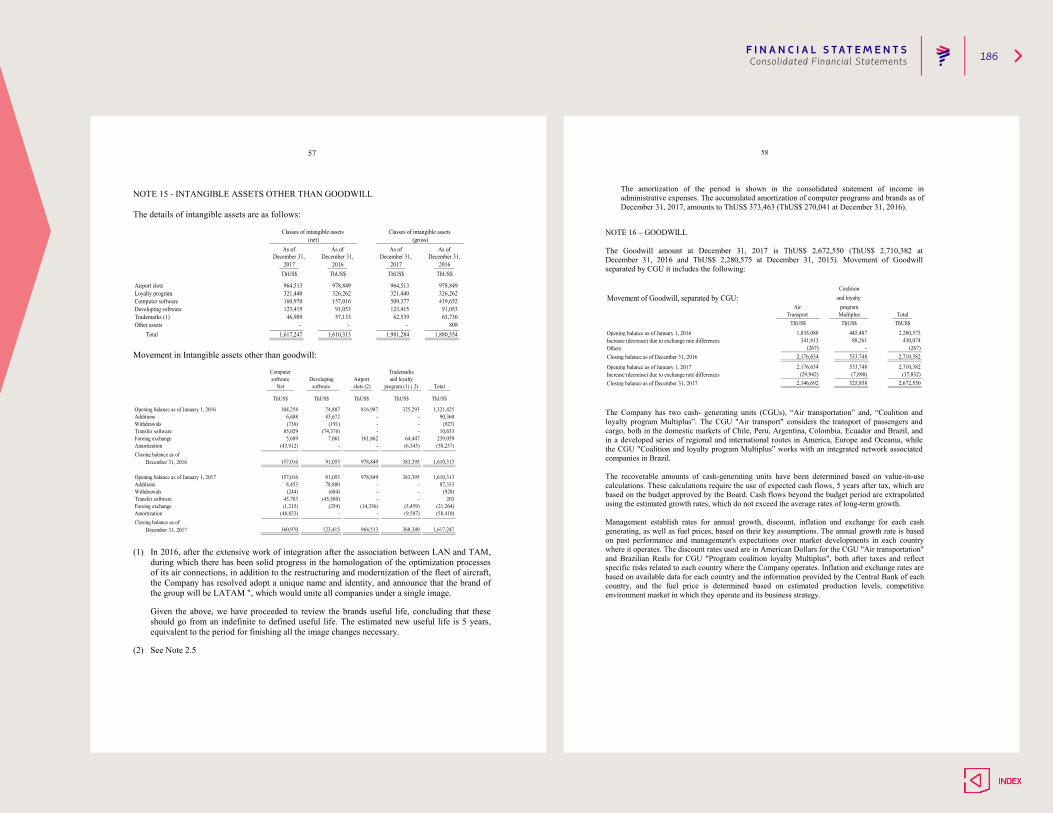
F I N A N C I A L S T AT E M E N T S 186Consolidated Financial Statements
57
NOTE 15 - INTANGIBLE ASSETS OTHER THAN GOODWILL The details of intangible assets are as follows:
Classes of intangible assets Classes of intangible assets (net) (gross)
As of As of As of As ofDecember 31, December 31, December 31, December 31,
2017 2016 2017 2016ThUS$ ThUS$ ThUS$ ThUS$
Computer software 160,970 157,016 509,377 419,652Developing software 123,415 91,053 123,415 91,053
Airport slots 964,513 978,849 964,513 978,849Loyalty program 321,440 326,262 321,440 326,262
Trademarks (1) 46,909 57,133 62,539 63,730
1,880,354Other assets - - - 808
Total 1,617,247 1,610,313 1,981,284 Movement in Intangible assets other than goodwill:
Closing balance as ofDecember 31, 2016
Closing balance as ofDecember 31, 2017
Amortization (48,823) - - (9,587) (58,410)
160,970 123,415 964,513 368,349 1,617,247
(928)Transfer software 45,783 (45,580) - - 203
(5,459) (21,264)Foreing exchange (1,215) (254) (14,336)
Withdrawals (244) (684) - -
Additions 6,688 83,672 - -
Foreing exchange 5,689 7,061 161,862 64,447
1,610,313Additions 8,453 78,880 - - 87,333Opening balance as of January 1, 2017 157,016 91,053 978,849 383,395
ThUS$
softwareAirport
slots (2)
ThUS$
and loyaltyDevelopingprogram (1) ( 2)
ThUS$ ThUS$
Total
Trademarks
Opening balance as of January 1, 2016 104,258 74,887 816,987 325,293 1,321,425
Computersoftware
Net
ThUS$
90,360Withdrawals (736) (191) - - (927)Transfer software 85,029 (74,376) - - 10,653
239,059Amortization (43,912) - - (6,345) (50,257)
157,016 91,053 978,849 383,395 1,610,313
(1) In 2016, after the extensive work of integration after the association between LAN and TAM,
during which there has been solid progress in the homologation of the optimization processes of its air connections, in addition to the restructuring and modernization of the fleet of aircraft, the Company has resolved adopt a unique name and identity, and announce that the brand of the group will be LATAM ", which would unite all companies under a single image.
Given the above, we have proceeded to review the brands useful life, concluding that these should go from an indefinite to defined useful life. The estimated new useful life is 5 years, equivalent to the period for finishing all the image changes necessary.
(2) See Note 2.5
58
The amortization of the period is shown in the consolidated statement of income in administrative expenses. The accumulated amortization of computer programs and brands as of December 31, 2017, amounts to ThUS$ 373,463 (ThUS$ 270,041 at December 31, 2016).
NOTE 16 – GOODWILL The Goodwill amount at December 31, 2017 is ThUS$ 2,672,550 (ThUS$ 2,710,382 at December 31, 2016 and ThUS$ 2,280,575 at December 31, 2015). Movement of Goodwill separated by CGU it includes the following:
Movement of Goodwill, separated by CGU:
Opening balance as of January 1, 2016Increase (decrease) due to exchange rate differencesOthersClosing balance as of December 31, 2016 Opening balance as of January 1, 2017Increase (decrease) due to exchange rate differencesClosing balance as of December 31, 2017
2,176,634 533,748 2,710,382
(29,942) (7,890) (37,832)2,710,3822,176,634 533,748
1,835,088 445,487 2,280,575
Coalition
programand loyalty
Air
341,813 88,261 430,074(267) - (267)
2,146,692 525,858 2,672,550
Transport Multiplus TotalThUS$ThUS$ ThUS$
The Company has two cash- generating units (CGUs), “Air transportation” and, “Coalition and loyalty program Multiplus”. The CGU "Air transport" considers the transport of passengers and cargo, both in the domestic markets of Chile, Peru, Argentina, Colombia, Ecuador and Brazil, and in a developed series of regional and international routes in America, Europe and Oceania, while the CGU "Coalition and loyalty program Multiplus” works with an integrated network associated companies in Brazil. The recoverable amounts of cash-generating units have been determined based on value-in-use calculations. These calculations require the use of expected cash flows, 5 years after tax, which are based on the budget approved by the Board. Cash flows beyond the budget period are extrapolated using the estimated growth rates, which do not exceed the average rates of long-term growth. Management establish rates for annual growth, discount, inflation and exchange for each cash generating, as well as fuel prices, based on their key assumptions. The annual growth rate is based on past performance and management's expectations over market developments in each country where it operates. The discount rates used are in American Dollars for the CGU "Air transportation" and Brazilian Reals for CGU "Program coalition loyalty Multiplus", both after taxes and reflect specific risks related to each country where the Company operates. Inflation and exchange rates are based on available data for each country and the information provided by the Central Bank of each country, and the fuel price is determined based on estimated production levels, competitive environment market in which they operate and its business strategy.
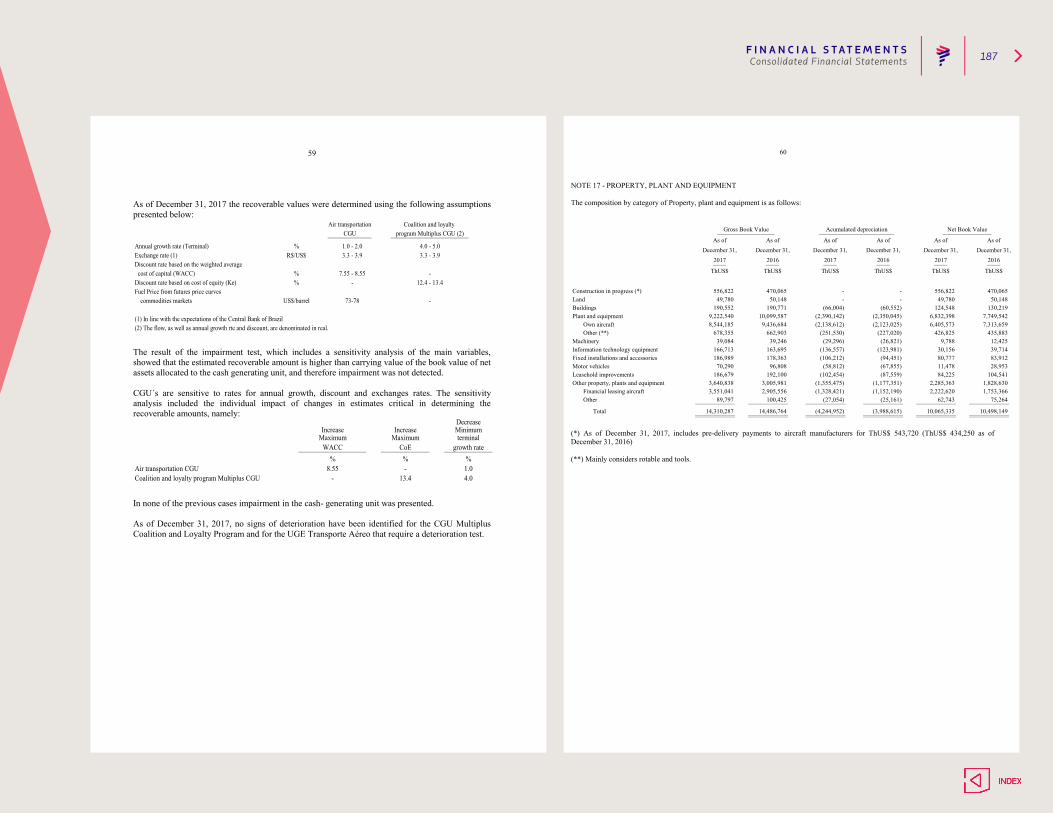
F I N A N C I A L S T AT E M E N T S 187Consolidated Financial Statements
59
As of December 31, 2017 the recoverable values were determined using the following assumptions presented below:
Exchange rate (1)Discount rate based on the weighted average cost of capital (WACC)Discount rate based on cost of equity (Ke)Fuel Price from futures price curves
commodities markets
(1) In line with the expectations of the Central Bank of Brazil(2) The flow, as well as annual growth rte and discount, are denominated in real.
Annual growth rate (Terminal)
% - 12.4 - 13.4
US$/barrel 73-78 -
7.55 - 8.55 -%
R$/US$ 3.3 - 3.9 3.3 - 3.9
Coalition and loyalty program Multiplus CGU (2)
Air transportationCGU
% 1.0 - 2.0 4.0 - 5.0
The result of the impairment test, which includes a sensitivity analysis of the main variables, showed that the estimated recoverable amount is higher than carrying value of the book value of net assets allocated to the cash generating unit, and therefore impairment was not detected. CGU´s are sensitive to rates for annual growth, discount and exchanges rates. The sensitivity analysis included the individual impact of changes in estimates critical in determining the recoverable amounts, namely:
Air transportation CGUCoalition and loyalty program Multiplus CGU
%1.04.0
MaximumWACC
%8.55
-
MaximumCoE%-
13.4
Decrease
terminalgrowth rate
Increase Increase Minimum
In none of the previous cases impairment in the cash- generating unit was presented. As of December 31, 2017, no signs of deterioration have been identified for the CGU Multiplus Coalition and Loyalty Program and for the UGE Transporte Aéreo that require a deterioration test.
60
NOTE 17 - PROPERTY, PLANT AND EQUIPMENT The composition by category of Property, plant and equipment is as follows:
2,285,36384,22511,47880,77730,156
10,065,335
470,065
12,425435,883
7,313,6597,749,542
130,21950,148
75,2641,753,366
104,54128,95383,91239,714
1,828,630
10,498,149
62,7432,222,620
(2,138,612)(2,390,142)
(66,004)
(106,212)(136,557)
556,822
9,788426,825
6,405,5736,832,398
124,54849,780
--
(60,552)(2,350,045)(2,123,025)
(227,020)(26,821)
(123,981)(94,451)
--
(3,988,615)
(67,855)(87,559)
(1,177,351)(1,152,190)
(25,161)
14,486,764
662,90339,246
163,695178,363
96,808192,100
3,005,9812,905,556
(27,054)(1,328,421)
(29,296)(251,530)
Construction in progress (*)LandBuildingsPlant and equipment
Information technology equipmentFixed installations and accessoriesMotor vehiclesLeasehold improvementsOther property, plants and equipment
Own aircraft Other (**)Machinery
Total
As of As ofDecember 31, December 31,
2017 2016
(4,244,952)
(1,355,475)(102,454)
(58,812)
As ofDecember 31,
2017
ThUS$
470,06550,148
190,77110,099,587
9,436,684
100,425 Financial leasing aircraft Other
Net Book Value
As ofDecember 31,
2016
ThUS$
As of As ofDecember 31, December 31,
2017 2016
ThUS$ ThUS$ ThUS$ ThUS$
Gross Book Value Acumulated depreciation
70,290186,679
3,640,8383,551,041
89,797
14,310,287
556,82249,780
190,5529,222,5408,544,185
678,35539,084
166,713186,989
(*) As of December 31, 2017, includes pre-delivery payments to aircraft manufacturers for ThUS$ 543,720 (ThUS$ 434,250 as of December 31, 2016) (**) Mainly considers rotable and tools.
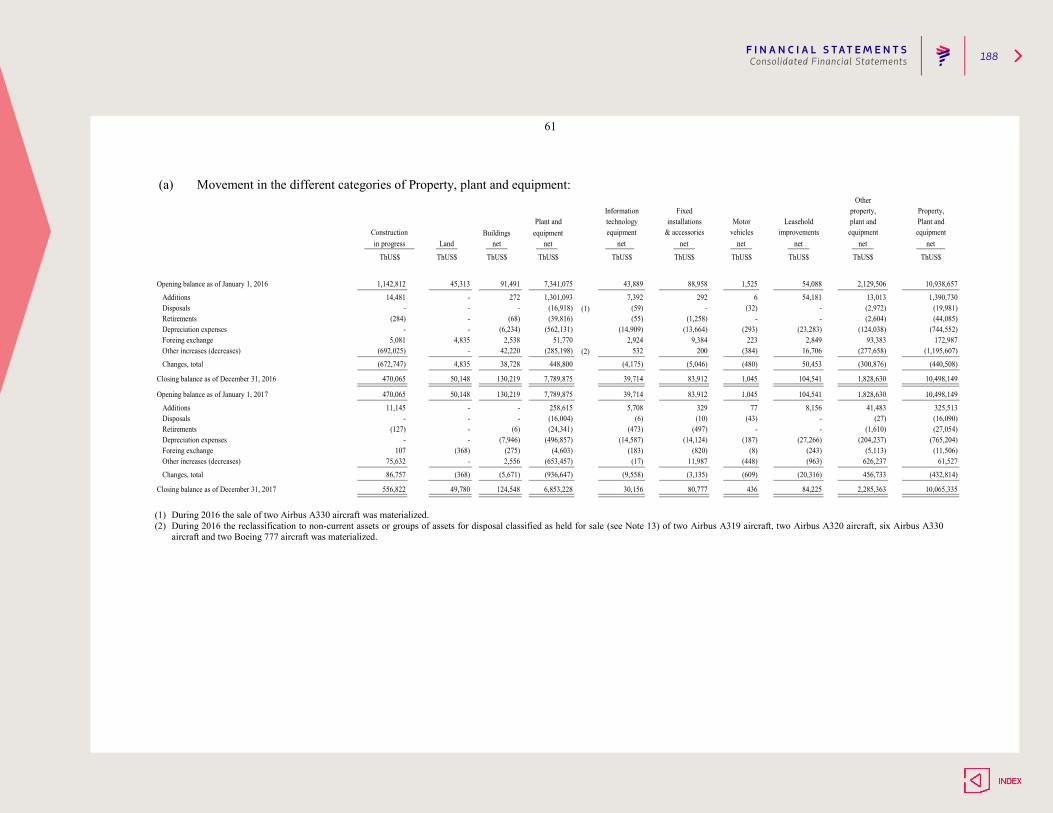
F I N A N C I A L S T AT E M E N T S 188Consolidated Financial Statements
61
(a) Movement in the different categories of Property, plant and equipment:
(1)
(2)
1,828,630 10,498,149Closing balance as of December 31, 2016 470,065 50,148 130,219 7,789,875 39,714 83,912 1,045 104,541
(277,658) (1,195,607)
Changes, total (672,747) 4,835 38,728 448,800 (4,175) (5,046) (480) 50,453 (300,876) (440,508)
Other increases (decreases) (692,025) - 42,220 (285,198) 532 200 (384) 16,706
(124,038) (744,552) Foreing exchange 5,081 4,835 2,538 51,770 2,924 9,384 223 2,849 93,383 172,987 Depreciation expenses - - (6,234) (562,131) (14,909) (13,664) (293) (23,283)
(2,972) (19,981) Retirements (284) - (68) (39,816) (55) (1,258) - - (2,604) (44,085) Disposals - - - (16,918) (59) - (32) -
2,129,506 10,938,657
Additions 14,481 - 272 1,301,093 7,392 292 6 54,181 13,013 1,390,730
Opening balance as of January 1, 2016 1,142,812 45,313 91,491 7,341,075 43,889 88,958 1,525 54,088
2,285,363 10,065,335Closing balance as of December 31, 2017 556,822 49,780 124,548 6,853,228 30,156 80,777 436 84,225
626,237 61,527
Changes, total 86,757 (368) (5,671) (936,647) (9,558) (3,135) (609) (20,316) 456,733 (432,814)
Other increases (decreases) 75,632 - 2,556 (653,457) (17) 11,987 (448) (963)
(204,237) (765,204) Foreing exchange 107 (368) (275) (4,603) (183) (820) (8) (243) (5,113) (11,506) Depreciation expenses - - (7,946) (496,857) (14,587) (14,124) (187) (27,266)
(27) (16,090) Retirements (127) - (6) (24,341) (473) (497) - - (1,610) (27,054) Disposals - - - (16,004) (6) (10) (43) -
1,828,630 10,498,149
Additions 11,145 - - 258,615 5,708 329 77 8,156 41,483 325,513
Opening balance as of January 1, 2017 470,065 50,148 130,219 7,789,875 39,714 83,912 1,045 104,541
Constructionin progress
ThUS$
Land net
ThUS$
net
ThUS$
equipmentinstallations
Buildings
ThUS$
net
ThUS$
netequipment
net
ThUS$ ThUS$
net
ThUS$
Other
net
ThUS$
& accessories vehicles improvements equipment equipmentnet
ThUS$
Property,Plant andMotor Leasehold plant and
Information Fixed property,technologyPlant and
(1) During 2016 the sale of two Airbus A330 aircraft was materialized. (2) During 2016 the reclassification to non-current assets or groups of assets for disposal classified as held for sale (see Note 13) of two Airbus A319 aircraft, two Airbus A320 aircraft, six Airbus A330
aircraft and two Boeing 777 aircraft was materialized.
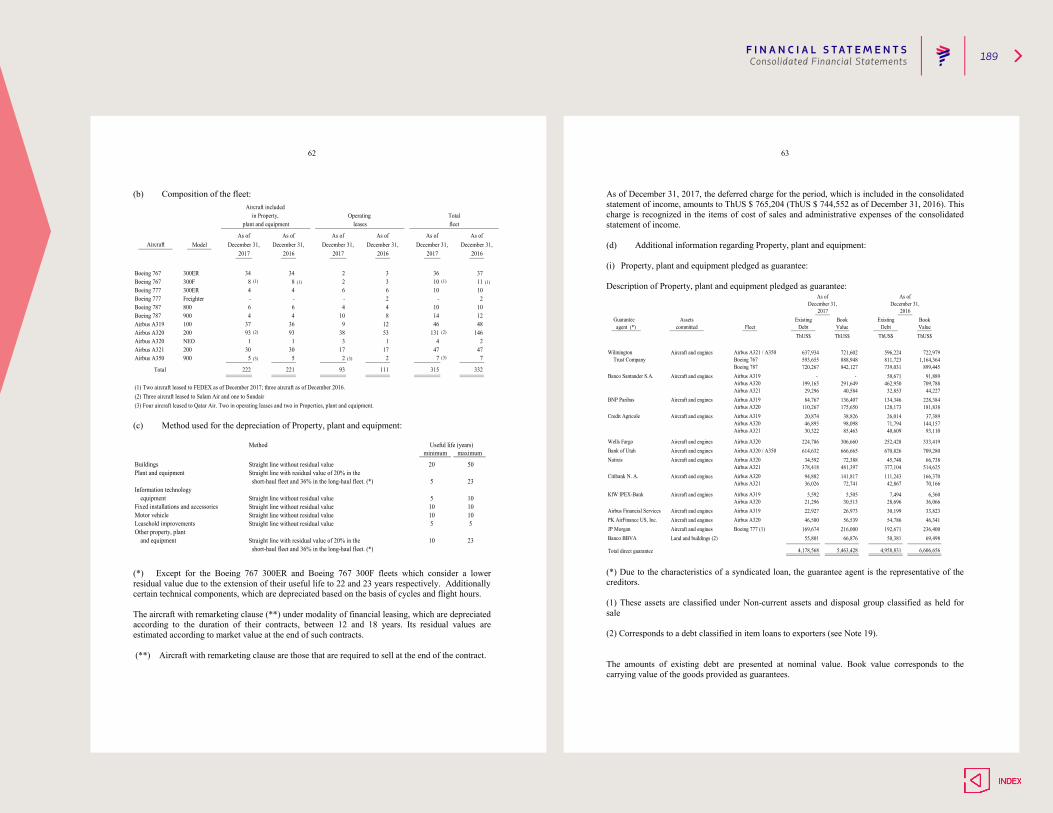
F I N A N C I A L S T AT E M E N T S 189Consolidated Financial Statements
62
(b) Composition of the fleet:
(1) (1) (1) (1)
(2) (2)
(3) (3) (3)
Total
(1) Two aircraft leased to FEDEX as of December 2017; three aircraft as of December 2016.(2) Three aircraft leased to Salam Air and one to Sundair(3) Four aircraft leased to Qatar Air. Two in operating leases and two in Properties, plant and equipment.
2 - 2
Boeing 787 900 4 4 10 8 14 12Boeing 787 800 6 6 4 4 10 10
Freighter -
Aircraft included in Property, Operating Total
plant and equipment leases fleet
As of As of As of As of As of As of
37
Aircraft Model December 31, December 31, December 31, December 31, December 31, December 31,2017 2016 2017 2016 2017 2016
Boeing 767 300ER
222 221 93 111 315 332
Airbus A350 900 5 5 2 2 7Airbus A321 200 30 30 17 17 47
7
Airbus A320 200 93 93 38 53 131 146Airbus A320 NEO 1
34 34
48
11Boeing 777 300ER 4 4 6 6 10 10
471 3 1 4 2
Airbus A319 100 37 36 9 12 46
Boeing 767 300F 8 8 2 3 10
Boeing 777
2 3 36
- -
(c) Method used for the depreciation of Property, plant and equipment:
minimum maximum
short-haul fleet and 36% in the long-haul fleet. (*)
Useful life (years)
20 50
23
5 23
5 1010 10
and equipment
Straight line without residual valueStraight line without residual valueStraight line without residual value
Straight line with residual value of 20% in the
10 105 5
10
Method
Straight line without residual value
short-haul fleet and 36% in the long-haul fleet. (*)
Straight line without residual value
Straight line with residual value of 20% in theBuildings
Information technology
Other property, plant
Plant and equipment
equipmentFixed installations and accessoriesMotor vehicleLeasehold improvements
(*) Except for the Boeing 767 300ER and Boeing 767 300F fleets which consider a lower residual value due to the extension of their useful life to 22 and 23 years respectively. Additionally certain technical components, which are depreciated based on the basis of cycles and flight hours. The aircraft with remarketing clause (**) under modality of financial leasing, which are depreciated according to the duration of their contracts, between 12 and 18 years. Its residual values are estimated according to market value at the end of such contracts. (**) Aircraft with remarketing clause are those that are required to sell at the end of the contract.
63
As of December 31, 2017, the deferred charge for the period, which is included in the consolidated statement of income, amounts to ThUS $ 765,204 (ThUS $ 744,552 as of December 31, 2016). This charge is recognized in the items of cost of sales and administrative expenses of the consolidated statement of income. (d) Additional information regarding Property, plant and equipment: (i) Property, plant and equipment pledged as guarantee: Description of Property, plant and equipment pledged as guarantee:
Total direct guarantee
93,110 -
JP Morgan Aircraft and engines Boeing 777 (1) 169,674 216,000 192,671 236,400
-
Airbus A321 -
Airbus A321
-
Credit Agricole Airbus A319Airbus A320Airbus A321 30,322 -
Citibank N. A. Aircraft and engines Airbus A320
29,29684,767 136,407
Aircraft and engines
Airbus A319BNP Paribas110,267
20,874 -
Boeing 787Airbus A319Banco Santander S.A.
Airbus A320Aircraft and engines
Airbus A320
720,267Aircraft and engines
199,165Airbus A321
Guarantee agent (*)
2017Existing
DebtThUS$
ValueThUS$
As ofDecember 31,
committedAssets
Fleet
As ofDecember 31,
Book
ThUS$
Existing2016
BookDebt Value
ThUS$
842,127 739,031593,655
85,463 40,609
91,889899,445
- -
709,788 - -
- -
637,934
228,384
1,164,364888,948 811,723721,602 596,224 722,979Wilmington Aircraft and engines Airbus A321 / A350
Trust Company Boeing 767
Airbus Financial Services
50,671
38,826
462,950
37,389181,838
71,79498,09826,014
291,64940,584 44,22732,853
144,157
175,650134,346128,173
Aircraft and engines
6,606,6564,178,568 5,463,428 4,958,831
KfW IPEX-Bank Aircraft and engines Airbus A319 5,592 5,505 7,494
50,38166,87655,801Banco BBVA Land and buildings (2)
Airbus A320
- - Aircraft and engines -
- -
Airbus A319 22,927 26,973 30,199 33,823
6,360
69,498
514,625
36,066
-
- 378,418 481,397166,370
72,741 42,867 70,166141,817 111,243
21,296 30,513 28,696
94,882 - -
Aircraft and engines
46,895
36,026
Wells Fargo - -
614,632 -
666,665 670,826
377,104
709,280
-
34,592Airbus A320 / A350
NatixisBank of Utah
252,428 333,419Aircraft and engines
66,73872,388
Airbus A320 306,660
45,748Airbus A320
224,786
-
PK AirFinance US, Inc. Aircraft and engines Airbus A320 46,500 56,539 54,786 46,341 - -
(*) Due to the characteristics of a syndicated loan, the guarantee agent is the representative of the creditors. (1) These assets are classified under Non-current assets and disposal group classified as held for sale (2) Corresponds to a debt classified in item loans to exporters (see Note 19). The amounts of existing debt are presented at nominal value. Book value corresponds to the carrying value of the goods provided as guarantees.
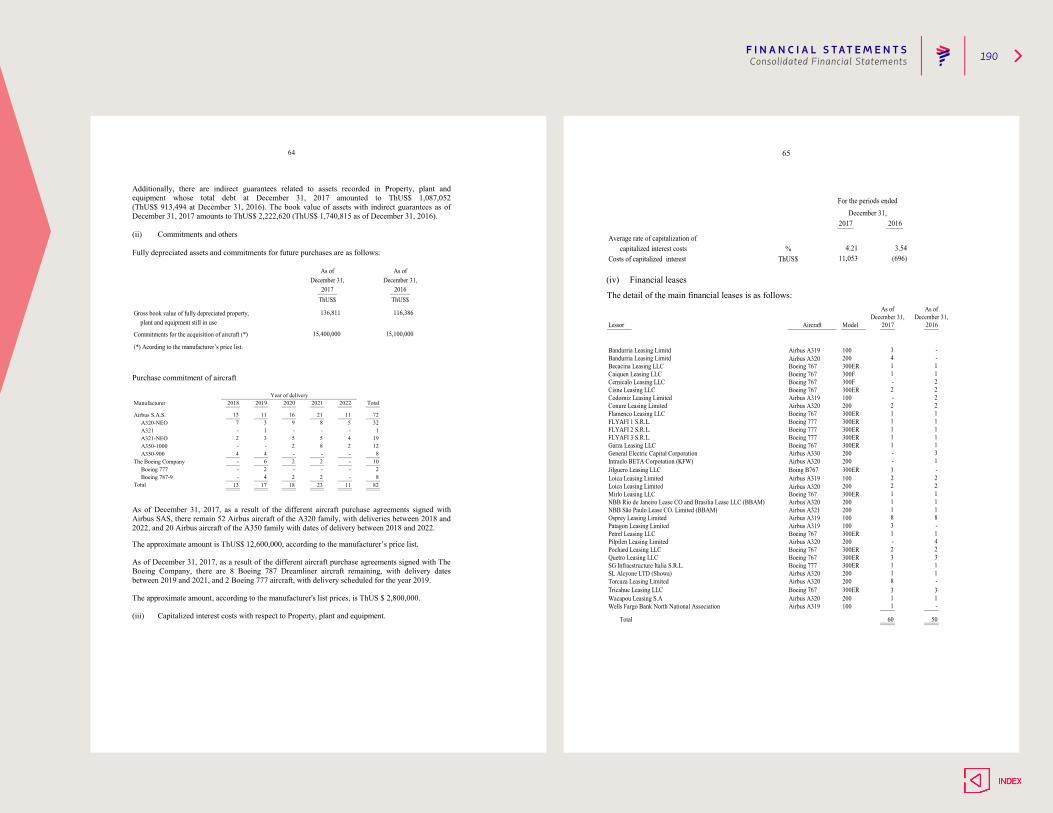
F I N A N C I A L S T AT E M E N T S 190Consolidated Financial Statements
64
Additionally, there are indirect guarantees related to assets recorded in Property, plant and equipment whose total debt at December 31, 2017 amounted to ThUS$ 1,087,052 (ThUS$ 913,494 at December 31, 2016). The book value of assets with indirect guarantees as of December 31, 2017 amounts to ThUS$ 2,222,620 (ThUS$ 1,740,815 as of December 31, 2016). (ii) Commitments and others Fully depreciated assets and commitments for future purchases are as follows:
(*) Acording to the manufacturer’s price list.
116,386
15,100,000
136,811
15,400,000
Gross book value of fully depreciated property, plant and equipment still in use
Commitments for the acquisition of aircraft (*)
As ofDecember 31, December 31,
As of
ThUS$ ThUS$2017 2016
Purchase commitment of aircraft
Manufacturer
Airbus S.A.S. A320-NEO A321 A321-NEO A350-1000 A350-900The Boeing Company Boeing 777 Boeing 787-9Total
Year of delivery2022
2
2018
-
16 21
1 - -
Total2019 2020 2021
727 3 9 8
13 1132
1
2 8 12- -84
10-- -
-2- 2 -
2- 6
13 17 18- 4 2
8223
3 5 5 19
22 8-
4
--
11
115-42
As of December 31, 2017, as a result of the different aircraft purchase agreements signed with Airbus SAS, there remain 52 Airbus aircraft of the A320 family, with deliveries between 2018 and 2022, and 20 Airbus aircraft of the A350 family with dates of delivery between 2018 and 2022.
The approximate amount is ThUS$ 12,600,000, according to the manufacturer’s price list.
As of December 31, 2017, as a result of the different aircraft purchase agreements signed with The Boeing Company, there are 8 Boeing 787 Dreamliner aircraft remaining, with delivery dates between 2019 and 2021, and 2 Boeing 777 aircraft, with delivery scheduled for the year 2019.
The approximate amount, according to the manufacturer's list prices, is ThUS $ 2,800,000.
(iii) Capitalized interest costs with respect to Property, plant and equipment.
65
2017
For the periods endedDecember 31,
4.2111,053
2016
3.54(696)
Average rate of capitalization of capitalized interest costs
Costs of capitalized interest %
ThUS$ (iv) Financial leases
The detail of the main financial leases is as follows:
Model
Airbus A320
Airbus A320
Pochard Leasing LLC
SL Alcyone LTD (Showa) Airbus A320
--
Patagon Leasing Limited Airbus A319 100 3 -
Bandurria Leasing LimitdBandurria Leasing Limitd Airbus A319 100
20034
Becacina Leasing LLC Boeing 767 300ER 1 1
300ER 2 2
8200 1100
13
1300ER 3
Boeing 767Boeing 767
1
Jilguero Leasing LLC
Boeing 7673
200 2 2
200200
23
-
Loica Leasing Limited
-300ER
2100
1-
1Boeing 767
FLYAFI 3 S.R.L.FLYAFI 2 S.R.L. Boeing 777
Boeing 777
Conure Leasing Limited
Pilpilen Leasing Limited Airbus A320
Airbus A319
200
Airbus A321
Boeing 767
1
1
300ER 1Petrel Leasing LLC
8
Quetro Leasing LLCSG Infraestructure Italia S.R.L.
Airbus A330Garza Leasing LLC 300ERGeneral Electric Capital CorporationIntraelo BETA Corpotation (KFW)
200Boeing 767
300ER1
14-
1
1
11
1
300ER
300ER300ER 1
11
1
Lessor
Cisne Leasing LLCCodorniz Leasing Limited
Loica Leasing Limited
NBB São Paulo Lease CO. Limited (BBAM)Osprey Leasing Limited
Mirlo Leasing LLC
200
NBB Rio de Janeiro Lease CO and Brasilia Lease LLC (BBAM) Airbus A320
Cernicalo Leasing LLC
Flamenco Leasing LLC Boeing 767Airbus A320
Boing B767
200
Caiquen Leasing LLC
FLYAFI 1 S.R.L.
2
Boeing 767
As ofDecember 31,
Aircraft 2017 2016
As ofDecember 31,
1 1
Airbus A319
300ER 2
Boeing 777 300ER 1
Airbus A319 100 -
Airbus A320
Boeing 767Boeing 777 300ER
2
Tricahue Leasing LLC 300ERTorcaza Leasing Limited Airbus A320 200 8 -
2
300F 1300F -
2
12
Wells Fargo Bank North National Association Airbus A319 100 1 -
Total
Boeing 767
60 50
3 3Wacapou Leasing S.A Airbus A320 200 1 1
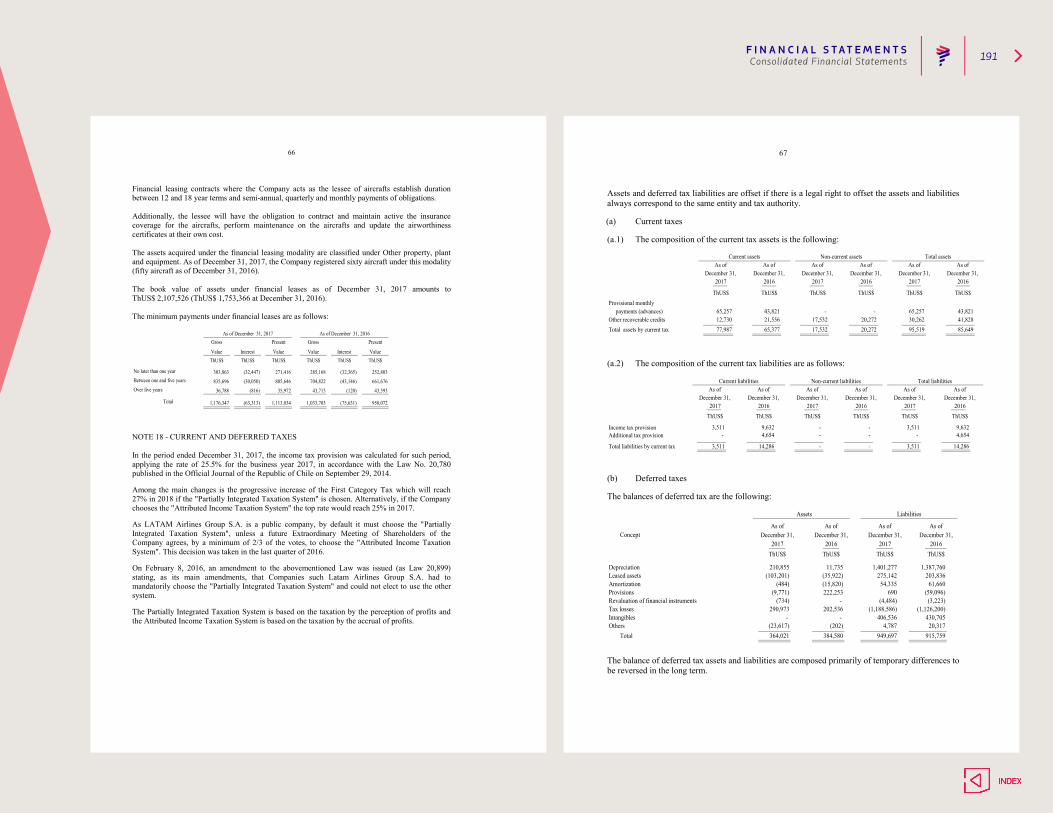
F I N A N C I A L S T AT E M E N T S 191Consolidated Financial Statements
66
Financial leasing contracts where the Company acts as the lessee of aircrafts establish duration between 12 and 18 year terms and semi-annual, quarterly and monthly payments of obligations.
Additionally, the lessee will have the obligation to contract and maintain active the insurance coverage for the aircrafts, perform maintenance on the aircrafts and update the airworthiness certificates at their own cost.
The assets acquired under the financial leasing modality are classified under Other property, plant and equipment. As of December 31, 2017, the Company registered sixty aircraft under this modality (fifty aircraft as of December 31, 2016). The book value of assets under financial leases as of December 31, 2017 amounts to ThUS$ 2,107,526 (ThUS$ 1,753,366 at December 31, 2016).
The minimum payments under financial leases are as follows:
No later than one year
Between one and five years
Over five years
As of December 31, 2017Gross Present
Value Interest ValueThUS$ ThUS$ ThUS$
303,863 (32,447) 271,416
835,696 (30,050) 805,646
(75,631) 958,072
36,788 (816) 35,972
Total 1,176,347 (63,313) 1,113,034 1,033,703
As of December 31, 2016Gross Present
Value Interest ValueThUS$ ThUS$ ThUS$
285,168 (32,365) 252,803
704,822 (43,146) 661,676
43,713 (120) 43,593
NOTE 18 - CURRENT AND DEFERRED TAXES In the period ended December 31, 2017, the income tax provision was calculated for such period, applying the rate of 25.5% for the business year 2017, in accordance with the Law No. 20,780 published in the Official Journal of the Republic of Chile on September 29, 2014.
Among the main changes is the progressive increase of the First Category Tax which will reach 27% in 2018 if the "Partially Integrated Taxation System" is chosen. Alternatively, if the Company chooses the "Attributed Income Taxation System" the top rate would reach 25% in 2017.
As LATAM Airlines Group S.A. is a public company, by default it must choose the "Partially Integrated Taxation System", unless a future Extraordinary Meeting of Shareholders of the Company agrees, by a minimum of 2/3 of the votes, to choose the "Attributed Income Taxation System". This decision was taken in the last quarter of 2016.
On February 8, 2016, an amendment to the abovementioned Law was issued (as Law 20,899) stating, as its main amendments, that Companies such Latam Airlines Group S.A. had to mandatorily choose the "Partially Integrated Taxation System" and could not elect to use the other system.
The Partially Integrated Taxation System is based on the taxation by the perception of profits and the Attributed Income Taxation System is based on the taxation by the accrual of profits.
67
Assets and deferred tax liabilities are offset if there is a legal right to offset the assets and liabilities always correspond to the same entity and tax authority.
(a) Current taxes
(a.1) The composition of the current tax assets is the following:
Provisional monthly payments (advances)Other recoverable credits Total assets by current tax
Current assets Non-current assets Total assetsAs of As of As of As of As of As of
2016December 31, December 31, December 31, December 31, December 31, December 31,
2017 2016 2017 2016 2017
43,821
ThUS$ ThUS$ ThUS$ ThUS$ ThUS$ ThUS$
65,257 43,821 - - 65,25741,82885,64977,987 65,377 17,532 20,272 95,519
12,730 21,556 17,532 20,272 30,262
(a.2) The composition of the current tax liabilities are as follows:
Income tax provision Additional tax provision
Total liabilities by current tax 3,511 14,286
3,511 9,632 - 4,654
-
-
2017 2016ThUS$ ThUS$
Current liabilitiesAs of As of
December 31, December 31,
Total liabilitiesNon-current liabilitiesAs of As of
December 31, December 31,As of As of
December 31, December 31,
14,286
-
-
-
3,511
4,654 - -
2016ThUS$ ThUS$
3,511 9,632
2017 2016ThUS$ ThUS$
2017
(b) Deferred taxes
The balances of deferred tax are the following:
#
TotalOthersIntangibles
(23,617)364,021
-
2016ThUS$
11,735
290,973
Provisions
Leased assets (103,201)
(9,771)(734)
(35,922)
Liabilities
As ofDecember 31,
2017
Amortization
As ofDecember 31,
2017ThUS$
Depreciation
Assets
As ofDecember 31,
2016ThUS$ThUS$
As ofDecember 31,Concept
202,536(4,484)
(1,188,586)
(15,820)
Revaluation of financial instruments222,253
- Tax losses
1,401,277
54,335690
210,855
(484)
430,70520,317
915,759(202)
384,580
406,5364,787
949,697
-
(3,223)(1,126,200)
275,142 203,8361,387,760
61,660(59,096)
The balance of deferred tax assets and liabilities are composed primarily of temporary differences to be reversed in the long term.
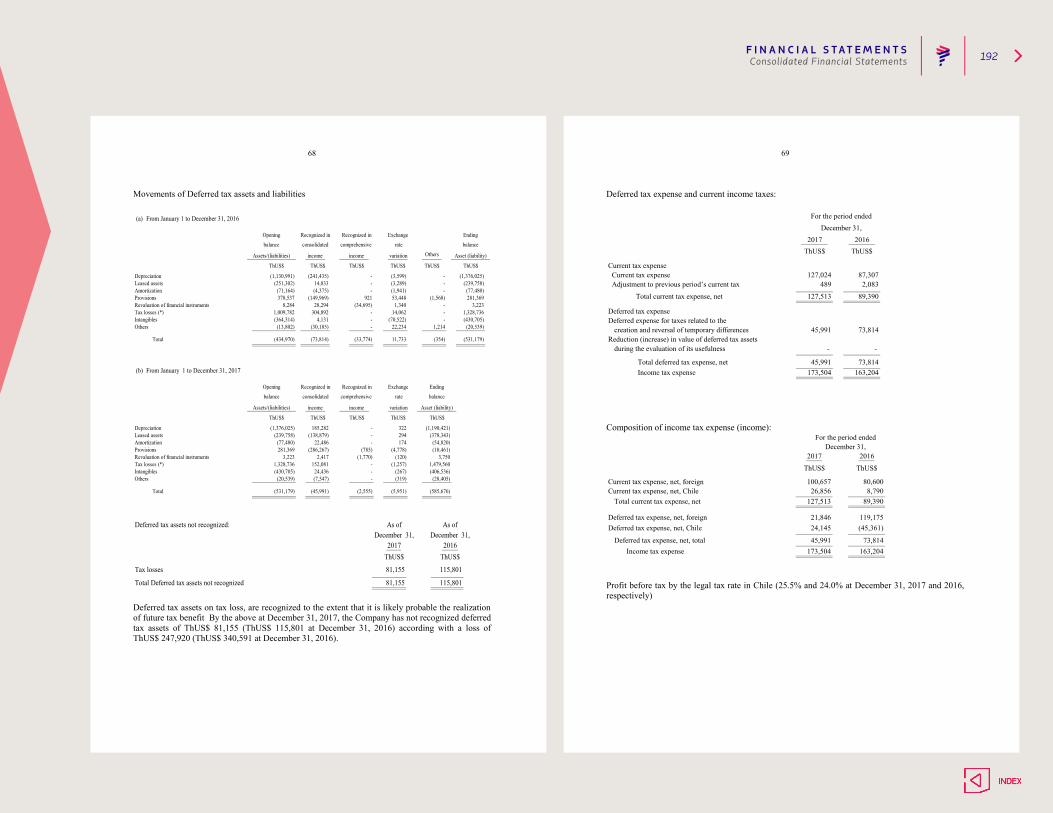
F I N A N C I A L S T AT E M E N T S 192Consolidated Financial Statements
68
Movements of Deferred tax assets and liabilities
balance
Opening Recognized in
consolidated
income
- 1,328,736
Recognized in
comprehensive
income
ThUS$
Asset (liability)
ThUS$
-
(71,164) (4,375) - -(1,941)
(430,705)1,214 (20,539)
Depreciation (1,130,991) (241,435) -Leased assets (251,302) 14,833 -
(1,376,025)- (239,758)
(3,599)(3,289)
Tax losses (*) 1,009,782 304,892
Total (434,970) (73,814) (33,774) (354)
22,234
11,733
Intangibles (364,314) 4,131 -Others (13,802) (30,185) -
-
Provisions 378,537 (149,969) 921Revaluation of financial instruments 8,284 28,294 (34,695)
Others
ThUS$
variation
ThUS$
-
ThUS$ThUS$
Assets/(liabilities)
(a)
Exchange
rate
(531,179)
(70,522)
- 3,223
(77,480)(1,568) 281,369
Ending
balance
53,4481,340
14,062
From January 1 to December 31, 2016
Amortization
balance
Opening Recognized in
consolidated
income
1,479,560
Recognized in
comprehensive
income
ThUS$
Asset (liability)
ThUS$
-
(77,480) 22,486 - 174
(406,536)(28,405)
Depreciation (1,376,025) 185,282 -Leased assets (239,758) (138,879) -
(1,190,421)(378,343)
322294
Tax losses (*) 1,328,736 152,081
Total (531,179) (45,991) (2,555)
(319)
(5,951)
Intangibles (430,705) 24,436 -Others (20,539) (7,547) -
Provisions 281,369 (286,267) (785)Revaluation of financial instruments 3,223 2,417 (1,770)
variation
ThUS$ThUS$ThUS$
Assets/(liabilities)
(b)
Exchange
rate
(585,676)
(267)
3,750
(54,820)(10,461)
Ending
balance
(4,778)(120)
(1,257)
From January 1 to December 31, 2017
Amortization
As ofDecember 31,
Deferred tax assets not recognized:
Tax losses
As ofDecember 31,
2017ThUS$
Total Deferred tax assets not recognized 81,155
115,801
115,801
2016ThUS$
81,155
Deferred tax assets on tax loss, are recognized to the extent that it is likely probable the realization of future tax benefit By the above at December 31, 2017, the Company has not recognized deferred tax assets of ThUS$ 81,155 (ThUS$ 115,801 at December 31, 2016) according with a loss of ThUS$ 247,920 (ThUS$ 340,591 at December 31, 2016).
69
Deferred tax expense and current income taxes:
73,814163,204
2,083
89,390
73,814
-
Current tax expense
127,513
45,991
489127,024
Total current tax expense, net
Current tax expense Adjustment to previous period’s current tax
Deferred expense for taxes related to the Deferred tax expense
creation and reversal of temporary differences
Total deferred tax expense, net Income tax expense
Reduction (increase) in value of deferred tax assetsduring the evaluation of its usefulness
For the period endedDecember 31,
2017ThUS$
173,504
-
45,991
2016ThUS$
87,307
Composition of income tax expense (income):
Current tax expense, net, foreign
Income tax expense 173,504 163,204
80,6008,790
89,390
119,175(45,361)
Total current tax expense, net 127,513Current tax expense, net, Chile
Deferred tax expense, net, foreign 21,846
ThUS$
100,657
ThUS$
26,856
For the period endedDecember 31,
2017 2016
Deferred tax expense, net, total 45,991 73,814
Deferred tax expense, net, Chile 24,145
Profit before tax by the legal tax rate in Chile (25.5% and 24.0% at December 31, 2017 and 2016, respectively)
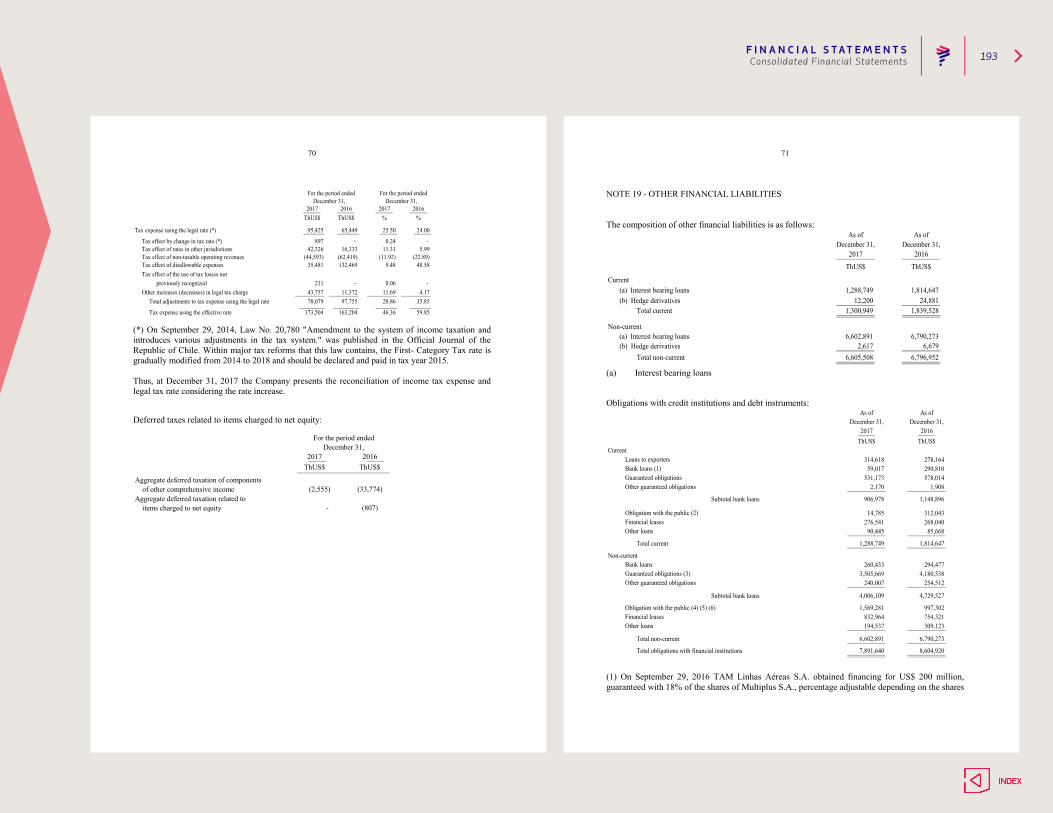
F I N A N C I A L S T AT E M E N T S 193Consolidated Financial Statements
70
Tax effect of the use of tax losses not
(62,419)
4.1797,755
163,204
35.85
59.85
20.86
-
2016%
For the period endedFor the period ended
2016ThUS$
December 31,December 31,2017
ThUS$2017
%
Tax expense using the effective rate
(11.92)9.4835,481
Tax effect of non-taxable operating revenues Tax effect of disallowable expenses
(44,593)
Total adjustments to tax expense using the legal rate
173,504
78,079
46.36
132,469
previously recognized
Tax expense using the legal rate (*)
Tax effect of rates in other jurisdictions 11.31
95,425
42,326
25.50
Tax effect by change in tax rate (*) 897 0.24
65,449
- 16,333
24.00
- 5.99
(22.89)48.58
Other increases (decreases) in legal tax charge 43,757 11.6911,372211 - 0.06
(*) On September 29, 2014, Law No. 20,780 "Amendment to the system of income taxation and introduces various adjustments in the tax system." was published in the Official Journal of the Republic of Chile. Within major tax reforms that this law contains, the First- Category Tax rate is gradually modified from 2014 to 2018 and should be declared and paid in tax year 2015. Thus, at December 31, 2017 the Company presents the reconciliation of income tax expense and legal tax rate considering the rate increase.
Deferred taxes related to items charged to net equity:
- (807)
ThUS$ ThUS$2017 2016
December 31,For the period ended
items charged to net equity
Aggregate deferred taxation of components
Aggregate deferred taxation related to of other comprehensive income (2,555) (33,774)
71
NOTE 19 - OTHER FINANCIAL LIABILITIES The composition of other financial liabilities is as follows:
24,8811,839,528
6,790,273
1,288,74912,200
1,300,949
6,602,891
As of As ofDecember 31, December 31,
2017 2016
ThUS$ ThUS$
Current(a) Interest bearing loans 1,814,647(b) Hedge derivatives
Total current
Non-current(a) Interest bearing loans(b) Hedge derivatives
Total non-current6,679
6,796,9522,617
6,605,508
(a) Interest bearing loans
Obligations with credit institutions and debt instruments:
754,321
278,164290,810
1,908
1,148,896
312,043
578,014
4,180,538
4,729,527
997,302
294,477
254,512
268,04085,668
1,814,647
906,978
14,785276,541
Current
Financial leasesOther loans
59,017Loans to exporters
90,445
314,618
531,1732,170
Bank loans (1)
Other guaranteed obligationsGuaranteed obligations
Subtotal bank loans
Obligation with the public (2)
December 31,As of
2016ThUS$
As ofDecember 31,
2017ThUS$
Total obligations with financial institutions
Total non-current
Obligation with the public (4) (5) (6)
Other loansFinancial leases 832,964
Total current
Subtotal bank loans
Guaranteed obligations (3) 3,505,669
Non-currentBank loans 260,433
Other guaranteed obligations
1,288,749
1,569,281
240,007
4,006,109
309,123
6,790,273
8,604,920
194,537
6,602,891
7,891,640
(1) On September 29, 2016 TAM Linhas Aéreas S.A. obtained financing for US$ 200 million, guaranteed with 18% of the shares of Multiplus S.A., percentage adjustable depending on the shares

F I N A N C I A L S T AT E M E N T S 194Consolidated Financial Statements
72
price. Additionally, TAM obtained a hedging economic (Cross Currency Swap) for the same amount and period, in order to convert the commitment currency from US$ to BRL.
On March 30, 2017, TAM Linhas Aéreas S.A. restructured the financing mentioned in the previous paragraph, modifying the nominal amount of the transaction to US $ 137 million.
On September 27, 2017, TAM Linhas Aéreas S.A. made the payment of capital plus interest corresponding to the last installment of the financing described above. Simultaneously, all the garments were lifted on the shares of Multiplus S.A. delivered as collateral.
(2) On April 25, 2017, the payment of the principal plus interest on the long-term bonds issued by the company TAM Capital Inc. for an amount of US$ 300,000,000 at an interest rate of 7.375% annual. The payment consisted of 100% of the capital, US$ 300,000,000, and interest accrued as of the date of payment for ThUS $ 11,063. (3) On April 10, 2017, the issuance and private placement of debt securities in the amount of US$ 140,000,000 was made under the current structure of the Enhanced Equipment Trust Certificates ("EETC") issued and placed the year 2015 to finance the acquisition of eleven Airbus A321-200, two Airbus A350-900 and four Boeing 787-9 with arrivals between July 2015 and April 2016. The offer is made up of Class C Certificates, which are subordinate to the Current Class A Certificates and Class B Certificates held by the Company. The term of the Class C Certificates is six years and expires in 2023.
(4) On April 11, 2017, LATAM Finance Limited, a company incorporated in the Cayman Islands with limited liability and exclusively owned by LATAM Airlines Group SA, has issued and placed on the international market, pursuant to Rule 144 -A and Regulation S of the securities laws of the United States of America, long-term unsecured bonds in the amount of US$ 700,000,000, maturing in 2024 at an annual interest rate of 6.875%. As reported in the essential fact of April 6, 2017, the Issue and placement of the 144-A Bonds was intended to finance general corporate purposes of LATAM. (5) On August 17, 2017, LATAM made the placement in the local market (Santiago Stock Exchange) of the Series A Bonds (BLATM-A), Series B (BLATM-B), Series C (BLATM-) C) and Series D (BLATM-D), which correspond to the first issue of bonds charged to the line inscribed in the Securities Registry of the Commission for the Financial Market (“CMF”), under number 862 for a total of UF 9,000,000. The total amount placed of the Series A Bond was UF 2,500,000; The total amount placed of the Series B Bond was UF 2,500,000. The total amount placed of the Series C Bond was UF 1,850,000. The total amount placed of the Series D Bond was UF 1,850,000, thus totaling UF 8,700,000. The Series A Bonds have an expiration date on June 1, 2022 and an annual interest rate of 5.25%. The Series B Bonds have an expiration date on January 1, 2028 and an annual interest rate of 5.75%. The Series C Bonds have an expiration date on June 1, 2022 and an annual interest rate of 5.25%. The Series D Bonds have an expiration date on January 1, 2028 and an annual interest rate of 5.75%.
73
The proceeds of the placement of the Series A, Series B, Series C and Series D Bonds were allocated in full to the partial financing of the early redemption of the total bonds of TAM Capital 3 inc. (6) On September 1, 2017, TAM Capital 3 Inc., a company controlled indirectly by TAM S.A. through its subsidiary TAM Linhas Aéreas SA, which consolidates its financial statements with LATAM, made the full advance redemption of the bonds it placed abroad on June 3, 2011, for an amount of US $ 500 million at a 8.375% rate and with an expiration date on June 3, 2021. The total redemption was partially financed with the placement of bonds in the local market described in number (5) above, and the balance, with other funds available from the Company. All interest-bearing liabilities are recorded according to the effective rate method. Under IFRS, in the case of fixed rate loans, the effective rate determined does not vary over the duration of the loan, whereas in variable rate loans, the effective rate changes to the date of each payment of interest. Currency balances that make the interest bearing loans:
Currency
7,891,640
Chilean peso (U.F.) 521,122 203,194Brazilian real 130 1,253
Total
8,400,473
8,604,920
US Dollar
ThUS$ ThUS$
As of As ofDecember 31, December 31,
2017 2016
7,370,388
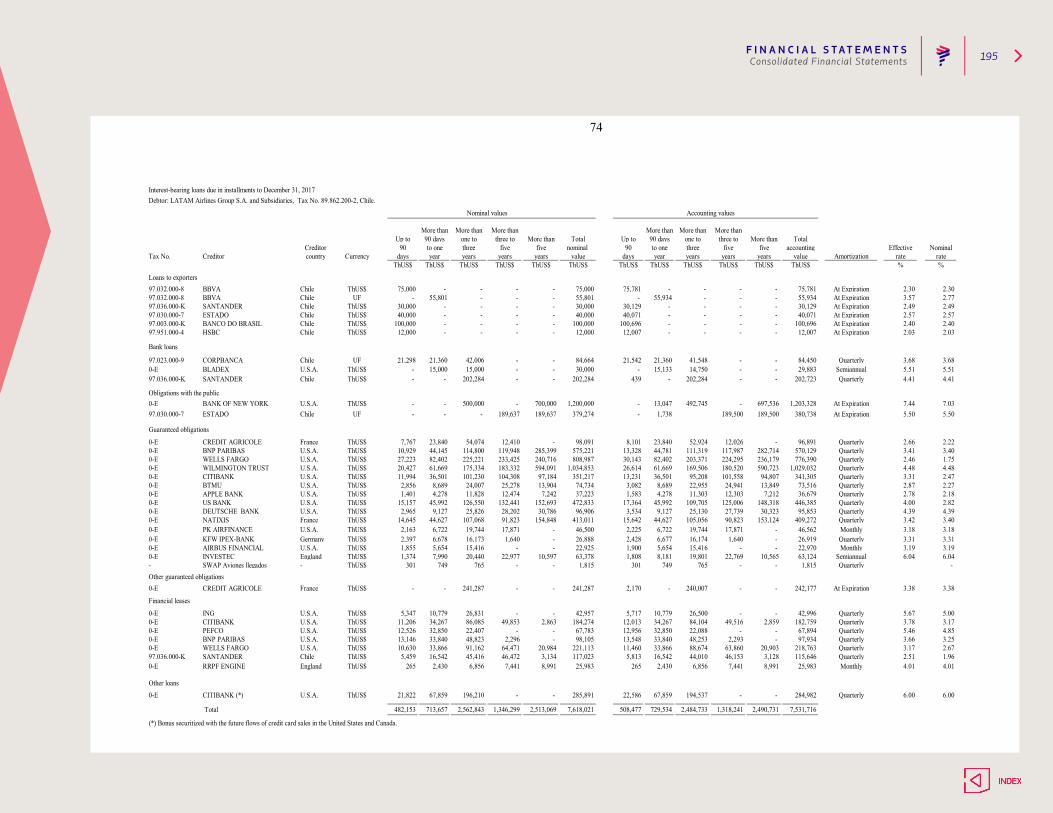
F I N A N C I A L S T AT E M E N T S 195Consolidated Financial Statements
74
Interest-bearing loans due in installments to December 31, 2017 Debtor: LATAM Airlines Group S.A. and Subsidiaries, Tax No. 89.862.200-2, Chile.
Nominal values Accounting values
More than More than More than More than More than More thanUp to 90 days one to three to More than Total Up to 90 days one to three to More than Total
Creditor 90 to one three five five nominal 90 to one three five five accounting Effective NominalTax No. Creditor country Currency days year years years years value days year years years years value Amortization rate rate
ThUS$ ThUS$ ThUS$ ThUS$ ThUS$ ThUS$ ThUS$ ThUS$ ThUS$ ThUS$ ThUS$ ThUS$ % %
Loans to exporters97.032.000-8 BBVA Chile ThUS$ 75,000 - - - - 75,000 75,781 - - - - 75,781 At Expiration 2.30 2.3097.032.000-8 BBVA Chile UF - 55,801 - - - 55,801 - 55,934 - - - 55,934 At Expiration 3.57 2.7797.036.000-K SANTANDER Chile ThUS$ 30,000 - - - - 30,000 30,129 - - - - 30,129 At Expiration 2.49 2.4997.030.000-7 ESTADO Chile ThUS$ 40,000 - - - - 40,000 40,071 - - - - 40,071 At Expiration 2.57 2.5797.003.000-K BANCO DO BRASIL Chile ThUS$ 100,000 - - - - 100,000 100,696 - - - - 100,696 At Expiration 2.40 2.4097.951.000-4 HSBC Chile ThUS$ 12,000 - - - - 12,000 12,007 - - - - 12,007 At Expiration 2.03 2.03
Bank loans
97.023.000-9 CORPBANCA Chile UF 21,298 21,360 42,006 - - 84,664 21,542 21,360 41,548 - - 84,450 Quarterly 3.68 3.680-E BLADEX U.S.A. ThUS$ - 15,000 15,000 - - 30,000 - 15,133 14,750 - - 29,883 Semiannual 5.51 5.5197.036.000-K SANTANDER Chile ThUS$ - - 202,284 - - 202,284 439 - 202,284 - - 202,723 Quarterly 4.41 4.41
Obligations with the public0-E BANK OF NEW YORK U.S.A. ThUS$ - - 500,000 - 700,000 1,200,000 - 13,047 492,745 - 697,536 1,203,328 At Expiration 7.44 7.0397.030.000-7 ESTADO Chile UF - - - 189,637 189,637 379,274 - 1,738 189,500 189,500 380,738 At Expiration 5.50 5.50
Guaranteed obligations
0-E CREDIT AGRICOLE France ThUS$ 7,767 23,840 54,074 12,410 - 98,091 8,101 23,840 52,924 12,026 - 96,891 Quarterly 2.66 2.220-E BNP PARIBAS U.S.A. ThUS$ 10,929 44,145 114,800 119,948 285,399 575,221 13,328 44,781 111,319 117,987 282,714 570,129 Quarterly 3.41 3.400-E WELLS FARGO U.S.A. ThUS$ 27,223 82,402 225,221 233,425 240,716 808,987 30,143 82,402 203,371 224,295 236,179 776,390 Quarterly 2.46 1.750-E WILMINGTON TRUST U.S.A. ThUS$ 20,427 61,669 175,334 183,332 594,091 1,034,853 26,614 61,669 169,506 180,520 590,723 1,029,032 Quarterly 4.48 4.480-E CITIBANK U.S.A. ThUS$ 11,994 36,501 101,230 104,308 97,184 351,217 13,231 36,501 95,208 101,558 94,807 341,305 Quarterly 3.31 2.470-E BTMU U.S.A. ThUS$ 2,856 8,689 24,007 25,278 13,904 74,734 3,082 8,689 22,955 24,941 13,849 73,516 Quarterly 2.87 2.270-E APPLE BANK U.S.A. ThUS$ 1,401 4,278 11,828 12,474 7,242 37,223 1,583 4,278 11,303 12,303 7,212 36,679 Quarterly 2.78 2.180-E US BANK U.S.A. ThUS$ 15,157 45,992 126,550 132,441 152,693 472,833 17,364 45,992 109,705 125,006 148,318 446,385 Quarterly 4.00 2.820-E DEUTSCHE BANK U.S.A. ThUS$ 2,965 9,127 25,826 28,202 30,786 96,906 3,534 9,127 25,130 27,739 30,323 95,853 Quarterly 4.39 4.390-E NATIXIS France ThUS$ 14,645 44,627 107,068 91,823 154,848 413,011 15,642 44,627 105,056 90,823 153,124 409,272 Quarterly 3.42 3.400-E PK AIRFINANCE U.S.A. ThUS$ 2,163 6,722 19,744 17,871 - 46,500 2,225 6,722 19,744 17,871 - 46,562 Monthly 3.18 3.180-E KFW IPEX-BANK Germany ThUS$ 2,397 6,678 16,173 1,640 - 26,888 2,428 6,677 16,174 1,640 - 26,919 Quarterly 3.31 3.310-E AIRBUS FINANCIAL U.S.A. ThUS$ 1,855 5,654 15,416 - - 22,925 1,900 5,654 15,416 - - 22,970 Monthly 3.19 3.190-E INVESTEC England ThUS$ 1,374 7,990 20,440 22,977 10,597 63,378 1,808 8,181 19,801 22,769 10,565 63,124 Semiannual 6.04 6.04- SWAP Aviones llegados - ThUS$ 301 749 765 - - 1,815 301 749 765 - - 1,815 Quarterly - Other guaranteed obligations0-E CREDIT AGRICOLE France ThUS$ - - 241,287 - - 241,287 2,170 - 240,007 - - 242,177 At Expiration 3.38 3.38
Financial leases
0-E ING U.S.A. ThUS$ 5,347 10,779 26,831 - - 42,957 5,717 10,779 26,500 - - 42,996 Quarterly 5.67 5.000-E CITIBANK U.S.A. ThUS$ 11,206 34,267 86,085 49,853 2,863 184,274 12,013 34,267 84,104 49,516 2,859 182,759 Quarterly 3.78 3.170-E PEFCO U.S.A. ThUS$ 12,526 32,850 22,407 - - 67,783 12,956 32,850 22,088 - - 67,894 Quarterly 5.46 4.850-E BNP PARIBAS U.S.A. ThUS$ 13,146 33,840 48,823 2,296 - 98,105 13,548 33,840 48,253 2,293 - 97,934 Quarterly 3.66 3.250-E WELLS FARGO U.S.A. ThUS$ 10,630 33,866 91,162 64,471 20,984 221,113 11,460 33,866 88,674 63,860 20,903 218,763 Quarterly 3.17 2.6797.036.000-K SANTANDER Chile ThUS$ 5,459 16,542 45,416 46,472 3,134 117,023 5,813 16,542 44,010 46,153 3,128 115,646 Quarterly 2.51 1.960-E RRPF ENGINE England ThUS$ 265 2,430 6,856 7,441 8,991 25,983 265 2,430 6,856 7,441 8,991 25,983 Monthly 4.01 4.01
Other loans0-E CITIBANK (*) U.S.A. ThUS$ 21,822 67,859 196,210 - - 285,891 22,586 67,859 194,537 - - 284,982 Quarterly 6.00 6.00
Total 482,153 713,657 2,562,843 1,346,299 2,513,069 7,618,021 508,477 729,534 2,484,733 1,318,241 2,490,731 7,531,716
(*) Bonus securitized with the future flows of credit card sales in the United States and Canada.

F I N A N C I A L S T AT E M E N T S 196Consolidated Financial Statements
75
Interest-bearing loans due in installments to December 31, 2017Debtor: TAM S.A. and Subsidiaries, Tax No. 02.012.862/0001-60, Brazil.
Nominal values Accounting values
More than More than More than More than More than More thanUp to 90 days one to three to More than Total Up to 90 days one to three to More than Total
Creditor 90 to one three five five nominal 90 to one three five five accounting Effective NominalTax No. Creditor country Currency days year years years years value days year years years years value Amortization rate rate
ThUS$ ThUS$ ThUS$ ThUS$ ThUS$ ThUS$ ThUS$ ThUS$ ThUS$ ThUS$ ThUS$ ThUS$ % %
Bank loans
0-E NEDERLANDSCHECREDIETVERZEKERING MAATSCHAPPIJ Holland ThUS$ 130 401 1,161 690 - 2,382 142 401 1,161 690 - 2,394 Monthly 6.01 6.01
Financial leases
0-E NATIXIS France ThUS$ 2,853 6,099 19,682 70,402 - 99,036 3,592 6,099 19,682 70,402 - 99,775 Quarterly/Semiannual 5.59 5.590-E WACAPOU LEASING S.A. Luxemburg ThUS$ 696 2,125 6,020 3,206 - 12,047 732 2,125 6,020 3,207 - 12,084 Quarterly 3.69 3.690-E SOCIÉTÉ GÉNÉRALE MILAN BRANCH Italy ThUS$ 8,964 27,525 208,024 - - 244,513 9,992 27,525 208,024 - - 245,541 Quarterly 4.87 4.810-E BANCO IBM S.A Brazil BRL 21 - - - - 21 21 - - - - 21 Monthly 6.89 6.890-E SOCIETE GENERALE France BRL 101 8 - - - 109 101 8 - - - 109 Monthly 6.89 6.89
Total 12,765 36,158 234,887 74,298 - 358,108 14,580 36,158 234,887 74,299 - 359,924
Total consolidated 494,918 749,815 2,797,730 1,420,597 2,513,069 7,976,129 523,057 765,692 2,719,620 1,392,540 2,490,731 7,891,640
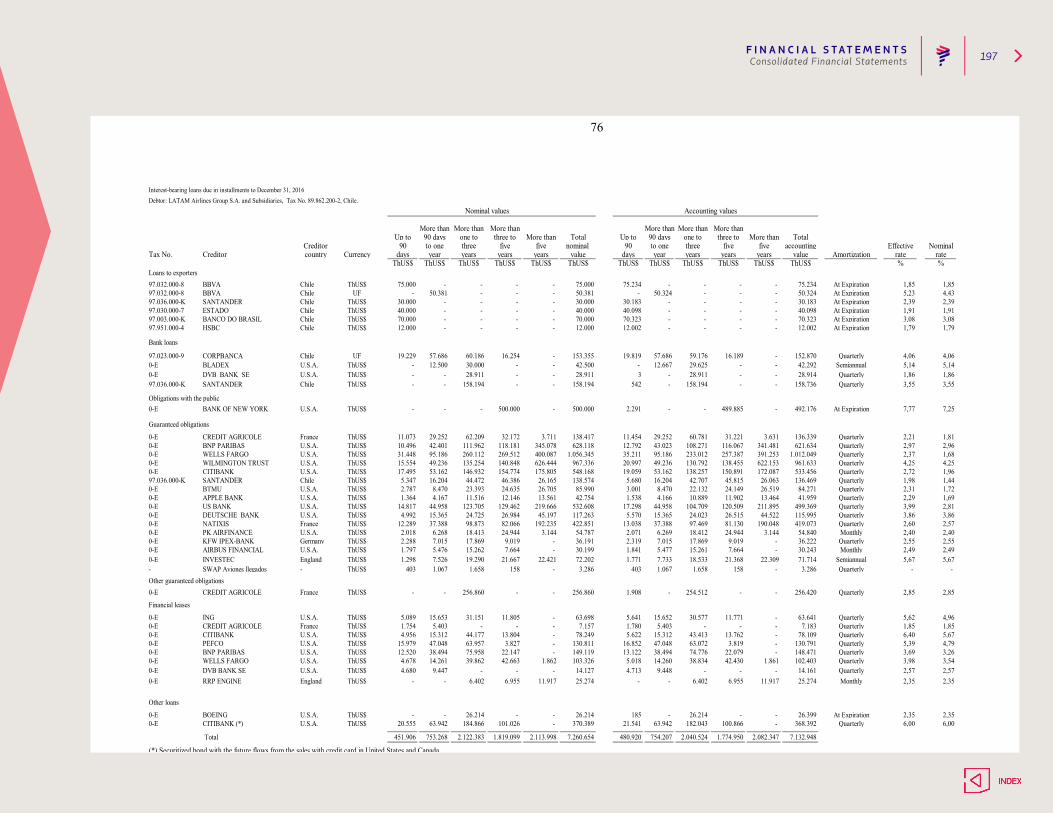
F I N A N C I A L S T AT E M E N T S 197Consolidated Financial Statements
76
Interest-bearing loans due in installments to December 31, 2016 Debtor: LATAM Airlines Group S.A. and Subsidiaries, Tax No. 89.862.200-2, Chile.
Nominal values Accounting values
More than More than More than More than More than More thanUp to 90 days one to three to More than Total Up to 90 days one to three to More than Total
Creditor 90 to one three five five nominal 90 to one three five five accounting Effective NominalTax No. Creditor country Currency days year years years years value days year years years years value Amortization rate rate
ThUS$ ThUS$ ThUS$ ThUS$ ThUS$ ThUS$ ThUS$ ThUS$ ThUS$ ThUS$ ThUS$ ThUS$ % %Loans to exporters97.032.000-8 BBVA Chile ThUS$ 75.000 - - - - 75.000 75.234 - - - - 75.234 At Expiration 1,85 1,8597.032.000-8 BBVA Chile UF - 50.381 - - - 50.381 - 50.324 - - - 50.324 At Expiration 5,23 4,4397.036.000-K SANTANDER Chile ThUS$ 30.000 - - - - 30.000 30.183 - - - - 30.183 At Expiration 2,39 2,3997.030.000-7 ESTADO Chile ThUS$ 40.000 - - - - 40.000 40.098 - - - - 40.098 At Expiration 1,91 1,9197.003.000-K BANCO DO BRASIL Chile ThUS$ 70.000 - - - - 70.000 70.323 - - - - 70.323 At Expiration 3,08 3,0897.951.000-4 HSBC Chile ThUS$ 12.000 - - - - 12.000 12.002 - - - - 12.002 At Expiration 1,79 1,79
Bank loans
97.023.000-9 CORPBANCA Chile UF 19.229 57.686 60.186 16.254 - 153.355 19.819 57.686 59.176 16.189 - 152.870 Quarterly 4,06 4,060-E BLADEX U.S.A. ThUS$ - 12.500 30.000 - - 42.500 - 12.667 29.625 - - 42.292 Semiannual 5,14 5,140-E DVB BANK SE U.S.A. ThUS$ - - 28.911 - - 28.911 3 - 28.911 - - 28.914 Quarterly 1,86 1,8697.036.000-K SANTANDER Chile ThUS$ - - 158.194 - - 158.194 542 - 158.194 - - 158.736 Quarterly 3,55 3,55
Obligations with the public0-E BANK OF NEW YORK U.S.A. ThUS$ - - - 500.000 - 500.000 2.291 - - 489.885 - 492.176 At Expiration 7,77 7,25
Guaranteed obligations
0-E CREDIT AGRICOLE France ThUS$ 11.073 29.252 62.209 32.172 3.711 138.417 11.454 29.252 60.781 31.221 3.631 136.339 Quarterly 2,21 1,810-E BNP PARIBAS U.S.A. ThUS$ 10.496 42.401 111.962 118.181 345.078 628.118 12.792 43.023 108.271 116.067 341.481 621.634 Quarterly 2,97 2,960-E WELLS FARGO U.S.A. ThUS$ 31.448 95.186 260.112 269.512 400.087 1.056.345 35.211 95.186 233.012 257.387 391.253 1.012.049 Quarterly 2,37 1,680-E WILMINGTON TRUST U.S.A. ThUS$ 15.554 49.236 135.254 140.848 626.444 967.336 20.997 49.236 130.792 138.455 622.153 961.633 Quarterly 4,25 4,250-E CITIBANK U.S.A. ThUS$ 17.495 53.162 146.932 154.774 175.805 548.168 19.059 53.162 138.257 150.891 172.087 533.456 Quarterly 2,72 1,9697.036.000-K SANTANDER Chile ThUS$ 5.347 16.204 44.472 46.386 26.165 138.574 5.680 16.204 42.707 45.815 26.063 136.469 Quarterly 1,98 1,440-E BTMU U.S.A. ThUS$ 2.787 8.470 23.393 24.635 26.705 85.990 3.001 8.470 22.132 24.149 26.519 84.271 Quarterly 2,31 1,720-E APPLE BANK U.S.A. ThUS$ 1.364 4.167 11.516 12.146 13.561 42.754 1.538 4.166 10.889 11.902 13.464 41.959 Quarterly 2,29 1,690-E US BANK U.S.A. ThUS$ 14.817 44.958 123.705 129.462 219.666 532.608 17.298 44.958 104.709 120.509 211.895 499.369 Quarterly 3,99 2,810-E DEUTSCHE BANK U.S.A. ThUS$ 4.992 15.365 24.725 26.984 45.197 117.263 5.570 15.365 24.023 26.515 44.522 115.995 Quarterly 3,86 3,860-E NATIXIS France ThUS$ 12.289 37.388 98.873 82.066 192.235 422.851 13.038 37.388 97.469 81.130 190.048 419.073 Quarterly 2,60 2,570-E PK AIRFINANCE U.S.A. ThUS$ 2.018 6.268 18.413 24.944 3.144 54.787 2.071 6.269 18.412 24.944 3.144 54.840 Monthly 2,40 2,400-E KFW IPEX-BANK Germany ThUS$ 2.288 7.015 17.869 9.019 - 36.191 2.319 7.015 17.869 9.019 - 36.222 Quarterly 2,55 2,550-E AIRBUS FINANCIAL U.S.A. ThUS$ 1.797 5.476 15.262 7.664 - 30.199 1.841 5.477 15.261 7.664 - 30.243 Monthly 2,49 2,490-E INVESTEC England ThUS$ 1.298 7.526 19.290 21.667 22.421 72.202 1.771 7.733 18.533 21.368 22.309 71.714 Semiannual 5,67 5,67- SWAP Aviones llegados - ThUS$ 403 1.067 1.658 158 - 3.286 403 1.067 1.658 158 - 3.286 Quarterly - - Other guaranteed obligations0-E CREDIT AGRICOLE France ThUS$ - - 256.860 - - 256.860 1.908 - 254.512 - - 256.420 Quarterly 2,85 2,85
Financial leases
0-E ING U.S.A. ThUS$ 5.089 15.653 31.151 11.805 - 63.698 5.641 15.652 30.577 11.771 - 63.641 Quarterly 5,62 4,960-E CREDIT AGRICOLE France ThUS$ 1.754 5.403 - - - 7.157 1.780 5.403 - - - 7.183 Quarterly 1,85 1,850-E CITIBANK U.S.A. ThUS$ 4.956 15.312 44.177 13.804 - 78.249 5.622 15.312 43.413 13.762 - 78.109 Quarterly 6,40 5,670-E PEFCO U.S.A. ThUS$ 15.979 47.048 63.957 3.827 - 130.811 16.852 47.048 63.072 3.819 - 130.791 Quarterly 5,39 4,790-E BNP PARIBAS U.S.A. ThUS$ 12.520 38.494 75.958 22.147 - 149.119 13.122 38.494 74.776 22.079 - 148.471 Quarterly 3,69 3,260-E WELLS FARGO U.S.A. ThUS$ 4.678 14.261 39.862 42.663 1.862 103.326 5.018 14.260 38.834 42.430 1.861 102.403 Quarterly 3,98 3,540-E DVB BANK SE U.S.A. ThUS$ 4.680 9.447 - - - 14.127 4.713 9.448 - - - 14.161 Quarterly 2,57 2,570-E RRP ENGINE England ThUS$ - - 6.402 6.955 11.917 25.274 - - 6.402 6.955 11.917 25.274 Monthly 2,35 2,35
Other loans
0-E BOEING U.S.A. ThUS$ - - 26.214 - - 26.214 185 - 26.214 - - 26.399 At Expiration 2,35 2,350-E CITIBANK (*) U.S.A. ThUS$ 20.555 63.942 184.866 101.026 - 370.389 21.541 63.942 182.043 100.866 - 368.392 Quarterly 6,00 6,00
Total 451.906 753.268 2.122.383 1.819.099 2.113.998 7.260.654 480.920 754.207 2.040.524 1.774.950 2.082.347 7.132.948
(*) Securitized bond with the future flows from the sales with credit card in United States and Canada.

F I N A N C I A L S T AT E M E N T S 198Consolidated Financial Statements
77
Interest-bearing loans due in installments to December 31, 2016 Debtor: TAM S.A. and Subsidiaries, Tax No. 02.012.862/0001-60, Brazil.
Nominal values Accounting values
More than More than More than More than More than More thanUp to 90 days one to three to More than Total Up to 90 days one to three to More than Total
Creditor 90 to one three five five nominal 90 to one three five five accounting Effective NominalTax No. Creditor country Currency days year years years years value days year years years years value Amortization rate rate
ThUS$ ThUS$ ThUS$ ThUS$ ThUS$ ThUS$ ThUS$ ThUS$ ThUS$ ThUS$ ThUS$ ThUS$ % %
Bank loans
0-E NEDERLANDSCHECREDIETVERZEKERING MAATSCHAPPIJ Holland ThUS$ 122 378 1.094 1.234 54 2.882 137 378 1.094 1.233 55 2.897 Monthly 6,01 6,01
0-E CITIBANK U.S.A ThUS$ - 200.000 - - - 200.000 (151) 199.729 - - - 199.578 At Expiration 3,39 3,14
Obligation with the public
0-E THE BANK OF NEW YORK U.S.A ThUS$ - 300.000 - 500.000 - 800.000 8.173 301.579 4.119 503.298 - 817.169 At Expiration 8,17 8,00
Financial leases
0-E AFS INVESTMENT IX LLC U.S.A ThUS$ 2.086 6.437 18.556 8.369 - 35.448 2.253 6.437 18.556 8.369 - 35.615 Monthly 1,25 1,250-E DVB BANK SE U.S.A ThUS$ 118 164 - - - 282 119 164 - - - 283 Monthly 2,50 2,500-E GENERAL ELECTRIC CAPITAL CORPORATION U.S.A ThUS$ 3.771 5.075 - - - 8.846 3.794 5.075 - - - 8.869 Monthly 2,30 2,300-E KFW IPEX-BANK Germany ThUS$ 579 1.544 - - - 2.123 583 1.544 - - - 2.127 Monthly/Quarterly 2,80 2,800-E NATIXIS France ThUS$ 2.675 5.732 18.485 38.820 41.731 107.443 3.533 5.732 18.485 38.820 41.731 108.301 Quarterly/Semiannual 4,90 4,900-E WACAPOU LEASING S.A. Luxemburg ThUS$ 668 2.038 5.768 6.280 - 14.754 709 2.038 5.768 6.280 - 14.795 Quarterly 3,00 3,000-E SOCIÉTÉ GÉNÉRALE MILAN BRANCH Italy ThUS$ 8.547 26.275 74.783 169.730 - 279.335 9.779 26.275 74.783 169.730 - 280.567 Quarterly 4,18 4,110-E BANCO IBM S.A Brazil BRL 260 749 22 - - 1.031 260 749 21 - - 1.030 Monthly 13,63 13,630-E HP FINANCIAL SERVICE Brazil BRL 222 - - - - 222 222 - - - - 222 Monthly 10,02 10,020-E SOCIETE GENERALE France BRL 102 307 110 - - 519 102 307 110 - - 519 Monthly 13,63 13,63
Total 19.150 548.699 118.818 724.433 41.785 1.452.885 29.513 550.007 122.936 727.730 41.786 1.471.972
Total consolidated 471.056 1.301.967 2.241.201 2.543.532 2.155.783 8.713.539 510.433 1.304.214 2.163.460 2.502.680 2.124.133 8.604.920
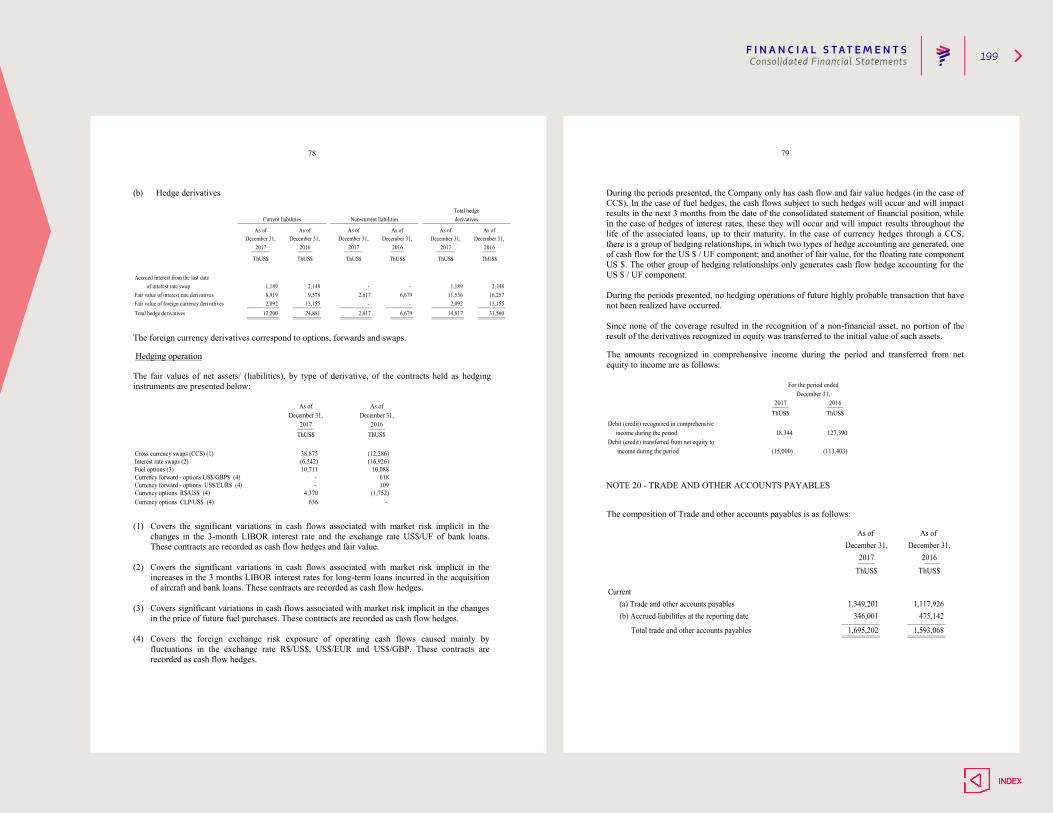
F I N A N C I A L S T AT E M E N T S 199Consolidated Financial Statements
78
(b) Hedge derivatives
Total hedgeCurrent liabilities Non-current liabilities derivatives
As of As of As of As of As of As of
2017 2016December 31, December 31, December 31, December 31, December 31, December 31,
2017 2016 2017 2016
ThUS$
Accrued interest from the last date
ThUS$ ThUS$ ThUS$ ThUS$ ThUS$
2,148Fair value of interest rate derivatives 16,257
of interest rate swap 1,189 2,148 - - 1,1898,919 9,578 2,617 6,679 11,536
- 2,092 13,15531,560Total hedge derivatives 12,200 24,881 2,617 6,679 14,817
Fair value of foreign currency derivatives 2,092 13,155 -
The foreign currency derivatives correspond to options, forwards and swaps.
Hedging operation
The fair values of net assets/ (liabilities), by type of derivative, of the contracts held as hedging instruments are presented below:
Currency forward - options US$/GBP$ (4)Currency forward - options US$/EUR$ (4)Currency options R$/US$ (4) 4,370 (1,752)
- 109
Cross currency swaps (CCS) (1)Interest rate swaps (2)
10,08810,711Fuel options (3)(16,926)(6,542)
- 618
Currency options CLP/US$ (4)
As ofAs ofDecember 31,December 31,
20162017
636 -
ThUS$ThUS$
(12,286)38,875
(1) Covers the significant variations in cash flows associated with market risk implicit in the
changes in the 3-month LIBOR interest rate and the exchange rate US$/UF of bank loans. These contracts are recorded as cash flow hedges and fair value.
(2) Covers the significant variations in cash flows associated with market risk implicit in the increases in the 3 months LIBOR interest rates for long-term loans incurred in the acquisition of aircraft and bank loans. These contracts are recorded as cash flow hedges.
(3) Covers significant variations in cash flows associated with market risk implicit in the changes in the price of future fuel purchases. These contracts are recorded as cash flow hedges.
(4) Covers the foreign exchange risk exposure of operating cash flows caused mainly by fluctuations in the exchange rate R$/US$, US$/EUR and US$/GBP. These contracts are recorded as cash flow hedges.
79
During the periods presented, the Company only has cash flow and fair value hedges (in the case of CCS). In the case of fuel hedges, the cash flows subject to such hedges will occur and will impact results in the next 3 months from the date of the consolidated statement of financial position, while in the case of hedges of interest rates, these they will occur and will impact results throughout the life of the associated loans, up to their maturity. In the case of currency hedges through a CCS, there is a group of hedging relationships, in which two types of hedge accounting are generated, one of cash flow for the US $ / UF component; and another of fair value, for the floating rate component US $. The other group of hedging relationships only generates cash flow hedge accounting for the US $ / UF component. During the periods presented, no hedging operations of future highly probable transaction that have not been realized have occurred. Since none of the coverage resulted in the recognition of a non-financial asset, no portion of the result of the derivatives recognized in equity was transferred to the initial value of such assets.
The amounts recognized in comprehensive income during the period and transferred from net equity to income are as follows:
income during the periodDebit (credit) transferred from net equity to income during the period (15,000)
18,344 127,390
(113,403)
Debit (credit) recognized in comprehensive
For the period endedDecember 31,
2017 2016ThUS$ThUS$
NOTE 20 - TRADE AND OTHER ACCOUNTS PAYABLES
The composition of Trade and other accounts payables is as follows:
As of As of December 31,December 31,
20162017ThUS$ThUS$
Current(a) Trade and other accounts payables 1,349,201 1,117,926(b) Accrued liabilities at the reporting date
Total trade and other accounts payables
346,001
1,695,202
475,142
1,593,068
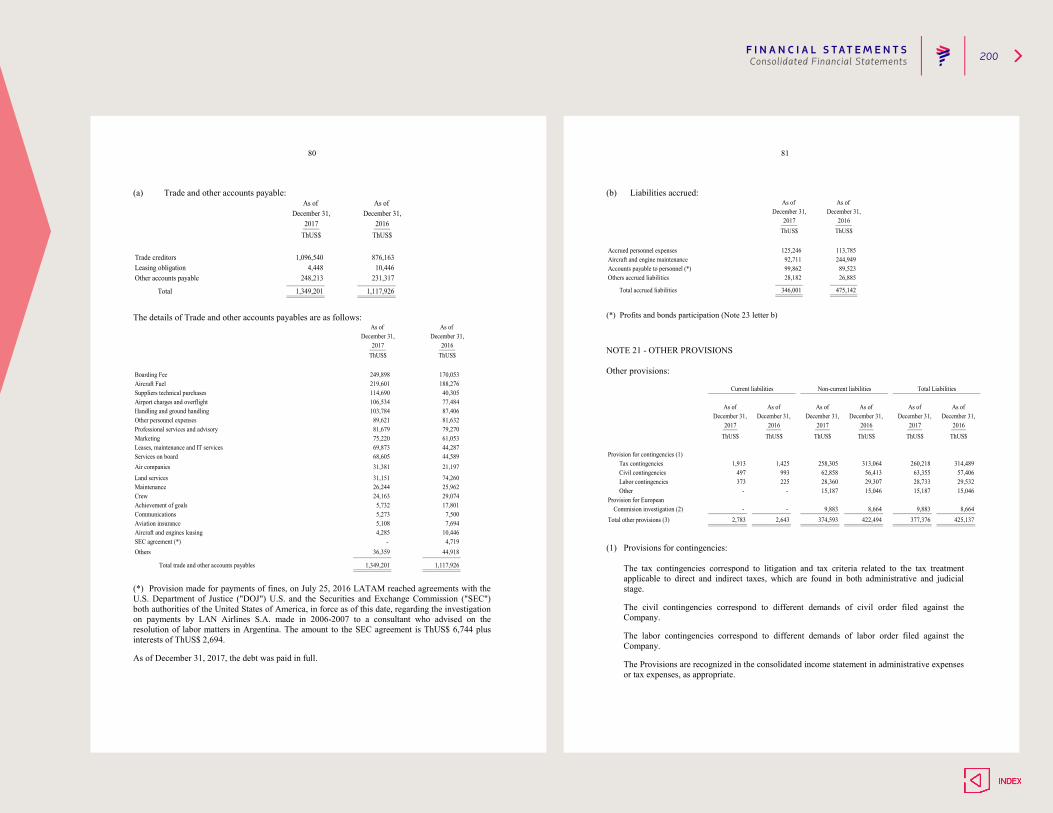
F I N A N C I A L S T AT E M E N T S 200Consolidated Financial Statements
80
(a) Trade and other accounts payable: As of As of
December 31,December 31,20162017
1,117,926
ThUS$ThUS$
876,16310,446
231,317
Trade creditorsLeasing obligationOther accounts payable
Total
1,096,5404,448
248,213
1,349,201
The details of Trade and other accounts payables are as follows:
SEC agreement (*)
87,40681,632
61,053
44,589
As of December 31, December 31,
2017 2016
As of
- 4,719
ThUS$
21,19731,381
ThUS$
249,898 170,053219,601 188,276
79,270
103,784
68,605
Total trade and other accounts payables 1,349,201
Communications
Others
1,117,926
36,359 44,918
7,6945,108Aircraft and engines leasing
Air companies
Aircraft FuelBoarding Fee
Other personnel expensesProfessional services and advisory
Airport charges and overflight
Marketing
Services on board
Handling and ground handling
75,220
106,534
31,151 74,260
4,285 10,446
17,8015,7325,273 7,500
89,62181,679
Aviation insurance
Achievement of goals
Suppliers technical purchases 114,690 40,305
Leases, maintenance and IT services 69,873 44,287
77,484
Land services26,244 25,962Maintenance
Crew 24,163 29,074
(*) Provision made for payments of fines, on July 25, 2016 LATAM reached agreements with the U.S. Department of Justice ("DOJ") U.S. and the Securities and Exchange Commission ("SEC") both authorities of the United States of America, in force as of this date, regarding the investigation on payments by LAN Airlines S.A. made in 2006-2007 to a consultant who advised on the resolution of labor matters in Argentina. The amount to the SEC agreement is ThUS$ 6,744 plus interests of ThUS$ 2,694.
As of December 31, 2017, the debt was paid in full.
81
(b) Liabilities accrued: As of As of
December 31,December 31,20162017
ThUS$ThUS$
Accrued personnel expenses
Accounts payable to personnel (*)
475,142
113,785
28,182 26,88589,52399,862
244,949
Others accrued liabilities
Total accrued liabilities 346,001
125,246Aircraft and engine maintenance 92,711
(*) Profits and bonds participation (Note 23 letter b)
NOTE 21 - OTHER PROVISIONS Other provisions:
2,783 2,643 374,593 422,494 377,376
Civil contingencies 497
ThUS$ ThUS$ ThUS$
993 62,858 56,413
Current liabilities Non-current liabilities Total Liabilities
As of As of As of As of As of As ofDecember 31,
2017 2016 2017 2016 2017 2016December 31, December 31, December 31, December 31, December 31,
ThUS$ ThUS$ThUS$
Tax contingencies 1,913 1,425 258,305 313,064 260,218 314,489Provision for contingencies (1)
63,355 57,40628,733 29,532
Other - - 15,187 15,046 15,187 15,046Labor contingencies 373 225 28,360 29,307
425,137Commision investigation (2) - - 9,883 8,664 9,883 8,664
Provision for European
Total other provisions (3)
(1) Provisions for contingencies:
The tax contingencies correspond to litigation and tax criteria related to the tax treatment
applicable to direct and indirect taxes, which are found in both administrative and judicial stage.
The civil contingencies correspond to different demands of civil order filed against the Company.
The labor contingencies correspond to different demands of labor order filed against the Company.
The Provisions are recognized in the consolidated income statement in administrative expenses or tax expenses, as appropriate.
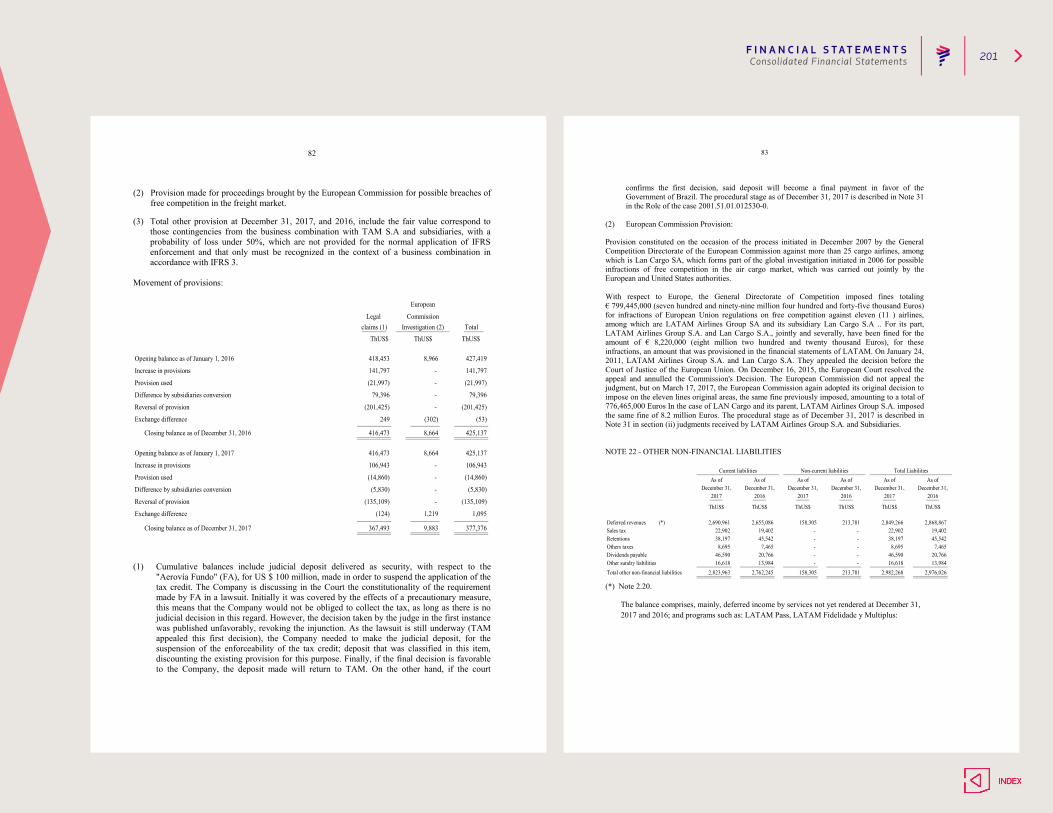
F I N A N C I A L S T AT E M E N T S 201Consolidated Financial Statements
82
(2) Provision made for proceedings brought by the European Commission for possible breaches of free competition in the freight market.
(3) Total other provision at December 31, 2017, and 2016, include the fair value correspond to those contingencies from the business combination with TAM S.A and subsidiaries, with a probability of loss under 50%, which are not provided for the normal application of IFRS enforcement and that only must be recognized in the context of a business combination in accordance with IFRS 3.
Movement of provisions:
Closing balance as of December 31, 2016
Closing balance as of December 31, 2017 367,493 9,883 377,376
Reversal of provision (135,109) - (135,109)
Exchange difference (124) 1,219 1,095
Provision used (14,860) - (14,860)
Difference by subsidiaries conversion (5,830) - (5,830)
425,137
Increase in provisions 106,943 - 106,943
Opening balance as of January 1, 2017 416,473 8,664
European
Total
ThUS$
Legal Commissionclaims (1) Investigation (2)
ThUS$ ThUS$
Opening balance as of January 1, 2016 418,453 8,966 427,419
Increase in provisions 141,797 - 141,797
Provision used (21,997) - (21,997)
Difference by subsidiaries conversion 79,396 - 79,396
416,473 8,664 425,137
Reversal of provision (201,425) - (201,425)
Exchange difference 249 (302) (53)
(1) Cumulative balances include judicial deposit delivered as security, with respect to the
"Aerovía Fundo" (FA), for US $ 100 million, made in order to suspend the application of the tax credit. The Company is discussing in the Court the constitutionality of the requirement made by FA in a lawsuit. Initially it was covered by the effects of a precautionary measure, this means that the Company would not be obliged to collect the tax, as long as there is no judicial decision in this regard. However, the decision taken by the judge in the first instance was published unfavorably, revoking the injunction. As the lawsuit is still underway (TAM appealed this first decision), the Company needed to make the judicial deposit, for the suspension of the enforceability of the tax credit; deposit that was classified in this item, discounting the existing provision for this purpose. Finally, if the final decision is favorable to the Company, the deposit made will return to TAM. On the other hand, if the court
83
confirms the first decision, said deposit will become a final payment in favor of the Government of Brazil. The procedural stage as of December 31, 2017 is described in Note 31 in the Role of the case 2001.51.01.012530-0.
(2) European Commission Provision:
Provision constituted on the occasion of the process initiated in December 2007 by the General Competition Directorate of the European Commission against more than 25 cargo airlines, among which is Lan Cargo SA, which forms part of the global investigation initiated in 2006 for possible infractions of free competition in the air cargo market, which was carried out jointly by the European and United States authorities. With respect to Europe, the General Directorate of Competition imposed fines totaling € 799,445,000 (seven hundred and ninety-nine million four hundred and forty-five thousand Euros) for infractions of European Union regulations on free competition against eleven (11 ) airlines, among which are LATAM Airlines Group SA and its subsidiary Lan Cargo S.A .. For its part, LATAM Airlines Group S.A. and Lan Cargo S.A., jointly and severally, have been fined for the amount of € 8,220,000 (eight million two hundred and twenty thousand Euros), for these infractions, an amount that was provisioned in the financial statements of LATAM. On January 24, 2011, LATAM Airlines Group S.A. and Lan Cargo S.A. They appealed the decision before the Court of Justice of the European Union. On December 16, 2015, the European Court resolved the appeal and annulled the Commission's Decision. The European Commission did not appeal the judgment, but on March 17, 2017, the European Commission again adopted its original decision to impose on the eleven lines original areas, the same fine previously imposed, amounting to a total of 776,465,000 Euros In the case of LAN Cargo and its parent, LATAM Airlines Group S.A. imposed the same fine of 8.2 million Euros. The procedural stage as of December 31, 2017 is described in Note 31 in section (ii) judgments received by LATAM Airlines Group S.A. and Subsidiaries. NOTE 22 - OTHER NON-FINANCIAL LIABILITIES
Deferred revenues
46,590 20,766Dividends payable 46,590 20,766 - -
December 31, December 31,
Current liabilities Non-current liabilities Total LiabilitiesAs of As of As of As of As of As of
December 31, December 31, December 31, December 31,2016
ThUS$ ThUS$ ThUS$ ThUS$ ThUS$
2017 2016 2017 2016 2017
ThUS$
213,781 2,849,266 2,868,867Sales tax 22,902 19,402 - - 22,902 19,402
(*) 2,690,961 2,655,086 158,305
38,197 45,542Others taxes 8,695 7,465 - - 8,695 7,465Retentions 38,197 45,542 - -
16,618 13,984Total other non-financial liabilities 2,823,963 2,762,245 158,305 213,781 2,982,268 2,976,026Other sundry liabilities 16,618 13,984 - -
(*) Note 2.20.
The balance comprises, mainly, deferred income by services not yet rendered at December 31, 2017 and 2016; and programs such as: LATAM Pass, LATAM Fidelidade y Multiplus:

F I N A N C I A L S T AT E M E N T S 202Consolidated Financial Statements
84
LATAM Pass is the frequent passenger program created by LAN to reward the preference and loyalty of its customers with multiple benefits and privileges, through the accumulation of kilometers that can be exchanged for free flight tickets or for a varied range of products and services. Customers accumulate LATAM Pass kilometers every time they fly on LAN, TAM, oneworld® member companies and other airlines associated with the program, as well as buying at stores or using the services of a vast network of companies that have an agreement with the program around the world.
For its part, TAM, thinking of people who travel constantly, created the LATAM Fidelidade program, in order to improve the service and give recognition to those who choose the company. Through the program, customers accumulate points in a wide variety of loyalty programs in a single account and can redeem them in all TAM destinations and associated airline companies, and even more, participate in the Multiplus Fidelidade Network.
Multiplus is a coalition of loyalty programs, with the objective of operating accumulation and exchange of points. This program has a network integrated by associated companies, including hotels, financial institutions, retail companies, supermarkets, vehicle leases and magazines, among many other partners from different segments.
NOTE 23 - EMPLOYEE BENEFITS
35,844
101,087
22,545
82,322Total liability for employee benefits
Other obligations
As of As ofDecember 31, December 31,
2017 2016
Retirements paymentsResignation payments
ThUS$ ThUS$
55,11910,124
49,68010,097
(a) The movement in retirements and resignation payments and other obligations:
From January 1 toDecember 31, 2016
From January 1 toDecember 31, 2017
Actuarial(gains)losses
ThUS$
3,105 82,322
balance
65,271 17,487 (4,536) 995
Increase (decrease)
translation
(2,763)
Opening current service Currency ClosingBenefits
ThUS$ ThUS$ ThUS$ ThUS$
balance provision paid
ThUS$
101,08782,322 21,635 5,292(5,399)
85
The principal assumptions used in the calculation to the provision in Chile are presented below:
20162017
Retirement age of men
As ofDecember 31,
Assumptions
Discount rate 4.55% 4.54%Expected rate of salary increaseRate of turnover Mortality rateInflation rateRetirement age of women
4.50% 4.50%
60 6065 65
6.98% 6.16%RV-2014 RV-2009
2.72% 2.86%
The discount rate corresponds to the 20-year term rate of the BCP Central Bank of Chile Bonds. The RV-2014 mortality tables correspond to those established by the Commission for the Financial Market of Chile and for the determination of the inflation rates; the market performance curves of Central Bank of Chile papers of the BCUs have been used. BCP long term at the date of scope. The calculation of the present value of the defined benefit obligation is sensitive to the variation of some actuarial assumptions such as discount rate, salary increase, rotation and inflation. The sensitivity analysis for these variables is presented below:
(5.665)5.952
6.334(5.644)
Effect on the liabilityAs of
December 31,2016
ThUS$
6.617
6.412(5.750)
As ofDecember 31,
2017
Change in the accrued liability an closing for decrease of 100 p.b.
Discount rate
Rate of wage growth
(5.795)
ThUS$
Change in the accrued liability an closing for increase in 100 p.b.Change in the accrued liability an closing for decrease of 100 p.b.
Change in the accrued liability an closing for increase in 100 p.b.
(b) The liability for short-term:
89,52399,862Profit-sharing and bonuses (*)
ThUS$ ThUS$
As of As ofDecember 31, December 31,
2017 2016
(*) Accounts payables to employees (Note 20 letter b)
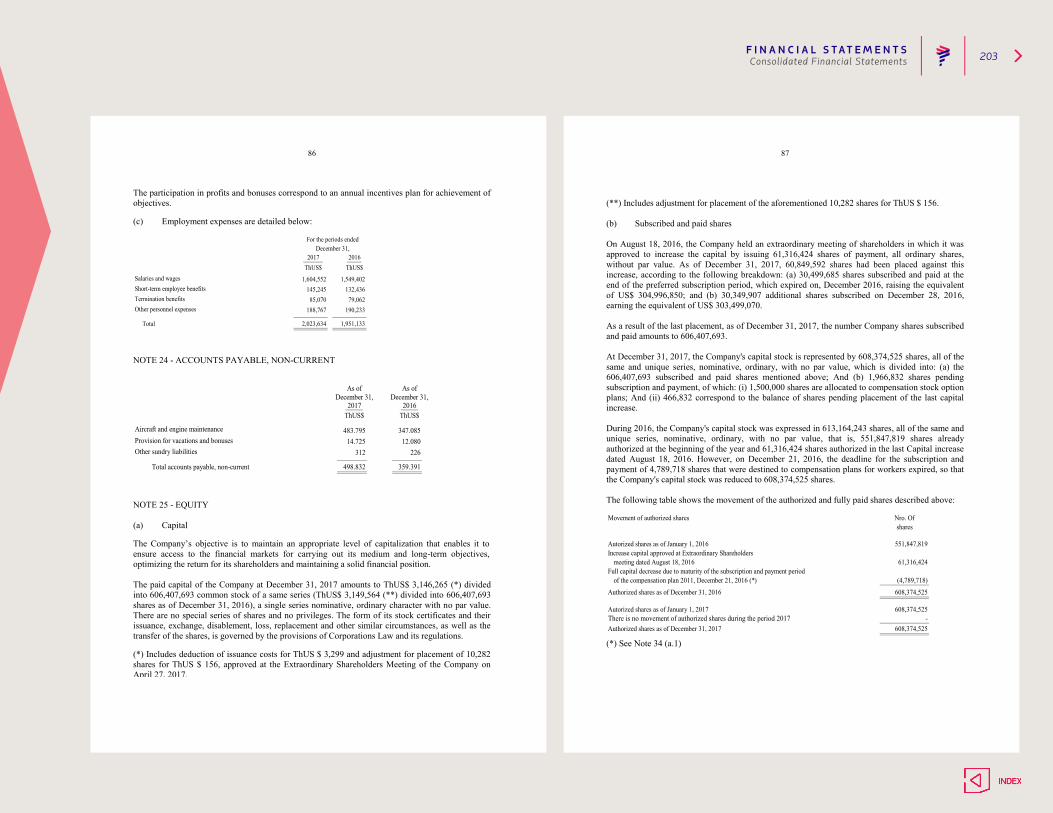
F I N A N C I A L S T AT E M E N T S 203Consolidated Financial Statements
86
The participation in profits and bonuses correspond to an annual incentives plan for achievement of objectives.
(c) Employment expenses are detailed below:
2,023,634 1,951,133
For the periods endedDecember 31,
2017 2016
188,767 190,233
145,245 132,43685,070 79,062
ThUS$ ThUS$
1,604,552 1,549,402Salaries and wages
Termination benefitsOther personnel expenses
Total
Short-term employee benefits
NOTE 24 - ACCOUNTS PAYABLE, NON-CURRENT
498.832
22612.080
347.085
359.391
31214.725
483.795Aircraft and engine maintenanceProvision for vacations and bonusesOther sundry liabilities
Total accounts payable, non-current
ThUS$ ThUS$
As of As ofDecember 31, December 31,
2017 2016
NOTE 25 - EQUITY (a) Capital
The Company’s objective is to maintain an appropriate level of capitalization that enables it to ensure access to the financial markets for carrying out its medium and long-term objectives, optimizing the return for its shareholders and maintaining a solid financial position. The paid capital of the Company at December 31, 2017 amounts to ThUS$ 3,146,265 (*) divided into 606,407,693 common stock of a same series (ThUS$ 3,149,564 (**) divided into 606,407,693 shares as of December 31, 2016), a single series nominative, ordinary character with no par value. There are no special series of shares and no privileges. The form of its stock certificates and their issuance, exchange, disablement, loss, replacement and other similar circumstances, as well as the transfer of the shares, is governed by the provisions of Corporations Law and its regulations.
(*) Includes deduction of issuance costs for ThUS $ 3,299 and adjustment for placement of 10,282 shares for ThUS $ 156, approved at the Extraordinary Shareholders Meeting of the Company on April 27, 2017.
87
(**) Includes adjustment for placement of the aforementioned 10,282 shares for ThUS $ 156. (b) Subscribed and paid shares On August 18, 2016, the Company held an extraordinary meeting of shareholders in which it was approved to increase the capital by issuing 61,316,424 shares of payment, all ordinary shares, without par value. As of December 31, 2017, 60,849,592 shares had been placed against this increase, according to the following breakdown: (a) 30,499,685 shares subscribed and paid at the end of the preferred subscription period, which expired on, December 2016, raising the equivalent of US$ 304,996,850; and (b) 30,349,907 additional shares subscribed on December 28, 2016, earning the equivalent of US$ 303,499,070. As a result of the last placement, as of December 31, 2017, the number Company shares subscribed and paid amounts to 606,407,693. At December 31, 2017, the Company's capital stock is represented by 608,374,525 shares, all of the same and unique series, nominative, ordinary, with no par value, which is divided into: (a) the 606,407,693 subscribed and paid shares mentioned above; And (b) 1,966,832 shares pending subscription and payment, of which: (i) 1,500,000 shares are allocated to compensation stock option plans; And (ii) 466,832 correspond to the balance of shares pending placement of the last capital increase. During 2016, the Company's capital stock was expressed in 613,164,243 shares, all of the same and unique series, nominative, ordinary, with no par value, that is, 551,847,819 shares already authorized at the beginning of the year and 61,316,424 shares authorized in the last Capital increase dated August 18, 2016. However, on December 21, 2016, the deadline for the subscription and payment of 4,789,718 shares that were destined to compensation plans for workers expired, so that the Company's capital stock was reduced to 608,374,525 shares. The following table shows the movement of the authorized and fully paid shares described above:
Movement of authorized shares
Autorized shares as of January 1, 2016Increase capital approved at Extraordinary Shareholders
meeting dated August 18, 2016Full capital decrease due to maturity of the subscription and payment period
of the compensation plan 2011, December 21, 2016 (*)
Autorized shares as of January 1, 2017There is no movement of authorized shares during the period 2017
61,316,424
Nro. Ofshares
(4,789,718)
551,847,819
608,374,525-
608,374,525
Authorized shares as of December 31, 2016 608,374,525
Authorized shares as of December 31, 2017
(*) See Note 34 (a.1)

F I N A N C I A L S T AT E M E N T S 204Consolidated Financial Statements
88
Movement fully paid shares
Paid shares as of January 1, 2016Approved at Extraordinary Shereholders
meeting dated August 18, 2016Capital reserveIncrease (decrease) by transfers
and other changes (4)
Paid shares as of January 1, 2017Capital reserve
(3)
(4,793)-- (4,793)
(3,299)3,146,265
(3,299)(14,453)
and placement of shares (2)
ThUS$ThUS$
(6,361) 2,545,705
Paid- in
3,149,564(11,154)
3,149,564
Capital
608,496
- 156
608,496 -
10,282 156
Paid shares as of December 31, 2017 606,407,693 3,160,718
Paid shares as of December 31, 2016 606,407,693
- -
60,849,592
606,407,693
Movementvalue
3,160,718
sharesN° of
of shares(1)
ThUS$
545,547,819 2,552,066
Cost of issuance
3,160,718 (11,154)
(1) Amounts reported represent only those arising from the payment of the shares subscribed.
(2) Decrease of capital by capitalization of reserves for cost of issuance and placement of shares established according to Extraordinary Shareholder´s Meetings, where such decreases were authorized.
(3) At December 31, 2017, the difference between authorized shares and fully paid shares are 1,966,832 shares, of which 1,500,000 correspond to compensation plans for executives of LATAM Airlines Group S.A. and subsidiaries (see Note 34(a.2)) and 466,832 correspond to the shares issued and unsubscribed from the capital increase approved at the Extraordinary Shareholders Meeting held on August 18, 2016.
(4) These 10,282 shares were placed in January 2014 and charged to the Compensation plan 2011 (See Note 34 (a.1))
(c) Treasury stock
At December 31, 2017, the Company held no treasury stock, the remaining of ThUS$ (178) corresponds to the difference between the amount paid for the shares and their book value, at the time of the full right decrease of the shares which held in its portfolio.
(d) Reserve of share- based payments
Movement of Reserves of share- based payments:
From January 1 to December 31, 2016From January 1 to December 31, 2017
38,53835,647 3,698 (807) 2,891
Stock Opening option Deferred Closing
Periods balance plan tax balanceNet movementof the period
ThUS$ThUS$ ThUS$ ThUS$ ThUS$
38,538 943 - 39,481943
These reserves are related to the “Share-based payments” explained in Note 34.
89
(e) Other sundry reserves
Movement of Other sundry reserves:
From January 1 to December 31, 2016From January 1 to December 31, 2017
Opening Legal ClosingPeriods balance reserves balance
(501) 2,639,780
ThUS$ ThUS$
5,602 2,640,281
ThUS$
2,640,2812,634,679
Balance of Other sundry reserves comprises the following:
Transactions with non-controlling interest (3) (25,911)Cost of issuance and placement of shares 0Others
Total 2,640,281
(2,621)
As ofDecember 31,
ThUS$
2,639,780
2,620(25,911)
(9)(2,111)
Reserve for the adjustment to the value of fixed assets (2) 2,620
As ofDecember 31,
2016
ThUS$
Higher value for TAM S.A. share exchange (1) 2,665,692 2,665,692
2017
(1) Corresponds to the difference in the shares value of TAM S.A. acquired (under subscriptions) by Sister Holdco S.A. and Holdco II S.A. (under the Exchange Offer), as stipulated in the Declaration of Posting of Merger by Absorption and the fair value of these exchange shares of LATAM Airlines Group S.A. at June 22, 2012.
(2) Corresponds to the technical revaluation of fixed assets authorized by the Commission for the Financial Market in 1979, in Circular N° 1529. The revaluation was optional and could be taken only once, the reserve is not distributable and can only be capitalized.
(3) The balance at December 31, 2017, correspond to the loss generated by the participation of Lan Pax Group S.A. and Inversiones Lan S.A. in the acquisition of shares of Aerovías de Integración Regional Aires of ThUS$ (3,480) and ThUS$ (20), respectively; the acquisition of TAM S.A. of the minority holding of Aerolinhas Brasileiras S.A. of ThUS$ (885) and the acquisition of minority interest of Aerolane S.A. by Lan Pax group S.A. through Holdco Ecuador S.A. for US$ (21,526).
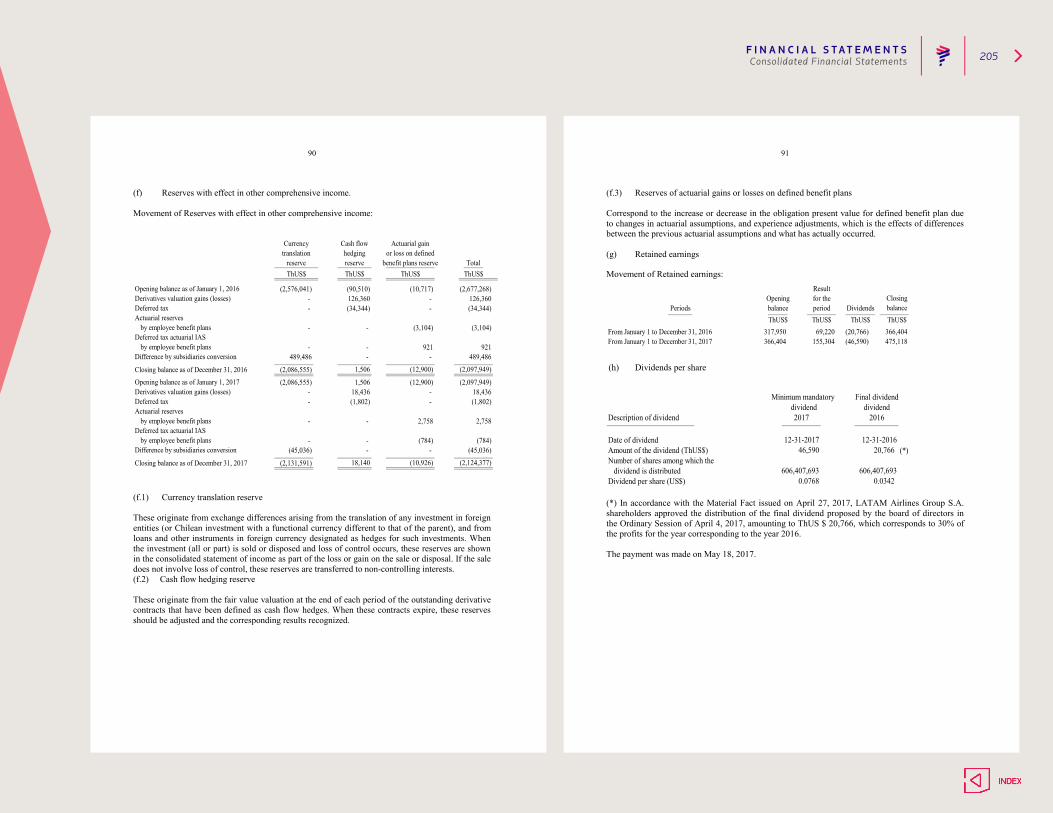
F I N A N C I A L S T AT E M E N T S 205Consolidated Financial Statements
90
(f) Reserves with effect in other comprehensive income. Movement of Reserves with effect in other comprehensive income:
Closing balance as of December 31, 2016 (2,086,555) 1,506 (12,900) (2,097,949)
Difference by subsidiaries conversion 489,486 - - 489,486by employee benefit plans - - 921 921
(3,104)Deferred tax actuarial IAS
Actuarial reserves by employee benefit plans - - (3,104)
Deferred tax - (34,344) - (34,344)Derivatives valuation gains (losses) - 126,360 - 126,360Opening balance as of January 1, 2016 (2,576,041) (90,510) (10,717) (2,677,268)
Actuarial gainor loss on defined
benefit plans reserve
Cash flowhedgingreserve Total
Currency
ThUS$ ThUS$reserve
translation
ThUS$ThUS$
2,758
Opening balance as of January 1, 2017 (2,086,555) 1,506 (12,900) (2,097,949)Derivatives valuation gains (losses) - 18,436 - 18,436
Actuarial reserves by employee benefit plans - - 2,758
Deferred tax - (1,802) - (1,802)
by employee benefit plans - - (784) (784)Deferred tax actuarial IAS
Closing balance as of December 31, 2017 (2,131,591) 18,140 (10,926) (2,124,377)
Difference by subsidiaries conversion (45,036) - - (45,036)
(f.1) Currency translation reserve These originate from exchange differences arising from the translation of any investment in foreign entities (or Chilean investment with a functional currency different to that of the parent), and from loans and other instruments in foreign currency designated as hedges for such investments. When the investment (all or part) is sold or disposed and loss of control occurs, these reserves are shown in the consolidated statement of income as part of the loss or gain on the sale or disposal. If the sale does not involve loss of control, these reserves are transferred to non-controlling interests. (f.2) Cash flow hedging reserve These originate from the fair value valuation at the end of each period of the outstanding derivative contracts that have been defined as cash flow hedges. When these contracts expire, these reserves should be adjusted and the corresponding results recognized.
91
(f.3) Reserves of actuarial gains or losses on defined benefit plans Correspond to the increase or decrease in the obligation present value for defined benefit plan due to changes in actuarial assumptions, and experience adjustments, which is the effects of differences between the previous actuarial assumptions and what has actually occurred. (g) Retained earnings
Movement of Retained earnings:
(46,590)From January 1 to December 31, 2017 366,404From January 1 to December 31, 2016 317,950 69,220 (20,766)
DividendsThUS$
Result
475,118155,304
ThUS$ ThUS$ ThUS$
ClosingOpening for the
366,404
Periods balance period balance
(h) Dividends per share
(*)
Dividend per share (US$) 0.0768 0.0342 dividend is distributed
Number of shares among which the
Date of dividendAmount of the dividend (ThUS$)
12-31-2017
606,407,693 606,407,693
46,590 20,766 12-31-2016
Description of dividend 2017 2016
Minimum mandatory dividend
Final dividenddividend
(*) In accordance with the Material Fact issued on April 27, 2017, LATAM Airlines Group S.A. shareholders approved the distribution of the final dividend proposed by the board of directors in the Ordinary Session of April 4, 2017, amounting to ThUS $ 20,766, which corresponds to 30% of the profits for the year corresponding to the year 2016. The payment was made on May 18, 2017.
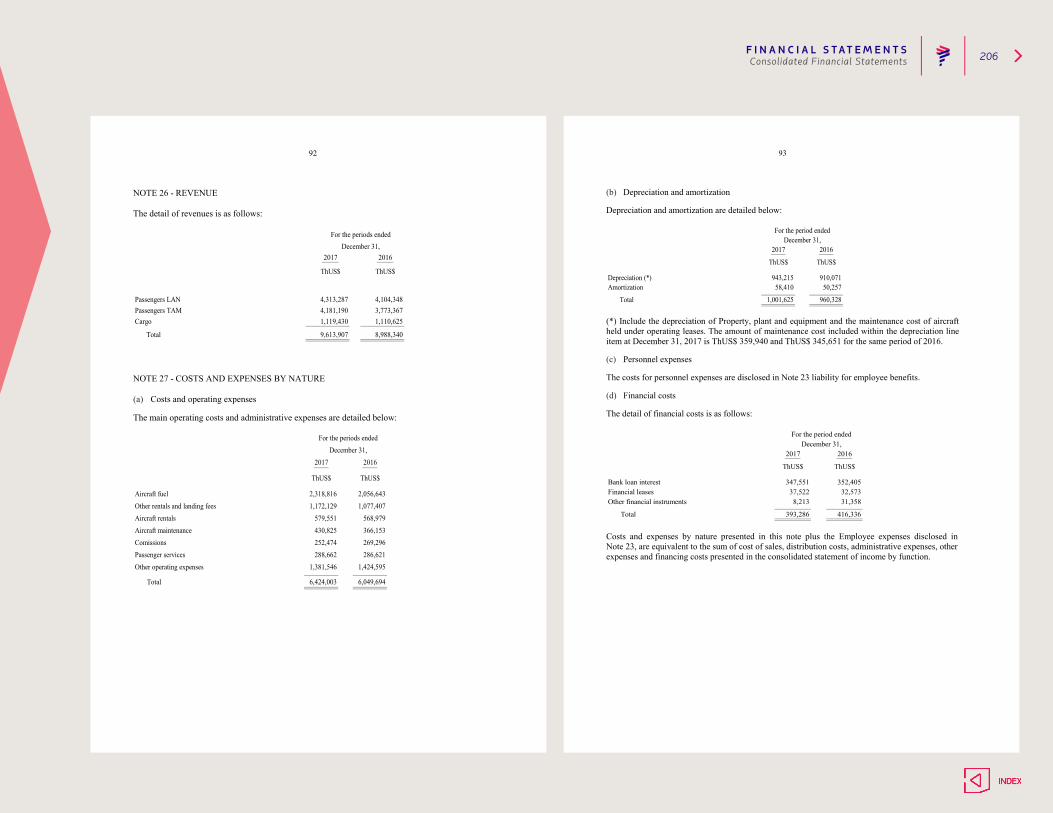
F I N A N C I A L S T AT E M E N T S 206Consolidated Financial Statements
92
NOTE 26 - REVENUE The detail of revenues is as follows:
Total
Passengers TAMCargo
Passengers LAN
9,613,907
ThUS$
For the periods endedDecember 31,
2017
1,119,430
4,313,2874,181,190
8,988,340
2016
ThUS$
4,104,3483,773,3671,110,625
NOTE 27 - COSTS AND EXPENSES BY NATURE (a) Costs and operating expenses
The main operating costs and administrative expenses are detailed below:
Aircraft maintenance 430,825 366,153Comissions 252,474 269,296
Total 6,424,003 6,049,694
Passenger services 288,662 286,621Other operating expenses 1,381,546 1,424,595
Aircraft rentals 579,551 568,979
ThUS$ ThUS$
Aircraft fuel 2,318,816 2,056,643Other rentals and landing fees 1,172,129 1,077,407
For the periods endedDecember 31,
2017 2016
93
(b) Depreciation and amortization
Depreciation and amortization are detailed below:
Depreciation (*) 943,215 910,071Amortization 58,410 50,257
Total 1,001,625 960,328
For the period endedDecember 31,
2017
ThUS$
2016
ThUS$
(*) Include the depreciation of Property, plant and equipment and the maintenance cost of aircraft held under operating leases. The amount of maintenance cost included within the depreciation line item at December 31, 2017 is ThUS$ 359,940 and ThUS$ 345,651 for the same period of 2016.
(c) Personnel expenses
The costs for personnel expenses are disclosed in Note 23 liability for employee benefits.
(d) Financial costs
The detail of financial costs is as follows:
347,55137,522
352,40532,573
For the period endedDecember 31,
2017
ThUS$
2016
ThUS$
Total 393,286 416,336
Other financial instruments 8,213 31,358Financial leasesBank loan interest
Costs and expenses by nature presented in this note plus the Employee expenses disclosed in Note 23, are equivalent to the sum of cost of sales, distribution costs, administrative expenses, other expenses and financing costs presented in the consolidated statement of income by function.
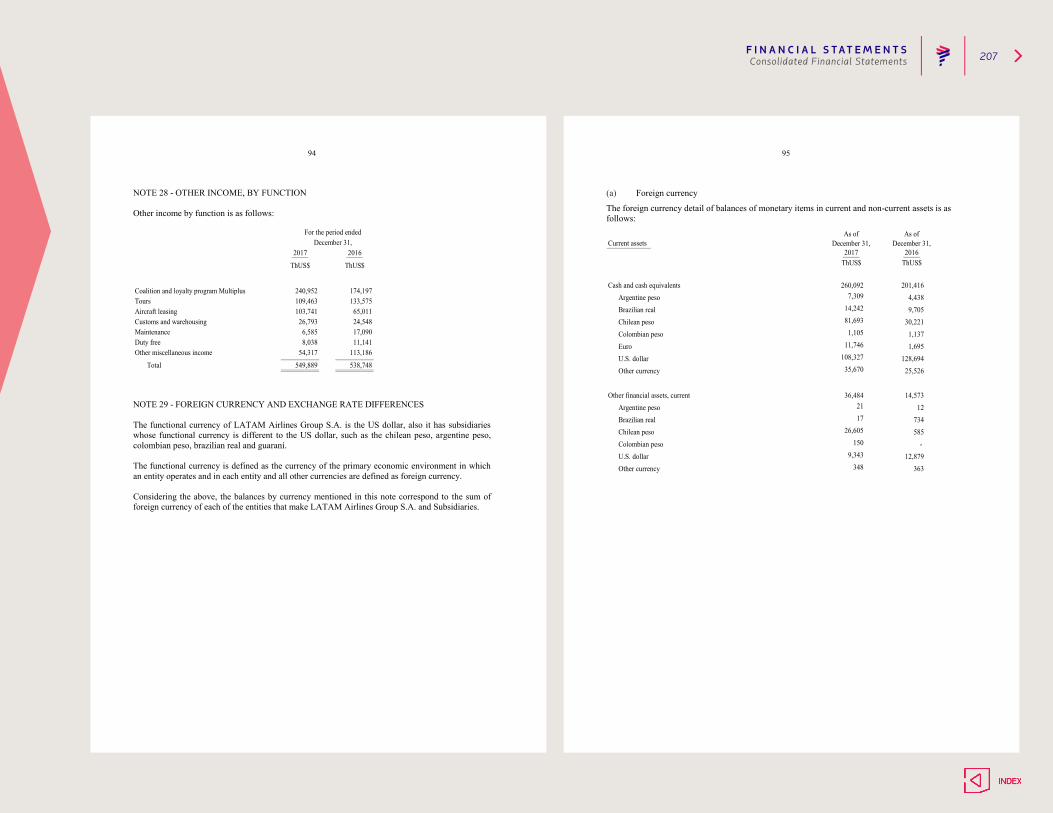
F I N A N C I A L S T AT E M E N T S 207Consolidated Financial Statements
94
NOTE 28 - OTHER INCOME, BY FUNCTION Other income by function is as follows:
2016
ThUS$
174,197133,575
65,011
Coalition and loyalty program Multiplus 240,952
24,54817,09011,141
113,186
538,748
26,7936,5858,038
Total 549,889
For the period endedDecember 31,
2017
ThUS$
Tours 109,463
Other miscellaneous income 54,317
Aircraft leasing 103,741
Duty free
Customs and warehousingMaintenance
NOTE 29 - FOREIGN CURRENCY AND EXCHANGE RATE DIFFERENCES The functional currency of LATAM Airlines Group S.A. is the US dollar, also it has subsidiaries whose functional currency is different to the US dollar, such as the chilean peso, argentine peso, colombian peso, brazilian real and guaraní. The functional currency is defined as the currency of the primary economic environment in which an entity operates and in each entity and all other currencies are defined as foreign currency. Considering the above, the balances by currency mentioned in this note correspond to the sum of foreign currency of each of the entities that make LATAM Airlines Group S.A. and Subsidiaries.
95
(a) Foreign currency
The foreign currency detail of balances of monetary items in current and non-current assets is as follows:
As of
2016December 31,
348
As of
14,24281,693
1,10511,746
108,327
7,309
17
Current assets
ThUS$
9,343
35,670
36,484
December 31,
ThUS$
150
2017
21
26,605
260,092 Argentine peso Brazilian real
Cash and cash equivalents
Other currency
Colombian peso U.S. dollar
Euro
Chilean peso
Other currency
Argentine peso
U.S. dollar
Other financial assets, current
Brazilian real
Chilean peso Colombian peso
734
12,879363
201,4164,4389,705
25,526
14,57312
585 -
30,2211,1371,695
128,694

F I N A N C I A L S T AT E M E N T S 208Consolidated Financial Statements
96
Current assets
63,73476,690Argentine peso
Brazilian real
U.S. dollar
Colombian peso
177Peruvian sol 14,387
59,885
811,726 603,734
Other currency
Total current assets75,196
Other currency
Euro U.S. dollar Other currency
89,081205,993
25,45412,988
6,333
1,350
U.S. Dollar
Colombian pesoEuro
Chilean peso
Chilean peso
Argentine peso 1,798 Brazilian real 2,462
129,794
As of
December 31,2016
90,48230,67554,356
251,204
2017ThUS$ ThUS$
December 31,
As of
3402,722
21,90711,750
22,00682,369
49,680
Chilean peso Colombian peso
554
Colombian peso
373,447Trade and other accounts receivable, current
Accounts receivable from related entities, current
Euro 2731,418
Other currency 17,493 U.S. dollar 50,157
713 Euro 1,563
Argentine peso Brazilian real
28,198
Brazilian real 20,158 Chilean peso 1,619
Other non - financial assets, current 107,170 107,789 Argentine peso 16,08616,507
19,68634,258
29,96214,08621,923
9,720
958
Tax current assets
Chilean peso 735 554
1,16948,28634,268
33,575
U.S. dollar 223 -
3,42462,933
174,395206,916
135,669
228,977
1,6793,9343,317
660179327
21,9481,531
97
Non-current assets
Other financial assets, non-current Brazilian real Chilean peso Colombian peso Euro U.S. dollar
Other currency
Other non - financial assets, non-current Argentine peso Brazilian real U.S. dollar
Other currency
Accounts receivable, non-currentChilean peso
Deferred tax assetsColombian pesoOther currency
Total non-current assets Argentine peso Brazilian real Chilean peso Colombian peso Euro U.S. dollar
Other currency
172
6,188
10,1996,961
3677,8537,311
1726,368
23,2298,331
7,3566,887
55,307142
8,7987,439
402
2,110117
6,966
6,029
39,051
6,887
2,08186
1,995 1,993
382,530
ThUS$
26,772
1,749
19,069142
8,3094,589
7,356
14,920
2,76983
2856,966
7,2731,663
9,108
As of December 31,
2016ThUS$
20,9753,831
74281
7,853
As of December 31,
2017
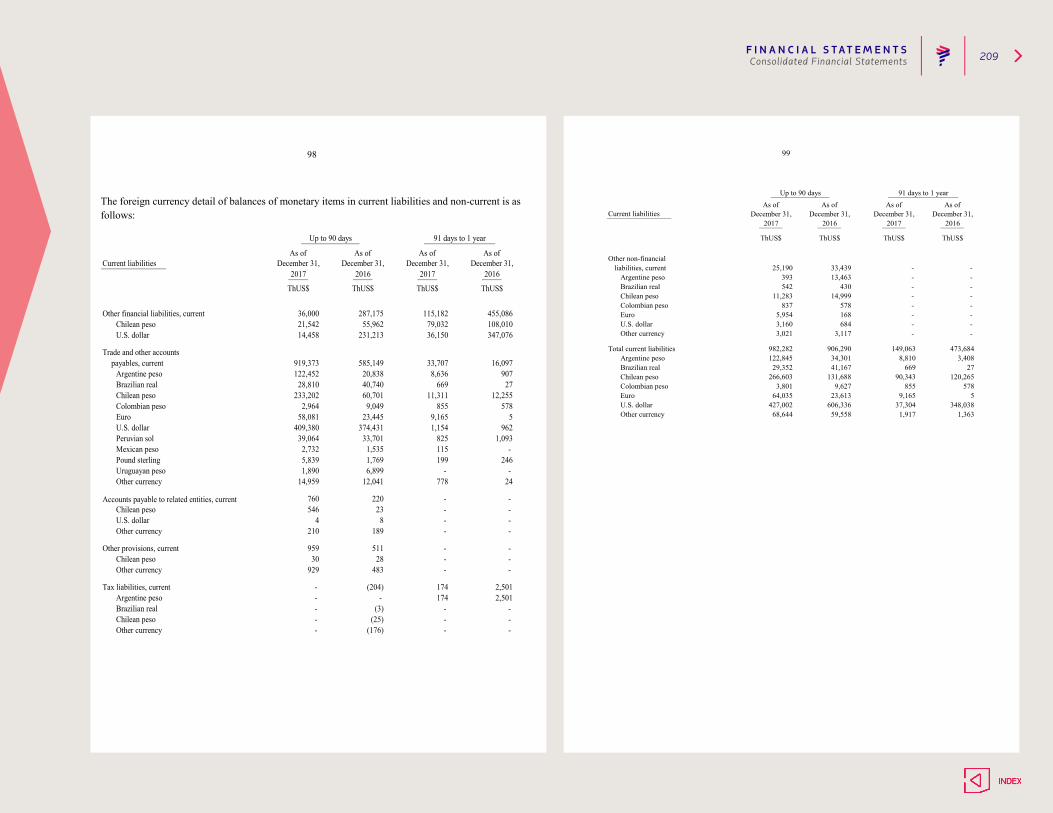
F I N A N C I A L S T AT E M E N T S 209Consolidated Financial Statements
98
The foreign currency detail of balances of monetary items in current liabilities and non-current is as follows:
Brazilian real - (3) - -
5,8391,890
14,959
Other currency 929 483 - -
Other provisions, current 959 511 - - Chilean peso 30 28
Argentine peso - -
ThUS$
24
246
189 - -
122,45228,810
233,2022,964
58,081409,380
39,0642,732
8,636669
11,311855
9,165
Up to 90 days 91 days to 1 year
As of As of As of As of
ThUS$ ThUS$ ThUS$
Current liabilities December 31, December 31, December 31, December 31,2017 2016 2017 2016
Other financial liabilities, current 36,000 287,175 115,182 455,086Chilean peso 21,542 55,962 79,032 108,010U.S. dollar 14,458 231,213 36,150 347,076
payables, current 919,373 585,149 33,707 16,097Argentine peso 20,838 907Brazilian real 40,740 27Chilean peso 60,701 12,255Colombian peso 9,049 578Euro 23,445 5U.S. dollar 374,431 962Peruvian sol 33,701 1,093
Uruguayan peso 6,899 - Pound sterling 1,769
1,154825115199
-
Trade and other accounts
Tax liabilities, current - (204) 174 2,501
Chilean peso 546 23 - - U.S. dollar 4 8 - -
Other currency 12,041
Other currency 210
Other currency - (176) - - Chilean peso - (25) - -
174
Mexican peso 1,535 -
Accounts payable to related entities, current 760 220 - -
- -
2,501
778
99
Up to 90 days 91 days to 1 yearAs of As of As of As of
ThUS$ ThUS$ ThUS$ ThUS$
Current liabilities December 31, December 31, December 31, December 31,2017 2016 2017 2016
Other non-financialliabilities, current 25,190 33,439 - -
Argentine peso 13,463 - - Brazilian real 430 - -
393542
Chilean peso 14,999 - - Colombian peso 578 - -
11,283837
Euro 168 - - U.S. dollar 684 - -
5,9543,160
Other currency 3,117 - - 3,021
Total current liabilities 982,282 906,290 149,063 473,684Argentine peso 34,301 3,408122,845 8,810Brazilian real 41,167 27Chilean peso 131,688 120,265
29,352266,603
66990,343
Colombian peso 9,627 578Euro 23,613 5
3,80164,035
8559,165
Other currency 59,558 1,363U.S. dollar 606,336 348,038427,002
68,64437,304
1,917
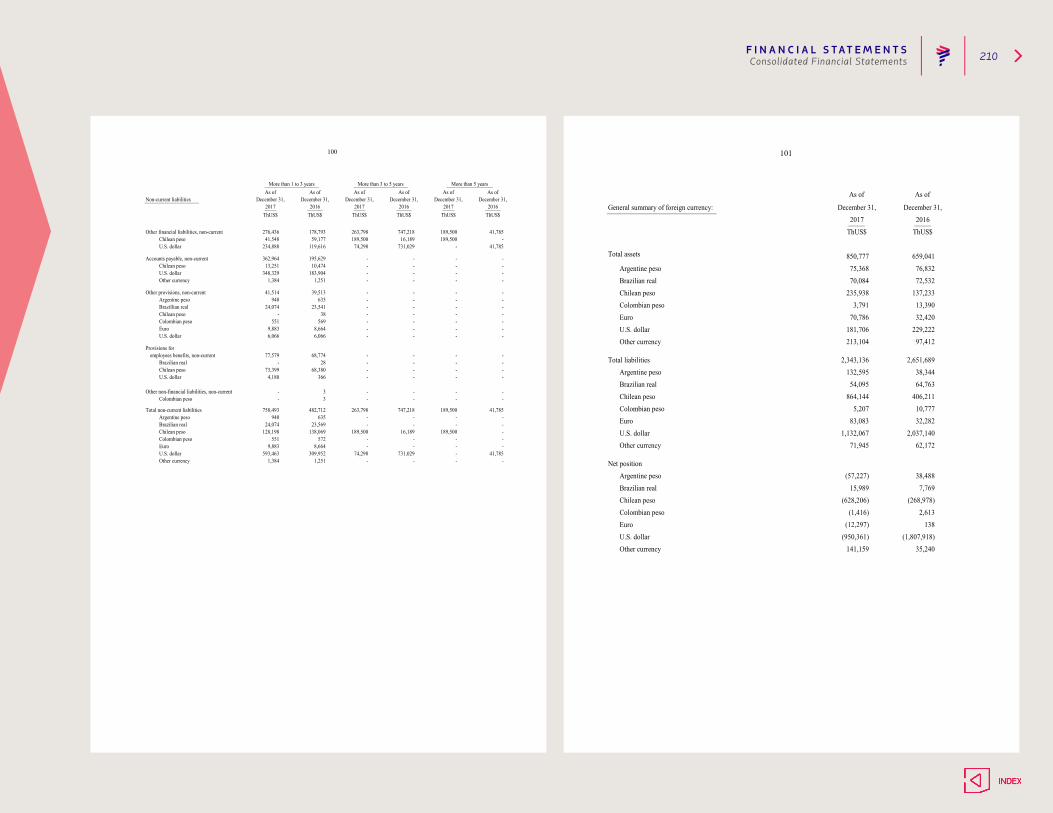
F I N A N C I A L S T AT E M E N T S 210Consolidated Financial Statements
100
Provisions for - -
189,500 -
U.S. dollar 6,066 6,066 - - - -
-
13,251348,329
1,384
41,514940
Chilean pesoU.S. dollarOther currency
-
- - - -
- -
- -
- -
178,793
119,61641,548 59,177 189,500
747,218
731,02916,189
-
41,785 - - -
-
41,785
41,785
- - - -
- -
-
- -
- -
- -
-
189,500
-
- - - -
- - - -
-
189,500 - -
189,500
- - -
- -
747,218 -
16,189
39,513635
- -
189,500
- 74,298 731,029
-
366 -
74,298
Chilean peso
EuroU.S. dollarOther currency
Brazilian real
Other provisions, non-current
Total non-current liabilities
Argentine pesoBrazillian realChilean peso
Euro
Argentine peso
employees benefits, non-current
138,069
8,664309,952
1,251
-
263,798
195,62910,474
183,9041,251
41,785 -
24,074 -
9,883
- -
593,4631,384
23,54138
8,664
482,712635
23,569
758,493940
24,074
77,579
-
68,774 -
128,198
9,883
More than 1 to 3 yearsAs of
December 31,2016
ThUS$
More than 3 to 5 yearsAs of
More than 5 yearsAs of
December 31,As of
December 31,2017 2016
As of December 31,
2017December 31,
2016
As of
Colombian peso - 3 - - - -
December 31,2017
ThUS$
362,964
276,436
234,888
Non-current liabilities
Other financial liabilities, non-current
Accounts payable, non-current
U.S. dollarChilean peso
ThUS$ ThUS$ThUS$ ThUS$
263,798
Colombian peso 551 569 - - - -
Colombian peso 551 572 - - - -
U.S. dollar 4,180 -
Other non-financial liabilities, non-current - 3 - - - -
Chilean peso 73,399 68,380 - - - - Brazilian real - 28 - - - -
101
10,77732,282
2,037,140
97,412
2,651,68938,34464,763
406,211
137,23313,39032,420
229,222
Other currency
EuroU.S. dollarOther currency
Argentine pesoBrazilian realChilean pesoColombian pesoEuroU.S. dollar
Net position
Brazilian realArgentine peso
As of
Chilean pesoColombian pesoEuroU.S. dollar
December 31,2016
ThUS$
659,04176,83272,532
Chilean pesoColombian peso
As of
Argentine pesoBrazilian real
Total assets
General summary of foreign currency:
ThUS$2017
December 31,
850,777
70,08475,368
235,938
Total liabilities
Other currency
5,207
181,70670,786
3,791
864,14454,095
132,5952,343,136
213,104
141,159(950,361)
(12,297)(1,416)
1,132,06783,083
2,613138
(1,807,918)
(628,206)15,989
(57,227)
71,945
35,240
62,172
38,4887,769
(268,978)
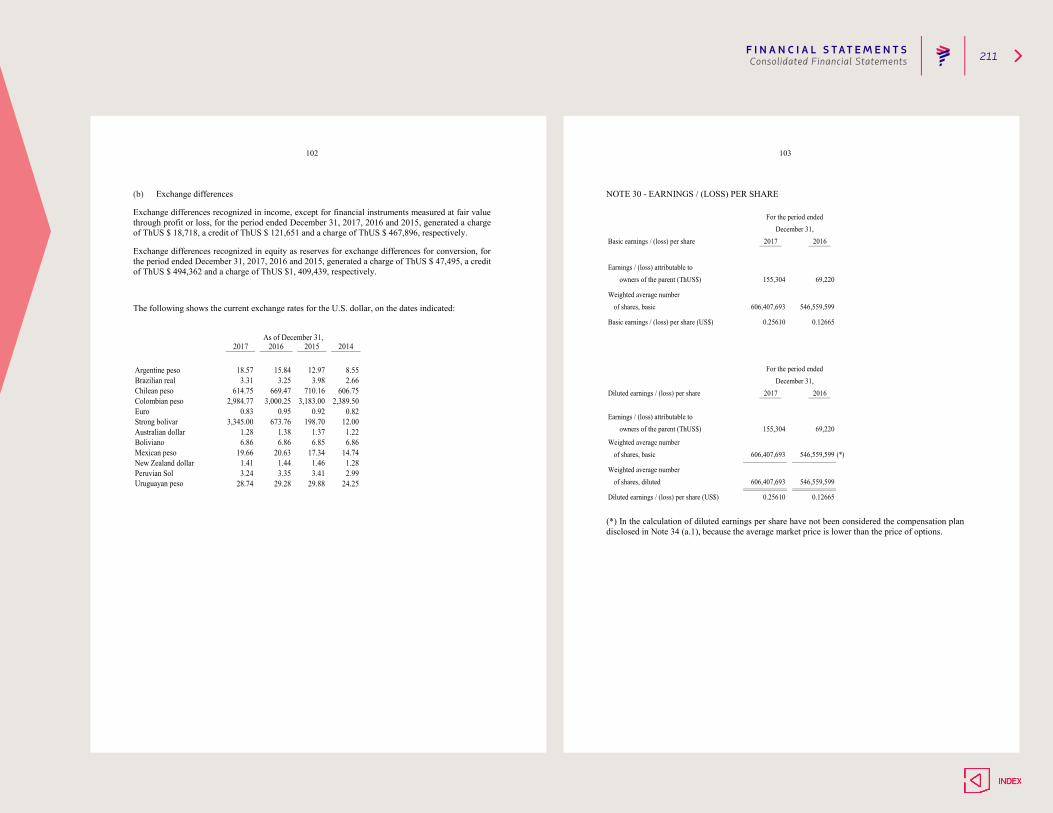
F I N A N C I A L S T AT E M E N T S 211Consolidated Financial Statements
102
(b) Exchange differences
Exchange differences recognized in income, except for financial instruments measured at fair value through profit or loss, for the period ended December 31, 2017, 2016 and 2015, generated a charge of ThUS $ 18,718, a credit of ThUS $ 121,651 and a charge of ThUS $ 467,896, respectively.
Exchange differences recognized in equity as reserves for exchange differences for conversion, for the period ended December 31, 2017, 2016 and 2015, generated a charge of ThUS $ 47,495, a credit of ThUS $ 494,362 and a charge of ThUS $1, 409,439, respectively.
The following shows the current exchange rates for the U.S. dollar, on the dates indicated:
29.28 29.88 24.25Peruvian SolUruguayan peso
3.2428.74
Mexican pesoNew Zealand dollar
3.35 3.41 2.99
20.63 17.34 14.741.44 1.46 1.281.41
19.666.86 6.85 6.86
Australian dollarBoliviano
1.286.86
Euro 0.95 0.92 0.82673.76 198.70 12.00Strong bolivar
0.833,345.00
15.84 12.97 8.55
2017 2016 2015 2014As of December 31,
3.25 3.98 2.66669.47 710.16 606.75
3,000.25 3,183.00 2,389.50
1.38 1.37 1.22
Argentine pesoBrazilian realChilean pesoColombian peso
18.573.31
614.752,984.77
103
NOTE 30 - EARNINGS / (LOSS) PER SHARE
(*)
2016
For the period endedDecember 31,
2017
0.25610
155,304
606,407,693
606,407,693
69,220
546,559,599
546,559,599
0.12665
0.25610
For the period endedDecember 31,
2017 2016
69,220
546,559,599
0.12665
155,304
Diluted earnings / (loss) per share (US$)
Earnings / (loss) attributable to owners of the parent (ThUS$)
Weighted average numberof shares, basic
Basic earnings / (loss) per share (US$)
owners of the parent (ThUS$)
Weighted average numberof shares, basic
Weighted average numberof shares, diluted
Basic earnings / (loss) per share
Diluted earnings / (loss) per share
Earnings / (loss) attributable to
606,407,693
(*) In the calculation of diluted earnings per share have not been considered the compensation plan disclosed in Note 34 (a.1), because the average market price is lower than the price of options.
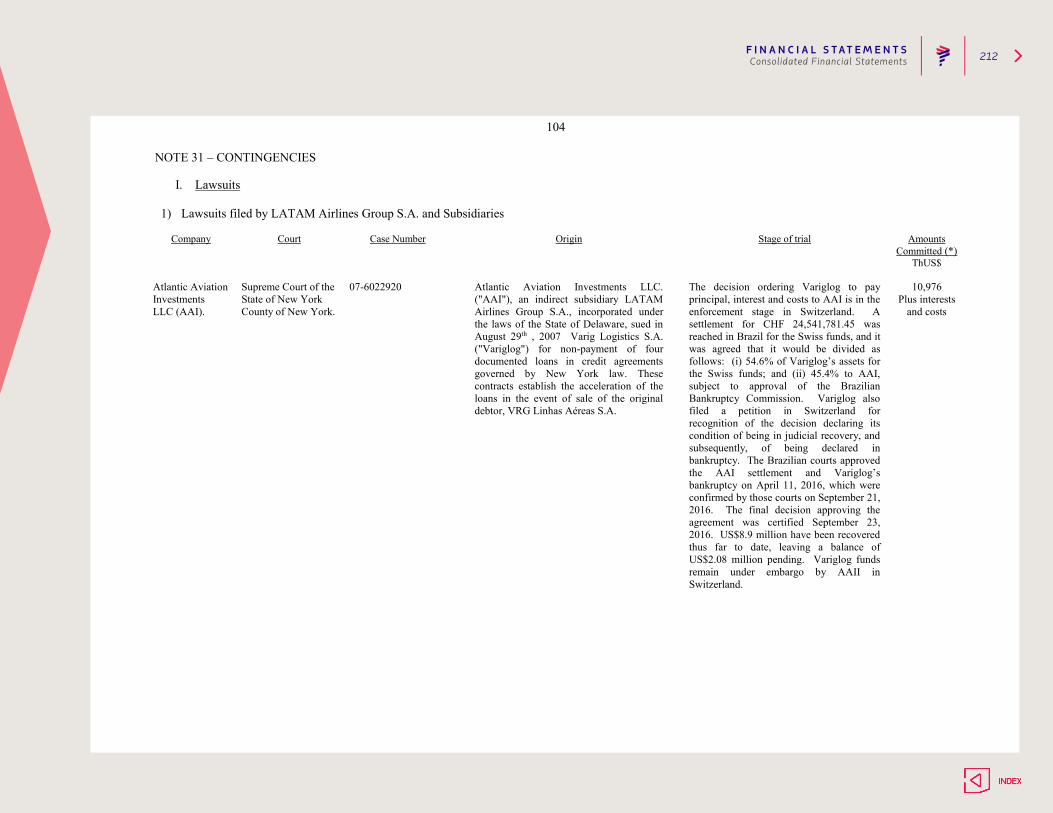
F I N A N C I A L S T AT E M E N T S 212Consolidated Financial Statements
104
NOTE 31 – CONTINGENCIES
I. Lawsuits 1) Lawsuits filed by LATAM Airlines Group S.A. and Subsidiaries
Company Court Case Number Origin Stage of trial Amounts
Committed (*) ThUS$
Atlantic Aviation Investments LLC (AAI).
Supreme Court of the State of New York County of New York.
07-6022920 Atlantic Aviation Investments LLC. ("AAI"), an indirect subsidiary LATAM Airlines Group S.A., incorporated under the laws of the State of Delaware, sued in August 29th , 2007 Varig Logistics S.A. ("Variglog") for non-payment of four documented loans in credit agreements governed by New York law. These contracts establish the acceleration of the loans in the event of sale of the original debtor, VRG Linhas Aéreas S.A.
The decision ordering Variglog to pay principal, interest and costs to AAI is in the enforcement stage in Switzerland. A settlement for CHF 24,541,781.45 was reached in Brazil for the Swiss funds, and it was agreed that it would be divided as follows: (i) 54.6% of Variglog’s assets for the Swiss funds; and (ii) 45.4% to AAI, subject to approval of the Brazilian Bankruptcy Commission. Variglog also filed a petition in Switzerland for recognition of the decision declaring its condition of being in judicial recovery, and subsequently, of being declared in bankruptcy. The Brazilian courts approved the AAI settlement and Variglog’s bankruptcy on April 11, 2016, which were confirmed by those courts on September 21, 2016. The final decision approving the agreement was certified September 23, 2016. US$8.9 million have been recovered thus far to date, leaving a balance of US$2.08 million pending. Variglog funds remain under embargo by AAII in Switzerland.
10,976 Plus interests
and costs
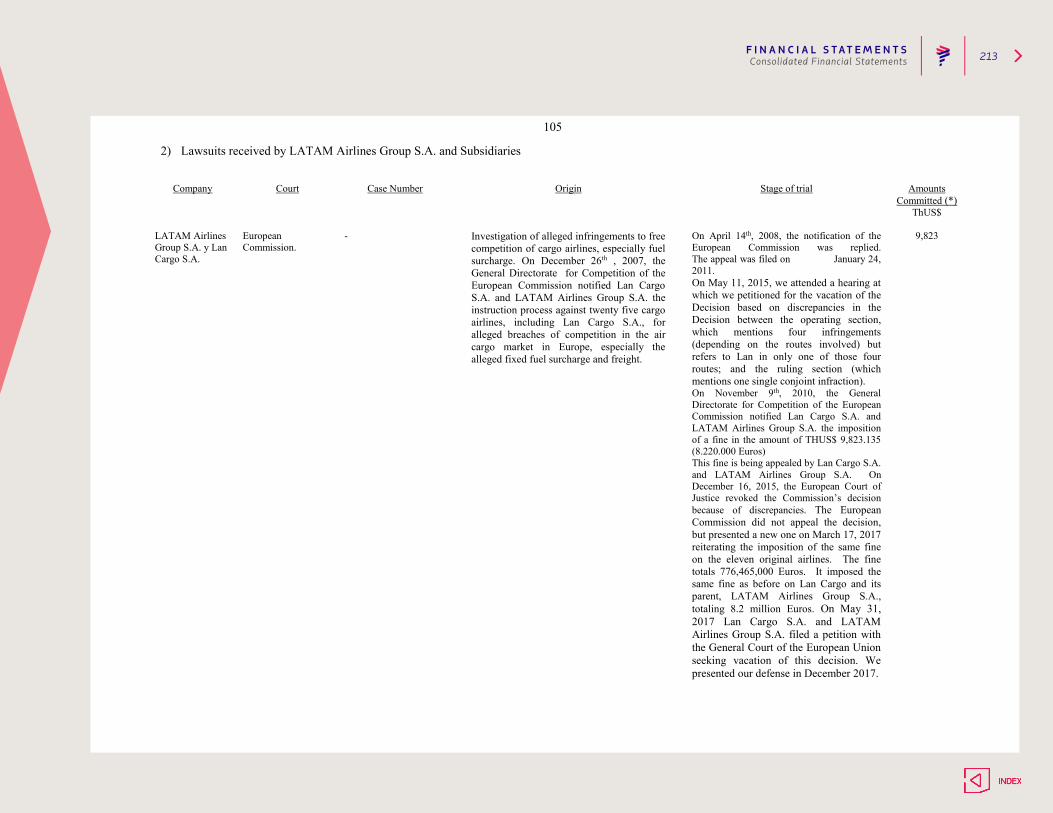
F I N A N C I A L S T AT E M E N T S 213Consolidated Financial Statements
105
2) Lawsuits received by LATAM Airlines Group S.A. and Subsidiaries
Company Court Case Number
Origin Stage of trial Amounts Committed (*)
ThUS$ LATAM Airlines Group S.A. y Lan Cargo S.A.
European Commission.
- Investigation of alleged infringements to free competition of cargo airlines, especially fuel surcharge. On December 26th , 2007, the General Directorate for Competition of the European Commission notified Lan Cargo S.A. and LATAM Airlines Group S.A. the instruction process against twenty five cargo airlines, including Lan Cargo S.A., for alleged breaches of competition in the air cargo market in Europe, especially the alleged fixed fuel surcharge and freight.
On April 14th, 2008, the notification of the European Commission was replied. The appeal was filed on January 24, 2011. On May 11, 2015, we attended a hearing at which we petitioned for the vacation of the Decision based on discrepancies in the Decision between the operating section, which mentions four infringements (depending on the routes involved) but refers to Lan in only one of those four routes; and the ruling section (which mentions one single conjoint infraction). On November 9th, 2010, the General Directorate for Competition of the European Commission notified Lan Cargo S.A. and LATAM Airlines Group S.A. the imposition of a fine in the amount of THUS$ 9,823.135 (8.220.000 Euros) This fine is being appealed by Lan Cargo S.A. and LATAM Airlines Group S.A. On December 16, 2015, the European Court of Justice revoked the Commission’s decision because of discrepancies. The European Commission did not appeal the decision, but presented a new one on March 17, 2017 reiterating the imposition of the same fine on the eleven original airlines. The fine totals 776,465,000 Euros. It imposed the same fine as before on Lan Cargo and its parent, LATAM Airlines Group S.A., totaling 8.2 million Euros. On May 31, 2017 Lan Cargo S.A. and LATAM Airlines Group S.A. filed a petition with the General Court of the European Union seeking vacation of this decision. We presented our defense in December 2017.
9,823
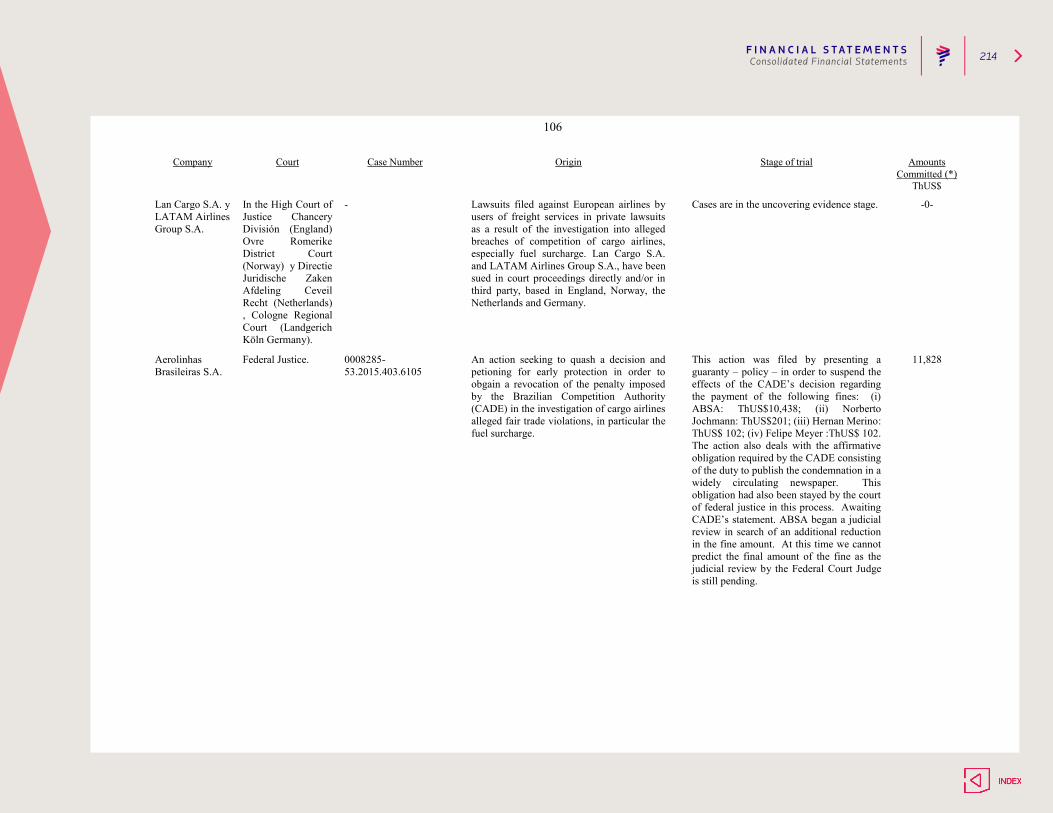
F I N A N C I A L S T AT E M E N T S 214Consolidated Financial Statements
106
Company Court Case Number
Origin Stage of trial Amounts
Committed (*) ThUS$
Lan Cargo S.A. y LATAM Airlines Group S.A.
In the High Court of Justice Chancery División (England) Ovre Romerike District Court (Norway) y Directie Juridische Zaken Afdeling Ceveil Recht (Netherlands) , Cologne Regional Court (Landgerich Köln Germany).
- Lawsuits filed against European airlines by users of freight services in private lawsuits as a result of the investigation into alleged breaches of competition of cargo airlines, especially fuel surcharge. Lan Cargo S.A. and LATAM Airlines Group S.A., have been sued in court proceedings directly and/or in third party, based in England, Norway, the Netherlands and Germany.
Cases are in the uncovering evidence stage. -0-
Aerolinhas Brasileiras S.A.
Federal Justice. 0008285-53.2015.403.6105
An action seeking to quash a decision and petioning for early protection in order to obgain a revocation of the penalty imposed by the Brazilian Competition Authority (CADE) in the investigation of cargo airlines alleged fair trade violations, in particular the fuel surcharge.
This action was filed by presenting a guaranty – policy – in order to suspend the effects of the CADE’s decision regarding the payment of the following fines: (i) ABSA: ThUS$10,438; (ii) Norberto Jochmann: ThUS$201; (iii) Hernan Merino: ThUS$ 102; (iv) Felipe Meyer :ThUS$ 102. The action also deals with the affirmative obligation required by the CADE consisting of the duty to publish the condemnation in a widely circulating newspaper. This obligation had also been stayed by the court of federal justice in this process. Awaiting CADE’s statement. ABSA began a judicial review in search of an additional reduction in the fine amount. At this time we cannot predict the final amount of the fine as the judicial review by the Federal Court Judge is still pending.
11,828

F I N A N C I A L S T AT E M E N T S 215Consolidated Financial Statements
107
Company Court Case Number Origin Stage of trial Amounts Committed (*)
ThUS$
Aerolinhas Brasileiras S.A.
Federal Justice. 0001872-58.2014.4.03.6105
An annulment action with a motion for preliminary injunction was filed on 28/02/2014, in order to cancel tax debts of PIS, CONFINS, IPI and II, connected with the administrative process 10831.005704/2006.43.
We have been waiting since August 21, 2015 for a statement by Serasa on TAM’s letter of indemnity and a statement by the Union. The statement was authenticated on January 29, 2016. A petition on evidence and replications were filed on June 20, 2016. A new insurance policy was submitted on March 3, 2016 with the change to the guarantee requested by PGFN, which was declared on June 3, 2016. A decision is pending.
15,811
Tam Linhas Aéreas S.A.
Department of Federal Revenue of Brazil
19515.720476/2015-83
Alleged irregularities in the SAT payments for the periods 01/2011 to 12/2012
A judgment by CARF is pending since April 12, 2016.
66,258
Tam Linhas Aéreas S.A.
Court of the Second Region.
2001.51.01.012530-0 Ordinary judicial action brought for the purpose of declaring the nonexistence of legal relationship obligating the company to collect the Air Fund.
Unfavorable court decision in first instance. Currently expecting the ruling on the appeal filed by the company. In order to suspend chargeability of Tax Credit a Guaranty Deposit to the Court was delivered for MUS$106. The court decision requesting that the Expert make all clarifications requested by the parties in a period of 30 days was published on March 29, 2016. The plaintiffs’ submitted a petition on June 21, 2016 requesting acceptance of the opinion of their consultant and an urgent ruling on the dispute. No amount additional to the deposit that has already been made is required if this case is lost.
100,240
Tam Linhas Aéreas S.A.
Internal Revenue Service of Brazil.
10880.725950/2011-05
Compensation credits of the Social Integration Program (PIS) and Contribution for Social Security Financing (COFINS) Declared on DCOMPs.
The objection (manifestação de inconformidade) filed by the company was rejected, which is why the voluntary appeal was filed. The case was assigned to the 1st Ordinary Group of Brazil’s Administrative Council of Tax Appeals (CARF) on June 8, 2015. TAM’s appeal was included in the CARF session held August 25, 2016. An agreement that converted the proceedings into a formal case was published on October 7, 2016.
64,383
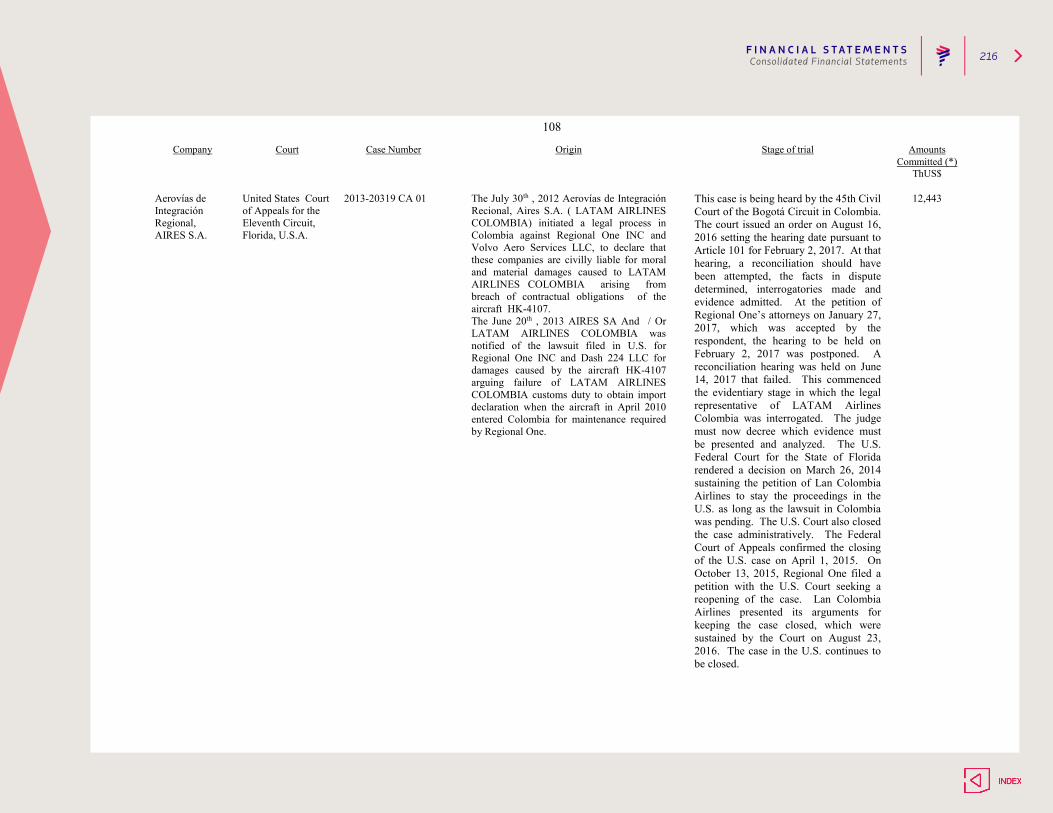
F I N A N C I A L S T AT E M E N T S 216Consolidated Financial Statements
108
Company Court Case Number Origin Stage of trial Amounts Committed (*)
ThUS$ Aerovías de Integración Regional, AIRES S.A.
United States Court of Appeals for the Eleventh Circuit, Florida, U.S.A.
2013-20319 CA 01 The July 30th , 2012 Aerovías de Integración Recional, Aires S.A. ( LATAM AIRLINES COLOMBIA) initiated a legal process in Colombia against Regional One INC and Volvo Aero Services LLC, to declare that these companies are civilly liable for moral and material damages caused to LATAM AIRLINES COLOMBIA arising from breach of contractual obligations of the aircraft HK-4107. The June 20th , 2013 AIRES SA And / Or LATAM AIRLINES COLOMBIA was notified of the lawsuit filed in U.S. for Regional One INC and Dash 224 LLC for damages caused by the aircraft HK-4107 arguing failure of LATAM AIRLINES COLOMBIA customs duty to obtain import declaration when the aircraft in April 2010 entered Colombia for maintenance required by Regional One.
This case is being heard by the 45th Civil Court of the Bogotá Circuit in Colombia. The court issued an order on August 16, 2016 setting the hearing date pursuant to Article 101 for February 2, 2017. At that hearing, a reconciliation should have been attempted, the facts in dispute determined, interrogatories made and evidence admitted. At the petition of Regional One’s attorneys on January 27, 2017, which was accepted by the respondent, the hearing to be held on February 2, 2017 was postponed. A reconciliation hearing was held on June 14, 2017 that failed. This commenced the evidentiary stage in which the legal representative of LATAM Airlines Colombia was interrogated. The judge must now decree which evidence must be presented and analyzed. The U.S. Federal Court for the State of Florida rendered a decision on March 26, 2014 sustaining the petition of Lan Colombia Airlines to stay the proceedings in the U.S. as long as the lawsuit in Colombia was pending. The U.S. Court also closed the case administratively. The Federal Court of Appeals confirmed the closing of the U.S. case on April 1, 2015. On October 13, 2015, Regional One filed a petition with the U.S. Court seeking a reopening of the case. Lan Colombia Airlines presented its arguments for keeping the case closed, which were sustained by the Court on August 23, 2016. The case in the U.S. continues to be closed.
12,443
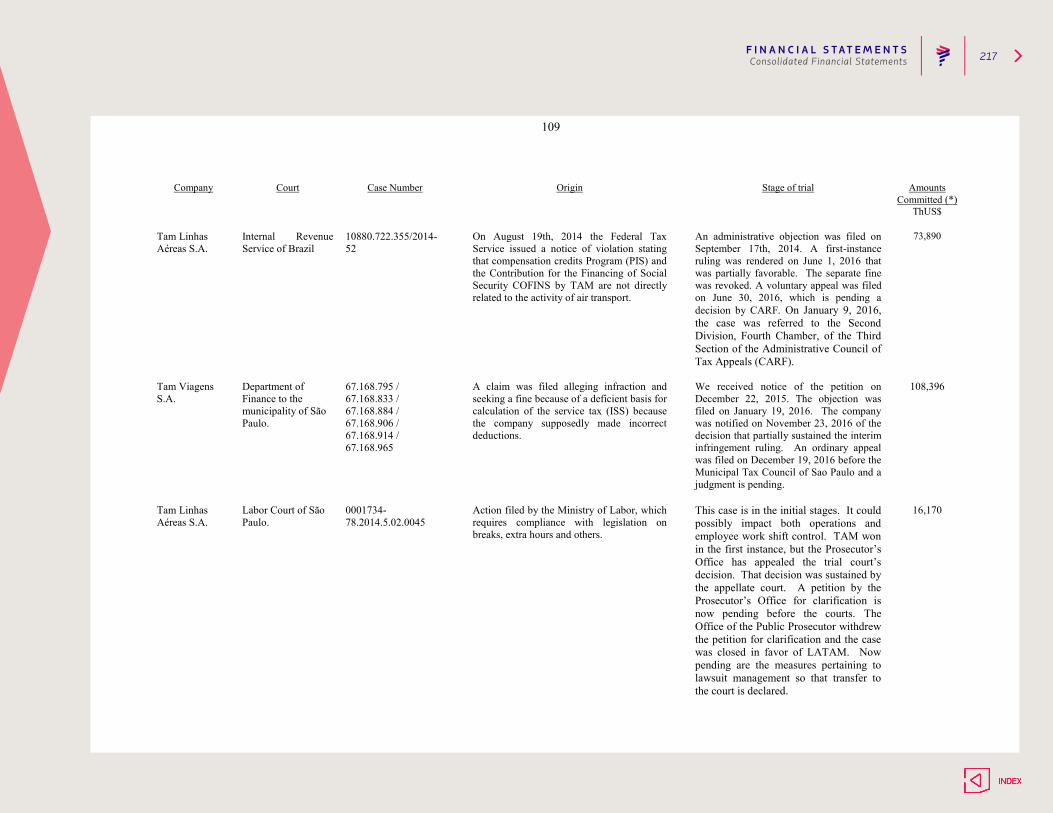
F I N A N C I A L S T AT E M E N T S 217Consolidated Financial Statements
109
Company
Court
Case Number
Origin
Stage of trial
Amounts
Committed (*) ThUS$
Tam Linhas Aéreas S.A.
Internal Revenue Service of Brazil
10880.722.355/2014-52
On August 19th, 2014 the Federal Tax Service issued a notice of violation stating that compensation credits Program (PIS) and the Contribution for the Financing of Social Security COFINS by TAM are not directly related to the activity of air transport.
An administrative objection was filed on September 17th, 2014. A first-instance ruling was rendered on June 1, 2016 that was partially favorable. The separate fine was revoked. A voluntary appeal was filed on June 30, 2016, which is pending a decision by CARF. On January 9, 2016, the case was referred to the Second Division, Fourth Chamber, of the Third Section of the Administrative Council of Tax Appeals (CARF).
73,890
Tam Viagens S.A.
Department of Finance to the municipality of São Paulo.
67.168.795 / 67.168.833 / 67.168.884 / 67.168.906 / 67.168.914 / 67.168.965
A claim was filed alleging infraction and seeking a fine because of a deficient basis for calculation of the service tax (ISS) because the company supposedly made incorrect deductions.
We received notice of the petition on December 22, 2015. The objection was filed on January 19, 2016. The company was notified on November 23, 2016 of the decision that partially sustained the interim infringement ruling. An ordinary appeal was filed on December 19, 2016 before the Municipal Tax Council of Sao Paulo and a judgment is pending.
108,396
Tam Linhas Aéreas S.A.
Labor Court of São Paulo.
0001734-78.2014.5.02.0045
Action filed by the Ministry of Labor, which requires compliance with legislation on breaks, extra hours and others.
This case is in the initial stages. It could possibly impact both operations and employee work shift control. TAM won in the first instance, but the Prosecutor’s Office has appealed the trial court’s decision. That decision was sustained by the appellate court. A petition by the Prosecutor’s Office for clarification is now pending before the courts. The Office of the Public Prosecutor withdrew the petition for clarification and the case was closed in favor of LATAM. Now pending are the measures pertaining to lawsuit management so that transfer to the court is declared.
16,170
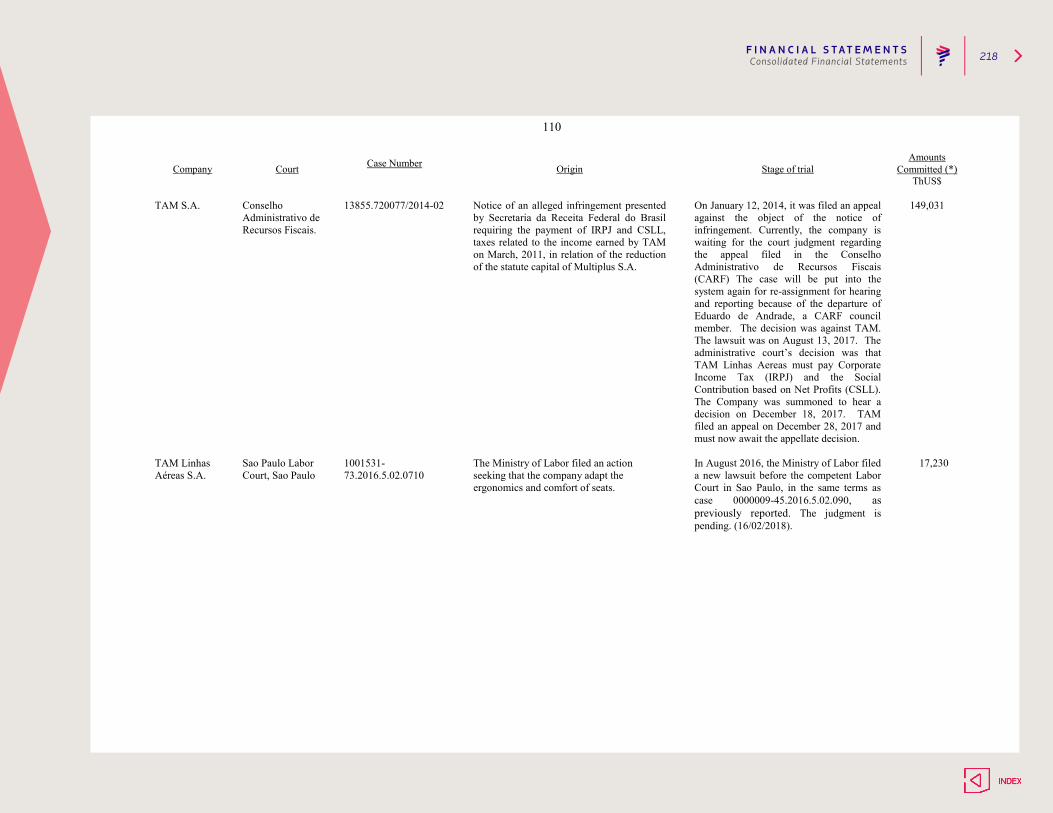
F I N A N C I A L S T AT E M E N T S 218Consolidated Financial Statements
110
Company Court Case Number Origin Stage of trial
Amounts Committed (*)
ThUS$ TAM S.A. Conselho
Administrativo de Recursos Fiscais.
13855.720077/2014-02 Notice of an alleged infringement presented by Secretaria da Receita Federal do Brasil requiring the payment of IRPJ and CSLL, taxes related to the income earned by TAM on March, 2011, in relation of the reduction of the statute capital of Multiplus S.A.
On January 12, 2014, it was filed an appeal against the object of the notice of infringement. Currently, the company is waiting for the court judgment regarding the appeal filed in the Conselho Administrativo de Recursos Fiscais (CARF) The case will be put into the system again for re-assignment for hearing and reporting because of the departure of Eduardo de Andrade, a CARF council member. The decision was against TAM. The lawsuit was on August 13, 2017. The administrative court’s decision was that TAM Linhas Aereas must pay Corporate Income Tax (IRPJ) and the Social Contribution based on Net Profits (CSLL). The Company was summoned to hear a decision on December 18, 2017. TAM filed an appeal on December 28, 2017 and must now await the appellate decision.
149,031
TAM Linhas Aéreas S.A.
Sao Paulo Labor Court, Sao Paulo
1001531-73.2016.5.02.0710
The Ministry of Labor filed an action seeking that the company adapt the ergonomics and comfort of seats.
In August 2016, the Ministry of Labor filed a new lawsuit before the competent Labor Court in Sao Paulo, in the same terms as case 0000009-45.2016.5.02.090, as previously reported. The judgment is pending. (16/02/2018).
17,230
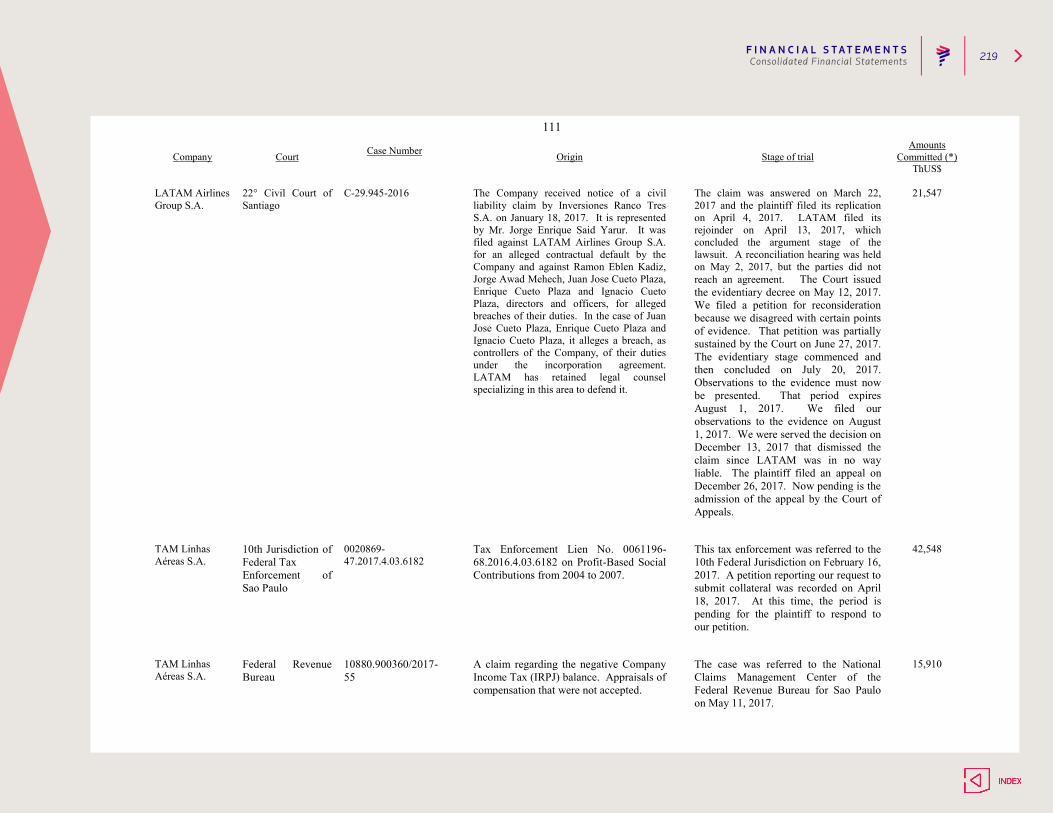
F I N A N C I A L S T AT E M E N T S 219Consolidated Financial Statements
111
Company Court Case Number Origin Stage of trial
Amounts Committed (*)
ThUS$ LATAM Airlines Group S.A.
22° Civil Court of Santiago
C-29.945-2016
The Company received notice of a civil liability claim by Inversiones Ranco Tres S.A. on January 18, 2017. It is represented by Mr. Jorge Enrique Said Yarur. It was filed against LATAM Airlines Group S.A. for an alleged contractual default by the Company and against Ramon Eblen Kadiz, Jorge Awad Mehech, Juan Jose Cueto Plaza, Enrique Cueto Plaza and Ignacio Cueto Plaza, directors and officers, for alleged breaches of their duties. In the case of Juan Jose Cueto Plaza, Enrique Cueto Plaza and Ignacio Cueto Plaza, it alleges a breach, as controllers of the Company, of their duties under the incorporation agreement. LATAM has retained legal counsel specializing in this area to defend it.
The claim was answered on March 22, 2017 and the plaintiff filed its replication on April 4, 2017. LATAM filed its rejoinder on April 13, 2017, which concluded the argument stage of the lawsuit. A reconciliation hearing was held on May 2, 2017, but the parties did not reach an agreement. The Court issued the evidentiary decree on May 12, 2017. We filed a petition for reconsideration because we disagreed with certain points of evidence. That petition was partially sustained by the Court on June 27, 2017. The evidentiary stage commenced and then concluded on July 20, 2017. Observations to the evidence must now be presented. That period expires August 1, 2017. We filed our observations to the evidence on August 1, 2017. We were served the decision on December 13, 2017 that dismissed the claim since LATAM was in no way liable. The plaintiff filed an appeal on December 26, 2017. Now pending is the admission of the appeal by the Court of Appeals.
21,547
TAM Linhas Aéreas S.A.
10th Jurisdiction of Federal Tax Enforcement of Sao Paulo
0020869-47.2017.4.03.6182
Tax Enforcement Lien No. 0061196-68.2016.4.03.6182 on Profit-Based Social Contributions from 2004 to 2007.
This tax enforcement was referred to the 10th Federal Jurisdiction on February 16, 2017. A petition reporting our request to submit collateral was recorded on April 18, 2017. At this time, the period is pending for the plaintiff to respond to our petition.
42,548
TAM Linhas Aéreas S.A.
Federal Revenue Bureau
10880.900360/2017-55
A claim regarding the negative Company Income Tax (IRPJ) balance. Appraisals of compensation that were not accepted.
The case was referred to the National Claims Management Center of the Federal Revenue Bureau for Sao Paulo on May 11, 2017.
15,910

F I N A N C I A L S T AT E M E N T S 220Consolidated Financial Statements
112
Company Court Case Number Origin Stage of trial Amounts
Committed (*) ThUS$
TAM Linhas Aéreas S.A.
Internal Revenue Service of Brazil
16643.000085/2009-47
Notice of claim to recover income taxes and social contributions paid on the basis of net profits (SCL) according to the royalty expenses and use of the TAM trademark.
Before the Internal Revenue Service of Brazil. A service of process is expected in the lawsuit on admissibility of the special appeal, filed by the General Counsel of the National Treasury, as well as notification of the decision rendered by the Administrative Council of Tax Appeals (CARF). The decision was made to file a lawsuit on December 5, 2017.
17,657
TAM Linhas Aéreas S.A.
Internal Revenue Service of Brazil
10831.012344/2005-55
Notice of an infringement filed by the Company to request the import tax (II), the Social Integration Program (PIS) of the Social Security Funding Contribution (COFINS) as a result of an unidentified international cargo loss.
Before the Internal Revenue Service of Brazil. The administrative decision was against the company. The matter is pending a decision by the CARF.
17,844
TAM Linhas Aéreas S.A.
Treasury Department of the State of Sao Paulo
3.123.785-0
Notice of an infringement to demand payment of the tax on the circulation of merchandise and services (ICMS) assessable on aircraft imports.
Before the Treasury Department of the State of Sao Paulo. A decision is now pending on the appeal that the company has filed with the Federal Supreme Court (STF).
14,647
TAM Linhas Aéreas S.A.
Treasury Department of the State of Sao Paulo
4.037.054
Action brought by the Treasury Department of the State of Sao Paulo because of non-payment of the tax on the circulation of merchandise and services (ICMS) in relation to telecommunications services.
Before the Treasury Department of the State of Sao Paulo. Defensive arguments have been presented. The first-instance decision sustained all parts of the notice. We filed an ordinary appeal on which a decision is pending by the Sao Paulo Tax Court.
10,808
TAM Linhas Aéreas S.A.
DERAT SPO (Delegacía de Receita Federal)
13808.005459/2001-45
Collection of the Social Security Funding Contribution (COFINS) based on gross revenue of the company in the period 1999-2000
The decision on collection was pending through June 2, 2010.
27,226
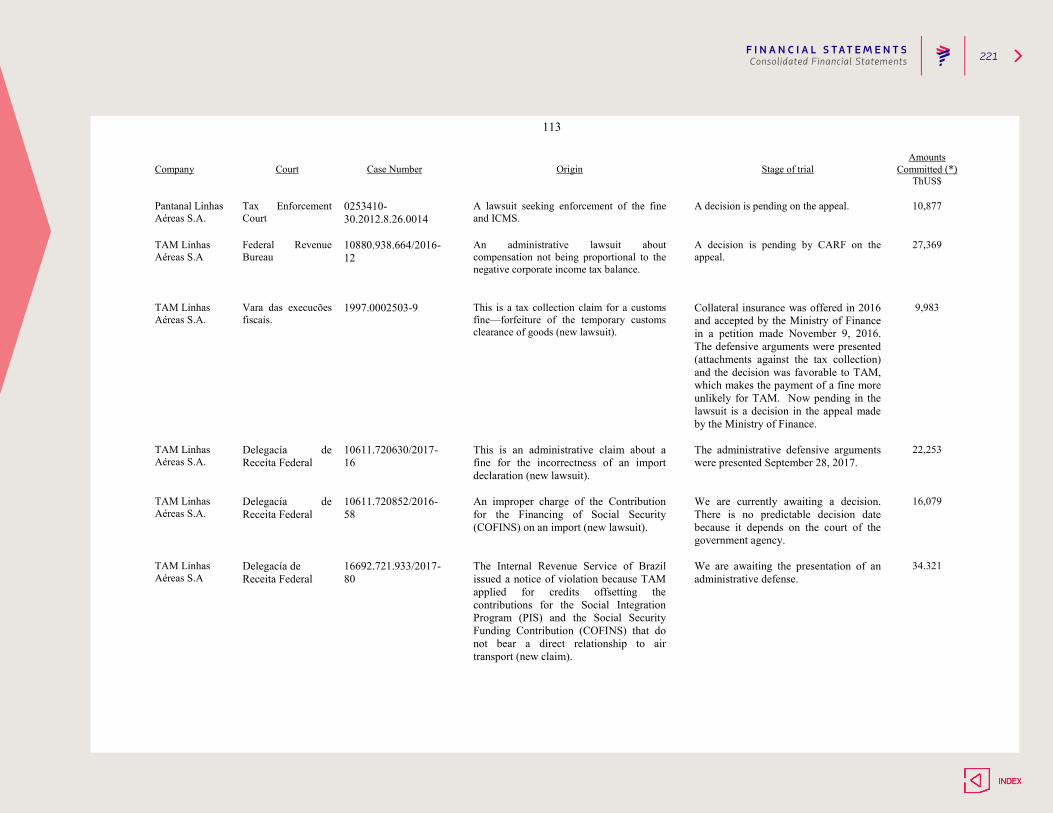
F I N A N C I A L S T AT E M E N T S 221Consolidated Financial Statements
113
Company Court Case Number Origin Stage of trial Amounts
Committed (*) ThUS$
Pantanal Linhas Aéreas S.A.
Tax Enforcement Court
0253410-30.2012.8.26.0014
A lawsuit seeking enforcement of the fine and ICMS.
A decision is pending on the appeal. 10,877
TAM Linhas Aéreas S.A
Federal Revenue Bureau
10880.938.664/2016-12
An administrative lawsuit about compensation not being proportional to the negative corporate income tax balance.
A decision is pending by CARF on the appeal.
27,369
TAM Linhas Aéreas S.A.
Vara das execucões fiscais.
1997.0002503-9 This is a tax collection claim for a customs fine—forfeiture of the temporary customs clearance of goods (new lawsuit).
Collateral insurance was offered in 2016 and accepted by the Ministry of Finance in a petition made November 9, 2016. The defensive arguments were presented (attachments against the tax collection) and the decision was favorable to TAM, which makes the payment of a fine more unlikely for TAM. Now pending in the lawsuit is a decision in the appeal made by the Ministry of Finance.
9,983
TAM Linhas Aéreas S.A.
Delegacía de Receita Federal
10611.720630/2017-16
This is an administrative claim about a fine for the incorrectness of an import declaration (new lawsuit).
The administrative defensive arguments were presented September 28, 2017.
22,253
TAM Linhas Aéreas S.A.
Delegacía de Receita Federal
10611.720852/2016-58
An improper charge of the Contribution for the Financing of Social Security (COFINS) on an import (new lawsuit).
We are currently awaiting a decision. There is no predictable decision date because it depends on the court of the government agency.
16,079
TAM Linhas Aéreas S.A
Delegacía de Receita Federal
16692.721.933/2017-80
The Internal Revenue Service of Brazil issued a notice of violation because TAM applied for credits offsetting the contributions for the Social Integration Program (PIS) and the Social Security Funding Contribution (COFINS) that do not bear a direct relationship to air transport (new claim).
We are awaiting the presentation of an administrative defense.
34.321

F I N A N C I A L S T AT E M E N T S 222Consolidated Financial Statements
114
- In order to deal with any financial obligations arising from legal proceedings in effect at December 31, 2017, whether civil, tax, or labor, LATAM
Airlines Group S.A. and Subsidiaries, has made provisions, which are included in Other non-current provisions that are disclosed in Note 21.
- The Company has not disclosed the individual probability of success for each contingency in order to not negatively affect its outcome.
(*) The Company has reported the amounts involved only for the lawsuits for which a reliable estimation can be made of the financial impacts and of the possibility of any recovery, pursuant to Paragraph 86 of IAS 37 Provisions, Contingent Liabilities and Contingent Assets.
Company Court Case Number Origin Stage of trial Amounts
Committed (*) ThUS$
SNEA (Sindicato Nacional das empresas aeroviárias)
União Federal
0012177-54.2016.4.01.3400
A claim against the 72% increase in airport control fees (TAT-ADR) and approach control fees (TAT-APP) charged by the Airspace Control Department (“DECEA”).
A decision is now pending on the appeal presented by SNEA.
23.118
TAM Linhas Aéreas S/A
União Federal
2001.51.01.020420-0
TAM and other airlines filed a recourse claim seeking a finding that there is no legal or tax basis to be released from collecting the Additional Airport Fee (“ATAERO”).
A decision by the superior court is pending. The amount is indeterminate because even though TAM is the plaintiff, if the ruling is against it, it could be ordered by the trial judge to pay certain fees.
-0-
F I N A N C I A L S T AT E M E N T S 223Consolidated Financial Statements
115
II. Governmental Investigations.
1) On July 25, 2016, LATAM reached agreements with the U.S. Department of Justice (“DOJ”) and the U.S. Securities and Exchange Commission (“SEC”) regarding the investigation of payments for US$1,150,000 by Lan Airlines S.A. in 2006-2007 to a consultant advising it in the resolution of labor matters in Argentina.
The purpose of the investigation was to determine whether these payments violated the U.S. Foreign Corrupt Practices Act (“FCPA”) that: (i) forbids bribery of foreign government authorities in order to obtain a commercial advantage; and (ii) requires the companies that must abide by the FCPA to keep appropriate accounting records and implant an adequate internal control system. The FCPA is applicable to LATAM because of its ADR program in effect on the U.S. securities market.
After an exhaustive investigation, the DOJ and SEC concluded that there was no violation of the bribery provisions of the FCPA, which is consistent with the results of LATAM’s internal investigation. However, the DOJ and SEC consider that LAN accounted for these payments incorrectly and, consequently, infringed the part of the FCPA requiring companies to keep accurate accounting records. These authorities also consider that LAN’s internal controls in 2006-2007 were weak, so LAN would have also violated the provisions in the FCPA requiring it to maintain an adequate internal control system.
The agreements signed, included the following:
a) The agreement with the DOJ involves: (i) entering into a Deferred Prosecution Agreement
(“DPA”), which is a public contract under which the DOJ files public charges alleging an infringement of the FCPA accounting regulations. LATAM is not obligated to answer these charges, the DOJ will not pursue them for a period of 3 years, and the DOJ will dismiss the charges after expiration of that 3-year period provided LATAM complies with all terms of the DPA. In exchange, LATAM must admit to the negotiated events described in the DPA and agree to pay the negotiated fine explained below and abide by other terms stipulated in the agreement; (ii) clauses in which LATAM admits that the payments to the consultant in Argentina were incorrectly accounted for and that at the time those payments were made (2006-2007), it did not have adequate internal controls in place; (iii) LATAM’s agreement to have an outside consultant monitor, evaluate and report to the DOJ on the effectiveness of LATAM’s compliance program for a period of 27 months; and LATAM’s agreement to continue evaluating and reporting directly to the DOJ on the effectiveness of its compliance program for a period of 9 months after the consultant’s work concludes; and (iv) LATAM paid a fine of ThUS$ 12,750.
b) The agreement with the SEC involves: (i) accepting a Cease and Desist Order, which is an
administrative resolution of the SEC closing the investigation, in which LATAM will accept certain obligations and statements of fact that are described in the document; (ii) accepting the same obligations regarding the consultant mentioned above; and (iii) LATAM paid a fine of KUS$6,744 and interest of ThUS$ 2,694.
Nothing is owed to the SEC at this time as ThUS$ 4,719 was paid in July 2017.
116
LATAM continued to cooperate with the Chilean authorities on this matter. The investigation continues. The 7th Criminal Court set the hearing date for October 24, 2017, at the request of the Office of the Public Prosecutor. The Prosecutor has petitioned that the investigation be closed.
2) LATAM received six Requests for Information from the Central-North Metropolitan Region
Legal Division, on October 25, 2016, on November 11, 2016, on March 8, 2017, on March 22, 2017, on July 7, 2017 and the last on August 28, 2017. It requested information related to the investigation of payments made by LAN Airlines in 2006 and 2007 to a consultant who advised it on the resolution of labor matters in Argentina. It also requested an explanation of information provided to the market. The five requests have already been answered and the requested information has been provided. The 7th Criminal Court set the hearing date for October 24, 2017 at the request of the Public Prosecutor. A reopening of the investigation was denied at that hearing and that denial was confirmed by the Santiago Court of Appeals on November 20, 2017.
3) The ecuatorian airline affiliate, LATAM Airlines Ecuador was given notice on
August 26, 2016 of an investigation of LATAM Airlines Ecuador and two other airlines begun, at its own initiative, by one of the Investigative Departments of the Ecuadoran Market Power Control Commission, limited to alleged signs of conscious parallelism in relation to specific fares on one domestic route in Ecuador from August 2012 to February 2013. The Investigative Prefecture has 180 days (through February 21, 2017) to issue a report on whether to quash the investigation or file charges against two or more of the parties involved. That period can be extended for another 180 days. A proceeding would begin only if the decision is made to file charges. The Commission extended the term of the investigation for another 180 days (through August 18, 2017) LATAM Airlines Ecuador is cooperating with the authority and has retained a law firm and economist expert in the subject to advise the company during this process and any additional information requested will be furnished. We received notice on August 23, 2017 that the Market Regulatory Commission decided to quash the investigation against AEROLANE LÍNEAS AÉREAS NACIONALES DEL ECUADOR S.A. and two other airlines because there was insufficient information to charge them. This decision is final.
NOTE 32 – COMMITMENTS (a) Loan covenants
With respect to various loans signed by the Company for the financing of Boeing 767, 767F, 777F and 787 aircraft, which carry the guarantee of the United States Export–Import Bank, limits have been set on some of the Company’s financial indicators on a consolidated basis, for which, in any case non-compliance does not generate acceleration of the loans. Moreover, and related to these same contracts, restrictions are also in place on the Company’s management in terms of its ownership, in relation to the ownership structure and the controlling group, and disposal of the assets which mainly refers to important transfers of assets.
The Company and its subsidiaries do not maintain financial credit contracts with banks in Chile that indicate some limits on financial indicators of the Company or its subsidiaries.
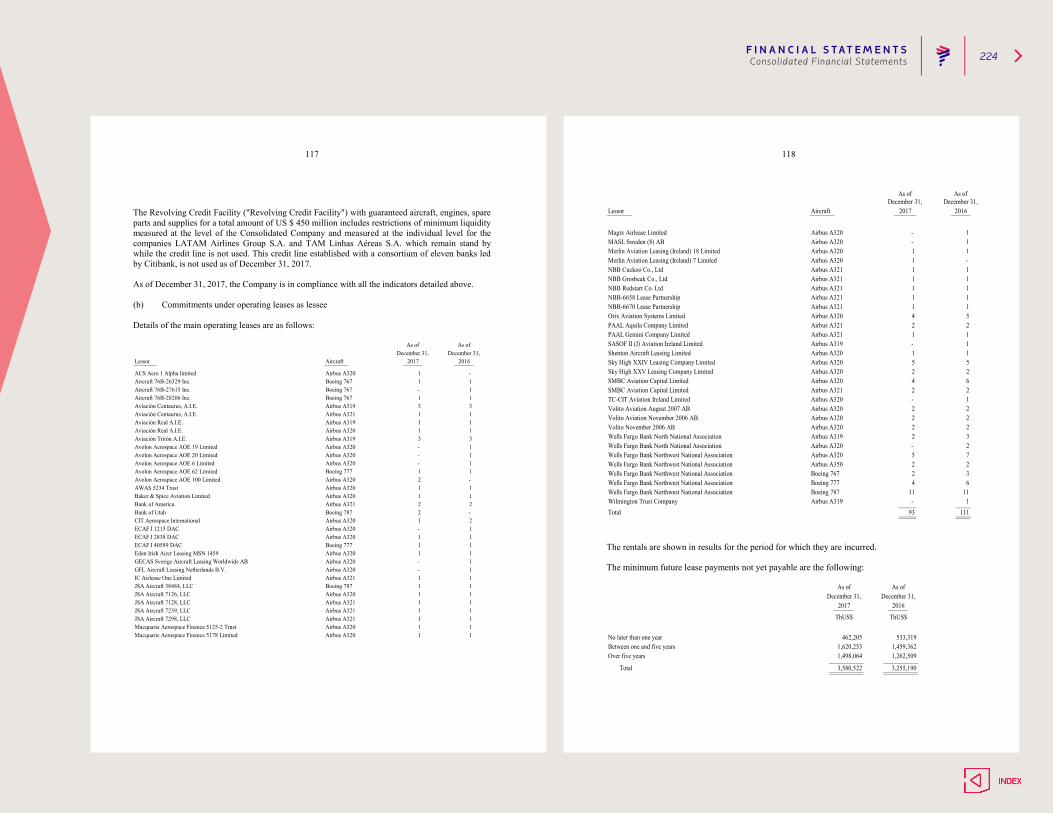
F I N A N C I A L S T AT E M E N T S 224Consolidated Financial Statements
117
The Revolving Credit Facility ("Revolving Credit Facility") with guaranteed aircraft, engines, spare parts and supplies for a total amount of US $ 450 million includes restrictions of minimum liquidity measured at the level of the Consolidated Company and measured at the individual level for the companies LATAM Airlines Group S.A. and TAM Linhas Aéreas S.A. which remain stand by while the credit line is not used. This credit line established with a consortium of eleven banks led by Citibank, is not used as of December 31, 2017. As of December 31, 2017, the Company is in compliance with all the indicators detailed above. (b) Commitments under operating leases as lessee Details of the main operating leases are as follows:
Lessor Aircraft
ACS Aero 1 Alpha limited Airbus A320Aircraft 76B-26329 Inc. Boeing 767Aircraft 76B-27615 Inc. Boeing 767Aircraft 76B-28206 Inc. Boeing 767Aviación Centaurus, A.I.E. Airbus A319Aviación Centaurus, A.I.E. Airbus A321Aviación Real A.I.E. Airbus A319Aviación Real A.I.E. Airbus A320Aviación Tritón A.I.E. Airbus A319Avolon Aerospace AOE 19 Limited Airbus A320Avolon Aerospace AOE 20 Limited Airbus A320Avolon Aerospace AOE 6 Limited Airbus A320Avolon Aerospace AOE 62 Limited Boeing 777Avolon Aerospace AOE 100 Limited Airbus A320AWAS 5234 Trust Airbus A320Baker & Spice Aviation Limited Airbus A320Bank of America Airbus A321Bank of Utah Boeing 787CIT Aerospace International Airbus A320ECAF I 1215 DAC Airbus A320ECAF I 2838 DAC Airbus A320ECAF I 40589 DAC Boeing 777Eden Irish Aircr Leasing MSN 1459 Airbus A320GECAS Sverige Aircraft Leasing Worldwide AB Airbus A320GFL Aircraft Leasing Netherlands B.V. Airbus A320IC Airlease One Limited Airbus A321JSA Aircraft 38484, LLC Boeing 787JSA Aircraft 7126, LLC Airbus A320JSA Aircraft 7128, LLC Airbus A321JSA Aircraft 7239, LLC Airbus A321JSA Aircraft 7298, LLC Airbus A321Macquarie Aerospace Finance 5125-2 Trust Airbus A320Macquarie Aerospace Finance 5178 Limited Airbus A320
-
- 1
1 11 1
- 1
1 1
1 1
1 11
As of As ofDecember 31, December 31,
2017 2016
1 11 1
1 -
1 11 13 3
1 1 - 11 13 31 1
- 2
1
2 2
- 1 - 1 - 11 12
111
1 2 - 11 11 11 1
1
118
Lessor Aircraft
Magix Airlease Limited Airbus A320MASL Sweden (8) AB Airbus A320Merlin Aviation Leasing (Ireland) 18 Limited Airbus A320Merlin Aviation Leasing (Ireland) 7 Limited Airbus A320NBB Cuckoo Co., Ltd Airbus A321NBB Grosbeak Co., Ltd Airbus A321NBB Redstart Co. Ltd Airbus A321NBB-6658 Lease Partnership Airbus A321NBB-6670 Lease Partnership Airbus A321Orix Aviation Systems Limited Airbus A320PAAL Aquila Company Limited Airbus A321PAAL Gemini Company Limited Airbus A321SASOF II (J) Aviation Ireland Limited Airbus A319Shenton Aircraft Leasing Limited Airbus A320Sky High XXIV Leasing Company Limited Airbus A320Sky High XXV Leasing Company Limited Airbus A320SMBC Aviation Capital Limited Airbus A320SMBC Aviation Capital Limited Airbus A321TC-CIT Aviation Ireland Limited Airbus A320Volito Aviation August 2007 AB Airbus A320Volito Aviation November 2006 AB Airbus A320Volito November 2006 AB Airbus A320Wells Fargo Bank North National Association Airbus A319Wells Fargo Bank North National Association Airbus A320Wells Fargo Bank Northwest National Association Airbus A320Wells Fargo Bank Northwest National Association Airbus A350Wells Fargo Bank Northwest National Association Boeing 767Wells Fargo Bank Northwest National Association Boeing 777Wells Fargo Bank Northwest National Association Boeing 787Wilmington Trust Company Airbus A319Total
11 -
1 - 1
11 14 5
11 11 1
2 2
5 7
2 2
- 2
2016
- 1
2
2 2
11 11
1
2 22 3
As of As ofDecember 31,
2017December 31,
111
2 3
4 6
93
- 1
5 524 62 2
1
21
1 -
21
1
1
-
1
The rentals are shown in results for the period for which they are incurred.
The minimum future lease payments not yet payable are the following:
Between one and five yearsNo later than one year
Over five years
462,2051,620,2531,498,064
Total
533,3191,459,3621,262,509
3,255,1903,580,522
As ofDecember 31,
2016
ThUS$
As ofDecember 31,
2017
ThUS$
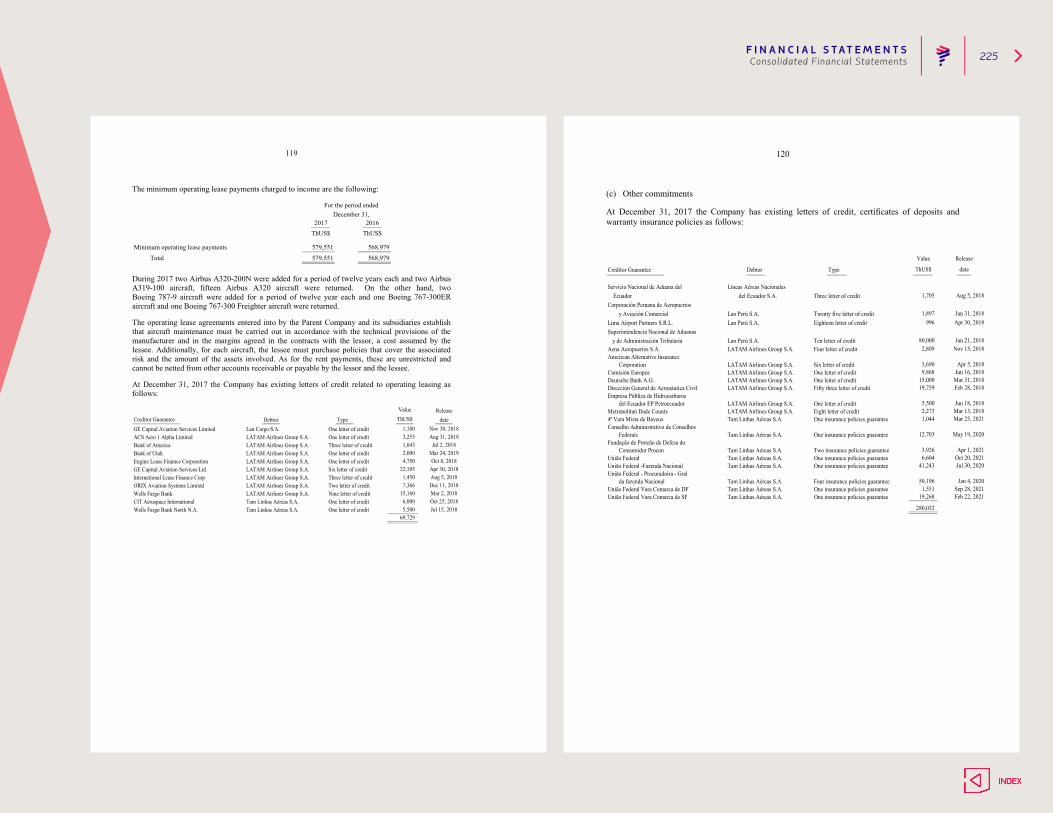
F I N A N C I A L S T AT E M E N T S 225Consolidated Financial Statements
119
The minimum operating lease payments charged to income are the following:
579,551
579,551
2017 2016ThUS$
568,979
ThUS$
For the period endedDecember 31,
Minimum operating lease payments
Total 568,979
During 2017 two Airbus A320-200N were added for a period of twelve years each and two Airbus A319-100 aircraft, fifteen Airbus A320 aircraft were returned. On the other hand, two Boeing 787-9 aircraft were added for a period of twelve year each and one Boeing 767-300ER aircraft and one Boeing 767-300 Freighter aircraft were returned.
The operating lease agreements entered into by the Parent Company and its subsidiaries establish that aircraft maintenance must be carried out in accordance with the technical provisions of the manufacturer and in the margins agreed in the contracts with the lessor, a cost assumed by the lessee. Additionally, for each aircraft, the lessee must purchase policies that cover the associated risk and the amount of the assets involved. As for the rent payments, these are unrestricted and cannot be netted from other accounts receivable or payable by the lessor and the lessee.
At December 31, 2017 the Company has existing letters of credit related to operating leasing as follows:
Creditor Guarantee Debtor TypeGE Capital Aviation Services Limited Lan Cargo S.A. One letter of creditACS Aero 1 Alpha Limited LATAM Airlines Group S.A. One letter of creditBank of America LATAM Airlines Group S.A. Three letter of creditBank of Utah LATAM Airlines Group S.A. One letter of creditEngine Lease Finance Corporation LATAM Airlines Group S.A. One letter of creditGE Capital Aviation Services Ltd. LATAM Airlines Group S.A. Six letter of creditInternational Lease Finance Corp LATAM Airlines Group S.A. Three letter of creditORIX Aviation Systems Limited LATAM Airlines Group S.A. Two letter of creditWells Fargo Bank LATAM Airlines Group S.A. Nine letter of creditCIT Aerospace International Tam Linhas Aéreas S.A. One letter of creditWells Fargo Bank North N.A. Tam Linhas Aéreas S.A. One letter of credit
69,729
Releasedate
ValueThUS$
6,000 Oct 25, 2018
2,000 Mar 24, 2019Oct 8, 2018
Nov 30, 2018Aug 31, 2018
1,450 Aug 5, 2018
Jul 15, 2018
15,160 Mar 2, 2018
5,500
1,100 3,255 1,043
4,750
Jul 2, 2018
Apr 30, 2018
7,366 Dec 11, 2018
22,105
120
(c) Other commitments
At December 31, 2017 the Company has existing letters of credit, certificates of deposits and warranty insurance policies as follows:
Creditor Guarantee Debtor Type
Servicio Nacional de Aduana del Líneas Aéreas NacionalesEcuador del Ecuador S.A. Three letter of credit
Corporación Peruana de Aeropuertosy Aviación Comercial Lan Perú S.A. Twenty five letter of credit
Lima Airport Partners S.R.L. Lan Perú S.A. Eighteen letter of creditSuperintendencia Nacional de Aduanas
y de Administración Tributaria Lan Perú S.A. Ten letter of creditAena Aeropuertos S.A. LATAM Airlines Group S.A. Four letter of creditAmerican Alternative Insurance
Corporation LATAM Airlines Group S.A. Six letter of creditComisión Europea LATAM Airlines Group S.A. One letter of creditDeutsche Bank A.G. LATAM Airlines Group S.A. One letter of creditDirección General de Aeronáutica Civil LATAM Airlines Group S.A. Fifty three letter of creditEmpresa Pública de Hidrocarburos
del Ecuador EP Petroecuador LATAM Airlines Group S.A. One letter of creditMetropolitan Dade County LATAM Airlines Group S.A. Eight letter of credit4ª Vara Mista de Bayeux Tam Linhas Aéreas S.A. One insurance policies guaranteeConselho Administrativo de Conselhos
Federais Tam Linhas Aéreas S.A. One insurance policies guaranteeFundação de Proteão de Defesa do
Consumidor Procon Tam Linhas Aéreas S.A. Two insurance policies guaranteeUnião Federal Tam Linhas Aéreas S.A. One insurance policies guaranteeUnião Federal -Fazenda Nacional Tam Linhas Aéreas S.A. One insurance policies guaranteeUnião Federal - Procuradoira - Gral
da fazenda Nacional Tam Linhas Aéreas S.A. Four insurance policies guaranteeUnião Federal Vara Comarca de DF Tam Linhas Aéreas S.A. One insurance policies guaranteeUnião Federal Vara Comarca de SP Tam Linhas Aéreas S.A. One insurance policies guarantee
5,500 Jun 18, 20182,273 Mar 13, 2018
3,926 Apr 1, 2021
50,196 Jan 4, 2020
6,604 Oct 20, 202141,243 Jul 30, 2020
19,268 Feb 22, 2021
280,032
1,551 Sep 28, 2021
Value Release
ThUS$ date
Jun 16, 20189,868 3,690 Apr 5, 2018
80,000 Jan 21, 2018
Mar 31, 2018
12,703 May 19, 2020
1,044 Mar 25, 2021
1,897 Jan 31, 2018
19,759 Feb 28, 2018
1,705 Aug 5, 2018
2,809 Nov 15, 2018
996 Apr 30, 2018
15,000
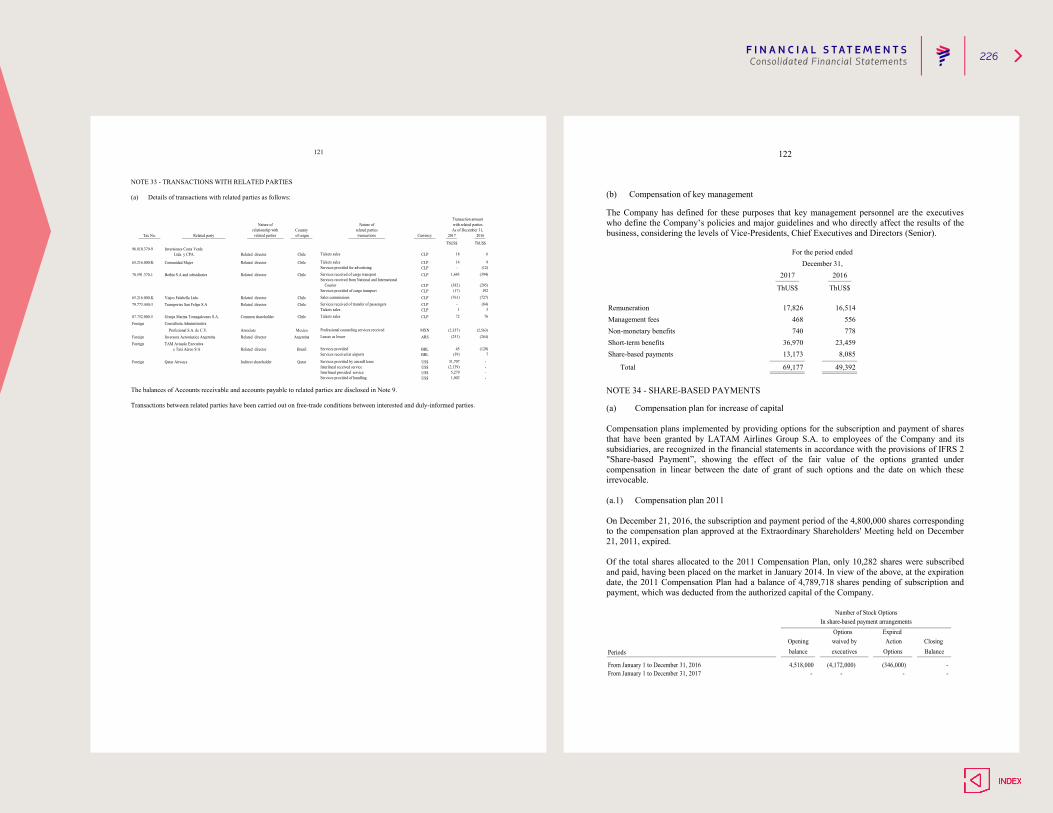
F I N A N C I A L S T AT E M E N T S 226Consolidated Financial Statements
121
NOTE 33 - TRANSACTIONS WITH RELATED PARTIES
(a) Details of transactions with related parties as follows:
Indirect shareholderInterlineal received serviceInterlineal provided service
MexicoForeign
BRL
Foreign
Profesional S.A. de C.V.
Services received at airports
Chile
Professional counseling services receivedConsultoría Administrativa
Foreign TAM Aviação Executiva
Qatar
Transaction amount
As of December 31,with related parties
Tickets sales CLP
Tickets sales CLP
Nature of
Currency
Services received of cargo transportServices received from National and International
2017
ThUS$
related partiestransactionsRelated party
Ltda. y CPA.
Granja Marina Tornagaleones S.A. Common shareholder
Related director
US$
ARS
CLP
MXNAssociate
US$
Services provided BRL
Qatar Airways
Transportes San Felipe S.A Services received of transfer of passengers
Leases as lessor
Related director
Country of origin
Chile
Nature of relationship with
related partiesTax No.
96.810.370-9
Chile
Inversiones Costa Verde
78.591.370-1 Bethia S.A and subsidiaries Related director Chile
65.216.000-KCLPServices provided for advertising
Related director ChileComunidad Mujer
79.773.440-3 Chile65.216.000-K Viajes Falabella Ltda. Related director
87.752.000-5
Foreign ArgentinaInversora Aeronáutica Argentina Related director
e Taxi Aéreo S/A Related director Brazil
18
- 1,643
(17)(382)
- 1
72
CLP
(39)
(2,357)(251)
31,707
45
76
(2,563)
Tickets sales CLP 14
(761)Services provided of cargo transport
Tickets sales CLP
(727)Sales commissions
3
CLP
2016
ThUS$
6
(12)
(84)
9
(394)
(285)192
CLP
CLPCourier
(264)
(120)7
- US$ (2,139) -
Services provided by aircraft lease
Services provided of handlingUS$ 5,279
1,002
-
-
The balances of Accounts receivable and accounts payable to related parties are disclosed in Note 9. Transactions between related parties have been carried out on free-trade conditions between interested and duly-informed parties.
122
(b) Compensation of key management
The Company has defined for these purposes that key management personnel are the executives who define the Company’s policies and major guidelines and who directly affect the results of the business, considering the levels of Vice-Presidents, Chief Executives and Directors (Senior).
Share-based payments
Total
Non-monetary benefitsShort-term benefits
RemunerationManagement fees
For the period endedDecember 31,
2017
ThUS$
17,826
49,392
74036,97013,173
2016
ThUS$
16,514556778
468
69,177
23,4598,085
NOTE 34 - SHARE-BASED PAYMENTS (a) Compensation plan for increase of capital Compensation plans implemented by providing options for the subscription and payment of shares that have been granted by LATAM Airlines Group S.A. to employees of the Company and its subsidiaries, are recognized in the financial statements in accordance with the provisions of IFRS 2 "Share-based Payment”, showing the effect of the fair value of the options granted under compensation in linear between the date of grant of such options and the date on which these irrevocable. (a.1) Compensation plan 2011 On December 21, 2016, the subscription and payment period of the 4,800,000 shares corresponding to the compensation plan approved at the Extraordinary Shareholders' Meeting held on December 21, 2011, expired. Of the total shares allocated to the 2011 Compensation Plan, only 10,282 shares were subscribed and paid, having been placed on the market in January 2014. In view of the above, at the expiration date, the 2011 Compensation Plan had a balance of 4,789,718 shares pending of subscription and payment, which was deducted from the authorized capital of the Company.
Number of Stock OptionsIn share-based payment arrangements
Options Expired Closing
Periods balance executives Options BalanceOpening waived by Action
- From January 1 to December 31, 2017 - - - From January 1 to December 31, 2016 4,518,000 (4,172,000) (346,000)
-
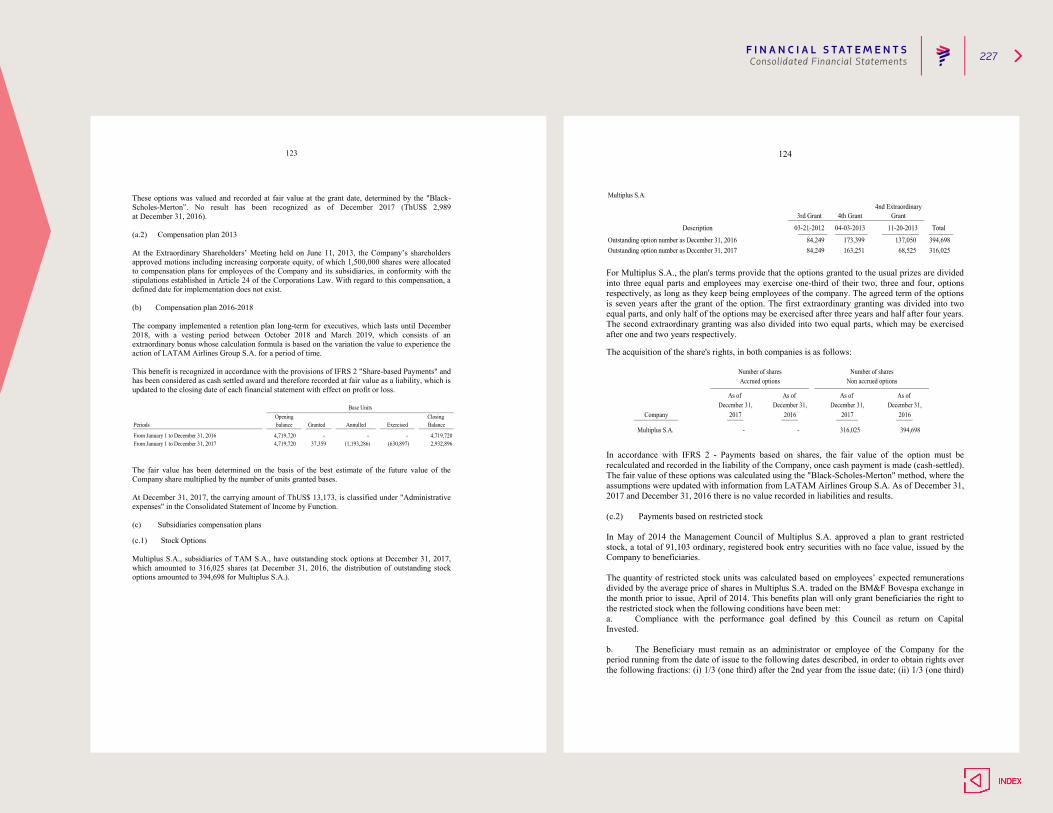
F I N A N C I A L S T AT E M E N T S 227Consolidated Financial Statements
123
These options was valued and recorded at fair value at the grant date, determined by the "Black-Scholes-Merton”. No result has been recognized as of December 2017 (ThUS$ 2,989 at December 31, 2016). (a.2) Compensation plan 2013 At the Extraordinary Shareholders’ Meeting held on June 11, 2013, the Company’s shareholders approved motions including increasing corporate equity, of which 1,500,000 shares were allocated to compensation plans for employees of the Company and its subsidiaries, in conformity with the stipulations established in Article 24 of the Corporations Law. With regard to this compensation, a defined date for implementation does not exist. (b) Compensation plan 2016-2018 The company implemented a retention plan long-term for executives, which lasts until December 2018, with a vesting period between October 2018 and March 2019, which consists of an extraordinary bonus whose calculation formula is based on the variation the value to experience the action of LATAM Airlines Group S.A. for a period of time. This benefit is recognized in accordance with the provisions of IFRS 2 "Share-based Payments" and has been considered as cash settled award and therefore recorded at fair value as a liability, which is updated to the closing date of each financial statement with effect on profit or loss.
Base UnitsClosing
balance Granted Annulled BalancePeriods Exercised
- (630,897)
From January 1 to December 31, 2016 - From January 1 to December 31, 2017 (1,193,286)
Opening
4,719,7202,932,896
4,719,7204,719,720
- 37,359
The fair value has been determined on the basis of the best estimate of the future value of the Company share multiplied by the number of units granted bases. At December 31, 2017, the carrying amount of ThUS$ 13,173, is classified under "Administrative expenses" in the Consolidated Statement of Income by Function. (c) Subsidiaries compensation plans (c.1) Stock Options
Multiplus S.A., subsidiaries of TAM S.A., have outstanding stock options at December 31, 2017, which amounted to 316,025 shares (at December 31, 2016, the distribution of outstanding stock options amounted to 394,698 for Multiplus S.A.).
124
Outstanding option number as December 31, 2017Outstanding option number as December 31, 2016
84,249 68,525163,251 316,025
03-21-2012 04-03-2013 Total
137,050 394,698
4nd ExtraordinaryGrant
Multiplus S.A.
3rd Grant
84,249 173,399
Description
4th Grant
11-20-2013
For Multiplus S.A., the plan's terms provide that the options granted to the usual prizes are divided into three equal parts and employees may exercise one-third of their two, three and four, options respectively, as long as they keep being employees of the company. The agreed term of the options is seven years after the grant of the option. The first extraordinary granting was divided into two equal parts, and only half of the options may be exercised after three years and half after four years. The second extraordinary granting was also divided into two equal parts, which may be exercised after one and two years respectively. The acquisition of the share's rights, in both companies is as follows:
2016
- 394,698
Number of sharesNon accrued options
Number of sharesAccrued options
Company
As of December 31,
2017
As of December 31,
2016
As of As of December 31, December 31,
2017
316,025 Multiplus S.A. -
In accordance with IFRS 2 - Payments based on shares, the fair value of the option must be recalculated and recorded in the liability of the Company, once cash payment is made (cash-settled). The fair value of these options was calculated using the "Black-Scholes-Merton" method, where the assumptions were updated with information from LATAM Airlines Group S.A. As of December 31, 2017 and December 31, 2016 there is no value recorded in liabilities and results. (c.2) Payments based on restricted stock In May of 2014 the Management Council of Multiplus S.A. approved a plan to grant restricted stock, a total of 91,103 ordinary, registered book entry securities with no face value, issued by the Company to beneficiaries. The quantity of restricted stock units was calculated based on employees’ expected remunerations divided by the average price of shares in Multiplus S.A. traded on the BM&F Bovespa exchange in the month prior to issue, April of 2014. This benefits plan will only grant beneficiaries the right to the restricted stock when the following conditions have been met: a. Compliance with the performance goal defined by this Council as return on Capital Invested. b. The Beneficiary must remain as an administrator or employee of the Company for the period running from the date of issue to the following dates described, in order to obtain rights over the following fractions: (i) 1/3 (one third) after the 2nd year from the issue date; (ii) 1/3 (one third) after the 3rd year from the issue date; (iii) 1/3 (one third) after the 4th year from the issue date.

F I N A N C I A L S T AT E M E N T S 228Consolidated Financial Statements
125
Number shares in circulation
From January 1 to December 31, 2016
From January 1 to December 31, 2017
Not acquired due to breach of employment
Granted Exercised retention conditions balance
175,910 138,282 (15,811) (60,525)
Openingbalance
Closing
237,856 129,218 (41,801) (15,563) 309,710
237,856
NOTE 35 - STATEMENT OF CASH FLOWS
(a) The Company has done significant non-cash transactions mainly with financial leases, which are detailed in Note 17 letter (d), additional information in numeral (iv) Financial leases.
(b) Other inflows (outflows) of cash:
Others deposits in guarantees 3,754 -
(4,201)
Court deposits
Change reservation systemsCurrency hedge
(229,163)
Guarantees 59,988 (51,559)
DOJ fine - (12,750)SEC agreement - (4,719)
Fuel hedge 19,862 (50,029)
Fuel derivatives premiums (2,832)
13,706
(10,383)
(9,223)
80,615(26,214)
8,896
-(8,931)
(6,840)
(6,635) (10,668)
(125,149)
843
(74,186)
(3,716)(4,337)
Total Other inflows (outflows) Financing flow
Loan guaranteeAircraft Financing advances
Total Other inflows (outflows) Investment flow
Tax paid on bank transaction
Settlement of derivative contracts (40,695) (29,828)
Others
Bank commissions, taxes paid and other (7,738)
Hedging margin guarantees
Others
Recovery loans convertible into shares(2,594)
(33,457)
(16,120)(17,798)
-
Tax paid on bank transaction
December 31,For the periods ended
Total Other inflows (outflows) Operation flow
2017 ThUS$
2016 ThUS$
1,184
(769)
(33,635)50
(209,269)
-(39,534)
126
(c) Dividends:
Latam Airlines Group S.A.Multiplus S.A. (*)Lan Perú S.A. (*)
Total dividends paid
For the periods endedDecember 31,
2017 ThUS$
2016 ThUS$
(20,766) -
(400)(45,876)
(41,223)(66,642)
(40,823)-
(*) Dividends paid to minority shareholders d) Reconciliation of liabilities arising from financing activities:
7,891,640
As of Cash flows As ofDecember 31,
financial institutions 2016 Capital Capital Interest and others Reclassifications
155,907
financial institutions 8,604,920 1,450,771 (2,213,413) (389,724) 439,086 -
December 31,
ThUS$ ThUS$ ThUS$ ThUS$ ThUS$ ThUS$ ThUS$
314,619Loans to exporters
Obtainment Interest accrued2017
Obligations with Payment
(21,127) 32,668 - 278,164 130,000 (99,719) (7,563) 13,737 -
1,055,167 (797,828) (128,764) 146,146 -
13,107 (124,688) (22,434) 22,024 -
Total Obligations with
242,1751,584,066
256,420 - (15,022) (8,890) 9,667
1,109,504394,791
-
58,937 419,0851,309,345
4,036,843585,287 70,357 (345,552)
Non-Flow Movements
Other loansFinancial leasesObligation with the publicOther guaranteed obligationsGuaranteed obligationsBank loans 321,633
4,758,552 182,140 (486,599) (154,072) (419,085)
282,8001,022,361 - (344,005) (46,874)
(e) Advances of aircraft Below are the cash flows associated with aircraft purchases, which are included in the statement of consolidated cash flow, in the item Purchases of properties, plants and equipment:
Increases (payments)RecoveriesTotal cash flows
For the periods endedDecember 31,
2017 2016
MUS$ MUS$
(126,502) 556,901
(205,143) (170,684)78,641 727,585

F I N A N C I A L S T AT E M E N T S 229Consolidated Financial Statements
127
NOTE 36 - THE ENVIRONMENT LATAM Airlines Group S.A has a commitment to sustainable development seeking to generate value taking into account the governance, environmental and social aspects. The company manages environmental issues at a corporate level, centralized in the Sustainability Management. For the company to monitor and minimize its impact on the environment is a commitment of the highest level; where the continuous improvement and contribute to the solution of the global climate change problem, generating added value to the company and the region, are the pillars of its management. One of the functions of the Sustainability Management in environmental issues, together with the various areas of the Company, is to ensure environmental compliance, implement a management system and environmental programs that comply with the requirements every day more. demanding worldwide; in addition to continuous improvement programs in their internal processes, which generate environmental, social and economic benefits and which are added to those currently carried out. Within the sustainability strategy, the Environment dimension of LATAM Airlines Group S.A., is called Climate Change and is based on the goal of achieving world leadership in this area, and for which we work on the following aspects: i. Carbon footprint ii. Eco Efficiency iii. Sustainable Alternative Energy iv. Standards and Certifications This is how, during 2017, the following initiatives have been carried out: - Implementation of an Environmental Management System for the main operations of the
company. It is highlighted that the company during 2016 has recertified its environmental management system in Miami facilities following the guidelines of the international standard ISO 14.001.
- Maintenance of the Stage 2 Certification of IATA Environmental Assestment (IEnvA) whose scope is the international flights operated from Chile, the most advanced level of this certification; being the first in the continent and one of the four airlines in the world that have this certification.
- Preparation of the environmental chapter for the sustainability report of the company, which allows to measure progress in environmental issues.
- Answer to the questionnaire of the DJSI. - Measurement and external verification of the Corporate Carbon Footprint. - Neutralization of land operations in the operations of Colombia and Peru with emblematic
reforestation projects in the respective countries. It is highlighted that in 2017, LATAM Airlines Group maintained its inclusion for the fourth consecutive year in the world category of the Dow Jones Sustainability Index, with only 3 airlines in the world belonging to this select group.
128
NOTE 37 - EVENTS SUBSEQUENT TO THE DATE OF THE FINANCIAL STATEMENTS Subsequent to December 31, 2017 and until the date of issuance of these financial statements, there is no knowledge of other financial or other events that significantly affect the balances or their interpretation. The consolidated financial statements of LATAM Airlines Group S.A. and Subsidiaries as of December 31, 2017, have been approved in an Extraordinary Board Meeting on March 14, 2018.
F I N A N C I A L S T AT E M E N T S 230Subsidiaries and Affiliated Companies
and Affiliated Companies
LATAM AIRLINES GROUP S.AName: LATAM Airlines Group S.A., R.U.T. 89.862.200-2
Incorporation:It was established as a limited liability company via a public deed dated December 30, 1983 before Notary Eduardo Avello Arellano; an excerpt of this deed is recorded in the Santiago Commerce Registry on page 20,341 number 11,248 of the year 1983, and published in the Official Gazzette on December 31, 1983.
Pursuant to the public deed dated August 20, 1985, granted by Notary Miguel Garay Figueroa’s Office, the company became a joint-stock corporation known as Línea Aérea Nacional Chile S.A. (nowadays, LATAM Airlines Group S.A.) which, by express provision of Law N° 18,400, has the quality of legal follower of the state-owned company created in the year 1929 under the name Línea Aérea Nacional de Chile, pursuant to the aeronautical and radio communications concessions, traffic rights, and other administrative concessions.
Lan Chile S.A.’s Extraoridnary Shareholders’ Meeting agreed on July 23, 2004 to change the company’s name to “Lan Airlines S.A.” An excerpt of the deed to which the Minutes of said Meeting referred was recorded in the Real Estate Registry of the Registry of Commerce on page 25,128 number 18,764 of the year 2004 and published in the Official Gazzette on August 21, 2004. The effective date for the name change was September 8, 2004.
Lan Airlines S.A.’s Extraordinary Shareholders’ meeting held on December 21, 2011 agreed to change the company’s name to “LATAM Airlines Group S.A.” An excerpt of the deed to which the Minutes of said Meeting referred was recorded in the Real Estate Registry of the Registry of Commerce on page 4,238 number 2,921 of the year 2012 and published in the Official Gazzette on January 14, 2012. The effective date for the name change was June 22, 2012.
LATAM Airlines Group S.A. is ruled by the regulation applicable to open stock companies, and registered to this effect under Nº 0306, dated January 22, 1987, in the Commission for the Financial Market (“CMF”), formerly the Superintendency of Securities and Insurance.
Note: A summary of the subsidiaries’ Financial Statements is presented herein. The full information is available to the public in our offices and at the CMF.
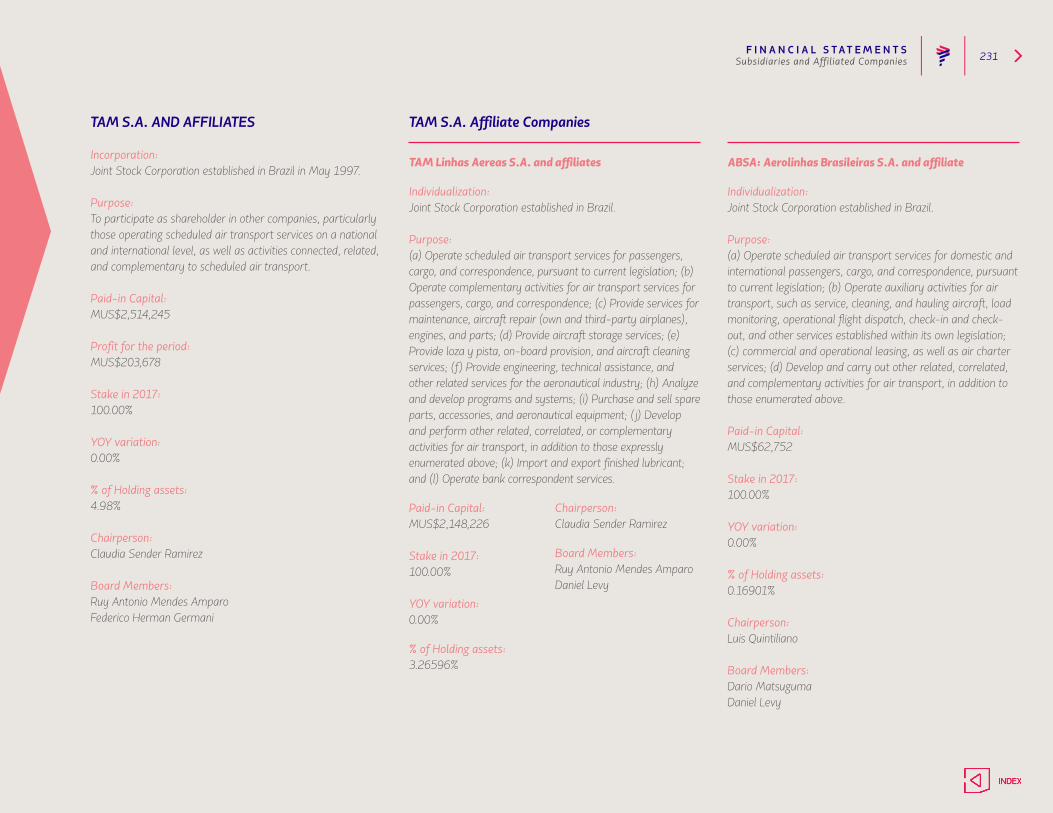
F I N A N C I A L S T AT E M E N T S 231Subsidiaries and Affiliated Companies
TAM S.A. AND AFFILIATES
Incorporation:Joint Stock Corporation established in Brazil in May 1997.
Purpose:To participate as shareholder in other companies, particularly those operating scheduled air transport services on a national and international level, as well as activities connected, related, and complementary to scheduled air transport.
Paid-in Capital:MUS$2,514,245
Profit for the period:MUS$203,678
Stake in 2017:100.00%
YOY variation:0.00%
% of Holding assets:4.98%
Chairperson: Claudia Sender Ramirez
Board Members: Ruy Antonio Mendes Amparo Federico Herman Germani
ABSA: Aerolinhas Brasileiras S.A. and affiliate
Individualization:Joint Stock Corporation established in Brazil.
Purpose: (a) Operate scheduled air transport services for domestic and international passengers, cargo, and correspondence, pursuant to current legislation; (b) Operate auxiliary activities for air transport, such as service, cleaning, and hauling aircraft, load monitoring, operational flight dispatch, check-in and check-out, and other services established within its own legislation; (c) commercial and operational leasing, as well as air charter services; (d) Develop and carry out other related, correlated, and complementary activities for air transport, in addition to those enumerated above.
Paid-in Capital:MUS$62,752
Stake in 2017:100.00%
YOY variation:0.00%
% of Holding assets:0.16901%
Chairperson: Luis Quintiliano
Board Members: Dario Matsuguma Daniel Levy
TAM Linhas Aereas S.A. and affiliates
Individualization:Joint Stock Corporation established in Brazil.
Purpose:(a) Operate scheduled air transport services for passengers, cargo, and correspondence, pursuant to current legislation; (b) Operate complementary activities for air transport services for passengers, cargo, and correspondence; (c) Provide services for maintenance, aircraft repair (own and third-party airplanes), engines, and parts; (d) Provide aircraft storage services; (e) Provide loza y pista, on-board provision, and aircraft cleaning services; (f) Provide engineering, technical assistance, and other related services for the aeronautical industry; (h) Analyze and develop programs and systems; (i) Purchase and sell spare parts, accessories, and aeronautical equipment; ( j) Develop and perform other related, correlated, or complementary activities for air transport, in addition to those expressly enumerated above; (k) Import and export finished lubricant; and (l) Operate bank correspondent services.
Paid-in Capital:MUS$2,148,226
Stake in 2017:100.00%
YOY variation:0.00%
% of Holding assets:3.26596%
TAM S.A. Affiliate Companies
Chairperson: Claudia Sender Ramirez
Board Members: Ruy Antonio Mendes AmparoDaniel Levy
F I N A N C I A L S T AT E M E N T S 232Subsidiaries and Affiliated Companies
Corsair Participações Ltda
Individualization:Joint Stock Corporation established in Brazil.
Purpose:(i) to participate in other civil or commercial associations as shareholder or partner; and (ii) to manage its own assets.
Paid-in Capital:MUS$58
Stake in 2017:100.00%
YOY variation:0.00%
% of Holding assets:0.00332%
Chairperson: Ruy Antonio Mendes Amparo
Board Members: Euzébio Angelotti Neto
Transportes Aereos del Mercosur S.A.
Individualization:Joint Stock Corporation established in Paraguay.
Purpose:It has a broad corporate purpose that includes aeronautical, commercial, tourist, service, financial, representation, and investment activities, with a focus on scheduled and charter, domestic and international, aeronautical transporation activities for people, objects, and/or correspondence, among others, as well as commercial and maintenance and technical assistance services for all types of aircraft, equipment, accessories, and material for airworthiness, among others.
Paid-in Capital:MUS$15,708
Stake in 2017:94.98%
YOY variation:0.00%
% of Holding assets:0.14770%
Chairperson:Rosario Altgelt
Board Members:Enrique Alcaide Hidalgo Esteban Burt Darío Maciel Martínez Hernán Pablo Morosuk (Interim Member)
Multiplus S.A.
Individualization:Joint Stock Corporation established in Brazil.
Purpose:i. To develop and manage the customer loyalty program based on consumption of goods and services offered by the Company’s business partners; ii. To trade the award redemption rights pursuant to the framework of the customer loyalty program; iii. To create databases of both individuals and companies; iv. To obtain and process transaction information regarding consumption patterns; v. To represent other companies, both Brazilian and foreign; and vi. To provide auxiliary services for the trade of goods and products, including, but not limited to, importing and exporting said goods and products and, in addition to the acquisition of related items and products, directly or indirectly, to achieve the abovementioned activities.
Paid-in Capital:MUS$32,437
Stake in 2017:72.40%
YOY variation:0.00%
% of Holding assets:1.49870%
Chairperson: Roberto José Maris de Medeiros
Board Members: Ronald DominguesRicardo Gazetta Ricardo Birtel Mendes de Freitas
TAM S.A. Affiliate Companies
Management:Enrique Alcaide Hidalgo Esteban Burt ArtazaMaria Emiliana Duarte LeónLuis GaleanoDiego Martinez
Chief Executive:Rosario Altgelt
F I N A N C I A L S T AT E M E N T S 233Subsidiaries and Affiliated Companies
TP Franchising Limited
Individualization:Limited Liability Company established in Brazil.
Purpose:(a) to award franchises; (b) to temporarily award its franchisees, free of charge or for a fee, the right to use its brands, systems, knowledge, methods, patents, actuation technology, and any other rights, stakes, or assets, movable or immovable, tangible or intangible, owned by the Company, as present or future owner or licensee, for the development, implementation, operation, or management of the franchises that it may grant; (c) to develop any and all necessary activities to ensure, insofar as possible, the ongoing maintenance and perfecting of the actuation patterns of its franchise network; (d) to develop implementation, operation, and mangement models for its franchise network and their transfer to the franchisees; and (e) the distribution, sale, and marketing of airfares and related products, as well as any related or accessory business to its main objective, while also able to participate in other companies as partner or shareholder, either in Brazil or Abroad, or in consortiums, as well as to carry out its own projects, or form partnerships with third parties in their projects, even to obtain tax benefits, pursuant to current legislation.
Paid-in Capital:MUS$9
Stake in 2017:100.00%
YOY variation:0.00%
% of Holding assets:0.00273%
TAM Capital 2 Inc.
Individualization:Joint Stock Corporation established in Brazil.
Purpose:The company may exercise any activity that is not in conflict with the law.
Paid-in Capital:MUS$93,216
Stake in 2017:100.00%
YOY variation:0.00%
% of Holding assets:0.00%
Board Members: José Zaidan Maluf, Bruno Macarenco AléssioEuzébio Angelotti Neto
Management: Claudia Sender RamirezMarcelo Eduardo Guzzi DezemDaniel Levy
TAM Capital Inc
Individualization:Joint Stock Corporation established in Brazil.
Purpose:The Company may exercise any activity that is not in conflict with the law.
Paid-in Capital:MUS$131,171
Stake in 2017:100.00%
YOY variation:0.00%
% of Holding assets:0.00%
Board Members: José Zaidan Maluf, Bruno Macarenco AléssioEuzébio Angelotti Neto
TAM S.A. Affiliate Companies
F I N A N C I A L S T AT E M E N T S 234Subsidiaries and Affiliated Companies
TAM Capital 3 Inc.
Individualization:Joint Stock Corporation established in Brazil.
Purpose:The company may exercise any activity that is not in conflict with the law.
Paid-in Capital:MUS$210,574
Stake in 2017:100.00%
YOY variation:0.00%
% of Holding assets:0.86614%
Board Members: José Zaidan Maluf, Bruno Macarenco AléssioEuzébio Angelotti Neto
LAN CARGO S.A AND AFFILIATES
Incorporation:Established as a private limited company via the public deed dated May 22, 1970, before Notary Sergio Rodriguez Garces, its incorporation was materialized through the contribution of assets and liabilities from company Linea Aerea del Cobre Limitada (Ladeco Limitada), established on September 3, 1958, before Notary Jaime Garcia Palazuelos. The Company has undergone various reforms, the latest of which is set forth in the public deed dated November 20, 1998, and an excerpt of which was included on page 30,091 number 24,117 of the Santiago Commerce Resgistry and published in the Official Gazzette on December 3, 1998, whereby Ladeco S.A. was merged into Lan Chile S.A.’s affiliate, Fast Air Carrier S.A.
In the public deed dated October 22, 2001, wherein the Minutes from the Extraordinary Shareholders’ Meeting of Ladeco S.A. held on the same date were recorded, the company’s name was changed to “Lan Chile Cargo S.A." An excerpt of said deed was recorded in the Real Estate Registry of the Santiago Registry of Commerce on page 27,746 number 22,624 of the year 2001, and published in the Official Gazzette on November 5, 2001. The name change became effective as of December 10, 2001.
In the public deed dated August 23, 2004, wherein the Minutes from the Extraordinary Shareholders’ Meeting of Lan Chile Cargo S.A. held on August 17, 2004 were recorded, the company’s name was changed to “Lan Cargo S.A." An excerpt of said deed was recorded in the Real Estate Registry of the Santiago Registry of Commerce on page 26,994 number 20,082 of the year 2004 and published in the Official Gazzette on August 30, 2004.
Purpose:To perform and develop, either on its own behalf or for third parties, the following: general transportation in any form and, specifically, air transport of passengers, cargo, and correspondence, within the country and abroad; tourism, lodging,
TAM S.A. Affiliate Companies and other related activities, in any form, within the country and abroad; purchase, sale, manufacture and/or integration, maintenance, leasing, or any other form of use, be it on its own behalf or for third parties, of airplanes, spare parts, and aeronautical equipment, and their operation for any given purpose; provide all sorts of services and counseling related to transportation in general and, specifically, to air transportation in any of its forms, be it ground support, maintenance, technical assistance, or any other type, within the country and abroad, and all sorts of services and activities related to tourism, lodging, and other abovementioned activities and goods, within the country and abroad. In order to meet the abovementioned goals, the Company may perform investments or participate as partner in other companies, either by purchasing stocks or rights or stakes in any other type of corporation, be it an already established one or one created in the future, and overall, perform all acts and enter all contracts necessary and relevant to the purposes described.
Paid-in Capital:MUS$83,226
Profit for the period:MUS$ (4,639)
Stake in 2017:99.898%
YOY variation:0.00%
% of Holding assets:1.93%
Board Members: Andrés Bianchi Urdinola (LATAM Executives)Ramiro Alfonsin Balza (LATAM Executives)Enrique Cueto Plaza (LATAM Executives)
Chief Executive:Andrés Bianchi Urdinola

F I N A N C I A L S T AT E M E N T S 235Subsidiaries and Affiliated Companies
Laser Cargo S.R.L.
Individualization:Limited Liability Company established in Argentina.
Purpose:On its own behalf and/or for third parties, to provide services as an air and sea cargo agent, operation of air and sea containers, loading and unloading control of conventional aircraft, cargo aircraft, conventional ships, and container ships, consolidation and deconsolidation, operations and contracts with air, sea, river, and land cargo transport, distribution, and promotion companies, and related activities and services, imports and exports: said operations will be carried out pursuant to the laws of the country and the regulation pertaining to said professions and activities, the legal stipulations on customs, and the rules of the Argentine coast guard (PNA), Argentine airforce, as well as by commissioning to third parties the performance of tasks assigned by current legislation to customs brokers; also, deposit and transfer of fruit, products, raw materials, general merchandise, and documents in general on its own behalf and/or for third parties: packaging of general merchandise, on its own behalf and/or for third parties. To perform said activities, the company may register as sea or air agent, importer and exporter, sea and air contractor and supplier before the corresponding authorities. In turn, it will carry out postal activities destined to the admission, classification, transportation, distribution, and delivery of correspondence, letters, postcards, and parcels weighing up to 50 kg, within the Argentine Republic and to or from other countries. This activity includes the tasks carried out by so-called couriers or courier companies, and all other assimilated or assimilable activities pursuant to Art. 4 of Decree 1187/93. The company may also carry out the logistics process consisting in transferring, storing, assembling, fractioning, packaging, and conditioning of general merchandise to be later transported and distributed to the end customer, as well as managing the pertinent information
Fast Air Almacenes de Carga S.A.
Individualization:Joint Stock Corporation established in Chile.
Purpose:To operate or manage the warehouses or storage facilities of customs deposits, where any type of good or merchandise can be stored until its withdrawal, for imports, exports, or any other customs destination, pursuant to the terms stated within the Customs Ordinance, its rules, and other corresponding regulation.
Paid-in Capital:MUS$6,741
Stake in 2017:99.89%
YOY variation:0.00%
% of Holding assets:0.04292%
Board Members:Ramiro Alfonsin Balza (LATAM Executives)Andrés del Valle Eitel (LATAM Executives)Hernan Pasman (LATAM Executives)
Chief Executive:Position currently vacant
Lan Cargo S.A. Affiliate Companies
to fulfill this goal; that is: the logistics process from fetching the raw material from the supplier to delivering the finished product to the customer, and the information regulation to guarantee the efficiency in this management process.
Paid-in Capital:MUS$68
Stake in 2017:99.99%
YOY variation:0.00%
% of Holding assets:0.0000%
Board Members:Esteban Bojanich Management:Esteban Bojanich, Rosario AltgeltMaría Marta Forcada, Facundo RochaGonzalo Perez CorralNicolás ObejeroNorberto Díaz
F I N A N C I A L S T AT E M E N T S 236Subsidiaries and Affiliated Companies
Prime Airport Services Inc. and affiliate
Individualization:Corporation established in the United States
Purpose:To operate or manage the warehouses or storage facilities of customs deposits, where any type of good or merchandise can be stored until its withdrawal, for imports, exports, or other customs destination, pursuant to the terms stated within the Customs Ordinance, its rules, and other corresponding regulation.
Paid-in Capital:MUS$2
Stake in 2017:100.00%
YOY variation:0.00%
% of Holding assets:0.00000%
Chief Executive:Rene Pascua
Lan Cargo Overseas Limited and affiliates
Individualization:Limited Liability Company established in Bahamas.
Purpose:To participate in any act or activity that is not expressly forbidden by any valid law in Bahamas.
Paid-in Capital:MUS$1,183
Stake in 2017:100.00%
YOY variation:0.00%
% of Holding assets:0.12644%
Board Members:Andrés del Valle Eitel (LATAM Executive)
Management:Andrés del Valle Eitel (LATAM Executive)
Transporte Aéreo S.A.
Individualization:Joint Stock Corporation established in Chile.
Purpose:To participate in any act or activity that is not expressly forbidden by any existing law in Bahamas.
Paid-in Capital:MUS$11,800
Stake in 2017:99.99%
YOY variation:0.00%
% of Holding assets:1.17109%
Board Members:Ramiro Alfonsin BalzaRoberto Alvo Milosawlewitsch
Management:Ramiro Alfonsin BalzaRoberto Alvo Milosawlewitsch
Lan Cargo S.A. Affiliate Companies
F I N A N C I A L S T AT E M E N T S 237Subsidiaries and Affiliated Companies
Consorcio Fast Air Almacenes de Carga S.A. - Laser Cargo S.R.L.
Individualization:Transitory merger of companies established in Argentina.
Purpose:Bidding at National and International Public Tender N° 11/2000 to be awarded the License of Use for the Installation and Operation of a Tax Warehouse at the Rosario International Airport.
Paid-in Capital:MUS$132
Stake in 2017:100.00%
YOY variation:0.00%
% of Holding assets:0.00018%
Board Members:Esteban Bojanich
Management:Esteban Bojanich
Lan Cargo Inversiones S.A. and affiliate
Individualization:Joint Stock Corporation established in Chile.
Purpose:a) to trade in air transportation, in any of its forms, be it of passengers, correspondence, and/or cargo, and anything related directly or indirectly to said activity within the country or abroad, on its own behalf or for third parties; b) to provide services releated to the maintenance and repair of own and third-party aircraft; c) to market and perform activities related to travel, tourism, and lodging; d) to make and/or participate in all types of investments, both in Chile and abroad, in matters directly or indirectly related to aeronautical issues and/or to any of the other corporate purposes; and e) to carry out and operate all other activities derived from the corporate purpose and/or related, connected, contributory, or complementary activities thereof.
Paid-in Capital:MUS$125
Stake in 2017:100.00%
YOY variation:0.00%
% of Holding assets:0.00000%
Board Members:Andrés Bianchi Urdinola Plaza (LATAM Executive)Ramiro Alfonsin Balza (LATAM Executive)Roberto Alvo Milosawlewitsch (LATAM Executive)
Connecta Corporation
Individualization:Corporation established in the United States.
Purpose:Ownership, operating leasing, and subleasing of aircraft
Paid-in Capital:MUS$1
Stake in 2017:100.00%
YOY variation:0.00%
% of Holding assets:0.11430%
Chief Executive:Andrés Bianchi Urdinola
Lan Cargo S.A. Affiliate Companies
F I N A N C I A L S T AT E M E N T S 238Subsidiaries and Affiliated Companies
Línea Aérea Carguera de Colombia(Subsidiary of LAN Cargo Inversiones)
Individualization:Joint Stock Corporation established in Colombia.
Purpose:To provide public, commercial cargo, and correspondence air transportation within the Republic of Colombia and from and to Colombia. As a secondary corporate purpose, the company can offer maintenance services to itself and to third parties; run its operations school and provide theoretical and practical instruction services, as well as tranining for its own and third-party aeronautical personnel in the various modes and specialties; import spare parts and replacements related to aeronautical activities, for itself and for third parties; provide airport services to third parties; represent or broker national and foreign air transport companies for passengers or cargo, and in general, companies that provide services to the aeronautical sector.
Paid-in Capital:MUS$774
Stake in 2017:90.00%
YOY variation:0.00%
% of Holding assets:0.05192%
Board Members:Alberto Davila Suarez (permanent member)Santiago Alvarez Matamoros (permanent member)Jaime Antonio Gongora Esguerra (permanent member)Andrés Bianchi Urdinola (Interim Member)Jorge Nicolas Cortazar Cardoso (Interim Member)Helen Victoria Warner Sanchez
Management:Jaime Antonio Gongora EsguerraErika Zarante Bahamon
Mas Investment Limited(A subsidiary of LAN Overseas Limited)
Individualization:Limited Liability Company established in Bahamas.
Purpose:To perform all activities that are not expressily forbidden by Bahamas law, and specifically, to hold stakes in other LAN affiliates.
Paid-in Capital:MUS$1,446
Stake in 2017:100.000
YOY variation:0.00%
% of Holding assets:0.03554%
Board Members:J. Richard EvansCarlton MortimerCharlene Y. WelsGeoffrey D. Andrews.
Promotora Aérea Latinoamérica S.A. and affiliates (A subsidiary of Mas Investmet Limited)
Individualization:Variable Capital Corporation established in Mexico.
Purpose:To promote, establish, organize, operate, and participate in the capital and equity of all types of trade companies, civil associations, industrial, commercial, service, or any other type of associations or companies, both national and foreign, as well as to participate in their management or settlement. *Acquisition, disposal, and overall trading in all types of stocks, equity interests, and any other security allowed by the law… *Providing or contracting technical, advisory, and consulting services, as well as signing contracts or agreements to pursue these goals.
Paid-in Capital:MUS$2,216
Stake in 2017:49.00%
YOY variation:0.00%
% of Holding assets:0.02508%
Management:Luis Ignacio Sierra Arriola
Lan Cargo S.A. Affiliate Companies
F I N A N C I A L S T AT E M E N T S 239Subsidiaries and Affiliated Companies
Inversiones Áreas S.A(A Subsidiary of Mas Investmet Limited) Individualization:Joint Stock Corporation established in Peru. Purpose:To promote, establish, organize, operate, and participate in the capital and equity of all types of trade companies, civil associations, industrial, commercial, service, or any other type of associations or companies, both national and foreign, as well as to participate in their management or settlement. *Acquisition, disposal, and overall trading in all types of stocks, equity interests, and any other security allowed by the law… *Providing or contracting technical, advisory, and consulting services, as well as signing contracts or agreements to pursue these goals. Paid-in Capital:MUS$428
Stake in 2017:100.00%
YOY variation:0.00%
% of Holding assets:0.03116%
Chairperson:Jorge Alejandro Villa Mardel Board Members:Jorge Alejandro Villa Mardel Andrés Enrique del Valle EitelRamiro Diego Alfonsín Balza
Chief Executive:Silvana Muguerza Mori
Americonsul S.A de C.V. (A Subsidiary of Promotora Aérea Latinoamérica S.A and affiliates)
Individualization:Variable Capital Corporation established in Mexico.
Purpose:To provide and receive all manner of technical, administrative, or counseling services for industrial, commercial, and service companies; Promote, organize, manage, supervise, provide, and direct personnel training courses; Perform all types of studies, plans, projects, and research; Engage the necessary professional and technical personnel.
Paid-in Capital:MUS$5
Stake in 2017:49.00%
YOY variation:0.00%
% of Holding assets:0.00000%
Management:Luis Ignacio Sierra ArriolaHector Ivan IriarteClaudio Torres
Americonsult de Guatemala S.A. (A subsidiary of Americonsul S.A de C.V)
Individualization:Joint Stock Corporation established in Guatemala.
Purpose:Powers to represent, broker, negotiate, and market; Carry out all types of commercial and industrial activities; All manner of trade in general. Broad purpose that allows for all manner of operations within the country.
Paid-in Capital:MUS$76
Stake in 2017:99.00%
YOY var.:0.00%
% of Holding assets:0.00071%
Chairperson:Luis Ignacio Sierra Arriola
Board Members:Carlos Fernando Pellecer Valenzuela
Management:Carlos Fernando Pellecer Valenzuela
Lan Cargo S.A. Affiliate Companies
F I N A N C I A L S T AT E M E N T S 240Subsidiaries and Affiliated Companies
Americonsult de Costa Rica S.A. (A subsidiary of Americonsul S.A de C.V)
Incorporation:Joint Stock Corporation established in Costa Rica.
Purpose:General trade; industry, agriculture, and livestock.
Paid-in Capital:MUS$20
Stake in 2017:99.00%
YOY var.:0.00%
% of Holding assets:0.00635%
Management:Luis Ignacio Sierra ArriolaTreasurer: Alejandro Fernández EspinozaLuis Miguel Renguel LópezTomás Nassar PérezMarjorie Hernández Valverde.
Lan Cargo S.A. Affiliate Companies LAN PERÚ S.A
Incorporation:Joint Stock Corporation established in Peru on February 14, 1997.
Purpose:Provide air transportation services for passengers, cargo, and correspondence, both nationally and internationally, pursuant to current civil aeronautical legislation.
Paid-in Capital:MUS$4,341
Profit for the period:MUS$ 1,205
Stake in 2017:70.00%
YOY variation:0.00%
% of Holding assets:0.06598%
Chairperson:Emilio Rodríguez Larraín Salinas Board Members:César Emilio Rodríguez Larraín SalinasEnrique Cueto Plaza (LATAM Executive)Enrique Cueto Plaza (LATAM Executive)Jorge Harten CostaAlejandro García VargasEmilio Rodríguez Larraín Miró QuesadaRoberto Alejandro Alvo Milosawlewitsch (LATAM Executive)
Chief Executive:Félix Antelo
LAN INVERSIONES S.A. AND AFFILIATES
Incorporation:Established as a private limited company through the Public Deed dated January 23, 1990 before Notary Humberto Quezada M., recorded in the Santiago Commerce Registry on page 3,462 N° 1,833 of the year 1990, and published in the Official Gazzette on February 2, 1990.
Purpose:Perform investments in all manner of goods, be they movable or immovable, tangible or intangible. Moreover, the Company may establish other types of companies of any sort; acquire rights in already existing corporations, manage, modify, and settle them.
Paid-in Capital:MUS$459
Profit for the period:MUS$1,588
Stake in 2017:100.00%
YOY variation:0.0%
% of Holding assets:0.03447%
Chairperson:Enrique Cueto Plaza (LATAM Executive)Ramiro Alfonsin Balza (LATAM Executive)Roberto Alvo Milosawlewitsch (LATAM Executive)
Chief Executive:Gregorio Bekes (LATAM Executive)
F I N A N C I A L S T AT E M E N T S 241Subsidiaries and Affiliated Companies
Andes Airport Services S.A.
Individualization:Joint Stock Corporation established in Chile.
Purpose:Comprehensive counseling for companies and provision of services for third parties, such as loading, ground handling, staffing, and any other requirements. For this purpose, the company will carry out its operations through personnel expressly hired for this purpose on its own behalf, or for third parties. Overall, the company can carry out all activities directly or indirectly related to its specific purpose of offering counseling or services to third parties.
Paid-in Capital:MUS$3
Stake in 2017:98.00%
YOY variation:0.00%
% of Holding assets:0.02685%
Board Members:Enrique Cueto Plaza (LATAM Executive)Ramiro Alfonsin Balza (LATAM Executive)Roberto Alvo Milosawlewitsch (LATAM Executive)
Board Members: Andrés del Valle Eitel (LATAM Executive)Roberto Alvo Milosawlewitsch (LATAM Executive)Ramiro Alfonsin Balza (LATAM Executive)
Chief Executive:Claudia Caceres Araya (LATAM Executive)
Affiliate Company ofLatam Travel Chile S.A. and stake
Latam Travel Chile II S.A.
Individualization:Joint Stock Corporation established in Chile.
Purpose:Operation, management, and representation of national or foreign companies or businesses in the lodging, shipping, air, and tourism activities in general; brokerage of tourist services, such as: (a) booking seats and selling tickets for all types of national transportation, (b) booking, acquistion, and sale of lodging and tourism services, and tickets to all types of entertainment, museums, monuments, and protected areas in the country, (c) organization, promotion, and sale of tourist packages, understood as the group of tourist services (food, transportation, lodging, etc.), adjusted or projected at the client’s behest, at a preset price, to be operated in national territory, (d) air, land, sea, and river tourist transportation within the national territory; (e) leasing and charter of planes, ships, buses, trains, and other forms of transportation for the provision of tourist services; (f) any other activity directly or indirectly related to the provision of the abovementioned services.
Affiliate companies ofInversiones Lan S.A. and stakes
LATAM TRAVEL CHILE S.A AND AFFILIATE
Incorporation:Established as a private limited company through the Public Deed dated June 22, 1987 before Santiago Notary Raul Undurraga Laso, recorded in the Santiago Commerce Registry on page 13,139 N° 8,495 of the year 1987, and published in the Official Gazzette on July 2, 1987. The company has undergone various reforms, the latest of which is recorded in the public deed dated August 24, 1999 before Santiago Notary Eduardo Pinto Peralta and recorded on page 21,042 N° 16,759 of the year 1999 and published in the Official Gazzette on September 8, 1999.
Purpose:Operation, management, and representation of national and foregin businesses in the lodging, shipping, air, and tourism industries; operation on its own behalf or for third parties, automobile leasing; imports, exports, production, marketing, and distribution on its own behalf or forth third parties, of any type of merchandise, raw materials, inputs, or finished products, in national and international markets.
Paid-in Capital:MUS$235
Profit for the period:MUS$1,833
Stake in 2017:100.00%
YOY variation:0.0%
% of Holding assets:0.02433%

F I N A N C I A L S T AT E M E N T S 242Subsidiaries and Affiliated Companies
Paid-in Capital:MUS$235
Stake in 2017:99.99%
YOY var.:0.00%
% of Holding assets:0.02433%
Board Members: Andrés del Valle Eitel (LATAM Executive)Roberto Alvo Milosawlewitsch (LATAM Executive)Ramiro Alfonsin Balza (LATAM Executive)
Chief Executive:Claudia Caceres Araya (LATAM Executive)
LAN PAX GROUP S.A.
Incorporation:Established as a private limited company through the Public Deed dated September 27, 2001 before Santiago Notary Patricio Zaldivar Mackenna, recorded in the Santiago Commerce Registry on page 25,636 N° 20,794 on October 4, 2001, and published in the Official Gazzette on October 6, 2001.
Purpose:Perform investments in all manner of goods, be they movable or immovable, tangible or intangible. Within its line of business, the Company may create other types of companies of any sort; acquire rights in already existing corporations, manage, modify, and settle them. Overall, it may acquire and sell all manner of goods and operate them, on its own behalf or for third aprties, as well as perform all manner of acts and enter into all manner of contracts conducive to its goals. Exercise the development and operation of all other activities derived from and/or related, connected, contributory, or complementary to the company’s corporate purpose.
Paid-in Capital:MUS$425
Profit for the period:MUS$ (36,343)
Stake in 2017:100.00%
YOY var.:0.00%
% of Holding assets:0.00%
Board Members:Andrés del Valle Eitel (LATAM Executive)Roberto Alvo Milosawlewitsch (LATAM Executive)Ramiro Alfonsin Balza (LATAM Executive)
Chief Executive:Andrés del Valle Eitel (LATAM Executive)
Affiliate companies ofLan Pax Group S.A. and stakes
Inversora Cordillera S.A. and affiliates
Individualization:Joint Stock Corporation established in Argentina.
Purpose:To perform investments on its own behalf or for third parties, or related to third parties, in other stock companies, regardless of corporate purpose, established or to be established, within the Argentine Republic or abroad, via acquisition, incorporation, or sale of stakes, shares, quotas, bonds, options, commercial paper, convertible or otherwise, other transferrable securities, or other forms of investment allowed by the applicable regulation at any given moment, either to hold them in its own portfolio, or to sell them partially or in full, as may be the case. For this purpose, the company may carry out all transactions that are not expressly forbidden by law in compliance with its corporate purpose, and it has full legal capacity to acquire rights, contract obligations, and exercise all acts that are not expressly forbidden by law or statute.
Paid-in Capital:MUS$215,148
Stake in 2017:95.78%
YOY var.:0.00%
% of Holding assets:0.66996%
F I N A N C I A L S T AT E M E N T S 243Subsidiaries and Affiliated Companies
Board Members:Manuel Maria BenitesJorge Luis Perez Alati Ignacio Cueto Plaza
Management:Manuel María BenitesJorge Luis Perez AlatiRosario AltgeltMaría Marta ForcadaFacundo Rocha Gonzalo Perez CorralNicolás ObejeroNorberto Díaz
Latam Travel S.A.
Individualization:Joint Stock Corporation established in Argentina.
Purpose:To perform on its own behalf or for third parties and/or in partnership with third parties, within the country and/or abroad, the following activities and transactions: A) COMMERCIAL: Carry out, intervene, develop, or design all manner of operations and activities involving the sale of airfare, land, river, and sea tickets, both nationally and abroad, or any other service related to the tourism industry in general. The aforementioned services may be carried out on its own behalf or upon request from third parties, via mandate, commission, the use of systems or methods deemed convenient for said purpose, be they manual, mechanical, electronic, telephone, or internet methods, or any other type or technology that may suit said purpose. The Company may perform ad hoc or related activities to the purpose described, such as purchase and sales, imports, exports, reexport, licencing, and representation of all manner of goods, services, know-how, and technology directly or indirectly related to
the purpose described; market, by any means the technology created or whose licence or patent it has acquired or manages; develop, distribute, promote, and market all types of content for mass media of any sort. B) TOURIST: Via the performance of all activities related to the tourist and lodging industry, as responsible operator or third-party service operator, or as travel agent. Via the creation of exchange, tourism, excursion, and tour programs; the brokerage and booking and rendering of services through any form of transportation within the country or abroad, and ticket sales; brokerage for hiring lodging services in the country or abroad; booking of hotels, motels, tourist apartments, and other tourist facilities; organization of trips and tourism for individuals or groups, excursions, or similar activities within the country or abroad; reception and assistance for tourists during their trip and stay in the country, provision of tour guide services, and forwarding of their luggage; representation of other travel and tourist agencies, companies, corporations, or institutions, both national and international, in order to provide any of these services on their behalf. C) MANDATARIA: Via the acceptance, performance, and granting of representations, concessions, commissions, agencies, and mandates in general. D) CONSULTING: Provide consulting, support, and management services on all matters related to the organization, installation, service, development, support, and promotion of companies related to air transportation activities, but not exclusive to said activity, in the management, industrial, commercial, technical, and advertising areas, to be provided, when the nature of the issue so requires, by certified professionals per the corresponding regulation, and the provision of organization and management, care, maintenance, and surveillance services, and of the suitable personnel, especially prepared to carry out said tasks. E) FINANCIAL: Via its participation in other companies already created or to be created, either through the acquisition of shares in established companies, or through the establishment of new companies, via the awarding or securing of credits, loans, cash advances secured or unsecured by collateral o personal guarantee; the awarding
of guarantees and sureties in favor of third parties for a fee or free of charge; placement of funds in foreign currency, gold or currencies, or bank deposits of any type. To achieve these purposes, the company has full legal capacity to exercise all acts not expressly forbidden by law or statue, including making borrowings publicly or privately via the issuance of debentures and tradable securities, and performing all manner of financial transactions except those comprised under Law 21,526 and any others requiring a public tender process.
Paid-in Capital:MUS$(420)
Stake in 2017:100.00%
YOY var.:0.00%
% of Holding assets:0.00447%
Board Members:Nicolás Obejero Facundo Rocha
Management:Rosario AltgeltMaría Marta ForcadaFacundo RochaSebastián PereiraNicolás Obejero Norberto Díaz
Affiliate companies of Lan Pax Group S.A. and stakes
F I N A N C I A L S T AT E M E N T S 244Subsidiaries and Affiliated Companies
Affiliate companies of Lan Pax Group S.A. and stakes
Atlantic Aviation Investments LLC
Individualization:Limited Liability Company established in the United States.
Purpose:Any and all lawful business that the company may undertake
Paid-in Capital:MUS$1
Stake in 2017:99.00%
YOY var.:0.00%
% of Holding assets:0.06092%
Board Members:Andrés del Valle Eitel
Management:Andrés del Valle (LATAM Executive)
Akemi Holdings S.A.
Individualization:Joint Stock Corporation established in Panama.
Purpose:The corporate purposes under which the company is organized are to establish, process, and carry out the business of an investment company anywhere in the world, buy, sell, and trade all manner of consumer items, capital stocks, bonds,
and securities of every type, buy, sell, lease, or in any other manner acquire or dispose of movable or immovable assets, invest in any industrial or commercial business, either as owner or shareholder, receive and provide cash as loans, secured or unsecured, to agree, sign, or follow through and carry out all manner of contracts, set up as guarantor or guarantee and enforce compliance with any and all contracts, to perform any lawful business not banned to a joint stock corporation, and to execute any and all of the above as holders, agents, or under any other representative nature.
Paid-in Capital:MUS$0
Stake in 2017:100.00%
YOY var.:0.00%
% of Holding assets:0.00000%
Board Members:Edith O. de BocanegraBarbara de RodriguezLuis Alberto Rodriguez
Management:Luis Alberto Rodriguez Barbara de Rodríguez
Saipan Holdings S.A.
Individualization:Joint Stock Corporation established in Panama.
Purpose:The corporate purposes under which the company is organized are to establish, process, and carry out the business of an investment company anywhere in the world, buy, sell, and trade all manner of consumer items, capital stocks, bonds, and securities of every type, buy, sell, lease, or in any other manner acquire or dispose of movable or immovable assets, invest in any industrial or commercial business, either as owner or shareholder, receive and provide cash as loans, secured or unsecured, to agree, sign, or follow through and carry out all manner of contracts, set up as guarantor or guarantee and enforce compliance with any and all contracts, to perform any lawful business not banned to a joint stock corporation, and to execute any and all of the above as holders, agents, or under any other representative nature.
Paid-in Capital:MUS$0
Stake in 2017:100.00%
YOY var.:0.00%
% of Holding assets:0.00000%
Board Members:Edith O. de BocanegraBarbara de RodriguezLuis Alberto Rodriguez
Management:Luis Alberto Rodriguez Barbara de Rodríguez

F I N A N C I A L S T AT E M E N T S 245
Aerolane, Líneas Aéreas Nacionales del Ecuador S.A.
Individualization:Joint Stock Corporation established in Ecuador.
Purpose:Combined air transport of passengers, cargo, and correspondence.
Paid-in Capital:MUS$1,000
Stake in 2017:55.00%
YOY var.:0.00%
% of Holding assets:0.06537%
Board Members:Antonio StaggManuel Van Oordt Mariana Villagómez
Chief Executive:Maximiliano Naranjo
Holdco Ecuador S.A
Individualization:Joint Stock Corporation established in Chile.
Purpose:Carry out all manner of investments for profitable purposes pertaining to tanglible or intangible, movable or immovable assets, either in Chile or abroad.
Paid-in Capital:MUS$351,174
Stake in 2017:99.999%
YOY var.:0.0%
% of Holding assets:1.85764%
Board Members:Antonio StaggManuel Van Oordt Mariana Villagómez
Chief Executive:Ramiro Alfonsin Balza (LATAM Executive)
Aerovias de Integración Regional, Aires SA.
Individualization:Joint Stock Corporation established in Colombia.
Purpose:The company’s corporate purpose shall be the operation of national or international commercial air transportation services, in any form, and therefore, the entering into and execution of contracts for the transportation of passengers, objects or luggage, correspondence, and cargo in general, pursuant to the operating permits issued to this effect by the Special Administrative Unit of Civil Aeronautics, or the agency that may carry out said functions in the future, adhering fully to the stipulations of the Code of Commerce, the Colombian Aviation Regulations, and any other rules issued on the matter. Likewise, to provide maintenance and adaptation services for
the equipment related to the operation of air transportation services within the country and abroad. In order to fulfill said purpose, the company will be authorized to invest in other national or foreign companies with purposes that are the same, similar, or complementary to the company’s. To fulfill its corporate purpose, the company may, among other things: (a) review, inspect, or provide maintenance and/or repairs to its own or third-party aircraft, as well as spare parts and accessories, through the Company’s Aeronautical Repair Stations, providing the necessary trainings for said purpose; (b) organize, establish, and invest in commercial transportation companies in Colombia or abroad to perform, industrially or commercially, the economic activity that is its purpose, so the company can acquire, for any purpose, airplanes, spare parts, replacements, and accessories of any kind, necessary for public air transportation, as well as sell them, and to set up and operate stations to repair and give maintenance to the aircraft;(c) enter leasing, charter, code-sharing, service rendering, or any other contracts pertaining to aircraft to exercise its purpose; (d) to operate scheduled air transport lines for passengers, cargo, correspondence, and securities, as well as the vehicle that will make it possible to coordinate the social management; (e) merge with equal, similar, or complementary companies to perform its activity; (f) accept national or foreign representations of services in the same sector or in complementary sectors; (g) acquire movable or immovable assets to develop its corporate purposes, build said facilities or constructions, such as warehouses, deposits, offices, etc., sell, or encumber them;(h) carry out imports and exports, as well as all foreign trade operations required; (i) take money on interest and provide personal, real, and bank guarantees, either on its own behalf or for third parties; ( j) participate in all manner of securities transactions, such as purchase or sale of debentures acquired by third parties when resulting in an economic or equity benefit for the company, and obtain loans through bonds or other liability instruments;(k) enter into contracts with third parties for the
Subsidiaries and Affiliated Companies
Affiliate companies of Lan Pax Group S.A. and stakes
F I N A N C I A L S T AT E M E N T S 246Subsidiaries and Affiliated Companies
Affiliate companies of Lan Pax Group S.A. and stakes
management and operation of the businesses it may organize to achieve its corporate purposes; (l) form partnerships and acquire shares and stakes in already established companies, both national and foreign; make contributions to one and all; (m) merge with other companies and form partnerships with similar companies to ensure provision of air transportation or for other purposes pertaining to the industry; (n) promote, provide technical assistance, finance, or manage companies or associations related to the corporate purpose; (o) carry out all manner of civil or comercial, industrial or financial contracts necessary or convenient to achieve its own purposes; (p) do business and fulfill activities that will ensure the flow of clients, and obtain the necessary authorizations and licenses from the corresponding authorities to provide its services; (q) develop and carry out any other activities resulting from and/or related, connected, contributory, or complementary to the corporate purpose, including the provision of tourist services under any and all forms allowed by law, such as travel agencies; (r) practice any business or legal activity, whether or not related to trade, as long as it is related to its corporate purpose, or that it enables a more rational operation of the public service that it will provide; and (s) make any manner of investments to employ the funds and reserves created pursuant to law or the current bylaws.
Paid-in Capital:MUS$3,388
Stake in 2017:99.017%
YOY var.:0.00%
% of Holding assets:0.24603%
Board Members:Jorge Nicolas Cortazar Cardoso (permanent member)Jaime Antonio Gongora Esguerra (permanent member)Santiago Alvarez Matamoros (permanent member)Jorgue Enrique Cortazar Garcia (Interim member)Alberto Davila Suarez (Interim member)Helen Victoria Warner Sanchez
Management:Erika Zarante Bahamon Jaime Antonio Gongora Esguerra
Lan Argentina S.A(A subsidiary of Inversora Cordillera S.A)
Individualization:Joint Stock Corporation established in Argentina.
Purpose:Carry out all manner of investments for profitable purposes pertaining to tanglible or intangible, movable or immovable assets, either in Chile or abroad.
Paid-in Capital:MUS$129,589
Stake in 2017:99.00%
YOY var.:0.00%
% of Holding assets:0.08762%
Board Members:Manuel Maria BenitesJorge Luis Perez Alati Enrique Cueto Plaza (LATAM Executive)
Management:Manuel María BenitesJorge Luis Perez AlatiRosario AltgeltMaría Marta ForcadaFacundo RochaSebastián PereiraNicolás ObejeroNorberto Díaz
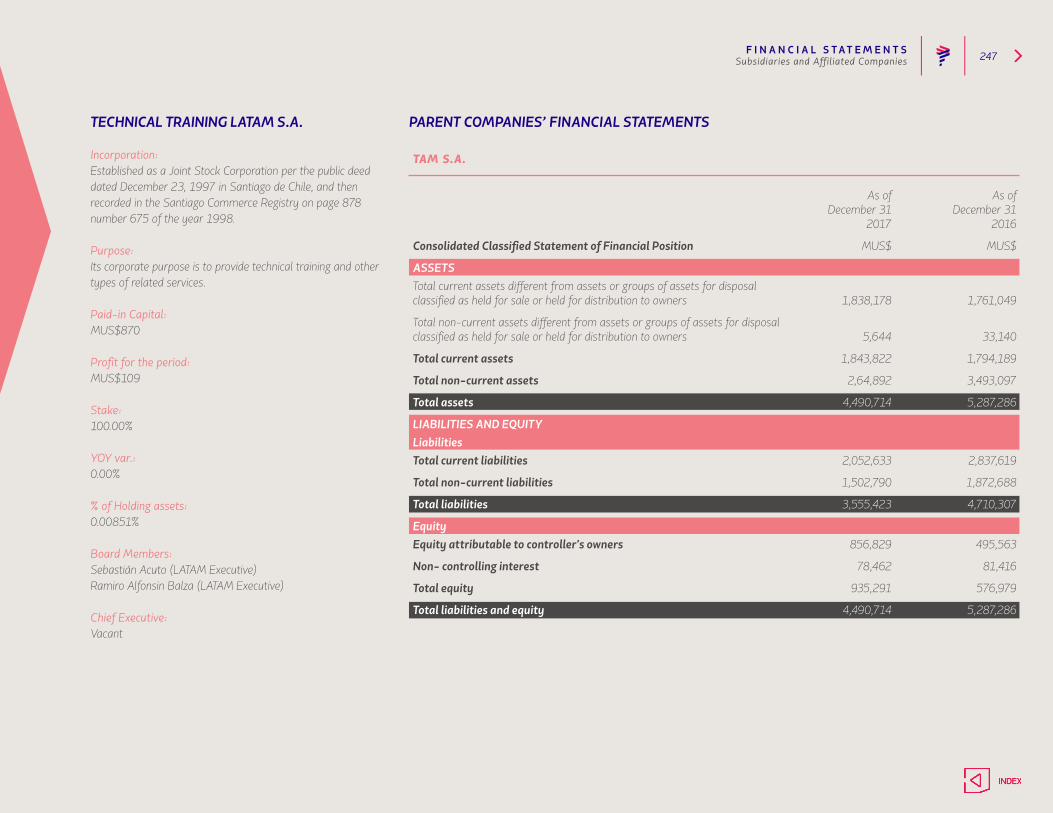
F I N A N C I A L S T AT E M E N T S 247
TECHNICAL TRAINING LATAM S.A.
Incorporation:Established as a Joint Stock Corporation per the public deed dated December 23, 1997 in Santiago de Chile, and then recorded in the Santiago Commerce Registry on page 878 number 675 of the year 1998.
Purpose:Its corporate purpose is to provide technical training and other types of related services.
Paid-in Capital:MUS$870
Profit for the period:MUS$109
Stake:100.00%
YOY var.:0.00%
% of Holding assets:0.00851%
Board Members:Sebastián Acuto (LATAM Executive)Ramiro Alfonsin Balza (LATAM Executive)
Chief Executive:Vacant
Subsidiaries and Affiliated Companies
PARENT COMPANIES’ FINANCIAL STATEMENTS
TAM S.A.
As of As of December 31 December 31 2017 2016
Consolidated Classified Statement of Financial Position MUS$ MUS$
ASSETSTotal current assets different from assets or groups of assets for disposal classified as held for sale or held for distribution to owners 1,838,178 1,761,049
Total non-current assets different from assets or groups of assets for disposal classified as held for sale or held for distribution to owners 5,644 33,140
Total current assets 1,843,822 1,794,189
Total non-current assets 2,64,892 3,493,097
Total assets 4,490,714 5,287,286
LIABILITIES AND EQUITYLiabilities Total current liabilities 2,052,633 2,837,619
Total non-current liabilities 1,502,790 1,872,688
Total liabilities 3,555,423 4,710,307
EquityEquity attributable to controller's owners 856,829 495,563
Non- controlling interest 78,462 81,416
Total equity 935,291 576,979
Total liabilities and equity 4,490,714 5,287,286
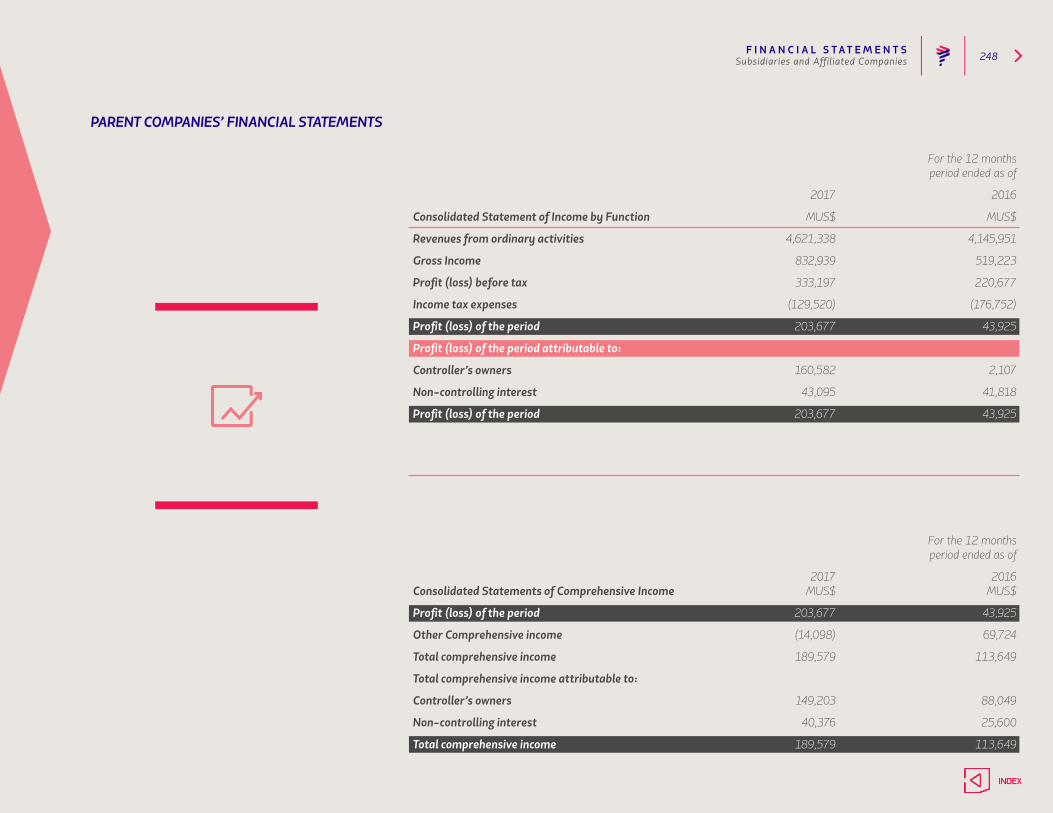
F I N A N C I A L S T AT E M E N T S 248Subsidiaries and Affiliated Companies
PARENT COMPANIES’ FINANCIAL STATEMENTS
For the 12 months period ended as of
2017 2016
Consolidated Statement of Income by Function MUS$ MUS$
Revenues from ordinary activities 4,621,338 4,145,951
Gross Income 832,939 519,223
Profit (loss) before tax 333,197 220,677
Income tax expenses (129,520) (176,752)
Profit (loss) of the period 203,677 43,925
Profit (loss) of the period attributable to:
Controller’s owners 160,582 2,107
Non-controlling interest 43,095 41,818
Profit (loss) of the period 203,677 43,925
For the 12 months period ended as of
2017 2016Consolidated Statements of Comprehensive Income MUS$ MUS$
Profit (loss) of the period 203,677 43,925
Other Comprehensive income (14,098) 69,724
Total comprehensive income 189,579 113,649
Total comprehensive income attributable to:
Controller’s owners 149,203 88,049
Non-controlling interest 40,376 25,600
Total comprehensive income 189,579 113,649
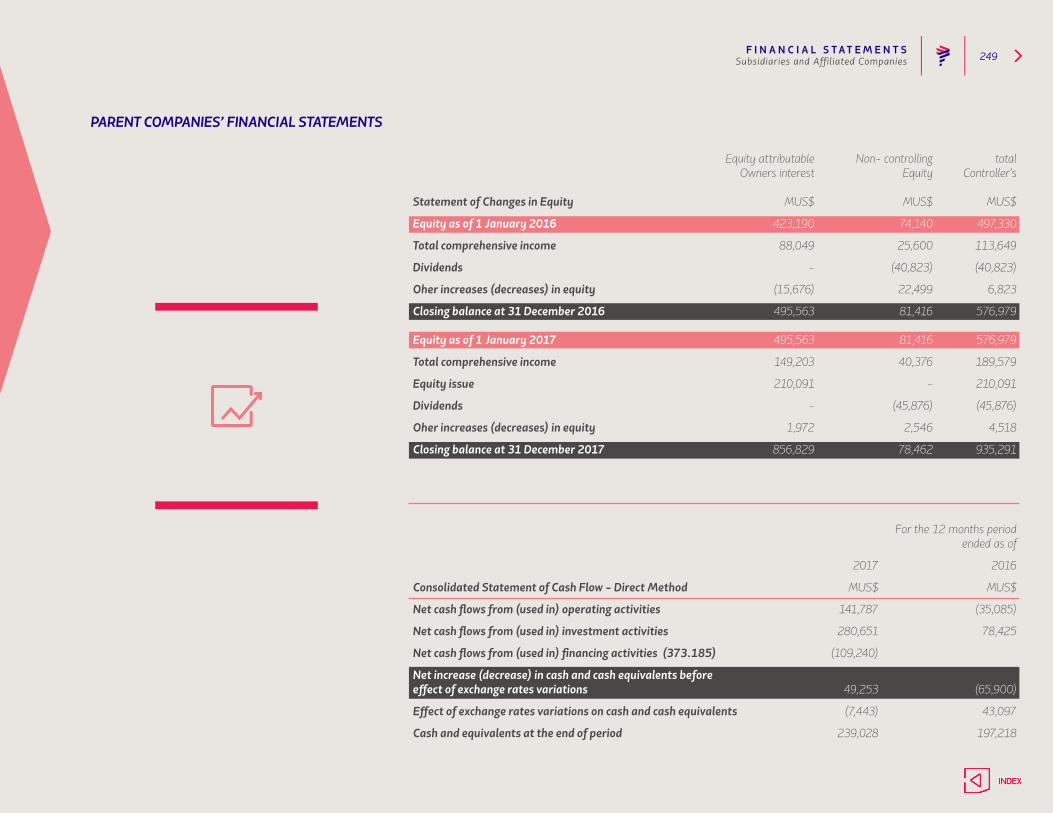
F I N A N C I A L S T AT E M E N T S 249Subsidiaries and Affiliated Companies
PARENT COMPANIES’ FINANCIAL STATEMENTS
Equity attributable Non- controlling total Owners interest Equity Controller’s Statement of Changes in Equity MUS$ MUS$ MUS$
Equity as of 1 January 2016 423,190 74,140 497,330
Total comprehensive income 88,049 25,600 113,649
Dividends - (40,823) (40,823)
Oher increases (decreases) in equity (15,676) 22,499 6,823
Closing balance at 31 December 2016 495,563 81,416 576,979
Equity as of 1 January 2017 495,563 81,416 576,979
Total comprehensive income 149,203 40,376 189,579
Equity issue 210,091 - 210,091
Dividends - (45,876) (45,876)
Oher increases (decreases) in equity 1,972 2,546 4,518
Closing balance at 31 December 2017 856,829 78,462 935,291
For the 12 months period ended as of
2017 2016
Consolidated Statement of Cash Flow - Direct Method MUS$ MUS$
Net cash flows from (used in) operating activities 141,787 (35,085)
Net cash flows from (used in) investment activities 280,651 78,425
Net cash flows from (used in) financing activities (373.185) (109,240)
Net increase (decrease) in cash and cash equivalents beforeeffect of exchange rates variations 49,253 (65,900)
Effect of exchange rates variations on cash and cash equivalents (7,443) 43,097
Cash and equivalents at the end of period 239,028 197,218
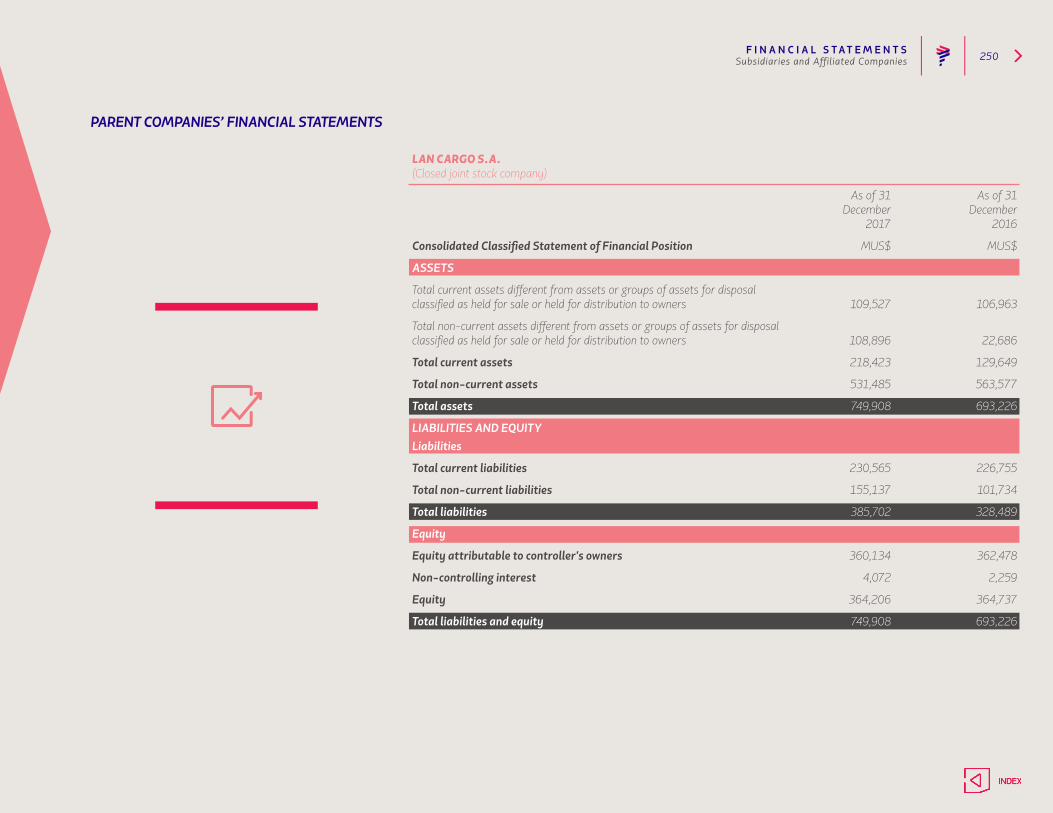
F I N A N C I A L S T AT E M E N T S 250Subsidiaries and Affiliated Companies
LAN CARGO S.A.(Closed joint stock company)
As of 31 As of 31 December December 2017 2016
Consolidated Classified Statement of Financial Position MUS$ MUS$
ASSETS
Total current assets different from assets or groups of assets for disposal classified as held for sale or held for distribution to owners 109,527 106,963
Total non-current assets different from assets or groups of assets for disposal classified as held for sale or held for distribution to owners 108,896 22,686
Total current assets 218,423 129,649
Total non-current assets 531,485 563,577
Total assets 749,908 693,226
LIABILITIES AND EQUITYLiabilities
Total current liabilities 230,565 226,755
Total non-current liabilities 155,137 101,734
Total liabilities 385,702 328,489
Equity
Equity attributable to controller's owners 360,134 362,478
Non-controlling interest 4,072 2,259
Equity 364,206 364,737
Total liabilities and equity 749,908 693,226
PARENT COMPANIES’ FINANCIAL STATEMENTS
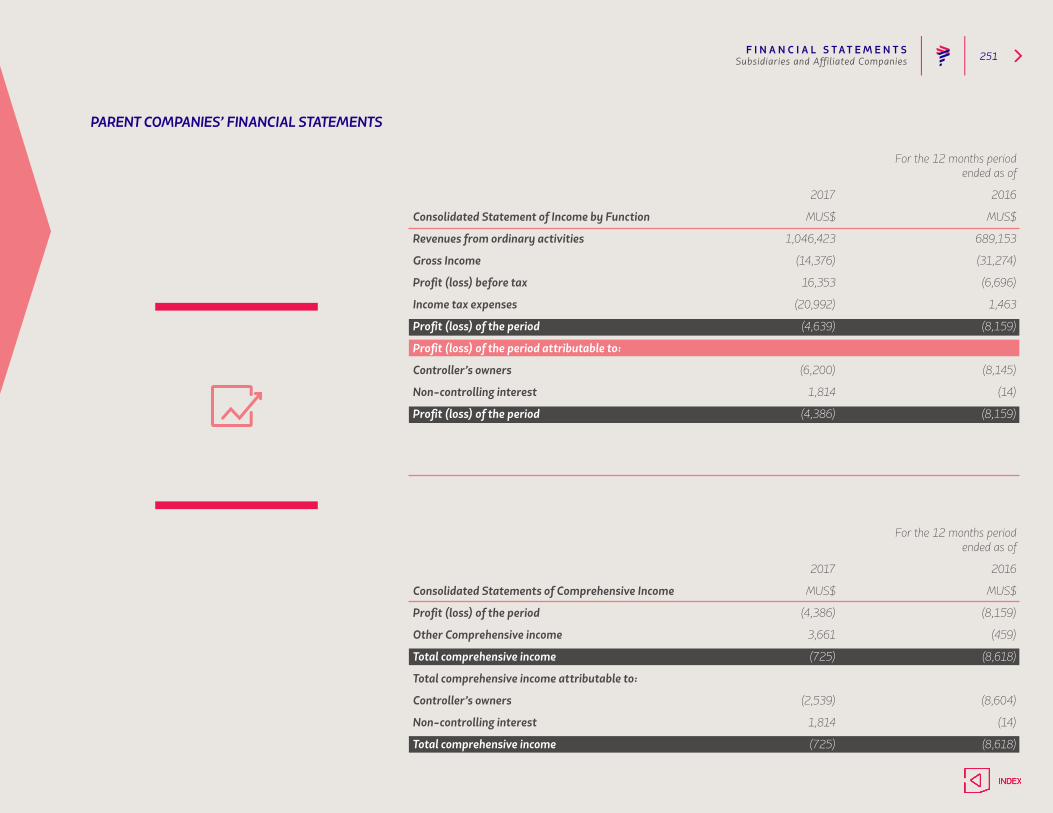
F I N A N C I A L S T AT E M E N T S 251Subsidiaries and Affiliated Companies
PARENT COMPANIES’ FINANCIAL STATEMENTS
For the 12 months period ended as of
2017 2016
Consolidated Statement of Income by Function MUS$ MUS$
Revenues from ordinary activities 1,046,423 689,153
Gross Income (14,376) (31,274)
Profit (loss) before tax 16,353 (6,696)
Income tax expenses (20,992) 1,463
Profit (loss) of the period (4,639) (8,159)
Profit (loss) of the period attributable to:
Controller’s owners (6,200) (8,145)
Non-controlling interest 1,814 (14)
Profit (loss) of the period (4,386) (8,159)
For the 12 months period ended as of
2017 2016
Consolidated Statements of Comprehensive Income MUS$ MUS$
Profit (loss) of the period (4,386) (8,159)
Other Comprehensive income 3,661 (459)
Total comprehensive income (725) (8,618)
Total comprehensive income attributable to:
Controller’s owners (2,539) (8,604)
Non-controlling interest 1,814 (14)
Total comprehensive income (725) (8,618)
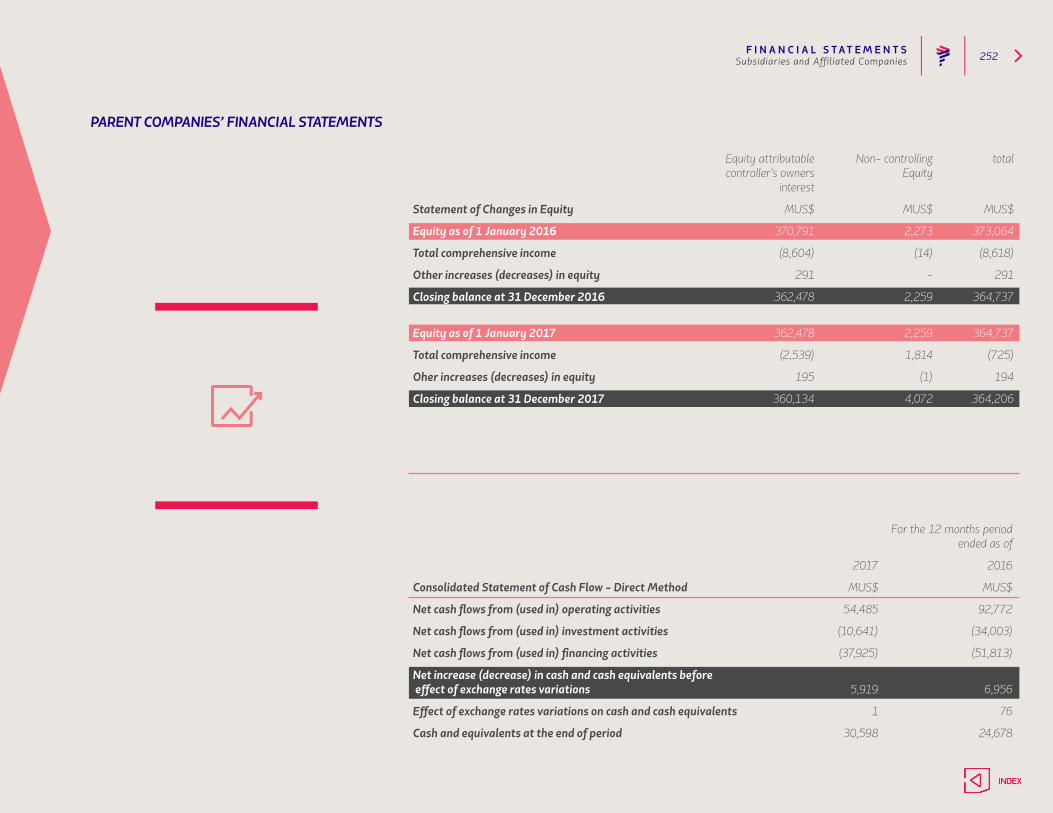
F I N A N C I A L S T AT E M E N T S 252Subsidiaries and Affiliated Companies
PARENT COMPANIES’ FINANCIAL STATEMENTS
Equity attributable Non- controlling total controller’s owners Equity interest
Statement of Changes in Equity MUS$ MUS$ MUS$
Equity as of 1 January 2016 370,791 2,273 373,064
Total comprehensive income (8,604) (14) (8,618)
Other increases (decreases) in equity 291 - 291
Closing balance at 31 December 2016 362,478 2,259 364,737
Equity as of 1 January 2017 362,478 2,259 364,737
Total comprehensive income (2,539) 1,814 (725)
Oher increases (decreases) in equity 195 (1) 194
Closing balance at 31 December 2017 360,134 4,072 364,206
For the 12 months period ended as of
2017 2016
Consolidated Statement of Cash Flow - Direct Method MUS$ MUS$
Net cash flows from (used in) operating activities 54,485 92,772
Net cash flows from (used in) investment activities (10,641) (34,003)
Net cash flows from (used in) financing activities (37,925) (51,813)
Net increase (decrease) in cash and cash equivalents before effect of exchange rates variations 5,919 6,956
Effect of exchange rates variations on cash and cash equivalents 1 76
Cash and equivalents at the end of period 30,598 24,678
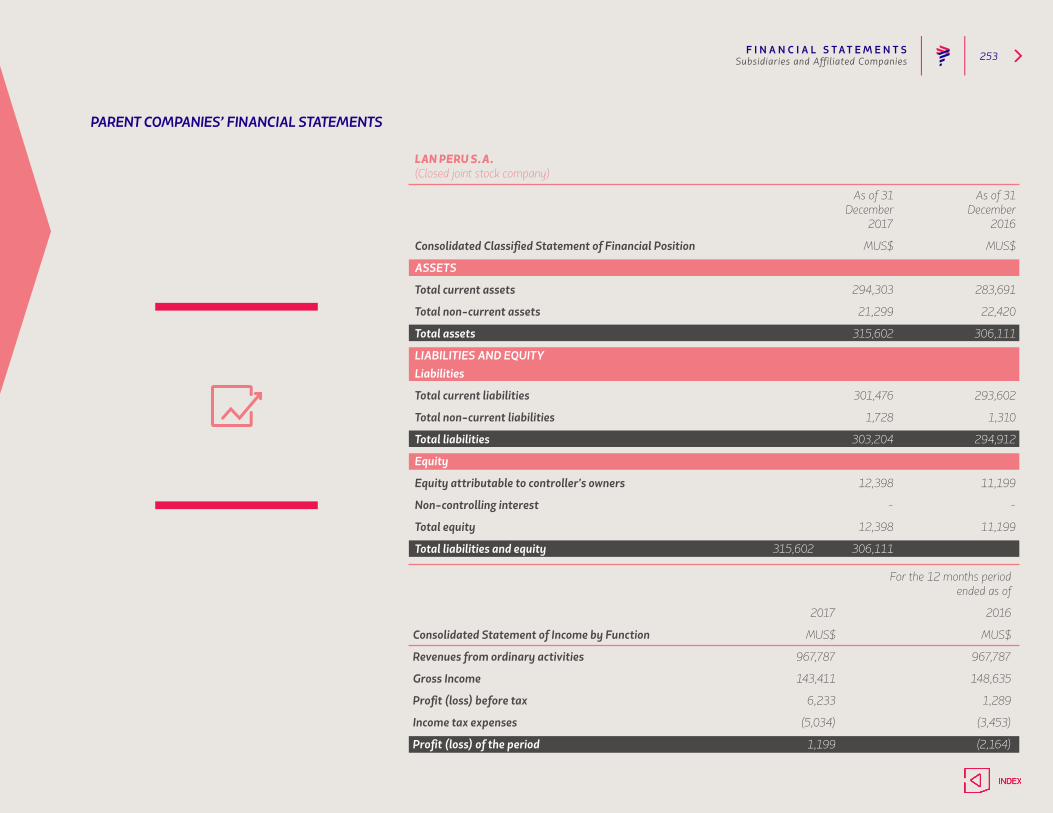
F I N A N C I A L S T AT E M E N T S 253Subsidiaries and Affiliated Companies
LAN PERU S.A.(Closed joint stock company)
As of 31 As of 31 December December 2017 2016
Consolidated Classified Statement of Financial Position MUS$ MUS$
ASSETS
Total current assets 294,303 283,691
Total non-current assets 21,299 22,420
Total assets 315,602 306,111
LIABILITIES AND EQUITYLiabilities
Total current liabilities 301,476 293,602
Total non-current liabilities 1,728 1,310
Total liabilities 303,204 294,912
Equity
Equity attributable to controller's owners 12,398 11,199
Non-controlling interest - -
Total equity 12,398 11,199
Total liabilities and equity 315,602 306,111
PARENT COMPANIES’ FINANCIAL STATEMENTS
For the 12 months period ended as of
2017 2016
Consolidated Statement of Income by Function MUS$ MUS$
Revenues from ordinary activities 967,787 967,787
Gross Income 143,411 148,635
Profit (loss) before tax 6,233 1,289
Income tax expenses (5,034) (3,453)
Profit (loss) of the period 1,199 (2,164)
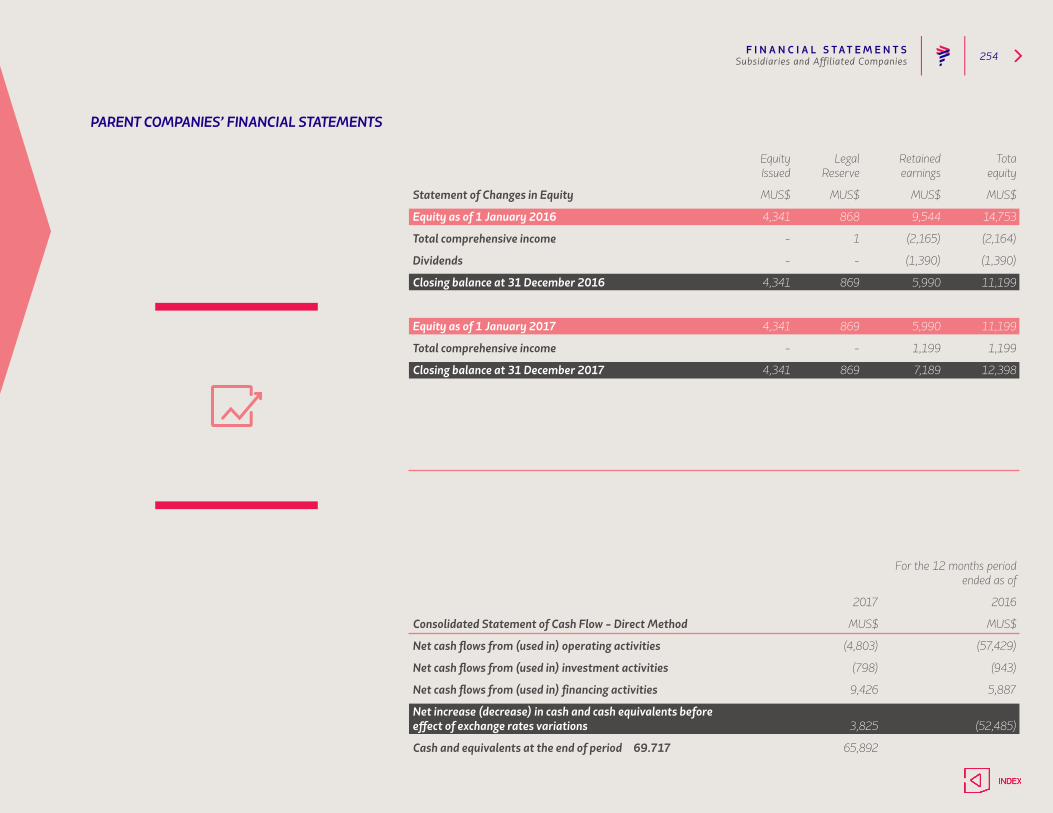
F I N A N C I A L S T AT E M E N T S 254Subsidiaries and Affiliated Companies
PARENT COMPANIES’ FINANCIAL STATEMENTS
Equity Legal Retained Tota Issued Reserve earnings equity
Statement of Changes in Equity MUS$ MUS$ MUS$ MUS$
Equity as of 1 January 2016 4,341 868 9,544 14,753
Total comprehensive income - 1 (2,165) (2,164)
Dividends - - (1,390) (1,390)
Closing balance at 31 December 2016 4,341 869 5,990 11,199
Equity as of 1 January 2017 4,341 869 5,990 11,199
Total comprehensive income - - 1,199 1,199
Closing balance at 31 December 2017 4,341 869 7,189 12,398
For the 12 months period ended as of
2017 2016
Consolidated Statement of Cash Flow - Direct Method MUS$ MUS$
Net cash flows from (used in) operating activities (4,803) (57,429)
Net cash flows from (used in) investment activities (798) (943)
Net cash flows from (used in) financing activities 9,426 5,887
Net increase (decrease) in cash and cash equivalents beforeeffect of exchange rates variations 3,825 (52,485)
Cash and equivalents at the end of period 69.717 65,892
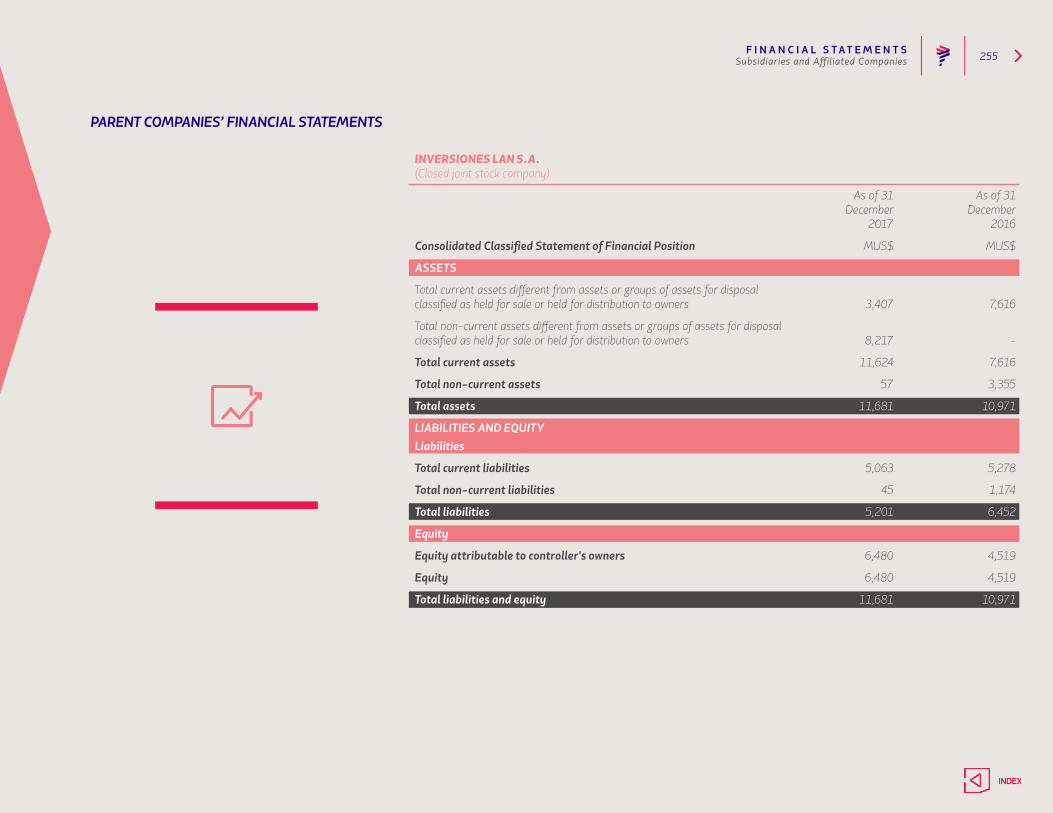
F I N A N C I A L S T AT E M E N T S 255Subsidiaries and Affiliated Companies
INVERSIONES LAN S.A. (Closed joint stock company)
As of 31 As of 31 December December 2017 2016
Consolidated Classified Statement of Financial Position MUS$ MUS$
ASSETS
Total current assets different from assets or groups of assets for disposal classified as held for sale or held for distribution to owners 3,407 7,616
Total non-current assets different from assets or groups of assets for disposal classified as held for sale or held for distribution to owners 8,217 -
Total current assets 11,624 7,616
Total non-current assets 57 3,355
Total assets 11,681 10,971
LIABILITIES AND EQUITYLiabilities
Total current liabilities 5,063 5,278
Total non-current liabilities 45 1,174
Total liabilities 5,201 6,452
Equity
Equity attributable to controller's owners 6,480 4,519
Equity 6,480 4,519
Total liabilities and equity 11,681 10,971
PARENT COMPANIES’ FINANCIAL STATEMENTS
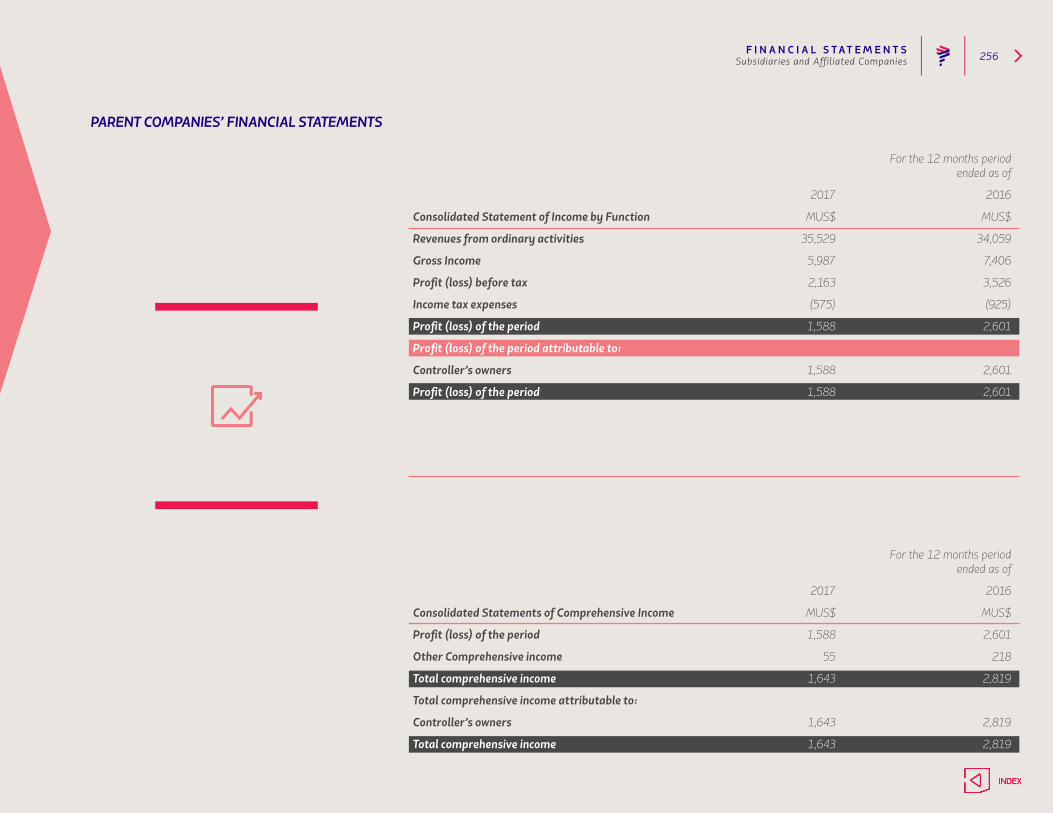
F I N A N C I A L S T AT E M E N T S 256Subsidiaries and Affiliated Companies
PARENT COMPANIES’ FINANCIAL STATEMENTS
For the 12 months period ended as of
2017 2016
Consolidated Statement of Income by Function MUS$ MUS$
Revenues from ordinary activities 35,529 34,059
Gross Income 5,987 7,406
Profit (loss) before tax 2,163 3,526
Income tax expenses (575) (925)
Profit (loss) of the period 1,588 2,601
Profit (loss) of the period attributable to:
Controller’s owners 1,588 2,601
Profit (loss) of the period 1,588 2,601
For the 12 months period ended as of
2017 2016
Consolidated Statements of Comprehensive Income MUS$ MUS$
Profit (loss) of the period 1,588 2,601
Other Comprehensive income 55 218
Total comprehensive income 1,643 2,819
Total comprehensive income attributable to:
Controller’s owners 1,643 2,819
Total comprehensive income 1,643 2,819
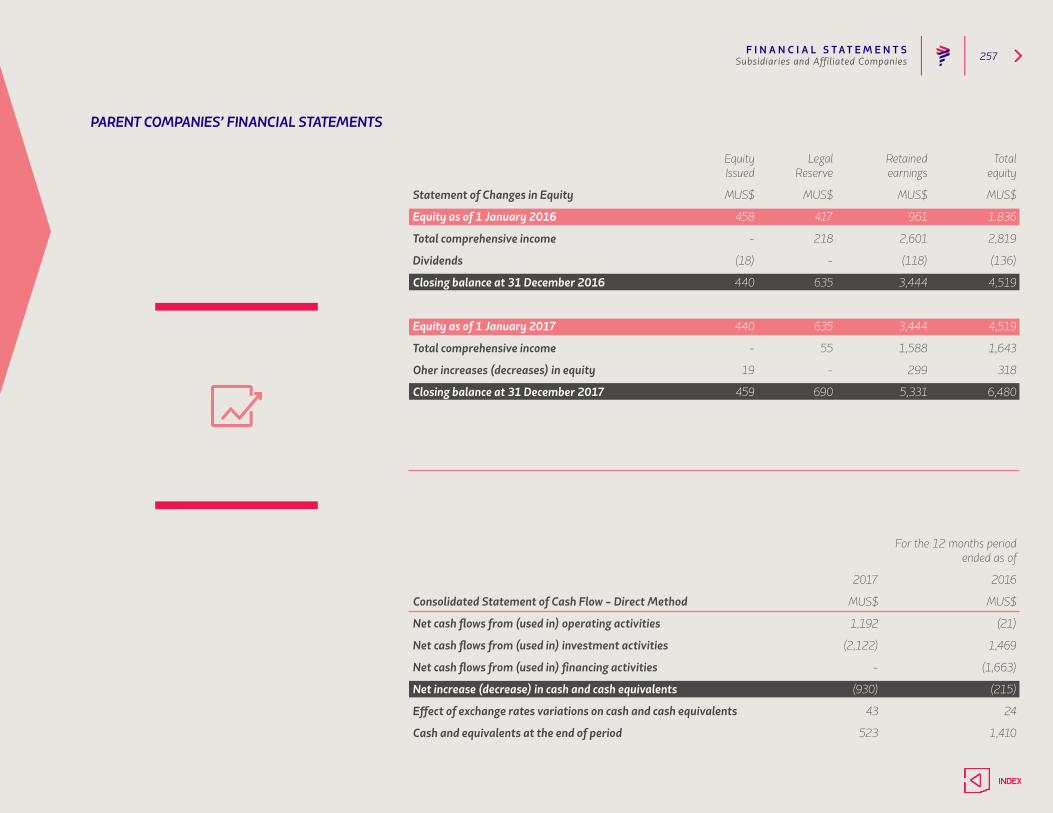
F I N A N C I A L S T AT E M E N T S 257Subsidiaries and Affiliated Companies
PARENT COMPANIES’ FINANCIAL STATEMENTS
Equity Legal Retained Total Issued Reserve earnings equity
Statement of Changes in Equity MUS$ MUS$ MUS$ MUS$
Equity as of 1 January 2016 458 417 961 1.836
Total comprehensive income - 218 2,601 2,819
Dividends (18) - (118) (136)
Closing balance at 31 December 2016 440 635 3,444 4,519
Equity as of 1 January 2017 440 635 3,444 4,519
Total comprehensive income - 55 1,588 1,643
Oher increases (decreases) in equity 19 - 299 318
Closing balance at 31 December 2017 459 690 5,331 6,480
For the 12 months period ended as of
2017 2016
Consolidated Statement of Cash Flow - Direct Method MUS$ MUS$
Net cash flows from (used in) operating activities 1,192 (21)
Net cash flows from (used in) investment activities (2,122) 1,469
Net cash flows from (used in) financing activities - (1,663)
Net increase (decrease) in cash and cash equivalents (930) (215)
Effect of exchange rates variations on cash and cash equivalents 43 24
Cash and equivalents at the end of period 523 1,410
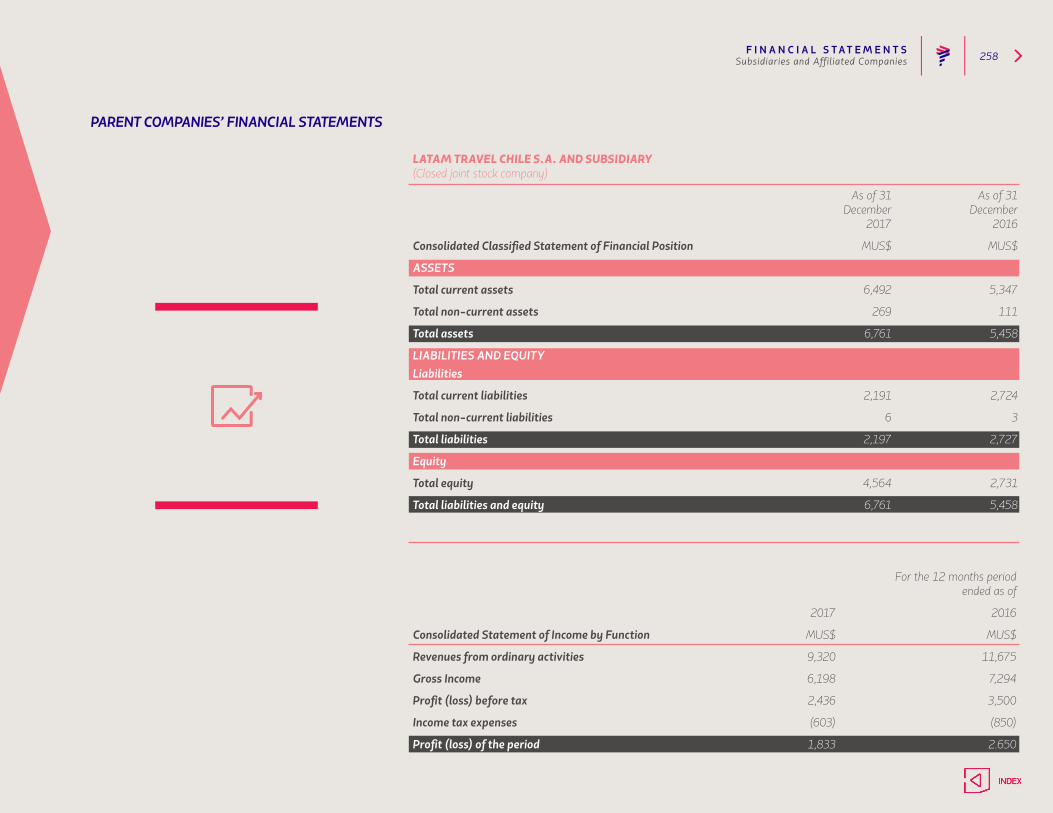
F I N A N C I A L S T AT E M E N T S 258Subsidiaries and Affiliated Companies
LATAM TRAVEL CHILE S.A. AND SUBSIDIARY(Closed joint stock company)
As of 31 As of 31 December December 2017 2016
Consolidated Classified Statement of Financial Position MUS$ MUS$
ASSETS
Total current assets 6,492 5,347
Total non-current assets 269 111
Total assets 6,761 5,458
LIABILITIES AND EQUITYLiabilities
Total current liabilities 2,191 2,724
Total non-current liabilities 6 3
Total liabilities 2,197 2,727
Equity
Total equity 4,564 2,731
Total liabilities and equity 6,761 5,458
PARENT COMPANIES’ FINANCIAL STATEMENTS
For the 12 months period ended as of
2017 2016
Consolidated Statement of Income by Function MUS$ MUS$
Revenues from ordinary activities 9,320 11,675
Gross Income 6,198 7,294
Profit (loss) before tax 2,436 3,500
Income tax expenses (603) (850)
Profit (loss) of the period 1,833 2.650
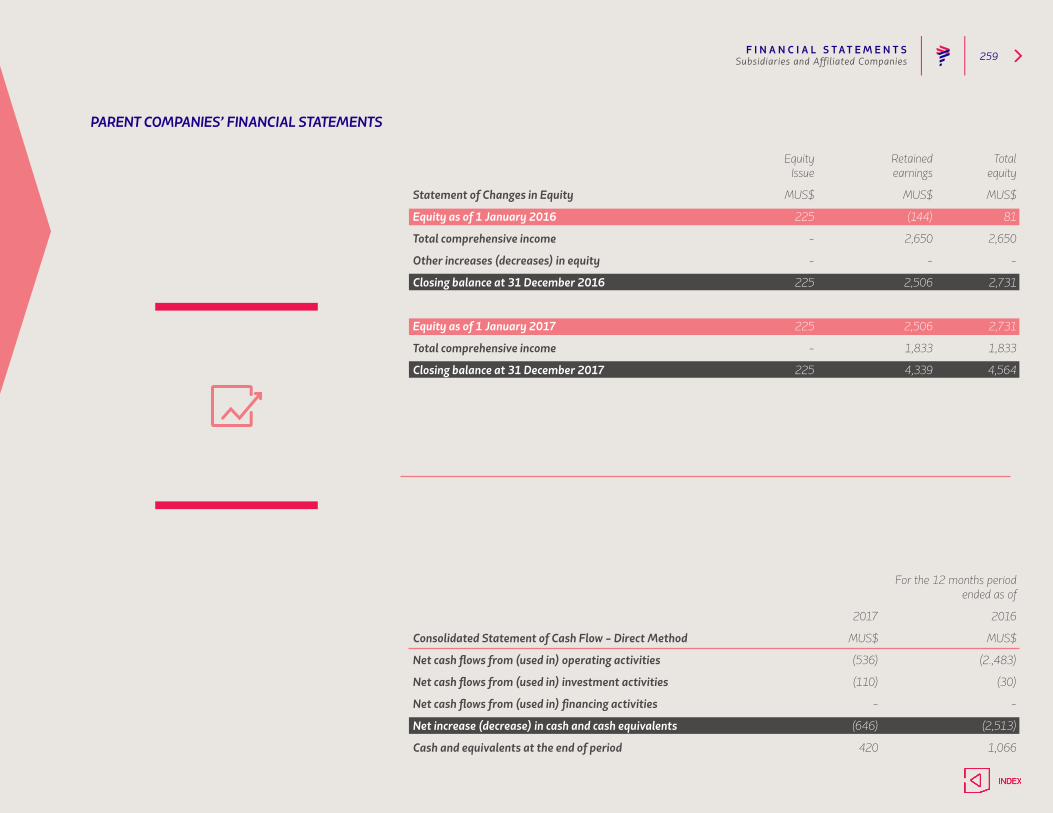
F I N A N C I A L S T AT E M E N T S 259Subsidiaries and Affiliated Companies
PARENT COMPANIES’ FINANCIAL STATEMENTS
Equity Retained Total Issue earnings equity
Statement of Changes in Equity MUS$ MUS$ MUS$
Equity as of 1 January 2016 225 (144) 81
Total comprehensive income - 2,650 2,650
Other increases (decreases) in equity - - -
Closing balance at 31 December 2016 225 2,506 2,731
Equity as of 1 January 2017 225 2,506 2,731
Total comprehensive income - 1,833 1,833
Closing balance at 31 December 2017 225 4,339 4,564
For the 12 months period ended as of
2017 2016
Consolidated Statement of Cash Flow - Direct Method MUS$ MUS$
Net cash flows from (used in) operating activities (536) (2.,483)
Net cash flows from (used in) investment activities (110) (30)
Net cash flows from (used in) financing activities - -
Net increase (decrease) in cash and cash equivalents (646) (2,513)
Cash and equivalents at the end of period 420 1,066
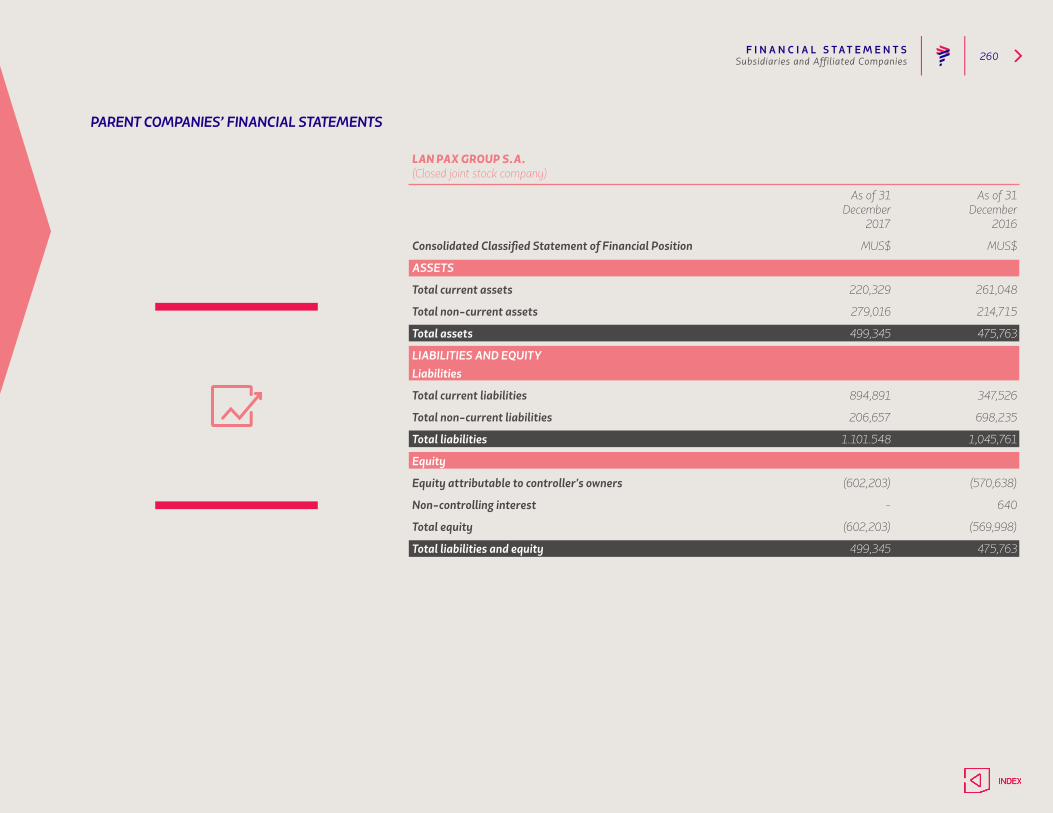
F I N A N C I A L S T AT E M E N T S 260Subsidiaries and Affiliated Companies
LAN PAX GROUP S.A. (Closed joint stock company)
As of 31 As of 31 December December 2017 2016
Consolidated Classified Statement of Financial Position MUS$ MUS$
ASSETS
Total current assets 220,329 261,048
Total non-current assets 279,016 214,715
Total assets 499,345 475,763
LIABILITIES AND EQUITYLiabilities
Total current liabilities 894,891 347,526
Total non-current liabilities 206,657 698,235
Total liabilities 1.101.548 1,045,761
Equity
Equity attributable to controller's owners (602,203) (570,638)
Non-controlling interest - 640
Total equity (602,203) (569,998)
Total liabilities and equity 499,345 475,763
PARENT COMPANIES’ FINANCIAL STATEMENTS
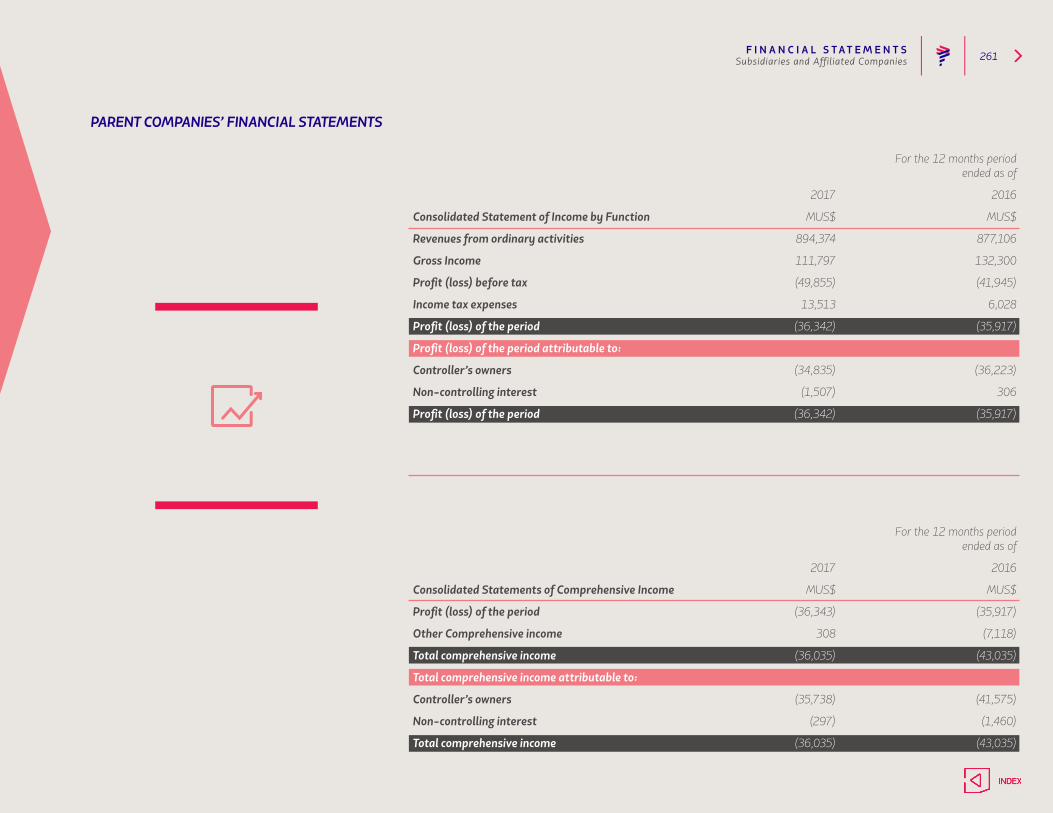
F I N A N C I A L S T AT E M E N T S 261Subsidiaries and Affiliated Companies
PARENT COMPANIES’ FINANCIAL STATEMENTS
For the 12 months period ended as of
2017 2016
Consolidated Statement of Income by Function MUS$ MUS$
Revenues from ordinary activities 894,374 877,106
Gross Income 111,797 132,300
Profit (loss) before tax (49,855) (41,945)
Income tax expenses 13,513 6,028
Profit (loss) of the period (36,342) (35,917)
Profit (loss) of the period attributable to:
Controller’s owners (34,835) (36,223)
Non-controlling interest (1,507) 306
Profit (loss) of the period (36,342) (35,917)
For the 12 months period ended as of
2017 2016
Consolidated Statements of Comprehensive Income MUS$ MUS$
Profit (loss) of the period (36,343) (35,917)
Other Comprehensive income 308 (7,118)
Total comprehensive income (36,035) (43,035)
Total comprehensive income attributable to:
Controller’s owners (35,738) (41,575)
Non-controlling interest (297) (1,460)
Total comprehensive income (36,035) (43,035)
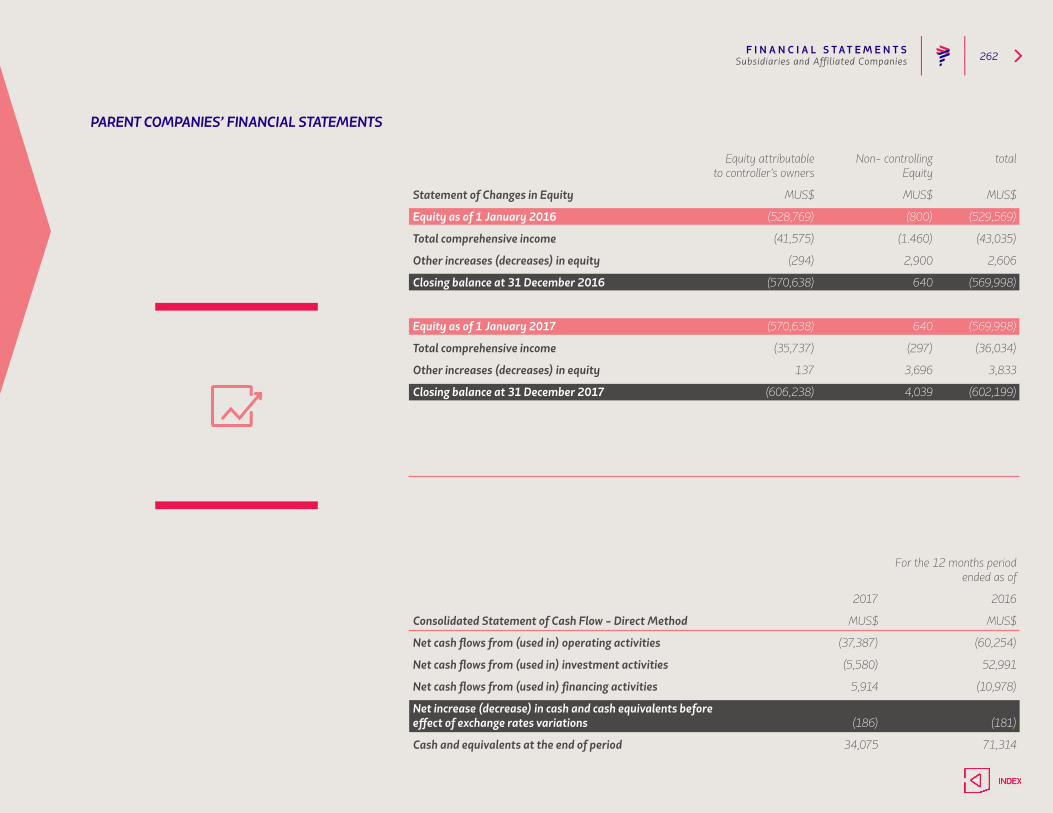
F I N A N C I A L S T AT E M E N T S 262Subsidiaries and Affiliated Companies
PARENT COMPANIES’ FINANCIAL STATEMENTS
Equity attributable Non- controlling total to controller’s owners Equity
Statement of Changes in Equity MUS$ MUS$ MUS$
Equity as of 1 January 2016 (528,769) (800) (529,569)
Total comprehensive income (41,575) (1.460) (43,035)
Other increases (decreases) in equity (294) 2,900 2,606
Closing balance at 31 December 2016 (570,638) 640 (569,998)
Equity as of 1 January 2017 (570,638) 640 (569,998)
Total comprehensive income (35,737) (297) (36,034)
Other increases (decreases) in equity 137 3,696 3,833
Closing balance at 31 December 2017 (606,238) 4,039 (602,199)
For the 12 months period ended as of
2017 2016
Consolidated Statement of Cash Flow - Direct Method MUS$ MUS$
Net cash flows from (used in) operating activities (37,387) (60,254)
Net cash flows from (used in) investment activities (5,580) 52,991
Net cash flows from (used in) financing activities 5,914 (10,978)
Net increase (decrease) in cash and cash equivalents before effect of exchange rates variations (186) (181)
Cash and equivalents at the end of period 34,075 71,314
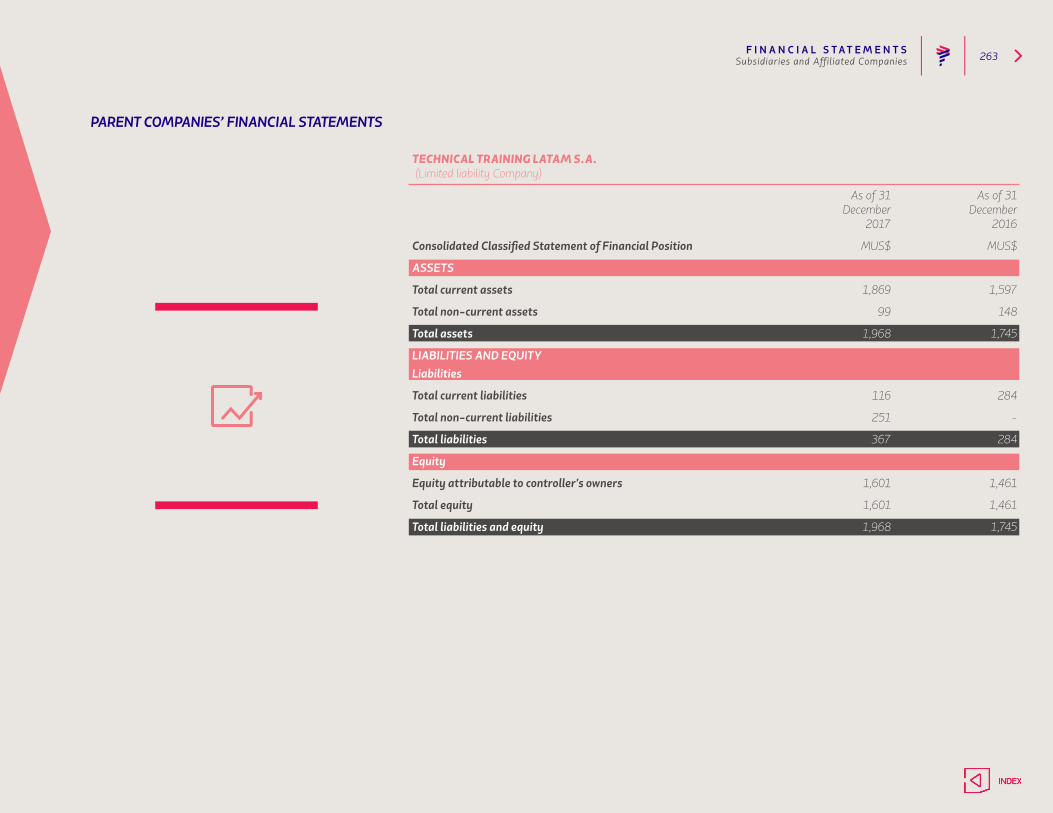
F I N A N C I A L S T AT E M E N T S 263Subsidiaries and Affiliated Companies
TECHNICAL TRAINING LATAM S.A. (Limited liability Company)
As of 31 As of 31 December December 2017 2016
Consolidated Classified Statement of Financial Position MUS$ MUS$
ASSETS
Total current assets 1,869 1,597
Total non-current assets 99 148
Total assets 1,968 1,745
LIABILITIES AND EQUITYLiabilities
Total current liabilities 116 284
Total non-current liabilities 251 -
Total liabilities 367 284
Equity
Equity attributable to controller's owners 1,601 1,461
Total equity 1,601 1,461
Total liabilities and equity 1,968 1,745
PARENT COMPANIES’ FINANCIAL STATEMENTS
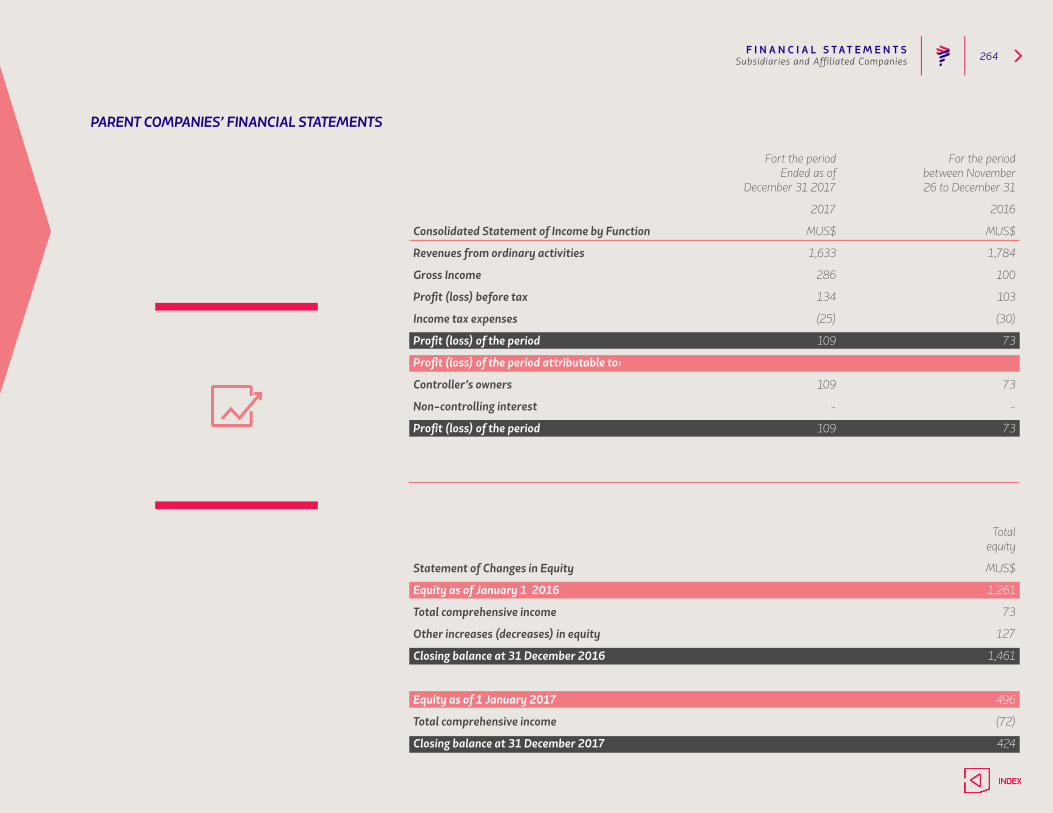
F I N A N C I A L S T AT E M E N T S 264Subsidiaries and Affiliated Companies
PARENT COMPANIES’ FINANCIAL STATEMENTS
Fort the period For the period Ended as of between November December 31 2017 26 to December 31
2017 2016
Consolidated Statement of Income by Function MUS$ MUS$
Revenues from ordinary activities 1,633 1,784
Gross Income 286 100
Profit (loss) before tax 134 103
Income tax expenses (25) (30)
Profit (loss) of the period 109 73
Profit (loss) of the period attributable to:
Controller’s owners 109 73
Non-controlling interest - -
Profit (loss) of the period 109 73
Total equity
Statement of Changes in Equity MUS$
Equity as of January 1 2016 1,261
Total comprehensive income 73
Other increases (decreases) in equity 127
Closing balance at 31 December 2016 1,461
Equity as of 1 January 2017 496
Total comprehensive income (72)
Closing balance at 31 December 2017 424
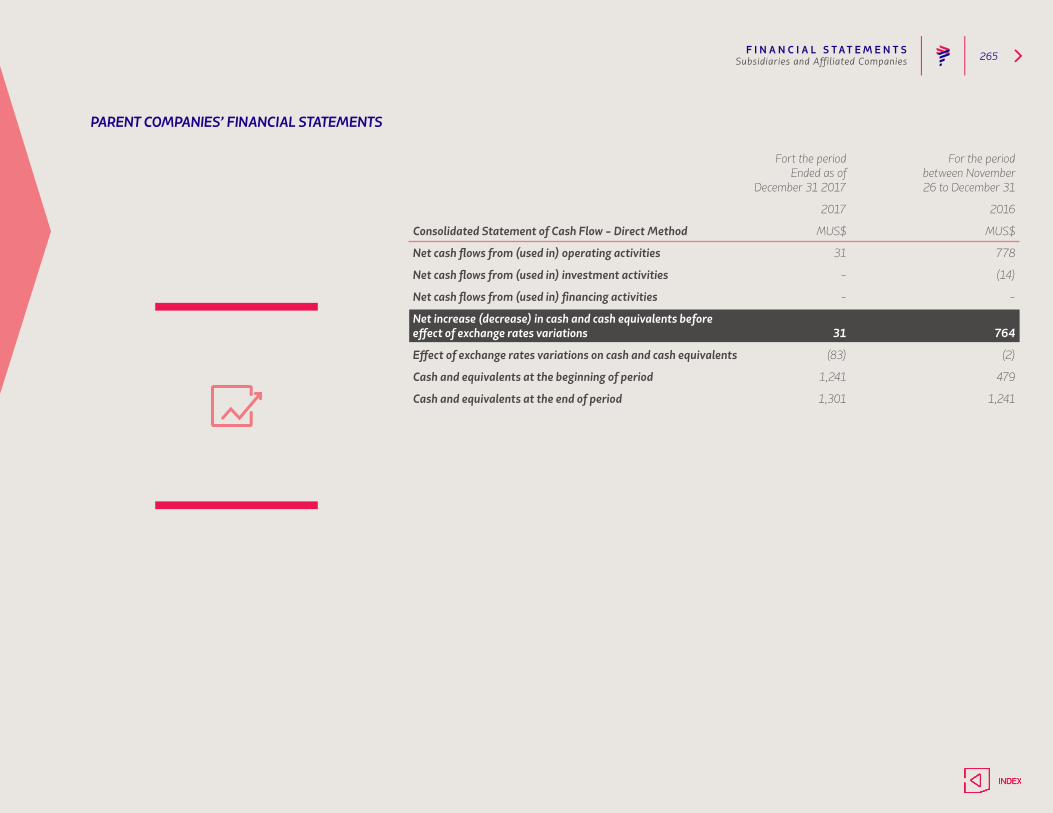
F I N A N C I A L S T AT E M E N T S 265Subsidiaries and Affiliated Companies
PARENT COMPANIES’ FINANCIAL STATEMENTS
Fort the period For the period Ended as of between November December 31 2017 26 to December 31
2017 2016
Consolidated Statement of Cash Flow - Direct Method MUS$ MUS$
Net cash flows from (used in) operating activities 31 778
Net cash flows from (used in) investment activities - (14)
Net cash flows from (used in) financing activities - -
Net increase (decrease) in cash and cash equivalents beforeeffect of exchange rates variations 31 764
Effect of exchange rates variations on cash and cash equivalents (83) (2)
Cash and equivalents at the beginning of period 1,241 479
Cash and equivalents at the end of period 1,301 1,241
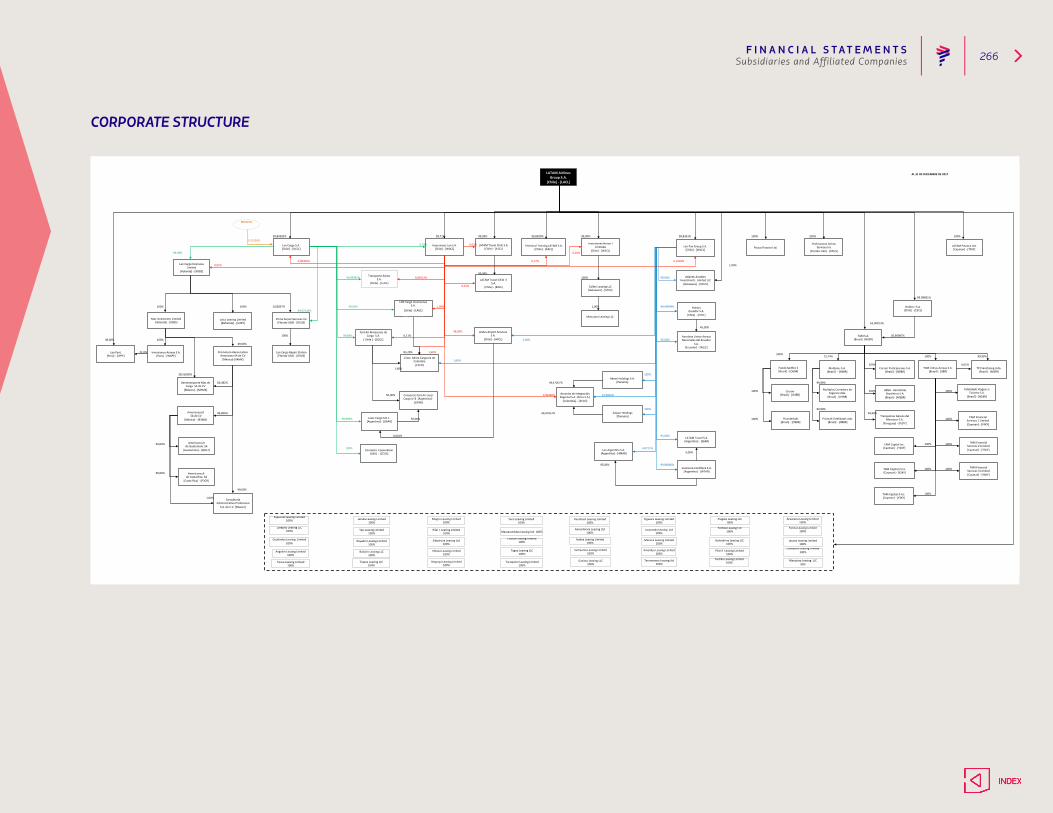
F I N A N C I A L S T AT E M E N T S 266Subsidiaries and Affiliated Companies
CORPORATE STRUCTURE
AL31DEDICIEMBREDE2017
99,89395% 99,71% 99,99% 99,8300% 99,90% 100% 100% 100%0,10196%
0,29% 0,01%
99,98% 0,10%
0,00409% 0,17%0,02% 1,00%
99,99%0,00013% 100% 99,00%
0,01%
100% 100% 0,02857% 1,00% 1,00% 99,99999%
63,09013%45,00%
98,00%100% 99,89% 0,11% 36,90987%
49,00% 100% 2,00% 55,00%49,00%
21,0% 85,20% 1,60%72,74% 100% 99,99%
1,60%100% 0,01%
1,60%
39,51600% 100%
99,99%
100% 100% 100%50,00% 0,09498%
100% 99,99%49,47057% 94,98%
99,999% 50,00% 100% 100%
0,001% 95,00%
99,00% 100% 100%100% 4,9711%
5,00%
95,00% 99,86060%100% 100%
99,00%
99,00%100%
1,00%
0,1639%
99,97143%
99,8361%
0,15802%
60,482%
99,800%
99,99987%
99,00%
100%
49,47057%
LATAMAirlinesGroupS.A.
[Chile]-[LACL]
LATAMTravelChileS.A.[Chile]-[A1CL]
LanPaxGroupS.A.[Chile]-[W1CL]
LanPerú[Perú]-[LPPE]
LanCargoS.A.[Chile]-[UCCL]
InversionesLanS.A.[Chile]-[W0CL]
TechnicalTrainingLATAMS.A.[Chile]-[A3CL]
LanCargoOverseasLimited
[Holanda]-[XOBS]
MasInvestmentLimited[Holanda]-[X3BS]
InversionesAéreasS.A.[Perú]-[W6PE]
Minority
InversionesHeronILimitada
[Chile]-[W2CL]
ColibriLeasingLLC[Delaware]-[S7US]
ManutaraLeasingLLC
ProfessionalAirlineServicesInc
[Florida-USA]-[PAUS]
LATAMTravelChileIIS.A.
[Chile]-[B2CL]
HoldcoIS.A.[Chile]-[E3CL}
TAMS.A.[Brasil]-[N2BR]
PrimeAirpotServicesInc[Florida-USA]-[D5US]
LoicaLeasingLimited[Bahamas]-[U2KY]
InversoraCordilleraS.A.[Argen`na]-[W7AR]
LanArgen`naS.A.[Argen`na]-[4MAR]
TAMLinhasAereasS.A.[Brasil]-[JJBR]
FidelidadeViagenseTurismoS.A.
[Brasil]-[N1BR]
Mul`plusS.A.[Brasil]-[N4BR]
TPFranchisingLtda.[Brasil]-[N3BR]
ABSA-AerolinhasBrasileirasS.A.[Brasil]-[M3BR]
TAMCapitalInc.[Cayman]-[Y1KY]
TAMCapital2Inc.[Cayman]-[Y2KY]
TAMCapital3Inc.[Cayman]-[Y3KY]
TAMFinancialServices1Limited[Cayman]-[Y4KY]
TAMFinancialServices2Limited[Cayman]-[Y5KY]
TAMFinancialServices3Limited[Cayman]-[Y6KY]
FundoSpidireII[Brasil]-[O6BR]
Mul`plusCorredoradeSegurosLtda.[Brasil]-[N7BR]
LATAMTravelS.A.[Argen`na]-[Z6AR]
HoldcoEcuadorS.A.[Chile]-[E2CL]
AerolaneLíneasAereasNacionalesdelEcuador
S.A.[Ecuador]-[XLEC]
AndesAirportServicesS.A.
[Chile]-[A4CL]
PromotoraAéreaLa`noAmericanaSAdeCV[México]-[X4MX]
AmericonsultSAdeCV
[México]-[R3MX]
AerotransporteMasdeCargaSAdeCV
[México]-[MYMX]
AmericonsultdeGuatemalaSA
[Guatemala]-[Q3GT]
AmericonsultdeCostaRicaSA
[CostaRica]-[P3CR]
TransporteAéreoS.A.
[Chile]-[LUCL]
99.99831%
ConsultoríaAdministra`vaProfesional
S.A.deC.V.[Mexico]
LATAMFinanceLtd.[Cayman]-[TFKY]
LaserCargoS.R.L.[Argen`na]-[D6AR]
FastAirAlmacenesdeCargaS.A.
[Chile]-[D2CL]
LíneaAéreaCargueradeColombia[C1CO]
LANCargoInversionesS.A.
[Chile]-[LA01]ServicesInc
ConnectaCorpora`on[USA]-[CCUS]
ConsorcioFastAirLaserCargoUTE[Argen`na]-
[D7AR]
TransportesAéreosdelMercosurS.A.
[Paraguay]-[PZPY]
CorsairPar`cipacoesS.A.[Brasil]-[N6BR]
Atlan`cAvia`onInvestmentsLimitedLLC
[Delaware]-[X5US]
LanCargoRepairSta`on[Florida-USA]-[D9US]
JatobaLeasingLimited100%
YpeLeasingLimited100%
RayadorLeasingLimited100%
SapucaiaLeasingLimited100%
ZarapitoLeasingLLC100%
GuabirobaLeasingLimited100%
AngelimLeasingLimited100%
BailarínLeasingLLC100%
TencaLeasingLimited100%
MognoLeasingLimited100%
PilarILeasingLimited100%
SibipirunaLeasingLtd100%
ImbuiaLeasingLimited100%
SequoyaLeasingLimited100%
YecoLeasingLimited100%
MassarandubaLeasingLtd100%
ChucaoLeasingLimited100%
TaguaLeasingLLC
100%
PauBrasilLeasingLimited100%
AmendoeiraLeasingLtd100%
AzaleaLeasingLimited100%
SumaumaLeasingLimited100%
GaviotaLeasingLLC100%
TucuquereLeasingLimited100%
FigueiraLeasingLimited100%
JacarandaLeasingLtd100%
ManacaLeasingLimited100%
AmarillysLeasingLimited100%
TarumaranaLeasingLtd100%
FragataLeasingLLC100%
TortolaLeasingLLC100%
GolondrinaLeasingLLC100%
PilarIILeasingLimited100%
AraucariaLeasingLimited100%
ParinaLeasingLimited100%
JacanaLeasingLimited100%
CanasteroLeasingLimited100%
CuclilloLeasingLimited
100%
Cruiser[Brasil]-[O4BR]
Thunderbolt[Brasil]-[O9BR]
TiuqueLeasingLLC100%
PrismahFidelidadeLtda.[Brasil]-[N8BR]
PeucoFinanceLtd.
AerovíasdeIntegraciónRegionalS.A.(AiresS.A.)[Colombia]-[4CCO]
AkemiHoldingsS.A.[Panama]
SaipanHoldings[Panama]
ManutaraLeasingLLC99%
F I N A N C I A L S T AT E M E N T S 267Analysis of the Financial Statements
of the Financial Statements
Comparative analysis and explanation of main trends:
1. CONSOLIDATED FINANCIAL STATEMENTAt December 31, 2017, the Company’s assets totaled US$18.797 billion which, compared to the value at December 31, 2016, represents a US$400.222 million decrease, equivalent to 2.1%.
The Company’s current assets increased by US$118.724 million (3.3%), compared to yearend 2016. The main increases were seen in the following segments: Cash and cash equivalents for US$192.677 million (20.3%); Trade debtors and other accounts receivable for US$106.161 million (9.6%); and current tax assets for US$12.610 million (19.3%). These items were compensated by the decreases in: Other current financial assets worth US$152.909 million (21.5%), and Non-current assets or disposable groups of assets classified as held for sale worth US$46.092 million (13.7%).
The Company’s liquidity index rose from 0.58 times at yearend 2016 to 0.64 times at December 2017. Current assets increased 3.3% while Current liabilities decreaby 6.1%. Moreover, the acid-test ratio increased from 0.15 times at yearend 2016 to 0.20 times at the end of the current period.
The Company’s non-current assets decreased by US$518.946 million (3.3%) compared to yearend 2016. The main decreases were seen in the following line items: Property, plants, and equipment, worth US$432.814 million (4.1%), which corresponds mainly to depreciation expenses in the period totaling US$765.204 million, and additions worth US$325.513 million, among others; Goodwill worth US$37.832 million (1.4%), and Deferred tax assets worth US$20.559 million (5.3%).
At December 31, 2017, the Company’s liabilities totaled US$14.53 billion which, compared to the value as at December 31, 2016, represents a US$482.154 million decrease, equivalent to 3.2%.
F I N A N C I A L S T AT E M E N T S 268Analysis of the Financial Statements
The Company’s current assets decreased by US$379.477 million (3.3%) compared to yearend 2016. The main decreases were seen in the following line items: Other financial liabilities worth US$538.579 million (29.3%), explained mainly by the payment of US$137 million, corresponding to the last installment on the financing obtained by Tam Linhas Aéreas S.A. in September of the previous year; the payment of US$300 million corresponding to long-term bonds issued by Tam Capital Inc., among other movements in the period; and current tax liabilities worth US$10.775 million (75.4%). All this was partially compensated by the increase in Trade and other accounts payable in the amount of US$102.134 million (6.4%) and Other non-financial liabilities worth US$61.718 million (2.2%).
The Company’s current liabilities’ indebtedness indicator decreased 7.88%, from 1.52 times at yearend 2016 to 1.4 times at December 31, 2017. The impact of current liabilities on total debt decreased by 1.24 percentage points, from 41.45% at yearend 2016 to 40.21% at the end of the current period.
The Company’s non-current liabilities decreased by US$102.677 million (1.2%), compared to the value as at December 31, 2016. The main decreases were seen in the following line items: Other financial liabilities worth US$191.444 million (2,8%), the net variation explained by the bond issuance via Latam Finance worth US$700 million; issuance of UF local bond worth US$358 million; payment of TAM Capital 3 Inc. bond for US$500 million; and payment of TAM Capital Inc. Bond for US$300 million, among other movements in the period, and Other non-financial liabilities worth US$55.476 million (25.9%). This was compensated by the US$139.441 million increase in Accounts payable (38,8%) and the US$33.938 million rise in deferred tax liabilities (3,7%).
The Company’s non-current liabilities’ indebtedness indicator shows a 3.3% decrease from 2.15 times at December 31, 2016 to 2.08 times at December 31, 2017. The impact of non-current liabilities on total debt rose by 1.24 percentage points from 58.55% at yearend 2016 to 59.79% at December 2017.
The indicator of the Company’s total indebtedness over Equity decreased by 4.9% from 3.66 times at yearend 2016 to 3.48 times at the end of the current period.
At December 31, 2017, roughly 63% of the debt has a fixed rate or is linked to one of the abovementioned instruments. The average rate on the debt is 4.14%.
The Equity attributable to the controlling shareholders increased by US$79.429 million, from US$4.096 billion at December 31, 2016 to US$4.176 billion at December 31, 2017. The increase is reflected in the higher accrued result, due to the US$155.304 million profit generated in the period from January to December 2017 attributable to the controlling shareholders. This is slightly countered by the decrease in Other reserves worth US$25.986 million, mainly resulting from the negative effect of the variation in Currency translation reserve for US$45.036 million, largely explained by the translation adjustment caused by the Goodwill recognized in the combined businesses with TAM and Affiliates.
In an Ordinary Board Meeting held on April 4, 2017, a US$3.299 million capitalization for cost of issuance of shares was approved.
2. CONSOLIDATED INCOME STATEMENTAt December 31, 2017, the controlling company reported a US$155.304 million gain, translating into an US$86.081 million increase in income vs. the previous year’s US$69.22 million. Net margin increased from 0.7% to 1.5% in 2017.
Operating income at December 31, 2017 totaled US$714.534 million, translating into a US$146.631 million increase from 2016, equivalent to 25.8%, whereas operating margin reached 7.0%, representing a 1.0 percentage-point increase.
Operating income at December 31, 2017 grew 6.7% vs. 2016, totaling US$10.163 billion. This was due to a 7.8% increase in PAX revenues, a 0.8% rise in Cargo revenues, and a 2.1% advance in Other income. The effect of the Brazilian Real’s appreciation translated into higher ordinary revenues by around US$236 million.
F I N A N C I A L S T AT E M E N T S 269Analysis of the Financial Statements
PAX REVENUES TOTALED US$8.494 BILLION WHICH, COMPARED TO THE US$7.877 BILLION
FROM 2016, TRANSLATES INTO A 7.8% INCREASE.
This change is mainly due to a 6.7% increase in RASK, given a 5.9% rise in yields, which were boosted by a better macroeconomic scenario in South America, and by the appreciation of local currencies (especially the Brazilian Real and the Chilean Peso). This was partly compensated by the 1.1% increase in capacity as measured in ASK. Moreover, the load factor reached 84.8%, translating into a 0.6 percentage-point increase from the previous year.
At December 31, 2017, Cargo revenues reached US$1.119 billion, translating into a 0.8% increase vs. 2016. This hike was due to a 2.1% increase in yields and a 1.3% decrease in traffic in terms of RTK. The rise in yields reflects an optimistic cargo environment worldwide, and the positive effect of the Brazilian Real on Brazil’s local market. On the other hand, capacity in ATK terms decreased 7.1%.
Moreover, the Other Income line item showed an US$11.14 million increase, mainly due to the effect of the Brazilian Real’s appreciation on revenues from the loyalty program in Brazil, as well as to higher income from leasing of aircraft to third parties. This was partially countered by lower income from aircraft sales and ground services compared to 2016. At December 31, 2017, Operating costs totaled US$9.449 billion which, compared to the previous year, translate into US$490.077 million higher costs, equivalent to a 5.5% increase, whereas unit cost per ASK-equivalent rose 7.0%. Furthermore, the effect of the Brazilian Real’s appreciation on this line item translates into higher costs by roughly US$195 million. Item variations are explained as follows:
a) Compensation and benefits increased by US$72.501 million, mainly due to the appreciation of the Brazilian Real and the Chilean Peso, by 4.8% and 6.5%, respectively. This was partially countered by a 9.7% decrease in the average staff for the period, in line with the Company’s cost control initiatives.
b) Fuel increased 12.7%, equivalent to an additional US$262.173 million in costs. The increase is mainly due to a 21.1% hike in unhedged prices, partially countered by a 2.5% decrease in consumption measured in gallon terms. During 2017, the Company recognized a gain of US$15.167 million from fuel hedges (compared to a US$48.094 million loss in the previous year), and a US$9.87 million loss on currency hedges.
c) Commissions decreased by US$16.822 million, translating into a 6.2% variation from the previous year.
d) Depreciation and Amortization increased by US$41.297 million in 2017. This change is mainly explained by the incorporation of 2 Airbus A320 airplanes, and 2 Boeing 787, and by the appreciation of the Brazilian Real. This was partially countered by the exit of 17 Airbus A320, 2 Airbus A330, 2 Boeing 767, and 2 Boeing 777.
e) Other Leasing and Landing Fees increased by US$94.722 million, mostly due to higher costs resulting from the increase in aeronautical charges in Brazil and Argentina, as well as to a hike in handling costs related to increased operations.
f) Passenger Service increased by US$2.041 million, translating into a 0.7% change, mainly due to an increase in passenger compensation and indemnification.
g) Aircraft Leasing rose US$10.572 million mainly due to the incorporation of 1 Airbus A320 and 2 Boeing 787. This was partially compensated by the return of 17 Airbus A320, 2 Boeing 767, and 2 Boeing 777.
h) Maintenance reported higher costs by US$64.672 million, equivalent to a 17.7% change, explained mainly by higher costs related to the return of the aircrafts during 2017.
i) Other Operating Costs decreased by US$41.079 million, largely due to costs from ground services related to the Rio 2016 Olympic Games and costs related to the valuation at fair value of the inventory as part of a sales plan driven by inventory reduction initiatives, recognized during the second half of the previous year. This was partially countered by the effect of the Brazilian Real’s appreciation, and the increase in costs related to point redemption through third parties, as part of the loyalty program in Brazil.
Financial revenues totaled US$78.695 million which, compared to the US$74.949 million from the same period of 2016, translates into higher revenues by US$3.746 million, mainly due to the increase in cash at hand.Financial costs decreased by 5.5%, totaling US$393.286 million at December 31, 2017, mainly due to lower costs related to lower debt levels.Other income/costs reported a negative US$25.725 million, mainly explained by losses recognized as a result of the depreciation of the Brazilian Real during 2017.
The main line items in the Consolidated Financial Statement of TAM S.A. and Affiliates, which caused a US$15.162 million currency exchange loss at December 31, 2017, were: Other financial liabilities; US$31.243 million profit from USD-denominated financial loans and leasings for fleet acquisitions; and currency exchange variations in accounts receivable from related companies, totaling a loss of US$14.621 million. The other net assets and liabilities line items generated a US$31.784 million loss.
F I N A N C I A L S T AT E M E N T S 270Analysis of the Financial Statements
Multiplus S.A. ResultsMultiplus’ net result at December 31, 2017 showed a US$158.784 million profit which, compared to the US$152.873 million from 2016, translates into a 3.87% increase.
REVENUES INCREASED 20.75%, MAINLY EXPLAINED BY THE EFFECT OF THE BRAZILIAN
REAL’S 4.8% APPRECIATION, AND BY A 9.7% INCREASE IN POINT REDEMPTION COMPARED TO
THE SAME PERIOD OF THE PREVIOUS YEAR.
Moreover, expired points increased by 5.8%. Operating costs increased by 25.44%, mainly due to the appreciation of the Brazilian Real and a 27.1% hike in point redemption through partner businesses.
Financial revenues/costs showed a negative change of 14.5%, mainly due to the depreciation of the Brazilian real during 2017, but partially countered by the placement of part of the company’s cash at hand in USD-linked currency hedges.
3. ANALYSIS AND EXPLANATION OF CONSOLIDATED NET CASH FLOW GENERATED BY OPERATING, INVESTMENT, AND FINANCING ACTIVITIESOperating cash flow at December 31, 2017 showed a positive change of US$685.856 million compared to the previous year, mainly due to the rises in the following concepts: Collections from asset sales and service rendering worth US$677.129 million and Other cash revenue (expenses) worth US$200.338 million. This was partially countered by the negative variations in the following line items: Payments to and on behalf of employees worth US$135.031 million, and net effect on Other receipts and payments from operating activities worth US$57.558 million.
Investment flows showed a positive change of US$144.367 million vs. the previous year. This variation is mainly due to the increase in the following line item: Purchases of property, plant, and equipment worth US$290.704 million, mainly due to fewer down payments for aircraft acquisitions and other fixed asset acquisitions.
In 2017, one Airbus A319 was acquired, compared to 2016, when we acquired: one Boeing 787, one Airbus A320, 4 Airbus A321, and 4 Airbus A350. The positive change described above was partially countered by the decrease in: Other receivables and payables on the sale of equity or debt instruments from other companies totaling US$120.716 million, where the investments made by TAM S.A. and Affiliates in private equity funds were recognized.
Financing flows showed a negative variation of US$782.809 million vs. the previous year, mainly explained by decreases in: Amounts from short- and long-term loans, totaling US$661.945 million; Sums from the issuance of stocks totaling US$608.496 million, from the capital increase in 2016, and from loan payments worth US$291.939 million.
The flows from loans described above include the following events:
a) On April 10, 2017, a private issuance and placement of debt securities worth US$140 million was made under the current Enhanced Equipment Trust Certificates (“EETC”) structure, issued and placed in 2015.
b) On April 11, 2017, an unsecured long-term bond worth US$700 million maturing in 2024 was issued and placed on the international market, pursuant to Rule 144-A and Regulation S of the US Securities Act.
c) On April 25, 2017, the TAM Capital I Inc. Bond was paid. The sums paid totaled US$300 million in capital and US$11 million in interest.
d) On August 17, 2017, LATAM issued Bonds on the local market (Santiago Stock Exchange), corresponding to the first bond issuance charged to the line inscribed in the Securities Register of the Superintendency of Securities and Insurance (“SVS”) under number 862.
The total sum placed is equivalent to UF8,700,000 (US$358 million).
e) On September 1, 2017, TAM Capital 3 Inc. made an early redemption of the total bonds issued abroad on June 3, 2011 for US$500 million, maturing on June 3, 2021.
f) On September 27, 2017, TAM Linhas Aereas S.A. paid the capital and corresponding interest on the last installment of the financing obtained in September a year earlier (US$200 million, guaranteed by roughly 18% of the stocks of Multiplus S.A.) The sum paid was US$137 million.
Last, the Company’s net cash flow at December 31, 2017 showed a positive change of US$192.677 million vs. the previous year.
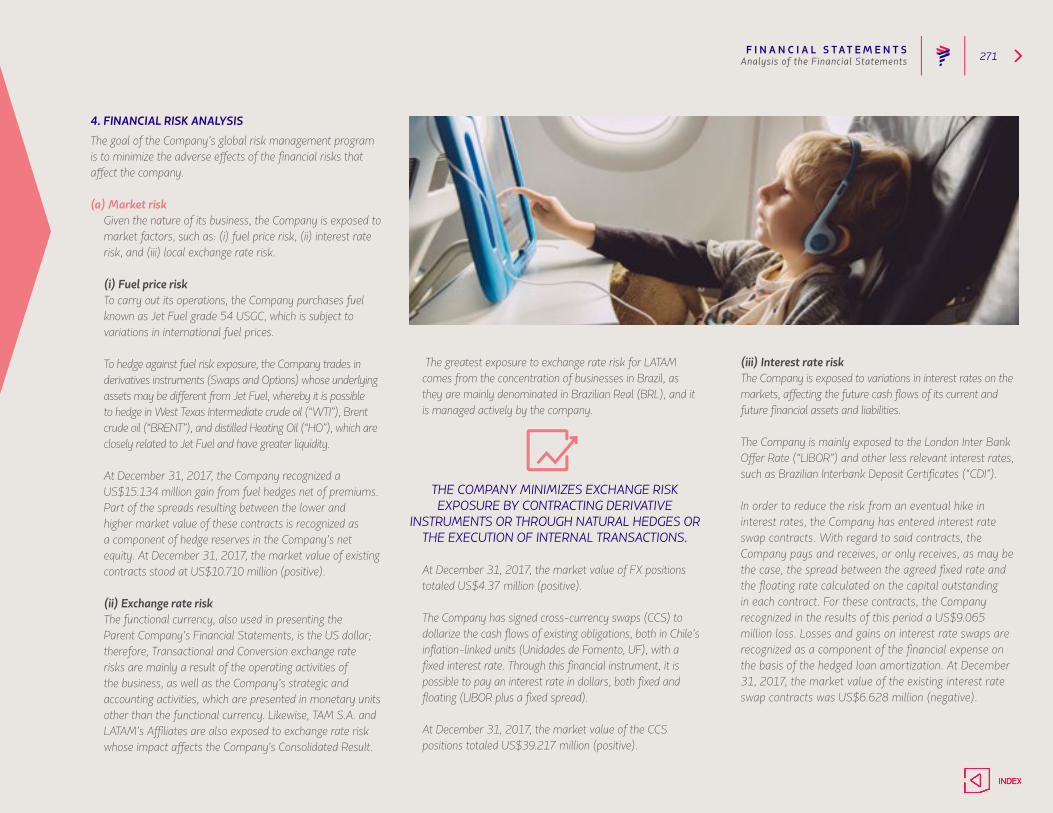
F I N A N C I A L S T AT E M E N T S 271Analysis of the Financial Statements
4. FINANCIAL RISK ANALYSISThe goal of the Company’s global risk management program is to minimize the adverse effects of the financial risks that affect the company.
(a) Market riskGiven the nature of its business, the Company is exposed to market factors, such as: (i) fuel price risk, (ii) interest rate risk, and (iii) local exchange rate risk.
(i) Fuel price riskTo carry out its operations, the Company purchases fuel known as Jet Fuel grade 54 USGC, which is subject to variations in international fuel prices.
To hedge against fuel risk exposure, the Company trades in derivatives instruments (Swaps and Options) whose underlying assets may be different from Jet Fuel, whereby it is possible to hedge in West Texas Intermediate crude oil (“WTI”), Brent crude oil (“BRENT”), and distilled Heating Oil (“HO”), which are closely related to Jet Fuel and have greater liquidity.
At December 31, 2017, the Company recognized a US$15.134 million gain from fuel hedges net of premiums. Part of the spreads resulting between the lower and higher market value of these contracts is recognized as a component of hedge reserves in the Company’s net equity. At December 31, 2017, the market value of existing contracts stood at US$10.710 million (positive).
(ii) Exchange rate riskThe functional currency, also used in presenting the Parent Company’s Financial Statements, is the US dollar; therefore, Transactional and Conversion exchange rate risks are mainly a result of the operating activities of the business, as well as the Company’s strategic and accounting activities, which are presented in monetary units other than the functional currency. Likewise, TAM S.A. and LATAM’s Affiliates are also exposed to exchange rate risk whose impact affects the Company's Consolidated Result.
The greatest exposure to exchange rate risk for LATAM comes from the concentration of businesses in Brazil, as they are mainly denominated in Brazilian Real (BRL), and it is managed actively by the company.
THE COMPANY MINIMIZES EXCHANGE RISK EXPOSURE BY CONTRACTING DERIVATIVE
INSTRUMENTS OR THROUGH NATURAL HEDGES OR THE EXECUTION OF INTERNAL TRANSACTIONS.
At December 31, 2017, the market value of FX positions totaled US$4.37 million (positive).
The Company has signed cross-currency swaps (CCS) to dollarize the cash flows of existing obligations, both in Chile’s inflation-linked units (Unidades de Fomento, UF), with a fixed interest rate. Through this financial instrument, it is possible to pay an interest rate in dollars, both fixed and floating (LIBOR plus a fixed spread).
At December 31, 2017, the market value of the CCS positions totaled US$39.217 million (positive).
(iii) Interest rate riskThe Company is exposed to variations in interest rates on the markets, affecting the future cash flows of its current and future financial assets and liabilities.
The Company is mainly exposed to the London Inter Bank Offer Rate (“LIBOR”) and other less relevant interest rates, such as Brazilian Interbank Deposit Certificates (“CDI”).
In order to reduce the risk from an eventual hike in interest rates, the Company has entered interest rate swap contracts. With regard to said contracts, the Company pays and receives, or only receives, as may be the case, the spread between the agreed fixed rate and the floating rate calculated on the capital outstanding in each contract. For these contracts, the Company recognized in the results of this period a US$9.065 million loss. Losses and gains on interest rate swaps are recognized as a component of the financial expense on the basis of the hedged loan amortization. At December 31, 2017, the market value of the existing interest rate swap contracts was US$6.628 million (negative).
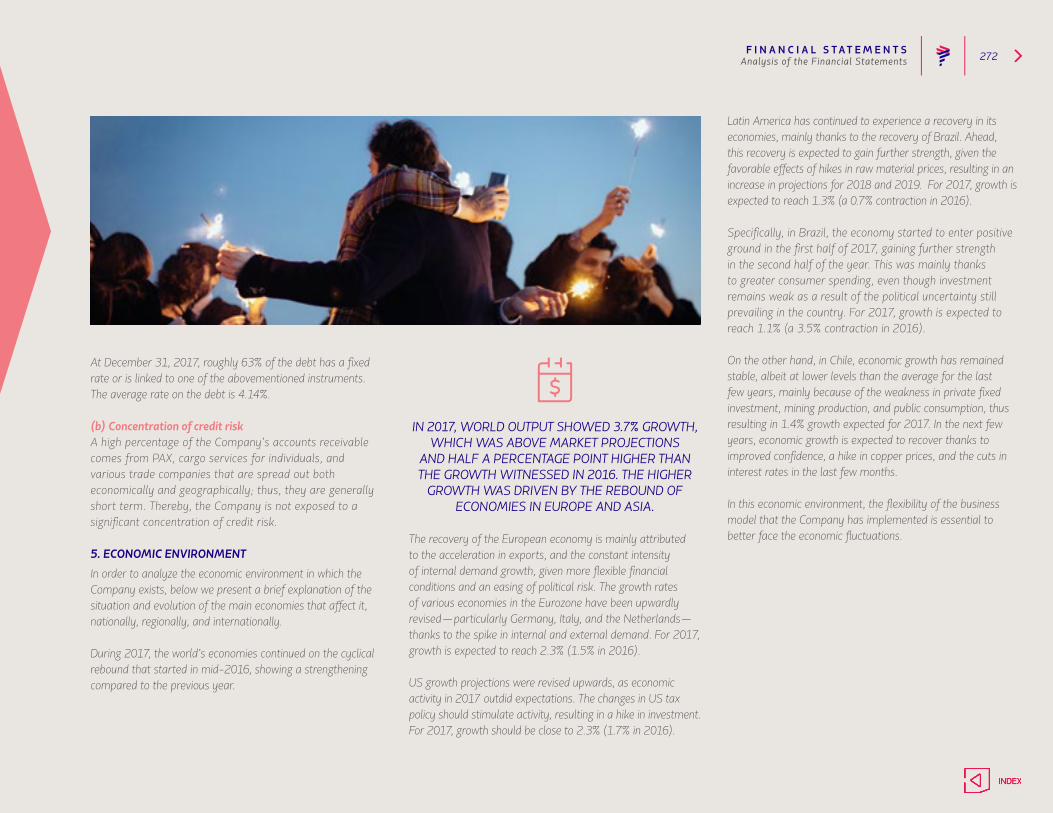
F I N A N C I A L S T AT E M E N T S 272Analysis of the Financial Statements
At December 31, 2017, roughly 63% of the debt has a fixed rate or is linked to one of the abovementioned instruments. The average rate on the debt is 4.14%.
(b) Concentration of credit riskA high percentage of the Company’s accounts receivable comes from PAX, cargo services for individuals, and various trade companies that are spread out both economically and geographically; thus, they are generally short term. Thereby, the Company is not exposed to a significant concentration of credit risk.
5. ECONOMIC ENVIRONMENT In order to analyze the economic environment in which the Company exists, below we present a brief explanation of the situation and evolution of the main economies that affect it, nationally, regionally, and internationally.
During 2017, the world’s economies continued on the cyclical rebound that started in mid-2016, showing a strengthening compared to the previous year.
IN 2017, WORLD OUTPUT SHOWED 3.7% GROWTH, WHICH WAS ABOVE MARKET PROJECTIONS
AND HALF A PERCENTAGE POINT HIGHER THAN THE GROWTH WITNESSED IN 2016. THE HIGHER
GROWTH WAS DRIVEN BY THE REBOUND OF ECONOMIES IN EUROPE AND ASIA.
The recovery of the European economy is mainly attributed to the acceleration in exports, and the constant intensity of internal demand growth, given more flexible financial conditions and an easing of political risk. The growth rates of various economies in the Eurozone have been upwardly revised—particularly Germany, Italy, and the Netherlands—thanks to the spike in internal and external demand. For 2017, growth is expected to reach 2.3% (1.5% in 2016).
US growth projections were revised upwards, as economic activity in 2017 outdid expectations. The changes in US tax policy should stimulate activity, resulting in a hike in investment. For 2017, growth should be close to 2.3% (1.7% in 2016).
Latin America has continued to experience a recovery in its economies, mainly thanks to the recovery of Brazil. Ahead, this recovery is expected to gain further strength, given the favorable effects of hikes in raw material prices, resulting in an increase in projections for 2018 and 2019. For 2017, growth is expected to reach 1.3% (a 0.7% contraction in 2016).
Specifically, in Brazil, the economy started to enter positive ground in the first half of 2017, gaining further strength in the second half of the year. This was mainly thanks to greater consumer spending, even though investment remains weak as a result of the political uncertainty still prevailing in the country. For 2017, growth is expected to reach 1.1% (a 3.5% contraction in 2016).
On the other hand, in Chile, economic growth has remained stable, albeit at lower levels than the average for the last few years, mainly because of the weakness in private fixed investment, mining production, and public consumption, thus resulting in 1.4% growth expected for 2017. In the next few years, economic growth is expected to recover thanks to improved confidence, a hike in copper prices, and the cuts in interest rates in the last few months.
In this economic environment, the flexibility of the business model that the Company has implemented is essential to better face the economic fluctuations.
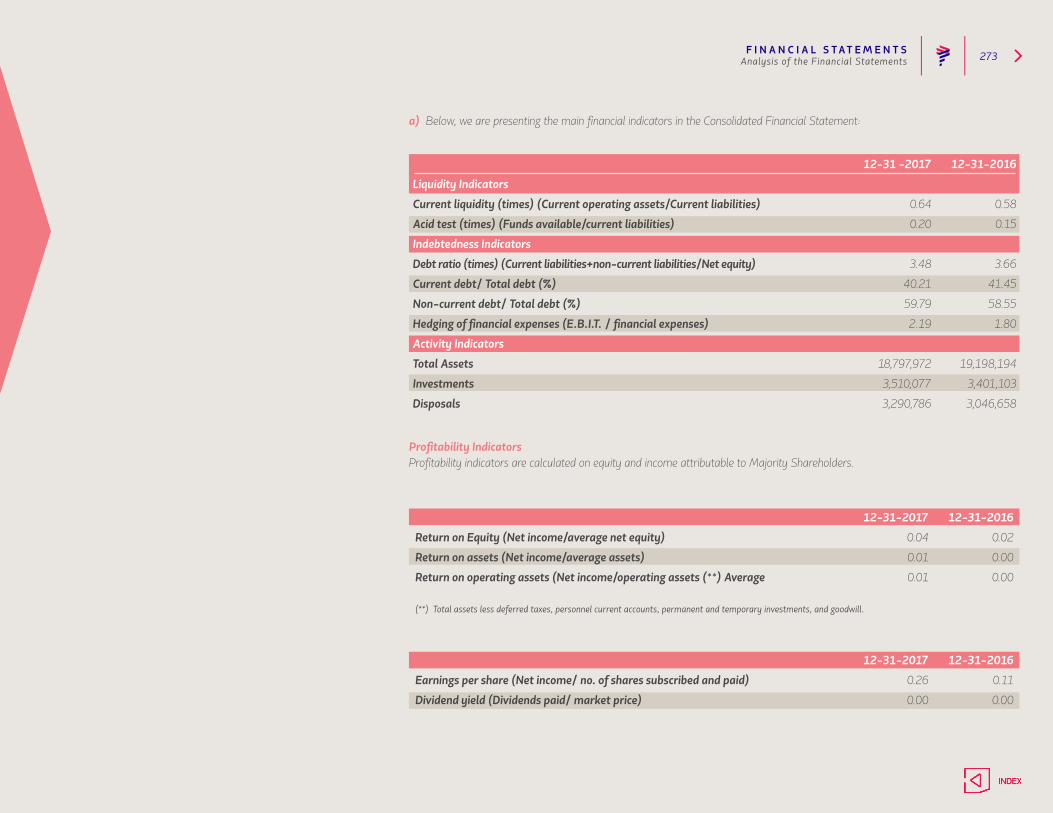
F I N A N C I A L S T AT E M E N T S 273Analysis of the Financial Statements
12-31 -2017 12-31-2016
Liquidity Indicators
Current liquidity (times) (Current operating assets/Current liabilities) 0.64 0.58
Acid test (times) (Funds available/current liabilities) 0.20 0.15
Indebtedness Indicators
Debt ratio (times) (Current liabilities+non-current liabilities/Net equity) 3.48 3.66
Current debt/ Total debt (%) 40.21 41.45
Non-current debt/ Total debt (%) 59.79 58.55
Hedging of financial expenses (E.B.I.T. / financial expenses) 2.19 1.80
Activity Indicators
Total Assets 18,797,972 19,198,194
Investments 3,510,077 3,401,103
Disposals 3,290,786 3,046,658
12-31-2017 12-31-2016
Return on Equity (Net income/average net equity) 0.04 0.02
Return on assets (Net income/average assets) 0.01 0.00
Return on operating assets (Net income/operating assets (**) Average 0.01 0.00
(**) Total assets less deferred taxes, personnel current accounts, permanent and temporary investments, and goodwill.
12-31-2017 12-31-2016
Earnings per share (Net income/ no. of shares subscribed and paid) 0.26 0.11
Dividend yield (Dividends paid/ market price) 0.00 0.00
a) Below, we are presenting the main financial indicators in the Consolidated Financial Statement:
Profitability Indicators Profitability indicators are calculated on equity and income attributable to Majority Shareholders.
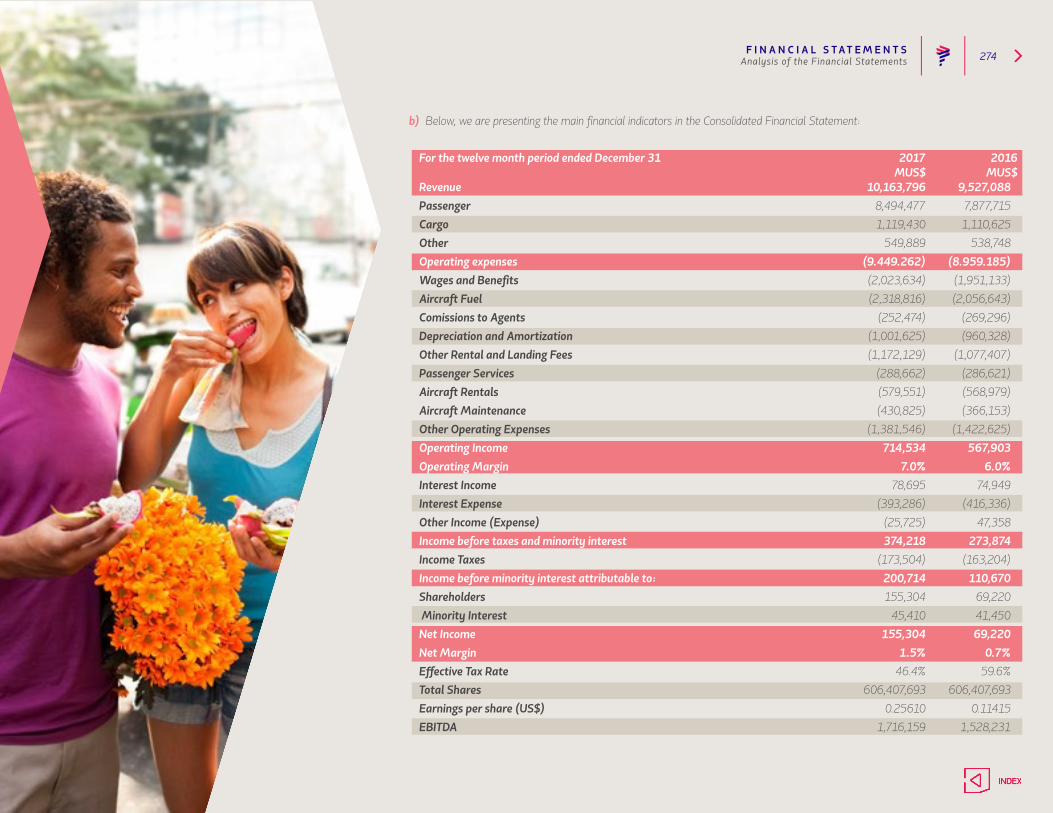
F I N A N C I A L S T AT E M E N T S 274Analysis of the Financial Statements
For the twelve month period ended December 31 2017 2016 MUS$ MUS$ Revenue 10,163,796 9,527,088Passenger 8,494,477 7,877,715Cargo 1,119,430 1,110,625Other 549,889 538,748Operating expenses (9.449.262) (8.959.185)Wages and Benefits (2,023,634) (1,951,133)Aircraft Fuel (2,318,816) (2,056,643)Comissions to Agents (252,474) (269,296)Depreciation and Amortization (1,001,625) (960,328)Other Rental and Landing Fees (1,172,129) (1,077,407)Passenger Services (288,662) (286,621)Aircraft Rentals (579,551) (568,979)Aircraft Maintenance (430,825) (366,153)Other Operating Expenses (1,381,546) (1,422,625)Operating Income 714,534 567,903Operating Margin 7.0% 6.0%Interest Income 78,695 74,949Interest Expense (393,286) (416,336)Other Income (Expense) (25,725) 47,358Income before taxes and minority interest 374,218 273,874Income Taxes (173,504) (163,204)Income before minority interest attributable to: 200,714 110,670 Shareholders 155,304 69,220 Minority Interest 45,410 41,450Net Income 155,304 69,220Net Margin 1.5% 0.7%Effective Tax Rate 46.4% 59.6% Total Shares 606,407,693 606,407,693Earnings per share (US$) 0.25610 0.11415EBITDA 1,716,159 1,528,231
b) Below, we are presenting the main financial indicators in the Consolidated Financial Statement:
F I N A N C I A L S T AT E M E N T S 275
A s Directors, Chief Exectutives Officer, and Chief Financial Officer of LATAM Airlines Group, we declare under our responsibility on the veracity of the
information contain in the Annual Report 2017.
Sworn Statements
Sworn