plan 4 prep: toolkit for oral prep implementation 4 prep: toolkit for oral prep implementation 3...
TRANSCRIPT
Plan 4 PrEP: Toolkit for Oral PrEP Implementation
3
STEP 3: ROLLOUT SCENARIOS

2JULY 2017
About this toolkit
WHAT IS THE PURPOSE AND CONTENTS OF THIS TOOLKIT?
• This toolkit was developed and used by the OPTIONS Consortium to support planning for the introduction of oral PrEP for HIV prevention in Kenya, Zimbabwe and South Africa.
• This toolkit is designed to help users in other countries plan for the introduction and rollout of oral PrEP
WHO SHOULD USE THIS TOOLKIT?This toolkit will be most relevant for:
National governments and ministries of health/HIV agencies to inform national and regional oral PrEP rollout and provide high-level guidance to counties/districts on what factors should be considered to ensure they are prepared to rollout oral PrEP
Implementing organizations (e.g., NGOs) to understand national and regional needs related to oral PrEP delivery and to support effective resource allocation
Donors (e.g., USAID) to initially scope country-specific needs and resource requirements
HOW COULD THE TOOLKIT BE MORE USEFUL?If you have thoughts, feedback, questions, requests for additional information or other resources that you would like to add to this toolkit, please contact Neeraja Bhavaraju at FSG (an OPTIONS consortium member) at [email protected].
Please acknowledge USAID/OPTIONS with use of this toolkit.
3JULY 2017
Plan developed to implement WHO oral
PrEP guidelines for end user populations
Oral PrEP produced, purchased, and distributed in
sufficient quantity tomeet projected
demand
Oral PrEP services delivered
through appropriate channels with access
to end user populations
End user populations seek and are able to access oral PrEP and
begin use
End users adhere to PrEP in recommended
frequency and time period; use is
effectively monitored
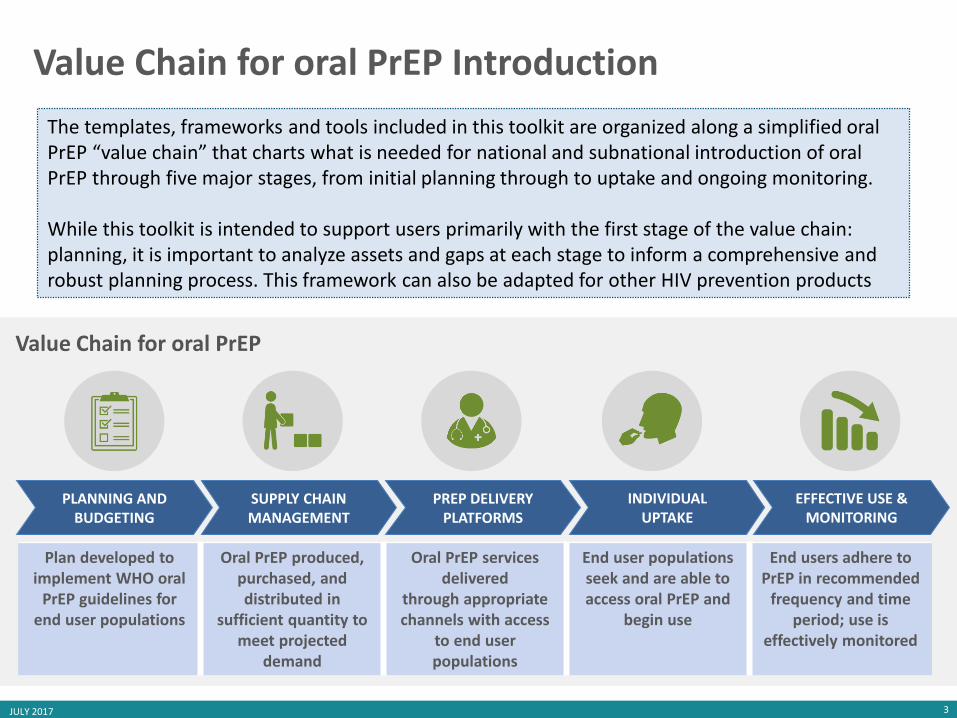
PLANNING AND BUDGETING
SUPPLY CHAIN MANAGEMENT
PREP DELIVERY PLATFORMS
INDIVIDUALUPTAKE
EFFECTIVE USE & MONITORING
The templates, frameworks and tools included in this toolkit are organized along a simplified oral PrEP “value chain” that charts what is needed for national and subnational introduction of oral PrEP through five major stages, from initial planning through to uptake and ongoing monitoring.
While this toolkit is intended to support users primarily with the first stage of the value chain: planning, it is important to analyze assets and gaps at each stage to inform a comprehensive and robust planning process. This framework can also be adapted for other HIV prevention products
Value Chain for oral PrEP
Value Chain for oral PrEP Introduction

4JULY 2017
This is the third tool in a series of four
1SITUATION ANALYSIS
2PROJECTLANDSCAPE
3READINESS ASSESSMENT
Understand the current situation for oral PrEP
• Identify existing assets, current gaps, challenges, and key questions for oral PrEP rollout
• Develop a landscape of key stakeholders and ongoing efforts
Assess findings & gaps in projects
• Survey current and planned studies and implementation projects
• Identify key questions to inform implementation and assess gaps
Assess readiness for oral PrEP
• Assess district/ county readiness to introduce and scale oral PrEP
• Support sub-national planning for oral PrEP roll out and scale-up
ROLLOUT SCENARIOS
Decide where and how to rollout oral PrEP
• Define rollout scenarios that differ by counties/districts or population groups
• Highlight considerations and trade-offs between different scenarios
4
Completed Rollout Scenarios to Reference Kenya | Zimbabwe
5JULY 2017
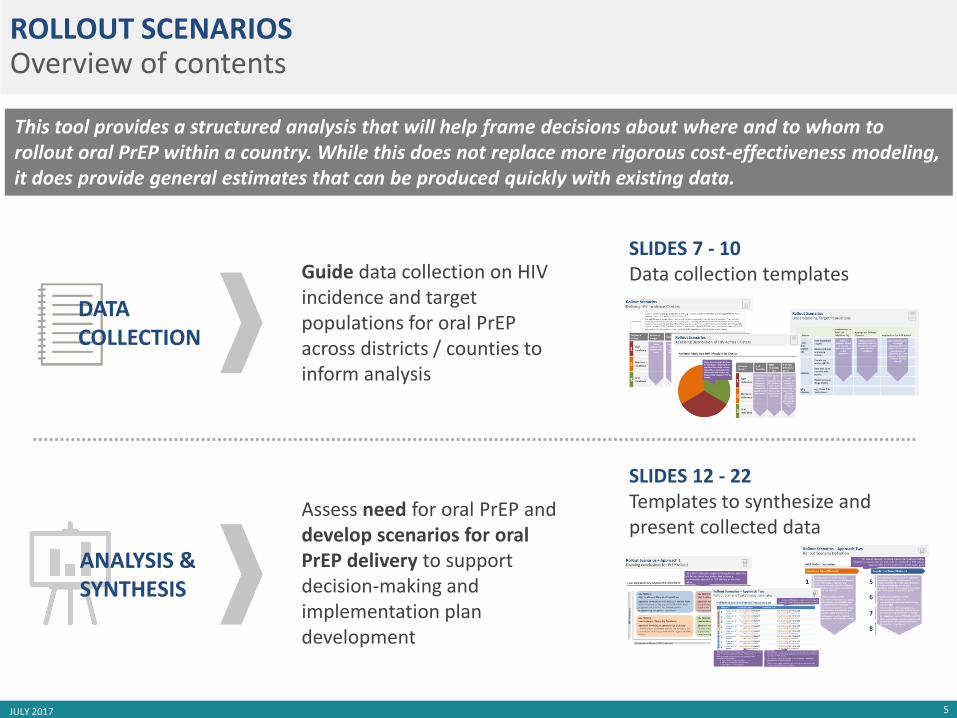
SLIDES 7 - 10Data collection templates
SLIDES 12 - 22Templates to synthesize and present collected data
ROLLOUT SCENARIOSOverview of contents
This tool provides a structured analysis that will help frame decisions about where and to whom to rollout oral PrEP within a country. While this does not replace more rigorous cost-effectiveness modeling, it does provide general estimates that can be produced quickly with existing data.
DATA COLLECTION
ANALYSIS & SYNTHESIS
Assess need for oral PrEP and develop scenarios for oral PrEP delivery to support decision-making and implementation plan development
Guide data collection on HIV incidence and target populations for oral PrEPacross districts / counties to inform analysis
6JULY 2017
ROLLOUT SCENARIOS
DATA COLLECTIONTEMPLATES

7JULY 2017
Rollout ScenariosData Collection in Excel
Collecting data in an Excel file enables easy analysis across counties/districts.
A sample Excel template can be found here.
8JULY 2017
IncidenceCluster
Incidence Range
Counties/Districts Included
1 High Incidence
2 Medium Incidence
3 LowIncidence
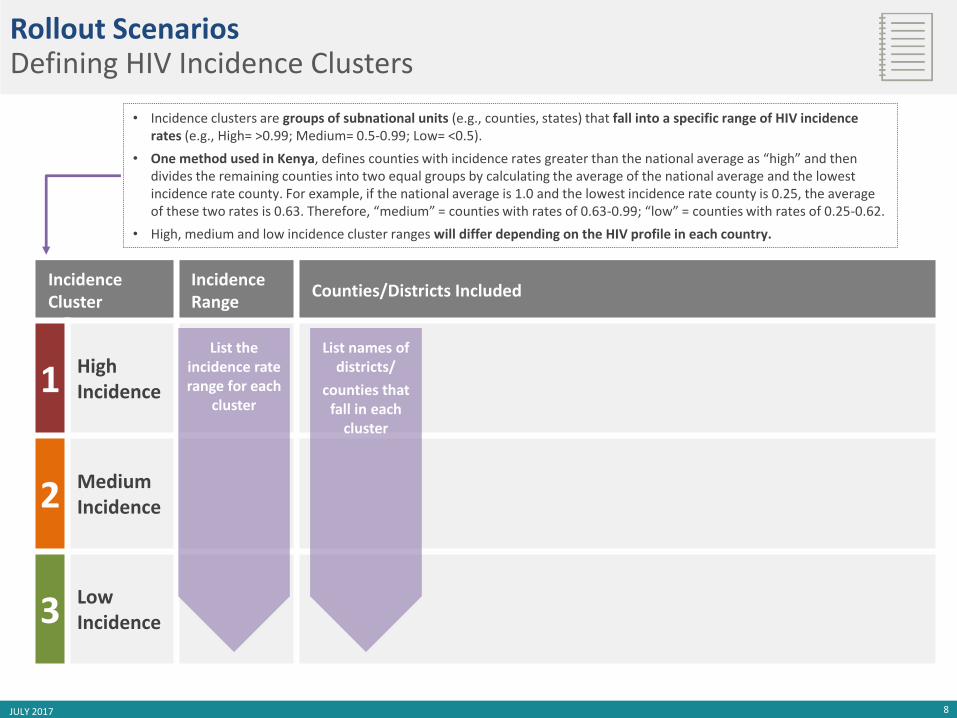
• Incidence clusters are groups of subnational units (e.g., counties, states) that fall into a specific range of HIV incidence rates (e.g., High= >0.99; Medium= 0.5-0.99; Low= <0.5).
• One method used in Kenya, defines counties with incidence rates greater than the national average as “high” and then divides the remaining counties into two equal groups by calculating the average of the national average and the lowest incidence rate county. For example, if the national average is 1.0 and the lowest incidence rate county is 0.25, the average of these two rates is 0.63. Therefore, “medium” = counties with rates of 0.63-0.99; “low” = counties with rates of 0.25-0.62.
• High, medium and low incidence cluster ranges will differ depending on the HIV profile in each country.
List names of districts/
counties that fall in each
cluster
List the incidence rate range for each
cluster
Rollout ScenariosDefining HIV Incidence Clusters
9JULY 2017
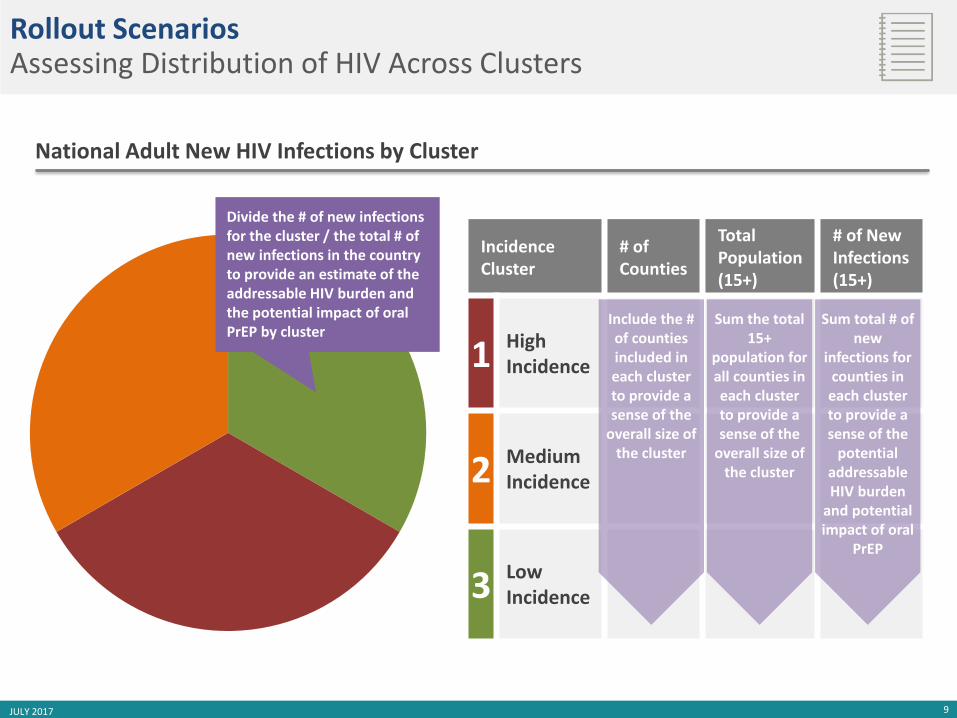
National Adult New HIV Infections by Cluster
Rollout ScenariosAssessing Distribution of HIV Across Clusters
IncidenceCluster
# ofCounties
Total Population (15+)
# of New Infections (15+)
1 High Incidence
2 Medium Incidence
3 LowIncidence
Include the # of counties included in each cluster to provide a sense of the
overall size of the cluster
Sum the total 15+
population for all counties in each cluster to provide a sense of the
overall size of the cluster
Sum total # of new
infections for counties in each cluster to provide a sense of the
potential addressable HIV burden
and potential impact of oral
PrEP
Divide the # of new infections for the cluster / the total # of new infections in the country to provide an estimate of the addressable HIV burden and the potential impact of oral PrEP by cluster

10JULY 2017
Rollout ScenariosUnderstanding Target Populations
Populations
Contribution to Total HIV Infections (%)
Appropriate Delivery Channels
Implications for Oral PrEPRollout
High-riskgeneral population groups
Sero-discordant couples
Adolescent girls and young women
Key populations
Female sexworkers (FSW)
Men who have sex with men(MSM)
People who use drugs (PWID)
Bridging populations
e.g., fisher folk, truck drivers
If data is available, note % of new HIV infections found in this population
Note appropriate channels for delivery of oral PrEP to reach each population effectively
Note implications for oral PrEP rollout, for example:
- Is population high-priority for PrEP access?
- Will the population be easy to reach through existing delivery channels?
11JULY 2017
ROLLOUT SCENARIOS
ANALYSIS
TEMPLATES
12JULY 2017
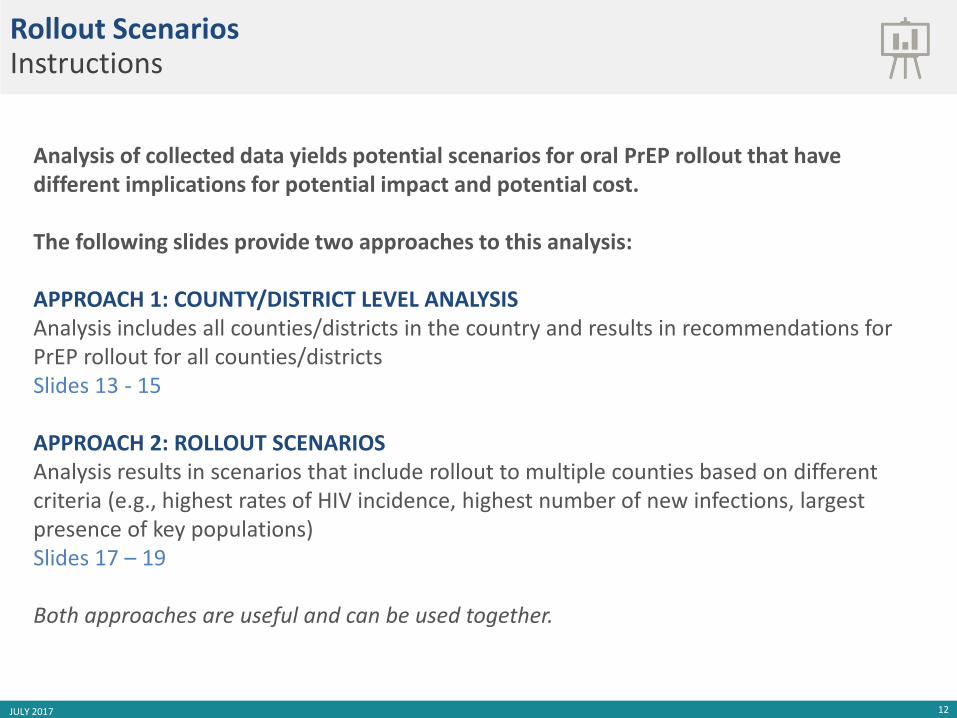
Rollout ScenariosInstructions
Analysis of collected data yields potential scenarios for oral PrEP rollout that have different implications for potential impact and potential cost.
The following slides provide two approaches to this analysis:
APPROACH 1: COUNTY/DISTRICT LEVEL ANALYSISAnalysis includes all counties/districts in the country and results in recommendations for PrEP rollout for all counties/districtsSlides 13 - 15
APPROACH 2: ROLLOUT SCENARIOSAnalysis results in scenarios that include rollout to multiple counties based on different criteria (e.g., highest rates of HIV incidence, highest number of new infections, largest presence of key populations) Slides 17 – 19
Both approaches are useful and can be used together.

13JULY 2017
Counties should be plotted along the Y-axis by HIV incidence (rate of new HIV infections). Incidence determines a district/county’s need for investment in new HIV prevention solutions including oral PrEP and prioritizes counties for PrEP rollout.
Counties with higher HIV incidence are higher priority for PrEP rollout.
Sources: Informed by Avenir, PrEP for Adolescent Girls and Young Women in Kenya, Preliminary Results Presentation, October 2016
Two-Step Delivery Approach Framework
HIV
Inci
de
nce
Population-Driven HIV Epidemic Generalized HIV Epidemic
1 2 Districts/counties should be plotted along the X-axis by size of key populations (FSW, MSM). This determines how a county should rollout oral PrEP.
Counties with epidemics driven by key populations should consider a targeted rollout to those groups while counties with low key populations but high HIV incidence should consider rollout to the general population, including serodiscordant couples, adolescent girls & young women, and bridging populations (e.g., fisherfolk).
Rollout Scenarios – Approach 1Plotting districts / counties
Plot counties / districts along two axes: HIV incidence and size of key populations as described below.
Circle size can illustrate absolute numbers of new infections.
14JULY 2017
Sources: Informed by Avenir, PrEP for Adolescent Girls and Young Women in Kenya, Preliminary Results Presentation, October 2016
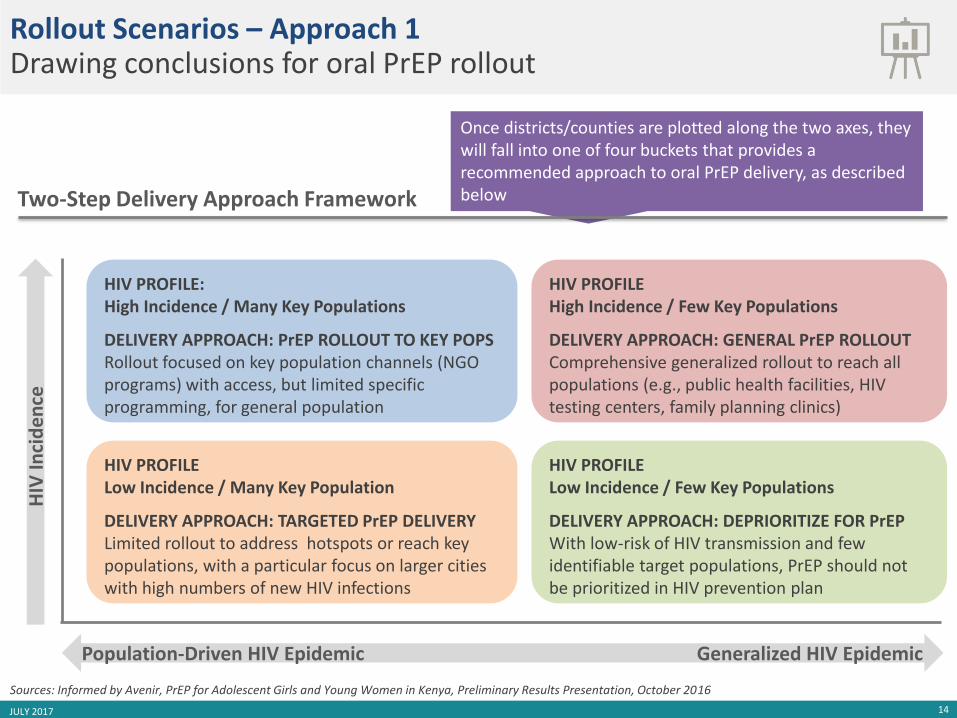
HIV PROFILE High Incidence / Few Key Populations
DELIVERY APPROACH: GENERAL PrEP ROLLOUT Comprehensive generalized rollout to reach all populations (e.g., public health facilities, HIV testing centers, family planning clinics)
HIV PROFILE Low Incidence / Few Key Populations
DELIVERY APPROACH: DEPRIORITIZE FOR PrEPWith low-risk of HIV transmission and few identifiable target populations, PrEP should not be prioritized in HIV prevention plan
HIV PROFILE: High Incidence / Many Key Populations
DELIVERY APPROACH: PrEP ROLLOUT TO KEY POPSRollout focused on key population channels (NGO programs) with access, but limited specific programming, for general population
HIV PROFILE Low Incidence / Many Key Population
DELIVERY APPROACH: TARGETED PrEP DELIVERY Limited rollout to address hotspots or reach key populations, with a particular focus on larger cities with high numbers of new HIV infections
Once districts/counties are plotted along the two axes, they will fall into one of four buckets that provides a recommended approach to oral PrEP delivery, as described below
Rollout Scenarios – Approach 1Drawing conclusions for oral PrEP rollout
Two-Step Delivery Approach Framework
HIV
Inci
de
nce
Population-Driven HIV Epidemic Generalized HIV Epidemic
15JULY 2017
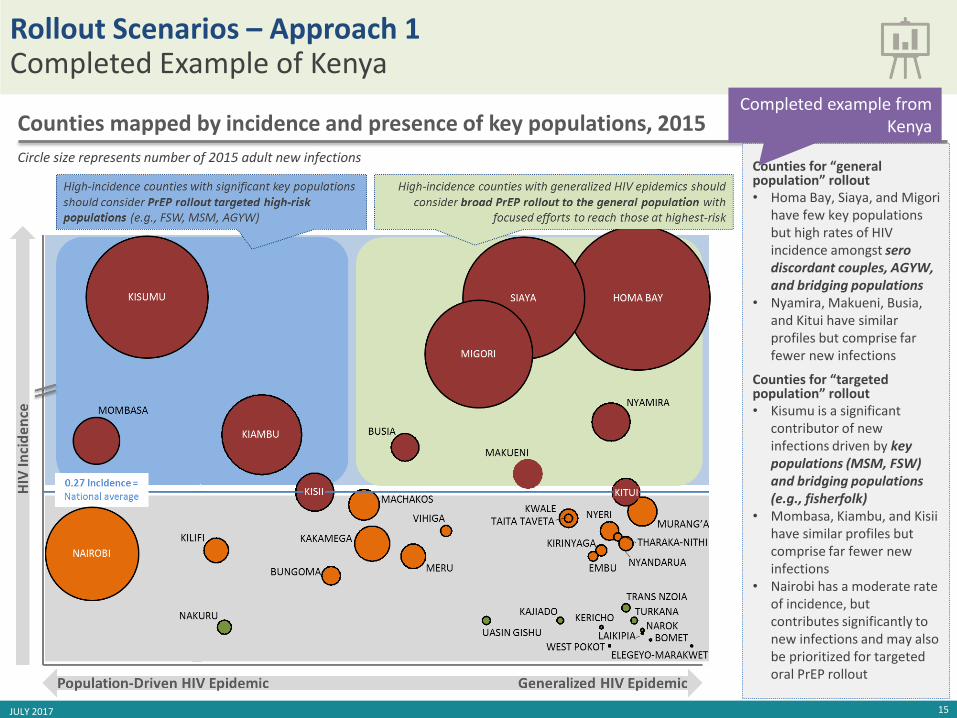
Circle size represents number of 2015 adult new infections
Counties mapped by incidence and presence of key populations, 2015
Counties for “general population” rollout• Homa Bay, Siaya, and Migori
have few key populations but high rates of HIV incidence amongst serodiscordant couples, AGYW, and bridging populations
• Nyamira, Makueni, Busia, and Kitui have similar profiles but comprise far fewer new infections
Counties for “targeted population” rollout • Kisumu is a significant
contributor of new infections driven by key populations (MSM, FSW) and bridging populations (e.g., fisherfolk)
• Mombasa, Kiambu, and Kisiihave similar profiles but comprise far fewer new infections
• Nairobi has a moderate rate of incidence, but contributes significantly to new infections and may also be prioritized for targeted oral PrEP rollout
Rollout Scenarios – Approach 1Completed Example of Kenya
Completed example from Kenya
16JULY 2017
5
6
7
8
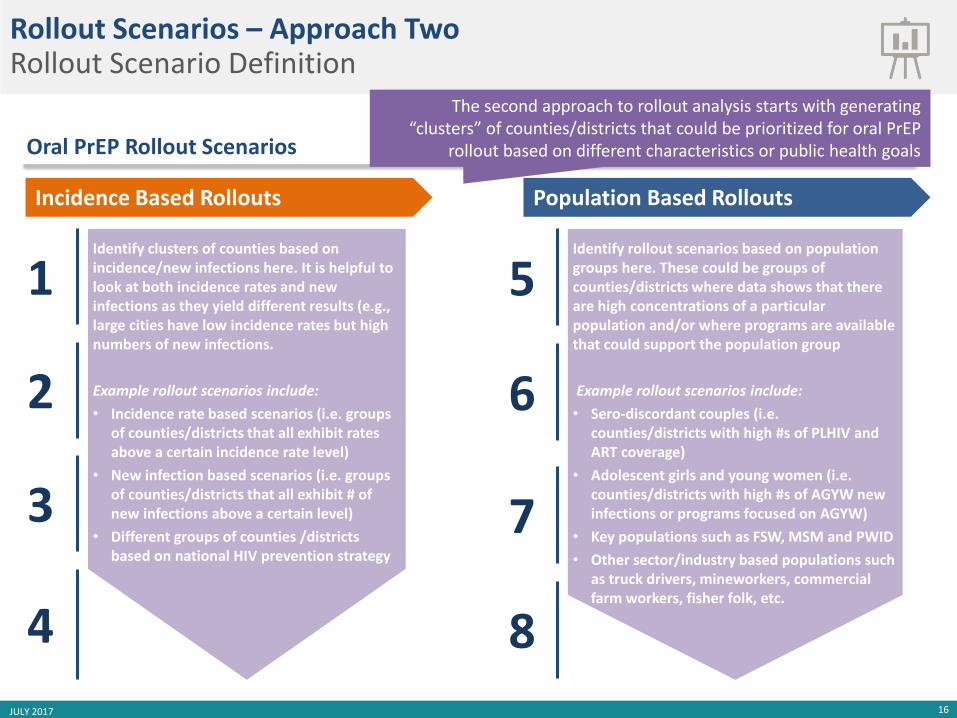
Identify rollout scenarios based on population groups here. These could be groups of counties/districts where data shows that there are high concentrations of a particular population and/or where programs are available that could support the population group
Example rollout scenarios include:
• Sero-discordant couples (i.e. counties/districts with high #s of PLHIV and ART coverage)
• Adolescent girls and young women (i.e. counties/districts with high #s of AGYW new infections or programs focused on AGYW)
• Key populations such as FSW, MSM and PWID
• Other sector/industry based populations such as truck drivers, mineworkers, commercial farm workers, fisher folk, etc.
1
2
3
4
Incidence Based Rollouts
Identify clusters of counties based on incidence/new infections here. It is helpful to look at both incidence rates and new infections as they yield different results (e.g., large cities have low incidence rates but high numbers of new infections.
Example rollout scenarios include:
• Incidence rate based scenarios (i.e. groups of counties/districts that all exhibit rates above a certain incidence rate level)
• New infection based scenarios (i.e. groups of counties/districts that all exhibit # of new infections above a certain level)
• Different groups of counties /districts based on national HIV prevention strategy
Oral PrEP Rollout Scenarios
Rollout Scenarios – Approach TwoRollout Scenario Definition
Population Based Rollouts
The second approach to rollout analysis starts with generating “clusters” of counties/districts that could be prioritized for oral PrEP
rollout based on different characteristics or public health goals
17
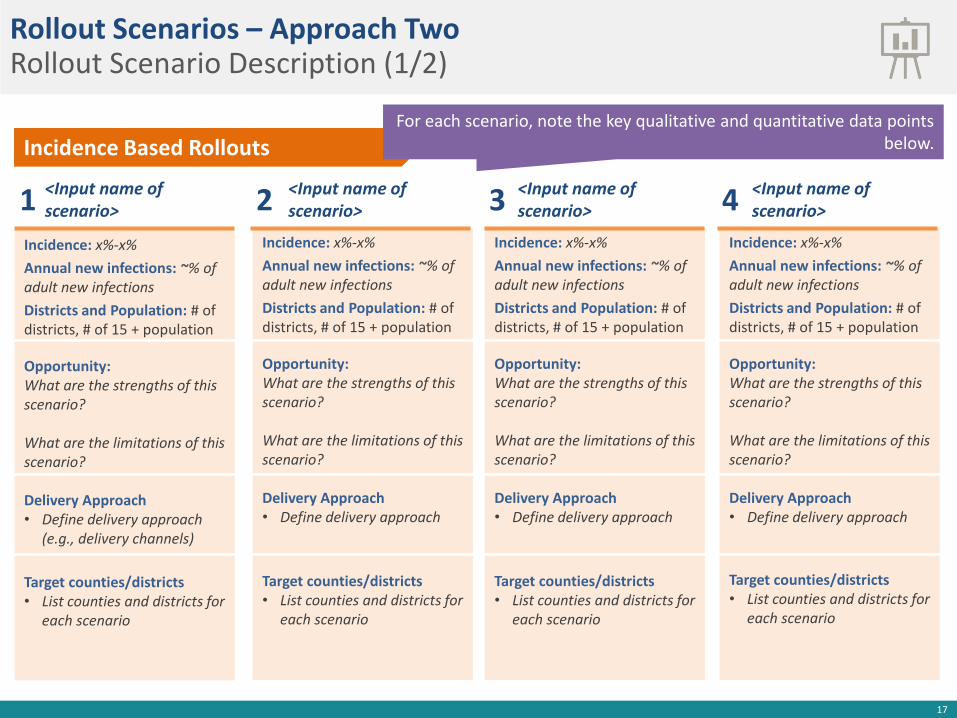
Incidence Based Rollouts
<Input name of scenario>
Incidence: x%-x%
Annual new infections: ~% of adult new infections
Districts and Population: # of districts, # of 15 + population
Opportunity: What are the strengths of this scenario?
What are the limitations of this scenario?
Delivery Approach• Define delivery approach
(e.g., delivery channels)
Target counties/districts• List counties and districts for
each scenario
1Incidence: x%-x%
Annual new infections: ~% of adult new infections
Districts and Population: # of districts, # of 15 + population
Opportunity:What are the strengths of this scenario?
What are the limitations of this scenario?
Delivery Approach• Define delivery approach
Target counties/districts• List counties and districts for
each scenario
Incidence: x%-x%
Annual new infections: ~% of adult new infections
Districts and Population: # of districts, # of 15 + population
Opportunity:What are the strengths of this scenario?
What are the limitations of this scenario?
Delivery Approach• Define delivery approach
Target counties/districts• List counties and districts for
each scenario
<Input name of scenario> 4<Input name of
scenario>2 <Input name of scenario>3
Rollout Scenarios – Approach TwoRollout Scenario Description (1/2)
For each scenario, note the key qualitative and quantitative data points below.

18
Population Based Rollouts
<Input name of scenario>
Incidence: x%-x%
Annual new infections: ~% of adult new infections
Districts and Population: # of districts, # of 15 + population
Opportunity: What are the strengths of this scenario?
What are the limitations of this scenario?
Delivery Approach• Define delivery approach
(e.g., delivery channels)
Target counties/districts• List counties and districts for
each scenario
1Incidence: x%-x%
Annual new infections: ~% of adult new infections
Districts and Population: # of districts, # of 15 + population
Opportunity:What are the strengths of this scenario?
What are the limitations of this scenario?
Delivery Approach• Define delivery approach
Target counties/districts• List counties and districts for
each scenario
Incidence: x%-x%
Annual new infections: ~% of adult new infections
Districts and Population: # of districts, # of 15 + population
Opportunity:What are the strengths of this scenario?
What are the limitations of this scenario?
Delivery Approach• Define delivery approach
Target counties/districts• List counties and districts for
each scenario
Incidence: x%-x%
Annual new infections: ~% of adult new infections
Districts and Population: # of districts, # of 15 + population
Opportunity:What are the strengths of this scenario?
What are the limitations of this scenario?
Delivery Approach• Define delivery approach
Target counties/districts• List counties and districts for
each scenario
<Input name of scenario> 4<Input name of
scenario>2 <Input name of scenario>3
Rollout Scenarios – Approach TwoRollout Scenario Description (2/2)
For each scenario, note the key qualitative and quantitative data points below.

19JULY 2017
Scenario Potential Impact Potential Cost
Inci
de
nce
-Bas
ed #
<Input name of scenario>
HIGH/MEDIUM/LOW IMPACT~% adult new infections
HIGH/MEDIUM/LOW TOTAL COST # of counties (# 15+ population)
#<Input name of scenario>
HIGH/MEDIUM/LOW IMPACT~% adult new infections
HIGH/MEDIUM/LOW TOTAL COST # of counties (# 15+ population)
#<Input name of scenario>
HIGH/MEDIUM/LOW IMPACT~% adult new infections
HIGH/MEDIUM/LOW TOTAL COST # of counties (# 15+ population)
#<Input name of scenario>
HIGH/MEDIUM/LOW IMPACT~% adult new infections
HIGH/MEDIUM/LOW TOTAL COST # of counties (# 15+ population)
Po
pu
lati
on
-Bas
ed #
<Input name of scenario>
HIGH/MEDIUM/LOW IMPACT~% adult new infections
HIGH/MEDIUM/LOW TOTAL COST # of counties (# 15+ population)
#<Input name of scenario>
HIGH/MEDIUM/LOW IMPACT~% adult new infections
HIGH/MEDIUM/LOW TOTAL COST # of counties (# 15+ population)
#<Input name of scenario>
HIGH/MEDIUM/LOW IMPACT~% adult new infections
HIGH/MEDIUM/LOW TOTAL COST # of counties (# 15+ population)
#<Input name of scenario>
HIGH/MEDIUM/LOW IMPACT~% adult new infections
HIGH/MEDIUM/LOW TOTAL COST # of counties (# 15+ population)
Oral PrEP Rollout Scenarios Potential Impact and Cost
• Potential impact is the percent of national HIV infections that occur in the counties/districts included in the scenario (e.g., new infections in scenario counties / total national new infections)
• While it will differ for each country, the following impact thresholds could be applied:
• High: >49% of new HIV infections• Medium: 20-49% of new HIV infections• Low: <20% of new HIV infections
• Potential cost is based on the # of counties and size of the 15+ population for each of the scenarios (larger population, more districts leads to higher total costs for oral PrEP delivery)
• This provides a high-level indication of cost to highlight tradeoffs and considerations for decision-making
• These cost and impact hypotheses will need to be complemented with impact and cost effectiveness modeling
Rollout Scenarios – Approach TwoRollout Scenario Cost / Impact Estimates
Using existing data, rough cost and impact estimates can be developed for each scenario

20JULY 2017
Oral PrEP Rollout Scenarios
1 Highest incidence districts
2 ZNASP hotspot districts
3 Districts with >1,000 annual new HIV infections
4 Districts with >500 annual new HIV infections
5 Serodiscordant couples
6 Adolescent girls and young women
7 Miners and commercial farmworkers
8 FSW, MSM and truck drivers
District Rollouts Population Rollouts
Note: Delivery approach, potential cost and impact are directional and will need to be refined with additional research, analysis and impact/cost-effectiveness modelling
Rollout Scenarios – Approach TwoCompleted Example of Zimbabwe

21JULY 2017
Highest Incidence Districts
Incidence: 1.2% - 1.9%
Annual new infections: ~40% adult new infections
Districts and Population: 13 districts, 1.6M 15+ population
Opportunity: Provides significant impact with less expansive and expensive rollout in circumstances with limited resources; all districts are ZNASP hotspots
Delivery Approach: Comprehensive generalized rollout
Target counties/districts• All districts of Matabeleland
South, Manicaland and Bulawayo
1Incidence: 0.5% - 1.7%
Annual new infections: ~55% adult new infections
Districts and Population: 15 districts, 3.6M 15+ population
Opportunity: Captures same number of new infections as Scenario #2 but less resource intensive given rollout to fewer districts; over 50% of districts are ZNASP hotspots
Delivery Approach
• Comprehensive rollout to More limited rollout in
Target counties/districts
• High: Kwekwe, Gweru, Mutare, Marondera, Mazowe, Murehwa, Gwanda and Bulawayo
• Medium Masvingo and Mashonaland East districts, including medium incidence Masvingo and Goromonzi
• Low: Harare
Incidence: 0.4% - 1.9%
Annual new infections: ~85% adult new infections
Districts and Population: 38 districts, 6.0M 15+ population
Opportunity: Covers districts with majority of new HIV infections but requires the greatest resource allocation of any scenario; over 50% of districts are ZNASP hotspots
Delivery ApproachComprehensive rollout to high-incidence districts; more limited rollout to medium and low incidence districts
Target counties/districts
• High: See alternative sheet
• Medium See alternative sheet
• Low: See alternative sheet
Incidence: 0.4% - 1.9%
Annual new infections: ~55% adult new infections
Districts and Population: 26 districts, 3.0M 15+ population
Opportunity: Captures over 50% of new infections, but likely requires ~2x resources than Scenario #1; all districts are ZNASP hotspots
Delivery Approach: Comprehensive rollout to high-incidence districts; more limited rollout to medium and low incidence districts
Target counties/districts
• High: Mat S. Manicaland, Bulawayo, as well as Mazowe (Mash C.), Marondera (Mash E), and Bubi (Mat N.)
• Medium: Mat. North and Mashonaland districts, including Nkayi, Centenary, Bindura, Shamva, Mount Darwin and Makonde
• Low: Chegutu, Hurungwe and Kadoma
ZNASP Hotspot Districts 4Districts with >1,000
Annual New Infections 2 Districts with >500 Annual New Infections3
Comprehensive generalized rollouts to all high-risk populations via public health facilities, rural health centers, family planning and SRH clinics
More limited tailored rollouts based on localized drivers of HIV in each district
Rollout Scenarios – Approach TwoCompleted Example of Zimbabwe
22JULY 2017
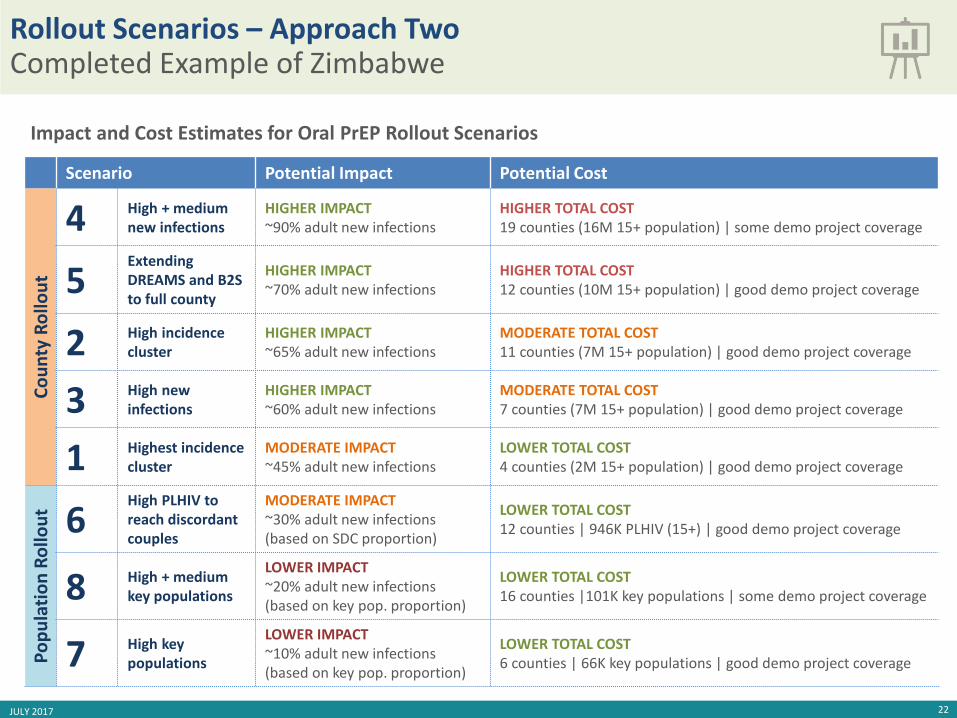
Impact and Cost Estimates for Oral PrEP Rollout Scenarios
Scenario Potential Impact Potential Cost
Co
un
tyR
ollo
ut
4 High + mediumnew infections
HIGHER IMPACT~90% adult new infections
HIGHER TOTAL COST 19 counties (16M 15+ population) | some demo project coverage
5Extending DREAMS and B2S to full county
HIGHER IMPACT~70% adult new infections
HIGHER TOTAL COST12 counties (10M 15+ population) | good demo project coverage
2 High incidence cluster
HIGHER IMPACT~65% adult new infections
MODERATE TOTAL COST11 counties (7M 15+ population) | good demo project coverage
3 High new infections
HIGHER IMPACT~60% adult new infections
MODERATE TOTAL COST7 counties (7M 15+ population) | good demo project coverage
1 Highest incidence cluster
MODERATE IMPACT~45% adult new infections
LOWER TOTAL COST4 counties (2M 15+ population) | good demo project coverage
Po
pu
lati
on
Ro
llou
t 6High PLHIV to reach discordant couples
MODERATE IMPACT~30% adult new infections (based on SDC proportion)
LOWER TOTAL COST12 counties | 946K PLHIV (15+) | good demo project coverage
8 High + medium key populations
LOWER IMPACT~20% adult new infections (based on key pop. proportion)
LOWER TOTAL COST16 counties |101K key populations | some demo project coverage
7 High key populations
LOWER IMPACT~10% adult new infections(based on key pop. proportion)
LOWER TOTAL COST6 counties | 66K key populations | good demo project coverage
Rollout Scenarios – Approach TwoCompleted Example of Zimbabwe