plant applications 8
TRANSCRIPT

GE Digital Proficy Historian and Operations Hub: Data Analysis in Context 1
Web ReportingPlant Applications 8.2

Proprietary Notice
The information contained in this publication is believed to be accurate and reliable. However, General Electric Company assumes no responsibilities for any errors, omissions or inaccuracies. Information contained in the publication is subject to change without notice.
No part of this publication may be reproduced in any form, or stored in a database or retrieval system, or transmitted or distributed in any form by any means, electronic, mechanical photocopying, recording or otherwise, without the prior written permission of General Electric Company. Information contained herein is subject to change without notice.
Trademark Notices
GE, the GE Monogram, and Predix are either registered trademarks or trademarks of General Electric Company.
Microsoft® is a registered trademark of Microsoft Corporation, in the United States and/or other countries.
All other trademarks are the property of their respective owners.
We want to hear from you. If you have any comments, questions, or suggestions about our documentation, send them to the following email address:
© 2021, General Electric Company. All rights reserved.

i
Table of Contents
Web Server Administrator Environment _____________________________________________ 1
Server Architecture _____________________________________________________________ 1
Client Architecture _____________________________________________________________ 2
The Plant Applications Web Report Server _______________________________________ 2
The Plant Applications Add-in for Excel _________________________________________ 2
Setting Up an SSO Login for the Web Server ________________________________________ 2
Installation __________________________________________________________________ 2
Troubleshooting _____________________________________________________________ 4
Using Command or Link Objects __________________________________________________ 5
SharePoint Services ____________________________________________________________ 6
Changing SharePoint Port Number ______________________________________________ 6
Web Report Server Administration _________________________________________________ 7
Logging on to the Web Administrator _____________________________________________ 7
Managing Web Server Security _________________________________________________ 7
Performing System Backups ____________________________________________________ 8
Refreshing the Server _________________________________________________________ 8
Managing Web Reports _________________________________________________________ 8
Five Types of Web Content ____________________________________________________ 8
Excel ____________________________________________________________________ 8
Access ___________________________________________________________________ 9
Active Server Page _________________________________________________________ 9
Active Server Application ____________________________________________________ 9
Internal or External Web site __________________________________________________ 9
Customizing a Web Page ______________________________________________________ 9
Adding New Content to the Web Server __________________________________________ 10
Viewing SQL Server Report Services Reports _____________________________________ 11
Creating a New Report Definition _______________________________________________ 13
Changing Report Definition Properties ___________________________________________ 13
Report Packages____________________________________________________________ 14

Table of Contents
ii
Importing a Plant Applications Report Package ____________________________________ 14
Exporting a Plant Applications Report Package ____________________________________ 14
Editing Web Content _________________________________________________________ 14
View Settings ______________________________________________________________ 16
Controlling Report Security ____________________________________________________ 16
Scheduling a Report _________________________________________________________ 17
Running a Scheduled Report __________________________________________________ 21
Printing Reports ____________________________________________________________ 22
Removing Reports from the Print Queue _________________________________________ 22
Removing Reports from the Engine Queue _______________________________________ 23
Creating Default Web Reports _________________________________________________ 23
Editing Report Parameters ____________________________________________________ 25
Previewing a Web Report _____________________________________________________ 26
Using the URL to Call Reports and Definitions _____________________________________ 26
Examples ________________________________________________________________ 26
Report Schedule ____________________________________________________________ 27
Report Types _______________________________________________________________ 27
Searching for a Saved Batch Analysis ___________________________________________ 27
Printers _____________________________________________________________________ 28
Adding a Printer ____________________________________________________________ 28
Removing a Printer __________________________________________________________ 28
Report Engines _______________________________________________________________ 28
Configuring Report Engines Errors ______________________________________________ 29
Controlling the Web Engines __________________________________________________ 29
Engine Parameters ________________________________________________________ 29
Viewing a Report Engine's Activity ______________________________________________ 30
Deleting Report Engine Messages ______________________________________________ 30
Parameters __________________________________________________________________ 30
Adding Parameters __________________________________________________________ 31
Editing Web Server Parameters ________________________________________________ 31
Deleting Web Server Parameters _______________________________________________ 32

Plant Applications Web Reporting
iii
Dialogs _____________________________________________________________________ 32
Adding Dialogs (Web pages) __________________________________________________ 32
Editing Dialogs (Web Pages) __________________________________________________ 33
Exporting Web Pages (Dialogs) ________________________________________________ 33
Deleting Dialogs (Web pages) _________________________________________________ 33
Time Options ________________________________________________________________ 34
What are Time Options? ______________________________________________________ 34
Viewing Time Options ________________________________________________________ 34
Creating Time Options _______________________________________________________ 34
Editing Time Options _________________________________________________________ 34
Deleting Time Options _______________________________________________________ 35
Managing Web Users __________________________________________________________ 35
Organizing the Client Environment ______________________________________________ 35
Organizing Users and Templates _____________________________________________ 35
Organizing Tree Templates __________________________________________________ 36
User Trees ________________________________________________________________ 36
Creating a New User Tree ____________________________________________________ 36
Deleting a User Tree _________________________________________________________ 36
Tree Users ________________________________________________________________ 36
Adding a User to a User Tree __________________________________________________ 36
Removing a User Tree Member ________________________________________________ 37
Changing the User Properties __________________________________________________ 37
Configuring Web Content for Users _____________________________________________ 37
Deleting a Tree Configuration Folder ____________________________________________ 38
Renaming a Tree Configuration Folder __________________________________________ 38
Monitoring Report Activity _______________________________________________________ 39
Viewing System Log Files _____________________________________________________ 39
Viewing a Report Engine's Activity ______________________________________________ 39
Viewing Reports in the Schedule Queue _________________________________________ 39
Viewing the Print Queue ______________________________________________________ 40
Web Report Client Interface _____________________________________________________ 40

Table of Contents
iv
The Toolbar Icons and Buttons _______________________________________________ 40
Using the Web Report Client __________________________________________________ 41
Logging on to the Web Report Client ____________________________________________ 42
Creating an Ad Hoc Report ____________________________________________________ 42
Printing Reports ____________________________________________________________ 42
Making Changes to a Report Type ______________________________________________ 43
Creating a New Report Definition _______________________________________________ 43
Site Parameters ______________________________________________________________ 44
Ad Hoc Report Life (Days) ____________________________________________________ 44
Dashboard Engine Server site parameter ________________________________________ 44
Gallery Physical Path site parameter ____________________________________________ 45
Gallery Virtual Path site parameter ______________________________________________ 45
Microsoft Dashboard Catalog Site Parameter _____________________________________ 45
Microsoft Dashboard Server Site Parameter ______________________________________ 46
Proficy Dashboard Server site parameter _________________________________________ 46
Proficy Dashboard Virtual Path site parameter _____________________________________ 47
Show Additional Web Part Configuration Tabs site parameter ________________________ 47
Web App Physical Path Site Parameter __________________________________________ 48
Standard Web Reports Overview _________________________________________________ 49
Alarm Detail _________________________________________________________________ 53
Trend Analysis ____________________________________________________________ 53
Audit Trail Reports ____________________________________________________________ 54
Downtime Detail ______________________________________________________________ 55
Event Information _________________________________________________________ 55
Cause or Action Information _________________________________________________ 56
Event Analysis _______________________________________________________________ 56
Product Analysis ____________________________________________________________ 57
Crew Analysis ______________________________________________________________ 57
Fault Analysis ______________________________________________________________ 58
Cause Analysis _____________________________________________________________ 58
Action Analysis _____________________________________________________________ 58

Plant Applications Web Reporting
v
Location Analysis ___________________________________________________________ 58
Category Analysis ___________________________________________________________ 59
Non-productive Time _________________________________________________________ 59
Capability Analysis __________________________________________________________ 59
Trends ____________________________________________________________________ 59
Data Summary _____________________________________________________________ 60
Criteria Summary ___________________________________________________________ 60
Event Detail Report ___________________________________________________________ 60
Event History Color ____________________________________________________________ 61
Event History Color Web Report ______________________________________________ 61
Event History Grid_____________________________________________________________ 62
Event History Grid Web Report _______________________________________________ 63
Event Detail Report ________________________________________________________ 63
Interactive Trend __________________________________________________________ 63
Inventory Listing ______________________________________________________________ 63
Inventory Listing Web Report ________________________________________________ 64
Event Detail Report ________________________________________________________ 64
Line Production Timeline _______________________________________________________ 65
Line Production Timeline Web Report _________________________________________ 65
Line Time Accounting __________________________________________________________ 66
Line Time Accounting Report ________________________________________________ 66
OEE Summary _______________________________________________________________ 67
OEE Summary ___________________________________________________________ 68
Production Listing _____________________________________________________________ 68
Grand Totals _____________________________________________________________ 68
Production Day Summary ___________________________________________________ 69
Shift Summary ____________________________________________________________ 69
Crew Summary ___________________________________________________________ 69
Process Order Summary ____________________________________________________ 69
Product Summary _________________________________________________________ 69
Status Summary __________________________________________________________ 69

Table of Contents
vi
Event Details _____________________________________________________________ 70
Sequence of Events ___________________________________________________________ 70
Sequence of Events Report _________________________________________________ 70
Simple Trend ________________________________________________________________ 71
SPC Chart ___________________________________________________________________ 72
Prerequisites _____________________________________________________________ 73
SPC Chart Functionality ____________________________________________________ 73
X-Bar and Range Chart _____________________________________________________ 73
X-Bar and MR Charts ______________________________________________________ 75
X-Bar and Sigma Charts ____________________________________________________ 77
Statistics ________________________________________________________________ 78
Criteria Summary _________________________________________________________ 79
Raw Data ________________________________________________________________ 80
SPC Chart Calculations ______________________________________________________ 80
Population Size (n) ________________________________________________________ 80
Number of Subgroups (k) ___________________________________________________ 80
Subgroup Size (m) ________________________________________________________ 80
Average _________________________________________________________________ 80
Minimum ________________________________________________________________ 81
Maximum ________________________________________________________________ 81
Process Standard Deviation (S) ______________________________________________ 81
Estimated Sigma () ________________________________________________________ 82
X/MR ___________________________________________________________________ 82
Z Numbers _______________________________________________________________ 82
Lower Process Capability Index (Cpl) __________________________________________ 83
Upper Process Capability Index (Cpu) _________________________________________ 83
Process Capability (Cp) _____________________________________________________ 83
Process Capability Index (Cpk) _______________________________________________ 84
Process Capability Ratio (Cr) ________________________________________________ 84
Taguchi Capability Index (Cpm) ______________________________________________ 84
Lower Process Performance (Ppl) ____________________________________________ 85

Plant Applications Web Reporting
vii
Upper Process Performance (Ppu) ____________________________________________ 85
Process Performance (Pp) __________________________________________________ 85
PpK ____________________________________________________________________ 86
SPC Chart Options and Data __________________________________________________ 86
SPC Chart Options and Control Limits ___________________________________________ 86
Configure and Run the SPC Chart ______________________________________________ 87
Running the SPC Chart from an Autolog display ___________________________________ 91
Editing an SPC Chart ________________________________________________________ 92
Test Conformance By Product ___________________________________________________ 94
Test Conformance By Shift ______________________________________________________ 95
Thumbnail Trends _____________________________________________________________ 96
Simple Trend Report _______________________________________________________ 97
Time History Color ____________________________________________________________ 97
Transaction Detail _____________________________________________________________ 98
Unit Time Accounting __________________________________________________________ 99
User-defined Event Detail ______________________________________________________ 100
Research Summary Information _____________________________________________ 100
Variable Centerline Analysis ____________________________________________________ 101
Variable Centerline Analysis Web Report ______________________________________ 102
Variable Conformance Summary ________________________________________________ 103
Variable Conformance Summary Report ______________________________________ 104
Variable Scatter Analysis ______________________________________________________ 104
Variable Specification _________________________________________________________ 105
Specification by Unit Report ________________________________________________ 106
Specification History Report ________________________________________________ 106
Interactive Trend Report ___________________________________________________ 107
Variable Statistics Summary ____________________________________________________ 107
Variable Statistics Summary Report ____________________________________________ 107
Control Summary ________________________________________________________ 107
Run Analysis ____________________________________________________________ 108
Process Capability ________________________________________________________ 108

Table of Contents
viii
Product Capability ________________________________________________________ 109
Control Chart ____________________________________________________________ 110
Cusum Analysis __________________________________________________________ 110
Trend __________________________________________________________________ 111
Criteria Summary ________________________________________________________ 111
Products Analyzed _______________________________________________________ 112
Viewing History ______________________________________________________________ 112
Waste Detail ________________________________________________________________ 112
Event Information ________________________________________________________ 113
Cause or Action Information ________________________________________________ 113
Parameter Summary ______________________________________________________ 113
Web Part Administrator Environment _____________________________________________ 113
Getting Started with Web Parts _________________________________________________ 115
What Is a Web Part? ________________________________________________________ 115
Logging on to the Web Parts Administrator ______________________________________ 115
Web Part Administration Dialog Box ____________________________________________ 115
Creating Web Parts _________________________________________________________ 116
Configuring Your Web Part ___________________________________________________ 117
Editing Default Parameter Values ______________________________________________ 118
Scheduling your Web Part ___________________________________________________ 118
Viewing Statistics __________________________________________________________ 119
Adding Dialogs ____________________________________________________________ 120
Adding Parameters _________________________________________________________ 120
Columns Tab ______________________________________________________________ 121
CrewFilter Tab _____________________________________________________________ 121
Deleting Parameters ________________________________________________________ 121
Page Caching _____________________________________________________________ 121
Query Results Page ________________________________________________________ 122
Selecting Batches ________________________________________________________ 122
Specifying Start and End Times _______________________________________________ 122
Pre-defined Time Options __________________________________________________ 123
Plant Applications Web Reporting
ix
User-defined Time Options _________________________________________________ 123
Viewing a Report ___________________________________________________________ 123
Viewing the Report Engine Queue _____________________________________________ 123
Managing Web Part Templates _________________________________________________ 124
Column Names __________________________________________________________ 124
Associated Templates and Reports ____________________________________________ 125
Editing Template Parameter Values ____________________________________________ 125
Copying Templates _________________________________________________________ 125
Exporting a Template _______________________________________________________ 126
Exporting All Templates _____________________________________________________ 127
Configuring Available Web Parts ________________________________________________ 128
Creating Web Parts _________________________________________________________ 128
Configuring Your Web Part ___________________________________________________ 128
Web Part Display Settings ___________________________________________________ 129
Deleting Web Parts _________________________________________________________ 130
Previewing Web Parts _______________________________________________________ 131
Copying Web Parts _________________________________________________________ 131
Editing Web Part Parameter Values ____________________________________________ 131
Changing Web Part Properties ________________________________________________ 132
Scheduling your Web Part ___________________________________________________ 132
Associated Templates and Reports ____________________________________________ 133
Exporting Web Parts ________________________________________________________ 133
Using Web Parts in a Portal ____________________________________________________ 134
Using Web Parts in Windows® SharePoint™ Services _____________________________ 134
Web Part Services and Parameters ______________________________________________ 135
Webpart Content Generator service ____________________________________________ 135
Standard Web Parts Overview __________________________________________________ 136
Alarm Count by Variables Web Part ______________________________________________ 141
Alarm Details by Production Event Web Part _______________________________________ 142
Alarm List By Units Web Part ___________________________________________________ 143
Alarm List By Variables Web Part _______________________________________________ 145

Table of Contents
x
Downtime Distribution Charts by Units Web Part ____________________________________ 147
Downtime Top N Chart by Unit Web Part __________________________________________ 150
Efficiency Statistics by Unit Web Part_____________________________________________ 152
Inventory Distribution Charts By Units ____________________________________________ 153
My Report Search Dialog Web Part ______________________________________________ 155
My Reports Favorites Dialog Web Part ___________________________________________ 156
Operating Downtime Distribution Web Part ________________________________________ 157
Overview Statistics by Path Web Part ____________________________________________ 160
Performance Distribution Web Part ______________________________________________ 161
Process Order (Active) List by Lines Web Part _____________________________________ 162
Process Order Search By Paths Web Part ________________________________________ 163
Process Order Search Dialog Web Part ___________________________________________ 164
Product Statistics By Units Web Part _____________________________________________ 165
Production Distribution Charts By Units Web Part ___________________________________ 167
Production Event Alarms By Unit Web Part ________________________________________ 168
Production Event Search By Unit Web Part ________________________________________ 169
Production Event Search Dialog Web Part ________________________________________ 170
Production Event Status List By Units Web Part ____________________________________ 171
Production Statistics By Lines Web Part __________________________________________ 173
Quality Statistics By Variables Web Part __________________________________________ 174
Specification Search By Units Web Part __________________________________________ 177
Specification Search Dialog Web Part ____________________________________________ 178
Unit OEE Web Part ___________________________________________________________ 178
Waste Distribution Charts by Units Web Part _______________________________________ 180
Waste Top N Charts by Units Web Part ___________________________________________ 183

1
Web Server Administrator Environment
The Plant Applications Web Server is configured through the Web Administrator, which is
accessed through the Plant Applications Administrator program. Therefore, the Web
Administrator can be started from any computer that has the Plant Applications Administrator
program installed on it.
To open the Web Administrator, in the Plant Applications Server Manager tree, expand the
Server Management node and double-click Administrator Web Server.
The toolbar allows you to change the view of the contents in the right pane, start the COA
applications and schedule a report.
From the File menu, you import Web report packages and exit the application. From the
View menu, you can refresh the view. From the Help menu, you access the online help file
and view information about your version of the Web Server Administrator.
The left pane displays the Web Administrator tree. This is where you add users, schedule
reports, manage the Web Server, and manage Web reports.
The right pane displays the contents of the node that you've selected in the left pane.
Server Architecture
The Plant-wide Reporting module is supported by the Plant Applications Server, Microsoft
Internet Information Server, the Plant Applications Web Report Server, the Plant Applications
Scheduler, and one or more Plant Applications Report Engines.

Client Architecture
2
The role of the Plant Applications Web Report Server is to interact with the Web Client and
service navigational and ad hoc requests for data.
The Plant Applications Scheduler submits work for the Report Engine(s) to perform based on
reports that are regularly scheduled and ad hoc requests from users. Each Web Engine bids for
work and when completed, publishes the content to the Plant Applications Web Site.
The Plant Applications Server manages the Plant Applications database.
The Plant Applications Add-in for Excel is serviced directly by the Plant Applications Server.
Client Architecture
The two primary client tools are the Plant Applications Report Server Web site and the Plant
Applications Add-in for Excel. The Report Server Web site is a sub-web site under your
company's intranet Web site and is installed on the Plant Applications Web Server. The Excel
Add-in works directly off the Plant Applications Server.
The Plant Applications Web Report Server
The Plant Applications Server maintains a profile of each user to ensure that each user gets the
appropriate reports when they log on to the Report Server Web site. Users can then view pre-
processed web content and reports simply by clicking on the desired title. Additionally, users can
create ad hoc reports, save reports, and make local copies of data for import into other
applications, if they've been given the proper User Rights.
The Report Server Web site does not require any software installation, and is configured through
the Plant Applications Web Administrator.
The Plant Applications Add-in for Excel
The Excel Add-in provides a specialized menu and set of standard functions to create dynamic
reports with Excel. After you have created your reports, you can save them and re-use them.
Additionally, you can create Excel templates and publish those templates for use through the
Web Report Server.
The Excel Add-in must be installed on each computer that will use the Add-in.
Setting Up an SSO Login for the Web Server
After installing the Plant Applications Web Server (Report Server), configuration is required to
enable log-in using an SSO user name. This feature is available with Plant Applications 5.0 SIM
(June 2012) and Plant Applications 6.1 release or higher.
NOTE: It is advisable to enable SSO log-in for only those users for whom you want to make SSO
log-in available. When SSO is enabled, it creates an extra login step for some Plant Applications
features, for example, when accessing Administer Web Server.
Installation
Setting up and enabling the SSO log-in is a shared task between you, the customer, and GE
Intelligent Platforms support:

Plant Applications Web Reporting
3
1. Obtain the URL for the installed web server. (Customer)
2. Request an SSO by contacting GE Corporate, Identity and Access Management at
http://supportcentral.ge.com/products/sup_products.asp?prod_id=18322. (Customer)
SSO will be enabled during implementation using the standard GE mechanism as
described in “What does it take to SSO enable an application” under the Quick Tips
section. (GE Corporate support)
3. Communicate to GE Corporate to use the certain HTTP headers, which are needed for
the integration to work. (Customer)
The following HTTP headers are needed by the Site Minder configuration for the
integration to work. The Plant Applications Web Server reads these headers to generate
session cookies:
NOTE: Either HTTP_SM_USER or HTTP_SM_SSOID is needed to indicate the SSO ID
of the logged in user.
HTTP_SM_USER is the SSO ID of the user and/or HTTP_SM_SSOID is the SSO ID of
the user reserved for GE Aviation
HTTP_SM_SDOMAIN is the SiteMinder cookie domain
HTTP_GESSOSTATUS is the status of the SSO account (‘A’ indicates the user is valid
and active.)
4. Setup and implement necessary headers using SiteMinder and accessing the web server
that the customer installed. (GE Corporate support)
5. Enable “Anonymous Authentication” for URLs in the following Plant Applications web
applications (Default Web Server) under SSO protection unless all the SSO users have
web server file system access: (GE Corporate support)
PAReporting
Apps
ProficyDashboard
Do this by selecting the application in the Connections pane, double-clicking Authentication
under IIS in the Features View, and ensuring that Anonymous Authentication is enabled.
Afterwards, ensure web service URLs with an .asmx suffix under /Apps/WebServices
are unprotected by an SSO.
6. Use the Plant Applications Administrator to set up using the SSO log-in. (Customer)
Under the listed server, double click to select Administer Site Parameters from Global
Configuration to display the Site Parameters screen. Under Client, click the ellipsis
button (…) in the Edit column. Set the Value to True. Close the panel.
Under Security Management, expand Site Users. Right-click on a user name, and select
Edit <username> Properties. Click the Use SSO Login check box. Supply the SSO ID,
using browse to find the ID if necessary.
NOTE: An asterisk (*) is a valid wildcard to limit searches. For example, enter “John” and “Sm*”
in the First and Last Name fields to search for “John Smith.” You can also limit the the search by
using a partial SSO. For example, enter “2080*” to locate employees with an SSO beginning with
those four digits.

Setting Up an SSO Login for the Web Server
4
When setup is complete, a user logs into the Web Server using SSO. After logging in, the user
should see the Plant Applications Web Server “Welcome” screen with their user name displayed
in the left-hand menu list as shown in the figure.
NOTE: When SSO is set up, the Plant Applications Report Server is accessible only through
SSO authentication. Plant Applications authentication and Windows authentication cannot be
used.
Troubleshooting
If the Plant Applications Web Server “Logon” screen (shown below) is displayed when attempting
an SSO login, you (the customer) should check the CookieInfo.aspx file to verify that GE
Corporate support used the correct headers. If the headers are not correct, contact GE
Corporate support.

Plant Applications Web Reporting
5
Using Command or Link Objects
Use the Command and Link to launch a window inside or outside an Internet Explorer window:
1. Select Tree Configuration in the Plant Applications Web Server Administrator to display
a list of Command or Link objects.
2. Right-click a (New Window) or (Same Window) Command or Link object in the Name
column, and select Copy Node.
3. Right-click on the Default (Tree) icon or a subfolder, and select Paste Node.
4. Right-click on the new object and select Properties to display the Node Properties
window.
5. Enter a URL and set parameters.
The following example demonstrates how to set up a Command or Link object. Begin by copying
an existing URL for a Web Server Report or definition. Paste it in the URL field in the Node
Properties window as shown:
When you access the Web Server viewer, the Command or Link object is displayed in the Users
Tree configuration.
Selecting the object launches a preconfigured URL.
You may want to store predefined SOPs in a specific virtual folder for users to access through the
web. Using the Command Link, you can open specific documents or files, for example, Word for
Windows documents or Excel files. In the next example, a Command or Link object is created to
open a Word for Windows document.

SharePoint Services
6
The URL field in the Node Properties dialog for the object points to TESTDOC.docx.
When a user selects the Command Link from the User Tree in Internet Explorer, a prompt is
displayed to open the document. The document is opened in a Word for Windows window that is
outside of Internet Explorer.
SharePoint Services
If the Plant Applications Web Server is installed on a computer running Windows 2000 Server or
Windows 2003 Server, the Web Parts will run on Windows SharePoint Services.
If you are upgrading from Windows SharePoint Services 2.0 to Windows SharePoint Services
3.0, please go to the Microsoft web site for more information:
http://www.microsoft.com/technet/solutionaccelerators/collaboration/default.mspx
IMPORTANT: SharePoint Portal Services 3.0 installs on port 80, which conflicts with the Plant
Applications Web Server, which also uses port 80. You must change SharePoint to use a
different port, such as port 81 or another port that is not used.
Changing SharePoint Port Number
SharePoint Services 3.0 automatically installs using port 80, which is the port used by the Plant
Applications Web server. You must change the port used by SharePoint.
To change the port used by SharePoint
1. On the Plant Applications Web server, open Internet Information Services (IIS) Manager.
(Start > Administrative Tools > Internet Information Services (IIS) Manager)
2. Expand the server.
3. Expand Web Sites.
4. Right-click SharePoint - 80 and select Properties. The SharePoint – 80 Properties
dialog box appears.
5. On the Web Site tab, under Web site identification, type an unused port number in the
TCP Port box.
6. Click OK.
7. Right-click SharePoint Central Administration v3 and select Browse. The SharePoint
Central Administration page appears.
8. Click the Operations tab.
9. Under Global Configurations, click Alternate access mappings.
10. Under Internal URL, click the URL for the server (for example, http://myservername/.
11. In the URL protocol, host and port box, add the port number you used in step 5 to the
end of the computer name (for example, http://myservername:85/).
12. Click OK.
13. If necessary, start the Default Web Site.
IMPORTANT: Remember to add the port number to the SharePoint URL. For example, if you
used port 81, the URL would be: http://myservername:81.

Plant Applications Web Reporting
7
Web Report Server Administration
The Plant Applications Web Server is configured through the Web Administrator, which is
accessed through the Plant Applications Administrator program. Therefore, the Web
Administrator can be started from any computer that has the Plant Applications Administrator
program installed on it.
You must have at least Manager rights to the Administrator security group to start the Web
Administrator.
You can use the Plant Applications Web Administrator to:
Manage Web Report Server users
Manage Web content
Schedule reports
Configure printers
Configure report parameters
Control and audit operation of Web engines
Logging on to the Web Administrator
To log on to the Web Administrator:
1. Log in to the Plant Applications Administrator program.
TIP: You must have at least Manager rights to the Administrator security group.
2. Expand Server Management.
3. Right-click Administer Web Server and choose Administer Web Server.
4. If necessary, enter your Plant Applications user name and password. Optionally, you can
enter your SSO credentials, which may require the fully qualified domain name (FQDN) if
SSO authentication is enabled.
Managing Web Server Security
The Internet Information Server (IIS) uses standard Windows file and folder permissions as well
as virtual directories to secure the Plant Applications Web site. Virtual directories provide pseudo
folder names and directory to the Internet client while shielding actual names and locations on the
hosting server.
By default, all Web Sites and sub-web sites in IIS have anonymous security. This means that
anyone can request any Web page they like provided they know the file name and location. By
applying windows security to a web site, you can require all visitors to be authenticated with a
standard Windows Domain account.
Also see Setting Up for Using an SSO Login.
To set authentication for PAReporting:

Managing Web Reports
8
1. On the Plant Applications Web Report Server, click Start and open your Windows
Control Panel.
2. Double-click Administrative Tools.
3. Double-click Internet Information Services (IIS) Manager.
4. Locate and click the Default Web Site, which may be located inside other directories.
5. In the Features view, select Authentication from the IIS section.
6. Set Anonymous Authentication to "enabled" and all other authentication options to
"disabled."
Performing System Backups
Performing system backups should be a part of your daily maintenance routine. The key
elements of the Plant Applications Web Server that need to be protected include:
Plant Applications Database (SQL Server)
Plant Applications Web Site (IIS)
Report Templates (MDB, XLT)
Reports
Your organization should have standard measures to adequately preserve and restore a
Microsoft SQL Server Database. This can be done with software, such as Backup Exec or
ARCserve. Additionally, all the files, web pages, and images that make up the Web site, as well
as the configuration data that Internet Information Server uses to make the site available to the
inter/intranet, should be backed up. This will also include all the Report Templates (Access and
Excel documents) and all the reports that were generated.
Refreshing the Server
After you have made changes to the Plant Applications Administrator program, you should
refresh the server to make sure your changes are recognized and have taken affect.
To refresh the server:
Right-click on the server and select Refresh Server from the pop-up menu.
Managing Web Reports
Five Types of Web Content
There are five types of Web content available to you. Four can be used to create Web-based
reports and one can be used to link to internal or external Web sites. Each type is identified with
an icon.
Excel
This icon identifies the Web content as an Excel-based report type.
This icon identifies the Web content as an Excel-based report definition.

Plant Applications Web Reporting
9
Access
This icon identifies the Web content as an Access-based report type.
This icon identifies the Web content as an Access-based report definition.
Active Server Page
This icon identifies the Web content as an Active Server Page report type.
This icon identifies the Web content as an Active Server Page report definition.
Active Server Application
This icon identifies the Web content as an Active Server Application report type.
This icon identifies the Web content as an Active Server Application report definition.
Internal or External Web site
This icon identifies the Web content as a link to an external or internal Web site. The page will
open in a new window (browser).
This icon identifies the Web content as a link to an external or internal Web site. The page will
open in the same window (browser).
Customizing a Web Page
You can customize Web page titles and prompts on each Web page, add or remove parameters,
and add or remove dependencies.
To customize a Web page
1. Log on to the Web Administrator. How?
2. Open the Web Server folder.
3. Click the Dialogs folder to display the Web pages in the right pane.
4. In the right pane, right-click on a Web page and click Properties. The Configure <web
page name> dialog box appears.
5. Do one or more of the following:
Click the Web Page tab to change the following:
o In the Path box, type the path to the Web page or click to locate the Web page.
o In the Page Title box, type the title of the Web page.
o In the Tab Description box, type the description that you want to appear on the Web page tab. If no description is typed, the Page Title will be used for the Tab Description.
o In the Prompt 1 box, type the new name for the first prompt.
o In the Prompt 2 box, type the new name for the second prompt.
o In the Prompt 3 box, type the new name for the third prompt.
o In the Prompt 4 box, type the new name for the fourth prompt.
o In the Prompt 5 box, type the new name for the fifth prompt.

Managing Web Reports
10
Click the Parameters tab to add or remove the parameters that will be available when
you include this Web page in a new Report Type.
Click the Dependencies tab to add or remove dependencies that will be included if you
create a Plant Applications Report Package.
6. Click OK.
Adding New Content to the Web Server
Through the Web Administrator, you can add new content to the Web server. Once you've added
the new content, you can make it available to the Plant Applications users.
To add new content
1. Open the Plant Applications Web Administrator. How?
2. Right-click on the Web Content folder and click Add. The Report Type Properties
dialog box appears
3. Click the General tab, do the following:
a. In the Template Name box, type the name of the template. This is the name that
will be displayed in the Web Content folder.
b. In the Class Name box, select the type of content you want to add from the drop-
down list.
c. In the Path box, type the location (the full path) of the file, or click Browse and
navigate to the file's location.
d. In the Stored Procedure box, you can attach a stored procedure if you selected
a Class Name of either Active Server Page or Active Server Application.
How?
e. In the Report Type Version box, enter the version number. By default the
version number is 1.
f. optional: In the Min. Server Version box, type the minimum version number this
Report Type will be compatible with or click to enter the current server version
number.
g. optional: In the Description box, type a brief description of the report type.
h. optional: In the Owner box, select an owner from the drop-down list. This is
used to identify the person who created the new Report Type.
i. optional: In the Security Group box, select a security group from the drop-down
list.
j. optional: In the File Name box, to save the file to the database, type the file
name, then click and browse to the file you want saved to the database.
k. optional: Select the Send Parameters check box to pass the report parameters
via the URL. If this is a user-defined Active Server Page or Active Server
Application report, this option must be selected.
l. optional: Select the Force Run Mode check box to automatically run the report
when it is clicked in the browser. If this option is selected, the report dialogs will
not open; the report will automatically run as originally configured.

Plant Applications Web Reporting
11
4. Click the Display tab to determine the type of output and to change the number of printed
copies.
a. Under File Output select the type of file you want to create. The selection you
made in step 3.b will determine the types of files you can create.
b. Under Screen Output, select the file format you want to display in the browser.
The available options in each of the drop-down lists will be determined by the
selections you made in step 4.a.
c. Under Printed Output, double-click the printer to change the number of printed
copies.
5. Click the Web Pages tab to select the Web pages that will be used to create the content
of the report type.
a. Under Available Web Pages, select the Web page(s) you want to use to create
your report type. Click Move Selected to add the selected web page(s) to
the Used Web Pages list or click Move All to move all of the Web pages to
the Used Web Pages list.
b. Click Up or Down to specify the order that the pages will be presented
to the user when they run the report.
6. Click the Parameters tab to edit the parameter default values by double-clicking on the
default value you want to change. To make the parameter optional, select the Optional
check box.
The list of parameters is determined by the Web pages you selected in step 5.
7. Click the Dependencies tab to include dependencies, such as stored procedures, files or
Web dialogs. These dependencies are included when you export the report type as a
Plant Applications Report Package (.prp).
a. Click Add.
b. In the Add Dependency dialog box, do one of the following:
o Select Stored Procedure and then click Browse to add a stored procedure.
o Select File or Web Dialog, select an FTP Location Prefix, then click and
browse to the file or web dialog you want to add as a dependency.
c. Click OK.
8. Click OK.
After creating your new Web content, you'll need to make it available for use. For more
information, see the topic Configuring Web Content for Users.
Viewing SQL Server Report Services Reports
Using SQL Server Reporting Services, developers can create reports using Microsoft Visual
Studio. After reports have been deployed to IIS (Internet Information Services), the reports can be
run and viewed from the Plant Applications Web Report server.
After the report and been created and deployed, there are five site parameters that must first be
configured.

Managing Web Reports
12
SQL Reporting Services Database Name
SQL Reporting Services http Location
SQL Reporting Services Password
SQL Reporting Services Server Name
SQL Reporting Services Username
For information on configuring these five site parameters, see SQL Reporting Services Site
Parameters.
After you have configured the site parameters, there are steps required to create a Plant
Applications report type that acts as a shell pointing to the SQL report.
To create a Plant Applications report type
1. Open the Plant Applications Web Administrator. How?
2. Right-click Web Content and click Add. The Report Type Properties dialog box
appears
3. Click the General tab, do the following:
a. In the Template Name box, type the name of the template. This is the name that
will be displayed in the Web Content folder.
b. In the Class Name box, select SQL Report.
c. In the Path box, click the Browse button . The SQL Reporting Services URL
Builder dialog box appears.
4. Next to the Report Name + Path box, click the Browse button . The SQL Report
Browser dialog box appears.
5. Select the report and click OK. The SQL Report Browser dialog box closes and you are
returned to the SQL Reporting Services URL Builder dialog box.
6. Under Available Parameters, double-click the parameters needed to create the report.
7. Click OK. The SQL Reporting Services URL Builder dialog box closes and you are
returned to the Report Type Properties dialog box with the correct URL in the Path box.
8. Click the Display tab to determine the type of output and to change the number of printed
copies.
a. Under File Output select the type of file you want to create. The selection you
made in step 3.b will determine the types of files you can create.
b. Under Screen Output, select the file format you want to display in the browser.
The available options in each of the drop-down lists will be determined by the
selections you made in step 8.a.
c. Under Printed Output, double-click the printer to change the number of printed
copies.
9. Click the Web Pages tab to select the Web pages that will be used to create the content
of the report type.
a. Under Available Web Pages, select the Web page(s) you want to use to create
your report type. Click Move Selected to add the selected web page(s) to
the Used Web Pages list or click Move All to move all of the Web pages to
the Used Web Pages list.

Plant Applications Web Reporting
13
b. Click Up or Down to specify the order that the pages will be presented
to the user when they run the report.
c. Click Apply.
10. Click the Parameters tab to edit the parameter default values by double-clicking on the
default value you want to change. To make the parameter optional, select the Optional
check box.
The list of parameters is determined by the Web pages you selected in step 9.
11. Click OK.
After creating your new Web content, you'll need to make it available for use. How?
Creating a New Report Definition
If you find that you run the same report with the same information over and over, you can create a
Report Definition, which will save your options and prevent you from having to select any option.
Then, you can simply run the Report Definition without having to select the same options each
time you run the Report Type.
You can create a report definition in
The Web Server Administrator
The Web Client
For more information on creating report definitions in the Web Client, see Creating a new Report
Definition.
To create a report definition from the Web Server Administrator
1. Log in to the Web Server Administrator. How?
2. Expand Web Content.
3. Right-click the report type from which you want to create your report definition and
choose Create Definition. The web pages for configuring the report appear.
4. Make any changes in the web pages. On the Finish tab, type a name for your report
definition and click Submit. The report definition is saved under the originating report
type.
Changing Report Definition Properties
Report definition properties enables you to edit your report definition. Report definition properties
define various characteristics of the report, such as name and web pages. Report definition
properties is also where a security group and owner can be assigned.
To change report definition properties
1. Log in to the Web Server Administrator. How?
2. Expand Web Content.
3. Right-click the report definition and select Properties. The Report Definition Properties
dialog box appears.
4. Make any desired changes and click OK.

Managing Web Reports
14
Report Packages
Plant Applications Report Packages are collections of new Report Types and supporting web
pages and updates. A growing library of packages are available on the GE Intelligent Platforms
Support web site (https://digitalsupport.ge.com). Browse to the support web site and download
the package(s) of your choice.
Importing a Plant Applications Report Package
To import a Report Package
1. Log on to the Web Administrator. How?
2. Do one of the following:
From File menu, click Import Package.
Right-click the Web Content folder and click Import on the pop-up menu.
3. Select a Plant Applications Report Package from the Open File dialog box and click
Open.
Exporting a Plant Applications Report Package
In addition to importing packages, the Plant Applications Web Administrator can export existing
Report Types and Web pages.
To export a report package
1. Log on to the Web Administrator. How?
2. Open the Web Content folder.
3. Right-click the Report Type or Web page and click Export.. The Save Export Package
As dialog box appears.
4. Type a file name (The file name must include the .prp file extension) and navigate to
where you want to save the report package.
5. Click Save.
Once exported, the PRP file can be distributed to any Plant Applications Web Server.
Editing Web Content
The parameter values for each report definition are inherited from its parent Report Type and
possibly modified from the Web Report Server. The navigational path for each report definition is
also inherited from the parent Report Type. Any or all of the parameters and navigational path for
a report can be modified.
To modify a report
1. Log on to the Web Administrator. How?
2. Open the Web Content folder.
3. Right-click on the Web content that you want to modify and click Properties. The Report
Type Properties dialog box appears.

Plant Applications Web Reporting
15
4. Click the General tab, and change any of the following:
a. In the Template Name box, type the name of the template. This is the name that
will be displayed in the Web Content folder.
b. In the Class Name box, select the type of content you want to add from the drop-
down list.
c. In the Path box, type the location (the full path) of the file, or click Browse and
navigate to the file's location.
d. In the Stored Procedure box, you can attach a stored procedure if you selected
a Class Name of either Active Server Page or Active Server Application.
How?
e. In the Report Type Version box, enter the version number. By default the
version number is 1.
f. optional: In the Min. Server Version box, type the minimum version number this
Report Type will be compatible with or click to enter the current server version
number.
g. optional: In the Description box, type a brief description of the report type.
h. optional: In the Owner box, select an owner from the drop-down list. This is
used to identify the person who created the new Report Type.
i. optional: In the Security Group box, select a security group from the drop-down
list.
j. optional: In the File Name box, to save the file to the database, type the file
name, then click and browse to the file you want saved to the database. To
retrieve the file and save it locally, click .
k. optional: Select the Send Parameters check box to pass the report parameters
via the URL. If this is a user-defined report or an ASP.NET report, the option
must be selected.
l. optional: Select the Force Run Mode check box to automatically run the report
when it is clicked in the browser. If this option is selected, the report dialogs will
not open; the report will automatically run as originally configured.
5. Click the Display tab to determine the type of output and to change the number of printed
copies.
a. Under File Output select the type of file you want to create. The selection you
made in step 4.b will determine the types of files you can create.
b. Under Screen Output, select the file format you want to display in the browser.
The available options in each of the drop-down lists will be determined by the
selections you made in step 4.a.
c. Under Printed Output, double-click the printer to change the number of printed
copies.
6. Click the Web Pages tab to select the Web pages that will be used to create the content
of the report type.
a. Under Available Web Pages, select the Web page(s) you want to use to create
your report type. Click Move Selected to add the selected web page(s) to
the Used Web Pages list or click Move All to move all of the Web pages to
the Used Web Pages list.

Managing Web Reports
16
b. Click Up or Down to specify the order that the pages will be presented
to the user when they run the report.
7. Click the Parameters tab to edit the parameter default values by double-clicking on the
default value you want to change. To make the parameter optional, select the Optional
check box.
The list of parameters is determined by the Web pages you selected in step 5.
8. Click the Dependencies tab to include dependencies, such as stored procedures, files or
Web dialogs. These dependencies are included when you export the report type as a
Plant Applications Report Package (.prp). Do one of the following:
a. Click Add and in the Add Dependency dialog box, do one of the following:
o Select Stored Procedure and then click to add a stored procedure.
o Select File or Web Dialog, select an FTP Location Prefix, then click and
browse to the file or Web dialog you want to add as a dependency.
b. Click Remove to remove a dependency.
9. Click OK.
10. Click OK.
View Settings
View Settings determine the format that the user will be able to view Web content when they log
in to the Web Report Server via their browser. When a Report Type is created and edited, the
image and native formats are defined on the Display tab of the Report Type Properties dialog
box.
To determine a user's view settings
1. Log on to the Web Administrator. How?
2. Open the User Trees folder.
3. Open the desired tree.
4. Click on Tree Users to display the list of users in the right-hand pane.
5. In the right-hand pane, right-click on the desired user and click Properties. The User
Properties For: <user name> dialog box appears.
6. Under View Settings, select one of the following options:
Report Images Only: This option limits the user to viewing only images of generated
reports. Report images formats can be HTML, PDF or SNP.
Images and Native Documents: Native format is the actual native documents and can
be HTML or XLS files. This option allows the user to view both the report image and
native format of reports.
7. Click OK to save your changes and close the dialog box.
Controlling Report Security

Plant Applications Web Reporting
17
Report security is based on the configuration of the user tree. Every member of a user tree has
access to everything listed in the user tree's Tree Configuration. When you add content to the
tree configuration, every member of the user tree will at least be able to view the content.
What an individual member is able to do with the content is controlled by the user properties. By
setting the user properties for each member of the tree, you can control what each member can
do with the contents of the tree configuration. Keep in mind that the user properties control
access at the user level, not the report level. In other words, the user properties will apply to all
the content that the individual member has access to.
Scheduling a Report
Scheduling a report will allow it to run repeatedly at specific intervals. If a Web client is viewing a
report that is scheduled, they can be sure they are looking at the most current data available. The
client’s browser will continually refresh itself and request the latest copy of the report.
Page Caching must be turned off on the client browser. If it is not, when your browser requests
the latest copy of a previously viewed report, you will get the cached report, rather than the report
with the most current data.
You can schedule only ASP (Active Server Page) report definitions. You can not schedule
ASA (Active Server Application) reports.
A report can't have more than one schedule. If you want the same report to run on more than one
schedule, create multiple report definitions and schedule them separately.
You can schedule a report from the Schedule queue or you can select a report in the Web
Contents folder and schedule it from there.
To schedule a report:
1. Log on to the Web Administrator. How?
2. Do one of the following:
To schedule a report from the Schedule queue:
a. Open the Current Activity folder.
b. Right-click Schedule and select Schedule New Report from the pop-up menu.
c. In the Available Reports dialog box, select a report and click OK.
To schedule a report from the Web Contents folder:
a. Open the Web Contents folder.
b. Locate the specific report definition, right-click on it and select Schedule
Definition from the pop-up menu.
The Schedule Definition option will not be available if the report is currently scheduled.
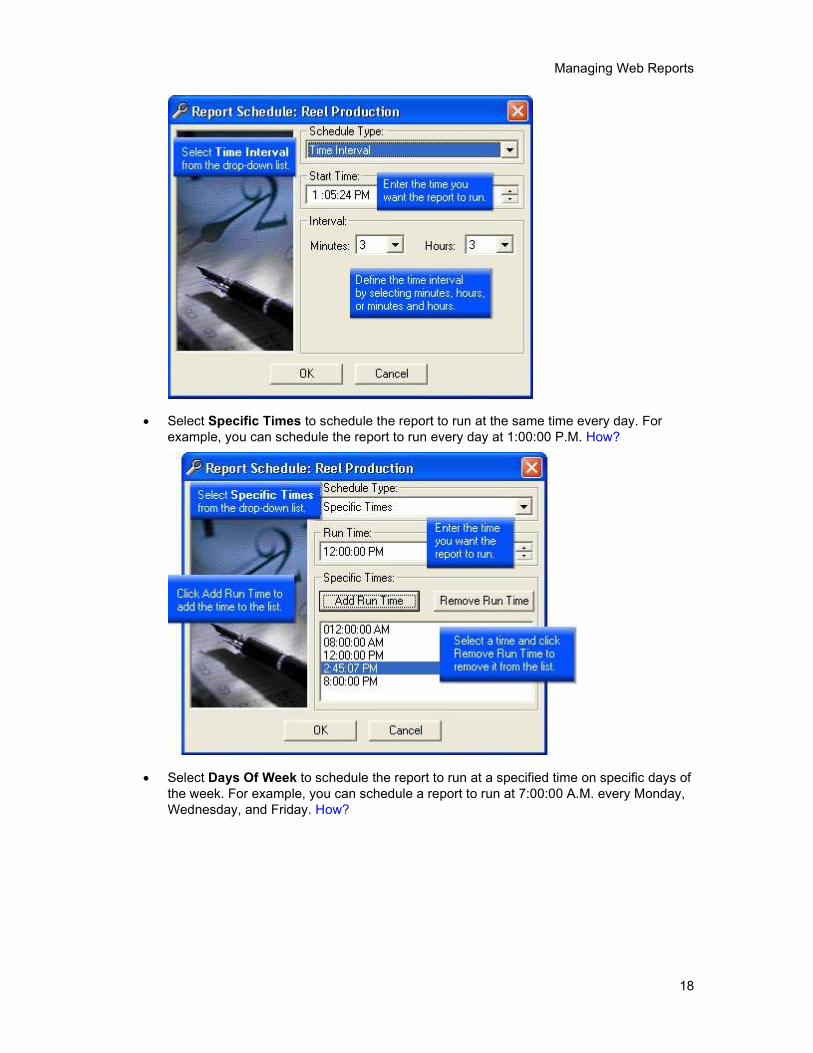
3. In the Report Schedule dialog box, under Schedule Type:
Select Time Interval to schedule the report to run in minute or hour intervals. For
example, you can schedule a report to run every five minutes, or every five hours, or
even every five hours and five minutes. How?
Managing Web Reports
18
Select Specific Times to schedule the report to run at the same time every day. For
example, you can schedule the report to run every day at 1:00:00 P.M. How?
Select Days Of Week to schedule the report to run at a specified time on specific days of
the week. For example, you can schedule a report to run at 7:00:00 A.M. every Monday,
Wednesday, and Friday. How?

Plant Applications Web Reporting
19
Select Monthly to schedule the report to run on a specific day of the month (for example,
the 15th) or a specific day of the week (for example, the 2nd Monday of the month).
How?
4. Click OK.
To change a report's schedule:
1. Log on to the Web Administrator. How?
2. Open the Current Activity folder.
3. Click Schedule to display the scheduled reports in the right pane.
4. Right-click on the desired report and select Schedule Properties from the pop-up menu.
5. In the Report Schedule dialog box, under Schedule Type:

Managing Web Reports
20
Select Time Interval to schedule the report to run in minute or hour intervals. For
example, you can schedule a report to run every five minutes, or every five hours, or
even every five hours and five minutes. How?
Select Specific Times to schedule the report to run at the same time every day. For
example, you can schedule the report to run every day at 1:00:00 p.m. How?
Select Days Of Week to schedule the report to run at a specified time on specific days of
the week. For example, you can schedule a report to run at 7:00:00 a.m. every Monday,
Wednesday, and Friday. How?

Plant Applications Web Reporting
21
Select Monthly to schedule the report to run on a specific day of the month (for example,
the 15th) or a specific day of the week (for example, the 2nd Monday of the month).
How?
6. Click OK.
Running a Scheduled Report
Even though a report is scheduled, you can force it to run immediately without having to wait for
the next scheduled time.
To force a scheduled report to run
1. Log on to the Web Administrator. How?

Managing Web Reports
22
2. Open the Current Activity folder.
3. Click Scheduled to display the list of scheduled reports in the right pane.
4. In the right pane, right-click on the report you want to run now and click Force Report To
Run.
5. Click Yes to run the report immediately.
Printing Reports
Not only can you display reports in your browser, but you can also automatically print the report. If
you schedule a report, you can have the report print based on the scheduled run time.
NOTE: Printing and scheduling reports created from Active Server Applications (.ASPX) is not
supported in this version of Plant Applications. If you do print a report, you will get unexpected
and inaccurate results.
To print a report
1. Log on to the Web Report client. How?
2. Click the report you want to print.
3. After the report runs, click on the Plant Applications Report Server toolbar.
If the report has multiple pages or sheets, select the sheet you want to print.
To schedule a report to print
1. Log on to the Web Administrator. How?
2. Open the Web Content folder.
3. Right-click on the report that you want to print and click Properties. The Report Type
Properties: <report name> dialog box appears.
4. Click the Display tab.
5. Under Printed Output, select the printer.
6. To change the number of printed copies, double-click the selected printer and enter the
number of copies in the Edit Copies dialog box.
7. Click OK.
8. Click OK.
9. Schedule the report.
Removing Reports from the Print Queue
You can remove one or more reports from the Print Queue if you decide not to print the report(s).
To remove reports from the Print Queue
1. Log on to the Web Administrator. How?
2. Open the Current Activity folder.
3. Do one of the following:

Plant Applications Web Reporting
23
To remove all reports, right-click Print Queue and click Remove All.
To remove one report, right-click the report and click Remove.
Removing Reports from the Engine Queue
You can remove one or more reports from the Engine Queue if you decide not to process the
report(s).
To remove reports from the Engine Queue
1. Log on to the Web Administrator. How?
2. Open the Current Activity folder.
3. Do one of the following:
To remove all reports, right-click Engine Queue and click Remove All.
To remove one report, right-click the report and click Remove.
Creating Default Web Reports
To help you get up and running with Plant Applications, you can automatically create default Web
reports. Based on your configurations, Plant Applications will automatically create a variety of pre-
configured Web reports.
You can either create a new User Tree from the Web Administrator, which you can then select
when you create your default reports, or you can simply let Plant Applications automatically
create a User Tree, called Plant Model, for you.
Plant Applications will create the necessary Web reports for the selected level and all levels to
which the selected level belongs. For example, if you select a Production Unit, all necessary Web
reports will be created for the selected Production Unit, the Production Line that the Production
Unit belongs to, and the Department. If you select a Production Line, all necessary Web reports
will be created for all Production Units that belong to the Production Line, the Production Line,
and the Department that the Production Line belongs to.
Select this: Get Web reports for this:
Department All Production Lines under the Department
All Production Units under the Department
Production Line Selected Production Line
All Production Units under the selected Production Line
Production Unit Production Line the Production Unit belongs to
Selected Production Unit
To automatically create default Web reports
1. Log in to the Plant Applications Administrator.

Managing Web Reports
24
2. Open the Plant Model and select the desired Department, Production Line, or Production
Unit. Right-click and click Create Default Reports. The Tree Selection dialog box
appears.
3. Do one of the following:
Select an existing User Tree and click OK.
Click OK to create the default User Tree, Plant Model.
If you have an existing User Tree named Plant Model, clicking OK will simply append any new
reports to the existing Plant Model User Tree configuration.
4. In the Create Default Reports dialog box, review the message logs and click OK.

Plant Applications Web Reporting
25
To view the Web reports
1. Open the Plant Applications Web Administrator. How?
2. Double-click on User Trees.
3. Double-click on the User Tree that you selected when you created the default reports.
4. Click on Tree Configuration.
5. In the middle pane, click to expand the levels of the report tree.
Editing Report Parameters
You can define the options selected when you configure your web report so that each time the
report is run, your specified options will always be pre-selected.
To edit the default parameters
1. Log on to the Web Administrator. How?
2. Expand the Web Content folder.
Managing Web Reports
26
3. Right-click on the web report you want to modify and click Edit Default Parameters. The
ASP pages appear.
4. Click the various tabs and make your changes.
5. When finished, click the Finish tab and click Submit to save your changes.
Previewing a Web Report
You can configure and preview a web report prior to adding it to a user’s Configuration tree.
To preview a web report
1. Log on to the Web Administrator. How?
2. Expand the Web Content folder.
3. Right-click on the web report you want to preview and click View. The ASP pages
appear.
4. Click the various tabs and make your changes.
5. When finished, click the Finish tab and click Submit. Your web report will appear.
Using the URL to Call Reports and Definitions
You can use the URL to call ASP Report Types and ASP Definitions directly via URL. You must
know what Report Type or Report Definition you want.
To determine the Report_Type_IDs or Report_IDs
1. Open the Web Server Administrator.
2. Open the Web Content folder.
3. Click on either a Report Type or Report Definition.
4. Look at the status bar on the bottom of the Web Server Administrator.
If it is a Report Type, the status bar will display "Types" and show the ID of the Report
Type that is selected.
If it is a Report Definition, the status bar will display "Definitions" and show the ID of the
Definition that is selected.
To create a new report from a report type
In this example, the Report_Type_Id = -4 (which is the Variable Conformance Report. Inventory
Report = -10)
http://<YourServerName>/PAReporting/Viewer/rsFrontDoor.asp?ReportTypeId
=-4
To view an existing report
In this example, the local Report_Id = 672
http://<YourServerName>/PAReporting/Viewer/rsFrontDoor.asp?ReportId=672
Examples

Plant Applications Web Reporting
27
In the examples below, the following information will be used:
Report_Type_Id = -4
StartTime and EndTime will be user defined, therefore, the TimeOption parameter must
be set to 0.
Master unit ID = 2
Variable IDs = 124,120,121,122,123,13
Product IDs = 3,4,5,6
To create a new report from a report type and pass in parameters:
http://YourServerName/PAReporting/Viewer/rsFrontDoor.asp?ReportTypeId=-
4&TimeOption=0&StartTime=2005-08-20 7:00:00AM&EndTime=2005-08-25
7:00:00AM&MasterUnit=2&variables=124,120,121,122,123,13&Products=3,4,5,
6
To create new report from a report type, pass in parameters and have the report automatically
execute without user intervention:
http://YourServerName/PAReporting/Viewer/rsFrontDoor.asp?ReportTypeId=-
4&TimeOption=0&StartTime=2005-08-20 7:00:00AM&EndTime=2005-08-25
7:00:00AM&MasterUnit=2&variables=124,120,121,122,123,13&Products=3,4,5,
6&ForceRunMode=1
Report Schedule
The Schedule contains a list of all the reports currently set to run at a particular interval. The
queue contains a list of all the reports the Plant Applications Report Schedule Service has
determined need to run and are waiting to be picked up by a Report Engine.
Report Types
A Report Type is a template used to create any number of reports. To re-configure or view the
information that each Report Type uses, right-click on a Report Type and select Properties from
the pop-up menu.
Searching for a Saved Batch Analysis
To search for a saved Batch Analysis
1. Log in to the Plant Applications Web Report Server. How?
2. If necessary, expand the report tree in order to see Batch Analysis.
3. In the report tree, click Batch Analysis.
4. In the Saved Batch Analysis page, do one of the following:
To find all saved batch analysis reports, click Search.
To filter your results, type all or part of the batch analysis report name and then click
Search.
5. In the list of returned reports, click the hyperlinked name. This will open the Query
Results page.

Printers
28
Printers
In the Web Administrator, the Printers folder contains all the printers that are installed and
available for your system to use. These can range from real printers, such as a laser or ink jet
printer to virtual printers. A distiller printer is set up during installation.
Adding a Printer
Before you can print Web content, the printer must be made available to the Web Report Server.
Through the Web Administrator, you can add both virtual printers such as a distiller printer and
real printers for printing the Web content and reports.
You can add only installed printers.
To add a printer:
1. Log on to the Web Administrator. How?
2. Open the Web Server folder.
3. Right-click on the Printers folder and click Configure. The Configure Printers dialog
box appears
4. Select the printer(s) in the Available list and click Add Selected .
5. Click OK to save your changes and close this dialog box.
Removing a Printer
If a printer no longer is available, has been moved to a different server, or is simply no longer
needed by the Plant Applications Web Report Server, you can easily remove it from the list of
printers.
NOTE: Removing a printer is not the same as un-installing it or deleting it. The printer will still be
available to other programs and can be made available to the Plant Applications Web Report
Server again.
To remove a printer:
1. Log on to the Web Administrator. How?
2. Open the Web Server folder.
3. Right-click on the Printers folder and select Configure from the pop-up menu.
4. In the Configure Printers dialog box, select the printer(s) in the Used list and click
Remove Selected .
5. Click OK to save your changes and close this dialog box.
Report Engines

Plant Applications Web Reporting
29
The Plant Applications Report Engine is a service that performs the work of creating a report in
conjunction with a VBA-supporting office application, such as Microsoft Excel. Engines can be
running on the Plant Applications Web Report Server or remotely on computers distributed across
your network.
Each Report Engine bids for work and when completed, publishes the content to the Plant
Applications Web Report Server site or directs the output to a printer.
The Engines folder contains a list of all the Report Engines that are currently configured for your
system. By clicking on each engine, you can view that engine’s activity log. Additionally, by right-
clicking on the Engines folder, you can add an engine and configure error messages for all
engines in the folder.
Configuring Report Engines Errors
You can control how the report engines respond when encountering an error while running a
report. For example, if you are doing any error checking in an Excel template, you can determine
how the report engine will respond when encountering a specific error.
For each error, you can elicit one of six responses:
Shut down the engine
Shut down the VBA application (for example, Excel)
Increment the Report Run counter
Increment the Engine Fail counter
Increment the Report Run and the Engine Fail counters
Do nothing
To configure report engine errors:
1. Log on to the Web Administrator. How?
2. Open the Web Server folder.
3. Right-click on the Engines folder and select Configuration. The Engine Error
Configuration dialog box appears
4. Do the following:
a. In the Error ID column enter the error ID used in your VBA application.
b. In the Description column enter a description of the error.
c. In the Response column select one of the responses from the drop-down list.
d. Click OK to save your changes and close the dialog box.
Controlling the Web Engines
All the elements the engine can control come in the form of parameters. Each Report Type has
the following parameters:
Engine Parameters

Parameters
30
Engine
Parameter
Description
ReportTimeout The number of minutes a report will run before timing out.
FileLocation The FTP path to the report and should be in the form of <name of ftp server>/<sub folder name>.
ServerFileLocation The actual file path to the report <C:\Report Server\Reports\>.
PrintStyles Indicates the type of output the engine is to produce and can be in the form of any one or more of the following:
1 = Paper: A print style of 1 indicates the engine will print to a physical printer attached to the host computer either locally or via the network. In this case, the ID of a valid printer must be in the Printers parameter. Ex. PrintStyles = 1, Printers = 9 would printer a paper copy to printer nine.
2 = HTML: A print style of 2 would cause the engine to create an HTML version of the report.
3 = PDF: A print style of 3 would cause the engine to create an Acrobat PDF version of the report. Acrobat must be installed on the host computer.
4 = SNP: A print style of 4 would cause the engine to create an Access Snap Shot version of the report. Access must be installed on the host computer.
5 = XLS: A print style of 5 would cause the engine to save the report as an Excel .xls file.
Printers A collection of valid paper printer IDs configured in the system. If no physical printer will be used, PrintStyles should contain a value of 1 otherwise the ID of the printer(s) being used in a comma separated string. (i.e. 4,9,12,?
AppName The name of the application, such as Excel or Access, that will be used to create a report.
TimeOption Used to dynamically configure the Start Time/Date and End Time/Date parameters.
Viewing a Report Engine's Activity
You can view a log of activity for each Report Engine. The EngineLoggingLevel site parameter
determines the level of error messages that will be recorded by the report engine. The number of
days error messages are kept are determined by the site parameter, LogfilePurgeDays.
To view a Report Engine's activity:
1. Log on to the Web Administrator. How?
2. Open the Web Server folder.
3. Open the Engines folder.
4. Click on a Report Engine to display the activity messages in the right pane.
Deleting Report Engine Messages
You can delete one or more messages in the Report Engine activity log.
To delete messages:
1. While viewing the report engine's messages, select one or more messages.
2. Right-click on the selected message(s) and choose Delete Message.
Parameters

Plant Applications Web Reporting
31
Adding Parameters
You can create and add parameters to use in creating or editing Web content.
To add a parameter:
1. Log on to the Web Administrator.
2. Open the Web Server folder.
3. Right-click on Parameters and select Add. The Create New Parameter dialog box
appears.
4. Do the following:
a. In the Name box, type the name of your new parameter.
b. In the Type box, select the type of data used by the parameter.
c. optional: In the Group box, select a group type from the drop-down list.
d. optional: In the SP Name box, enter the name of the stored procedure.
The stored procedure that you enter in the SP Name box will determine the choices you are
presented with when you attempt to modify parameter data for this parameter (using the Web
Administrator).
e. optional: If the stored procedure allows for the selection of multiple values,
select the Select Multiple Values option.
f. If you want the parameter to be a default (or system) parameter, select Include
as Default Parameter.
g. optional: In the Default Value box, type the default value.
h. optional: In the Description box, type a brief description of the parameter.
i. Click OK.
Editing Web Server Parameters
When you edit a parameter, you can change:
The default value
The description
Whether it is a default parameter
To edit a parameter:
1. Log on to the Web Administrator. How?
2. Open the Web Server folder.
3. Click the Parameters folder.
4. In the right pane, right-click the parameter you want to edit and select Properties. The
Report Parameter Properties dialog box appears.
5. Do one or more of the following:
a. Select or clear the Include as Default Parameter option.
b. In the Default Value box, type a new default value.

Dialogs
32
c. In the Description box, type a new description or edit an existing description.
6. Click OK.
Deleting Web Server Parameters
You can delete any of the Web Server parameters.
Keep in mind that if you delete a parameter, it will be deleted from all Report Types and Report
Definitions that use the parameter.
To delete a parameter:
1. Log on to the Web Administrator. How?
2. Open the Web Server folder.
3. Click on the Parameters folder.
4. In the right pane, right-click on the parameter you want to delete and click Delete.
5. Click Yes to confirm the deletion.
Dialogs
Adding Dialogs (Web pages)
Dialogs are used to create new Web content. You can add dialogs and then use the dialogs to
create a new Report Type.
To add a new dialog:
1. Log on to the Web Administrator. How?
2. Open the Web Server folder.
3. Right-click on the Dialogs folder and click Add. The Configure Report Web Page dialog
box appears
4. Do the following:
a. On the Web Page tab, enter the following information:
o In the Path box, type the path to the ASP or HTML file. You can click to locate
the file.
o In the Page Title box, type the title for the page.
o optional: In the Tab Description box, type the name you want displayed on the
tab. If you do not type a description, the page title will be used.
o optional: In the Prompt boxes, type the text you want to use to override the
default prompts.
b. On the Parameters tab, select the parameters you want to add to the dialog and
click .
c. On the Dependencies tab, click Add to add either stored procedures or
additional files or dialogs.
d. Click OK to save your changes and to close the dialog box.

Plant Applications Web Reporting
33
Editing Dialogs (Web Pages)
You can change any of the properties of Web dialogs.
To edit dialogs:
1. Log on to the Web Administrator. How?
2. Open the Web Server folder.
3. Click on the Dialogs folder.
4. In the right pane, right-click on the dialog you want to edit and click Properties. The
Configure <dialog name> dialog box appears.
5. Do one of the following:
a. Click the Web Page tab to change the path to the source file, change the page
title, the tab description, or the prompts.
b. Click the Parameters tab to add new parameters or remove parameters.
c. Click the Dependencies tab to add or remove dependent stored procedures or
files.
d. Click OK.
Exporting Web Pages (Dialogs)
After you create new dialogs or configure existing dialogs, you can export them to other servers
or local machines.
To export a Web page (dialog):
1. Log on to the Web Administrator. How?
2. Open the Web Server folder.
3. Click the Dialogs folder.
4. In the right pane, right-click on a dialog (Web page) and click Export Web Page. The
Save Export Package As dialog box appears.
5. Navigate to where you want to save the Plant Applications Report Package, type a new
file name, if desired, and click Save.
Deleting Dialogs (Web pages)
When you delete a dialog, the source file still remains, but all of the changes are gone and the file
is deleted from the list of available dialogs. Furthermore, the dialog will be deleted from any
Report Type or Report Definition that uses the dialog.
To delete a dialog:
1. Log on to the Web Administrator. How?
2. Open the Web Server folder.
3. Click the Dialogs folder.
4. In the right pane, right-click on the dialog you want to delete and click Delete.

Time Options
34
5. Click Yes to confirm the deletion.
Time Options
What are Time Options?
Time options are pre-defined time parameters that are used on any dialog that uses start or end
times. In addition to the seven pre-defined options, you can create user-defined time options.
There is a template provided to aid you in defining your time options.
Time options are defined by both date and time. In Time Options, you can define the date portion.
There are two site parameters that are used to define the time portion: EndOfDayHour and
EndOfDayMinute.
Viewing Time Options
You can view the start and end times for all your defined time options.
To view your time options:
1. Log on to the Web Administrator. How?
2. Open the Web Server folder.
3. Click on the Time Options folder to display the time options in the right pane.
Creating Time Options
In addition to the seven pre-defined time options, you can also create your own, user-defined time
options. To aid you in this text, we have included a template of the SQL code necessary to define
your time option.
This function allows you to define the date portion of your start and end times. To define the time
portion of your time option, you need to set the EndOfDayHour and EndOfDayMinute site
parameters.
To create a time option:
1. Log on to the Web Administrator. How?
2. Open the Web Server folder.
3. Right-click on the Time Options folder and click Add.
4. After reading the message, click OK. The Time Option dialog box appears.
5. Make the necessary changes to the SQL code.
6. Click Test to view your newly defined Start or End time.
7. Click OK to save your changes and close the dialog box.
Editing Time Options
You can edit only your user-defined time options. For the seven default time options, you can only
view the SQL code and the defined start and end time.

Plant Applications Web Reporting
35
To edit a time option:
1. Log on to the Web Administrator. How?
2. Open the Web Server folder.
3. Click the Time Options folder to display the time options in the right pane.
4. Right-click on the desired time option and select Properties from the pop-up menu.
5. In the Time Option dialog box, make your changes.
Keep in mind that you can edit only user-defined time options. You can only view the default time
options.
6. Click Test.
7. Click OK to save your changes and close the dialog box.
Deleting Time Options
You can delete only your user-defined time options.
To delete a user-defined time option
1. Log on to the Web Administrator. How?
2. Open the Web Server folder.
3. Click the Time Options folder to display the time options in the right pane.
4. Right-click on the user-defined time option that you want to delete and select Delete from
the pop-up menu.
5. Click Yes to confirm the deletion.
Managing Web Users
Organizing the Client Environment
Organizing Users and Templates
Within the Web Administrator, you determine which site users can use the Web Report Server,
the content those users have access to, and what the users can do with the content.
A Tree Template models what the user can see when they log on to the Report Server through
their browser. This is the primary means of organizing content and controlling security to that
content. A user cannot access information or reports not explicitly added to the Tree Template for
that user (or group of users).
The concept of a template is used to allow several users with the same job functions or concerns
to share the same Tree. This allows an administrator to maintain the Web Client environment for
many users at the same time and provides a consistent look and feel to end users.
It is very easy to initially start with a single Tree Template and apply it across all users. As needs
develop further, it is easy to create new Tree Templates and re-arrange users without disrupting
the operation of the system.

Managing Web Users
36
Organizing Tree Templates
This tree should be organized with the most important information at the top of the tree and within
the first level of the tree. Content should be organized by area of the plant and/or by operational
topic, such as Quality or Efficiency.
User Trees
User Trees help you organize and manage access to the various Web content available through
the Plant Applications Web Report Server. A User Tree consists of two parts:
Tree Users: Tree Users is where you add new users and manage existing users.
Tree Configuration: Tree Configuration is where you determine what content the User Tree
members have access to, and what the individual User Tree members can do with that content.
All members of the User Tree will see the same content, but you can control what individual users
can do with the content.
Creating a New User Tree
To create a new User Tree:
1. Log on to the Web Administrator. How?
2. Right-click the User Trees folder and select Add Template from the pop-up menu.
3. Type the name of the template and press ENTER.
4. Open the new User Tree to add users and to configure the users' content.
Deleting a User Tree
If you delete a User Tree, all the members of the tree and the reports associated with the tree will
also be deleted. The users and reports can be added to another tree, however.
To delete a User Tree
1. Log on to the Web Administrator. How?
2. Open the User Trees folder.
3. Right-click on the User Tree you want to delete and select Delete Template from the
pop-up menu.
4. Click Yes to confirm the deletion.
Tree Users
Before anyone can use the Web Report Server, they must first be added as a user. Only users
that exist in the Plant Applications database (site users) can be added as Plant Applications Web
Report users.
Adding a User to a User Tree
To add a user to the web server:

Plant Applications Web Reporting
37
1. Open the Plant Applications Web Administrator. How?
2. Open the User Trees folder.
3. Open the desired Tree.
4. Right-click on Tree Users and click Add User. The Add User dialog box appears.
5. Select the user you want to add and click OK.
After you add a user, you can change the user's access rights and determine whether they can
view only the report images or both the report image and the native document. How?
Removing a User Tree Member
You can remove users from User Trees. Once the user has been removed, they will no longer
have access to the Tree Configuration reports. However, they will be available to be added to
other User Trees.
To remove a user from a User Tree:
1. Log on to the Web Administrator. How?
2. Open the User Trees folder.
3. Open the desired User Tree.
4. Click Tree Users to display the list of members in the right pane.
5. Right-click on the user you want to remove and select Remove User from the pop-up
menu.
Changing the User Properties
You can edit a new or existing user's access rights and view settings. These settings determine
what the user can do and see in the Web Report Server.
To change a user's properties:
1. Log on to the Web Administrator.
2. Open the User Trees folder.
3. Open the desired Tree.
4. Double-click on Tree Users to display the list of users in the right-hand pane.
5. In the right-hand pane, right-click on the desired user and select Properties from the
pop-up menu.
6. In the User Properties For: <user name> dialog box, make the desired changes.
7. Click OK to save your changes and close the dialog box.
Configuring Web Content for Users
Before users can view and run reports and other web content, it must first be added to the user's
Tree Configuration. After the User Tree has been created and users have been added to the
User Tree, the content must be added to the Tree Configuration. This will determine what the

Managing Web Users
38
members of each User Tree will see when they log on to the Plant Applications Web Report
Server.
To determine the Web user's content:
1. Log on to the Web Administrator. How?
2. Open the User Trees folder.
3. Open the desired User Tree.
4. Right-click on Tree Configuration. The right pane will be divided into two panes. The left
pane will display the User Tree name and the right pane will display a list of all available
web content.
5. In the middle pane, right-click on the User Tree name and select Add Folder from the
pop-up menu.
6. Type the folder name and press ENTER.
7. Repeat steps 5 and 6 to add additional folders.
8. Drag the selected Web content into the folder.
Deleting a Tree Configuration Folder
In the Web Administrator, you can open the User Tree and delete any or all of the folders in the
Tree Configuration. If you delete a folder, you will delete all of the content inside the folder. These
changes will affect all the members of the selected User Tree.
Deleting the folder only deletes the content from the user's view. The original content is still
available and can be added to a new or existing folder.
To delete a folder:
1. Log on to the Web Administrator. How?
2. Open the User Trees folder.
3. Open the desired User Tree and click Tree Configuration.
4. In the middle pane, right-click on the folder you want to delete and select Delete Node
from the pop-up menu.
5. Click Yes to confirm the deletion.
Renaming a Tree Configuration Folder
You can rename a folder in the Tree Configuration. However, when you rename the folder, it is
renamed for every user in the User Tree.
To rename a folder:
1. Log on to the Web Administrator. How?
2. Open the User Trees folder.
3. Open the desired User Tree.
4. Click on Tree Configuration to display the Web content in the right pane.

Plant Applications Web Reporting
39
5. Right-click on the folder you want to rename and choose Properties. The Node
Properties dialog box appears.
6. Type the new folder name in the Node Name box.
7. Click OK to save your changes and close the dialog box.
Monitoring Report Activity
Viewing System Log Files
The Plant Applications Report Scheduler and engines keep a record of their activity in both the
Plant Applications database and in log files. The log file contains information about each
individual report run, such as the time it ran, run duration, how many files were generated and
what the engine did with them.
The log files can be found on the computer hosting these services in the ReportServer\Logs
directory. They are ASCII text files and can be opened with Notepad or any other text editor.
Viewing a Report Engine's Activity
You can view a log of activity for each Report Engine. The EngineLoggingLevel site parameter
determines the level of error messages that will be recorded by the report engine. The number of
days error messages are kept are determined by the site parameter, LogfilePurgeDays.
To view a Report Engine's activity:
1. Log on to the Web Administrator. How?
2. Open the Web Server folder.
3. Open the Engines folder.
4. Click on a Report Engine to display the activity messages in the right pane.
Viewing Reports in the Schedule Queue
In the Schedule queue, you can see the reports that have been scheduled to run. For each
scheduled report, the following information is displayed.
Report name
Last run time
Next run time
Current status
Last run result
Run time error
Run attempts
Description
To view reports in the Schedule Queue

Web Report Client Interface
40
1. Log on to the Web Administrator. How?
2. Open the Current Activity folder.
3. Click Schedule to view the list a scheduled reports.
Viewing the Print Queue
The Print Queue lets you see which reports are waiting to be printed, which printer they will be
printed on, and the number of copies. From the Print Queue you can also remove reports from
the queue.
To view reports in the Print Queue
1. Log on to the Web Administrator. How?
2. Open the Current Activity folder.
3. Click Print Queue to display the reports waiting to be printed.
Web Report Client Interface
The Web client is accessed by using your Internet Explorer and has the look and feel of the
Windows Explorer. The window is divided into two panes.
The left pane displays the reports and web content available to the current user.
The right pane displays reports when you click a report definition or web content. When you
click a report type, the report dialogs are displayed in the right pane.
The Toolbar Icons and Buttons

Plant Applications Web Reporting
41
This icon indicates that the report is set to automatically refresh every 30000 milliseconds
while you are viewing the report. This icon is visible only if the Auto Refresh option has been
selected. If you do not want the report to automatically refresh while you are viewing the report,
click the icon. It will switch to the icon.
NOTE: You set the Auto Refresh option in the Report Definition Properties dialog box, which is
opened by right-clicking a report definition in the Web Server Administrator and selecting
Properties.
This icon indicates that the report will be viewed in the format designated as its image
(primary) format when the report type was created. Click this icon to view the content in its native
(secondary) format. This functionality is controlled by the user's View Setting.
This icon indicates that the report will be viewed in the format designated as its native
(secondary) format when the Report Type was created. Click this icon to view the content in its
image (primary) format. This functionality is controlled by the user's View Setting.
This icon indicates the browser is in View mode. In order to generate new content from a
report type, the browser must be in View mode. Click this icon to change to Edit mode.
This icon indicates the browser is in Edit mode. In order to run a report definition, the
browser must be in Edit mode. Click this icon to change to View mode.
This icon indicates the report will automatically run when the report title is clicked in the left
pane of the browser. The report dialogs will not appear and the report will run as originally
configured. Click the icon to switch to View mode or Edit mode.
Click this button to refresh your browser.
Click this button to search for Plant Applications Web content.
Click this button to view the list of available content. The content is determined by the user's
Tree Configuration.
Click this button to copy the contents of the right pane to your Clipboard.
Click this button to print your report.
Click this button to log off from the Plant Applications Web Report Server.
Using the Web Report Client
The Plant Applications Web Report Server uses Internet Explorer as the web browser. If you
have a connection to your company’s intranet or the World Wide Web, then you can log in to
Plant Applications. In most cases, the address uses one of following formats, where
"servername" is the name of the server where the Plant Applications Web Server is installed:

Web Report Client Interface
42
http://servername/ReportServer
https://servername/ReportServer
Another site parameter, UseHTTPS, controls whether a secure site is used.
NOTE: The name of the virtual directory under the web site is changed in release 6.2 to
PAReporting from ReportServer.
Logging on to the Web Report Client
To view, run, or edit reports, you need to log on to the Web Report client.
To log on to the Web Report client:
1. Start Microsoft Internet Explorer.
2. In the address bar, enter the address of the Web Report Server, and press Enter.
3. In the Plant Applications Web client log on screen, enter your Plant Applications user
name and password. This is the user name and password you were assigned as a site
user. This may or may not be the same as your Windows user name and password.
Optionally, you can enter your SSO credentials, which may require the fully qualified
domain name (FQDN) if SSO authentication is enabled.
Creating an Ad Hoc Report
You can create ad hoc reports by clicking a report type (Similar to a template. You can use the
report type to create ad hoc reports or you can save the report as a report definition) in the left
pane. After clicking the report type, the right-pane will display the different dialogs used to
determine the content of the report. After you've finished determining the content, you'll be able to
save the changes.
To create an ad hoc report
1. Log on to the Plant Applications Web Report client. How?
2. In the left pane, open the desired folder and click the appropriate title.
3. In the right pane, click the tabs to determine the report's content.
4. On the You're Finished tab, select Execute Immediately and click Submit to create an
ad hoc version of this report.
Printing Reports
Not only can you display reports in your browser, but you can also automatically print the report. If
you schedule a report, you can have the report print based on the scheduled run time.
NOTE: Printing and scheduling reports created from Active Server Applications (.ASPX) is not
supported in this version of Plant Applications. If you do print a report, you will get unexpected
and inaccurate results.
To print a report
1. Log on to the Web Report client. How?

Plant Applications Web Reporting
43
2. Click the report you want to print.
3. After the report runs, click on the Plant Applications Report Server toolbar.
If the report has multiple pages or sheets, select the sheet you want to print.
To schedule a report to print
1. Log on to the Web Administrator. How?
2. Open the Web Content folder.
3. Right-click on the report that you want to print and click Properties. The Report Type
Properties: <report name> dialog box appears.
4. Click the Display tab.
5. Under Printed Output, select the printer.
6. To change the number of printed copies, double-click the selected printer and enter the
number of copies in the Edit Copies dialog box.
7. Click OK.
8. Click OK.
9. Schedule the report.
Making Changes to a Report Type
Within the Web Report client, when you execute a report type, any changes you make can be
permanently saved. Then, the next time you execute the report, the report will run using your
changes.
Keep in mind that when you save the changes, the report is permanently changed. The changes
cannot be undone.
To change a Report Type:
1. Log on to the Web Report client. How?
2. Click the report you want to change.
3. Select the parameters you want to use.
4. On the You're Finished tab, select Save Changes To <report name>.
5. Click Submit.
Creating a New Report Definition
If you find that you run the same report with the same information over and over, you can create a
Report Definition, which will save your options and prevent you from having to select any option.
Then, you can simply run the Report Definition without having to select the same options each
time you run the Report Type.
To create a Report Definition:
1. Log on to the Web Report client. How?
2. Click the Report Type to run the report.

Site Parameters
44
3. Make any changes to the information.
4. On the You're Finished tab, select Save As Definition And Execute Immediately.
5. In the Save As box, type the name of your new Report Definition. By default, the name of
the Report Type and the current time stamp are used to name the Report Definition.
6. Click Submit.
Site Parameters
Ad Hoc Report Life (Days)
Use the Ad Hoc Report Life (Days) site parameter to specify the number of days an ad hoc report
is kept in the database. The date is based off the date the report was last accessed.
To edit the Ad Hoc Report Life (Days) site parameter
1. Log in to the Plant Applications Administrator.
You must have Administrator access to the Administrator security group to change site
parameters.
2. Open Global Configuration.
3. Right-click on the Administer Site Parameters folder and click Edit Site Parameter. The
Site Parameters dialog box appears.
4. Double-click on Ad Hoc Report Life (Days). The Edit Parameter dialog box appears.
5. Type the number of days in the Value box. For example, if you type 4 in the Value box,
ad hoc reports will be kept in the database up to four days from the date they were last
accessed.
6. Click the OK button to save your changes and close the dialog box.
7. Click the Close button to close the Site Parameters dialog box.
8. Refresh the server.
Dashboard Engine Server site parameter
The Dashboard Engine Server parameter should contain the name of the server where the Plant
Applications dashboard services are installed.
To edit the Dashboard Engine Server site parameter
1. Log in to the Plant Applications Administrator.
You must have Administrator access to the Administrator security group to change site
parameters.
2. Open Global Configuration.
3. Right-click on the Administer Site Parameters folder and click Edit Site Parameters. The
Site Parameters dialog box appears.
4. Double-click on Dashboard Engine Server. The Edit Parameter dialog box appears.
5. Type the server name in the Value box.

Plant Applications Web Reporting
45
6. Click the OK button to save your changes and close the dialog box.
7. Click the Close button to close the Site Parameters dialog box.
8. Refresh the server.
Gallery Physical Path site parameter
The Gallery Physical Path parameter contains the physical path of the Web Part gallery.
To edit the Gallery Physical Path site parameter
1. Log in to the Plant Applications Administrator.
You must have Administrator access to the Administrator security group to change site
parameters.
2. Open Global Configuration.
3. Right-click on the Administer Site Parameters folder and click Edit Site Parameters. The
Site Parameters dialog box appears.
4. Double-click on Gallery Physical Path. The Edit Parameter dialog box appears.
5. Enter the physical path to where the Web Parts are located.
6. Click the OK button to save your changes and close the dialog box.
7. Click the Close button to close the Site Parameters dialog box.
8. Refresh the server.
Gallery Virtual Path site parameter
The Gallery Virtual Path site parameter contains the virtual path of the Web Part gallery.
This is used only if you are using DDRK for your dashboard.
To edit the Gallery Virtual Path site parameter
1. Log in to the Plant Applications Administrator.
You must have Administrator access to the Administrator security group to change site
parameters.
2. Open Global Configuration.
3. Right-click on the Administer Site Parameters folder and click Edit Site Parameters. The
Site Parameters dialog box appears.
4. Double-click on Gallery Virtual Path. The Edit Parameter dialog box appears.
5. Enter the virtual path to where the Web Parts are located.
6. Click the OK button to save your changes and close the dialog box.
7. Click the Close button to close the Site Parameters dialog box.
8. Refresh the server.
Microsoft Dashboard Catalog Site Parameter

Site Parameters
46
The Microsoft Dashboard Catalog site contains the name of the Microsoft dashboard catalog.
This is used only if you are using DDRK (Digital Dashboard Resource Kit) for your dashboard.
To edit the Microsoft Dashboard Catalog site parameter
1. Log in to the Plant Applications Administrator.
You must have Administrator access to the Administrator security group to change site
parameters.
2. Open Global Configuration.
3. Right-click on the Administer Site Parameters folder and click Edit Site Parameters. The
Site Parameters dialog box appears.
4. Double-click on Microsoft Dashboard Catalog. The Edit Parameter dialog box appears.
5. Type the name of the Microsoft dashboard catalog.
6. Click the OK button to save your changes and close the dialog box.
7. Click the Close button to close the Site Parameters dialog box.
8. Refresh the server.
Microsoft Dashboard Server Site Parameter
The Microsoft Dashboard Server parameter contains the name of the server where the Microsoft
dashboard is installed.
This is used only if you are using DDRK for your dashboard.
To edit the Microsoft Dashboard Server site parameter
1. Log in to the Plant Applications Administrator.
You must have Administrator access to the Administrator security group to change site
parameters.
2. Open Global Configuration.
3. Right-click on the Administer Site Parameters folder and click Edit Site Parameters. The
Site Parameters dialog box appears.
4. Double-click on Microsoft Dashboard Server. The Edit Parameter dialog box appears.
5. Type the name of the server where the Microsoft dashboard is installed.
6. Click the OK button to save your changes and close the dialog box.
7. Click the Close button to close the Site Parameters dialog box.
8. Refresh the server.
Proficy Dashboard Server site parameter
The Proficy Dashboard Server parameter contains the name of the server where the Proficy
dashboard is installed.
To edit the Proficy Dashboard Server site parameter

Plant Applications Web Reporting
47
1. Log in to the Plant Applications Administrator.
You must have Administrator access to the Administrator security group to change site
parameters.
2. Open Global Configuration.
3. Right-click on the Administer Site Parameters folder and click Edit Site Parameters. The
Site Parameters dialog box appears.
4. Double-click on Proficy Dashboard Server. The Edit Parameter dialog box appears.
5. Type the name of the server where the Proficy dashboard is installed.
6. Click the OK button to save your changes and close the dialog box.
7. Click the Close button to close the Site Parameters dialog box.
8. Refresh the server.
Proficy Dashboard Virtual Path site parameter
The Proficy Dashboard Virtual Path site parameter contains the virtual path of the Proficy
dashboard.
To edit the Proficy Dashboard Virtual Path site parameter
1. Log in to the Plant Applications Administrator.
You must have Administrator access to the Administrator security group to change site
parameters.
2. Open Global Configuration.
3. Right-click on the Administer Site Parameters folder and click Edit Site Parameters. The
Site Parameters dialog box appears.
4. Double-click on Proficy Dashboard Virtual Path. The Edit Parameter dialog box appears.
5. Enter the virtual path to where the Proficy dashboard is located.
6. Click the OK button to save your changes and close the dialog box.
7. Click the Close button to close the Site Parameters dialog box.
8. Refresh the server.
Show Additional Web Part Configuration Tabs site parameter
Use the Show Additional Web Part Configuration Tabs parameter to control the display of the
Manage Parameter Types tab and the Manage Dialogs tab in the Web Parts Administration
dialog box.
CAUTION: You must be very careful when using this feature. Only someone with advanced
knowledge of Plant Applications, server technology, and web technology should use this
feature.
To edit the Show Additional Web Part Configuration Tabs site parameter
1. Log in to Plant Applications Administrator.

Site Parameters
48
You must have Administrator access to the Administrator security group to change site
parameters.
2. Expand Global Configuration.
3. Right-click on Administer Site Parameters folder and select Edit Site Parameters. The
Site Parameters dialog box appears.
4. Double-click Show Additional Web Part Configuration Tabs. The Edit Parameter dialog
box appears.
5. Select True to display the tabs or select False to hide the tabs.
6. Click the OK button to save your changes and close the dialog box.
7. Click the Close button to close the Site Parameters dialog box.
8. Refresh the server.
Web App Physical Path Site Parameter
The Web App Physical Path site parameter contains the value for the physical path of the Plant
Applications dashboard.
To edit the Web App Physical Path site parameter
1. Log in to the Plant Applications Administrator.
You must have Administrator access to the Administrator security group to change site
parameters.
2. Open Global Configuration.
3. Right-click on the Administer Site Parameters folder and click Edit Site Parameters.
4. In the Site Parameters dialog box, double-click on Web App Physical Path. The Edit
Parameter dialog box appears.
5. Type the physical path of the Plant Applications dashboard in the Value box.
6. Click the OK button to save your changes and close the dialog box.
7. Click the Close button to close the Site Parameters dialog box.
8. Refresh the server.

49
Standard Web Reports Overview
= Required; = Optional
Quality Module
Product
Module
Efficiency Module Production
Module
All
Prod
uctio
n
Eve
nt
Prod
uctio
n
Eve
nt
Stat
us
Prod
uctio
n
Even
t
Dime
nsion
s
Cre
w/S
hift
Pro
duc
ts
and
Pro
duc
t
Cha
nge
s
Dow
ntim
e
W
as
te
Us
er
Def
ine
d
Ev
ent
s
Proc
ess
Ord
ers
and
Sch
edul
es
Pro
ces
s
Ord
er
Sta
tus
Vari
able
s
Varia
ble
Specif
icatio
ns
Fault/
Reaso
ns
Act
ion
s
Ala
rm
s
Elec
troni
c
Sign
atur
e
Conf
igure
d
Displ
ays
Event
Analy
sis
Event
Histor
y
Color
Event
Histor
y Grid
Invent
ory

Standard Web Reports Overview
50
Listin
g
Line
Produ
ction
Timeli
ne
Line
Time
Accou
nting
Proce
ss
Order
Detail
Produ
ction
Listin
g
Sequ
ence
of
Event
s
Simpl
e
Trend
Test
Confo
rmanc
e by

Plant Applications Web Reporting
51
Produ
ct
Test
Confo
rmanc
e by
Shift
Thum
bnail
Trend
s
Trans
action
Detail
Unit
Time
Accou
nting
Varia
ble
Cente
rline
Analy
sis
Varia
ble
Confo
rmanc
e
Sum
mary

Standard Web Reports Overview
52
Varia
ble
Scatt
er
Analy
sis
Varia
ble
Specif
icatio
n
Repor
t
Varia
ble
Statist
ics
Sum
mary

53
Alarm Detail
This web report provides detailed alarm information on a specific variable. This web report is
accessed from the following web parts:
Alarm List By Variables Web Part
Alarm List By Units Web Part
Sequence of Events
These web parts pass configuration information to this web report. The only option when viewing
this report is whether to display electronic signature information. See below.
The report includes a drop-down menu for quick navigation to the various summaries presented.
Click View Timeline to open the Unit Time Accounting web report.
Click View Audit Trail to view an audit report of the changes made to the alarm.
To display electronic signature information, click the Properties icon on the web report's
toolbar and select Display Electronic Signature Information.
Trend Analysis
The Trend Analysis displays the target value (indicated by a green dash line) and the upper and
lower specification limits (indicated by a blue dash line). The actual value and timestamp are
plotted on the chart. The alarm duration is indicated in red. Click to view the interactive trend
chart.

Audit Trail Reports
54
Audit Trail Reports
Audit information can be viewed from a variety of reports by clicking View Audit Trail link. These
audit reports provided detailed information about changes made to specific events, such as
downtime or alarm.
The information provided by these reports includes:
Update Time: This is the date and time the change was made.
Update User: This is the electronic signature of the person who made the change.
Operation: This describes the action that was taken.
Field: This describes the field that was changed.
From Value: This displays the original value of the field.
To Value: This displays the change that was made to the field.

Plant Applications Web Reporting
55
Audit Trail Report for a Downtime Event
Downtime Detail
This web report is accessed from the following web reports:
Sequence of Events
Line Time Accounting
Click View Audit Trail to view an audit trail report.
To display electronic signature information, click the Properties icon on the web report's
toolbar and select Display Electronic Signature Information.
Event Information
The Downtime Detail report displays the following information for the downtime event:
Start Time: The date and time the downtime event began.
End Time: The date and time the downtime event ended.

Event Analysis
56
Time to Repair: The duration of the downtime event.
Time Between Failure: The amount of time since the last downtime event ended and
this downtime event began.
Product: The product that was being produced.
Product Description: The description of the product that was being produced.
Added By: This is the service (for example, EventMgr) or user who inserted the
downtime event.
Updated By: If the downtime event has been edited, this is the person who last made a
change to the downtime event.
NOTE: If the downtime event has not been changed, Added By will be displayed. If the downtime
event has been changed, Updated By will be displayed.
Number of Updates: This is the number of times the downtime event was changed.
Click the number to view an audit trail report.
Cause or Action Information
Additionally, detailed cause and action information is provided if reason trees have been
configured for the downtime event. For more information on attaching reason trees to downtime
events, please see How to Attach Reason Trees to Downtime Locations.
Downtime Detail Report
Event Analysis
This application provides comprehensive pareto and statistical analysis of the selected event
type. In general, raw data is gathered based on the filter criteria specified. That data is then
summarized in a specific way for each chart. The following parameters are required:
The start and end times
The production unit(s)

Plant Applications Web Reporting
57
The specific event you want to analyze
If you choose events that are quantity based instead of time based, the report displays quantities
instead of times. For example, waste doesn't show durations, it shows the amount of waste.
While viewing the report, you can hover over most items to view detailed information, and most
charts and graphs can be clicked to view more specific information. You can also dynamically
change the information on the report by clicking the Properties icon to open the Event
Analysis Options dialog box, where you can change the following information:
Event type
Security group
Time period
Production units
Products
Causes and actions
Which analysis to perform
Definitions
Duration The duration of the event but pro-rated so that none of the event falls out of the reporting range.
Time to repair The duration of the event. If the event doesn't have an end time, the current time is assumed.
Time previous failure The amount of uptime between the events. Uptime that starts before the reporting time is not counted, but the last uptime that starts within the reporting range is fully counted.
MTTR Mean time to repair. The average time it takes to repair something.
MTBF Mean time between failures. The average length of time between failures.
MAPE The mean amount of waste per event. MAPE replaces MTTR for waste events.
MABE The mean amount produced between waste events. MABE replaces MTBF for waste events.
Operating Time Operating time is Gross Running Time.
Product Analysis
% Operating Time: This pie chart shows the percentage of time that each product ran out of the
total operating time. Example: (Prod1 Operating time) / (Total Operating time)
% Fault Time: This bar chart shows percentage of downtime that occurred, grouped by the
product that was running. Example: Product 1 Fault Time % = (downtime during Product 1) /
(operating time of Product 1)
Crew Analysis
% By Crew: This pie chart shows the percent of downtime attributed to a specific crew.

Event Analysis
58
MTTR By Crew: This bar chart shows the average time to repair, in minutes, for each crew.
Example: sum(crew1 time to repair) / crew 1 downtime occurrences
MTBF By Crew: The bar chart shows the average uptime, in minutes, for each crew.
# Occurrences By Crew: This bar chart shows the number of downtime events that occurred
during each crew.
Fault Analysis
% By Fault: This pie chart shows the percent of downtime attributed to a specific fault.
MTTR By Fault: This bar chart shows the average time to repair, in minutes, for each fault.
Example: sum(fault1 time to repair) / fault1 downtime occurrences
MTBF By Fault: The bar chart shows the average uptime, in minutes, for each fault.
# Occurrences By Fault: This bar chart shows the number of downtime events that occurred
during each fault.
Cause Analysis
% By Cause: This pie chart shows the percent of downtime attributed to a specific cause.
MTTR By Cause: This bar chart shows the average time to repair, in minutes, for each cause.
Example: sum(cause1 time to repair) / cause1 downtime occurrences
MTBF By Cause: The bar chart shows the average uptime, in minutes, for each cause.
# Occurrences By Cause: This bar chart shows the number of downtime events that occurred
during each cause.
Action Analysis
% By Action: This pie chart shows the percent of downtime attributed to a specific action.
MTTR By Action: This bar chart shows the average time to repair, in minutes, for each action.
Example: sum(action1 time to repair) / action1 downtime occurrences
MTBF By Action: The bar chart shows the average uptime, in minutes, for each action.
# Occurrences By Action: This bar chart shows the number of downtime events that occurred
during each action.
Location Analysis
% By Location: This pie chart shows the percent of downtime attributed to a specific location.
MTTR By Location: This bar chart shows the average time to repair, in minutes, for each
location. Example: sum(location1 time to repair) / location1 downtime occurrences
MTBF By Location: The bar chart shows the average uptime, in minutes, for each location.
# Occurrences By Location: This bar chart shows the number of downtime events that occurred
during each location.
Plant Applications Web Reporting
59
Category Analysis
% By Category: This pie chart shows the percent of downtime attributed to a specific category.
MTTR By Category: This bar chart shows the average time to repair, in minutes, for each
category. Example: sum(category1 time to repair) / category1 downtime occurrences
MTBF By Category: The bar chart shows the average uptime, in minutes, for each category.
# Occurrences By Category: This bar chart shows the number of downtime events that
occurred during each category.
Non-productive Time
These charts are reporting on non-productive time for the entire reporting range, not just what
occurred during the event being analyzed. For more information, see Non-Productive Time.
Non-Productive time reasons. Displays the amount of non-productive time that can be
attributed to each reason.
Productive time vs. non-productive time. The ratio of productive vs. non-productive time.
Non-productive reason occurrences. The number of occurrences of each type of non-
productive reason.
Capability Analysis
The curved line represents a normal distribution curve based on the standard deviation and
average. The bars represent the number of occurrences of a "time to repair" range. For example,
one bar could represent a time to repair of 10 minutes. The height of the bar determines how
many times the time to repair was 10 minutes.
The background colors represent the specification limits (upper warning, lower reject, and so on).
The MTBF analysis is the same, except that the time since the previous failure is used.
Trends
The trend line overlays the actual data to show a rough representation of the slope of the data.
The trend is a linear regression analysis of the data points, and represents a best fit straight line.
The least square method is used to calculate the slope and y intercept.
The background is shaded based on the average and standard deviation values of the data.
The yellow zone start value is calculated using the formula Avg + (2 x StdDev).
The red zone is calculated using Avg + (3 x StdDev).
The rest of the background is green.
The standard deviation uses the StdDevP function, which calculates standard deviation based on
the entire population.
The total time trend plots the duration of the event in the number of buckets specified in the
parameters.
The MTBF trend plots the time since previous failure.

Event Detail Report
60
The MTTR plots the time to repair.
Data Summary
Cause: This is the cause of the event.
Total: The sum of the duration (in minutes) of the cause. If the event is a Waste event, then the
total is the total waste amount for the cause.
MTTR: Mean Time To Repair. This is the average number of minutes that the event lasts. In
other words, it is the average amount of time it took to repair the problem. The number in the
parentheses is the standard deviation of MTTR. For alarms, MTTR is the time to acknowledge the
alarm plus the time to repair.
MTBF: Mean Time Between Failure. This is the average number of minutes before a fault occurs.
The number is parentheses is the standard deviation of MTBF. MTBF is a direct indication of the
probability that a particular fault will be the fault that will cause failure. The shorter the MTBF for a
particular fault, the higher the probability that it will be the fault that will cause failure. If the event
type is a Waste event, then MTBF becomes MABF (Mean Amount Between Failure), which is the
mean production amount between waste events.
MTTA: Mean Time To Acknowledge. This applies only to alarms and is the average number of
minutes it takes for an alarm to be acknowledged.
#Occurrences: The sum of the number of causes.
%Total: The duration of this event compared to the operating time.
%Fault: The duration of this event compared to the total production time.
Inc MTTR (Incremental Mean Time To Repair). The standard deviation of the time to repair
compared to the total production time.
Inc MTBF (Incremental Mean Time Between Failure). The standard deviation of the mean time
between failures compared to the total production time.
Comparing Inc MTTR to Inc MTBF can help you statistically determine if more benefit can be
realized by improving repair times (MTTR) or preventing failures (MTBF).
Criteria Summary
This chart is a summary of the criteria used to create the Web report.
Event Detail Report
The Event Detail report displays detailed information about a specific production event. This
report can be accessed by clicking on a production event hyperlink in the Event History Color
report.
When you create the report, you must specify:
The time period for which you want to search for production events
The production unit where the production event occurred

Plant Applications Web Reporting
61
The production event
The Event Detail report will display a summary of any events, such as downtime or waste, that
occurred during the selected production event. In addition, a list of variables and the associated
specifications will be displayed in a Parameter Summary.
Click View Audit Trail to view an audit report of the changes made to the alarm.
To display electronic signature information, click the Properties icon on the web report's
toolbar and select Display Electronic Signature Information.
Event History Color
This ASP-based report lists events and event data for selected variables. The report requires the
following parameters:
Start and end time
The variables you want on the report
The event type
For each event, the report will graphically show whether the selected variables were within the
specifications. Comments are indicated with the Pencil icon . Hover over the pencil to view the
comment. Below each variable, you can hover over the Eyeglass icon to view specifications
for the variable. Click the Graph icon to view an interactive trend. You can click inside the
Interactive Trend chart to view information over a shorter time period.
You can click each event to view detailed information about the event.
Event History Color Web Report

Event History Grid
62
When you click an event on the Event History Color report, you can view an Event Detail report.
When you click the Graph icon on the Event History Color report, you can view an interactive
trend analysis of the selected variable.
Event History Grid
This ASP-based report lists events and event data for selected variables. This report requires the
following parameters:
Start and end time
The variables
The event type
For each event, the report will show whether the selected variables were within the specifications.
The cell color indicates whether the value was within specification limits. Below each variable are
the Target, Warning, and Reject specifications. Comments are indicated with the Pencil icon .
Hover over the pencil to view the comment. Click the Graph icon to view an interactive trend
analysis of the selected variable. You can click inside the Interactive Trend to view information
over a shorter time period.
You can click each event to view the detailed information about the event.
The cell background color indicates whether the value is within specification limits.
Green: The value is within the target limits.
Yellow: The value is either above or below the warning limits.
Red: The value is either above or below the reject limits.

Plant Applications Web Reporting
63
If the variable has no specification limits, the cell is always green.
Event History Grid Web Report
Event Detail Report
When you click an event on the Event History Grid report, you can view an Event Detail report.
Interactive Trend
When you click the Graph icon on the Event History Grid report, you can view an interactive trend
analysis of the selected variable.
Inventory Listing
This application lists summary statistics and details about inventory for specific units. This report
requires the following parameters:
The production units

Inventory Listing
64
The products
The report provides a summary of inventory by production unit, by product, and by status.
Inventory Listing Web Report
For each unit that produced inventory, the report lists the following information:
The event name
The production unit
The product
Conformance: If all variables are within target, then conformance is Good. If one or more
variables are in warning, then conformance is Warning. If one or more variables are in
reject, then conformance is reject. The number in parentheses () is the percentage of
variables that have data. The variable must have Conformance Variable selected in the
Variable sheet.
Dimensions: Hover over the dimensions to see more detailed information.
Age: How long the product has been in inventory, in the format: DDD HH:MM:SS
Signed By: If electronic signature is used, the person who signed off on the event.
Approved By: If electronic signature is used, the person who approved the event.
Event Detail Report
When you click an event on the Inventory Listing report, the Event Detail Report opens.

Plant Applications Web Reporting
65
Line Production Timeline
This application displays a timeline of production events across multiple units. You can select
production units from multiple production lines. The following parameters are required:
Start and end times
Production units
You can click the Properties icon on the report’s toolbar to dynamically change the time frame
and add or remove production units in the Line Production Timeline Properties dialog box.
Line Production Timeline Web Report

Line Time Accounting
66
In the Line Production Timeline report, you can click an event to view the Event Detail report or
hover over an item to view additional details.
Line Time Accounting
This application displays the timeline of selected events over multiple production units during a
specified period of time. You can select production units from multiple production lines. This
report requires the following parameters:
The start and end time
The production units
The event types
Click the Properties icon to open the Line Time Accounting Properties dialog box where you
can change the time period, the units, and the events included in the report.
Line Time Accounting Report

Plant Applications Web Reporting
67
You can click each event to view the Event Detail report. You can hover over an event to view
additional information about the event.
OEE Summary
The OEE Summary report shows OEE and other crucial production summary statistics. From this
report you can also click the symbol to access individual Unit OEE Web Parts.
The report includes a drop-down menu for quick navigation to the various summaries presented.
An asterisk (*) next to the performance rate indicates that performance is capped at 100%. To
allow this number to exceed 100%, change the value in the site parameter, OEE Max Limit
Override.
Available parameters are:
Start and end times (with shortcut options)
Line and unit selection
Summary display options
If the report start time or end time falls outside of an event start or end time, then loading time for
events partially outside the reporting period are calculated. The production for the event is
awarded to the reporting period on the basis of the following proration:
(Total Event Production / Total Event Loading Time) x Event Loading Time Within Reporting

Production Listing
68
Period
In cases where the last event in the specified reporting period has not yet ended, the Report End
Date for all calculations is actually the end date of the last completed event. That is, all availability
and production calculations are based on the end date/time of the last completed event, and not
the specified reporting end date.
OEE Summary
Production Listing
This report provides a summary of production event information for the selected production unit
and variables over the specified time period. This report requires the following parameters:
The start and end time
Production unit and variable(s)
You have the option of displaying Downtime, Genealogy, Waste, and Non-productive time
information. You can also summarize the information by one or more of the following: Crew, Day,
Process Order, Product, Shift, Status.
Grand Totals
The Grand Totals section displays the total number of production events and totals and
percentages for any events that were selected when the report was configured.
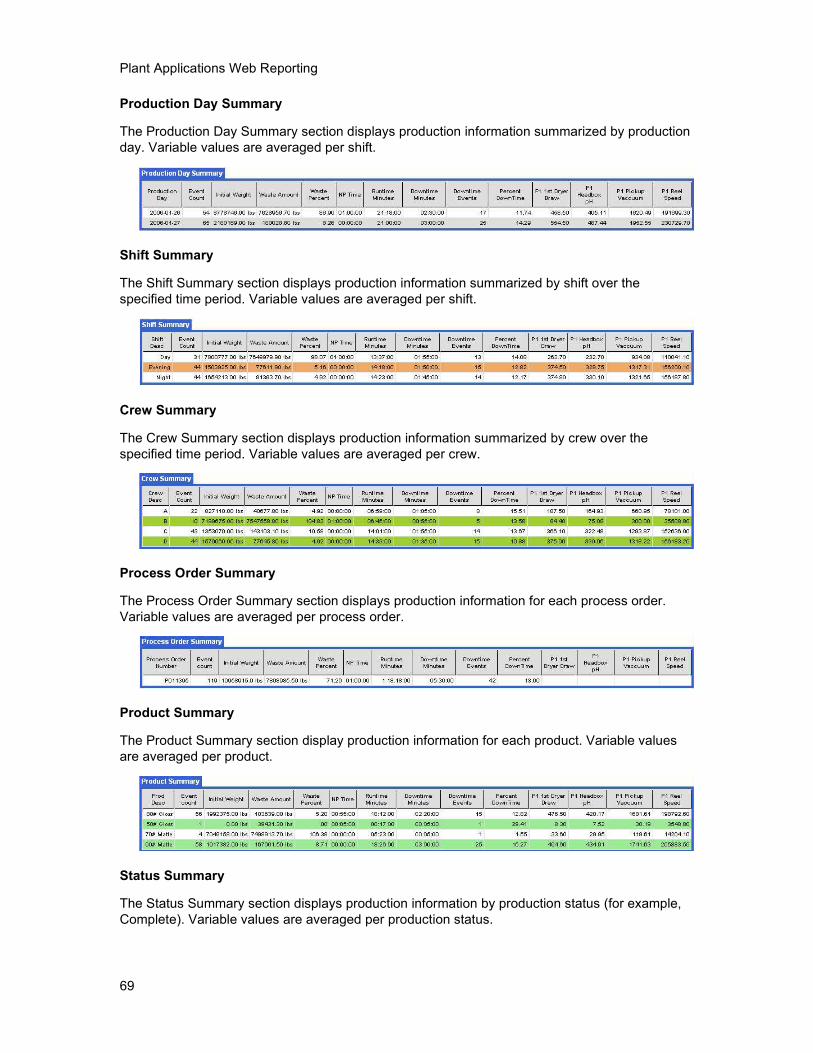
Plant Applications Web Reporting
69
Production Day Summary
The Production Day Summary section displays production information summarized by production
day. Variable values are averaged per shift.
Shift Summary
The Shift Summary section displays production information summarized by shift over the
specified time period. Variable values are averaged per shift.
Crew Summary
The Crew Summary section displays production information summarized by crew over the
specified time period. Variable values are averaged per crew.
Process Order Summary
The Process Order Summary section displays production information for each process order.
Variable values are averaged per process order.
Product Summary
The Product Summary section display production information for each product. Variable values
are averaged per product.
Status Summary
The Status Summary section displays production information by production status (for example,
Complete). Variable values are averaged per production status.

Sequence of Events
70
Event Details
The Event Details section provides detail information for each production event on the selected
production unit for the specified time period. Click the Event Detail icon to view the Event
Detail report.
Sequence of Events
This application chronologically lists all events that occurred during the specified period of time.
The report requires the following parameters:
The start and end time
The production unit(s)
The event type(s)
The report is organized chronologically by parent events. You can click a parent event to show or
hide the child events and then click on each child event to view detailed information about the
event. You also can hover over an item on the report to view additional details.
This icon indicates a Crew Schedule Change event.
This icon indicates a Downtime event.
This icon indicates a Waste event.
This icon indicates a Product Change event.
This icon indicates a Production event. The color of the flag indicates the production status.
This icon indicates a User-Defined event.
Sequence of Events Report

Plant Applications Web Reporting
71
Simple Trend
This application, also called Interactive Trend, allows you to trend multiple variables on a
selected production unit. When you configure the report, you can:
Specify the start and end time
Select the variables by unit
Select events by variables
Filter on events (event ID is on the x-axis)
NOTE: Control limits can be automatically calculated as an option based on a configurable
sample size. When available, calculated sigma values are reflected by control limits in trend
charts.
You can left-click anywhere in the report to decrease the time period (zoom in). You can right-
click in the report to increase the time period (zoom out).
Click the Properties icon and then click the Advanced tab to adjust the "zoom" factor. On the
Data tab, you can determine whether the data points for the selected variables are plotted relative
to either the primary axis or the secondary axis. Variables plotted relative to the secondary axis
are identified with squares on the plot line. You can also add additional variables or overlay
event information, such as Downtime and Waste events.
NOTE: When you select Plot By Number Of Points on the Time tab, the Units, Event Type and
Events tabs disappear. This is because these options conflict with the Plot By Number Of Points
option.
This report can be accessed from the:

SPC Chart
72
Thumbnail Trends report
Variable Specification report
Event History Color report
On the toolbar:
Click the clock or arrows to adjust the report's time period.
Click the Graph icon to add or remove variables.
Click the Properties icon to modify the report.
A green bar indicates the target limits.
Blue bars indicate the warning limits.
Red bars indicate the reject limits.
Left-click the report to zoom in or right-click to zoom out.
SPC Chart
A control chart enables you to:
Reduce scrap and rework and for improving productivity.
Prevent defects, which means less chance of nonconforming units produced.
Prevent unnecessary process adjustments by distinguishing between common cause
variation and special or assignable cause variation.
Determine the state of the process by looking at patterns within the data. You can then
make the necessary changes to improve the process performance.
View information about important process parameters over time.

Plant Applications Web Reporting
73
This SPC Chart is designed for operators and ongoing monitoring by Process Engineers and is
not intended to be an in-depth analysis tool.
The X/MR, XBar/Range and XBar/Sigma charts all show the same control chart (in addition to the
respective MR, R or S chart) and are differentiated only in how the control limits are calculated. If
fixed limits are selected, the X, XBar-Range and XBar-Sigma charts will all be identical.
NOTE: Control limits can be automatically calculated as an option based on a configurable
sample size. When available, calculated sigma values are reflected by control limits in SPC
charts.
Prerequisites
To use the SPC Chart report, you must configure a variable and include that variable on an
Autolog display.
To run or view the SPC Chart report in your browser, you must do one of the following:
Add the SPC Chart report to your Users Tree.
Create a report definition of the SPC Chart and add the definition to your Users Tree.
SPC Chart Functionality
The toolbar enables you to:
export the report to Excel
print the report
move the report forward or backward in time
reconfigure the report (for more information, see page 27.
Click to hide a section of the report.
Click to view a section of the report.
X-Bar and Range Chart
An XBar-Range chart is a pair of control charts used with processes that have a subgroup size of
two or more. The standard chart for variables data, X-bar and R charts help determine if a
process is stable and predictable. The X-bar chart shows how the mean or average changes over
time and the R chart shows how the range of the subgroups changes over time. It is also used to
monitor the effects of process improvement theories. As the standard, the X-bar and R chart will
work in place of the X-bar and s or median and R chart.
For the X-Bar chart, the value of the average will be plotted on the chart. The value will be the
selected variable value itself (in other words, SPC variable subgroup type) or it could be a
calculated value (in other words, time-series subgroup).
For the Range Chart, the value of the range will be plotted on the chart. The value will be the
SPC range variable value or the calculated value for time-series subgroup.

SPC Chart
74
1 Hover over a data point to view the value and subgroup, and any alarm violations, unless
Automatic Control Limits has been enabled.
2 Color-coded data points indicate alarms for fixed limits and centerline violations for calculated
limits.
Limit
Type
Condition Color
Fixed SPC template alarm record exists
Red
Calculated Value exceeds the control limit
Red
3 Limit values are displayed to the right of the chart.
4 Limit lines are color coded, as follows:
SPC
Limit
Plant
Applications
Limit
Color
Specification Reject Purple
Control Control Red
Zone 2 Warning Yellow

Plant Applications Web Reporting
75
Zone 1 User Green
Target Target Blue
5 The data on the X-axis is evenly spaced by subgroup. For Variable Subgroups the X-axis
displays the timestamp of the data points at automatically determined intervals. For Time-Series
subgroups, the X-axis displays the timestamp of the last data point in the subgroup.
6 The Y-axis is automatically defaulted to a range that is representative of the data set. You can
fix the Y-axis to a set range on the Advanced tab of the Properties dialog box.
XBar Chart Control Limit Formulas
j is a multiplier for calculating control limit. The default value is 3.
The other zones on the chart (i.e. Zone 1/User Limit and Zone 2/Warning Limit) are 1/3 and 2/3
respectively of the control limit.
Range (R) Chart Control Limit Formulas
j is a multiplier for calculating control limit. The default value is 3.
d3 is a constant defined by standard 6-sigma rules.
The other zones on the chart (i.e. Zone 1/User Limit and Zone 2/Warning Limit) are 1/3 and 2/3
respectively of the control limit.
X-Bar and MR Charts
An individuals and moving range (X-MR) chart is a pair of control charts for processes with a
subgroup size of one. Used to determine if a process is stable and predictable, it creates a picture
of how the system changes over time. The individual (X) chart displays individual measurements.
The moving range (MR) chart shows variability between one data point and the next. Individuals
and moving range charts are also used to monitor the effects of process improvement theories.
The X/MR chart will show 2 charts the X chart for the individual values and the Moving Range
(MR) chart for the ranges.
The format and layout off the X/MR chart is the same as the XBar/R chart described in the
preceding section. The difference is in the data displayed and the calculation of the limits.
The MR chart shows the calculated moving range for each selected variable. The moving range
is calculated based on a subgroup of 2 (the current and previous data points).

SPC Chart
76
Individual (X) Chart Control Limit Formulas
j is a multiplier for calculating control limit. The default value is 3.
d2 is a constant defined by standard 6-sigma rules.
The other zones on the chart (i.e. Zone 1/User Limit and Zone 2/Warning Limit) are 1/3 and 2/3
respectively of the control limit.
Moving Range (MR) Chart Control Limit Formulas
j is a multiplier for calculating control limit. The default value is 3.
d2 and d3 are constants defined by standard 6-sigma rules.

Plant Applications Web Reporting
77
The other zones on the chart (i.e. Zone 1/User Limit and Zone 2/Warning Limit) are 1/3 and 2/3
respectively of the control limit.
X-Bar and Sigma Charts
An XBar Sigma chart is a special purpose variation of the X-bar and R chart. Used with
processes that have a subgroup size of 11 or more, X-bar and s charts show if the system is
stable and predictable. They are also used to monitor the effects of process improvement
theories. Instead of using subgroup range to chart variability, these charts use subgroup standard
deviation. Because standard deviation uses each individual reading to calculate variability, it
provides a more effective measure of the process spread.
The format and layout off the X-Bar/S chart is the same as the X-Bar/R chart described
previously. The difference is in the data displayed and the calculation of the limits. The X-Bar
chart shows the averages while the S chart shows the SPC variable standard deviation values or
the calculated standard deviation values. As such, the S chart will only be valid for subgroups > 2.
If the subgroup size is less than 3, then the S chart will not show any data. Generally, the S chart
should only be used for subgroups > 10.
The S chart uses the S chart formulas for calculated “estimated sigma” and, subsequently, the
control limits. For information on calculations, see page 6.
Xbar Chart and Control Limit Formulas

SPC Chart
78
j is a multiplier for calculating control limit. The default value is 3.
The other zones on the chart (i.e. Zone 1/User Limit and Zone 2/Warning Limit) are 1/3 and 2/3
respectively of the control limit.
Sigma (S) Chart and Control Limit Formulas
j is a multiplier for calculating control limit. The default value is 3.
C4 is a constant defined by standard 6-sigma rules.
The other zones on the chart (i.e. Zone 1/User Limit and Zone 2/Warning Limit) are 1/3 and 2/3
respectively of the control limit
Statistics
The Histogram will show the distribution of the data against a normal curve. The Histogram will
only be shown for the last product in the selected time range. The title of the Histogram will
clearly show which product the data is shown for.
The statistics are based on the entire selected dataset ( including multiple products if selected).
The statistics are shown in a table that shows the values for each product that is included.
If multiple products are shown in the statistics table (and in the control chart), the Histogram only
displays data for the most recent product.

Plant Applications Web Reporting
79
1 If available, the upper and lower specification limits and the upper and lower control limits are
displayed.
2 A normal curve for the data is displayed.
3 The calculated average is displayed.
4 Data are grouped into appropriate groups.
Criteria Summary
The criteria summary contains all of the filters and chart options:
Variable
Time Range
Product(s)
Crew(s)
Shift(s)
Process Order(s)
Event(s)
Subgroup Type
Subgroup Size
Control Limit Type

SPC Chart
80
Raw Data
An optional section displays the raw data points that were the basis for the charts and statistical
analysis. The raw data section displays the following fields:
Field Description
Timestamp Timestamp of the data point
Value Value
Subgroup If a time-series subgroup type was chosen this will show which subgroup the data point was assigned
Product Product associated with the value
To view raw data, click the Properties icon and click the Advanced tab.
SPC Chart Calculations
Population Size (n)
The Population Size (n) is the count of all the test values, regardless of which subgroup they are
in.
Number of Subgroups (k)
The Number of Samples (k) will be the count of the selected samples/subgroups.
Subgroup Size (m)
The Subgroup Size (m) is the number of values within each subgroup.
Average

Plant Applications Web Reporting
81
The Process Average ( ) is the mean of all the data points, ignoring the existence of
subgroups.
The Sample Average ( ) is the mean of all the data points in the subgroup.
The Subgroup Average ( )is the mean of all the subgroups.
Minimum
The Minimum will be calculated based on the entire dataset (including multiple products if
selected).
Minimum = minimum value
Maximum
The Maximum will be calculated based on the entire dataset (including multiple products if
selected).
Maximum = maximum value
Process Standard Deviation (S)
The Standard Deviation (s) is the average of the distance between each point and the mean for
the entire population of data.

SPC Chart
82
Estimated Sigma ()
Estimated Sigma ( ) is calculated as follows:
Xbar/R
If 2 <= Subgroup Size <= 25 then
Xbar/S
If Subgroup Size >= 2 then
X/MR
If Subgroup Size = 1 then
Statistics
Z Numbers
The following Z numbers will be calculated:

Plant Applications Web Reporting
83
If LSL is not specified, then no value will be calculated.
If USL is not specified, then no value will be calculated.
If Target is not specified, then no value will be calculated.
Because of the dependence on the specification limit, this statistic is product dependent and
cannot be calculated for multiple products.
Lower Process Capability Index (Cpl)
Lower Capability Index (Cpl) is calculated as follows:
If no limits are specified, then no value will be calculated.
Because of the dependence on the specification limit, this statistic is product dependent and
cannot be calculated for multiple products.
Upper Process Capability Index (Cpu)
Upper Capability Index (Cpu) is calculated as follows:
If no limits are specified, then no value will be calculated.
Because of the dependence on the specification limit, this statistic is product dependent and
cannot be calculated for multiple products.
Process Capability (Cp)
Capability (Cp) is calculated as follows:
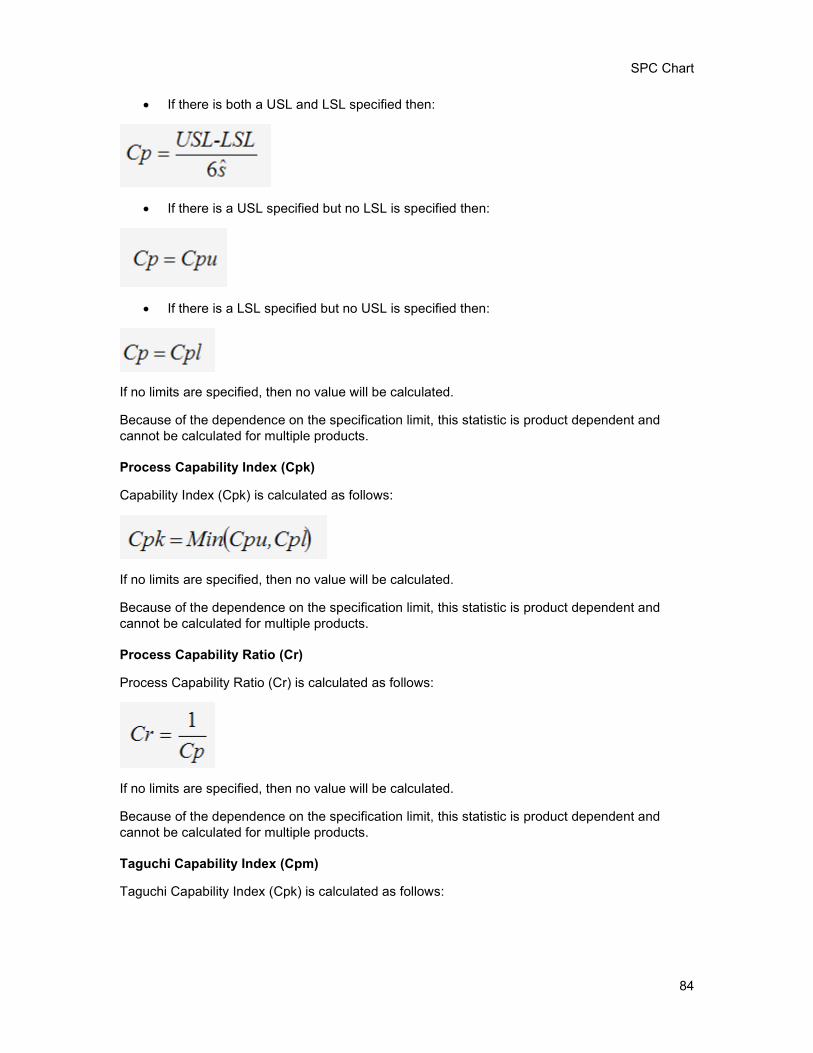
SPC Chart
84
If there is both a USL and LSL specified then:
If there is a USL specified but no LSL is specified then:
If there is a LSL specified but no USL is specified then:
If no limits are specified, then no value will be calculated.
Because of the dependence on the specification limit, this statistic is product dependent and
cannot be calculated for multiple products.
Process Capability Index (Cpk)
Capability Index (Cpk) is calculated as follows:
If no limits are specified, then no value will be calculated.
Because of the dependence on the specification limit, this statistic is product dependent and
cannot be calculated for multiple products.
Process Capability Ratio (Cr)
Process Capability Ratio (Cr) is calculated as follows:
If no limits are specified, then no value will be calculated.
Because of the dependence on the specification limit, this statistic is product dependent and
cannot be calculated for multiple products.
Taguchi Capability Index (Cpm)
Taguchi Capability Index (Cpk) is calculated as follows:

Plant Applications Web Reporting
85
If either limit is not specified, then no value will be calculated.
Because of the dependence on the specification limit, this statistic is product dependent and
cannot be calculated for multiple products.
Lower Process Performance (Ppl)
Lower Process Performance (Ppl) is calculated as follows:
If no limits are specified, then no value will be calculated.
Because of the dependence on the specification limit, this statistic is product dependent and
cannot be calculated for multiple products.
Upper Process Performance (Ppu)
Upper Process Performance (Ppu) is calculated as follows:
If no limits are specified, then no value will be calculated.
Because of the dependence on the specification limit, this statistic is product dependent and
cannot be calculated for multiple products.
Process Performance (Pp)
Process Performance (Pp) is calculated as follows:
If there is both a USL and LSL specified then:
If there is an USL specified but no LSL is specified then:
If there is a LSL specified but no USL is specified then:

SPC Chart
86
If no limits are specified, then no value will be calculated.
Because of the dependence on the specification limit, this statistic is product dependent and
cannot be calculated for multiple products.
PpK
Process Performance Index (Ppk) is calculated as follows:
Because of the dependence on the specification limit, this statistic is product dependent and
cannot be calculated for multiple products.
SPC Chart Options and Data
The relationships between the chart types, subgroup size, subgroup type and what chart data are
shown is described in the following table:
SPC Chart Options and Control Limits
The relationships between the chart types, subgroup size and how the control limits are
calculated is described in the following table.
NOTE: Control limits can be automatically calculated as an option based on a configurable
sample size. When available, calculated sigma values are reflected by control limits in SPC
charts.

Plant Applications Web Reporting
87
Configure and Run the SPC Chart
You can configure the SPC Chart report in one of two ways. You can:
Configure and run the report from the Web Server Administrator.
Configure and run the report from Internet Explorer.
To configure the report from the Web Server Administrator
1. Log on to the Web Server Administrator from the Plant Applications Administrator.
2. Click Web Content.
3. Right-click SPCCharts and click one of the following:
The option you select will determine the options available on the Finish tab.
Edit Default Parameters:Select this option to save changes to the default SPC Chart
report.
Create Definition: Select this option to create a new report based on the default SPC
Chart report.
View: Select this option to only view the report. Tabbed pages appear which you use to
configure the report.
4. Do the following:
a. On the Time Range tab, specify the time period you want to include on your
report.
b. On the Variable tab, specify the variable you want to include on your report. You
can use the Line, Unit and Group selections to filter the search for the relevant
variable. When the variable is selected, some configuration options will be
restricted based the variable type. For example, if an SPC variable is chosen,
the Subgroup Size option will be grayed out because the subgroup size is
automatically determined from the SPC variable configuration.
c. On the Product tab, specify products that will be used to filter the data selection.
If one or more products are specified, then only the data recorded during those
product runs will be selected; otherwise, all data will be selected. The list of the
available products is based on which products have been assigned to the

SPC Chart
88
selected variable’s production unit, which is contained in the PU_Products table.
The filtering of the data is based on the records in the Production_Starts table.
d. On the Shifts tab, specify shifts that will be used to filter the data selection. If one
or more shifts are specified, then only the data recorded during those shift runs
will be selected; otherwise, all data will be selected. The shifts will be filtered by
the production unit that the variable is associated with. Only those shifts on that
unit will be shown in the list. The list of available shifts shown will also be based
on the time range selected. Only those shifts occurring within the time range
selected will be available to be selected for the filter. The filter itself will not
change if the time range is changed. If the ‘Plot By Number Of Points’ option is
selected, the start time of the range for shift selection will be defaulted to 1 month
before the defined end time. The list of available shifts and the subsequent
filtering of the data is based on the records in the Crew_Schedule table.
e. On the Crews tab, specify crews that will be used to filter the data selection. If
one or more crews are specified, then only the data recorded during those crew
runs will be selected; otherwise, all data will be selected. The crews will be
filtered by the production unit that the variable is associated with. Only those
crews on that unit will be shown in the list. The list of available crews shown will
be based on the time range selected. Only those crews occurring within the time
range selected will be available to be selected for the filter. The filter itself will
not change if the time range is changed. If the ‘Plot By Number Of Points’ option
is selected, the start time of the range for crew selection will be defaulted to 1
month before the defined end time. The list of available crews and the
subsequent filtering of the data is based on the records in the Crew_Schedule
table.
f. On the Event tab, select one or more production events to control which values
are charted. The production events come from the same unit that the variable
was selected on. The selected production events will be used to filter the data (in
other words, only the values for the selected events will be charted). The tab will
only be enabled if the selected variable(s) have an event type of “Production
Event.”
g. On the ProcessOrders tab, specify which process orders that will be used to filter
the data selection. If one or more orders are specified, the only the data
recorded during those runs will be selected; otherwise, all data will be selected.
The orders will be filtered by the production unit that the variable is associated
with. Only those orders that have run on that unit will be shown in the list. The
list of available process orders will be limited to those process orders that have
run on the variable’s production unit. The list will also be limited to those that
have run within the time range selected. If the ‘Plot By Number Of Points’ option
is selected, the start time of the range for order selection will be defaulted to one
month before the defined end time. The list of available orders and the
subsequent filtering of the data is based on the records in both the
Production_Plan_Starts and Event_Details tables. The latter is for those process
orders that are directly linked to the production event vs being linked by time
through the Production_Plan_Starts table.
h. On the SPC Options tab, do the following:
o Subgroup Type: Select either Time-Series or Variable. If you select Time-Series,
the report will create subgroups from the data by dividing the data selected data
set by the subgroup size. If you select Variable, the report will determine the

Plant Applications Web Reporting
89
subgroup size based on the number of child variables with an SPC Variable type
of ‘Individuals’ defined underneath it.
o Subgroup Size: If you select a Subgroup Type of Times-Series, type the size of
the subgroup. The subgroups will be created from the start time and if there is a
remainder it will be created as an incomplete subgroup. For example, if you pick
a 24-hour range which brings back 52 test values and the subgroup size is
defined as 5, this results in 10 subgroups of 5 values and 1 subgroup of 2 values
for the statistics.
If your subgroup type is Time-Series, the following subgroup size restrictions are:
For MR charts, the subgroup size must be 1.
For Range charts, the subgroup size must be >= 2 and <= 25.
For Sigma charts, the subgroup size must be >= 2.
If you select a Subgroup Type of Variable, you cannot edit this field.
o Control Limit Selection: Select either Defined Specification Limits or Calculated
Limits, If you select Defined Specification Limits, the limits that are associated
with the selected variable will be used. If you select Calculated Limits, the limits
will be calculated based on the defined subgroup. The method of calculating the
limits is described on page 6.
o Number of Data Points: The number you type defines how many values to
include in the report rather than choosing the data points by the time range. The
selection is based on the End Time parameter that is selected and the
direction. For example, if 10 data points are chosen and the direction of
“backwards,” the last 10 entries for the variable will be selected starting from the
end time. Any selected filters will be applied before the data points are selected.
o Sigma Factor: This is a multiplier in the control limit calculation.
o Select the type of control chart you want to use from the drop-down list. Your
choices are: XBar/MR, XBar/Range, and XBar/Sigma.
i. On the Finish tab, select one of the options and click Submit.
To configure the report from Internet Explorer
1. Ensure you have added the SPC Chart report to your User Tree. For more information,
see page 3.
2. Log into the report server. For more information, see page 4.
3. In the left pane, click the SPC Chart report you want to run. Tabbed pages appear which
you use to configure the report.
4. Do the following:
a. On the Time Range tab, specify the time period you want to include on your
report.
b. On the Variable tab, specify the variable you want to include on your report. You
can use the Line, Unit and Group selections to filter the search for the relevant
variable. When the variable is selected, some configuration options will be
restricted based the variable type. For example, if an SPC variable is chosen,
the Subgroup Size option will be grayed out because the subgroup size is
automatically determined from the SPC variable configuration.
c. On the Product tab, specify products that will be used to filter the data selection.
If one or more products are specified, then only the data recorded during those

SPC Chart
90
product runs will be selected; otherwise, all data will be selected. The list of the
available products is based on which products have been assigned to the
selected variable’s production unit, which is contained in the PU_Products table.
The filtering of the data is based on the records in the Production_Starts table.
d. On the Shifts tab, specify shifts that will be used to filter the data selection. If one
or more shifts are specified, then only the data recorded during those shift runs
will be selected; otherwise, all data will be selected. The shifts will be filtered by
the production unit that the variable is associated with. Only those shifts on that
unit will be shown in the list. The list of available shifts shown will also be based
on the time range selected. Only those shifts occurring within the time range
selected will be available to be selected for the filter. The filter itself will not
change if the time range is changed. If the ‘Plot By Number Of Points’ option is
selected, the start time of the range for shift selection will be defaulted to 1 month
before the defined end time. The list of available shifts and the subsequent
filtering of the data is based on the records in the Crew_Schedule table.
e. On the Crews tab, specify crews that will be used to filter the data selection. If
one or more crews are specified, then only the data recorded during those crew
runs will be selected; otherwise, all data will be selected. The crews will be
filtered by the production unit that the variable is associated with. Only those
crews on that unit will be shown in the list. The list of available crews shown will
be based on the time range selected. Only those crews occurring within the time
range selected will be available to be selected for the filter. The filter itself will
not change if the time range is changed. If the ‘Plot By Number Of Points’ option
is selected, the start time of the range for crew selection will be defaulted to 1
month before the defined end time. The list of available crews and the
subsequent filtering of the data is based on the records in the Crew_Schedule
table.
f. On the Event tab, select one or more production events to control which values
are charted. The production events come from the same unit that the variable
was selected on. The selected production events will be used to filter the data (in
other words, only the values for the selected events will be charted). The tab will
only be enabled if the selected variable(s) have an event type of “Production
Event.”
g. On the ProcessOrders tab, specify which process orders that will be used to filter
the data selection. If one or more orders are specified, the only the data
recorded during those runs will be selected; otherwise, all data will be selected.
The orders will be filtered by the production unit that the variable is associated
with. Only those orders that have run on that unit will be shown in the list. The
list of available process orders will be limited to those process orders that have
run on the variable’s production unit. The list will also be limited to those that
have run within the time range selected. If the ‘Plot By Number Of Points’ option
is selected, the start time of the range for order selection will be defaulted to one
month before the defined end time. The list of available orders and the
subsequent filtering of the data is based on the records in both the
Production_Plan_Starts and Event_Details tables. The latter is for those process
orders that are directly linked to the production event vs being linked by time
through the Production_Plan_Starts table.
h. On the SPC Options tab, do the following:
o Subgroup Type: Select either Time-Series or Variable. If you select Time-Series,
the report will create subgroups from the data by dividing the data selected data
Plant Applications Web Reporting
91
set by the subgroup size.
If you select Variable, the report will determine the subgroup size based on the
number of child variables with an SPC Variable type of ‘Individuals’ defined
underneath it.
The report will check the type of the selected variable to see if it is one of the
following:
Standard Variable: The value of the selected variable will be used for the
statistics and the subgroup size will be assumed to be 1.
SPC Calculation Variable: The statistics will be based on a subgroup size that
matches all of the child variables with an SPC Variable Type of ‘Individual’ and
the value of the parent variable will be plotted.
o Subgroup Size: If you select a Subgroup Type of Times-Series, type the size of
the subgroup. The subgroups will be created from the start time and if there is a
remainder it will be created as an incomplete subgroup. For example, if you pick
a 24-hour range which brings back 52 test values and the subgroup size is
defined as 5, this results in 10 subgroups of 5 values and 1 subgroup of 2 values
for the statistics.
If you select a Subgroup Type of Variable, you cannot edit the Subgroup Size field.
o Control Limit Selection: Select either Defined Specification Limits or Calculated
Limits, If you select Defined Specification Limits, the limits that are associated
with the selected variable will be used. If you select Calculated Limits, the limits
will be calculated based on the defined subgroup. The method of calculating the
limits is described in the topic, SPC Chart calculations.
o Number of Data Points: The number you type defines how many values to
include in the report rather than choosing the data points by the time range. The
selection is based on the End Time parameter that is selected and the
direction. For example, if 10 data points are chosen and the direction of
“backwards,” the last 10 entries for the variable will be selected starting from the
end time. Any selected filters will be applied before the data points are selected.
o Sigma Factor: This is a multiplier in the control limit calculation.
o Select the type of control chart you want to use from the drop-down list. Your
choices are: XBar/MR, XBar/Range, and XBar/Sigma.
i. On the Finish tab, select one of the options and click Submit.
Running the SPC Chart from an Autolog display
You can launch the Variable SPC Chart report from Autolog. There are two new display options
that must be configured before you can access the SPC Chart report from Autolog. The new
display options are:
DrilldownURLGeneratorFunctionName
DrilldownURLTitle
To configure the display options
1. In the Plant Applications Administrator tree, expand Client Management.
2. Expand the Displays folder.

SPC Chart
92
3. Expand the display group, and double-click the Autolog display. The Edit Display dialog
box appears.
4. Click the Display Options tab.
5. Double-click DrilldownURLGeneratorFunctionName. The Assign Property Value dialog
box appears.
6. In the Value box, type "spRS_ReportServerURLForSPCReport" (without the quotation
marks). This is the stored procedure that is called when the report is run.
7. Click OK. The Assign Property Value dialog box closes.
8. Double-click DrilldownURLTitle. The Assign Property Value dialog box appears.
9. In the Value box, type the label that you want to appear in the right-click menu in the
Autolog display.
10. Click OK. The Assign Property Value dialog box closes.
11. Click Save.
12. If prompted click OK to reload the services.
13. Close the Edit Display dialog box.
Editing an SPC Chart
To change an existing report
1. While viewing an existing report, click the Properties icon on the report toolbar
. The Options dialog box appears.
2. Do one or more of the following:
a. Click the General tab to save the report as a definition so that it can be run at a
later date with the same configured parameters.
b. Click the Time tab to select the data selection type. You can select:
o Plot By Number of Points
o Plot By Time Range
NOTE: If Plot By Number of Points is selected, the Events tab will not be available.
c. Click the Variable tab to select the variable for the report. You can use the Line,
Unit and Group selections to filter the search for the relevant variable. When the
variable is selected, some configuration options will be restricted based the
variable type. For example, if an SPC variable is chosen, the Subgroup Size
option will be grayed out because the subgroup size is automatically determined
from the SPC variable configuration.
d. Click the Products tab to specify products that will be used to filter the data
selection. If one or more products are specified, then only the data recorded
during those product runs will be selected; otherwise, all data will be selected.
The list of the available products is based on which products have been assigned
to the selected variable’s production unit, which is contained in the PU_Products
table. The filtering of the data is based on the records in the Production_Starts
table.

Plant Applications Web Reporting
93
e. Click the Events tab to select one or more production events to control which
values are charted. The production events come from the same unit that the
variable was selected on. The selected production events will be used to filter
the data (in other words, only the values for the selected events will be charted).
The tab will only be enabled if the selected variable(s) have an event type of
“Production Event.”
NOTE: If Plot By Number of Points is selected on the Time tab, the Events tab will not be
available.
f. Click the Shifts tab to specify shifts that will be used to filter the data selection. If
one or more shifts are specified, then only the data recorded during those shift
runs will be selected; otherwise, all data will be selected. The shifts will be filtered
by the production unit that the variable is associated with. Only those shifts on
that unit will be shown in the list. The list of available shifts shown will also be
based on the time range selected. Only those shifts occurring within the time
range selected will be available to be selected for the filter. The filter itself will
not change if the time range is changed. If the ‘Plot By Number Of Points’ option
is selected, the start time of the range for shift selection will be defaulted to 1
month before the defined end time. The list of available shifts and the
subsequent filtering of the data is based on the records in the Crew_Schedule
table.
g. Click the Crews tab to specify crews that will be used to filter the data
selection. If one or more crews are specified, then only the data recorded during
those crew runs will be selected; otherwise, all data will be selected. The crews
will be filtered by the production unit that the variable is associated with. Only
those crews on that unit will be shown in the list. The list of available crews
shown will be based on the time range selected. Only those crews occurring
within the time range selected will be available to be selected for the filter. The
filter itself will not change if the time range is changed. If the ‘Plot By Number Of
Points’ option is selected, the start time of the range for crew selection will be
defaulted to 1 month before the defined end time. The list of available crews and
the subsequent filtering of the data is based on the records in the
Crew_Schedule table.
h. Click the ProcessOrders tab to specify which process orders that will be used to
filter the data selection. If one or more orders are specified, the only the data
recorded during those runs will be selected; otherwise, all data will be selected.
The orders will be filtered by the production unit that the variable is associated
with. Only those orders that have run on that unit will be shown in the list. The
list of available process orders will be limited to those process orders that have
run on the variable’s production unit. The list will also be limited to those that
have run within the time range selected. If the ‘Plot By Number Of Points’ option
is selected, the start time of the range for order selection will be defaulted to one
month before the defined end time. The list of available orders and the
subsequent filtering of the data is based on the records in both the
Production_Plan_Starts and Event_Details tables. The latter is for those process
orders that are directly linked to the production event vs being linked by time
through the Production_Plan_Starts table.
i. Click the SPC Options tab to do the following:
o Under Control Charts Options, select or clear the information you want to display
on your report.

Test Conformance By Product
94
o Subgroup Type: Select either Time-Series Subgroup or Variable Subgroup. If you
select Time-Series Subgroup, the report will create subgroups from the data by
dividing the data selected data set by the subgroup size.
If you select Variable Subgroup, the report will determine the subgroup size
based on the number of child variables with an SPC Variable type of ‘Individuals’
defined underneath it.
The report will check the type of the selected variable to see if it is one of the
following:
Standard Variable: The value of the selected variable will be used for the
statistics and the subgroup size will be assumed to be 1.
SPC Calculation Variable: The statistics will be based on a subgroup size that
matches all of the child variables with an SPC Variable Type of ‘Individual’ and
the value of the parent variable will be plotted.
o Subgroup Size: If you select a Subgroup Type of Times-Series, type the size of
the subgroup. The subgroups will be created from the start time and if there is a
remainder it will be created as an incomplete subgroup. For example, if you pick
a 24-hour range which brings back 52 test values and the subgroup size is
defined as 5, this results in 10 subgroups of 5 values and 1 subgroup of 2 values
for the statistics.
NOTE: If you select a Subgroup Type of Variable, you cannot edit the Subgroup Size field.
o Control Limit Selection: Select either Defined Specification Limits or Calculated
Limits, If you select Defined Specification Limits, the limits that are associated
with the selected variable will be used. If you select Calculated Limits, the limits
will be calculated based on the defined subgroup. The method of calculating the
limits is described in the topic, SPC Chart calculations.
o Under Additional Options, clear the Auto Scale Y Axis or Auto Scale Second
Chart Y Axis to adjust the scale of the Y axis for the X-Bar chart and the
secondary chart (MR, Range, or Sigma).
o Select Show Control Limits to display control limits on your report.
NOTE: Control limits can be automatically calculated as an option based on a configurable
sample size. When available, calculated sigma values are reflected for control limits in SPC
charts.
j. Click Apply to apply your changes before saving them or click Ok to save the
changes and close the dialog box.
Test Conformance By Product
This ASP report shows conformance to test scheduling, grouped by product. This report requires
the following parameters:
The start and end times
The variable(s)
The product(s)

Plant Applications Web Reporting
95
For each variable, the report shows the number of times the variable was scheduled to be tested,
the actual number of times it was tested, and the conformance percentage. The information is
grouped by product. This report also provides a grand total of all variables for all products.
Test Conformance By Shift
This ASP report shows conformance to test scheduling, grouped by shift. This report requires the
following parameters:
The start and end times
The variable(s)
For each variable, the report shows the number of times the variable was scheduled to be tested,
the actual number of times it was tested, and the conformance percentage. The information is
grouped by shift. This report also provides a grand total of all variables for all shifts.

Thumbnail Trends
96
Thumbnail Trends
This application provides a thumbnail Trend analysis for each variable that is part of a selected
display. Only displays that have more than one variable are available for selection. This
application requires the following parameters.
The start and end times
The display
For each thumbnail, the background color indicates whether the last value was within
specifications. If the background color is green, then the last value was within target limits. If the
background color is blue, then the last value was within the warning limits. If the background color
is red, then the last value was within reject limits. The line color indicates whether the values were
within specification at each specific time. Within the report, you can click on each thumbnail to
open an interactive Trend Display.
You can also select a different display from the drop-down list and change the time frame.
NOTE: With Plan Applications 6.3, control limits can be automatically calculated as an option
based on a configurable sample size. When available, calculated sigma values are reflected y
control limits in trend charts.

Plant Applications Web Reporting
97
Simple Trend Report
When you click a thumbnail trend, the Simple Trend report opens.
Time History Color
This ASP-based report graphically shows whether variables that are part of a selected time-
based display are within the target, warning or reject limits. When you run the report, you specify
the following parameters:
Start and End time
The time-based display
The product(s)
For each event, the report will graphically show whether the variables were within the
specifications. Comments are indicated with the Pencil icon . Hover over the pencil to view the
comment. Below each variable, you can hover over the Eyeglass icon to view specifications
for the variable. Click the Graph icon to view an interactive trend analysis of the selected
variable.

Transaction Detail
98
Transaction Detail
This ASP application shows detailed information about the selected specification transaction. This
report requires the following parameter:
The selected transaction
When you run the report, you can select either pending or approved transactions.
Although you can select more than one transaction, only one transaction is displayed on the
report.

Plant Applications Web Reporting
99
Unit Time Accounting
This ASP application provides a timeline of selected events on a selected unit. This report
requires the following parameters:
The start and end time
The production line and production unit
The event type(s)
Any event type, including process orders and user-defined events, can appear in the timeline.
Within the report:
You can click an event to view detailed information about the event.
You can view the selected events on a different production unit by selecting a different
production unit from the drop-down list.
Click the Properties icon to dynamically change the time period, the production unit,
and add or remove event types.
Click the Clock icon to change the reporting time period.

User-defined Event Detail
100
User-defined Event Detail
This web report is accessed from the following reports:
Unit Time Accounting
Sequence of Events
Batch Procedure Detail
Click View Audit Trail to view an audit trail report.
Click View Timeline to open the Unit Time Accounting web report.
To display electronic signature information, click the Properties icon on the web report's
toolbar and select Display Electronic Signature Information.
Research Summary Information
This section lists all the variables that have been defined with the event type of user-defined
events. You can select the check box next to a variable and then click the Trend icon to view a
trend analysis report.

Plant Applications Web Reporting
101
Variable Centerline Analysis
This ASA report graphically displays information about each variable on the selected display.
When you configure the report, you can:
Specify the start and end times
Select the display that has the variables you want to analyze
Filter by product
Filter by event
Include or exclude non-productive time
For each variable on the selected display, the report graphically indicates the upper and lower
bounds, the mean, and the minimum and maximum values for the specified time period. The
upper bound is the average plus three standard deviations. The lower bound is the average
minus three standard deviations. The inverted triangle indicates the last value, which is also
displayed next to the thumbnail trend.
Each bar represents the range of data. The color of the bar shows whether the average value
was within specification. To change the color scheme, see the topic, Color Schemes.
Red: Average is within the reject limits
Blue: Average is within warning limits
Green: Average is within target limits

Variable Centerline Analysis
102
Only variables with specifications for the most recent production run (product) are displayed. If your selected time period overlaps the start and end time of two production runs, then only the values for the variables associated with the most recent production run will be displayed.
You can select a different display from the drop-down list. You can click a thumbnail to view an
interactive Trend Display.
Variable Centerline Analysis Web Report
The variable name
Click a thumbnail to view an interactive Trend analysis. The background color indicates
whether the last value was within specifications.
Green: The last value was within target limits
Blue: The last value was within the warning limits
Red: The last value was within reject limits
The line color indicates whether the values were within specification at each specific time.
The last value. The inverted green triangle also indicates the last value.
Lower bound = Average – 3 std. dev.
Upper bound = Average + 3 std. dev.
Minimum value

Plant Applications Web Reporting
103
Maximum value
Mean
Displays the name of the Autolog display. Click the arrow to view a list of available
displays.
Use the arrows or click the Clock icon to change the time period. Click the View
History icon to view a history of visited pages. Click the Properties icon to adjust the
report time range, select a different display, or filter by product.
Click the Alarm icon to view the Alarm List by Unit report.
Variable Conformance Summary
This ASP report provides comprehensive quality statistics for selected variables and products.
The following parameters are required:
The start and end time
The unit
The variable(s)
The product(s)
The selected variables are grouped by product and the following statistics are provided for each
variable:
Average
Standard Deviation
Specification limits:
o Upper and lower reject
o Upper and lower warning
o Target
Capability statistics:
o Ppk
o Cpk
For descriptions and calculation details for these and other statistics, see Variable Property
Definitions.
Std(s): Std(s) is standard deviation from the mean
Std(t): Std(t) is standard deviation from the target
Sampling details:
o Total
o Tested

Variable Scatter Analysis
104
o Rejected
Variable Conformance Summary Report
The report includes a drop-down menu for quick navigation to the various summaries presented.
The capability statistics (Ppk, Cpk) are highlighted to show whether the calculated index falls in
the target range (green), in the warning range (yellow), or in the reject range (red).
For each variable on the report, you can:
Click the Graph icon to view an interactive Trend display.
Click the Variable Statistics icon to view a detailed statistical analysis.
Click the hyperlink next to the Pencil icon to view comments. The Pencil icon (and
hyperlink) will appear only if comments have been entered for the variable.
Variable Scatter Analysis
This ASP application creates a scatter plot to help you evaluate variables by providing a visual
picture of the relationship between two variables. The pattern of the points helps indicate the type
and strength of the relationship between the two variables. The following parameters are
required:
The start and end time
The variables
After you run the report, you can select a product from the drop-down list. Click the Properties
icon to change the time period, select different variables and specify which variable is the
primary variable (the variable that determines the timestamp for gathering the other variable
data). You can also display a trend line and connect all points on the chart.

Plant Applications Web Reporting
105
Variable Specification
There are two ASP reports that list specifications for variables, grouped by Variable Groups within
the selected product(s).
The Specification by Unit report lists specifications for all variables on a selected unit, grouped
by the selected product(s). This report requires the following parameters:
The date
The production unit
The product(s)
The Specification by Variable report lists specifications for selected variables on a selected
production unit for a selected product. You can search for variables by production line, production
unit, or by Variable group. This report requires the following parameters:
The date
The variable(s)
The product(s)
The main difference between the two reports is that the Specification by Variable report lets you
select the variables you want to see on the report, while the Specification by Unit report lists all
variables for the selected production unit.
Both reports group the variables by the Variable groups defined in your plant model. Click a link
under the Effective Date column to view the specification history for a specific variable, which will
show you who made changes to the specifications and when they were made. Any specification
comments or transaction comments can also be viewed.

Variable Specification
106
Click the Graph icon to view a trend analysis of a selected variable.
Specification by Unit Report
This is an example of the Specification by Unit report, which is identical to the Specification by
Variable report.
Specification History Report
To see this report, from the Specification by Unit or Specification by Variable report, click a
hyperlink under the Effective Date column.

Plant Applications Web Reporting
107
Interactive Trend Report
To see this report, click the Graph icon next to a variable on the Specification by Unit or the
Specification by Variable report.
For more information on this report, see Simple Trend.
Variable Statistics Summary
This ASP application displays detailed statistical analysis of a selected variable for one or more
products. The following parameters are required:
The start and end time
The variable
The product(s)
The basis product
The basis product is the product that you use the specs from to calculate the theoretical limits.
Data for the analysis will include data from all the products but the theoretical limit calculations
will be based off the basis product.
Variable Statistics Summary Report
For the selected variable, the report provides the following charts:
Control Summary
The chart shows the percentage of values at the various specifications limits. Pause on the
various bars to view the percentage.

Variable Statistics Summary
108
Run Analysis
This chart is a graphical representation of the Statistics Summary and shows the minimum value,
the maximum value and the average for the selected time period. The time stamp is the most
recent production run after the specified start time.
Process Capability

Plant Applications Web Reporting
109
This histogram shows the number of occurrences of a value. A normal curve based on the actual
limits is overlaid as a reference.
Product Capability
This histogram shows the number of occurrences of a value. A normal curve based on theoretical
limits is overlaid as a reference.

Variable Statistics Summary
110
Control Chart
This chart plots the values over the specified time period.
Cusum Analysis
This chart plots the cumulative deviation from the mean. The cusum line is on top of the actual
values.

Plant Applications Web Reporting
111
Trend
This chart plots values against the specification limits, which are indicated by a dashed line.
Criteria Summary
This chart is a summary of the criteria used to create the report.

Viewing History
112
Products Analyzed
This chart lists the products analyzed on the report.
Viewing History
Most Plant Applications Web reports have a toolbar which helps you navigate within a report, filter
the report, or change the properties of the report. An important icon on the toolbar is the View
History icon .
This icon should be used in place of using your browser's Back button.
Clicking the View History icon will open the History dialog box, which contains a list of pages.
Within the History dialog box, double-click a page to return to that page.
Waste Detail
This web report is accessed from the following web reports:
Sequence of Events
Line Time Accounting
Event Detail
Click View Audit Trail to view an audit trail report.
To display electronic signature information, click the Properties icon on the web report's
toolbar and select Display Electronic Signature Information.

Plant Applications Web Reporting
113
Event Information
The Waste Detail report displays the following information for the Waste event:
Timestamp: The date and time the Waste event occurred.
Type: The type of waste. This is selected either during the event configuration or as part
of the waste model.
Entered in: The units of measure.
Time From Last Event: The amount of time since the last Waste event ended and this
Waste event began.
Product: The product that was being produced.
Added By: This is the service (for example, EventMgr) or user who inserted the Waste
event.
Updated By: If the Waste event has been edited, this is the person who last made a
change to the Waste event.
NOTE: If the Waste event has not been changed, Added By will be displayed. If the Waste event
has been changed, Updated By will be displayed.
Number of Updates: This is the number of times the Waste event was changed. Click
the number to view an audit trail report.
Cause or Action Information
Additionally, detailed cause and action information is provided if reason trees have been
configured for the Waste event. For more information on attaching reason trees to Waste events,
please see How to Attach Reason Trees to Waste Locations.
Parameter Summary
The Parameter Summary lists the specifications for variables with an event type of waste. You
can select the check box next to a variable and then click the Trend icon to view a trend
analysis report.
Web Part Administrator Environment
Using the automobile dashboard analogy, Web Parts are like the gauges and indicators on your
car's dashboard. The Web Part Administrator is where you configure and manage your Web
Parts, create new Web Parts, change default parameters, and access a variety of statistical
reports.
To open the Web Administrator, from the Plant Applications Server Manager tree, expand the
Server Management node and double-click Administrator Web Parts.

Web Part Administrator Environment
114
The Manage WebPart Template tabbed page lists all of the templates used to create
user-defined Web Parts. The Configure Available WebParts tabbed page lists all of the
user-defined Web Parts and is where the Web Parts are created and configured.
This area lists all Web Parts or Web Part templates and information about each Web Part
or template.
These buttons allow you to import or export Web Parts and Web Part templates.
This button allows you to preview the selected Web Part or Web Part template.
The WebPart Properties button is used to specify parameters that control things such as
the placement of your Web Part or Web Part template in your dashboard.
These buttons are used to create new Web Part templates, copy existing templates, and
delete templates.
These tabs provide information about the selected Web Part or Web Part template and
are where you edit the default parameters for the associated Web Part or template.

Plant Applications Web Reporting
115
Getting Started with Web Parts
What Is a Web Part?
Using the automobile dashboard analogy, Web Parts are like the gauges and indicators on your
car's dashboard. Plant Applications Web Parts provide you important summary information. Then,
if you need more specific information, you can click links within the Web Part that will provide you
information with greater detail. By editing a Web Part, you can create ad hoc reports.
A great way to view and use your Plant Applications Web Parts is to add them to a portal, where
you can build a "dashboard" of Web Parts. Currently, we support the use of Web Parts in
Windows® SharePoint™ Services and Windows® SharePoint™ Portal Server.
Logging on to the Web Parts Administrator
You must have Manager or Administrator access to the Administrator security group before
you can administer Web Parts.
To log on to the Web Parts Administrator:
1. Open the Plant Applications Administrator.
2. Expand Server Management.
3. Right-click Administer Web Parts and choose Administer Web Parts.
Web Part Administration Dialog Box
To access this dialog box: From Plant Applications Administrator, expand the Server
Management node and double-click Administer Web Parts
This dialog box is used to create, configure, and manage your Web Parts. Depending on how
you've configured the site parameter, Show Additional Web Part Configuration Tabs, you may
see two or four tabs:
This tab... Is where you...
Configure Available WebParts Create your own Web Parts to use in your portal.
Manage WebPart Templates Manage the Web Part templates that are used for creating your own Web Parts.
Manage Parameter Types Create parameter types that are associated with dialogs that you've created. This tab is visible only if the Show Additional Web Part Configuration Tabs site parameter is set to True.
Manage Dialogs Add dialogs to the Web Part system and then associated the dialogs with your user-defined parameter types. This tab is visible only if the Show Additional Web Part Configuration Tabs site parameter is set to True.

Getting Started with Web Parts
116
Creating Web Parts
Plant Applications comes with a certain number of templates, which can be found on the Manage
WebPart Templates tab. Web Parts are based off these templates, which determine the stored
procedures, parameters, and style sheets used to create your Web Part.
After you've created the Web Part, you can change the name, the parameter values, and
determine when the Web Part gets updated.
To create a Web Part:
1. Log on to the Web Part Administrator. How?
2. In the Web Part Administration dialog box, click the Configure Available WebParts
tab.
3. Click Add. The Add Report dialog box appears.
4. Under Template, select the template you want to base your Web Part on.

Plant Applications Web Reporting
117
5. In the Report Name box, type the name of the Web Part.
6. Click OK.
Configuring Your Web Part
Configuring your Web Part is how you determine the location of the Web Part within your
dashboard, the size of the Web Part within your digital dashboard, and certain cache options,
among others. You can also change various properties of a specific Web Part, such as the Web
Part name, parameter values, and scheduling.
Configuration changes made to a Web Part are applied only to that specific Web Part.
You can view a template's Web Part options, but you cannot edit them.
The WebParts Options dialog box is an interface for you to modify attributes of Web Parts viewed
in Windows SharePoint portal.
To configure a Web Part
1. Log on to the Web Parts Administrator. How?
2. In the Web Part Administration dialog box, click the Configure Available WebParts
tab.
3. Select the Web Part you want to configure and click WebParts Properties. The
WebParts Options dialog box appears.
4. Do one or more of the following:
k. In the Description box, type a brief description of the Web Part. This description
will be displayed on the Import Web Parts page within the Digital Dashboard.
l. Under Position on Page click the icon that represents where you want this Web
Part positioned on the dashboard page.
m. If you have more than one Web Part with the same position on the dashboard
page, you can type a number in the Position in Column box to specify the order
you want the Web Parts displayed. For example, Web Part A and Web Part B
both occupy the center of the dashboard page. If you type 1 in the Position in
Column box for Web Part A and you type 2 in the Position in Column for Web
Part B, Web Part A will be on top of Web Part B in the dashboard page.
n. Select or clear Display this Web Part in a frame. If you clear this option, the
Web Part will not have a border around it and will not have a title bar. Without the
title bar, you can not customize your Web Part.
o. Under Default State, click either the Expanded or Minimized button. This will
determine whether the Web Part is minimized or expanded when the dashboard
page is opened.
p. Select or clear Allow users to remove this Web Part from their dashboard. If
you clear this option, users will not be able to delete this Web Part from the
dashboard page.
q. Under Should this Web Part be cached,
Select ... To ...
No Re-fire the stored procedure each time the Web Part is loaded into the dashboard. The Web Part will not be cached and the contents will be updated.

Getting Started with Web Parts
118
Yes Enable the Cache Options.
Cache
Options
Description
Style All Users: Share the cached output with all users.
Per User: Cache the output for each individual user.
Seconds Type the number of seconds before the dashboard automatically refreshes the Web Part content.
r. Select Provide help for this Web Part through the following link if you want
to link to a help file for this Web Part. If you select this option, type the help file's
URL or full path in the box. The Web Part will have a Help icon in the title bar
that, when clicked, will open the help file.
s. Click Update to save your changes.
t. Click Close to close the dialog box.
Editing Default Parameter Values
Parameters are what make the Web Part unique. Parameters must be specified in order to
schedule automatic content refresh. Changing the default values for a template's parameters
won't affect any Web Parts that you have already created. It's not retroactive. However, any new
Web Parts that use the template will have the new default values.
To edit the parameter values for a Web Part:
1. Log on to the Web Part Administrator. How?
2. In the Web Part Administration dialog box, click the Configure Available WebParts
tab.
3. Click the Report Parameters tab to view a list of the parameters used in this Web Part.
4. Click Edit Parameters to change the default values for the parameters.
5. Make changes to the values.
6. On the Finish dialog box, click Finish to save your changes.
To edit the default parameter values for a template:
1. Log on to the Web Part Administrator. How?
2. In the Web Part Administration dialog box, click the Manage WebPart Templates tab.
3. Click the Parameter Defaults tab.
4. Click Edit Parameters.
5. Make changes to the default values.
6. On the Finish dialog box, click Finish to save your changes.
Scheduling your Web Part
You can control if or when your data is refreshed by selecting one of several scheduling options.
To schedule your Web Part:
1. Log on to the Web Parts Administrator. How?

Plant Applications Web Reporting
119
2. In the Web Parts Administration dialog box, click the Configure Available WebParts tab.
3. Click the Report Schedule tab.
4. Select Do Not Refresh Automatically if you do not want the Web Part to refresh
automatically. Once the Web Part has valid data, the Web Part will never refresh unless
you change a parameter value for the Web Part. You can force the Web Part to refresh
by clicking on the Web Part title bar.
5. Select Refresh on Each Load if you want the data to be refreshed (updated) each time
the Web Part is viewed.
6. Select Refresh Automatically if you want to schedule when the content is refreshed. You
can refresh the content at a specific time interval, based on a specific time, and based on
an Event.
You can select one or more of the following options.
a. To refresh the content of this Web Part on a fixed interval, select Refresh On A
Fixed Time Interval and define your interval on the Fixed Time Interval tab.
More information ...
b. To refresh the content of this Web Part on a specific day or date, select Refresh
Based On A Specific Time and specify the day or date on the Specific Time
tab. More information ...
c. To refresh the content of this Web Part based on a specific Plant Applications
Event, select Refresh Based On An Event and configure the event on the
Event Trigger tab. More information ...
Viewing Statistics
You can view information about report run times, CPU usage, and memory usage.
To view statistical information:
1. Log on to the Web Part Administrator. How?
2. In the Web Part Administration dialog box, click the Configure Available WebParts tab.
3. On the Report Properties tab, under Report Statistics, click Detailed Statistics. The
Content Generator Statistics dialog box appears.
4. Double-click one of the items in the tree.
5. Under Graph Controls, you can change the start and end times to view statistics.
6. To automatically refresh the display, select Automatically Move Time Window With
Refresh.
7. Under Refresh Rate - Seconds, choose how often you want the display to refresh.
8. Click Graph Style to select one of the following graph styles:
Step
Line
Bar
9. In the Maximum Number of Samples to Show box, type the number of samples to
display.

Getting Started with Web Parts
120
10. Click Close to close the dialog box.
Adding Dialogs
The Plant Applications Web Administrator comes with default dialogs. However, you can use your
custom .asp pages to create new dialogs. When you create a new parameter type, you can
associate the dialog with a parameter type so that the Web Parts know which dialogs to display.
CAUTION: You must be very careful when using this feature. Only someone with advanced
knowledge of Plant Applications, server technology, and web technology should use this
feature.
To add a dialog:
1. Log on to the Web Parts Administrator. How?
2. In the Web Part Administration dialog box, click the Manage Dialogs tab.
3. Click Add. The Add Dialog dialog box appears.
4. Do the following:
In the Dialog Name box, type the name of the dialog.
In the URL box, type the URL of the .asp page.
In the # Parameters Expected box, type the number of parameters used.
Click OK.
Adding Parameters
The Manage Parameter Types tab is used to create parameter types, such as unit collection,
that can be used by other Web Parts. The parameter types you create can then be associated
with the dialogs that you create on the Manage Dialogs tab.
CAUTION: You must be very careful when using this feature. Only someone with advanced
knowledge of Plant Applications, server technology, and web technology should use this
feature.
To add a parameter:
1. Log on to the Web Parts Administrator. How?
2. On the Manage Parameter Types tab, click Add.
The Manage Parameter Types tab is visible only if the Show Additional Web Part
Configuration site parameter has been set to true.
3. In the Add Parameter dialog box, type a name for the new parameter in the Parameter
Name box.
4. Select a parameter type from the Parameter Type list.
5. Click Configure Dialogs to select the dialogs to include with your parameter.
6. In the Available Dialogs dialog box, select the dialog(s) and click the Move Selected
button.
7. Click OK.

Plant Applications Web Reporting
121
8. Click OK.
Columns Tab
You can customize this Web part by using the Columns tab to determine the information you want
displayed on this Web part. The choices for columns is dependant on the Web part. Keep in mind
that if you do not select a column, the information for that column will not be included in the Web
part.
To use the Column tab
1. Under the Available Columns list, select the column(s) you want displayed on this Web
part and click the Move Selected arrow. To display all columns click the Move All
arrows.
2. Under the Visible Columns list, select the column(s) you do not want displayed on this
Web par and click the Remove Selected arrow. To remove all columns, click the
Remove All arrows.
CrewFilter Tab
This tab allows you to filter on a specific crew. If you select <Any>, you will get all crews.
To use this tab
From the Crew list, select a specific crew to filter on. Only the crew you select will be
included on the report.
Deleting Parameters
Before you can delete a parameter, you must delete it from all templates using the parameter.
To delete a parameter:
1. Log on to the Web Parts Administrator. How?
2. On the Manage Parameter Types tab, select the parameter you want to delete.
3. Click Delete.
4. Click Yes to confirm the deletion.
Page Caching
In order to be sure that the data in your report is the most current, you need to turn Page
Caching off in Internet Explorer. If page caching is left on, then when you run the report, you will
get the cached report, rather than the most current report.
To turn page caching off in Internet Explorer:
1. Open Internet Explorer.
2. From the Tools menu, select Internet Options.
3. In the Internet Options dialog box, on the General tab, click Settings.
4. In the Settings dialog box, select Every visit to the page.

Getting Started with Web Parts
122
5. Click OK to save your changes and close the dialog box.
6. Click OK to close the Internet Options dialog box.
Query Results Page
The Query Results page lists all of the batches that matched your criteria. You use this page to
select the batches you want to analyze. For each batch in the analysis, the following information
is provided:
The batch name
The product
The status of the batch
The department name (this is from your Plant Model)
The production line name
The production unit name
The batch start time
The batch end time
From this page you can run the following reports:
Production Timeline
Batch Genealogy
Batch Summary
Parameter Comparison
Cycle Time Comparison
Timeline Comparison
Selecting Batches
There are two ways to select batches. To select a single batch, click the option button (also
known as a radio button) next to the batch you want to analyze. To select multiple batches, you
can either click the check box at the top of the check box column to select all batches or you can
click the check box next to the batches that you want to analyze. For the reports the multiple
batch reports, you must select three or more batches. The batch that has the option button
selected becomes the batch that the other batches are compared against.
Specifying Start and End Times
Certain web parts require you to specify a time span. To help you do that, when you configure
one of these web parts, you are presented with a tabbed page that contains various pre-defined
time options that you can select, or you can specify your own, user-defined, time span.
For the predefined time options, the start and end times are determined by the site parameters,
EndOfDayHour and EndOfDayMinute, and a production day is the 24-hour period based on the
values in the EndOfDayHour and EndOfDayMinute site parameters. For example, if
EndOfDayHour is 7 and EndOfDayMinute is 0 (zero), then a production day starts at 7:00 am and
ends the following day at 7:00 am.

Plant Applications Web Reporting
123
Pre-defined Time Options
User-defined: This option allows you to specify your own time span. If you select this
option, you can enter specific dates or dates and times in the User Defined section of this
page.
Today: If you select this option, the start time will be the start time of the current date and
the end time will be the current time.
Yesterday: Select this option to retrieve the previous production days's information.
Last 3 Days: Select this option to retrieve information from the previous three days.
This Month: Select this option to retrieve information starting at the beginning of the first
production day of the current month and ending at the current time.
Last 7 Days: Select this option to retrieve information from the previous seven
production days.
Last 30 Days: Select this option to retrieve information from the previous 30 production
days.
Last Month: Select this option to retrieve information from the previous month.
User-defined Time Options
You can specify your own user-defined time span. In order to use this option, you must select
User Defined under Time Options. You can click the Calendar icon to view a calendar from
which you can select a specific date. You can click the Formula icon to view a list of pre-
defined formulas.
You can also create your own formulas. Valid parameters are:
Now = the current date and time.
sec = seconds
min = minutes
h = hours
d = days
Valid operators are + and -. A space is required on both sides of the operator.
Viewing a Report
The Web client interface has the look and feel of the Windows Explorer. The windows is divided
into two panes. The left pane displays the reports and web content available to the current user.
When you click on a report definition or web content, it is displayed in the right pane. When you
click a report type, the report dialogs are displayed in the right pane.
Viewing the Report Engine Queue
You can see which reports are currently waiting to be processed by the Report Engines by
viewing the Engine Queue in the Current Activity folder. You can also remove reports from the
Engine Queue.
To view the Engine Queue:

Managing Web Part Templates
124
1. Log on to the Web Administrator. How?
2. Open the Current Activity folder.
3. Double-click Engine Queue to display the reports in the right pane.
Managing Web Part Templates
To access this dialog box: From Plant Applications Administrator, expand the Server
Management node, double-click Administer Web Parts, then click the Manage WebPart
Templates tab.
Templates are the building blocks for creating your own Web Parts. It is important to note that any
changes you make to the template parameters become the default for any Web parts based off
the template.
The Manage WebPart Templates tab lists all of the available templates. From this tab you can:
Export a single template or all templates
Import a .zip file containing Web Parts
Preview a template
View and change the template properties
Copy templates
Add (create) new templates
Delete templates
Column Names
You can click a column heading to sort by that column.
Name: This is the name of the template.
Version: On initial import, the version number is set to 1. When a copy is made of a template, the
version of the copied template is set to 2.
Locked: Templates are initially locked for security purposes. Locked templates can not be edited.
If you need to edit a template, create a copy of it and then edit the properties of the copy.
Type: Templates can be either ASP or XML. If the template type is ASP, there is an associated
ASPX page that will be displayed for the Web Part. If the type is XML, then there is XSL stored in
the database for the template. The XSL and the XML will generate HTML, which will display the
Web Part. XSL template are stored in the database. ASP and ASPX files are in the inetpub
directory.
Screen Size: Some templates have a fixed size. The dimensions are displayed in this column. If
there are no dimensions, the Web Part will automatically fit the zone in which they are placed. If
you need to control the size of a Web Part, you can create a copy of the template and then edit
the properties of the copy.
# Parameters: The number of available inputs to the stored procedure associated with the
template. This does not mean the number of required parameters for the stored procedure.
Stored Procedure: The name of the stored procedure used by the associated template.

Plant Applications Web Reporting
125
Launch Type: The way the Web Part is displayed.
Template Filename: This is the file name for this Web part.
Template Preview Filename: This is the name of the image file used as a preview of the Web
part.
Associated Templates and Reports
Templates can have other templates associated with them. These associated templates continue
as links in your Web Parts and are passed any parameters, such as start and end time, from the
originating Web Part.
For example:
Template 1 is used to create Web Part 1.
Template 1 has an associated template, Template 2.
An operator opens Web Part 1 in the dashboard.
Web Part 1 contains a link that will open Web Part 2, which is based on the associated
Template 2. The parameters used to configure Web Part 1 are passed to Web Part 2.
You can view associated templates on the Associated Templates tab on the Manage WebPart
Templates tab.
You can view associated reports on the Associated Reports tab on the Configure Available
WebParts tab.
Editing Template Parameter Values
Parameters are what make the Web Part unique. Parameters must be specified in order to
schedule automatic content refresh. Changing the default values for a template's parameters
won't affect any Web Parts that you have already created. It's not retroactive. However, any new
Web Parts that use the template will have the new default values.
To edit the default parameter values for a template:
1. Log on to the Web Part Administrator. How?
2. In the Web Part Administration dialog box, click the Manage WebPart Templates tab.
3. Click the Parameter Defaults tab.
4. Click Edit Parameter.
5. Make changes to the default values.
6. On the Finish page, click Finish to save your changes.
Copying Templates
All of the default templates that come with Plant Applications have been locked and can not be
edited or changed. However, you can create a copy of a template, which will allow you to make
changes to the template.
To copy a template:

Managing Web Part Templates
126
1. Log on to the Web Part Administrator. How?
2. In the Web Part Administration dialog box, click the Manage WebPart Template tab.
3. Select the template you want to copy and click Copy As. The Copy As dialog box
appears.
4. Click Copy to accept the default name and create a copy of the template, or type a new
name for the template and then click Copy.
5. Make your changes to the copy of the template.
Exporting a Template
You can export a template for use on another server. When you export the template, you'll be
able to determine the files that are also exported with the template, and whether the template will
be locked (unable to be edited) on the other server.
You can export only one template at a time. If you want to export the entire database of Web
Parts, see Exporting It All.
To export one template:
1. Log on to the Web Part Administrator. How?
2. In the Web Part Administration dialog box, click the Manage WebPart Templates tab.
3. Select the template you want to export and click Export Template. The Export Options
dialog box appears.
4. Do one or more of the following:
To export the stored procedures associated with the template, click Export Local Stored
Procedures.
To lock the template when it is imported, click Lock Templates.
5. Click Export. The Export Finalization dialog box appears.
6. Under Generated Export Files is the file that will be exported. The .prdb file is an XML-
based file that maps the database structure for the selected template. Under Additional
Files Needed is a list of additional files that are needed in order for this template to run. If
the destination server already has these files, you do not need to add them. However, if
the destination server does not have these files, then you will need to add them. Do one
of the following:
If you do not need to add the additional files:
a. Under Export File Name, click Browse . The Change Zip FileName dialog
box appears.
b. Specify the location of the export file.
c. Click Export.
If you need to add the additional files:
a. Click Browse next to Set Base Path For Export.

Plant Applications Web Reporting
127
b. In the Select Base Path dialog box, browse to the location of the files you need to
add and click OK.
c. Under Added Files, click Add New. The Add Template Export Files dialog box
appears.
d. Select the file you want to add and click Open. The Export Relative Path dialog
box appears.
e. Type the path relative to the physical path, which is the path you specified as the
base path in step b above. This will determine where the file is stored during the
import.
f. Click OK.
g. Repeat steps c - f for each file you need to add.
h. Under Export File Name, click Browse . The Change Zip FileName dialog
box appears.
i. Specify the location of the export file.
j. Click Export.
Exporting All Templates
You can export all templates and associated files. If you want to export only one template, see
Exporting a Template.
To export all templates:
1. Log on to the Web Part Administrator. How?
2. In the Web Part Administration dialog box, click the Manage WebPart Templates tab.
3. Click Export All. The Export Finalization dialog box appears.
4. Under Generated Export Files are the files that will be exported. The .prdb file is an
XML-based file that maps the database structure for the templates. Under Additional
Files Needed is a list of additional files that are needed in order for these templates to
run. If the destination server already has these files, you do not need to add them.
However, if the destination server does not have these files, then you will need to add
them.
5. Click Browse next to Set Base Path For Export. The Select Base Path dialog box
appears.
6. Browse to the location of the files you need to add and click OK.
7. Under Added Files, click Add New. The Add Template Export Files dialog box
appears.
8. Select the file you want to add and click Open. The Export Relative Path dialog box
appears.
9. Type the path relative to the physical path, which is the path you specified as the base
path in step 6. This will determine where the file is stored during the import.
10. Click OK.
11. Repeat steps 7 - 10 for each file you need to add.

Configuring Available Web Parts
128
12. Under Export File Name, click Browse . The Change Zip FileName dialog box
appears.
13. Specify the location of the export file.
14. Click Export.
Configuring Available Web Parts
Creating Web Parts
Plant Applications comes with a certain number of templates, which can be found on the Manage
WebPart Templates tab. Web Parts are based off these templates, which determine the stored
procedures, parameters, and style sheets used to create your Web Part.
After you've created the Web Part, you can change the name, the parameter values, and
determine when the Web Part gets updated.
To create a Web Part:
1. Log on to the Web Part Administrator. How?
2. In the Web Part Administration dialog box, click the Configure Available WebParts
tab.
3. Click Add. The Add Report dialog box appears.
4. Under Template, select the template you want to base your Web Part on.
5. In the Report Name box, type the name of the Web Part.
6. Click OK.
Configuring Your Web Part
Configuring your Web Part is how you determine the location of the Web Part within your
dashboard, the size of the Web Part within your digital dashboard, and certain cache options,
among others. You can also change various properties of a specific Web Part, such as the Web
Part name, parameter values, and scheduling.
Configuration changes made to a Web Part are applied only to that specific Web Part.
You can view a template's Web Part options, but you cannot edit them.
The WebParts Options dialog box is an interface for you to modify attributes of Web Parts viewed
in Windows SharePoint portal.
To configure a Web Part
1. Log on to the Web Parts Administrator. How?
2. In the Web Part Administration dialog box, click the Configure Available WebParts tab.
3. Select the Web Part you want to configure and click WebParts Properties. The WebParts
Options dialog box appears.
4. Do one or more of the following:

Plant Applications Web Reporting
129
a. In the Description box, type a brief description of the Web Part. This description
will be displayed on the Import Web Parts page within the Digital Dashboard.
b. Under Position on Page click the icon that represents where you want this Web
Part positioned on the dashboard page.
c. If you have more than one Web Part with the same position on the dashboard
page, you can type a number in the Position in Column box to specify the order
you want the Web Parts displayed. For example, Web Part A and Web Part B
both occupy the center of the dashboard page. If you type 1 in the Position in
Column box for Web Part A and you type 2 in the Position in Column for Web
Part B, Web Part A will be on top of Web Part B in the dashboard page.
d. Select or clear Display this Web Part in a frame. If you clear this option, the
Web Part will not have a border around it and will not have a title bar. Without the
title bar, you can not customize your Web Part.
e. Under Default State, click either the Expanded or Minimized button. This will
determine whether the Web Part is minimized or expanded when the dashboard
page is opened.
f. Select or clear Allow users to remove this Web Part from their dashboard. If
you clear this option, users will not be able to delete this Web Part from the
dashboard page.
g. Under Should this Web Part be cached,
Select ... To ...
No Re-fire the stored procedure each time the Web Part is loaded into the dashboard. The Web Part will not be cached and the contents will be updated.
Yes Enable the Cache Options.
Cache
Options
Description
Style All Users: Share the cached output with all users.
Per User: Cache the output for each individual user.
Seconds Type the number of seconds before the dashboard automatically refreshes the Web Part content.
h. Select Provide help for this Web Part through the following link if you want
to link to a help file for this Web Part. If you select this option, type the help file's
URL or full path in the box. The Web Part will have a Help icon in the title bar
that, when clicked, will open the help file.
i. Click Update to save your changes.
j. Click Close to close the dialog box.
Web Part Display Settings
These options determine how the Web Part will be displayed in the dashboard or in the Plant
Applications Web Server.
To control how your Web Part is displayed
1. Log on to the Web Parts Administrator. How?
2. In the Web Part Administration dialog box, click the Configure Available WebParts tab.

Configuring Available Web Parts
130
3. Select the Web Part you want to configure and click Web Parts Properties. The Web
Parts Options dialog box appears.
4. Do one or more of the following:
a. In the Description box, type a brief description of the Web Part.
b. Under Position on Page click the icon that represents where you want this Web
Part positioned on the dashboard or portal page.
c. If you have more than one Web Part with the same position on the dashboard or
portal page, you can type a number In the Position in Column box to specify the
order you want the Web Parts displayed. For example, Web Part A and Web Part
B both occupy the center of the dashboard or portal page. If you type 1 in the
Position in Column box for Web Part A and you type 2 in the Position in
Column for Web Part B, Web Part A will be on top of Web Part B in the
dashboard or portal page.
d. Select or clear the Display this Web Part in a frame option. If you clear this
option, the Web Part will not have a border around it and will not have a title bar.
Without the title bar, you cannot customize your Web Part.
e. Under Default State, click either the Expanded or Minimized button. This will
determine whether the Web Part is minimized or expanded when the dashboard
or portal page is opened.
f. Select or clear the Allow users to remove this Web Part from their
dashboard option. If you clear this option, users will not be able to delete this
Web Part from the dashboard or portal page.
g. Under Should this Web Part be cached, select Yes or No. If you select Yes,
the output of a Web Part will be cached for a period of time before the dashboard
or portal refreshes it. See step h.
h. If you chose Yes in step g, you can determine if the cached output can be
shared by all users or cached separately for each individual user, and the period
of time, in seconds, before the dashboard will refresh it. From the Style drop-
down list, select All Users to share the cached output with all users or select Per
User to cache the output for each individual user. In the Seconds box, type the
number of seconds before the dashboard will automatically refresh the output.
i. Select the Provide help for this Web Part through the following link if you
want to link to a help file for this Web Part. If you select this option, type the help
file's URL or full path in the box. The Web Part will have a Help icon in the title
bar that, when clicked, will open the help file.
j. Click Update to save your changes.
k. Click Close to close the dialog box.
Deleting Web Parts
You can delete Web Parts from just the dashboard, but still have them available for use on other
dashboards, or you can permanently delete them.
To permanently delete a Web Part from the Web Part Administrator:
1. Log on to the Web Part Administrator. How?
2. On the Configure Available WebParts tab, select the Web Part that you want to delete.

Plant Applications Web Reporting
131
3. Click Delete.
4. Click Yes to confirm the deletion.
Previewing Web Parts
After you create a Web Part, you can quickly preview it to make sure it will contain the content
you want.
To preview a Web Part:
1. Log on to the Web Part Administrator. How?
2. On the Configure Available WebParts tab, select the Web Part you want to preview.
3. Click Preview .
4. After the Web Part loads, verify that it contains the content you want and then click the
Close button on the title bar.
Copying Web Parts
When you copy a Web Part, the copied version will contain the same attributes as the original
Web Part, so you do not have to create a Web Part from scratch. Once the Web Part has been
copied, the copy will get a new version number based on the assumption that changes will be
made to the copy.
To create a copy of a Web Part:
1. Log on to the Web Part Administrator.
2. In the Web Part Administration dialog box, click the Configure Available WebParts tab.
3. Select the Web Part you want to copy and click Copy As. The Copy As dialog box
appears.
4. Type a new name for the Web Part.
You can accept the current name of the Web Part. If you do, the copy of the Web Part will be
given a different version number. If you change the name of the template, the version number will
be 1 (one).
5. Click Copy.
Editing Web Part Parameter Values
Parameters are what make the Web Part unique. Parameters must be specified in order to
schedule automatic content refresh. Changing the default values for a Web Part's parameters
won't affect any Web Parts that you have already created. It's not retroactive. However, any new
Web Parts that use the template will have the new default values.
To edit the parameter values for a Web Part
1. Log on to the Web Part Administrator. How?
2. In the Web Part Administration dialog box, click the Configure Available WebParts
tab.

Configuring Available Web Parts
132
3. Click the Report Parameters tab to view a list of the parameters used in this Web Part.
4. Click Edit Parameter to change the values for the parameters and click Finish on the
Finish tab. You will return to the Web Part Administration dialog box.
5. On the Report Properties tab, click Update.
Changing Web Part Properties
After you've created your Web Part, you can change the name of the Web Part, the template that
is associated with the Web Part, and assign a security group to the Web Part.
To change the Web Part properties:
1. Log on to the Web Part Administrator. How?
2. In the Web Part Administration dialog box, click the Configure Available WebParts tab.
3. Select the desired Web Part and click the Report Properties tab at the bottom of the
dialog box.
4. Do one or more of the following:
To change the name of the Web Part, type the new name in the Report Name box.
To assign a new template to the Web Part, select a template from the Report Template
drop-down list.
To apply a security group to the Web Part, select a security group from the Security
Group drop-down list.
To determine the number of reports that get saved to the database, type a number in the
#Versions to Save box.
5. Click Update.
Scheduling your Web Part
You can control if or when your data is refreshed by selecting one of several scheduling options.
To schedule your Web Part:
1. Log on to the Web Parts Administrator. How?
2. In the Web Parts Administration dialog box, click the Configure Available WebParts tab.
3. Click the Report Schedule tab.
4. Select Do Not Refresh Automatically if you do not want the Web Part to refresh
automatically. Once the Web Part has valid data, the Web Part will never refresh unless
you change a parameter value for the Web Part. You can force the Web Part to refresh
by clicking on the Web Part title bar.
5. Select Refresh on Each Load if you want the data to be refreshed (updated) each time
the Web Part is viewed.
6. Select Refresh Automatically if you want to schedule when the content is refreshed.
You can refresh the content at a specific time interval, based on a specific time, and
based on an Event.
You can select one or more of the following options.

Plant Applications Web Reporting
133
a. To refresh the content of this Web Part on a fixed interval, select Refresh On A
Fixed Time Interval and define your interval on the Fixed Time Interval tab.
More information ...
b. To refresh the content of this Web Part on a specific day or date, select Refresh
Based On A Specific Time and specify the day or date on the Specific Time
tab. More information ...
c. To refresh the content of this Web Part based on a specific Plant Applications
Event, select Refresh Based On An Event and configure the event on the
Event Trigger tab. More information ...
Associated Templates and Reports
Templates can have other templates associated with them. These associated templates continue
as links in your Web Parts and are passed any parameters, such as start and end time, from the
originating Web Part.
For example:
Template 1 is used to create Web Part 1.
Template 1 has an associated template, Template 2.
An operator opens Web Part 1 in the dashboard.
Web Part 1 contains a link that will open Web Part 2, which is based on the associated
Template 2. The parameters used to configure Web Part 1 are passed to Web Part 2.
You can view associated templates on the Associated Templates tab on the Manage WebPart
Templates tab.
You can view associated reports on the Associated Reports tab on the Configure Available
WebParts tab.
Exporting Web Parts
You can export all Web Parts and associated files, including templates, to a ZIP file that can be
re-imported if you ever need to restore your database to a working state.
To export all Web Parts
1. Log on to the Web Part Administrator. How?
2. In the Web Part Administration dialog box, click the Configure Available WebParts tab.
3. Click Export Full. The Export Options dialog box appears.
4. Do one or more of the following:
Select Export Local Stored Procedures to include any user-created stored procedures
in the export file.
Select Lock Templates to lock the templates. Templates are initially locked for security
purposes. Locked templates cannot be edited. If you need to edit a template, create a
copy of it and then edit the properties of the copy.
5. Click Export. The Export Finalization dialog box appears.

Using Web Parts in a Portal
134
6. Under Generated Export Files are the files that will be exported. The .prdb file is an
XML-based file that maps the database structure for the templates. Under Additional
Files Needed is a list of additional files that are needed in order for these templates to
run. If the destination server already has these files, you do not need to add them.
However, if the destination server does not have these files, then you will need to add
them.
7. Click Browse next to Set Base Path For Export. The Select Base Path dialog box
appears.
8. Browse to the location of the files you need to add and click OK.
9. Under Added Files, click Add New. The Add Template Export Files dialog box
appears.
10. Select the file you want to add and click Open. The Export Relative Path dialog box
appears.
11. Type the path relative to the physical path, which is the path you specified as the base
path in step 8. This will determine where the file is stored during the import.
12. Click OK.
13. Repeat steps 7 - 10 for each file you need to add.
14. Under Export File Name, click Browse . The Change Zip FileName dialog box
appears.
15. Specify the location of the export file and click Export.
Using Web Parts in a Portal
Using Web Parts in Windows® SharePoint™ Services
Windows SharePoint Services is the engine that allows you to create Web sites for information
sharing and document collaboration. A key piece of the information worker infrastructure
delivered in Microsoft Windows Server 2003, Windows SharePoint Services provides additional
functionality to the Microsoft Office System and other desktop applications, as well as serving as
a platform for application development.
You can also use Plant Applications Web Parts in Windows SharePoint Portal Server, which
extends the capabilities of Windows SharePoint Services by providing organizational and
management tools for SharePoint sites, and by enabling teams to publish information to the entire
organization.
The difference between Windows SharePoint Services and Windows SharePoint Portal Server is
Windows SharePoint Services provides sites for team collaboration, while SharePoint Portal
Server 2003 connects these sites, people, and business processes — facilitating knowledge
sharing and smart organizations.
SharePoint Services is included with Microsoft Windows Server 2003 Service Pack 1. You can
download a free copy from Microsoft's site at www.microsoft.com. Search on "sharepoint
services."
To view Web Parts in SharePoint Services

Plant Applications Web Reporting
135
1. Open your SharePoint Services Web site and navigate to the desired Web page.
2. Click Modify Shared Page.
3. Point to Add Web Parts, and click Browse.
4. Click Online Gallery.
5. Drag the desired Web Part onto the Web page.
Only Web Parts that are user-configured (on the Configure Available WebParts tab) can be
added to your portal.
Web Part Services and Parameters
Webpart Content Generator service
The Webpart Content Generator service:
Performs database maintenance. It manages ad hoc reports and statistics.
Looks for and removes ad hoc reports that are no longer needed.
Monitors statistics and flushes the old statistics based on a configurable interval. See
Session Manager Stat Life (Days) parameter for more information.
Acts as the scheduler and is able to receive events.
Monitors all Web Part reports that have been scheduled.
Opens a socket and waits to receive an incoming event for a scheduled report. Once an
incoming event is received, the Webpart Content Generator will get the template and run
the report.

136
Standard Web Parts Overview
= Required; = Optional
Quality Module
Product
Module
Efficiency Module Production
Module
All
Produ
ction
Event
Produ
ction
Event
Statu
s
Produ
ction
Event
Dimen
sions
Crew/
Shift
Prod
ucts
and
Prod
uct
Cha
nges
Down
time
Wa
ste
Fa
ult
Produ
ction
Metric
Product
ion
Metric
Specific
ations
Proce
ss
Order
s and
Sche
dules
Exec
ution
Path
s
Varia
bles
Variabl
e
Specific
ations
Alar
ms
Rea
sons
Alarm
Count
by
Variabl
es
Alarm
Details
by
Produc
tion
Event
Alarm
List by
Variabl
es

Plant Applications Web Reporting
137
Alarm
List by
Units
Downti
me
Distrib
ution
Charts
by
Units
Downti
me
Top N
Charts
by
Units
Efficien
cy
Statisti
cs by
Unit
Invento
ry
Distrib
ution
Logout
My
Report
Search
Dialog
My
Report

Standard Web Parts Overview
138
s
Favorit
es
Dialog
Operati
ng
Downti
me
Distrib
ution
Overvi
ew
Statisti
cs by
Path
Proces
s
Order
(Active
) List
by
Lines
Proces
s
Order
Search
by
Paths
Proces
s
Order
Search
Dialog

Plant Applications Web Reporting
139
Produc
t
Statisti
cs by
Unit
Produc
tion
Distrib
ution
Charts
by
Units
Produc
tion
Event
Alarms
by Unit
Produc
tion
Event
Search
by Unit
Produc
tion
Statisti
cs by
Lines
Quality
Statisti
cs by
Variabl
es

Standard Web Parts Overview
140
Specifi
cation
Search
by
Units
Specifi
cation
Search
Dialog
Unit
OEE
Waste
Distrib
ution
Waste
Top N
Charts
by
Units

141
Alarm Count by Variables Web Part
The Alarm Count By Variables Web Part graphically displays the number and level of alarms during
three user-specified time periods for selected variables. From this Web Part, you can view the Alarm
List By Variables Web Part.
In order to use this Web Part, you must first:
Create your plant model
Create your products
Create variables on a production unit
Add products to the production unit
Enter specification limits for those variables on the production unit for the selected products
Configure an Alarm Template
Configure an Alarm Display
The top row indicates whether the number of alarms is trending up, down, or remaining the same.
The alarm count for each category in the first row is compared to the alarm count for each
category in the second row. For each alarm level, if the alarm count in the first row exceeds the
alarm count in the second row, then a red down-pointing arrow is displayed. If the alarm count in
the first row is less than the alarm count in the second row, then a green up-pointing arrow is
displayed. If there is no change, then a green circle is displayed.
The red column displays the number of high alarms. The blue column displays the number of
medium alarms. The yellow column displays the number of low alarms.
The first row of numbers is the number of alarms, in each category, for the specified Start Time #1.
The second row of numbers is the number of alarms, in each category, for the specified Start Time
#2. The third row of numbers is the number of alarms, in each category, for the specified Start
Time #3.
You can click a number in the grid to open the Alarm List By Variables web part.
To create an Alarm Count by Variables Web Part
1. Create the web part. How?
2. On the Report Parameters tab, click the Edit Parameter button.
3. On the Variables tab, select the variables you want included on this web part.
4. After you've selected your variables, click the Start and End Time #1 tab. On this tab, you
can specify the most current time period over which you want to count alarms on your
selected variables. These alarm counts are displayed in the top row of the web part.

Alarm Details by Production Event Web Part
142
5. Click the Start and End Time #2 tab. On this tab, you can specify a time period prior to the
time period specified on the Start and End Time #1 tab.
6. Click the Start and End Time #3 tab. On this tab, you can specify a time period prior to the
time period specified on the Start and End time #2 tab.
7. Click the Finish tab and click the Finish button to save your changes and to return to the Web
Part Administration dialog box.
Alarm Details by Production Event Web Part
The Alarm Details by Production Event Web Part displays information about alarms for a specific
production event on a production unit. This Web part is for ad hoc reporting only or is available from
other Web parts. You can not add this Web part to your list of available Web Parts.
NOTE: You can view this Web Part from the Production Event Alarms by Unit Web Part.
In order to use this Web Part, you must first:
Create your plant model
Create your products
Create variables on a production unit
Add products to the production unit
Enter specification limits for those variables on the production unit for the selected products
Get data into your variables (Autolog, Historian tag, Calculations, etc.)
Capture production events
Configure an Alarm Template
Configure an Alarm Display
This Web Part provides the following information:
Priority: This is the alarm level and can be High, Medium, or Low. These were determined
when you configured the Alarm Template.
Variable: This is the variable that triggered the alarm.

Plant Applications Web Reporting
143
Message: This is the text that was entered when the Alarm Template was created. More
information...
Value: This is the value that triggered the alarm. Click the Interactive Trend Analysis
icon to view a trend analysis for the variable.
LRL: Lower Reject Limit. If the Value is less than the LRL, both the Value and the LRL will be
red.
LWL: Lower Warning Limit. If the Value is less than the LWL, but greater than the LRL, both
the Value and the LWL will be blue.
TGT: Target. This is the target value and it is always green.
UWL: Upper Warning Limit. If the Value is greater than the UWL, but less than the URL, both
the Value and the UWL will be blue.
URL: Upper Reject Limit. If the Value is greater than the URL, both the Value and the URL
will be red.
User: The electronic signature of the person who gave user verification, if electronic signature
has been configured.
Approver: The electronic signature of the person who gave approver verification, if electronic
signature has been configured.
Comments: This will display any comments associated with the event.
History:
To configure the Alarm Details by Production Event Web Part
If you edit the parameters for this Web Part template, then those values will become the default. If you
leave the parameter as is, then the values from the Web Part from which this Web Part was accessed
will be passed to this Web Part.
1. Log in to the Web Administrator. How?
2. Click the Manage WebPart Templates tab.
3. Select Alarm Details By Production Event.
4. Click the Parameter Defaults tab.
5. Click the Edit Parameter button.
6. On the Unit tab, select the production line and then select the production unit.
7. On the Options tab, enter the event number, if you want to filter on a specific event number.
8. On the Finish tab, click the Finish button.
Alarm List By Units Web Part
The Alarm List by Units Web Part displays information about alarms for a specific production unit over
a specific period of time.
The reporting time period is displayed at the bottom of the Web Part. To adjust the reporting period,
click the Clock icon.
In order to use this Web Part, you must first:
Create your plant model
Create your products
Create variables on a production unit
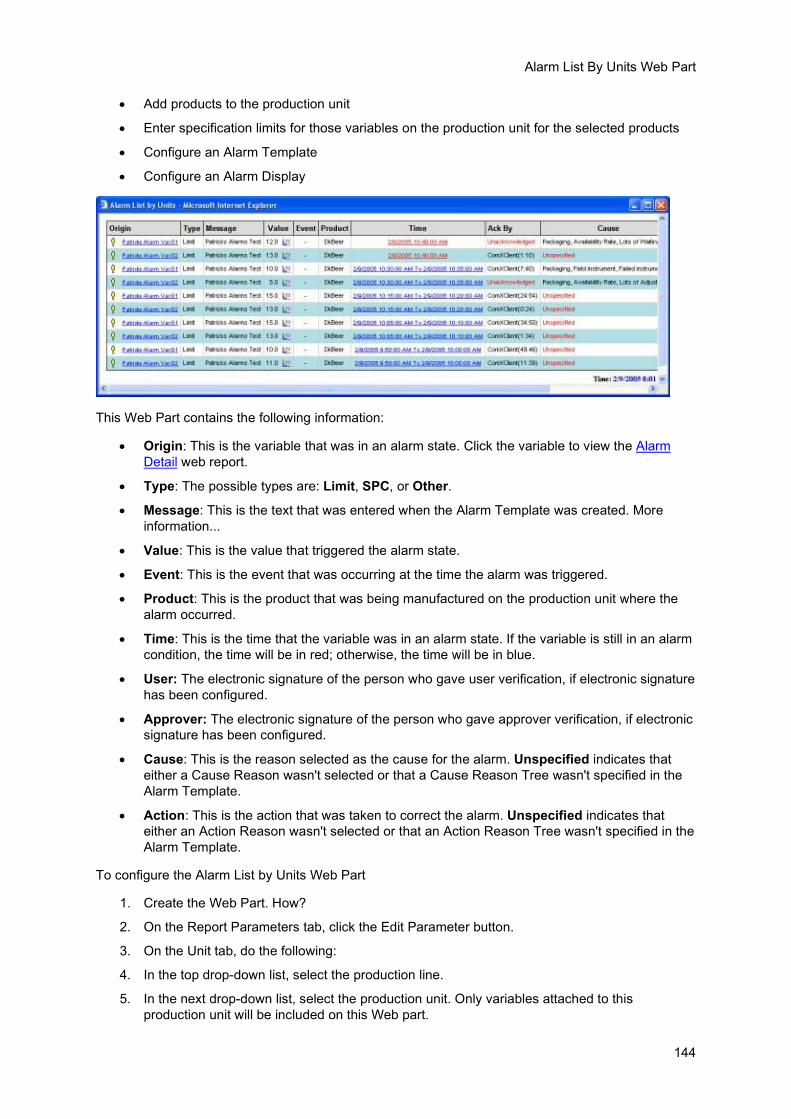
Alarm List By Units Web Part
144
Add products to the production unit
Enter specification limits for those variables on the production unit for the selected products
Configure an Alarm Template
Configure an Alarm Display
This Web Part contains the following information:
Origin: This is the variable that was in an alarm state. Click the variable to view the Alarm
Detail web report.
Type: The possible types are: Limit, SPC, or Other.
Message: This is the text that was entered when the Alarm Template was created. More
information...
Value: This is the value that triggered the alarm state.
Event: This is the event that was occurring at the time the alarm was triggered.
Product: This is the product that was being manufactured on the production unit where the
alarm occurred.
Time: This is the time that the variable was in an alarm state. If the variable is still in an alarm
condition, the time will be in red; otherwise, the time will be in blue.
User: The electronic signature of the person who gave user verification, if electronic signature
has been configured.
Approver: The electronic signature of the person who gave approver verification, if electronic
signature has been configured.
Cause: This is the reason selected as the cause for the alarm. Unspecified indicates that
either a Cause Reason wasn't selected or that a Cause Reason Tree wasn't specified in the
Alarm Template.
Action: This is the action that was taken to correct the alarm. Unspecified indicates that
either an Action Reason wasn't selected or that an Action Reason Tree wasn't specified in the
Alarm Template.
To configure the Alarm List by Units Web Part
1. Create the Web Part. How?
2. On the Report Parameters tab, click the Edit Parameter button.
3. On the Unit tab, do the following:
4. In the top drop-down list, select the production line.
5. In the next drop-down list, select the production unit. Only variables attached to this
production unit will be included on this Web part.

Plant Applications Web Reporting
145
6. On the Start Time and End Time tab, select the period of time for which you want alarm
information retrieved.
7. On the PriorityFilter tab, select the alarm level(s) you want on your web part.
8. On the Columns tab, select the columns you want to include on your web part. The available
choices are:
Origin: This is the variable that was in an alarm state.
Type: The possible types are: Limit, SPC, and Other.
Message: This is the text that was when the Alarm Template was created. More information...
Value: This is the value that triggered the alarm state.
Event: This is the event that was occurring at the time the alarm was triggered.
Product: This is the product that was being manufactured on the production unit where the
alarm occurred.
Time: This is the time that the variable was in an alarm state. If the variable is still in an alarm
condition, the time will be in red; otherwise, the time will be in blue.
Ack By: This is the user name of the person who acknowledged the alarm. The number in
parenthesis is the number of minutes:seconds it took for the alarm to be acknowledged.
Cause: This is the reason selected as the cause for the alarm. Unspecified indicates that
either a Cause Reason wasn't selected or that a Cause Reason Tree wasn't specified in the
Alarm Template.
Action: This is the action that was taken to correct the alarm. Unspecified indicates that
either an Action Reason wasn't selected or that an Action Reason Tree wasn't specified in the
Alarm Template.
9. On the Options tab, select OpenOnly to include only variables that are currently in an alarm
state.
10. On the Finish tab, click the Finish button to save your changes and to exit.
Alarm List By Variables Web Part
The Alarm List by Variables Web Part displays information about alarms for a specific variable or
variables over a specific period of time.
In order to use this Web Part, you must first:
Create your plant model
Create your products
Create variables on a production unit
Add products to the production unit
Enter specification limits for those variables on the production unit for the selected products
Configure an Alarm Template
Configure an Alarm Display

Alarm List By Variables Web Part
146
This Web Part contains the following information:
Origin: This is the variable that was in an alarm state. Click the variable to view the Alarm
Detail web report.
Type: The possible types are: Limit, SPC, and Other.
Message: This is the text that was entered when the alarm template was created. More
information...
Value: This is the value that triggered the alarm state.
Event: This is the event that was occurring at the time the alarm was triggered.
Product: This is the product that was being manufactured on the production unit where the
alarm occurred.
Time: This is the time that the variable was in an alarm state. If the variable is still in an alarm
condition, the time will be in red; otherwise, the time will be in blue.
User: The electronic signature of the person who gave user verification.
Approver: The electronic signature of the person who gave approver verification.
Cause: This is the reason selected as the cause for the alarm. Unspecified indicates that
either a Cause Reason wasn't selected or that a Cause Reason Tree wasn't specified in the
Alarm Template.
Action: This is the action that was taken to correct the alarm. Unspecified indicates that
either an Action Reason wasn't selected or that an Action Reason Tree wasn't specified in the
Alarm Template.
The reporting time period is displayed at the bottom of the Web Part. To adjust the reporting
period, click the Clock icon.
To configure the Alarm List by Variables Web Part
1. Create the web part. How?
2. On the Report Parameters tab, click the Edit Parameter button.
3. On the Variables tab, select the variables you want to include on this report.
4. On the Start Time and End Time tab, select the period of time for which you want alarm
information retrieved.
5. On the PriorityFilter tab, select the alarm level(s) you want on your web part.
6. On the Columns tab, select the columns you want to include on your web part.
7. On the Options tab, select OpenOnly to include only variables that are currently in an alarm
state.

Plant Applications Web Reporting
147
8. On the Finish tab, click the Finish button to save your changes and to exit.
Downtime Distribution Charts by Units Web Part
The Downtime Distribution Charts by Units Web Part displays the amount of downtime for a specific
period of time that is attributed to a specific location (unit), fault, reason level, product, and crew. Click
the Table icon to display the information in a table format or click the Graph icon to display the
information as a bar chart.
The reporting time period is displayed at the bottom of the Web Part. To adjust the reporting period,
click the Clock icon.
Terms
MTTR (Mean Time To Repair): This is the mean time to repair and is calculated by: total
downtime minutes / number of downtime events. MTTR provides an indication of the
expected time a production unit will be down.
MTBF (Mean Time Between Failure): This is the mean time between failures and is
calculated by: total uptime minutes / number of uptime events. MTBF provides an indication of
the expected time between failures.
To use this Web Part, you must first:
Configure your plant model. For more information on this topic, click here.
Capture downtime events. For more information on this topic, click here.
Attach a reason tree to your downtime events. For more information on this topic, click here.
Configure products and product changes. For more information on this topic, click here.
optional: Attach faults to your downtime events. For more information on this topic, click here.
optional: Include crew/shift schedule information. For more information, click here.

Downtime Distribution Charts by Units Web Part
148
When the Web Part is in Bar Chart view, each bar represents the total amount of downtime assigned
to a specific attribute, such as a reason. In Bar Chart view, you can click one of the bars to get a
more granular view of your downtime. For example, on the Location tab, you can click one of the
bars for a specific location to view only the information specific to that location.
In Table view, this Web Part provides the following information:
Location tab:
o Location: This is a list of the location (unit) where the downtime event(s) occurred.
o Total: This is the total amount of time attributed to downtime for the specific location.
o MTTR: This is the total mean time to repair for the specific location. The time format is HH:MM:SS.
o MTBF: This is the total mean time between failure for the specific location. The time format is HH:MM:SS.
o % Total: This is the percent total of downtime attributed to the specific location.
o # Events: This is the number of downtime events that occurred at the specific location.
o Totals: Totals are provided for the amount of downtime for all locations and for the number of events for all locations.
Fault tab:
If no fault has been attached to the downtime event, then the fault will be "Unspecified."
o Fault: This is a list of the fault(s) assigned to the downtime events.
o Total: This is the total amount of time attributed to downtime for the fault.
o MTTR: This is the total mean time to repair for the specific fault. The time format is HH:MM:SS.
o MTBF: This is the total mean time between failure for the specific fault. The time format is HH:MM:SS.
o % Total: This is the percent total of downtime attributed to the specific fault.
o # Events: This is the number of downtime events that occurred at the specific fault.

Plant Applications Web Reporting
149
o Totals: Totals are provided for the amount of downtime for all faults and for the number of events for all faults.
Reason Level tab(s):
There will be a tab for each reason level in the associated reason tree.
o Reason: This is a list of the reason(s) assigned to the downtime events.
o Total: This is the total amount of time attributed to downtime for the reason.
o MTTR: This is the total mean time to repair for the specific reason. The time format is HH:MM:SS.
o MTBF: This is the total mean time between failure for the specific reason. The time format is HH:MM:SS.
o % Total: This is the percent total of downtime attributed to the specific reason.
o # Events: This is the number of downtime events that occurred at the specific reason.
o Totals: Totals are provided for the amount of downtime for all reasons and for the number of events for all reasons.
Product tab:
o Product: This is a list of the product(s) which were being run when the downtime event(s) occurred.
o Total: This is the total amount of time attributed to downtime for the specific product.
o MTTR: This is the total mean time to repair for the specific product. The time format is HH:MM:SS.
o MTBF: This is the total mean time between failure for the specific product. The time format is HH:MM:SS.
o % Fault: This is the percent of time that the specific product was in a fault condition (downtime).
o % Total: This is the percent total of downtime attributed to the specific product.
o # Events: This is the number of downtime events associated with the specific product.
o Totals: Totals are provided for the amount of downtime for all products, fault percent and number of events.
Crew tab:
o Crew: This is a list of the Crew shifts when the downtime event(s) occurred.
o Total: This is the total amount of time attributed to downtime for the specific Crew.
o MTTR: This is the total mean time to repair for the specific Crew. The time format is HH:MM:SS.
o MTBF: This is the total mean time between failure for the specific Crew. The time format is HH:MM:SS.
o % Total: This is the percent total of downtime attributed to the specific Crew.
o # Events: This is the number of downtime events that occurred at the specific Crew.
o Totals: Totals are provided for the amount of downtime for all crews and for the number of events for all crews.
To configure the Downtime Distribution Charts by Units
1. Create the web part. How?
2. On the Report Parameters tab, click the Edit Parameter button.
3. On the Units tab, select the production units.
4. On the Start and End Time tab, specify the report time.
5. On the ProductFilter tab, filter by product, if desired.
6. On the CrewFilter tab, filter by specific crew, if desired.
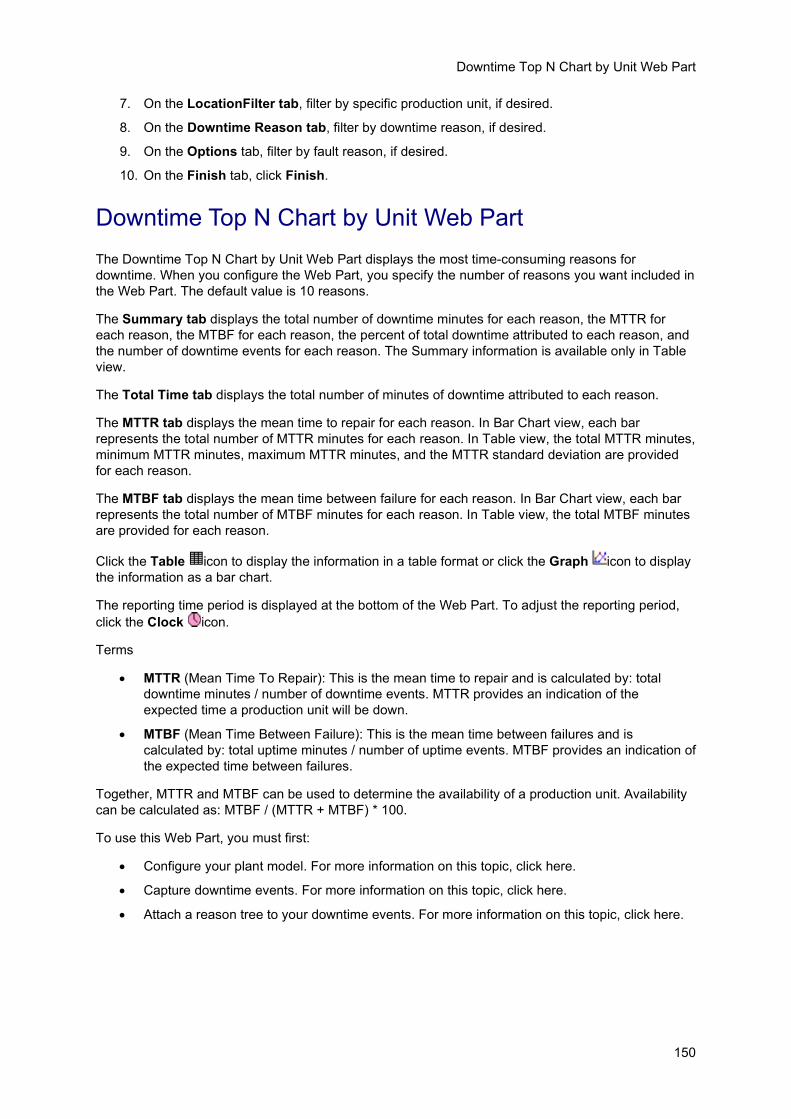
Downtime Top N Chart by Unit Web Part
150
7. On the LocationFilter tab, filter by specific production unit, if desired.
8. On the Downtime Reason tab, filter by downtime reason, if desired.
9. On the Options tab, filter by fault reason, if desired.
10. On the Finish tab, click Finish.
Downtime Top N Chart by Unit Web Part
The Downtime Top N Chart by Unit Web Part displays the most time-consuming reasons for
downtime. When you configure the Web Part, you specify the number of reasons you want included in
the Web Part. The default value is 10 reasons.
The Summary tab displays the total number of downtime minutes for each reason, the MTTR for
each reason, the MTBF for each reason, the percent of total downtime attributed to each reason, and
the number of downtime events for each reason. The Summary information is available only in Table
view.
The Total Time tab displays the total number of minutes of downtime attributed to each reason.
The MTTR tab displays the mean time to repair for each reason. In Bar Chart view, each bar
represents the total number of MTTR minutes for each reason. In Table view, the total MTTR minutes,
minimum MTTR minutes, maximum MTTR minutes, and the MTTR standard deviation are provided
for each reason.
The MTBF tab displays the mean time between failure for each reason. In Bar Chart view, each bar
represents the total number of MTBF minutes for each reason. In Table view, the total MTBF minutes
are provided for each reason.
Click the Table icon to display the information in a table format or click the Graph icon to display
the information as a bar chart.
The reporting time period is displayed at the bottom of the Web Part. To adjust the reporting period,
click the Clock icon.
Terms
MTTR (Mean Time To Repair): This is the mean time to repair and is calculated by: total
downtime minutes / number of downtime events. MTTR provides an indication of the
expected time a production unit will be down.
MTBF (Mean Time Between Failure): This is the mean time between failures and is
calculated by: total uptime minutes / number of uptime events. MTBF provides an indication of
the expected time between failures.
Together, MTTR and MTBF can be used to determine the availability of a production unit. Availability
can be calculated as: MTBF / (MTTR + MTBF) * 100.
To use this Web Part, you must first:
Configure your plant model. For more information on this topic, click here.
Capture downtime events. For more information on this topic, click here.
Attach a reason tree to your downtime events. For more information on this topic, click here.

Plant Applications Web Reporting
151
To configure the Downtime Top N Chart by Unit Web Part
1. Create the web part. How?
2. On the Report Parameters tab, click the Edit Parameter button.
3. On the Units tab, select the production units.
4. On the Start and End Time tab, specify the report time.
5. On the CrewFilter tab, filter by specific crew, if desired.
6. On the LocationFilter tab, filter by a specific location, if desired.

Efficiency Statistics by Unit Web Part
152
7. On the Downtime Reason tab, filter by downtime reason, if desired.
8. On the Options tab, filter by product, location, report level, or the number of reasons to
include on the report (Top N), if desired.
9. On the Finish tab, click Finish.
Efficiency Statistics by Unit Web Part
The Efficiency Statistics by Unit Web Part graphically represents the Percent OEE, Performance Rate
%, Available Rate %, and Quality Rate % for a specified production unit.
The reporting time period is displayed at the bottom of the Web Part. To adjust the reporting period,
click the Clock icon.
The placement of the arrow is dependant on the specification limits for each value. Different
specification limits will cause the graph to have a different scale. You can hover over the graphs to
view the specification limits.
You can drill into each graphic to view additional information.
Click on Percent OEE to view the Unit Time Accounting Web report.
Click on Performance Rate % to view the Performance Distribution Web Part.
Click on Available Rate % to view the Operating Downtime Distribution Web Part.
Click on Quality Rate % to view the Waste Distribution Web Part.
Calculations
Performance Rate %: The performance rate of the unit based on the Actual and Ideal
Speeds (Actual Speed/Ideal Speed * 100).
Quality Rate %: Percentage of good product (ActualProduction/[ActualProduction +
QualityLoss] * 100).
Available Rate %: Actual runtime/loading time, showing the percentage of time the machine
is available.
Loading Time: The number of minutes during the reporting period that were consumed in a loading
phase. It is the period of the report in minutes (that is, report start time minus report end time), less
the TotalUnavailableMinutes, less the TotalOutsideAreaMinutes.
Run Time: The number of minutes that the machine has been running, returned by the
spCMN_GetUnitStatistics stored procedure.
Percent OEE: Quality Rate * Performance Rate * Available Rate. By default, OEE cannot
exceed 100%. However, if your site allows OEE to exceed 100%, you can edit the OEE Max
Limit Override site parameter.
Efficiency Statistics By Unit Web Part
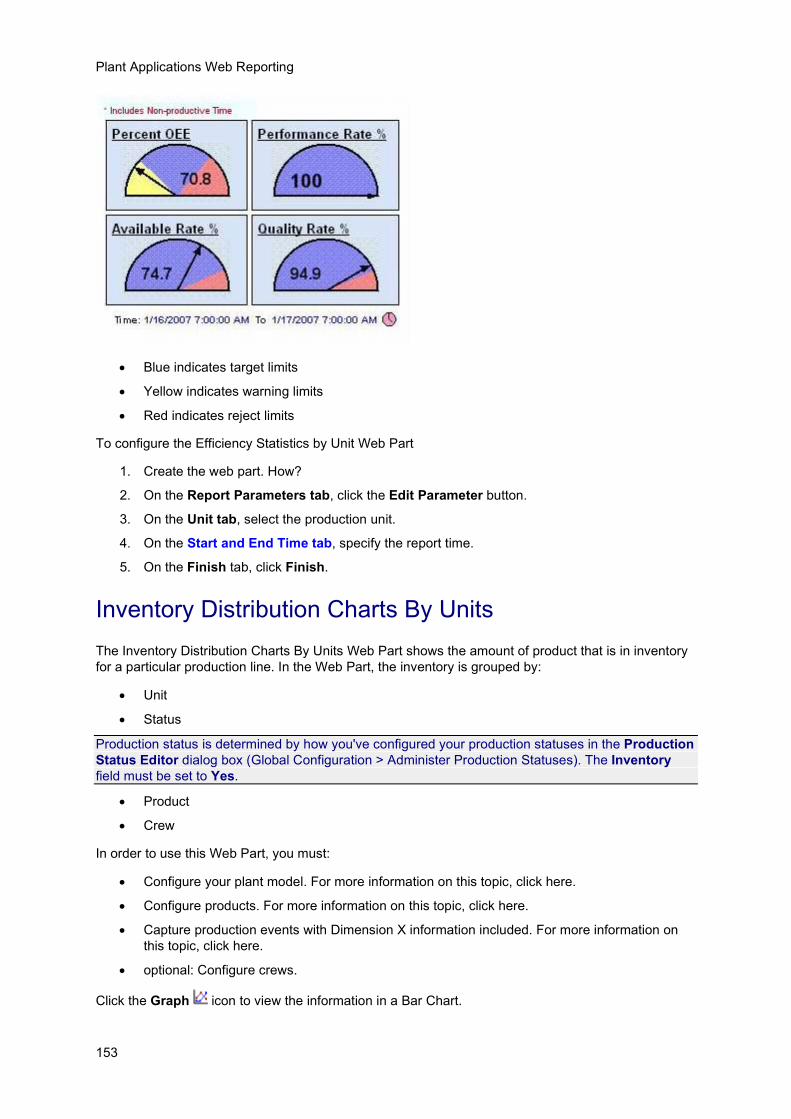
Plant Applications Web Reporting
153
Blue indicates target limits
Yellow indicates warning limits
Red indicates reject limits
To configure the Efficiency Statistics by Unit Web Part
1. Create the web part. How?
2. On the Report Parameters tab, click the Edit Parameter button.
3. On the Unit tab, select the production unit.
4. On the Start and End Time tab, specify the report time.
5. On the Finish tab, click Finish.
Inventory Distribution Charts By Units
The Inventory Distribution Charts By Units Web Part shows the amount of product that is in inventory
for a particular production line. In the Web Part, the inventory is grouped by:
Unit
Status
Production status is determined by how you've configured your production statuses in the Production
Status Editor dialog box (Global Configuration > Administer Production Statuses). The Inventory
field must be set to Yes.
Product
Crew
In order to use this Web Part, you must:
Configure your plant model. For more information on this topic, click here.
Configure products. For more information on this topic, click here.
Capture production events with Dimension X information included. For more information on
this topic, click here.
optional: Configure crews.
Click the Graph icon to view the information in a Bar Chart.

Inventory Distribution Charts By Units
154
Click the Table icon to view the information in a table where you can view:
The Total amount of inventory for each grouping
The Average amount of inventory for each grouping.
The Minimum amount of inventory for each grouping.
The Maximum amount of inventory for each grouping.
The % Total amount of inventory for each grouping.
The number of events that produced the total amount of inventory for each grouping.

Plant Applications Web Reporting
155
To configure the Inventory Distribution Charts By Units Web Part
1. Create the web part. How?
2. On the Report Parameters tab, click the Edit Parameter button.
3. On the Units tab, select the production units.
4. On the UnitFilter tab, filter by production unit, if desired.
5. On the StatusFilter tab, filter by status, if desired.
6. On the CrewFilter tab, filter by specific crew, if desired.
7. On the Options tab, filter by product, if desired.
8. On the Finish tab, click Finish.
My Report Search Dialog Web Part
The My Report Search Dialog Web Part provides search functionality for and is accessed from the My
Reports Favorites Dialog Web Part. This Web Part lists both configured Web Parts and Web Part
templates and cannot be configured.
In the Search Results list, Web Part templates are identified with an asterisk (*).
In the Search box, you can type part of a Web Part name or use standard SQL wildcard characters,
such as %.
Click on a Web Part name to view the Web Part.

My Reports Favorites Dialog Web Part
156
My Reports Favorites Dialog Web Part
The My Reports Favorites Dialog Web Part lists Web Parts that you have selected.
Web Part templates are identified with an asterisk (*).
In the Search box, you can type part of a Web Part name or use standard SQL wildcards, such as %.
When you click Search, the Search Results Web Part appears.
Click on a Web Part name to view the Web Part.
To add Web Parts to My Reports Favorites

Plant Applications Web Reporting
157
1. In the Web Administrator dialog box, click the Configure Available WebParts tab.
2. Do one of the following:
Create a new My Reports Favorites Web Part.
Select your existing My Reports Favorites Web Part.
3. Click the Report Parameters tab.
4. In the Parameter Value section, click Edit Parameter. The My Reports Favorites Dialog ASP
page appears.
5. On the Report List tab, select the Web Part(s) you want to include in your list of favorites.
6. On the Finish tab, click Finish.
Operating Downtime Distribution Web Part
The Operating Downtime Distribution Web Part shows the unplanned downtime during a specific
period of time that is attributed to a specific location (unit), fault, reason level, product, and crew.
Unplanned downtime is any downtime that is not attributed to performance downtime, external
downtime, or unavailable downtime. Click the Table icon to display the information in a table format
or click the Graph icon to display the information as a bar chart.
The reporting time period is displayed at the bottom of the Web Part. To adjust the reporting period,
click the Clock icon.
Terms
MTTR (Mean Time To Repair): This is the mean time to repair and is calculated by: total
downtime minutes / number of downtime events. MTTR provides an indication of the
expected time a production unit will be down.
MTBF (Mean Time Between Failure): This is the mean time between failures and is
calculated by: total uptime minutes / number of uptime events. MTBF provides an indication of
the expected time between failures.
To use this Web Part, you must first:
Configure your plant model. For more information on this topic, click here.
Capture downtime events. For more information on this topic, click here.
Attach a reason tree to your downtime events. For more information on this topic, click here.
Configure products and product changes. For more information on this topic, click here.
optional: Attach faults to your downtime events. For more information on this topic, click here.
optional: Include crew/shift schedule information.

Operating Downtime Distribution Web Part
158
When the Web Part is in Bar Chart view, each bar represents the total amount of unplanned
downtime assigned to a specific attribute, such as a reason. In Bar Chart view, you can click one of
the bars to get a more granular view of your downtime. For example, on the Location tab, you can
click one of the bars for a specific location to view only the information specific to that location.
In Table view, this Web Part provides the following information:

Plant Applications Web Reporting
159
Location tab:
o Location: This is a list of the location (unit) where the downtime event(s) occurred.
o Total: This is the total amount of time attributed to downtime for the specific location.
o MTTR: This is the total mean time to repair for the specific location. The time format is HH:MM:SS.
o MTBF: This is the total mean time between failure for the specific location. The time format is HH:MM:SS.
o % Total: This is the percent total of downtime attributed to the specific location.
o # Events: This is the number of downtime events that occurred at the specific location.
o Totals: Totals are provided for the amount of downtime for all locations and for the number of events for all locations.
Fault tab:
If no fault has been attached to the downtime event, then the fault will be "Unspecified."
o Fault: This is a list of the fault(s) assigned to the downtime events.
o Total: This is the total amount of time attributed to downtime for the fault.
o MTTR: This is the total mean time to repair for the specific fault. The time format is HH:MM:SS.
o MTBF: This is the total mean time between failure for the specific fault. The time format is HH:MM:SS.
o % Total: This is the percent total of downtime attributed to the specific fault.
o # Events: This is the number of downtime events that occurred at the specific fault.
o Totals: Totals are provided for the amount of downtime for all faults and for the number of events for all faults.
Reason Level tab(s):
There will be a tab for each reason level in the associated reason tree.
o Reason: This is a list of the reason(s) assigned to the downtime events.
o Total: This is the total amount of time attributed to downtime for the reason.
o MTTR: This is the total mean time to repair for the specific reason. The time format is HH:MM:SS.
o MTBF: This is the total mean time between failure for the specific reason. The time format is HH:MM:SS.
o % Total: This is the percent total of downtime attributed to the specific reason.
o # Events: This is the number of downtime events that occurred at the specific reason.
o Totals: Totals are provided for the amount of downtime for all reasons and for the number of events for all reasons.
Product tab:
o Product: This is a list of the product(s) which were being run when the downtime event(s) occurred.
o Total: This is the total amount of time attributed to downtime for the specific product.
o MTTR: This is the total mean time to repair for the specific product. The time format is HH:MM:SS.
o MTBF: This is the total mean time between failure for the specific product. The time format is HH:MM:SS.
o % Fault: This is the percent of time that the specific product was in a fault condition (downtime).
o % Total: This is the percent total of downtime attributed to the specific product.
o # Events: This is the number of downtime events associated with the specific product.

Overview Statistics by Path Web Part
160
o Totals: Totals are provided for the amount of downtime for all products, fault percent and number of events.
Crew (or Shift) tab:
o Crew (or Shift): This is a list of the Crew shifts when the downtime event(s) occurred.
o Total: This is the total amount of time attributed to downtime for the specific Crew.
o MTTR: This is the total mean time to repair for the specific Crew. The time format is HH:MM:SS.
o MTBF: This is the total mean time between failure for the specific Crew. The time format is HH:MM:SS.
o % Total: This is the percent total of downtime attributed to the specific Crew.
o # Events: This is the number of downtime events that occurred at the specific Crew.
o Totals: Totals are provided for the amount of downtime for all crews and for the number of events for all crews.
To configure the Operating Downtime Distribution Web Part
1. Create the web part. How?
2. On the Report Parameters tab, click the Edit Parameter button.
3. On the Units tab, select the production units.
4. On the Start Time and End Time tab, specify the time period.
5. On the CrewFilter tab, filter by specific crew, if desired.
6. On the LocationFilter tab, filter by location, if desired.
7. On the Downtime Reasons tab, filter by reason, if desired.
8. On the Options tab, filter by product, shift, or fault, if desired.
9. On the Finish tab, click Finish.
Overview Statistics by Path Web Part
The Overview Statistics by Path Web Part displays important key performance indicators for a
production execution path over a specified period of time. The following key performance indicators
are displayed:
Production: The actual production and target production are displayed for the specified
production execution path over the specified period of time. Click the icon to view the
Production Distribution Charts By Units Web Part.
Waste (%): The actual waste percent and the target waste percent are displayed for the
specified production execution path over the specified period of time. The actual waste
percent is calculated by Waste / Production. Click the to view the Waste Distribution
Charts By Units Web Part.
Downtime (%): The actual downtime percent and target downtime percent are displayed for
the specified production execution path over the specified period of time. The actual
downtime percent is calculated by Downtime / Production. Click the icon to view the
Downtime Distribution By Units Web Part.
Efficiency (%): The actual efficiency percent and target efficiency percent are displayed for
the specified production execution path over the specified period of time.
Current Order: The current process order for the selected execution path. Click the to
view a list of process orders.

Plant Applications Web Reporting
161
Next Order: The next process order for the selected execution path.
Sched. Deviation: The amount of time the actual end time deviated from the forecast end
time.
Inventory: The amount of inventory on the specified production execution path over the
specified period of time. Click the to view the Inventory Distribution Charts By Units Web
Part.
The reporting time period is displayed at the bottom of the Web Part. To adjust the reporting period,
click the Clock icon.
To use this Web Part, you must first:
Configure your plant model. For more information on this topic, click here.
Calculate the production metric. For more information on this topic, click here.
Track waste. For more information on this topic, click here.
Track downtime. For more information on this topic, click here.
Configure the efficiency metric. For more information on this topic, click here.
Configure a production execution path. For more information on this topic, click here.
Track inventory. For more information on this topic, click here.
To configure the Overview Statistics by Path Web Part
1. Create the web part. How?
2. On the Report Parameters tab, click the Edit Parameter button.
3. On the Path tab, select the production execution path.
4. On the Finish tab, click Finish.
Performance Distribution Web Part
The Performance Distribution Web Part compares the amount of loss attributed to performance
downtime with the amount of loss attributed to the normalized loss for each of the selected production
units over the specified period of time. The information is grouped by location (production unit), fault,

Process Order (Active) List by Lines Web Part
162
and reason levels. There is one tab for each reason level. For each fault and reason level, the
information is categorized by:
MTTR
MTBF
% Total
# Events
Performance downtime is any downtime that is attributed to the category specified as the
Performance Downtime Category. These categories are defined in the Reason Tree (Global
Configuration), and allow a group of reasons to be specified that define scheduled downtime.
Normalized loss = (target production amount – actual production amount) / target speed
Duration @ Design Speed is the number of hours running at target speed.
Click the Table icon to display the information in a table format or click the Graph icon to display
the information as a bar chart.
The reporting time period is displayed at the bottom of the Web Part. To adjust the reporting period,
click the Clock icon.
To configure the Performance Distribution Web Part
1. Create the web part. How?
2. On the Report Parameters tab, click the Edit Parameter button.
3. On the Units tab, select the production units.
4. On the Start and End Time tab, specify the report time.
5. On the CrewFilter tab, filter by specific crew, if desired.
6. On the LocationFilter tab, filter by specific production unit, if desired.
7. On the Downtime Reason tab, filter by downtime reason, if desired.
8. On the Options tab, filter by product, shift, or fault reason, if desired.
9. On the Finish tab, click Finish.
Process Order (Active) List by Lines Web Part
The Process Order (Active) List By Lines Web Part displays a list of active process orders for the
selected production lines, based on the execution path configured on the selected production lines.
Only production lines with configured execution paths are considered for this Web Part.
To use this Web Part, you must:
Capture production events. For more information on this topic, click here.
Capture process orders. For more information on this topic, click here.
Configure a production execution path. For more information on this topic, click here.
Configure a Schedule View display. For more information on this topic, click here.
This Web Part provides the following information:
Resource: The production line and, in parenthesis, the name of the execution path. This is
the path code that was entered when the execution path was configured. Click the resource
to open the Process Order Search By Paths Web Part.

Plant Applications Web Reporting
163
Current Order: The current process order on the production line. Click the process order to
view the Process Order Detail Web Report. Click the link to open the Process Order Detail
Web report.
Planned: The planned amount of product on the process order.
Remaining: The amount remaining to be produced on the process order. The engineering
units are what was entered when the production event was configured on the production unit.
Planned Items: The number of total number of planned repetitions of all sequences attached
to the process order. If there are no sequences, this field is blank.
Remaining Items: The planned items less actual items produced.
Run Time: The actual run time, in minutes, of the process order.
Sched Dev: The planned duration less the predicted remaining duration plus the actual
duration (run time).
Units: The production units that were identified as production points when the execution path
was configured. Click a unit to open the Unit Time Accounting Web report.
Next Order: The process order with a status of "Next." Click the link to open the Process
Order Detail Web report.
Est Start: The estimated start time of the next process order.
Next Duration: The planned end time less the planned start time of the next process order.
To configure the Process Order (Active) List By Lines Web Part
1. Create the web part. How?
2. On the Report Parameters tab, click the Edit Parameter button.
3. On the Lines tab, select the production lines.
4. On the Columns tab, select the columns.
5. On the Finish tab, click Finish.
Process Order Search By Paths Web Part
The Process Order Search By Paths Web Part displays all the process orders on the selected
production lines for the specified period of time. You can specify the production lines, the production
status(es), and the time period. You can also filter on a specific product or process order. You must
have an execution path configured on the selected production lines.
To use this Web Part, you must:
Capture production events. For more information on this topic, click here.
Capture process orders. For more information on this topic, click here.
Configure a production execution path. For more information on this topic, click here.
Configure a Schedule View display. For more information on this topic, click here.

Process Order Search Dialog Web Part
164
The reporting time period is displayed at the bottom of the Web Part. To adjust the reporting period,
click the Clock icon.
This Web Part provides the following information:
Process Order: A yellow star indicates that the process order was active during the time
specified when you configured the Web Part. You can click a process order to view the
Process Order Detail Web Report.
Resource: The production line and, in parenthesis, the name of the execution path. This is
the path code that was entered when the execution path was configured.
Status: The status of the process order. The possible statuses are: Complete, Pending, Next,
Active.
Product: The product that was produced.
Quantity: If the status is Active, the amount is the remaining quantity. The amount in
parenthesis is the predicted remaining amount. If the status is Next or Pending, the amount
is the forecast amount. If the status is Complete, the amount is the actual good quantity and
the amount in the parenthesis indicates whether more (+) or less (-) was produced than
forecast amount.
Start: If the status is Active or Complete, this is the actual start time of the process order. If
the status is Next or Pending, this is the forecast start time.
End: If the status is Next or Pending, this is the forecast end time of the process order. If the
status is Active, this is the forecast end time. If the status is Complete, this is the actual end
time. A negative number in parenthesis is the amount of time, in hours and minutes (HH:MM),
it would take to produce the amount of product that was not produced, but was planned.
To configure the Process Order Search By Paths Web Part
1. Create the web part. How?
2. On the Report Parameters tab, click the Edit Parameter button.
3. On the Paths tab, select the production execution path.
4. On the Statuses tab, filter by status if desired.
5. On the Start and End Time tab, specify the report time.
6. On the Finish tab, click Finish.
Process Order Search Dialog Web Part

Plant Applications Web Reporting
165
The Process Order Search Dialog Web Part allows you to search for specific process orders on a
selected execution path. You can filter on the following criteria:
Resource: The execution paths' path code.
Status: The status of the process order.
Product Code: The product's product code (not the product's name.)
Time: You can select the process orders from:
o Today
o Yesterday
o Last 3 Days
o Last 7 Days
o Last 30 Days
o Last Month
o This Month
Search: You can type all or part of a process order in the Search box. You can use standard
SQL wildcards, such as %.
When you click Search, the Process Order Search By Paths Web Part appears.
To use this Web Part, you must:
Capture production events. For more information on this topic, click here.
Capture process orders. For more information on this topic, click here.
Configure a production execution path. For more information on this topic, click here.
Configure a Schedule View display. For more information on this topic, click here.
Product Statistics By Units Web Part
The Product Statistics By Units Web Part provides statistical information on products that were run on
a specific production unit over a specified period of time.
To use this Web Part, you must have:
Configured products. For more information on this topic, click here.
Capture production events. For more information on this topic, click here.

Product Statistics By Units Web Part
166
Capture waste events. For more information on this topic, click here.
Capture downtime events. For more information on this topic, click here.
The reporting time period is displayed at the bottom of the Web Part. To adjust the reporting period,
click the Clock icon.
A yellow star indicates that the product was being produced during the specified time period.
The colored squares are a visual representation of the particular statistic.
This Web Part provides the following information:
Product: The product (and product code). Click on a product to view the Inventory Listing
Web report.
#Items: The number of good production events.
Amount: The total amount produced for all selected units during the specified time period.
%Conf: The number good production events / total number of production events.
%Rate: The (actual production rate / planned production rate) * 100, or:
((actual amount produced, plus actual quality loss and actual yield loss) / actual run time) /
((planned production, less planned quality loss and planned downtime loss) / (planned run
time, less any planned downtime)) * 100
%Downtime: The (actual run time minutes) / (actual run time minutes + actual downtime
minutes) * 100
%Waste: The (actual quality loss) / (actual quality loss + actual production) * 100
To configure the Product Statistics By Units Web Part
1. Create the web part. How?
2. On the Report Parameters tab, click the Edit Parameter button.
3. On the Units tab, select the production units.
4. On the Start Time and End Time tab, specify the time period.
5. On the OnlyMadeNow tab, select True to include only the products that were being produced
during the specified time period.
6. On the Column tab, select the columns of information you want to include on the Web Part.
7. On the Finish tab, click Finish.

Plant Applications Web Reporting
167
Production Distribution Charts By Units Web Part
The Production Distribution Charts By Units Web Part displays the amount of production for a specific
period of time that is attributed to a specific location (unit), status, product, and crew.
Click the Table icon to display the information in a table format or click the Graph icon to display
the information as a bar chart.
The reporting time period is displayed at the bottom of the Web Part. To adjust the reporting period,
click the Clock icon.
For each unit, status, product, and crew, the following statistics are provided:
Total: The total production amount attributed to the production unit, status, product, or crew.
Average: The average production amount attributed to the production unit, status, product, or
crew. This is the amount in the Total column divided by the number of production events
listed in the # <production event> column.
Minimum: The minimum amount produced for the production events associated with the
production unit, status, product, or crew.
Maximum: The maximum amount produced for the production events associated with the
production unit, status, product, or crew.
% Total: The percent of the total amount attributed to the production unit, status, product, or
crew.
# <production event>: The number of production events attributed to the production unit,
status, product, or crew. The actual name of the production event is displayed.

Production Event Alarms By Unit Web Part
168
To configure the Production Distribution Charts By Units Web Part
1. Create the web part. How?
2. On the Report Parameters tab, click the Edit Parameter button.
3. On the Units tab, select the production units.
4. On the Start and End Time tab, specify the report time.
5. On the UnitFilter tab, filter by production unit, if desired.
6. On the StatusFilter tab, filter by production status, if desired.
7. On the CrewFilter tab, filter by specific crew, if desired.
8. On the Options tab, filter by product or production only, if desired.
9. On the Finish tab, click Finish.
Production Event Alarms By Unit Web Part
The Production Event Alarms By Unit Web Part lists the number and priority of the alarms for each
production event on the selected production unit that occurred during the specified period of time.
The top of the Web Part displays the number of production events that were rejected and the
percentage of the total amount of production that was rejected. Rejected production events are
highlighted in yellow.
The reporting time period is displayed at the bottom of the Web Part. To adjust the reporting period,
click the Clock icon.
You can click on a production event to view the Alarm Details By Production Event Web Part.
To use this Web Part, you must:
Configur products. For more information on this topic, click here.
Configur production events. For more information on this topic, click here.
Configur alarm templates. For more information on this topic, click here.

Plant Applications Web Reporting
169
To configure the Production Event Alarms By Unit Web Part
1. Create the web part. How?
2. On the Report Parameters tab, click the Edit Parameter button.
3. On the Unit tab, select the production units.
4. On the Start and End Time tab, specify the report time.
5. On the Finish tab, click Finish.
Production Event Search By Unit Web Part
The Production Event Search By Unit Web Part lists all production events on the selected production
units that occurred during the specified period of time.
This Web Part requires the following parameters:
At least one production unit
Start and end time
You can also filter on:
Production status
Event number
If in process
The Web Part provides the following information:
Events: The production event. Click a production event to view the Event Detail Web report.
Unit: The production unit the event occurred on. Click on a production unit to view the Unit
Time Accounting Web report.
Product: The product that was produced.

Production Event Search Dialog Web Part
170
Conformance: If all variables are within target, then conformance is Good. If one or more
variables are in warning, then conformance is Warning. If one or more variables are in reject,
then conformance is Reject.
Status: The status of the production event.
Dimensions: The final dimensions of the product.
Timestamp: The production event timestamp. Click on a timestamp to view the Event Time
Accounting Web report.
To configure the Production Event Search By Unit Web Part
1. Create the web part. How?
2. On the Report Parameters tab, click the Edit Parameter button.
3. On the Units tab, select the production units.
4. On the Statuses tab, select the statuses to include on this report.
5. On the Options tab, filter by product, event number, or only production events that are
currently in process, if desired.
6. On the Finish tab, click Finish.
Production Event Search Dialog Web Part
The Production Event Search Dialog Web Part allows you to search for production events:
On a specific production unit
With a specific production status
By product code
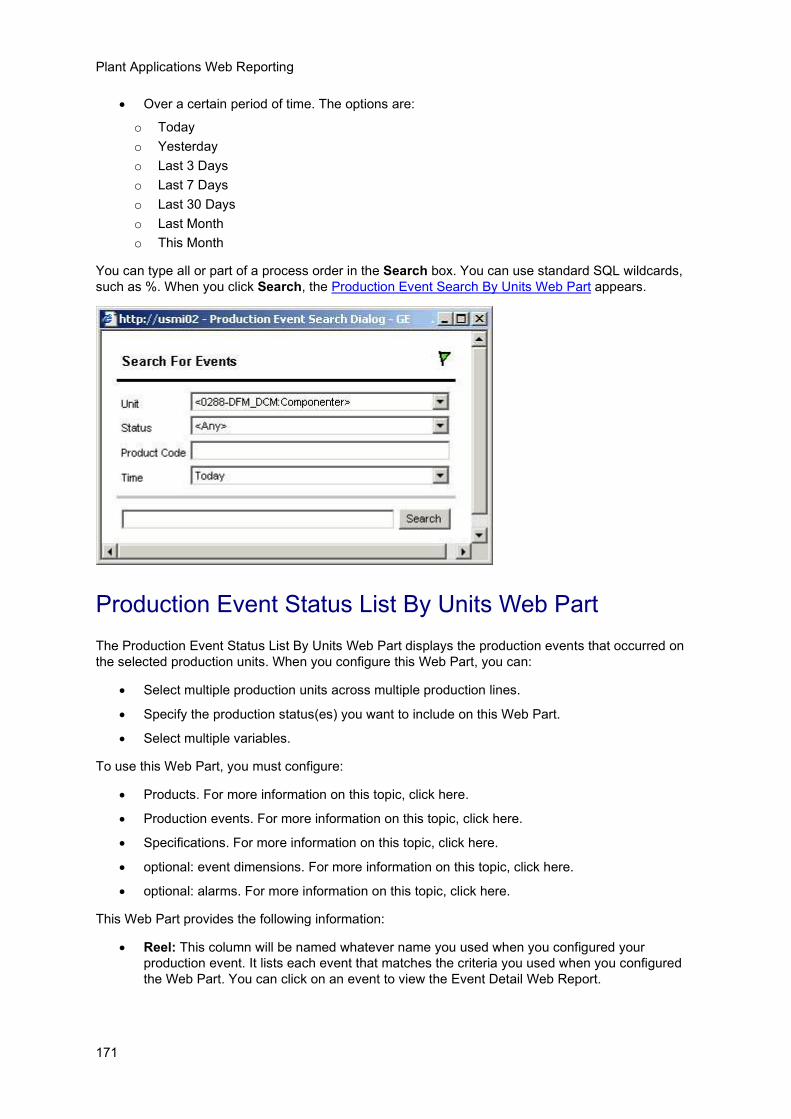
Plant Applications Web Reporting
171
Over a certain period of time. The options are:
o Today
o Yesterday
o Last 3 Days
o Last 7 Days
o Last 30 Days
o Last Month
o This Month
You can type all or part of a process order in the Search box. You can use standard SQL wildcards,
such as %. When you click Search, the Production Event Search By Units Web Part appears.
Production Event Status List By Units Web Part
The Production Event Status List By Units Web Part displays the production events that occurred on
the selected production units. When you configure this Web Part, you can:
Select multiple production units across multiple production lines.
Specify the production status(es) you want to include on this Web Part.
Select multiple variables.
To use this Web Part, you must configure:
Products. For more information on this topic, click here.
Production events. For more information on this topic, click here.
Specifications. For more information on this topic, click here.
optional: event dimensions. For more information on this topic, click here.
optional: alarms. For more information on this topic, click here.
This Web Part provides the following information:
Reel: This column will be named whatever name you used when you configured your
production event. It lists each event that matches the criteria you used when you configured
the Web Part. You can click on an event to view the Event Detail Web Report.

Production Event Status List By Units Web Part
172
Unit: The production unit on which the event occurred. Click a unit to view the Unit Time
Accounting Web report.
Location: The inventory location. You must configure the production unit as an inventory
point when you edit the production unit properties in the Unit Properties Configuration dialog
box. The location information is entered on the Inventory Locations tab.
Start: The start time of the production event.
End: The end time of the production event.
Age: The number of hours and minutes from the current time to when the production event
ended (current time – end time). The format is HH:MM.
Product: The product code of the product that was produced.
Status: The production status of the production event.
Time: The amount of time the production event has been in its current status. The current
time less the timestamp that the production event transitioned to its current status.
Weight: The Dimension X of the product that was produced during this production event. The
actual title of this column is determined by the information entered when the production event
was configured.
Length: The Dimension Y of the product that was produced during this production event. The
actual title of this column is determined by the information entered when the production event
was configured. This information is from the Production Event Configuration dialog box.
Width: The Dimension Z of the product that was produced during this production event. The
actual title of this column is determined by the information entered when the production event
was configured. This information is from the Production Event Configuration dialog box.
Diameter: The Dimension A of the product that was produced during this production event.
The actual title of this column is determined by the information entered when the production
event was configured. This information is from the Production Event Configuration dialog box.
% Tested: The percentage of variables tested during this production event. Click a link to
view the Event Detail Web report.
% Conf: If all variables are within target, then conformance is Good. If one or more variables
are in warning, then conformance is Warning. If one or more variables are in reject, then
conformance is Reject. The number in parentheses () is the percentage of variables that have
data. The variable must have Conformance Variable selected in the Variable sheet. Click a
link to view the Event Detail Web report.
User: The electronic signature of the person who gave user verification.
Approver: The electronic signature of the person who gave approver verification.
Alarms: The number of high, medium, and low alarms that occurred during the production
event. Click a link to view the Alarm List By Units Web Part.
Variables: The variables listed in the variable parameter.

Plant Applications Web Reporting
173
To configure the Production Event Status List By Units Web Part
1. Create the web part. How?
2. On the Report Parameters tab, click the Edit Parameter button.
3. On the Units tab, select the production units.
4. On the Statuses tab, select the statuses to include on this report.
5. On the Variables tab, select the variables to include on this report.
6. On the Columns tab, select the columns of information to include on this report.
7. On the Finish tab, click Finish.
Production Statistics By Lines Web Part
The Production Statistics By Lines Web Part displays statistics for selected production lines over a
specified period of time.
The reporting time period is displayed at the bottom of the Web Part. To adjust the reporting period,
click the Clock icon.
To use this Web Part, you must:
Capture production events. For more information on this topic, click here.
Capture downtime events. For more information on this topic, click here.
Capture waste events. For more information on this topic, click here.
Configure central specifications. For more information on this topic, click here.
This Web Part provides the following information:
Production: The total production for all production lines during the specified period of time.
Hover over the graphic to view totals for the actual production amount, the target production
amount, and the reject production amount.

Quality Statistics By Variables Web Part
174
Net Rate: The actual production / the total time to produce. Hover over the graphic to view
detailed information.
Schedule Deviation: The total amount of time that actual production time deviated from the
planned production time.
Speed: This is calculated as: (actual production + yield loss + quality loss) / run-time minutes.
In other words, it's the desired production / the planned run time.
To configure the Production Statistics By Lines Web Part
1. Create the web part. How?
2. On the Report Parameters tab, click the Edit Parameter button.
3. On the Lines tab, select the production units.
4. On the Start and End Time tab, specify the report time.
5. On the Finish tab, click Finish.
Quality Statistics By Variables Web Part
The Quality Statistics By Variables Web Part provides a variety of overall statistics for a single
variable over the specified period of time.
This Web Part provides a comparison of the actual (test) variable values against the target values.
The reporting time period is displayed at the bottom of the Web Part. To adjust the reporting period,
click the Clock icon.
To use this Web Part, you must:
Configure products. For more information, click here.
Capture values in variables. For more information,click here.
Configure alarms. For more information, click here.
Configure specifications. For more information, click here.
For Cpk, Ppk, Pp, and Cp, the color values indicate the following:
Red indicates the value is less than 1.

Plant Applications Web Reporting
175
Yellow indicates the value is between 1 and 1.33.
Green indicates the value is greater than 1.33.
For High, Med, and Low (alarms), the color values indicate the following:
Red is used for the High alarm box to indicate that there is one or more high alarms.
Blue is used for the Med alarm box to indicate that there is one or more medium alarms.
Light blue is used for the Low alarm box to indicate that there is one or more low alarms.
Green is used on all three alarms types to indicate that there are no alarms.
For %Test, %Conf, %Dev, and %Sigma, the color values indicate the following:
Red indicates the value is in reject.
Blue indicates the value is in warning.
Green indicates the value is in target.
This Web Part provides the following information:
High: This is the percentage of variables that had an alarm with a high priority. Click the
number to view the Alarm List By Variables Web Part.
Med: This is the percentage of variables that had an alarm with a medium priority. Click the
number to view the Alarm List By Variables Web Part.
Low: This is the percentage of variables that had an alarm with a low priority. Click the
number to view the Alarm List By Variables Web Part.
#Samples: The number of samples used in the calculations.
%Conf: The percentage of variables that were in conformance, which is calculated as:
(sum (number of values in target * number of test values)) / total number tested
For example, if Variable A had 3 out of 10 values in target, Variable B had 6 out of 10 values
in target, and Variable C had 9 out of 10 values in target, then the % conformance would be
60% (18/30)
Cpk: The process capability index. For detailed information on Cpk, see Variable Property
Definitions: Cpk.
Ppk: The process performance index. For detailed information on Ppk, see Variable Property
Definitions: Ppk.
Cp: The process capability ratio. For detailed information on Cp, see Variable Property
Definitions: Cp.
Pp: The process performance indicator. For detailed information on Pp, see Variable Property
Definitions: Pp.
%Dev: This is calculated as follows:
sum (CoefficientVariationTarget * number tested) / sum (number tested)
where
CoefficientVariationTarget = (standard deviation of the Target Deviation / minimum target
value) * 100.00
where
Target Deviation = variable result value – variable target value

Quality Statistics By Variables Web Part
176
%Sigma: This is calculated as follows:
(sum (Standard Deviation / Average * 100.00 * number tested)) / sum (number tested)
where
Standard Deviation = standard deviation of the results for each variable
and
Average = average of the results for each variable
%Test: The percentage of variables that had result values, calculated as follows:
sum (number of non-null values for each variable) / sum (total number of samples)
To configure the Quality Statistics By Variables Web Part
1. Create the web part. How?
2. On the Report Parameters tab, click the Edit Parameter button.
3. On the Variable tab, select the unit, then the slave unit (if applicable), and next select the
variable.
4. Click Next.
5. On the Start Time and End Time tab, select the period of time you want to retrieve
information for.
6. Click Next.
7. On the Product Filter tab, select the products you want to retrieve information for.
8. Click Next.
9. On the Cpk Mode tab, select either Cpk Weighted Average or Cpk by Product. If you select
Cpk Weighted Average, calculations are made across all products. If you select Cpk by
Product, calculations are made per product and the user will be able to scroll through all
available products with the arrows in the top right of the web part display.
10. Click Next.
11. On the Options tab, select the Filter Non-Productive Time check box if you want to exclude
non-productive time from the calculations.
12. Click Next.
13. On the Finish tab, click Finish.

Plant Applications Web Reporting
177
Specification Search By Units Web Part
The Specification Search By Units Web Part returns a list of products for the selected production
units. When you click a product link, you can view the Specification By Unit Web report, which lists all
specifications for the selected product on the date that you specified when you created this Web Part.
The reporting time period is displayed at the bottom of the Web Part. To adjust the reporting period,
click the Clock icon.
To use this Web Part, you must have:
Configured products. For more information on this topic, click here.
Configured production events. For more information on this topic, click here.
Configured specifications. For more information on this topic, click here.
This Web Part provides the following information:
Product Code: The product code of the product that was produced on the production unit
during the time specified. Click the link to view the Specification By Unit Web report.
Description: The description of the product.
Unit: The production unit on which the product was run.
To configure the Specification Search By Units Web Part
1. Create the web part. How?
2. On the Report Parameters tab, click the Edit Parameter button.
3. On the Units tab, select the production units.
4. On the Timestamp tab, specify the timestamp for the report.
5. On the Options tab, filter by product code, if desired.
6. On the Finish tab, click the Finish button to save your changes and to exit.

Specification Search Dialog Web Part
178
Specification Search Dialog Web Part
The Specification Search Dialog Web Part is used for searching for specification on a specific
production unit at a specific time. When you click Search, the Specification Search By Units Web Part
opens.
To use the Specification Search Dialog Web Part
1. From the Unit list, select the production unit.
2. In the Time box, enter the date and time for which you want to retrieve specifications. Click
the button to view an interactive calendar from which you can select a date. The time is
the current time. Clicking the button next to the time will update the time to the current
time.
3. In the Search box, you can type all or part of the product code for which you want to search.
4. Click Search.
Unit OEE Web Part
The Unit OEE Web Part displays OEE and other statistical information on a unit-by-unit basis. This
Web Part is a summary that provides several opportunities to drill down further into your process.
If the report start time or end time falls outside of an event start or end time, then loading time for
events partially outside the reporting period are calculated. The production for the event is awarded to
the reporting period on the basis of the following proration:
(Total Event Production / Total Event Loading Time) x Event Loading Time Within Reporting Period
In cases where the last event in the specified reporting period has not yet ended, the Report End Date
for all calculations is actually the end date of the last completed event. That is, all availability and
production calculations are based on the end date/time of the last completed event, and not the
specified reporting end date.
In order to use this Web Part, you must first:
Create the plant model

Plant Applications Web Reporting
179
Create products (steps to create products and specifications are required only if you will use
specification alarms)
Create variables on a production unit
Add products to the production unit
Enter specification limits for those variables on the production unit for the selected products
Populate variables with data (Autolog, Historian tag, Calculations, etc.)
The Unit OEE Web Part provides the following information:
Unit Name: The production unit for which the row of data is retrieved and/or calculated. Click
the link to view the Unit Time Accounting report.
Net Production: The amount of production from the unit being reported on. The value is
returned in the ActualProduction output variable of the spCMN_GetUnitStatistics stored
procedure. Click the link to view the Product Statistics By Unit report.
Actual Speed: The actual speed at which the machine is operating. (Net Production + Total
Waste/Uptime Minutes)
Ideal Speed: The target operating speed of the unit, returned by the
spCMN_GetUnitStatistics stored procedure.
Performance Rate %: The performance rate of the unit based on the Actual and Ideal
Speeds (Actual Speed/Ideal Speed * 100). Click the link to view the Performance Distribution
report.
Waste: The quality loss from the unit, returned by the spCMN_GetUnitStatistics stored
procedure.
Quality Rate %: Percentage of good product (Net Production/[Net Production + Waste] *
100). Click the link to view the Quality Distribution report.
Run Time: The time that the machine has been running, returned by the
spCMN_GetUnitStatistics stored procedure. In other words, it is the planned production time
less any downtime. Format: DD HH:MM:SS
Loading Time: The time during the reporting period that were consumed in a loading phase.
It is the period of the report in minutes (that is, report start time minus report end time), less
the TotalUnavailableMinutes, less the TotalOutsideAreaMinutes. In other words, it is the
planned production time. Format: DD HH:MM:SS
Available Rate %: The percentage of time the machine is available. Run Time/Loading
Time. Click the link to view the Operating Downtime Distribution report.
% OEE: Quality Rate * Performance Rate * Available Rate. Click the link to vew the OEE
Summary report.
Alarms: The number of alarms that have occurred on the unit during the reporting period.
Click the links to view the Alarm List By Units report.
Summary:
o Net Production: The sum of the net production amounts for all units on the report

Waste Distribution Charts by Units Web Part
180
o Actual Speed: (ΣNet Production + ΣTotal Waste)/ΣUptime Minutes
o Ideal Speed: ΣIdeal Production/ΣLoading Time
o Performance Rate %: ΣActual Speed/ΣIdeal Speed
o Waste: The sum of the waste amounts for all units on the report
o Quality Rate %: (ΣNet Production/[ΣNet Production + ΣWaste] * 100)
o Run Time: The sum of the run times for all units on the report
o Loading Time: The sum of the loading times for all units on the report
o Available Rate %: ΣRun Time/ΣLoading Time
o % OEE: ΣQuality Rate * ΣPerformance Rate * ΣAvailable Rate
To configure the Unit OEE Web Part
1. Log in to the Web Part Administrator. How?
2. Click the Manage Web Part Templates tab.
3. On the Configure Available Web Parts tab, select Unit OEE.
4. In the lower part of the dialog box, click the Report Parameters tab.
5. In Parameters, select a parameter. Corresponding values appear in Parameter Value.
6. If you wish to edit a value, click Edit Parameter to open the appropriate dialog box.
7. Click WebPart Properties to configure the appearance and behavior of the Web Part in a
browser.
8. Click the Report Schedule tab to choose scheduling options.
9. When you are finished, close the Web Part Administrator.
Waste Distribution Charts by Units Web Part
The Waste Distribution Charts by Units Web Part displays the amount of waste for a specific period of
time that is attributed to a specific location (unit), fault, reason level, product, and crew. Click the
Table icon to display the information in a table format or click the Graph icon to display the
information as a bar chart.
The reporting time period is displayed at the bottom of the Web Part. To adjust the reporting period,
click the Clock icon .
Terms
MAPE (Mean Amount Per Event): total waste amount/ number of waste events
MABE (Mean Amount Between Events): This is the mean amount that was produced
between waste events.
To use this Web Part, you must first:
Configure your plant model. For more information on this topic, click here.
Capture waste events. For more information on this topic, click here.
Attach a reason tree to your waste events. For more information on this topic, click here.
Configure products and product changes. For more information on this topic, click here.
optional: Attach faults to your waste events. For more information on this topic, click here.
optional: Include crew/shift schedule information.

Plant Applications Web Reporting
181
When the Web Part is in Bar Chart view, each bar represents the total amount of waste assigned to a
specific attribute, such as a reason. In Bar Chart view, you can click one of the bars to get a more
granular view of your waste. For example, on the Location tab, you can click one of the bars for a
specific location to view only the information specific to that location.
In Table view, this Web Part provides the following information:
Location tab:

Waste Distribution Charts by Units Web Part
182
o Location: This is a list of the location (unit) where the waste event(s) occurred.
o Total: This is the total amount of waste for the specific location.
o MAPE: This is the mean amount of waste for the specific location.
o MABE: This is the mean amount that was produced between waste events for the specific location.
o % Total: This is the percent total of waste attributed to the specific location.
o # Events: This is the number of waste events that occurred at the specific location.
o Totals: Totals are provided for the amount of waste for all locations and for the number of events for all locations.
Fault tab:
If no fault has been attached to the waste event, then the fault will be "Unspecified."
o Fault: This is a list of the fault(s) assigned to the waste events.
o Total: This is the total amount waste for the fault.
o MAPE: This is the mean amount of waste for the specific fault.
o MABE: This is the mean amount that was produced between waste events for the specific fault.
o % Total: This is the percent total of waste attributed to the specific fault.
o # Events: This is the number of waste events that occurred at the specific fault.
o Totals: Totals are provided for the amount of waste for all faults and for the number of events for all faults.
Reason Level tab(s):
There will be a tab for each reason level in the associated reason tree.
o Reason: This is a list of the reason(s) assigned to the waste events.
o Total: This is the total amount of time attributed to waste for the reason.
o MAPE: This is the total mean amount of waste for the specific reason.
o MABE: This is the mean amount that was produced between waste events for the specific reason.
o % Total: This is the percent total of waste attributed to the specific reason.
o # Events: This is the number of waste events that occurred at the specific reason.
o Totals: Totals are provided for the amount of waste for all reasons and for the number of events for all reasons.
Product tab:
o Product: This is a list of the product(s) which were being run when the waste event(s) occurred.
o Total: This is the total amount of waste for the specific product.
o MAPE: This is the total mean amount of waste for the specific product.
o MABE: This is the mean amount that was produced between waste events for the specific product.
o % Production: This is the percent of total production that was waste.
o % Total: This is the percent total of waste attributed to the specific product.
o # Events: This is the number of waste events associated with the specific product.
o Totals: Totals are provided for the amount of waste for all products, fault percent and number of events.
Crew tab:
o Crew: This is a list of the Crew shifts when the waste event(s) occurred.
o Total: This is the total amount of time attributed to waste for the specific Crew.
o MAPE: This is the total mean amount of waste for the specific Crew.

Plant Applications Web Reporting
183
o MABE: This is the mean amount that was produced between waste events for the specific Crew.
o % Total: This is the percent total of waste attributed to the specific Crew.
o # Events: This is the number of waste events that occurred at the specific Crew.
o Totals: Totals are provided for the amount of waste for all crews and for the number of events for all crews.
To configure the Waste Distribution Charts by Units Web Part
1. Create the web part. How?
2. On the Report Parameters tab, click the Edit Parameter button.
3. On the Units tab, select the units you want to include on this report.
4. On the Start Time and End Time tab, select the period of time for which you want waste
information retrieved.
5. On the Options tab, select one or more of the following:
ProductFilter: Enter a product description or code to filter on that product.
6. On the Finish tab, click the Finish button to save your changes and to exit.
Waste Top N Charts by Units Web Part
The Waste Top N Charts by Units Web Part displays the most time-consuming level 1 reasons for
waste. When you configure the Web Part, you specify the number of reasons you want included in the
Web Part. The default value is 10 reasons.
The Summary tab displays the total amount of waste for each reason, the MATR for each reason,
the MABF for each reason, the percent of total waste attributed to each reason, and the number of
waste events for each reason. The Summary information is available only in Table view.
The Total Amount tab displays the total amount of waste attributed to each reason.
The MATR tab displays the mean amount of waste for each reason. In Bar Chart view, each bar
represents the total amount of MATR waste for each reason. In Table view, the total MATR waste,
minimum MATR waste, maximum MATR waste, and the MATR standard deviation are provided for
each reason.
The MABF tab displays the mean waste amount between failure for each reason. In Bar Chart view,
each bar represents the total amount of MABF waste for each reason. In Table view, the total MABF
waste amount is provided for each reason.
Click the Table icon to display the information in a table format or click the Graph icon to
display the information as a bar chart.
The reporting time period is displayed at the bottom of the Web Part. To adjust the reporting period,
click the Clock icon .
Terms
MATR (Mean Amount To Repair): total waste amount/ number of waste events
MABF (Mean Amount Between Failure): This is the mean amount that was produced in
between waste events.
To use this Web Part, you must first:
Configure your plant model. For more information on this topic, click here.
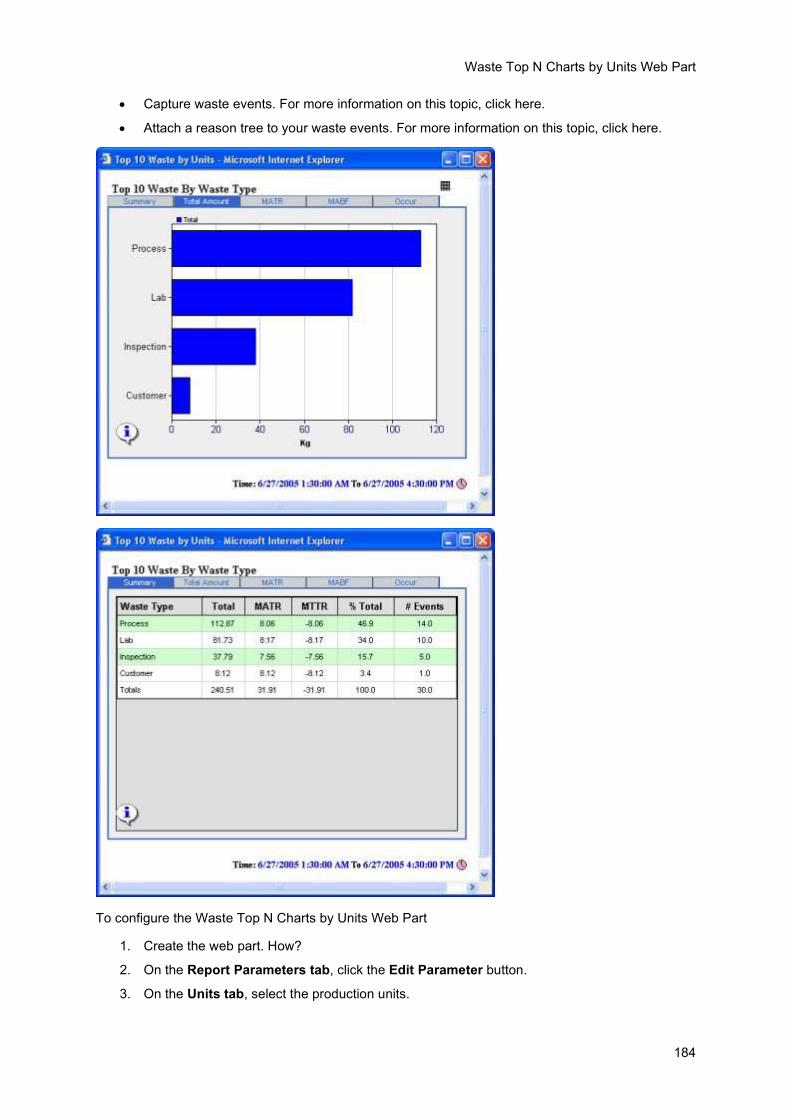
Waste Top N Charts by Units Web Part
184
Capture waste events. For more information on this topic, click here.
Attach a reason tree to your waste events. For more information on this topic, click here.
To configure the Waste Top N Charts by Units Web Part
1. Create the web part. How?
2. On the Report Parameters tab, click the Edit Parameter button.
3. On the Units tab, select the production units.

Plant Applications Web Reporting
185
4. On the Start and End Time tab, specify the report time.
5. On the CrewFilter tab, filter by specific crew, if desired.
6. On the LocationFilter tab, filter by a specific fault, if desired.
7. On the Waste Reason tab, filter by downtime reason, if desired.
8. On the Options tab, filter by product, fault, report level, the number of reasons to include on
the report (Top N), and whether to filter out non-productive time, if desired.
9. On the Finish tab, click Finish.