planting systems - an agronomists view?. alternate row spacings narrow row and alternate row...
TRANSCRIPT

Planting Systems - An Agronomists View?Planting Systems - An Agronomists View?

Alternate Row SpacingsAlternate Row Spacings• Narrow row and alternate row configurations have Narrow row and alternate row configurations have
been of studied as a means to improve yields by been of studied as a means to improve yields by improving light and water use efficiencies. improving light and water use efficiencies.
• Karlen et al., (1985) reported 5 to 10% yield increase Karlen et al., (1985) reported 5 to 10% yield increase from narrow rows over 38 in rows.from narrow rows over 38 in rows.
• Paszkiewicz (2002) summarized a series of narrow Paszkiewicz (2002) summarized a series of narrow row studies throughout the corn belt and found:row studies throughout the corn belt and found:
– Yield response to narrow rows ranged from -1.6 to Yield response to narrow rows ranged from -1.6 to 7.6% compared to 30 in rows. 7.6% compared to 30 in rows.
• Widdicombe and Thelen (2002) reported Widdicombe and Thelen (2002) reported – 30 to 22 in = 2% yield increase30 to 22 in = 2% yield increase– 30 to 15 in = 4% yield increase30 to 15 in = 4% yield increase

Light InterceptionLight Interception
• Paszkiewicz (2002) –Paszkiewicz (2002) –– Yield responses were more likely to occur in NW corn Yield responses were more likely to occur in NW corn
belt compared to other regions of the corn belt. belt compared to other regions of the corn belt. – Attributed advantages to increased light interception in Attributed advantages to increased light interception in
light limiting environments. light limiting environments.
• Andrade et al. (2002) – Andrade et al. (2002) – – Clearly illustrated that yield increases occur in narrow Clearly illustrated that yield increases occur in narrow
rows in response increased light interceptionrows in response increased light interception

Narrow Row Corn StudyNarrow Row Corn Study
• Years - 1996, 1997, 1998
• Row spacings - 15, 20 and 30 inch
• Plant populations - 20-, 26-, 32-, and 36,000 plants/a
• Locations - Scandia (irrigated), St. John (irrigated) & Belleville (dryland)

60
70
80
90
100
110
120
130
140
16,000 20,000 24,000 28,000 32,000 36,000 40,000
Plant Population (plts/a)
Gra
in Y
ield
(bu
/a)
15 20 30
Belleville 1996 - DrylandBelleville 1996 - Dryland
LSD(0.05) = 9.4

40
50
60
70
80
90
16,000 20,000 24,000 28,000 32,000 36,000 40,000Plant Population (plts/a)
Gra
in Y
ield
(b
u/a
)
15 20 30
Belleville 1997 - DrylandBelleville 1997 - Dryland
LSD(0.05) = 9.4

100
120
140
160
180
200
220
16,000 20,000 24,000 28,000 32,000 36,000 40,000Plant Population (plts/a)
Gra
in Y
ield
(b
u/a
)
15 20 30
Scandia 1996 & 97- IrrigatedScandia 1996 & 97- Irrigated
LSD(0.05) = 12.2

IrrigatedIrrigated Dryland DrylandRowRow YieldYield DiffDiff** YieldYield DiffDiff**
Spacing (in) Spacing (in) (bu/a)(bu/a) (bu/a)(bu/a) (bu/a)(bu/a) (bu/a)(bu/a)
1515 188.7188.7 13.413.4 108.3108.3 -5.4-5.42020 185.0185.0 9.7 9.7 106.0106.0 -7.7-7.73030 175.2175.2 ------ 113.8113.8 ------
Narrow Row Corn Summary (96-98)Narrow Row Corn Summary (96-98)Six irrigated site-years and three dryland site-yearsSix irrigated site-years and three dryland site-years
* Difference compared to 30” rows

PlantPlant IrrigatedIrrigated Dryland DrylandPopulationPopulation YieldYield DiffDiff** YieldYield DiffDiff**
(plt/a) (plt/a) (bu/a)(bu/a) (bu/a)(bu/a) (bu/a)(bu/a) (bu/a)(bu/a)
20,00020,000 166.4166.4 ------ 103.7103.7 ------26,00026,000 184.0184.0 17.617.6 107.5107.5 3.7 3.732,00032,000 189.8189.8 23.423.4 111.8111.8 8.0 8.036,00036,000 193.7193.7 27.327.3 114.6114.6 10.910.9
Corn Population Summary (96-98)Corn Population Summary (96-98)Six irrigated site-years and three dryland site-yearsSix irrigated site-years and three dryland site-years
* Difference compared to 20,000 rows

Paired Row Paired Row CornCorn
• Believed to have the same light interception Believed to have the same light interception characteristics of narrow row corn (~22 in).characteristics of narrow row corn (~22 in).
• Can be harvested with conventional corn head.Can be harvested with conventional corn head.

Paired Row Corn Paired Row Corn - Drills- Drills
• Plant paired row corn with fluted feed or air Plant paired row corn with fluted feed or air seeders.seeders.
• Hope that skips in adjacent rows will Hope that skips in adjacent rows will compensate for each other.compensate for each other.
• Seeding depth control and seed placement?Seeding depth control and seed placement?

Paired Row Corn - DrillPaired Row Corn - Drill
• Near McPherson in 1998Near McPherson in 1998
• Irrigated - Center PivotIrrigated - Center Pivot
• Planted with air seederPlanted with air seeder
• Yield were adjusted for harvest loss. Yield were adjusted for harvest loss.

Irrigated Corn 1998Irrigated Corn 1998
140
150
160
170
180
190
30000 40000 50000 60000 70000 80000Plant Population (plts/acre)
Drill 7.5"
Drill 15"
Drill Paired Row
Planter 15"
Planter 30"

Paired Row Corn StudyPaired Row Corn StudyAlexander, KS 2000Alexander, KS 2000
• John Deere 1760 Row Crop Planter & 1860 Air SeederJohn Deere 1760 Row Crop Planter & 1860 Air Seeder
• Two corn hybridsTwo corn hybrids
• Target Plant Populations - Target Plant Populations - – Planter 19,500 & 21,000 seed/a (hybrid specific)– Air Seeder 25,500, 32,500 and 39,000 seed/a
• Measured emergence, plant spacing, seeding depth and yield.Measured emergence, plant spacing, seeding depth and yield.
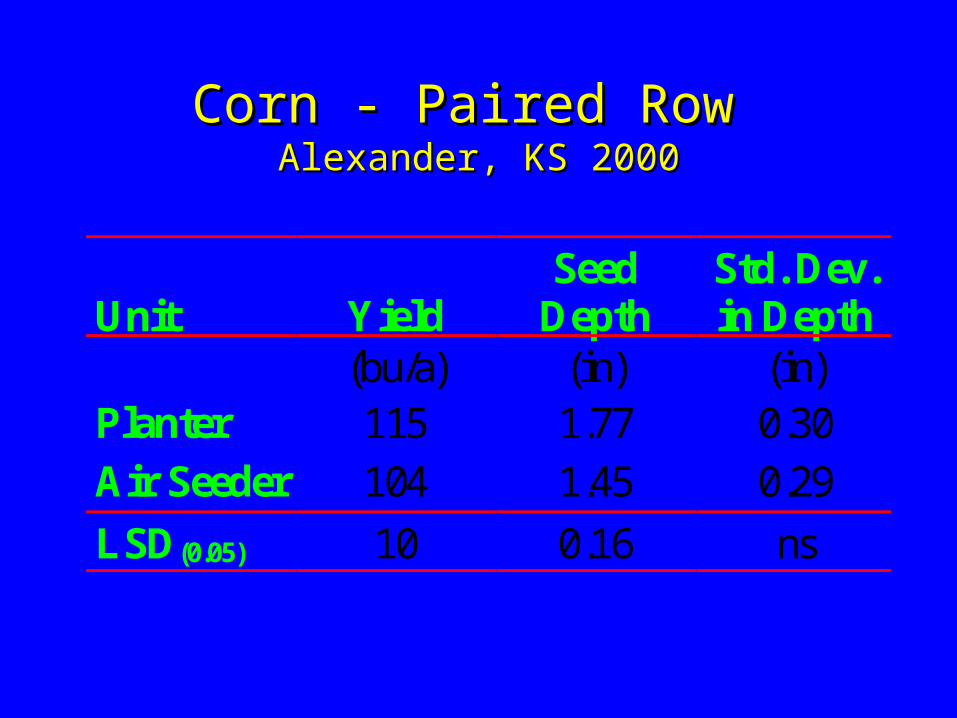
Corn - Paired Row Corn - Paired Row Alexander, KS 2000Alexander, KS 2000
Unit YieldSeed
DepthStd. Dev.in Depth
(bu/a) (in) (in)Planter 115 1.77 0.30
Air Seeder 104 1.45 0.29
LSD(0.05) 10 0.16 ns

Corn - Paired Row Corn - Paired Row Alexander, KS 2000Alexander, KS 2000
0
10
20
30
40
50
60
70
80
90
Miss Quality of Feed Multiple
Inde
x (%
)
Planter
Air Seeder

Materials and MethodsMaterials and Methods• Six Location-Years:Six Location-Years:
– Manhattan (dryland) 2001– Manhattan (dryland) 2002– Powhattan (dryland) 2002– Belleville (dryland) 2002
– Rossville (irrigated) 2001– Topeka (irrigated) 2002
• Three planting patterns:Three planting patterns:– 30 in, 20 in, and paired row
• Previous CropPrevious Crop– Soybeans
• All location-years
– Except Manhattan 2001 • Corn

Materials and MethodsMaterials and Methods• Two plant populations:Two plant populations:
– Dryland: 24,000 and 28,000 plants/a– Irrigated: 26,000 and 30,000 plants/a
• Hybrids used: Pioneer ‘34K77’ (2001) & Pioneer ‘35P12’Hybrids used: Pioneer ‘34K77’ (2001) & Pioneer ‘35P12’
• Yield and yield components were measured.Yield and yield components were measured.– Grain yield– Ears/Plant– Ears/a– Kernel weight

Paired Row Corn - PlanterPaired Row Corn - Planter
• Two locations:Two locations:– Manhattan (dryland) – Rossville (irrigated)
• Two plant populations:Two plant populations:– Manhattan: 24,000 and 28,000– Rossville: 26,000 and 30,000
• Three planting patterns:Three planting patterns:– 30 in, 20 in, and paired row

Analysis of Variance – 2001Analysis of Variance – 2001Grain YieldGrain Yield
Plot LocationsPlot Locations
SourceSource RileyRiley ShawneeShawnee
Row Configuration (RC)Row Configuration (RC) 0.090.09 0.810.81
Plant Density (D)Plant Density (D) 0.460.46 0.190.19
RC X DRC X D 0.590.59 0.370.37
C.V. (%)C.V. (%) 22.422.4 11.811.8
Mean Yield (bu/a)Mean Yield (bu/a) 4141 134134

Analysis of Variance – 2002Analysis of Variance – 2002Grain YieldGrain Yield
Plot LocationsPlot Locations
SourceSource BrownBrown ShawneeShawnee RileyRiley RepublicRepublic
Row Configuration (RC)Row Configuration (RC) 0.170.17 0.770.77 0.880.88 0.050.05
Plant Density (D)Plant Density (D) 0.440.44 0.780.78 0.090.09 0.740.74
RC X DRC X D 0.090.09 0.810.81 0.020.02 0.320.32
C.V. (%)C.V. (%) 9.49.4 33.233.2 6.46.4 33.333.3
Mean Yield (bu/a)Mean Yield (bu/a) 6767 9191 4545 1515

Republic 2002Republic 2002
Row Row ConfigurationConfiguration
Grain YieldGrain Yield
bu/abu/a
30 in30 in 25 a 25 a ††
20 in20 in 12 b12 b
PairedPaired 10 b10 b
† † means followed by the same letter in the means followed by the same letter in the same column are not different at same column are not different at αα =0.05=0.05

Analysis of Variance – 2003Analysis of Variance – 2003Grain YieldGrain Yield
Plot LocationsPlot Locations
SourceSource BrownBrown ShawneeShawnee RileyRiley RepublicRepublic
Row Configuration (RC)Row Configuration (RC) 0.980.98 0.300.30 0.930.93 0.890.89
Plant Density (D)Plant Density (D) 0.530.53 0.280.28 0.830.83 0.740.74
RC X DRC X D 0.520.52 0.540.54 0.980.98 0.220.22
C.V. (%)C.V. (%) 7.97.9 8.48.4 14.014.0 43.343.3
Mean Yield (bu/a)Mean Yield (bu/a) 8383 123123 4545 5656

Analysis of Variance – 2004Analysis of Variance – 2004Grain YieldGrain Yield
Plot LocationsPlot Locations
SourceSource ShawneeShawnee RepublicRepublic
Row Configuration (RC)Row Configuration (RC) 0.040.04 0.050.05
Plant Density (D)Plant Density (D) 0.010.01 0.210.21
RC X DRC X D 0.240.24 0.800.80
C.V. (%)C.V. (%) 4.84.8 13.313.3
Mean Yield (bu/a)Mean Yield (bu/a) 220220 231231

Corn - Paired Row - 2004 Corn - Paired Row - 2004
0
50
100
150
200
250
300
30-in Paired -Row
20-in
Yie
ld (
bu
/a)
a
b b
0
50
100
150
200
250
300
30-in Paired -Row
20-in
Yie
ld (
bu
/a)
a b a
ShawneeShawnee

Paired Row CornPaired Row Corn• Narrow rows showed and advantage in high yielding Narrow rows showed and advantage in high yielding
environments in the late 1990s. Narrow rows reduced yields environments in the late 1990s. Narrow rows reduced yields significantly when an extended period of early season water significantly when an extended period of early season water stress was encountered. stress was encountered.
• Establishing consistent stands with and air seeder or fluted feed Establishing consistent stands with and air seeder or fluted feed grain drill in paired rows can be challenging. grain drill in paired rows can be challenging.
• Paired rows may have canopy characteristics similar to 20 or 22 Paired rows may have canopy characteristics similar to 20 or 22 in rows, but the advantage of these row spacings were not in rows, but the advantage of these row spacings were not realized in this study. realized in this study.
• If adequate stands can be established in paired rows (non air If adequate stands can be established in paired rows (non air seeder or fluted feed systems) yields will likely be similar to 30 seeder or fluted feed systems) yields will likely be similar to 30 in rows planted with a planter under most dryland situations in in rows planted with a planter under most dryland situations in Kansas. Kansas.

Questions?


Paired Row CornPaired Row Corn20012001
RowRow ManhattanManhattan RossvilleRossvilleSpacingSpacing YieldYield Ears/PlantEars/Plant YieldYield Ears/PlantEars/Plant
bu/abu/a bu/abu/a30 in30 in 36.436.4 0.80.8 137.8137.8 1.01.020 in20 in 43.443.4 1.01.0 132.4132.4 1.01.0Paired Paired 39.939.9 0.90.9 133.1133.1 1.01.0LSDLSD(0.05)(0.05) NSNS NSNS NSNS NSNS
Plant population treatments did not significantly affect yields. Plant population treatments did not significantly affect yields.

Corn Yield Loss from Plant Spacing Variability Corn Yield Loss from Plant Spacing Variability
y = 1.328x + 0.3959
R2 = 0.46
0
4
8
12
16
20
0 1 2 3 4 5 6 7 8
Seed Spacing (Standard Deviation)
Yie
ld L
oss
(%)
0.83.2
6.6
10.6
Vanderlip et al., 1988

Planter Speed Planter Speed YieldYield
50
75
100
125
150
175
200
3 4 5 6 7 8 9 10 11 12Speed (mph)
Yie
ld (
bu
/a)
Powhattan Topeka Powhattan 00

Finger Pick-Up TestFinger Pick-Up Test• Use a Kinze Test Stand (Model 3000)Use a Kinze Test Stand (Model 3000)
• Ran two new meters at : 40 – 100 rpmRan two new meters at : 40 – 100 rpm– Converted to mph at 3 seeding rates
• Medium Round Corn SeedMedium Round Corn Seed
• Meter calculates Accuracy, Skips and Multiples. Meter calculates Accuracy, Skips and Multiples.

Finger Pick-Up TestFinger Pick-Up Test
0
2
4
6
8
10
12
14
16
18
20
30 40 50 60 70 80 90 100 110RPM
% M
ult
iple
s
0
1
2
3
4
5
% S
kips
Multiples Skips

Managing Plant SpacingManaging Plant Spacing• Select the correct hybrid for your conditionsSelect the correct hybrid for your conditions
• Plant it at the right time (late April-Early May)Plant it at the right time (late April-Early May)
• Plant the correct population – speed influencePlant the correct population – speed influence
• Maintain your planter and adjust it correctly Maintain your planter and adjust it correctly

Finger Pick-Up TestFinger Pick-Up Test
0
0.2
0.4
0.6
0.8
1
1.2
1.4
1.6
0 2 4 6 8 10 12
MPH
% S
kip
s
24000 28000 32000

Finger Pick-Up TestFinger Pick-Up Test
0
2
4
6
8
10
12
14
16
18
20
0 2 4 6 8 10 12
MPH
% M
ult
iple
s
24000
28000
32000


Planter Speed StudyPlanter Speed Study
• Corn Seeding Rates:Corn Seeding Rates: 23,525 & 27,330 seed/acre 23,525 & 27,330 seed/acre
• Planter Speeds:Planter Speeds: 5, 8 and 11 mph 5, 8 and 11 mph
• Four row plots Four row plots
• Measured grain yield and plant spacingsMeasured grain yield and plant spacings

Planter Speed - Corn 2000Planter Speed - Corn 2000Multiple IndexMultiple Index
0
2
4
6
8
10
12
14
16
4 6 8 10 12
Speed (mph)
Mul
itpl
e In
dex
23525 plts/a
27330 plts/a
LSDsPop = ns
Speed = nsP x S = ???

0
5
10
15
20
25
4 6 8 10 12
Speed (mph)
Mis
s In
dex
23525 plts/a27330 plts/aAverage
LSDsPop = ns
Speed = 7.2P x S = ns
Planter Speed - Corn 2000Planter Speed - Corn 2000Miss IndexMiss Index

60
70
80
90
100
110
4 6 8 10 12
Speed (mph)
Qua
lity
of F
eed 23525 plts/a
27330 plts/aAverage
LSDsPop = ns
Speed = 7.6P x S = ns
Planter Speed - Corn 2000Planter Speed - Corn 2000Quality of Feed IndexQuality of Feed Index

15
20
25
30
4 6 8 10 12
Speed (mph)
Pre
cisi
on
23525 plts/a27330 plts/aAverage
LSDsPop = ns
Speed = 3.9P x S = ns
Planter Speed - Corn 2000Planter Speed - Corn 2000 Precision Index Precision Index

ConclusionsConclusions• Plant variability can result in 10% yield losses under Plant variability can result in 10% yield losses under
extreme conditions. extreme conditions.
• Skips and doubles increase as planter speed increases, Skips and doubles increase as planter speed increases, but skips reduce yields, but doubles increase yields if no but skips reduce yields, but doubles increase yields if no barrenness occurs.barrenness occurs.
• Final plant population should be the first goal and then Final plant population should be the first goal and then worry about plant spacing uniformity. worry about plant spacing uniformity.
• Few improvements are likely to be gained when using a Few improvements are likely to be gained when using a new or well maintained planter operated at 4 to 7 mph. new or well maintained planter operated at 4 to 7 mph.

Experimental DesignExperimental Design• Planter-Row SpacingPlanter-Row Spacing
– Drill 7.5”, 15” and 30” (low pop only)
– Planter 15” and 30”
• Three populations (160, 190 and 210,000)Three populations (160, 190 and 210,000)• Replicated three times (39 plots)Replicated three times (39 plots)• Planted 30 foot strips about 1000 feet longPlanted 30 foot strips about 1000 feet long• Squared plots to about 900 feet long and harvested Squared plots to about 900 feet long and harvested
the center 20 feetthe center 20 feet• Yield monitor and weigh wagonYield monitor and weigh wagon

0
3
6
9
12
15
18
120 140 160 180 200
Plant Density (1000 plts/acre)
Gra
in Y
ield
(bu
/acr
e)
30 15
ns
Soybean 2000Soybean 2000
100 120 140 160
Plant Density (1000 plts/acre)
30 15 7.5
ns
PlanterPlanter DrillDrill

40
50
60
70
80
90
100
120 170 220
Plant Density (1000 plts/acre)
Em
erge
nce
(%)
30 15
ns
Soybean 2000Soybean 2000
120 170 220
Plant Density (1000 plts/acre)
30 15 7.5
PlanterPlanter DrillDrill

ConclusionsConclusions
• When yields are extremely low, row When yields are extremely low, row spacing and plant population have little spacing and plant population have little effect on soybean yieldseffect on soybean yields
• Soybeans planted with planter units had Soybeans planted with planter units had greater establishment rates (plants/seed greater establishment rates (plants/seed drop) than soybeans planted with a drill.drop) than soybeans planted with a drill.

K STATE Research and Extension
““KnowledgeKnowledge Life”Life”forfor


Planter Speed Planter Speed Topeka 2001Topeka 2001
Emergence (%)Emergence (%)
SourceSource 4/284/28 4/304/30 5/45/4
Speed (S)Speed (S) NSNS NSNS NSNS
Firmer (F)Firmer (F) NSNS **** NSNS
S X FS X F NSNS NSNS NSNS
Expressed as % of final stand as determined on 6/20

Planter Speed Planter Speed Topeka 2001Topeka 2001
Seed Seed SpacingSpacing Std DevStd Dev
Multiple Multiple IndexIndex
Miss Miss IndexIndex
(in)(in) (in)(in)
KeatonKeaton 7.07.0 3.353.35 11.211.2 12.712.7
NoneNone 7.27.2 3.683.68 10.910.9 14.114.1
LSDLSD(0.05)(0.05) NSNS 0.310.31 NSNS NSNS

Planter Speed Planter Speed Topeka 2001Topeka 2001
Emergence (%)Emergence (%)
4/284/28 4/304/30 5/45/4
KeatonKeaton 0.30.3 36.736.7 93.093.0
NoneNone 0.00.0 39.339.3 89.789.7
LSDLSD(0.05)(0.05) NSNS NSNS 3.03.0
Expressed as % of final stand as determined on 6/20

Planter Speed Planter Speed Powhattan 2001Powhattan 2001
SourceSource
Seed Seed SpacingSpacing Std DevStd Dev
Multiple Multiple IndexIndex
Miss Miss IndexIndex
Speed (S)Speed (S) NSNS **** **** ****
Firmer (F)Firmer (F) NSNS **** NSNS NSNS
S X FS X F NSNS NSNS NSNS NSNS

Planter Speed Planter Speed Topeka 2001Topeka 2001
y = -0.1362x2 + 2.13x - 4.1337
y = 1.725x - 1.0083
y = 1.85x + 0.4167
0
2
4
6
8
10
12
14
16
18
20
4 5 6 7 8 9 10Speed (mph)
Std. DevMultiple IndexMiss Index

Planter Speed Planter Speed Topeka 2001Topeka 2001
Emergence (%)Emergence (%)
SourceSource 4/284/28 4/304/30 5/45/4
Speed (S)Speed (S) NSNS NSNS NSNS
Firmer (F)Firmer (F) NSNS **** NSNS
S X FS X F NSNS NSNS NSNS
Expressed as % of final stand as determined on 6/20

Planter Speed Planter Speed Topeka 2001Topeka 2001
Seed Seed SpacingSpacing Std DevStd Dev
Multiple Multiple IndexIndex
Miss Miss IndexIndex
(in)(in) (in)(in)
KeatonKeaton 7.07.0 3.353.35 11.211.2 12.712.7
NoneNone 7.27.2 3.683.68 10.910.9 14.114.1
LSDLSD(0.05)(0.05) NSNS 0.310.31 NSNS NSNS

Planter Speed Planter Speed Topeka 2001Topeka 2001
Emergence (%)Emergence (%)
4/284/28 4/304/30 5/45/4
KeatonKeaton 0.30.3 36.736.7 93.093.0
NoneNone 0.00.0 39.339.3 89.789.7
LSDLSD(0.05)(0.05) NSNS NSNS 3.03.0
Expressed as % of final stand as determined on 6/20

Speed and Planter Rate (1 rep)Speed and Planter Rate (1 rep)
5 mph
11 mph
8 mph
5 mph
11 mph
8 mph
27,3
3027
,330
23,5
2523
,525
Blocking seeding rates made sub plots (speed) easier to implementBlocking seeding rates made sub plots (speed) easier to implement
380 ft380 ft

Planter Speed StudyPlanter Speed Study• Yield was measured using an AgLeader PF3000 Yield was measured using an AgLeader PF3000
yield monitor to estimate weight yield monitor to estimate weight (distance measured with a tape).
• Plant spacings of 20 plants were measured for Plant spacings of 20 plants were measured for planter performance evaluation. planter performance evaluation.

Planter Speed - Corn 2000Planter Speed - Corn 2000YieldYield
60
70
80
90
100
110
120
4 6 8 10 12
Speed (mph)
Yie
ld (
bu/a
)
23,525
27,330
NS
LSDsPop = ns
Speed = nsP x S = ??

Planter Speed StudyPlanter Speed Study
27,33027,330
23,52523,525
Rep 1
23,52523,525
27,33027,330
Rep 2
27,33027,330
23,52523,525
Rep 3
Plan
t Sp
acing M
easurem
ent A
rea

Planter Speed - Corn 2000Planter Speed - Corn 2000Standard DeviationStandard Deviation
0
1
2
3
4
5
6
7
4 6 8 10 12
Speed (mph)
Mu
litp
le I
nd
ex
23525 plts/a
27330 plts/a
LSDsPop = ns
Speed = nsP x S = ns

Give the crop a head startGive the crop a head start
• Get a proper standGet a proper stand– Be sure planters
are properly adjusted
– Be sure planters are properly maintained
– Consider slowing down. 0
2
4
6
8
10
12
14
16
18
20
0 5 10 15Speed (mph)
Per
cent
age
Multiple Index
Miss Index

y = -0.0782x2 + 0.3442x + 0.5897
R2 = 0.7343
0.5
0.6
0.7
0.8
0.9
1.0
1.1
1.2
0.0 1.0 2.0 3.0Planting Depth (in)
Yie
ld (
% o
f M
ax)
Proper Planting Depth Proper Planting Depth • Planting corn and sorghum deep (2 & 1.5”) will reduce Planting corn and sorghum deep (2 & 1.5”) will reduce
early season mortality under dry soil conditions. early season mortality under dry soil conditions.
Source:AgWay

Geary County 1998Geary County 1998
• Planter Speeds: 3.4, 4, 5, 6, 7, and 8 mphPlanter Speeds: 3.4, 4, 5, 6, 7, and 8 mph
• Target Population: 27,500 plants/acreTarget Population: 27,500 plants/acre
• Measured Plant Standard Deviation with a Measured Plant Standard Deviation with a mechanical tripping lever device. mechanical tripping lever device.

Plant Populations and Standard DeviationPlant Populations and Standard Deviation
y = 0.1862x + 2.7202
R2 = 0.7216
y = -0.1896x + 24.801
R2 = 0.63830.00.51.01.52.02.53.03.54.04.5
0 2 4 6 8 10
Planter Speed (mph)
Stan
dard
Dev
iati
on (
in)
22.0
22.5
23.0
23.5
24.0
24.5
25.0
25.5
26.0
Pop
ulat
ion
(100
0 pl
ts/a
)
Standard DevPlant Density

Vanderlip et al. (1988)Vanderlip et al. (1988)
• Less than 25% of the yield variability was Less than 25% of the yield variability was accounted for by within-row spacing accounted for by within-row spacing variabilityvariability
• In all tests, yield reduction due to variability In all tests, yield reduction due to variability in plant spacing was less than 1 bu/A per in plant spacing was less than 1 bu/A per inch standard deviation in plant spacinginch standard deviation in plant spacing

Plant SpacingPlant Spacing
• About 3.5 bu/A yield reduction for each About 3.5 bu/A yield reduction for each inch of standard deviation in plant inch of standard deviation in plant spacing(Krall et al. 1977)spacing(Krall et al. 1977)
• Less than one inch of standard deviation in Less than one inch of standard deviation in plant spacing for reducing planter speed plant spacing for reducing planter speed from 8 mph to 4 mphfrom 8 mph to 4 mph

Osage County PlotsOsage County Plots
• Standard DeviationsStandard Deviations– Maximum = 6.4– Average = 3.9– Minimum = 2.2
• Emergence related variability, not planter Emergence related variability, not planter speedspeed

Skips and Doubles?Skips and Doubles?• DoublesDoubles
- Plants in the double reduced grain wt/plant by 12% - Plants in the double reduced grain wt/plant by 12% (range 10 to 16%)(range 10 to 16%)- However, no barrenness in the doubles increased - However, no barrenness in the doubles increased yield/acre by 14 to 26%yield/acre by 14 to 26%
• SkipsSkips-- Plants next to a skip yielded from 9 to 15% higher Plants next to a skip yielded from 9 to 15% higher than the controlsthan the controls- But the increase was not enough to compensate for - But the increase was not enough to compensate for the missing plantsthe missing plants
Nafziger, 1996

Skips and Doubles?Skips and Doubles?• 10% 10% skipsskips in a field at 18,000 plants/a will in a field at 18,000 plants/a will
reducereduce yields by 5% and 8% at 30,000 yields by 5% and 8% at 30,000 plants/a. plants/a. (increasing seeding rates will reduce the (increasing seeding rates will reduce the number of skips)number of skips)
• 10% 10% doublesdoubles in a field at 18,000 plants/a in a field at 18,000 plants/a will will increaseincrease yields 8% and 4% at 30,000 yields 8% and 4% at 30,000 plants/acre plants/acre (reducing plate speed will reduce doubles)(reducing plate speed will reduce doubles)
Nafziger, 1996

0
10
20
30
40
50
60
70
80
10000 15000 20000 25000Plant Population (plts/acre)
0
0.2
0.4
0.6
0.8
1
1.2
1.4
1.6
1.8
2Grain Yield (bu/acre)
Avg Plant Spacing (in)
Plants/row ft
Drilled CornDrilled Corn
Kansas Agricultural Experiment Station Report - 1888

Douglas County Soybean ProjectDouglas County Soybean Project
• 80 acre field in southern Douglas county80 acre field in southern Douglas county
• Worked with K-State in the past on other Worked with K-State in the past on other projectsprojects
• Curious about differences between split-row Curious about differences between split-row planters and drills for soybeansplanters and drills for soybeans

Soil EC and YieldSoil EC and Yield
2000 Soybean 1999 Corn

Plot Yield vs DistancePlot Yield vs Distance
0
5
10
15
20
25
0 200 400 600 800 1000 1200
Distance, feet
Yie
ld, b
u/ac
Planter 15
Drill 7.5

Soil EC PathSoil EC Path

Treatment ComparisonsTreatment Comparisons
Contrast (X vs Y)Establishment
(%)Yield(bu/a)
X-Y X-Y
Planter 15" vs. Drill 15" 21.4 ** 2.1 *
Planter 30" vs. Drill 30" 16.3 ** 1.2 ns
Planter vs. Drill 17.6 ** 1.9 *
Drill 7.5 vs. Drill 15 9.1 ** 1.9 *
Drill 7.5 vs. Planter 15 -12.4 ** -0.2 ns
Planter 15 vs. Planter 30 -1.3 ns -1.4 ns
** indicates significance at the 0.01 level* indicates significance at the 0.05 level
