plasma processes in the magnetosphere: radiation belt ... · plasma processes in the magnetosphere:...
TRANSCRIPT

Plasma Processes in the Magnetosphere: Radiation Belt Response to
Solar Wind Drivers
inner
belt
outer
belt
Slot
region
Mary K. Hudson Dartmouth College
Contributions: T. Brito, Zhao Li, S. Elkington, B. Kress

Earth’s Magnetosphere

Magnetosphere Overview
Ring current
Magnetosphere is highly efficient particle accelerator
keV
10s-100 keVs MeV
eV el keV p
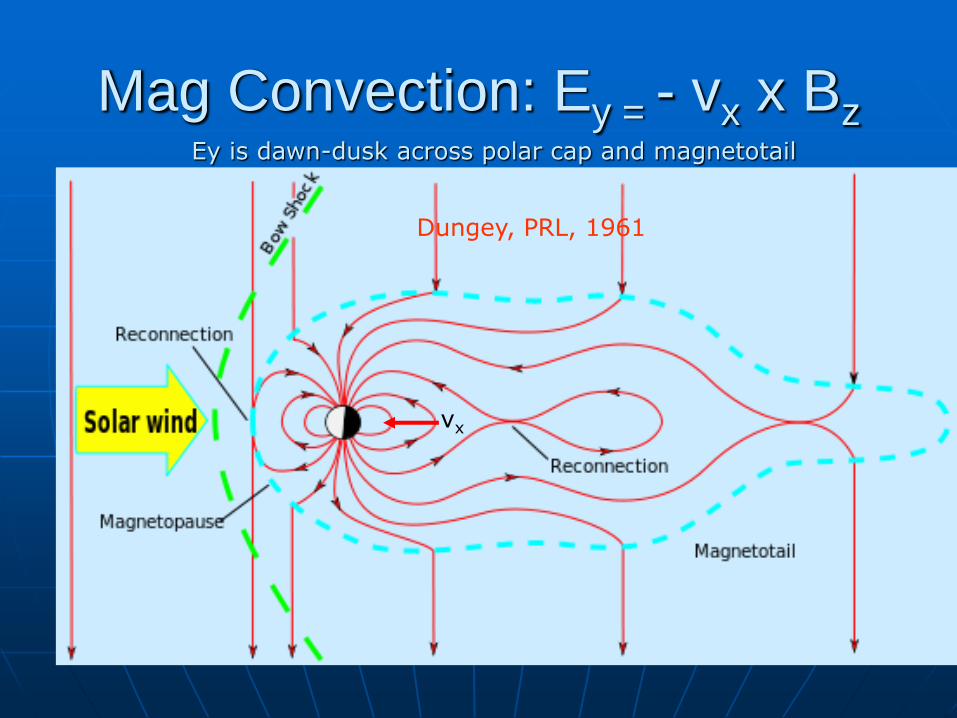
Mag Convection: Ey = - vx x Bz Ey is dawn-dusk across polar cap and magnetotail
vx
Dungey, PRL, 1961

• The Radiation Belts consist of
energetic charged particles (plasma)
trapped by Earth's magnetic field
• Historic discovery in 1958 by the
Explorer I under Dr. James Van
Allen at the University of Iowa.
• The trapped radiation was first
mapped out by Sputnik 3, Explorer
IV, Pioneer III and Luna 1.
• Energetic electrons form two
distinct radiation belts, while
protons form a single belt.
Radiation Belts: The Big Picture
Explorer I

: Pitch angle
L
( )m
m
s
m
s
K B B s ds
S
da B
2 2 2sin
2 2
p p
mB mB
2*
E
ML
R
Adiabatic invariants:
– Cyclotron motion:
– Bounce motion:
– Drift motion:
Adiabatic invariants
and
[MeV/G]

CME vs. High Speed Stream
Source of MeV Electron Events
Solar Maximum Declining Phase

SAMPEX 2-6 MeV for 92-09
(Extended from Li et al., GRL, 2006)
Li et al., JGR, 2011
CME-storms CIR storms

CME vs. CIR Storms
Tsurutani et al., JGR, 2006
3.5 – 9 days
2 – 5 days

Unusual Solar Minimum 2009

Geosynchronous Electrons vs. vsw
measurements from ATS-6 (1979)

SAMPEX Flux > 2 MeV, 2.5<L<6.5
Remains enhanced post-forcing
Baker et al., Space Weather, 2004
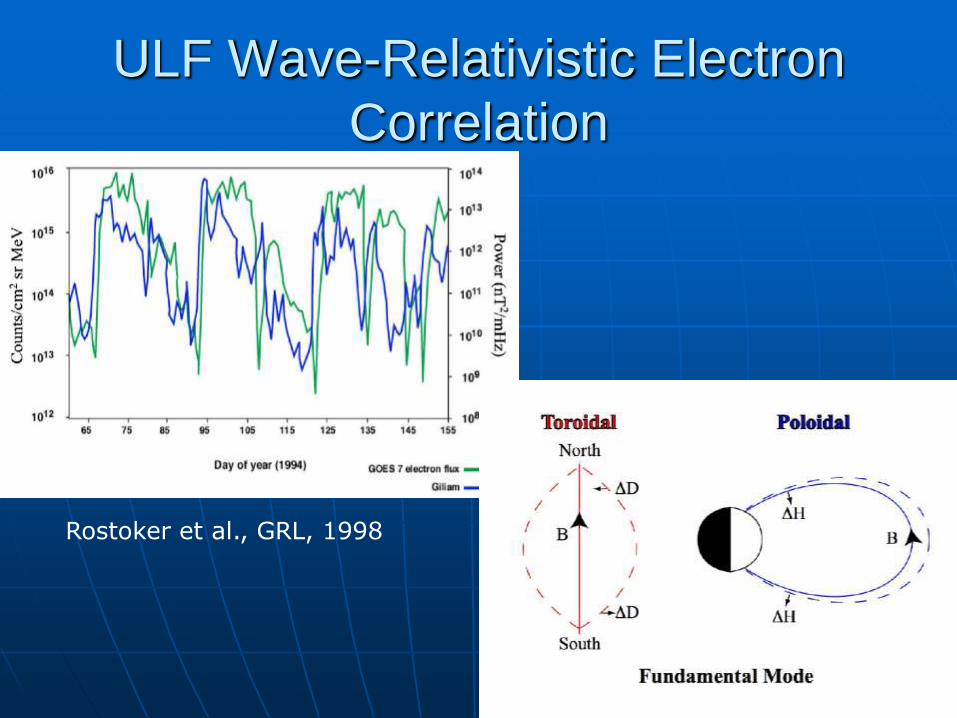
ULF Wave-Relativistic Electron
Correlation
Rostoker et al., GRL, 1998

Direct Coupling of Solar Wind ULF Waves
Kepko & Spence, JGR, 2003
Or Convective Growth of Magnetopause K-H Waves Miura, JGR, 1992
Claudepierre et al., 2008
Both correlated with Vsw

Seasonal Peaks 2.5 < L < 6.5
Baker et al., GRL, 1999

SAMPEX 2-6 MeV for 03-05
Baker et al., 2008

Halloween ’03 2-6 and >10 MeV Electrons
See filling of slot region on storm timescale (days) at 2-6 MeV (Baker et al., 2004)
SAMPEX observes > 2 month delay in high > 10 MeV fluxes at low altitude (longer loss time)

Global MHD Simulations of
Magnetosphere Observations of the
solar wind conditions made by satellites, operating at the L1 point where sun’s = earth’s gravity->input
The ideal MHD equations are solved on a grid to simulate the response of the magnetosphere to the dynamic solar wind

Halloween ’03 Shock Injection
W ~ 5 MeV 15 MeV
R ~ 6 RE 2.5 RE
Kress et al., JGR, 07
MHD-test particle simulation
curlE = - dB/dt : dBz/dt Ephi
29 October 2003
LFM MHD code

Halloween ’03 Shock Injection of >10
MeV (W0=1-7 MeV) Electrons
Kress et al., 2006

Trapped MeV electron in H-storm MHD fields
Lorentz to Guiding Center Switch Implemented

H’storm Injection & SEE Source
Kress et al., JASTP, 2008

SAMPEX 2-6 MeV for 03-05
Baker et al., 2008

July & Nov 04 Differ by SSC
SAMPEX Measurements

NOAA GOES > 2 MeV el flux

Radial Diffusion for July & Nov 04
July 04 triple-storm
Nov 04 SSC storm
f
L
fLD
LL
dt
dfll
22
Kp-dependent Dll and p’pause; lifetime inside (10 days) outside (Kp/3 days); Dynamic outer boundary from LANL PSD
μ= 2000 MeV/G
f(v,r;t) = f(μ,K,Φ) = j/p2

Radial Diffusion-
CRRES Data Comparison
2-months following
March 1991 prompt injection
Recurring high speed streams
Recovery of slot region as
plasmapause penetrates to
low L
1 MeV fluxes, interpolated from PSD at fixed Mu

MHD Fields Inject RadBelt
Electrons
Elkington et al., JASTP, 2004
Plasmasheet el injection

MHD Fields Injection of RadBelt
Electrons
Elkington et al., JASTP, 2004

f calculations for other storms…
January 1995 September 1998 (final)
•The (big) September 1998 storm shows a significant change in trapped PSD as
a result of coupling to the plasmasheet.
•The more moderate storm of January 1995 showed almost no coupling with
the plasmasheet. Elkington et al., 2008

Sep 98 CME Storm, Jan 95 Substorm
Shows importance of convection E_phi:

SAMPEX 2-6 MeV for 92-09
(Extended from Li et al., GRL, 2006)
Li et al., JGR, 2011
CME-storms CIR storms

CIR Stream Interactions
March-April 2008
Whole Heliosphere Interval
Geospace response to each stream had distinct features • Stream 1 had
higher Φpc for longer than Stream 2 even though Vx was lower
• Bz plays an important role in determining geoeffectiveness of streams
• Carrington Rotation 2068
CMIT-L1 simulation
ACE data
S1 S2
ACE Data

Stream 1&2 GOES Electrons
j increase > 2 MeV is ~ 104, > 0.6 MeV is 101.5
no j increase after 4 days
S1
S2
> 600 keV
> 2 MeV

2D-Plasmasheet Injection
Trapped only: losses Trapped + P’sheet Injection
M = 1000 MeV/G, 600 keV at L = 6.6 (100 nT)

Eφ at GEO Determines Efficiency of
Plasmasheet Injection
Dst = -56 nT
Dst = -33 nT
1mV/m->

2D PSD: Stream1 Stream2 a
b
c f
h
i
gd
e
Trapped only + P’sheet injection
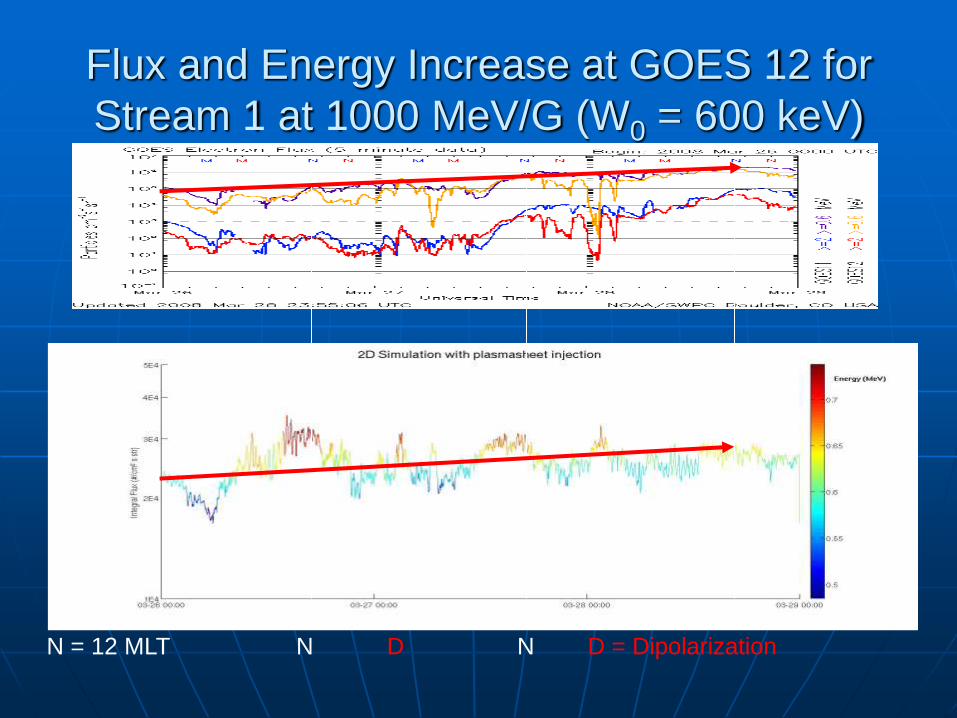
Flux and Energy Increase at GOES 12 for
Stream 1 at 1000 MeV/G (W0 = 600 keV)
N = 12 MLT N D N D = Dipolarization
GOES B-field f→j conversion

Slot region variability tied to plasmapause
inner
belt
outer
belt
Slot
region
SAMPEX electrons: 2 - 6 MeV
slot region
L = 2 - 3
Outer belt
inner belt

Plasmapause explanation
Balance convection E0 assume uniform dawn-dusk
with corotation Er inward, oppose at dawn moves p’pause inward and reinforce at dusk moves p’pause outward
Dayside plume forms when E0 increases, p’pause moves inward
Grebowsky, JGR, 1970
Related separatrix between convecting and grad-B drifting plasma: Alfven layer Depends on el/p energy and local B
Econv
Ecor

slot region new belt
Effect on the Radiation Belts of Plasmapause Location
[Baker et al., 2004, Nature]
Halloween Storm 2003

Unusual Solar Minimum 2009

Pitch Angle & Energy Diffusion
Internal Loss & Source
VLF chorus from p’sheet electrons
EMIC waves from ring current ions
Local Accel
After Summers et al., 1998

Whistler Chorus and Hiss
Hiss – inside plasmaphere
Chorus – outside plasmasphere
Bortnik et al., Nature, 2008
0
2 kHz

Slot Region Due to Hiss
ρ ~ B/grad B
determines
trapping boundary

Pitch Angle & Energy Diffusion
Internal Loss & Source
VLF chorus from p’sheet electrons
EMIC waves from ring current ions
Local Accel
After Summers et al., 1998

Hybrid dipole simulations of whistler chorus
due to Tperp/T// > 1 , Wu and Denton
• Waves are generated
near the equator and
propagate away from to
higher lattitude.
• Wave power peaks at the
equator in a dipole field
model.
• The chorus rising tone
sweep rate is 60 times
larger compared to
observation due to
assumed mag field
inhomogeneity.
Preliminary Results
0.25
qc /w pe0
1
0
1
0
1
0
1
0
1
0
1
0
1
0
1
0-1 0 1
100~200
200~300
300~400
400~500
500~600
qc /w pe0tWce=
0.15
0.35
=
0 250 500
750 tWce
w / Wce w / Wce

Hybrid Code Simulation – 2D preliminary results

Two identical highly-instrumented
spacecraft, elliptical orbits (~600 km x
5.8 RE, 10o inclination)
Expected launch – August 23, 2012
Radiation Belt Storm Probes

RBSP Particle Instrument
Capabilities
electrons
protons
HOPE
HOPE
HOPE
RBSPICE
RBSPICE
RBSPICE
MagEIS
RPS
Particle Sensors
PSBR/RPS
ECT/REPT
ECT/MagEIS
ECT/HOPE
RBSPICE
1eV 1keV 1MeV 1GeV
MagEIS
REPT
ion
composition
Level 1 Requirement
Capability
Energy
REPT
MRD Requirement

BARREL(Balloon Array for RBSP Relativistic
Electron Losses)
Measure x-rays due to precipitating electrons
Two campaigns - January 2013 and 2014
20 balloons launched each year
Make correlated measurements with RBSP
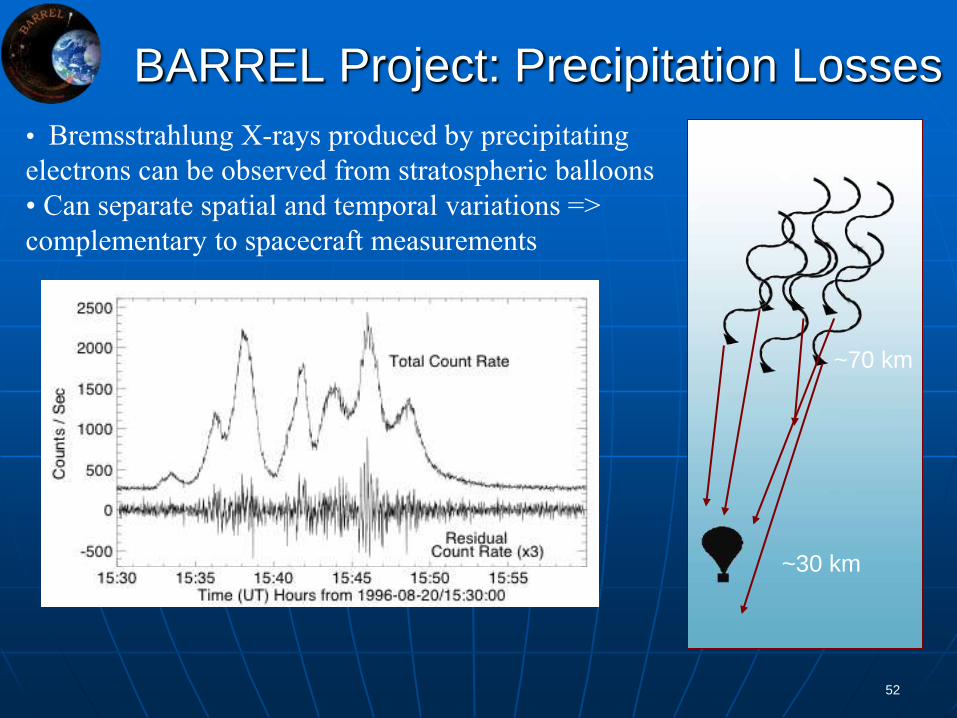
BARREL Project: Precipitation Losses
52
• Bremsstrahlung X-rays produced by precipitating
electrons can be observed from stratospheric balloons
• Can separate spatial and temporal variations =>
complementary to spacecraft measurements
~30 km
~70 km

Altitude of Energy Absorption
Baker and Blake, 2012
Balloons ~ 100K ft

Conclusions
Outer zone electrons have dynamic time-history tied to solar variability
Source and loss processes compete during active solar wind driving conditions
Different time scales for outer zone variations
1) Drift time scale (mins) injection of multi- MeV
electrons:
Strong compression of dayside magnetopause due to high speed CME

Conclusions cont.
2)Intermediate storm timescale (hrs,days):
Changes described by convection, radial diffusion, loss to magnetopause (spatial);
Localized heating balanced against
loss due to whistler (and EMIC) scattering into atmosphere
3)Long time scales described by radial diffusion and pitch angle scattering losses to atmosphere
D_LL enhanced ~ 100x by ULF waves during active times; parametrized by Kp (B&A 2000)
Causal link to solar cycle correlation with Vsw

Extra Slides

Source and Loss Balance
Over solar cycle, 276 Dst < -50 storms:
53% increase, 19% decrease, 28% same
Reeves et al., 2003