plastic hinge rotation capacity of reinforced hpfrcc...
TRANSCRIPT

Plastic Hinge Rotation Capacity of Reinforced 1
HPFRCC Beams 2
3
Ali Hemmati 4
Ph.D. Candidate, Civil Engineering Faculty, Semnan University, Semnan, Iran, 5
Email: [email protected] 6
7
Ali Kheyroddin 8
Professor, Civil Engineering Faculty, Semnan University, Semnan, Iran, 9
Email: [email protected] 10
11
Mohammad Kazem Sharbatdar 12
Assistant Professor, Civil Engineering Faculty, Semnan University, Semnan, Iran, 13
Email: [email protected] 14
15
Abstract: High Performance Fiber Reinforced Cementitious Composite (HPFRCC) 16
materials exhibit strain hardening behavior under tensile loading. This strain hardening 17
response occurs after first cracking of the material. In this paper, experimental and 18
parametric studies are performed to assess the influence of the compressive strength, 19
loading type and tension reinforcement ratio (ρ) on the ultimate deformation 20
characteristics of reinforced HPFRCC beams. The analytical and numerical results for 21
simply supported beams with different amounts of tension reinforcement ratio under three 22
different loading conditions are presented and compared with each other and also with the 23

experimental data, where available. The plastic hinge rotation capacity is increased as the 24
loading condition is changed from the concentrated load at the middle to the uniform, and 25
it is a maximum for the case of the two-point load. The effect of the loading type on the 26
plastic rotation capacity of the reinforced beams with high amount of ρ is not as 27
significant as that for the lightly reinforced beams. Based on the analytical results 28
obtained using the nonlinear finite element method, new simple equations as function of 29
the tension reinforcement ratio and the loading type are proposed. The analytical results 30
indicate that the proposed equations can be used with sufficient accuracy for analysis of 31
ultimate capacity and the associated deformations of RHPFRCC beams. 32
Keywords: Nonlinear Analysis, Finite Element, Plastic Hinge, Reinforced Concrete, 33
Rotation Capacity 34
35
a. Introduction 36
HPFRCC is defined as a material with strain hardening response under uni-axial loading. 37
At the first stages, Li and Wu introduced a pseudo-strain-hardening material that used 38
only fine aggregates with reinforcing polyethylene fibers (Li and Wu 1992). In 1996, 39
Naaman and Reinhardt presented and developed a fiber reinforced cementitious material 40
which had a matrix with no coarse aggregates, and regarded as fiber reinforced cement 41
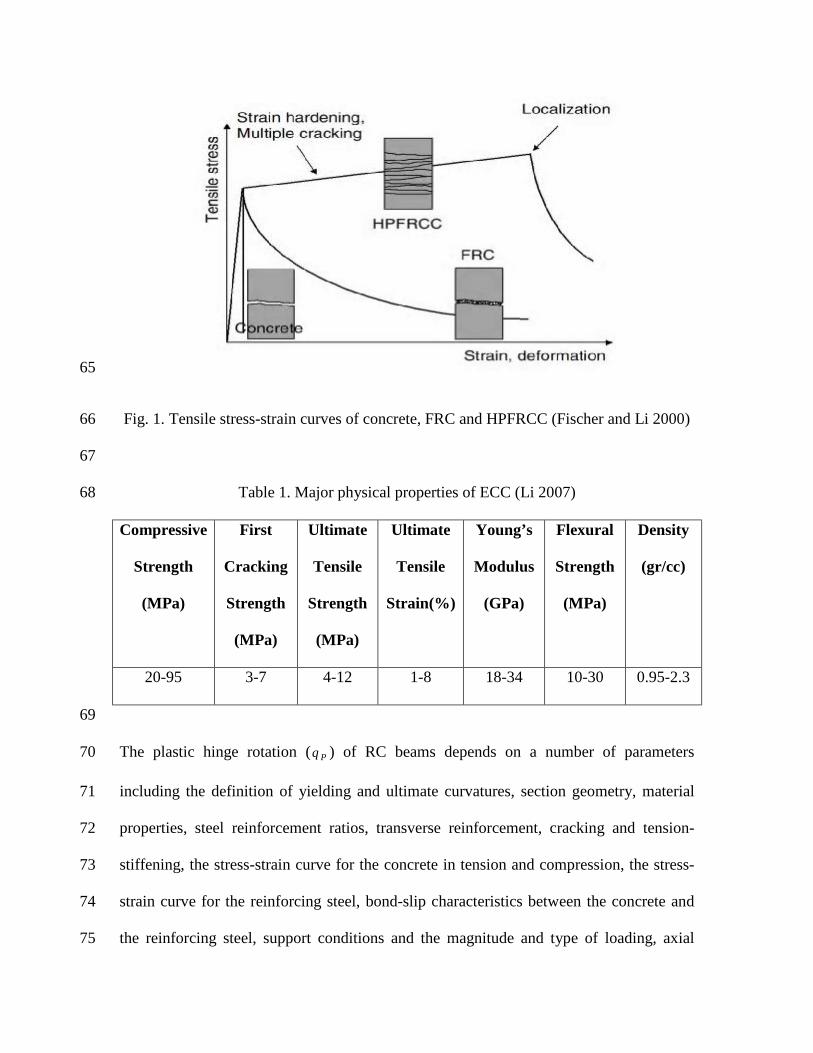
paste or mortar (Naaman and Reinhardt 1996).As it shown in Fig. 1, high tensile ductility 42
with strain hardening response is the most important characteristics of this material which 43
is called as High Performance Fiber Reinforced Cementitious Composite (HPFRCC) 44
compared to normal concrete and fiber reinforced concrete (FRC). In recent years, a new 45
class of HPFRCC has emerged entitled ECC. Engineered Cementitious Composite (ECC) 46

was originally developed at the University of Michigan, with a typical moderate tensile 47
strength of 4-6 MPa and a higher ductility of 3-5% (Fischer et al 2003). After this stage, 48
self-consolidating ECC, high early strength ECC, light weight ECC and green ECC were 49
introduced by different researchers (Kong et al 2003, Wang and Li 2006, Wang and Li 50
2003, Lepech et al 2007). A summary of major physical properties of ECC is given in 51
Table 1 (Li 2007). Some of the researchers have worked on nonlinear finite element 52
analysis of concrete and HPFRCC sections (Ghobarah and Aly 1998, Shaheen and Shrive 53
2008, Ranzi and Bradford 2009). Results showed that there is an appropriate 54
compatibility between experimental tests and analytical investigations in regard of 55
concrete and HPFRCC (Han et al 2003, Sirijaroonchai 2009, Na and Kwak 2011). 56
A large number of researchers have developed ECC material based on PVA fiber. But, 57
decision making on selecting and using the type of fibers, depends on fiber’s natural 58
characteristics such as diameter ranges, surface characteristics and mechanical behavior. 59
It also depends on the matrix cracking properties, fiber-matrix interfacial bonding 60
properties, the desired properties of the ECC composites, the durability needed, the 61
desired sustainability of the system and the economic constraints of the application. (Lee 62
et al 2010). 63
64
65
Fig. 1. Tensile stress-strain curves of concrete, FRC and HPFRCC (Fischer and Li 2000) 66
67
Table 1. Major physical properties of ECC (Li 2007) 68
Compressive
Strength
(MPa)
First
Cracking
Strength
(MPa)
Ultimate
Tensile
Strength
(MPa)
Ultimate
Tensile
Strain(%)
Young’s
Modulus
(GPa)
Flexural
Strength
(MPa)
Density
(gr/cc)
20-95 3-7 4-12 1-8 18-34 10-30 0.95-2.3
69
The plastic hinge rotation ( Pθ ) of RC beams depends on a number of parameters 70
including the definition of yielding and ultimate curvatures, section geometry, material 71
properties, steel reinforcement ratios, transverse reinforcement, cracking and tension-72
stiffening, the stress-strain curve for the concrete in tension and compression, the stress-73
strain curve for the reinforcing steel, bond-slip characteristics between the concrete and 74
the reinforcing steel, support conditions and the magnitude and type of loading, axial 75

force, width of the loading plate, influence of shear, and the presence of column 76
(Kheyroddin 1996). Some equations have been proposed to calculate the plastic hinge 77
length ( Pl ) and the inelastic rotation capacity; however, there is no general agreement on 78
the techniques to evaluate the inelastic characteristics of indeterminate concrete 79
structures. The conditions at the ultimate load stage of a typical cantilever beam subjected 80
to uniform load are shown in Fig. 2. For values of loads smaller than the yielding moment 81
( yM ), the curvature is increasing gradually from the free end of a cantilever (point A) to 82
the column face (point B). There is a large increase in the curvature at first yield of the 83
tension steel. At the ultimate load stage, the value of the curvature at the support 84
increases suddenly so that it causes large inelastic deformations (Kheyroddin and 85
Naderpour 2007). 86
As it shown in Fig. 2(c), the actual distribution of curvature at the ultimate load stage can 87
be idealized into elastic and plastic regions, thus the total rotation ( totalθ ) over the beam 88
length can be divided into elastic ( eθ ) and plastic ( Pθ ) rotations. The elastic rotation 89
which is defined until the first yielding of steel can be obtained using the curvature at 90
yielding. The plastic hinge rotation ( Pθ ) on each side of the critical section shown in Fig. 91
2, can be defined as: 92
( )[ ]∫ ⋅−= yl
yP dxx0
φφθ 93
Eq(1) 94
In which, yl is the beam length over which the bending moment is larger than the 95
yielding moment ( yM ) or the distance between the critical section and the location where 96
tension steel bars start yielding and ( )xφ is the curvature at a distance x from the critical 97

section at the ultimate load stage. The shaded area in Fig. 1(c) shows the plastic rotation 98
( Pθ ) that occurred in addition to the elastic rotation at the plastic hinge at the ultimate 99
load stage. The plastic hinge rotation can be determined either by the calculation of 100
shaded area or by an equivalent rectangle of height ( )yu φφ − and width Pl . Equivalent 101
plastic hinge length ( Pl ) can be defined as: 102
( )[ ]∫ ⋅−−
= yl
yyu
P dxxl0
1φφ
φφ 103
Eq(2) 104
Therefore, the value of plastic hinge rotation at the ultimate stage ( Pθ ) can be calculated 105
by the following equation: 106
( ) PPPyuP ll ⋅=⋅−= φφφθ 107
Eq(3) 108
Where uφ and yφ are the curvatures at the ultimate load and yielding, respectively and Pl 109
is the equivalent length of the plastic hinge over which the plastic curvature ( Pφ ), is 110
assumed to be constant (Kheyroddin 1996). 111
112
113
Fig. 2. Curvature distribution along a beam at ultimate stage (Kheyroddin 1996) 114

In this paper, an experimental work was carried out and then a nonlinear finite element 115
program was used for performing a parametric study to examine the influence of 116
compressive strength of HPFRCC, tension reinforcement ratio and the loading type on 117
the ultimate deformation characteristics of reinforced HPFRCC beams and new equation 118
is developed to consider the influence of the various parameters on the calculation of the 119
ultimate curvature, yielding length, plastic hinge length and the plastic hinge rotation of 120
these beams. 121
122
b. Experimental program 123
An experimental investigation was undertaken to corroborate the analytical work and 124
lend further insight into the nature of finite element items in beam analysis. The test 125
specimens which were chosen for this analytical study were two large scale beams with 126
two hinged supports which have been tested by authors. The beam clear span was 2100 127
mm, total length was 2300 mm with constant cross section of 300 mm deep by 200 mm 128
wide. Two-point loading which was increased monotically, applied on this beam. Details 129
of reinforcement layout and loading of the beam are shown in Fig. 3. Material properties 130
are summarized in Table 2. 131
Test set up of RC and RHPFRCC beams is presented in Fig. 4. The amount of damage is 132
more sever in RHPFRCC beam compared to RC beam as it shown in Fig. 5 and Fig. 6. 133
Moreover, the mid-span deflection of RHPFRCC beam is more than RC beam. In RC 134
beam, the ultimate load and mid-span deflection were 239.83 kN and 30.25 mm. While, 135
in RHPFRCC beam, these values are 263.17 kN and 59.95 mm respectively. 136
137

138
139
Fig. 3. Details of the experimental specimen 140
Table 2. Concrete, HPFRCC and steel properties used in the test beam 141
Dimensions and material
properties
(RC beam)
(HPFRCC beam)
)(mmd 270 270
)( 2mmAs 603 603
)( 2mmA s′ 157 157
)(MPaf c′ 35.7 24
*cuε 0.0075 0.0113
)(MPaf y 400 400
)(MPaEs 200,000 200,000
suε 0.02 0.02
* Assumed values 142

143
Fig. 4. Test Set-up 144
145
146
Fig. 5. RC beam at the end of test loading 147
148
Fig. 6. RHPFRCC beam at the end of test loading 149

c. Nonlinear finite element program and calibration 150
The beams were analyzed using the nonlinear finite element software called ABAQUS. 151
This software is a powerful engineering simulation program, based on the finite element 152
method that can perform nonlinear analyses. In a nonlinear analysis, ABAQUS 153
automatically chooses appropriate load increments and convergence tolerances and 154
continually adjusts them during the analysis to ensure that an accurate solution is 155
obtained efficiently (ABAQUS 2008). 156
The reinforcing bars were modeled as an elastic strain hardening material by a 2 node 157
nonlinear truss element shown in Fig. 7. 158
159
160
161
162
163
Fig. 7. Stress-strain curve and nonlinear element of reinforcing bars (ABAQUS 2008) 164
In this paper, concrete damage plasticity was selected for modeling of concrete and 165
HPFRCC materials. The actual stress-strain curve of HPFRCC which was presented by 166
various researchers and is close to regular concrete could be entered in damage plasticity 167
model and calibrated with experimental work (Han et al 2003, Hung and El-Tawil 2010). 168
The model is a continuum, plasticity-based, damage model for concrete. It was assumed 169
that the main two failure mechanisms were tensile cracking and compressive crushing of 170

the concrete material. The evolution of the yield (or failure) surface was controlled by 171
two hardening variables ( pltε~ and pl
cε~ ) linked to failure mechanisms under tension and 172
compression loading, respectively. The model was assumed that the uni-axial tensile and 173
compressive response of concrete was characterized by damaged plasticity, as shown in 174
Fig. 8 (ABAQUS 2008). Where, tε and cε are tensile and compressive strain 175
respectively. Some researchers have been developed other plasticity based models for 176
HPFRCC material too (Kabele and Horii 1996, Sirijaroonchai 2009). 177
If 0E is the initial (undamaged) elastic stiffness of the material, the stress-strain relations 178
under uni-axial tension and compression loading are introduced by Eq. (4): 179
180
( ) ( )pltttt Ed εεσ ~1 0 −−= 181
( ) ( )plcccc Ed εεσ ~1 0 −−= 182
Eq. (4) 183
Where, td and cd are two damage variables in tension and compression (0 = undamaged 184
material and 1 = total loss of strength). 185
The concrete and HPFRCC were modeled as elastic strain softening and elastic strain 186
hardening materials in tension as shown in Fig. 8 and Fig. 9 respectively. A 3-D 187
nonlinear solid element with the ability to modeling the composite sections was applied 188
for modeling these beams (Fig. 10). The compression behavior of these two materials is 189
similar to each other (Fukuyama et al 2000). As it shown in Fig. 9, ccσ and pcσ are the 190
first cracking stress and the maximum stress of HPFRCC with PVA fibers in the range of 191
0.75%-2% and are expressed by Eq. (5) (Suwannakarn 2009): 192

( ) dLVV ffmucc τσσ 5204.01 +−=
193
dLVV ffpc τσ )0933.27074.0( +−=
194
Eq. (5) 195
Where, muσ = Tensile strain of matrix, fV = Volume fraction of fiber, τ = Average bond 196
strength at the fiber matrix interface, L = Fiber length and d = Fiber diameter. 197
198
199
200
201
202
203
204
205
206
Fig. 8. Response of concrete in (a) tension and (b) compression (ABAQUS 2008) 207
208
Fig. 9. Tensile behavior of HPFRCC (Fukuyama et al 2000) 209

210
211
212
213
214
Fig. 10. Nonlinear element for modeling of concrete and HPFRCC (ABAQUS 2008) 215
216
In this research, two beams (RC and RHPFRCC beams) are analyzed using ABAQUS 217
program. To investigate the influence of mesh size on the nonlinear analysis results, three 218
types of mesh configurations were used for analyzing these beams. These mesh 219
configurations including coarse, medium and fine mesh sizes. Load-mid span deflection 220
curves for these two RC and RHPFRCC beams are shown in Fig. 11 and Fig. 12. 221
0
50
100
150
200
250
300
350
400
0 5 10 15 20 25 30 35 40 45Deflection (mm)
P, L
oad
(kN
)
Exp.Anal. (Medium mesh)Coarse meshFine mesh
222
Fig. 11. Load-mid span deflection curves for different mesh sizes in RC beam 223

In RC beams, the medium mesh size (50mm x 50mm), gave an ultimate load value of 224
236.46 kN, which was close to the experimental value 239.83 kN. While the coarse mesh 225
size (100mm x 100mm), results in an ultimate load value 289.17 kN and the fine mesh 226
size (25mm x 25mm), concludes to an ultimate load 180.44 kN. Both of these values are 227
far from the experimental value. In HPFRCC beams, the medium mesh size (50mm x 228
50mm) gave an ultimate load value of 259.5 kN, which was close to the experimental 229
value 263.17 kN. While the coarse mesh size results in an ultimate load value 334.26 kN 230
and the fine mesh size concludes to an ultimate load 220 kN. Both of these values are far 231
from the experimental value. These analytical results are summarized in Table 3 and 232
Table 4. 233
0
50
100
150
200
250
300
350
400
0 10 20 30 40 50 60 70 80Deflection (mm)
P, L
oad
(kN
)
Exp.Anal. (Medium mesh)Coarse meshFine mesh
234
Fig. 12. Load-mid span deflection curves for different mesh sizes in HPFRCC beam 235
236

Table 3. Analytical and experimental results for RC beams with different mesh sizes 237
Size of elements
(mm x mm)
uP (kN) u∆ (mm) ( )( )alExperimentP
AnalyticalP
u
u
Experimental 239.83 30.25 -
25 x 25 180.44 9.18 0.75
50 x 50 236.46 31.84 0.98
100 x 100 289.17 40.43 1.21
238
Table 4. Analytical and experimental results for HPFRCC beams with different mesh 239
sizes 240
Size of elements
(mm x mm)
uP (kN) u∆ (mm) ( )( )alExperimentP
AnalyticalP
u
u
Experimental 263.17 59.95 -
25 x 25 220 12.18 0.84
50 x 50 259.5 59.61 0.98
100 x 100 334.26 69.93 1.27
241
As can be seen in Fig. 11 and Fig. 12, when a coarse mesh size is applied, the beam 242
exhibits a stiffer behavior compared with the experimental response. With increasing the 243
number of elements, the beam trends to be more flexible and less ductile. Infact, the mid 244
span deflection at ultimate load decreases with reducing in element size. Hence, medium 245
mesh size is selected for analytical purposes. Cracking is idealized using the smeared 246
cracking model, and assumed to occur when the principal tensile stress at a point (usually 247

a Gauss integration point) exceeds the concrete tensile strength. The stiffness across the 248
crack is assumed to be zero and the principal directions are not allowed to rotate. For 249
evaluation of an "appropriate" value of the ultimate tensile strain of the concrete, tuε , and 250
elimination of mesh size dependency phenomenon, Shayanfar et al. proposed the 251
following simple formula: 252
253
Eq. (6) 254
Where, h is the width of the element in mm. In concrete materials, finer mesh size does 255
not always conclude to more exact response and there is a limit value for this case. 256
Decreasing in element size of concrete materials is concluded to more flexible beam and 257
subsequently decreasing in ultimate force of the beam (Shayanfar et al 1996). 258
259
d. Analytical models 260
The experimental HPFRCC beam, 200 x 300 mm, with a tension reinforcement ratio of 261
0.0112 and compressive strength of 24 MPa subjected to a two-point load, is used for the 262
parametric study in this paper. In addition, the same beams were analyzed with four other 263
assumed tension reinforcement ratios (0.022, 0.0147, 0.0074, and 0.006), another 264
assumed compressive strength of 35.7 MPa (same to RC beam) under the three load types 265
(two-point, concentrated and uniform). Model names are summarized in Table 5. 266
267
268
269
270
hetu⋅−⋅= 008.0004.0ε

Table 5. Name of analytical models 271
Model
names
Description )(MPa
f c′ Tension reinforcement
ratio )(ρ
Load type
RC1 Reinforced concrete 35.7 0.0112 Two-point
RC2 Reinforced concrete 24 0.0112 Two-point
RH1 Reinforced HPFRCC 24 0.0112 Two-point
RH2 Reinforced HPFRCC 35.7 0.0112 Two-point
RH3 Reinforced HPFRCC 24 0.0112 Concentrated
RH4 Reinforced HPFRCC 24 0.0112 Uniform
RH5 Reinforced HPFRCC 24 0.006 Two-point
RH6 Reinforced HPFRCC 24 0.0074 Two-point
RH7 Reinforced HPFRCC 24 0.0147 Two-point
RH8 Reinforced HPFRCC 24 0.022 Two-point
RH9 Reinforced HPFRCC 24 0.006 Concentrated
RH10 Reinforced HPFRCC 24 0.0074 Concentrated
RH11 Reinforced HPFRCC 24 0.0147 Concentrated
RH12 Reinforced HPFRCC 24 0.022 Concentrated
RH13 Reinforced HPFRCC 24 0.006 Uniform
RH14 Reinforced HPFRCC 24 0.0074 Uniform
RH15 Reinforced HPFRCC 24 0.0147 Uniform
RH16 Reinforced HPFRCC 24 0.0022 Uniform
272
273

e. Results and Discussion 274
e.1. Two-point loading 275
e.1.1. Compressive strength effect 276
Load deflection curves of RH1 and RH2 are illustrated in Fig. 13. Load deflection curves 277
of RC1 and RC2 are illustrated in Fig. 14. The analytical results including the yielding 278
and ultimate loads, deflections and curvatures and ductility ratios for these beams are also 279
presented in Table 5. The mode of failure is flexural for all beams, i.e., steel 280
reinforcements yield prior compressive HPFRCC and concrete crushing. As shown in 281
these figures and tables, ultimate load, deflection, curvature and ductility ratio of RH2 282
beam are about 0.7 %, 1.58 %, 1.8 % and 0.2 % higher than its corresponding values in 283
RH1 beam. In RC1 beam, the ultimate load, deflection, curvature and ductility ratio are 284
about 1 %, 3.6 %, 8.3 % and % 8.3 % more than RC2 respectively. Load and deflection 285
capacity, curvature and ductility ratio of reinforced concrete and HPFRCC beams 286
increase with increasing the compressive strength of concrete and HPFRCC. It seems that 287
these parameters in reinforced HPFRCC beams are higher than corresponding values in 288
reinforced concrete beams. 289
For calculating the of pθ and pl values, the curvature along the beam is obtained from 290
the concrete and HPFRCC strain values in compression zone and from the steel strain in 291
tension zone at the ultimate limit state. Then the pθ is calculated by integration along the 292
yielding length. Curvature distribution in RH1 and RH2 beams and also in RC1 and RC2 293
beams are presented in Fig. 15 and Fig. 16. Plastic hinge characteristics including the 294
yielding length ( yl ), plastic hinge length ( pl ) and plastic hinge rotation ( pθ ) of these 295
beams are also presented in Table 6. As it shown in Fig. 15, the maximum value of 296

curvature is occurred in the distance of about 400 mm and 350 mm from mid-span of the 297
RH1 and RH2 beams which are very close to the point of two concentrated loads (the 298
distance between two concentrated loads in these beams are 700 mm). In the case of RC1 299
and RC2 beams, the maximum value of curvature is occurred in distance of about 250 300
mm and 300 mm from mid-span of the RC1 and RC2 beams. As it shown in Table 6, in 301
the case of reinforced concrete and reinforced HPFRCC beams, increasing in the 302
compressive strength concludes to an increase in pl and pθ values. Plastic hinge length 303
and plastic hinge rotation of RH2 beam are about 0.6 % and 1.8 % higher than its 304
corresponding values in RH1 beam. In RC1 beam, plastic hinge length and plastic hinge 305
rotation are about 3 % and 13 % more than RC2 respectively. It is obvious that these 306
parameters in reinforced HPFRCC beams are higher than corresponding values in 307
reinforced concrete beams. As it shown in Table 5, plastic hinge length and rotation of 308
RHPFRCC beams are about 1.065 and 1.77 times more than RC beams. But the yield 309
length in both beams is the same approximately. 310
This may be due to existence of reinforcing fibers, HPFRCC material maintains its unity 311
under sever loading (bridging mechanism and pull out of fibers) and subsequently steel 312
reinforcements suffer more strains and reach more close to the value of their plastic 313
strain. Moreover, the ultimate compressive strain of HPFRCC is more than normal 314
concrete. This phenomenon concludes to increase in ultimate curvature, plastic hinge 315
length and plastic hinge rotation of RHPFRCC beams capacity of HPFRCC beams 316
compared to RC beams. 317
318
319

Table 5. Analytical results for RH1, RH2, RC1 and RC2 beams 320
Model
name
yP
(kN)
y∆
(mm)
uP
(kN)
u∆
(mm)
610−×yφ
(rad/mm)
610−×uφ
(rad/mm) y
u
∆∆
=∆µ y
u
φφ
µφ =
RH1 236.43 10.36 259.5 59.61 26.2 87.4 5.75 3.34
RH2 238.6 10.4 261.49 60.55 26.6 89 5.82 3.35
RC1 217.26 10.17 236.46 31.84 18.8 59 3.13 3.14
RC2 221.25 9.98 2234.12 30.73 18.8 54.5 3.08 2.9
321
Table 6. Plastic hinge characteristics of RH1, RH2, RC1 and RC2 beams 322
Model
name
yl
(mm)
pl
(mm)
pθ
(rad) 2)( RCp
p
ll
2)( RCp
p
θ
θ
RH1 550 290 0.0223 1.062 1.756
RH2 550 292 0.0227 1.069 1.787
RC1 550 281 0.0143 1.029 1.126
RC2 550 273 0.0127 1 1
323

0
50
100
150
200
250
300
0 10 20 30 40 50 60 70Deflection (mm)
P, L
oad
(kN
)
RH1RH2
324
Fig. 13. Load-deflection curves of RH1 and RH2 beams 325
0
50
100
150
200
250
0 5 10 15 20 25 30 35Deflection (mm)
P, L
oad
(kN
)
RC1RC2
326
Fig. 14. Load-deflection curves of RC1 and RC2 beams 327
328

329
Fig. 15. Distribution of curvature in RH1 and RH2 beams 330
331
Fig. 16. Distribution of curvature in RC1 and RC2 beams 332

e.1.2. Influence of tension reinforcement ratio 333
Load deflection curves of RH1, RH5, RH6, RH7 and RH8 beams are illustrated in Fig. 334
17. The analytical results including the yielding and ultimate loads, deflections and 335
curvatures and ductility ratios for these beams are also presented in Table 7. The mode of 336
failure is flexural for all of these beams. As it shown in Fig. 17 and Table 7, increasing in 337
the value of tension reinforcement ratio in these beams conclude to higher ultimate load 338
values. In the other hand, increasing in the value of tension reinforcement ratio of these 339
beams conclude to less ultimate deflection, curvature and ductility ratio. 340
Distribution of curvature in RH1, RH5, RH6, RH7 and RH8 are presented in Fig. 18. As 341
it shown in this figure, the maximum value of curvature is occurred in the distance of 342
about 400 mm from mid-span of the RH1 and RH2 beams which is very close to the point 343
of two concentrated loads (the distance between two concentrated loads in these beams 344
are 700 mm). Plastic hinge characteristics of these beams are also presented in Table 6. It 345
seems that increasing in the value of tension reinforcement ratio of these beams conclude 346
to less plastic hinge length and plastic hinge rotation. The plastic hinge length of RH5, 347
RH6, RH7 and RH8 are about 1.028, 1.01, 0.996 and 0.883 times to the value obtained 348
for RH1 beam. The plastic hinge rotation of RH5, RH6, RH7 and RH8 are about 1.386, 349
1.224, 0.919 and 0.619 times to the value obtained for RH1 beam. 350
As it shown in Table 8, plastic hinge length and rotation of RHPFRCC beams are about 351
1.05 and 1.8 times more than RC beams. But the yield length in both beams is the same 352
approximately. 353
354
355

Table 7. Analytical results for RH1, RH5, RH6, RH7 and RH8 beams 356
Model
name
yP
(kN)
y∆
(mm)
uP
(kN)
u∆
(mm)
610−×yφ
(rad/mm)
610−×uφ
(rad/mm) y
u
∆∆
=∆µ y
u
φφ
µφ =
RH1 236.43 10.36 259.5 59.61 26.2 87.4 5.75 3.34
RH5 176.72 7.71 228.62 69.21 19 114 8.98 6
RH6 195.29 8.84 239.61 63.21 21.2 104 7.15 4.91
RH7 277.26 11.15 310.66 39.72 28.8 79.8 3.56 2.77
RH8 333.64 16.14 349.48 33.51 32.8 63.5 2.03 1.94
357
Table 8. Plastic hinge characteristics of RH1, RH5, RH6, RH7 and RH8 beams 358
Model
name
yl
(mm)
pl
(mm)
pθ
(rad) 2)( RCp
p
ll
2)( RCp
p
θ
θ
RH1 550 290 0.0223 1.062 1.756
RH5 550 298 0.0309 1.091 2.433
RH6 550 293 0.0273 1.073 2.149
RH7 550 289 0.0205 1.058 1.614
RH8 450 256 0.0138 0.938 1.086
359

0
50
100
150
200
250
300
350
400
0 10 20 30 40 50 60 70 80Deflection (mm)
P, L
oad
(kN
)
RH5RH6RH1RH7RH8
360
Fig. 17. Load-deflection curves of RH1, RH5, RH6, RH7 and RH8 beams 361
362
Fig. 18. Distribution of curvature in RH1, RH5, RH6, RH7 and RH8 beams 363

e.2. Concentrated loading 364
e.2.1. Influence of tension reinforcement ratio 365
Load deflection curves of RH3, RH9, RH10, RH11 and RH12 beams are illustrated in 366
Fig. 19. The analytical results for these beams are presented in Table 9. Distribution of 367
curvature in RH3, RH9, RH10, RH11 and RH12 are presented in Fig. 20. Plastic hinge 368
characteristics of these beams are also presented in Table 10. 369
As it shown in these figures and tables, increasing in the value of tension reinforcement 370
ratio in these beams conclude to higher ultimate load values. In the other hand, increasing 371
in the value of tension reinforcement ratio of these beams conclude to less ultimate 372
deflection, curvature and ductility ratio. The maximum value of curvature is occurred in 373
the mid span of these beams, i.e., at the point of concentrated load. It seems that 374
increasing in the value of tension reinforcement ratio of these beams conclude to less 375
plastic hinge length and plastic hinge rotation. 376
In the case of reinforced HPFRCC beams under concentrated load, ultimate deflection, 377
curvature and ductility ratio are higher compared to corresponding beams subjected to 378
two-point loading. But, plastic hinge length and rotation is less than two-point loading 379
beams. The plastic hinge length of RH3, RH9, RH10, RH11 and RH12 are about 0.683, 380
0.741, 0.724, 0.638 and 0.586 times to the value obtained for RH1 beam. The plastic 381
hinge rotation of RH3, RH9, RH10, RH11 and RH12 are about 0.991, 1.13, 1.103, 0.87 382
and 0.605 times to the value obtained for RH1 beam. 383
As it shown in Table 8, plastic hinge length and rotation of RHPFRCC beams are about 384
0.72 and 1.65 times compared to RC beams under two-point loading. 385
386

Table 9. Analytical results for RH3, RH9, RH10, RH11 and RH12 beams 387
Model
name
yP
(kN)
y∆
(mm)
uP
(kN)
u∆
(mm)
610−×yφ
(rad/mm)
610−×uφ
(rad/mm) y
u
∆∆
=∆µ y
u
φφ
µφ =
RH3 152.03 6.01 219.16 62.71 25.3 119 10.43 4.7
RH9 110 5.21 180.31 76.8 19.3 125 14.74 6.48
RH10 124.66 5.82 185 70.23 21.4 125 12.07 5.84
RH11 190.98 7.36 237.31 48.84 29.4 114 6.64 3.88
RH12 231.94 8.98 262.78 44.38 30.5 89.2 4.94 2.92
388
Table 10. Plastic hinge characteristics of RH3, RH9, RH10, RH11 and RH12 beams 389
Model
name
yl
(mm)
pl
(mm)
pθ
(rad) 2)( RCp
p
ll
2)( RCp
p
θ
θ
RH3 350 198 0.0221 0.725 1.74
RH9 350 215 0.0252 0.788 1.984
RH10 350 210 0.0246 0.769 1.937
RH11 300 185 0.0194 0.678 1.528
RH12 250 170 0.0135 0.623 1.063
390

0
50
100
150
200
250
300
0 10 20 30 40 50 60 70 80 90Deflection (mm)
P, L
oad
(kN
)
RH9RH10RH3RH11RH12
391
Fig. 19. Load deflection curves of RH3, RH9, RH10, RH11 and RH12 beams 392
393
Fig. 20. Distribution of curvature in RH3, RH9, RH10, RH11 and RH12 beams 394
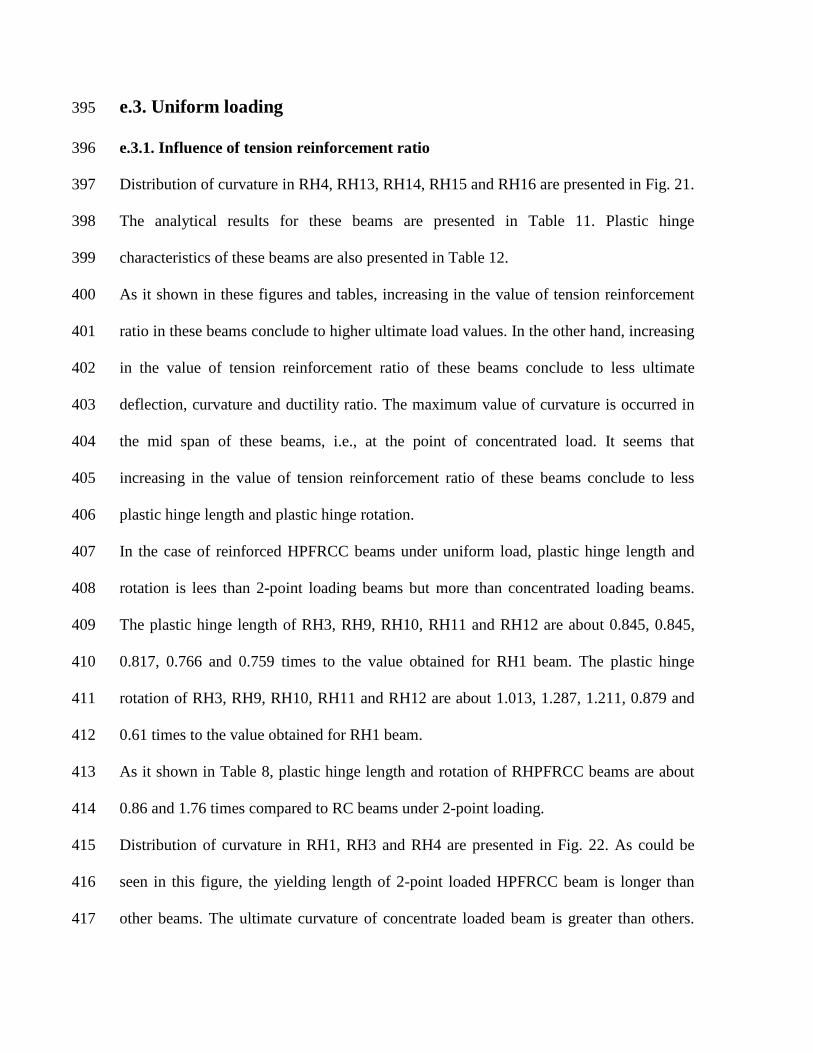
e.3. Uniform loading 395
e.3.1. Influence of tension reinforcement ratio 396
Distribution of curvature in RH4, RH13, RH14, RH15 and RH16 are presented in Fig. 21. 397
The analytical results for these beams are presented in Table 11. Plastic hinge 398
characteristics of these beams are also presented in Table 12. 399
As it shown in these figures and tables, increasing in the value of tension reinforcement 400
ratio in these beams conclude to higher ultimate load values. In the other hand, increasing 401
in the value of tension reinforcement ratio of these beams conclude to less ultimate 402
deflection, curvature and ductility ratio. The maximum value of curvature is occurred in 403
the mid span of these beams, i.e., at the point of concentrated load. It seems that 404
increasing in the value of tension reinforcement ratio of these beams conclude to less 405
plastic hinge length and plastic hinge rotation. 406
In the case of reinforced HPFRCC beams under uniform load, plastic hinge length and 407
rotation is lees than 2-point loading beams but more than concentrated loading beams. 408
The plastic hinge length of RH3, RH9, RH10, RH11 and RH12 are about 0.845, 0.845, 409
0.817, 0.766 and 0.759 times to the value obtained for RH1 beam. The plastic hinge 410
rotation of RH3, RH9, RH10, RH11 and RH12 are about 1.013, 1.287, 1.211, 0.879 and 411
0.61 times to the value obtained for RH1 beam. 412
As it shown in Table 8, plastic hinge length and rotation of RHPFRCC beams are about 413
0.86 and 1.76 times compared to RC beams under 2-point loading. 414
Distribution of curvature in RH1, RH3 and RH4 are presented in Fig. 22. As could be 415
seen in this figure, the yielding length of 2-point loaded HPFRCC beam is longer than 416
other beams. The ultimate curvature of concentrate loaded beam is greater than others. 417

The area under the curve of 2-point loaded HPFRCC beam is more than other beams and 418
concluded to more pθ and pl values. 419
420
Table 11. Analytical results for RH4, RH13, RH14, RH15 and RH16 beams 421
Model
name
yP
(kN)
y∆
(mm)
uP
(kN)
u∆
(mm)
610−×yφ
(rad/mm)
610−×uφ
(rad/mm) y
u
∆∆
=∆µ y
u
φφ
µφ =
RH4 341.76 13.76 405.79 60.82 28.6 102 4.42 3.57
RH13 258.8 8.34 343.91 70.01 19.3 125 8.39 6.48
RH14 277.24 10.33 357.85 65.22 21.6 124 6.31 5.74
RH15 423.65 19.8 445.26 41.14 29.5 96.4 2.08 3.27
RH16 509.9 23.1 524.97 34.59 32.9 71.2 1.5 2.16
422
Table 12. Plastic hinge characteristics of RH4, RH13, RH14, RH15 and RH16 beams 423
Model
name
yl
(mm)
pl
(mm)
pθ
(rad) 2)( RCp
p
ll
2)( RCp
p
θ
θ
RH4 500 245 0.0226 0.897 1.78
RH13 550 245 0.0287 0.897 2.26
RH14 500 237 0.027 0.868 2.126
RH15 350 222 0.0196 0.813 1.54
RH16 300 220 0.0136 0.806 1.071

424
Fig. 21. Distribution of curvature in RH4, RH13, RH14, RH15 and RH16 beams 425
426
427
Fig. 22. Distribution of curvature in RH1, RH3 and RH4 beams 428

The variation of pθ and pl for the different loading types in beams, could be explained 429
by the differences in the bending moment diagrams and yielding lengths ( yl ) for each 430
type of loading which has been shown in Fig. 22. This may be due to moment gradient in 431
neighborhood of the critical section. i.e., bending moment distribution has significant 432
influence on the distribution of curvature along the length of the beam. Variation of pθ 433
with respect to ρ in the different loading types is presented in Fig. 23. As could be seen 434
in this figure, plastic hinge rotation of 2-point loaded beam is greater than that in uniform 435
case and subsequently the pθ of uniform loaded beam is greater than the concentrate 436
loaded beam in the whole different ratios of tensile reinforcements. 437
438
Fig. 23. Variation of pθ with respect to ρ in different loading types 439
440
441

e.4. Empirical and proposed equations 442
The most widely used pl formulations for RC beams and columns available in literature 443
are presented in Table 13. Where, z = distance from critical section to point of 444
contraflexure, d = effective depth of section, bd = diameter of longitudinal reinforcement, 445
L = length of the member, h = overall depth of section, yf = yielding stress of 446
reinforcement and ′cf = concrete compressive strength. 447
As it shown in this table and previous results, the most part of these obtained empirical 448
values are close to RHPFRCC beams under concentrated loading which is changed from 449
170 to 215 mm. The values of pl for uniform and two-point loaded beams vary from 220 450
to 245 and 256 to 298 mm respectively. These analytical values are close to results which 451
have been presented by Sheikh and Khoury, Bayrak and Sheikh, Panagiotakos and Fardis. 452
453
454
455
456
457
458
459
460
461
462
463
Table 13. Plastic hinge length formulations 464

Researcher(s) Element Type Plastic hinge length
expression ( pl )
Present beam using
empirical equations
pl (mm)
Baker (1956) RC beams and
columns
( ) ddzk ⋅⋅ 4
1 189.6
I.C.E (1962) RC beams and
columns
( ) ddzkkk ⋅⋅ 4
1
321 189
Sawyer (1964) zd 075.025.0 + 146.25
Corley (1966) RC beams d
zd +5.0 199
Mattock (1967) RC beams zd 05.05.0 + 187.5
Park et al (1982) RC columns h42.0 126
Mander (1983) RC columns Ldb 06.032.0 + 139.28
Priestley and Park
(1987)
RC columns zdb 08.088.0 + 98.08
Sakai and Sheikh
(1989)
RC beams and
columns
hh 7.0~35.0 105 ~210
Tanaka and Park
(1990)
RC columns hh 75.0~4.0 120~225
Paulay and
Priestley (1992)
RC beams and
columns
zfd yb 08.0022.0 + 224.8
Sheikh and
Khoury (1993)
RC columns hh 15.1~95.0 285~345

Watson and Park
(1994)
RC columns h56.0 168
Bayrak and Sheikh
(1997)
RC columns h1 300
Panagiotakos and
Fardis (2001)
RC beams and
columns
zfd yb 18.0021.0 + 323.4
Berry et al (2008) RC columns ′
+
c
by
f
dfL 1.005.0
156.3
465
Naaman et al (Naaman et al 1996), presented a simple formulation for calculating yl in 466
reinforced HPFRCC beams which is presented in Eq. (6). 467
468
dVl fy ⋅+= )13.006.1( ρ 469
Eq. (6) 470
471
Where, ρ is the tensile reinforcement ratio in percent, fV is the volume fraction fibers in 472
percent and d is the effective depth of beam. For the present study yl is equal to 364.82 473
mm which is close to obtained values in Table 10. 474
The relation among three different types of loading discussed in this paper can be defined 475
as: 476
( )( )
( ).
.int
intConcP
poTwoPpoTwou θ
θα
−
− = 477

( )( )
( ).
.
ConcP
UniPUniu θ
θα = 478
Eq. (7) 479
Where, uα is the loading type factor. 480
481
482
Fig. 23. Relation among three different types of loading 483
484
The variation of uα with tension reinforcement ratio is presented in Fig. 24. Regression 485
analysis of the results can be expressed as: 486
( ) )1.81(2.1int ρα −=− poTwou 487
( ) ( )ρα 7.6115.1 −=Uniu 488
Eq. (8) 489

The analytical values of the plastic hinge rotation and the estimated values using equation 490
8 are compared to each other in Table 14. 491
492
Table 14. Analytical and estimated values for pθ 493
Name of model uα ( )AnalyticalPθ
(rad)
( )EstimatedPθ
(rad)
( )
( )AnalyticalP
EstimatedP
θ
θ
RH1 1.091 0.0223 0.0241 1.08
RH5 1.142 0.0309 0.0288 0.93
RH6 1.128 0.0273 0.0278 1.02
RH7 1.057 0.0205 0.0205 1
RH8 0.986 0.0138 0.0133 0.96
RH4 1.064 0.0226 0.0235 1.04
RH13 1.104 0.0287 0.0278 0.97
RH14 1.093 0.027 0.0269 0.99
RH15 1.037 0.0197 0.0201 1.02
RH16 0.98 0.0136 0.0132 0.97
494
The maximum difference among analytical and estimated values is about 8 %. It can be 495
noted that in two-point loaded beam, the distance between two concentrated loads are 496
significant and has an influence on previous results(Harajli and Hijazi 1991). 497
498
499
500

f. Conclusions 501
Based on the analytical and experimental results, the following conclusions can be drawn: 502
1. The yield and ultimate loads increase with the tension reinforcement ratio ( ρ ) in 503
RHPFRCC beams, but the ultimate deflection, ultimate curvature and ductility ratio 504
decrease. 505
2. The value of plastic hinge length and plastic hinge rotation of RHPFRCC simply 506
supported beams are more 1.065 and 1.77 times more than similar RC beams. 507
3. The plastic hinge length and rotation increase as the loading type changed from 508
concentrated load to uniform load and two-point load. But in the case of two-point load, 509
the results are independent to the distance between two loads. 510
4. In the case of two-point loading, the plastic hinge length and rotation of RHPFRCC 511
beams are about 1.05 and 1.8 times more than RC beams. But the yield length in both 512
beams is the same approximately. Plastic hinge length and rotation of RHPFRCC 513
concentrate loaded beams are about 0.72 and 1.65 times compared to RC beams under 514
two-point loading. And in uniform loaded beams, these values are 0.86 and 1.76 515
respectively. 516
5. The yielding length of two-point loaded HPFRCC beam is longer than other beams. 517
The ultimate curvature of concentrate loaded beam is greater than others. The area under 518
the curve of two-point loaded HPFRCC beam is more than other beams and concluded to 519
more pθ and pl values. 520
6. Empirical equations for calculating pl could be used for determining the plastic hinge 521
length of RHPFRCC beams under concentrated loading. For other types of loading the 522

equations which have been presented by Sheikh and Khoury, Bayrak and Sheikh, 523
Panagiotakos and Fardis and Naaman et al can be used. 524
7. The analytical results indicate that the proposed equations for different loading types 525
and tension reinforcement ratios are adequate and the difference between analytical and 526
estimated values of Pθ is about 8 % in the maximum case. 527
528
References 529
Baker, A.L.L. (1956). "Ultimate load theory applied to design of reinforced and prestressed concrete 530
frames", Concrete Publications, London. 531
Bayrak, O. and Sheikh, S.A. (1997). "High strength concrete columns under simulated earthquake loading", 532
ACI Structural Journal, 94(6), 708-722. 533
Berry, M., Lehman, D.E., and Lowes, L.N. (2008). "Lumped plasticity models for performance simulation 534
of bridge columns", ACI Structural Journal, 105(3), 270-279. 535
Corley, W.G. (1966). "Rotational capacity of reinforced concrete beams", Journal of Structural Division, 536
ASCE, 92, 121-146. 537
Fischer, G. and Li, V.C. (2000). "Structural composites with ECC," Proceedings of the ASCCS-6, Ed. Y. 538
Xiao and S.A. Mahin, USC, pp. 1001-1008. 539
Fischer, G., Wang, S. and Li, V.C. (2003). "Design of engineered cementitious composites for processing 540
and workability requirements", Seventh International Symposium on Brittle Matrix Composites, pp. 29-36. 541
Warsaw, Poland. 542
Fukuyama, H., Matsuzaki, Y., Sato, Y. and Iso, M. (2000). "Structural performance of engineered 543
cementitious composite elements". 544
Ghobarah, A. and Aly, N.M. (1998). "Seismic reliability assessment of existing reinforced concrete 545
buildings", Journal of Earthquake engineering, 2(4), 569-592. 546
Han, T.S. and Feenstra, P.H. and Billington, S.L. (2003). "Simulation of highly ductile fiber-reinforced 547
cement-based composite components under cyclic loading", ACI Structural Journal, 100(6), 749-757. 548

Hung, C.C and El-Tawil, S. (2010). " Hybrid rotating/fixed-crack model for high performance fiber 549
reinforced cementitious composites” ACI Materials J., 568-576. 550
I.C.E. Research Committee. (1962). "Ultimate load design of concrete structures", 21, 399-442. 551
Kabele, P. and Horii, H. (1996). “Analytical model for fracture behaviors of pseudo strain-hardening 552
cementitious composites" Journal of Materials, Concrete Structures and Pavements, 30(532), 208-219. 553
Kheyroddin, A. (1996). "Nonlinear finite element analysis of flexure-dominant reinforced concrete 554
structures", PhD Thesis, McGill University, 290. 555
Kheyroddin, A. and Naderpour, H. (2007). "Plastic hinge rotation capacity of reinforced concrete beams", 556
International Journal of Civil Engineering, 5(1), 30-47. 557
Kong, H.J., Bike, S. and Li, V.C. (2003). "Development of a self-compacting engineered cementitious 558
composite employing electrosteric dispersion/stabilization", Journal of Cement and Concrete Composites 559
25(3), 301-309. 560
Harajili, H. and Hijazi, S. (1991). "Evaluation of the ultimate steel stress in partially prestressed concrete 561
members", PCI Journal, 62-82. 562
Help of ABAQUS. (2008). "Getting started with ABAQUS". 563
Lee, B.Y., Kim, J.K. and Kim Y.Y. (2010), “Prediction of ECC tensile stress-strain curves based on 564
modified fiber bridging relations considering fiber distribution characteristics”. Computers and Concrete, An 565
Int'l Journal, 7(5). 566
Lepech, M.D., Li, V.C., Robertson, R.E. and Keoleian, G.A. (2007). "Design of ductile engineered 567
cementitious composites for improved sustainability", ACI Materials Journal. 568
Li, V.C. and Wu, H.C. (1992), "Conditions for pseudo strain-hardening in fiber reinforced brittle matrix 569
composites", J. Applied Mechanics Review, 45(8), 390-398. 570
Li, V.C. (2007). "Engineered cementitious composites (ECC) – material, structural, and durability 571
performance", University of Michigan, Ann Arbor, MI 48109. 572
Mander, J.B. (1983). "Seismic design of bridge piers", PhD Thesis, University of Canterbury. 573
Mattock, A.H. (1967). "Discussion of rotational capacity hinging regions in reinforced concrete beams", 574
Journal of Structural Division, ASCE, 93, 519-522. 575
Na, C. and Kwak, H.G. (2011). “A numerical tension stiffening model for ultra high strength fiber reinforced 576
concrete beams”. Computers and Concrete, An Int'l Journal, 8(1). 577
Naaman, A.E. and Reinhardt, H.W. (1996). "Characterization of high performance fiber reinforced cement 578
composites", HPFRCC-2, 1-24. 579
Naaman, A.E., Paramasivam, P., Balazs, G., Bayasi, Z.M., Eibl, J., Erdelyi, L., Hassoun, N.M., Krstulovic, 580
N., Li, V.C. and Lohrmann, G. (1996). "Reinforced and prestressed concrete using HPFRCC materials", 581
HPFRCC-2, 314-320. 582
Panagiotakos, T.B. and Fardis, M.N. (2001). "Deformation of reinforced concrete members at yielding and 583
ultimate, haracterization of high performance fiber reinforced cement composites", ACI Structural Journal, 584
98(2), 135-148. 585
Park, R., Priestley, M.J.N. and Gill, W.D. (1982). "Ductility of square confined concrete columns", 586
Structural Journal, 108(ST4), 929-950. 587
Paulay, T. and Priestley, M.J.N. (1992). "Seismic design of reinforced concrete and masonry structures", 588
John Wiley & Sons. 589
Priestley, M.J.N. and Park, R. (1987). "Strength and ductility of concrete bridge columns under seismic 590
loading", ACI Structural Journal, 84(1), 61-76. 591
Ranzi, G. and Bradford, M.A. (2009). "Nonlinear analysis of composite beams with partial shear interaction 592
by means of the direct stiffness method", Steel and Composite Structures, 9(2). 593
Sakai, K. and Sheikh, S.A. (1989). "What do we know about confinement in reinforced concrete columns", 594
ACI Structural Journal, 86(2), 192-207. 595
Shaheen, E. and Shrive, N.G. (2008). "Cyclic loading and fracture mechanics of Ductal concrete", 596
International Journal of Fracture, 148(3), 251-260. 597
Shayanfar, M.A., Kheyroddin, A. and Mirza, M.S. (1996). "Element size effects in nonlinear analysis of 598
reinforced concrete members", Computers & Structures, London, U.K. 599
Sheikh, S.A. and Khoury, S.S. (1993). "Confined concrete columns with stubs", ACI Structural Journal, 600
90(4), 414-431. 601
Sirijaroonchai, K. (2009). "A macro-scale plasticity model for high performance fiber reinforced cement 602
composites", PhD Dissertation, Michigan University. 603

Suwannakarn, S.W. (2009). "Post-cracking characteristics of high performance fiber reinforced cementitious 604
composites", PhD Dissertation, Michigan University. 605
Tanaka, H. and Park, R. (1990). "Effect of lateral Confining reinforcement on the ductile behavior of 606
reinforced concrete columns", Research Report, University of Canter bury. 607
Wang, S. and Li, V.C. (2003). "Materials design of lightweight PVA-ECC". In Proc., HPFRCC, A.E. 608
Naaman and H.W. Reinhardt, eds., pp.379-390. 609
Wang, S. and Li, V.C. (2006). "High early strength engineered cementitious composites", ACI Materials 610
Journal, 103(2), 97-105. 611
Watson, S. and Park, R. (1994). "Simulated seismic load tests on reinforced concrete columns", Journal of 612
Structural Engineering, 120(6), 1825-1849. 613
614