platts methodology and perspectives on bunker …marketexchange.com/2014_platts/day...
TRANSCRIPT

© 2013 Platts, McGraw Hill Financial. All rights reserved.
Platts Methodology and Perspectives on Bunker Fuel Markets Platts 11th annual Bunker and Residual Fuel Oil Conference JW Marriott June 24, 2014
Market Overview
• Physical residual fuel oil market • Residual fuel oil swaps • US bunkers • Latin American bunkers
2
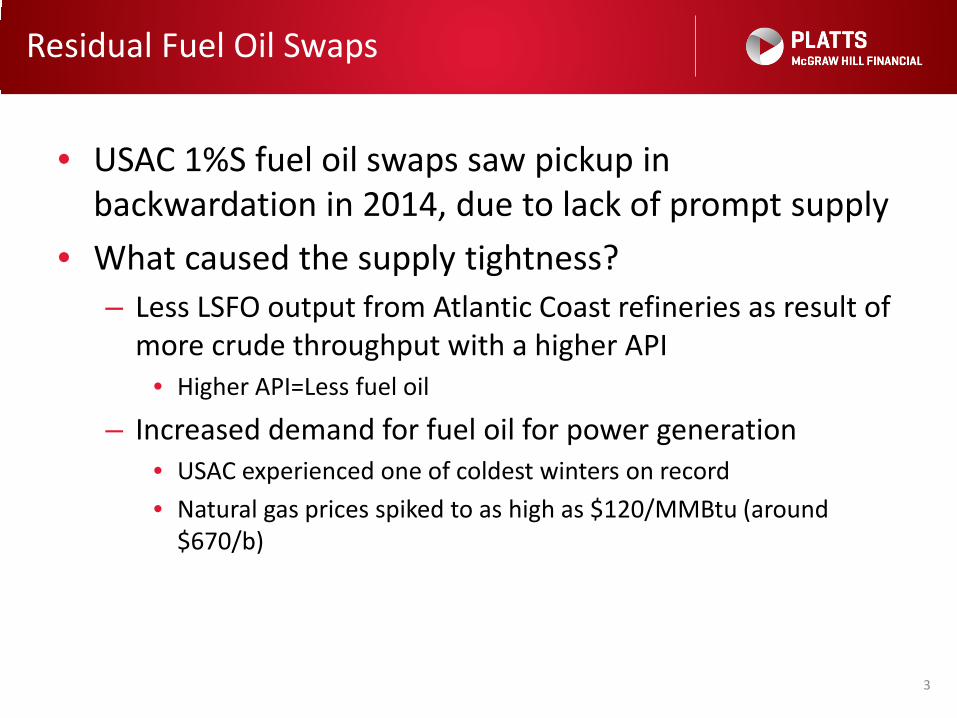
Residual Fuel Oil Swaps
• USAC 1%S fuel oil swaps saw pickup in backwardation in 2014, due to lack of prompt supply
• What caused the supply tightness? – Less LSFO output from Atlantic Coast refineries as result of
more crude throughput with a higher API • Higher API=Less fuel oil
– Increased demand for fuel oil for power generation • USAC experienced one of coldest winters on record • Natural gas prices spiked to as high as $120/MMBtu (around
$670/b)
3
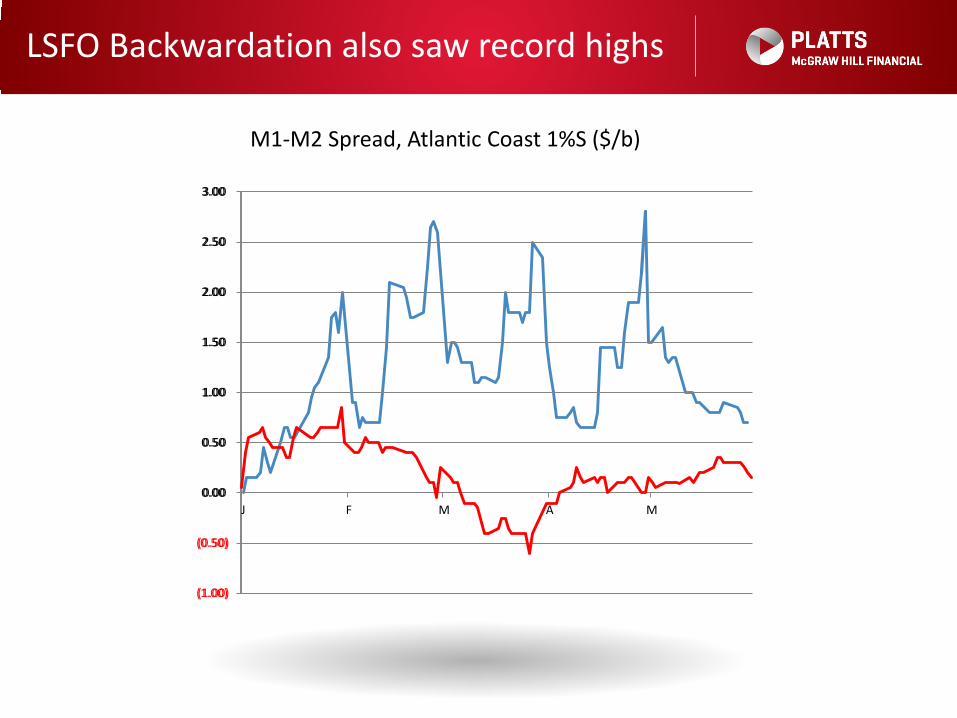
LSFO Backwardation also saw record highs
(1.00)
(0.50)
0.00
0.50
1.00
1.50
2.00
2.50
3.00
J F M A M
M1-M2 Spread, Atlantic Coast 1%S ($/b)
(1.00)
(0.50)
0.00
0.50
1.00
1.50
2.00
2.50
3.00
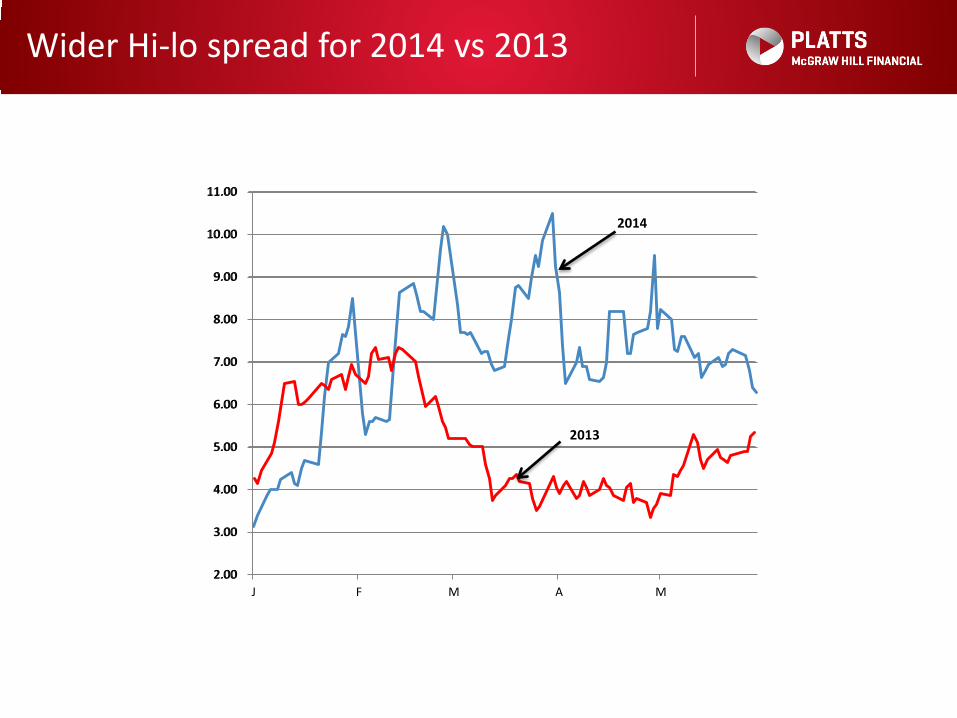
Wider Hi-lo spread for 2014 vs 2013
2.00
3.00
4.00
5.00
6.00
7.00
8.00
9.00
10.00
11.00
J F M A M2.00
3.00
4.00
5.00
6.00
7.00
8.00
9.00
10.00
11.00
2013
2014
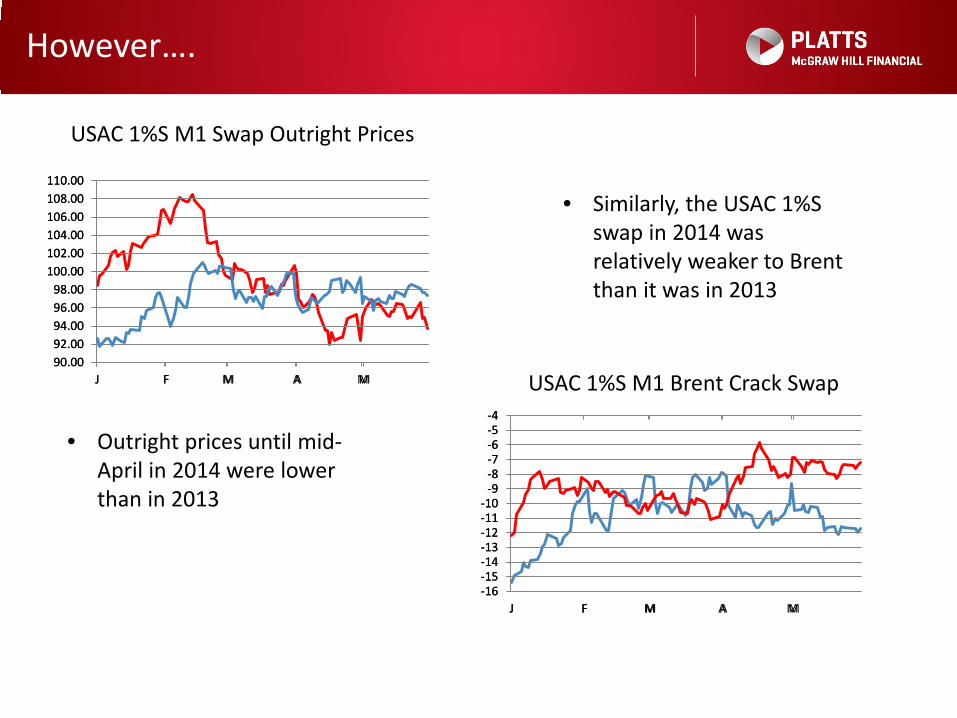
However….
90.0092.0094.0096.0098.00
100.00102.00104.00106.00108.00110.00
J F M A M90.0092.0094.0096.0098.00
100.00102.00104.00106.00108.00110.00
J F M A M
USAC 1%S M1 Swap Outright Prices
-16-15-14-13-12-11-10
-9-8-7-6-5-4
J F M A M-16-15-14-13-12-11-10
-9-8-7-6-5-4
J F M A M
USAC 1%S M1 Brent Crack Swap
• Outright prices until mid-April in 2014 were lower than in 2013
• Similarly, the USAC 1%S swap in 2014 was relatively weaker to Brent than it was in 2013
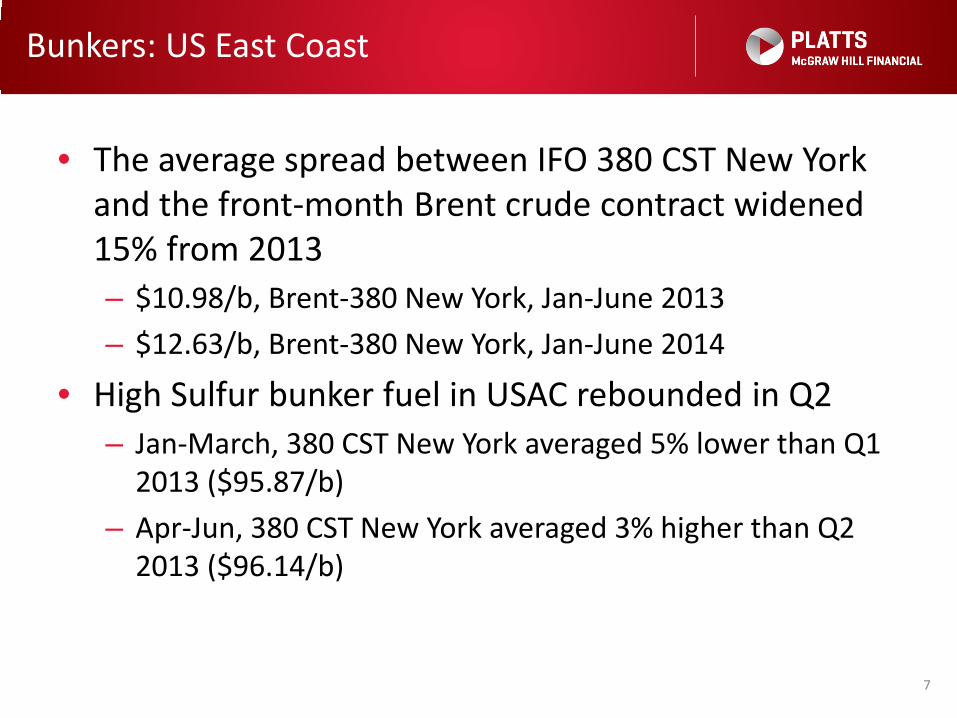
Bunkers: US East Coast
• The average spread between IFO 380 CST New York and the front-month Brent crude contract widened 15% from 2013 – $10.98/b, Brent-380 New York, Jan-June 2013 – $12.63/b, Brent-380 New York, Jan-June 2014
• High Sulfur bunker fuel in USAC rebounded in Q2 – Jan-March, 380 CST New York averaged 5% lower than Q1
2013 ($95.87/b) – Apr-Jun, 380 CST New York averaged 3% higher than Q2
2013 ($96.14/b)
7
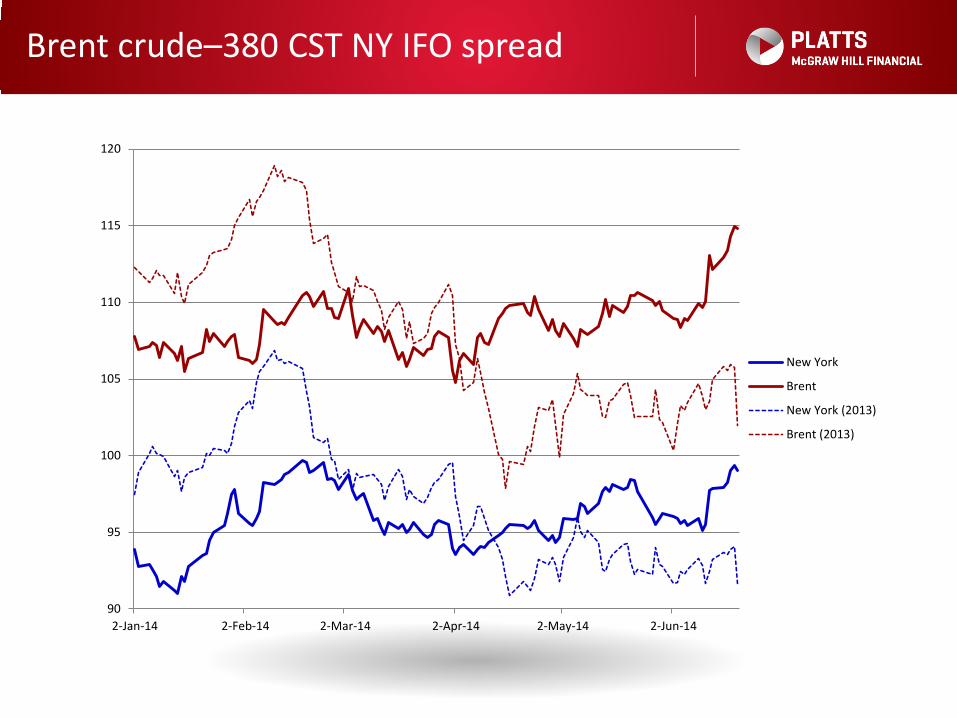
Brent crude–380 CST NY IFO spread
90
95
100
105
110
115
120
2-Jan-14 2-Feb-14 2-Mar-14 2-Apr-14 2-May-14 2-Jun-14
New York
Brent
New York (2013)
Brent (2013)
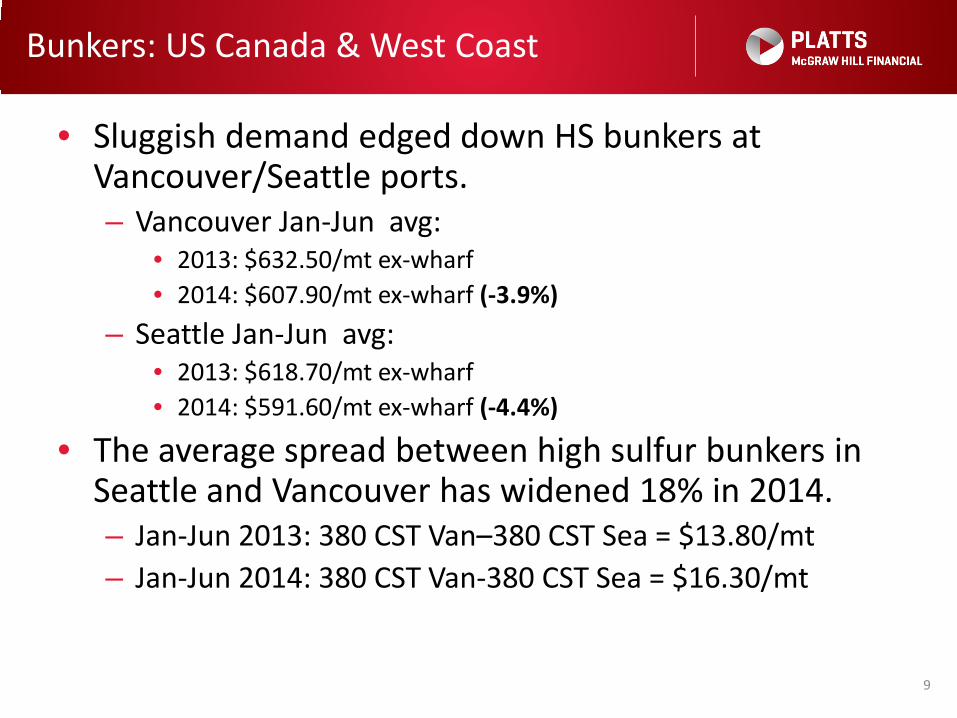
Bunkers: US Canada & West Coast
• Sluggish demand edged down HS bunkers at Vancouver/Seattle ports. – Vancouver Jan-Jun avg:
• 2013: $632.50/mt ex-wharf • 2014: $607.90/mt ex-wharf (-3.9%)
– Seattle Jan-Jun avg: • 2013: $618.70/mt ex-wharf • 2014: $591.60/mt ex-wharf (-4.4%)
• The average spread between high sulfur bunkers in Seattle and Vancouver has widened 18% in 2014. – Jan-Jun 2013: 380 CST Van–380 CST Sea = $13.80/mt – Jan-Jun 2014: 380 CST Van-380 CST Sea = $16.30/mt
9

IFO 380 CST Vancouver–Seattle spread
550
570
590
610
630
650
670
690
2-Jan-14 2-Feb-14 2-Mar-14 2-Apr-14 2-May-14 2-Jun-14
Seattle
Seattle 2013
Vancouver
Vancouver 2013

Bunkers: Panama vs Houston
• The spread between the IFO 380 CST Houston price
and IFO 380 CST Balboa will fluctuate due to fierce supplier competition.
• In Q1, IFO 380 CST Panama held a $24.60/mt average premium over IFO 380 CST Houston, due to limited supplies on the wake of loading delays.
• During May, the average premium fell to $10.90/mt, due to low seasonal demand and ample supplies.
• On June 16, IFO 380 CST Panama was at a $2/mt discount to Houston for the first time in the year.
11
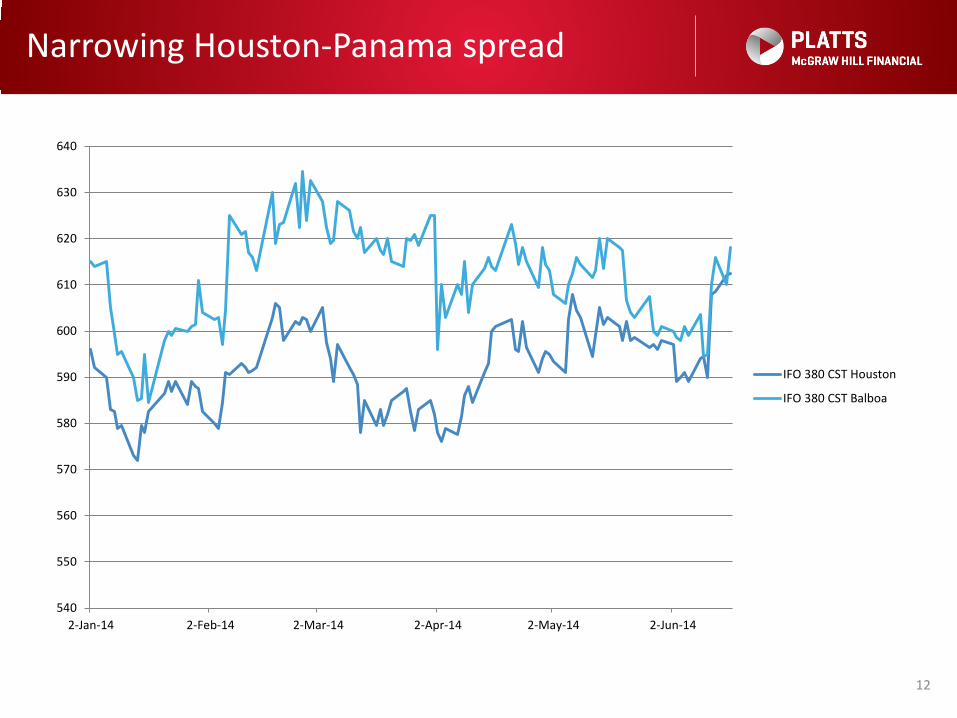
Narrowing Houston-Panama spread
12
540
550
560
570
580
590
600
610
620
630
640
2-Jan-14 2-Feb-14 2-Mar-14 2-Apr-14 2-May-14 2-Jun-14
IFO 380 CST Houston
IFO 380 CST Balboa
Platts methodology changes
- Intro to Platts assessments - Changes made in 2014 - Upcoming proposed changes
13
Editorial and market assessments are conducted with complete Independence & Impartiality
Platts – An introduction
Enabling the markets to perform with greater Transparency & Efficiency
Since
Platts – An introduction
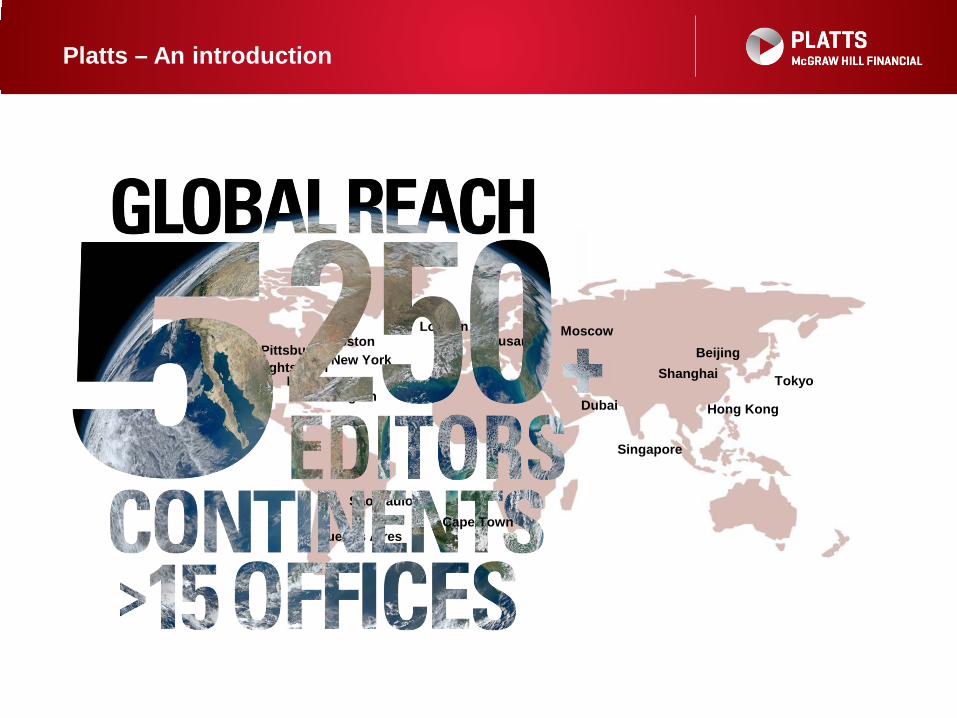
New York Denver
Washington Houston
Buenos Aires
London Moscow
Dubai
Beijing
Tokyo Shanghai
Hong Kong
Singapore
Evergreen
Boston
Hightstown Pittsburgh
São Paulo
Lausanne
Platts – An introduction
Cape Town

Houston
ARA (Amsterdam Rotterdam Antwerp)
Singapore
Benchmark Price Assessments – Key spot markets

A robust
How data is analyzed to produce a final value
What is being assessed
How data is collected – Platts Price Discovery Process
Market on Close in Depth – Methodology
must define

What is being assessed
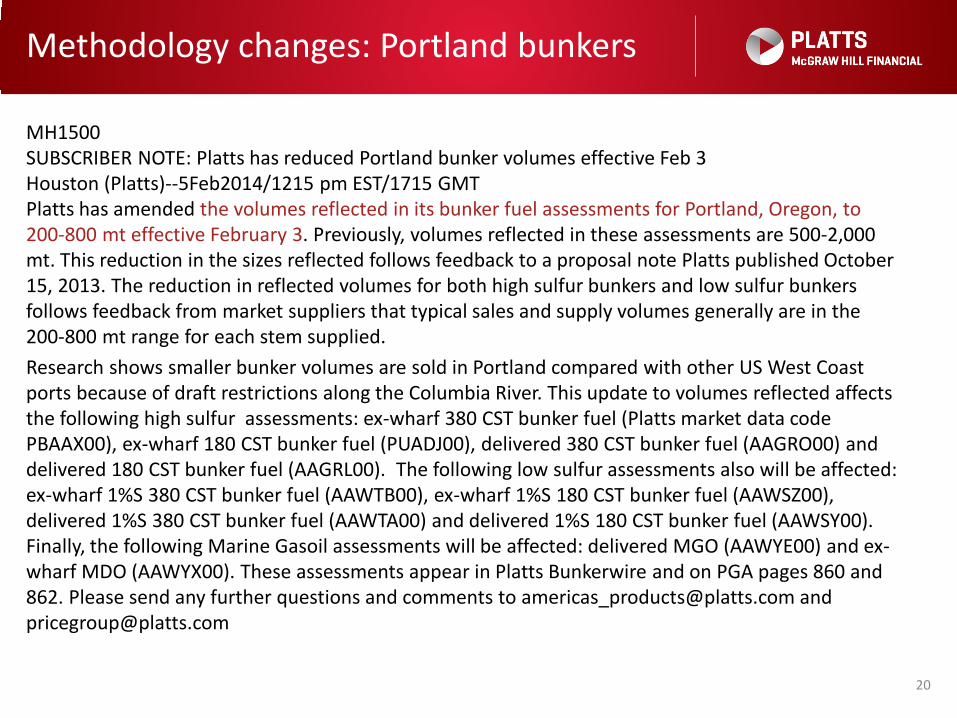
Methodology changes: Portland bunkers
MH1500 SUBSCRIBER NOTE: Platts has reduced Portland bunker volumes effective Feb 3 Houston (Platts)--5Feb2014/1215 pm EST/1715 GMT Platts has amended the volumes reflected in its bunker fuel assessments for Portland, Oregon, to 200-800 mt effective February 3. Previously, volumes reflected in these assessments are 500-2,000 mt. This reduction in the sizes reflected follows feedback to a proposal note Platts published October 15, 2013. The reduction in reflected volumes for both high sulfur bunkers and low sulfur bunkers follows feedback from market suppliers that typical sales and supply volumes generally are in the 200-800 mt range for each stem supplied. Research shows smaller bunker volumes are sold in Portland compared with other US West Coast ports because of draft restrictions along the Columbia River. This update to volumes reflected affects the following high sulfur assessments: ex-wharf 380 CST bunker fuel (Platts market data code PBAAX00), ex-wharf 180 CST bunker fuel (PUADJ00), delivered 380 CST bunker fuel (AAGRO00) and delivered 180 CST bunker fuel (AAGRL00). The following low sulfur assessments also will be affected: ex-wharf 1%S 380 CST bunker fuel (AAWTB00), ex-wharf 1%S 180 CST bunker fuel (AAWSZ00), delivered 1%S 380 CST bunker fuel (AAWTA00) and delivered 1%S 180 CST bunker fuel (AAWSY00). Finally, the following Marine Gasoil assessments will be affected: delivered MGO (AAWYE00) and ex-wharf MDO (AAWYX00). These assessments appear in Platts Bunkerwire and on PGA pages 860 and 862. Please send any further questions and comments to [email protected] and [email protected]
20
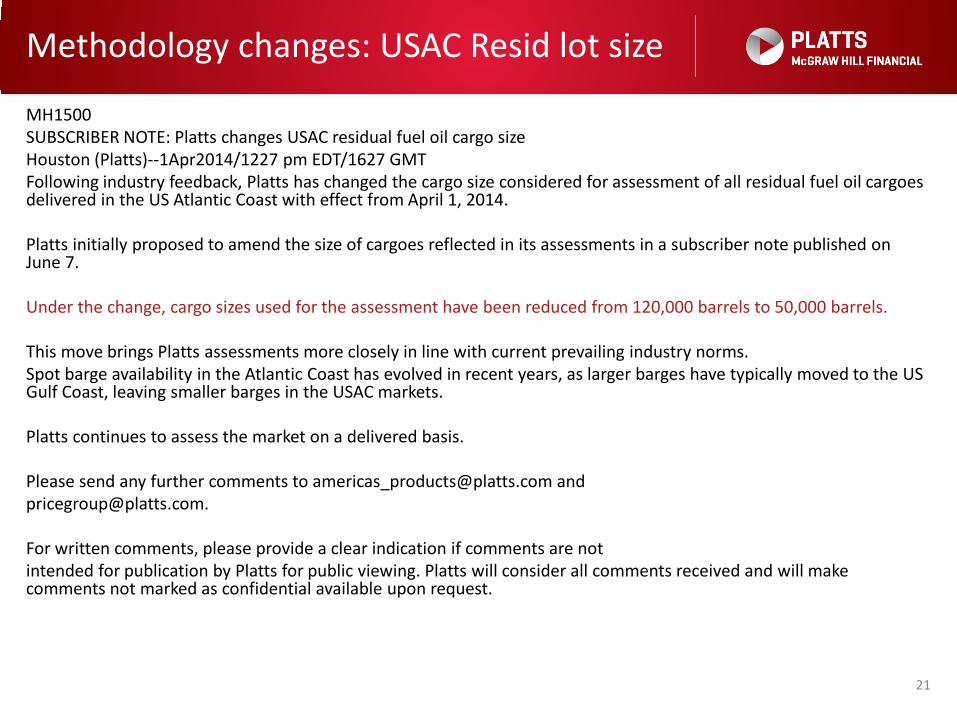
Methodology changes: USAC Resid lot size
MH1500 SUBSCRIBER NOTE: Platts changes USAC residual fuel oil cargo size Houston (Platts)--1Apr2014/1227 pm EDT/1627 GMT Following industry feedback, Platts has changed the cargo size considered for assessment of all residual fuel oil cargoes delivered in the US Atlantic Coast with effect from April 1, 2014. Platts initially proposed to amend the size of cargoes reflected in its assessments in a subscriber note published on June 7. Under the change, cargo sizes used for the assessment have been reduced from 120,000 barrels to 50,000 barrels. This move brings Platts assessments more closely in line with current prevailing industry norms. Spot barge availability in the Atlantic Coast has evolved in recent years, as larger barges have typically moved to the US Gulf Coast, leaving smaller barges in the USAC markets. Platts continues to assess the market on a delivered basis. Please send any further comments to [email protected] and [email protected]. For written comments, please provide a clear indication if comments are not intended for publication by Platts for public viewing. Platts will consider all comments received and will make comments not marked as confidential available upon request.
21

Upcoming changes: Tighter 2015 specs
• Ships operating up to 200 nautical miles off of U.S. shores need to comply with 0.1%S in bunker fuel by Jan 2015. All of Platts’ US and Canadian bunker assessments will be affected.
• Given the swing market in Panama, with US fuel ships calling there frequently instead of the USGC, Panama needs to be included although Latin America in general does not fall under ECA.
• Proposal to launch parallel 0.1% S assessments
22
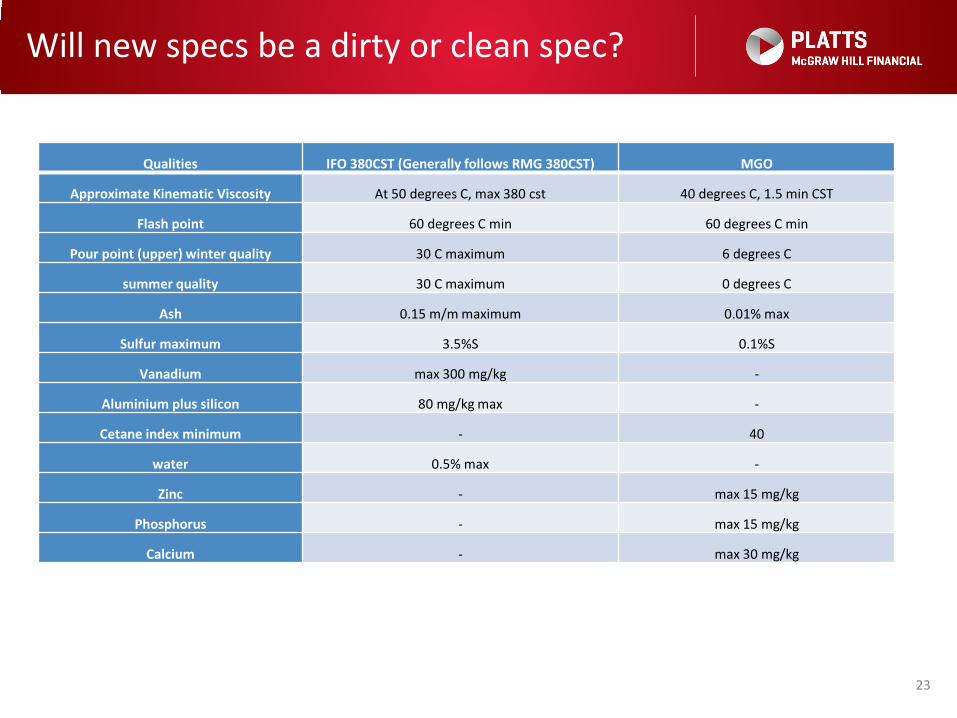
Will new specs be a dirty or clean spec?
Qualities IFO 380CST (Generally follows RMG 380CST) MGO
Approximate Kinematic Viscosity At 50 degrees C, max 380 cst 40 degrees C, 1.5 min CST
Flash point 60 degrees C min 60 degrees C min
Pour point (upper) winter quality 30 C maximum 6 degrees C
summer quality 30 C maximum 0 degrees C
Ash 0.15 m/m maximum 0.01% max
Sulfur maximum 3.5%S 0.1%S
Vanadium max 300 mg/kg -
Aluminium plus silicon 80 mg/kg max -
Cetane index minimum - 40
water 0.5% max -
Zinc - max 15 mg/kg
Phosphorus - max 15 mg/kg
Calcium - max 30 mg/kg
23
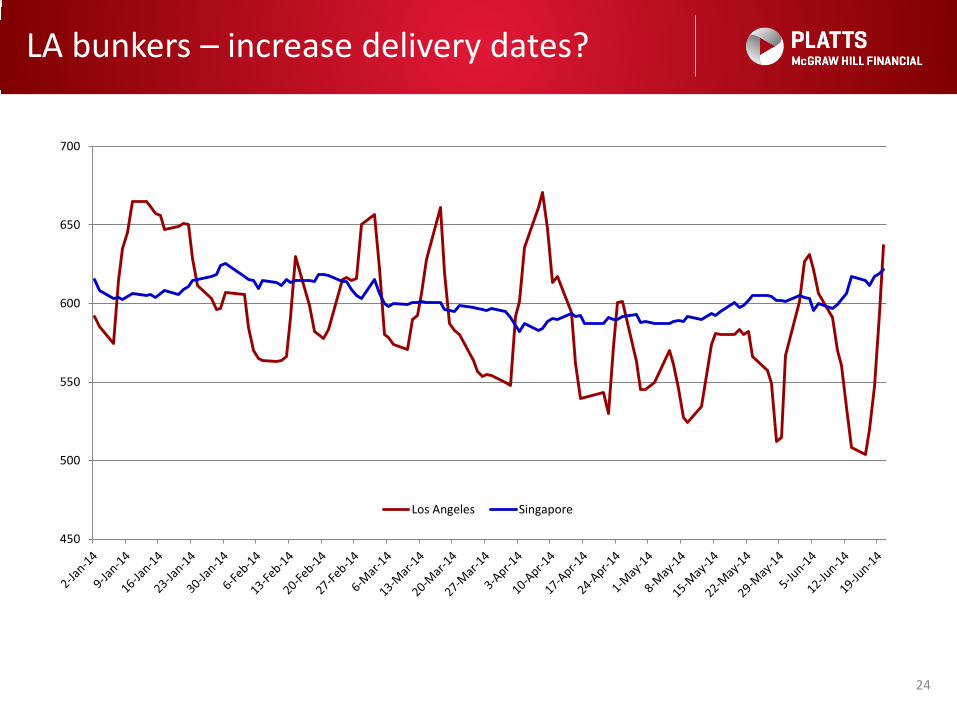
LA bunkers – increase delivery dates?
24
450
500
550
600
650
700
Los Angeles Singapore