plaxis bulletin · 4 plaxis bulletin l spring issue 2010 l consolidate. a change of shear strength...
TRANSCRIPT
Title
Study on influence of deep excavations on existing tunnels using PLAXIS-GiD
Numerical simulations and parametric study of SDCM and DCM piles under full scale axial and lateral loads as well as under embankment load
Editorial
Issue 27 / Spring 2010
Plaxis bulletin

Pag
e 14
Table of contents
Pag
e 4
Pag
e 6
Pag
e 10
Editorial03New developments04
Recent activities14
Numerical simulations and parametric study of SDCM and DCM piles under full scale axial and lateral loads as well as under embankment load
10
Study on influence of deepexcavations on existing tunnels using PLAXIS-GiD
06PLAXIS Expert Services update05
ColophonAny correspondence regarding the Plaxis bulletin can be sent by e-mail to:
or by regular mail to:
Plaxis bulletinc/o Erwin BeerninkPO Box 5722600 AN DelftThe Netherlands
The Plaxis bulletin is a publication of Plaxis bv and is distributed worldwide among Plaxis subscribers
Editorial board:Wout BroereRonald BrinkgreveErwin BeerninkArny Lengkeek
Design: Blemmodesign
For information about PLAXIS software contact your local agent or Plaxis main office:
Plaxis bvP.O. Box 5722600 AN DelftThe Netherlands
Tel: +31 (0)15 251 7720Fax: +31 (0)15 257 3107
» The Plaxis bulletin is the combined magazine of Plaxis bv and the Plaxis users
association (NL). The bulletin focuses on the use of the finite element method in geotechnical engineering practise and includes articles on the practical application of the PLAXIS programs, case studies and backgrounds on the models implemented in PLAXIS.
The bulletin offers a platform where users of PLAXIS can share ideas and experiences with each other. The editors welcome submission of papers for the Plaxis bulletin that fall in any of these categories.
The manuscript should preferably be submitted in an electronic format, formatted as plain text without formatting. It should include the title of the paper, the name(s) of the authors and contact information (preferably e-mail) for the corresponding author(s). The main body of the article should be divided into appropriate sections and, if necessary, subsections. If any references are used, they should be listed at the end of the article. The author should ensure that the article is written clearly for ease of reading.
In case figures are used in the text, it should be indicated where they should be placed approximately in the text. The figures themselves have to be supplied separately from the text in a vector based format (eps,ai). If photographs or ‘scanned’ figures are used the author should ensure that they have a resolution of at least 300 dpi or a minimum of 3 mega pixels. The use of colour in figures and photographs is encouraged, as the Plaxis bulletin is printed in full-colour.
www.plaxis.nl l Spring issue 2010 l Plaxis bulletin 3
Editorial
» 2010 will be the year of two completely new PLAXIS releases: PLAXIS 2D 2010 and
PLAXIS 3D 2010. The former one will succeed the popular PLAXIS 2D V9. With these releases we will change the naming from a version number into the year of release. After their actual release, we will formally celebrate the new releases together with our users during the European Plaxis users meeting on November 10-12, 2010, in Karlsruhe, Germany. We suggest that you mark these dates in your agenda.
In this 27th issue of the Plaxis bulletin we have again tried to compose a nice collection of interesting articles and useful information for you. In the New Developments column we explain different ways to deal with undrained behaviour. This difficult subject often causes confusion among users. By introducing three clear ways to model undrained behaviour we trust to create more clarity. These methods are available in the new PLAXIS 2D 2010 and PLAXIS 3D 2010 versions.
The first user’s article involves a study on the influence of deep excavations on tunnels. Different positions of the tunnel relative to the excavation were analysed and conclusions were drawn with respect to displacements and bending moments. In addition to 2D analyses, PLAXIS-GiD was used to perform 3D calculations.
The second user’s article involves the analysis of a full scale test on Deep Cement Mixing piles in Bangkok. Different types of DCM piles and different pile length were tested under axial and lateral load conditions, as well as under embankment loading. The situations were analysed with 3DFoundation. From the results conclusions were drawn with respect to the bearing capacity of DCM piles.
In addition to the contributions by PLAXIS users, there is again a joint presentation about a project where Plaxis has provided expert services to a client. More and more clients use this new service and find out that it is an efficient way to perform advanced numerical modelling in collaboration with Plaxis. We wish you an interesting reading experience and look forward to receive your comments on this 27th Plaxis bulletin.
The Editors
Editorial
4 Plaxis bulletin l Spring issue 2010 l www.plaxis.nl
consolidate. A change of shear strength must be defined in a separate data set, which is to be assigned to the soil as soon as the change should take effect.
In principle, these three ways to define undrained behaviour are independent of the soil model being used. However, some models only allow for one or two of these methods. Limitations will be indicated in the program and manual.
In the case that a soil layer, which is defined as Undrained, should temporarily behave drained, the option ‘Ignore undrained behaviour’ can be used. In the new PLAXIS versions, this option is available as a separate calculation type ‘Plastic drained’. When using this option, no high bulk stiffness for water is added. Please note that the option to force undrained materials to behave drained only works properly in the case of Undrained A. In the case of Undrained B the soil strength will continue to be defined by cu (or su ), which may not be appropriate in drained calculations. In the case of Undrained C both the stiffness and strength will continue to be defined as undrained properties, so in this case the options ‘Ignore undrained behaviour’ or ‘Plastic drained’ have no effect at all.
With the distinction between Undrained A, B and C we hope to have improved clarity about the various ways to model undrained behaviour in PLAXIS. All three ways have their advantages and disadvantages. It is of importance that PLAXIS users are aware of the consequences when choosing a particular method.
New developments
»PLAXIS can deal with undrained behaviour in an effective stress approach by adding
a high bulk stiffness for the pore water. When selecting ‘undrained’ as the type of soil behaviour (soil type) in a material data set, the soil stiffness is supposed to be entered as an effective parameter. For soil strength there is a choice between effective strength properties and undrained shear strength. On the other hand, there is the conventional total stress approach of undrained behaviour by using all parameters undrained. In the latter case, the soil type is set tot nonporous.The above often leads to confusion by PLAXIS users. Therefore we will introduce three different methods of undrained soil behaviour, named Undraind A, Undrained B and Undrained C. These methods will be available as from the new PLAXIS 2D and 3D versions 2010.
Undrained A uses the PLAXIS option of undrained behaviour in an effective stress approach by automatically adding a high bulk stiffness for the pore water. Both the stiffness and the strength properties are supposed to be specified as effective properties (i.e. and', ', ' 'co {E ). Distinction is made between pore pressure and effective stress. In this way excess pore pressures are generated. During consolidation the change of effective stress will lead to a change of undrained shear strength, which is the result of the input of effective strength parameters and the undrained stress path as predicted by the soil model. Please note that using this method a given shear strength profile may not be represented properly by the model. It is necessary to check the undrained shear strength, as predicted by the soil model, by
performing numerical tests for different loading conditions.
Undrained B also uses the PLAXIS option of undrained behaviour in an effective stress approach by automatically adding a high bulk stiffness for the pore water. In this case the stiffness is supposed to be specified as an effective property, but the strength is defined in terms of undrained shear strength (i.e. and', ', 's 0'u uo {E = % ). In this way a given undrained shear strength profile can be modelled accurately. Distinction is made between pore pressure and effective stress. Excess pore pressures are generated, but they may be incorrect due to limitations in the soil model. Therefore, it may not be useful to perform a consolidation analysis. If a consolidation analysis is considered anyway, it should be noted that the change of effective stress will NOT lead to a change of undrained shear strength, since the shear strength is a direct input property. A change of shear strength must be defined in a separate data set, which is to be assigned to the soil as soon as the change should take effect, e.g. after consolidation.
Undrained C uses the conventional total stress approach in which both stiffness and strength are supposed to be specified as undrained properties (i.e. 0.5 and 0, s,u u u u cco {E = ). In this case no bulk stiffness is automatically added and no pore pressures are generated. Output on effective stresses should be interpreted as total stresses. It does not make sense to perform a consolidation analysis, since there are no pore pressures to
In this bulletin I would like to discuss the modelling of undrained soil behaviour in PLAXIS. Soil behaves undrained if it
saturated and if the pore water cannot flow freely in the soil skeleton. As a consequence, the incompressibility of the pore
water prevents the soil to change volume. Changes in total mean stress will be carried by the pore water, resulting in excess
pore pressures, whereas changes in deviatoric stress will be carried by the soil skeleton, resulting in effective stress change.
Ronald Brinkgreve, Plaxis bv
www.plaxis.nl l Spring issue 2010 l Plaxis bulletin 5
»The Plaxis project concerned analysis for the lifting of a refinery tower in the Netherlands.
This lift was carried out as part of a major project executed on an EPCm basis by Jacobs, one of the world’s largest and most diverse providers of professional technical services.
The temporary lifting cranes for the tower can carry up to 300 tons and were on the project supported by piled foundation. Although pile foundation safely improves soil resistance and generates admissible soil displacement, it remains an expensive solution. In this context the possibilities to apply shallow foundations for future lifting of heavy equipment have been investigated.
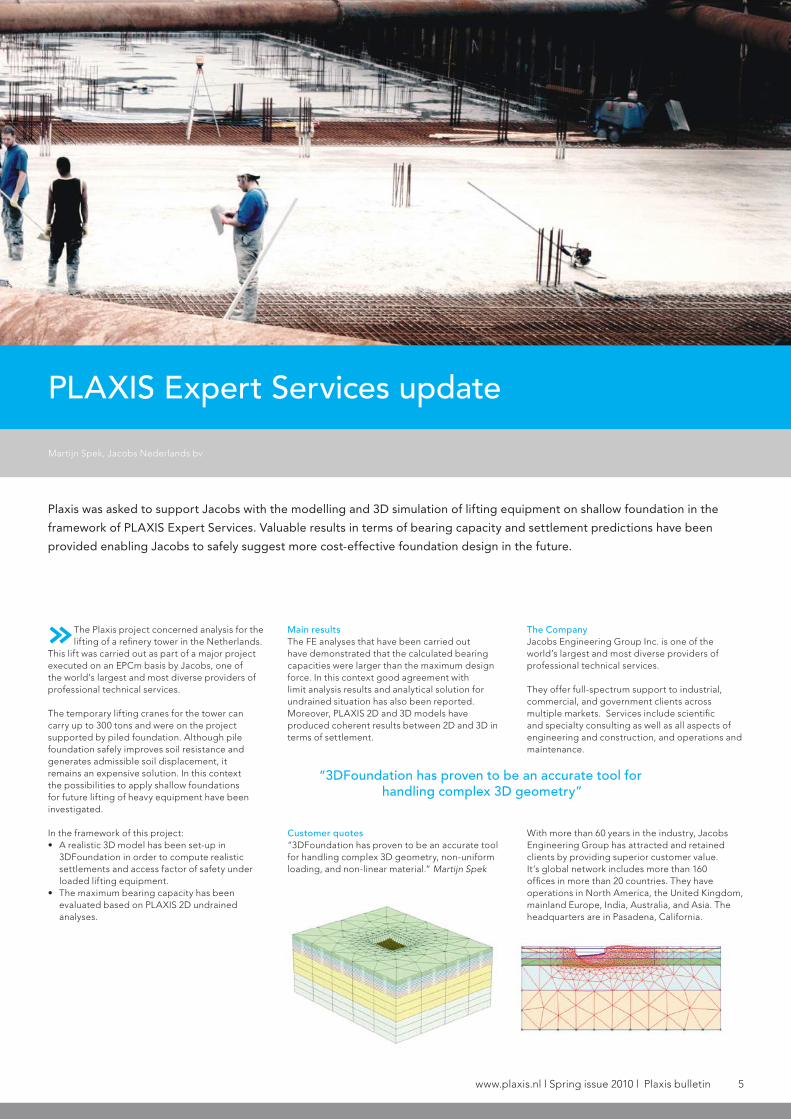
In the framework of this project:• A realistic 3D model has been set-up in
3DFoundation in order to compute realistic settlements and access factor of safety under loaded lifting equipment.
• The maximum bearing capacity has been evaluated based on PLAXIS 2D undrained analyses.
Main resultsThe FE analyses that have been carried out have demonstrated that the calculated bearing capacities were larger than the maximum design force. In this context good agreement with limit analysis results and analytical solution for undrained situation has also been reported. Moreover, PLAXIS 2D and 3D models have produced coherent results between 2D and 3D in terms of settlement.
Customer quotes“3DFoundation has proven to be an accurate tool for handling complex 3D geometry, non-uniform loading, and non-linear material.” Martijn Spek
The CompanyJacobs Engineering Group Inc. is one of the world’s largest and most diverse providers of professional technical services.
They offer full-spectrum support to industrial, commercial, and government clients across multiple markets. Services include scientific and specialty consulting as well as all aspects of engineering and construction, and operations and maintenance.
With more than 60 years in the industry, Jacobs Engineering Group has attracted and retained clients by providing superior customer value. It’s global network includes more than 160 offices in more than 20 countries. They have operations in North America, the United Kingdom, mainland Europe, India, Australia, and Asia. The headquarters are in Pasadena, California.
Plaxis was asked to support Jacobs with the modelling and 3D simulation of lifting equipment on shallow foundation in the
framework of PLAXIS Expert Services. Valuable results in terms of bearing capacity and settlement predictions have been
provided enabling Jacobs to safely suggest more cost-effective foundation design in the future.
Martijn Spek, Jacobs Nederlands bv
PLAXIS Expert Services update
“3DFoundation has proven to be an accurate tool for handling complex 3D geometry”
6 Plaxis bulletin l Spring issue 2010 l www.plaxis.nl
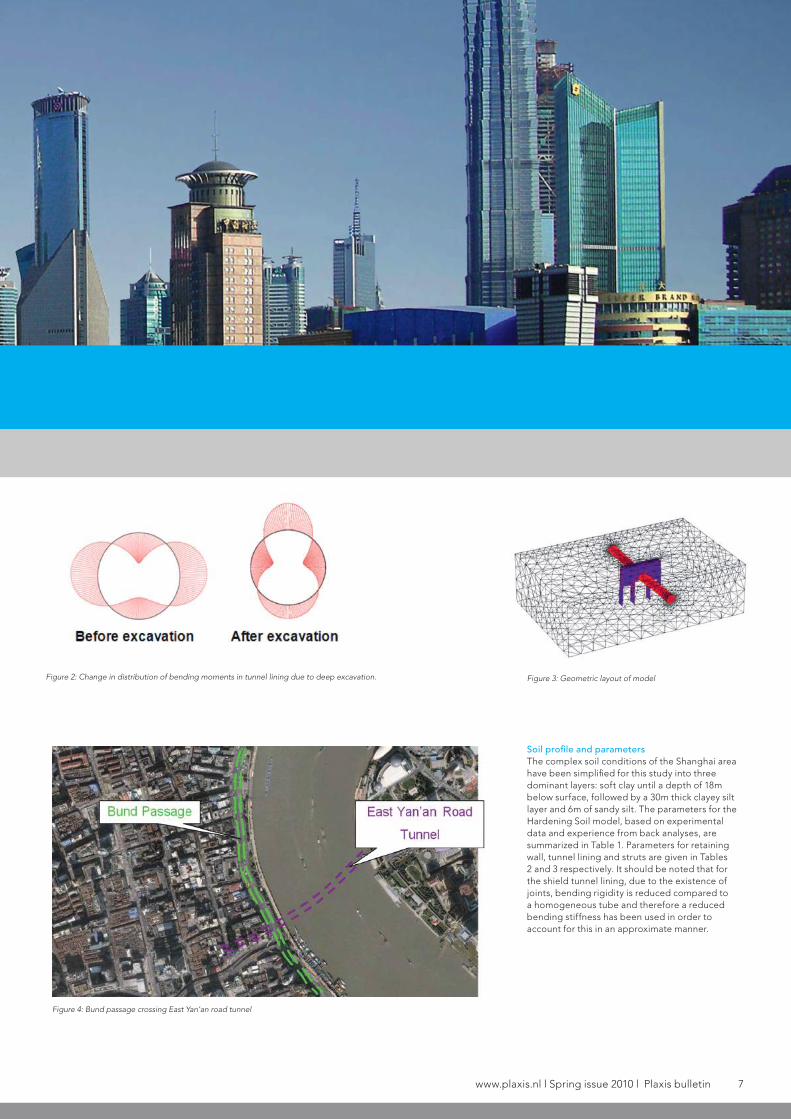
one of the investigated layouts, the corresponding finite element mesh consists of about 90 000 10-nodes tetrahedral elements. The dimensions are 230×150×64m. Lateral boundaries are fixed in horizontal direction and the bottom boundary in vertical and horizontal directions.
Figure 3 resembles the situation at the passage for the East Yan’an Road Tunnel located at the Shanghai Bund (Figure 4) with a tunnel diameter of 11m and therefore results will be presented for this case first. The influence of changing the distance between excavation level and tunnel is also presented in the following because it is the objective of this study to look at different scenarios and not only analyse the project at the Shanghai Bund. In addition, results from another configuration, namely where the deep excavation is located in some lateral distance to the tunnel are presented because these are possible scenarios for other projects in the Shanghai
area. It is noted that the diaphragm walls are very deep. The reason is that these walls are part of the countermeasures to cope with the uplift problem in long term conditions at this particular project. However, in a further series of analyses other configurations with shorter walls will be investigated. As the main purpose of the analysis is the assessment of the influence of the deep excavation on the tunnel, tunnel construction has not been modelled in detail but the tunnel was assumed to be wished-in-place. However, the excavation was modelled in steps. Dewatering and struts were applied before soil excavation in each excavation layer, which is common practice for deep excavations in the Shanghai area.
Study on influence of deep excavations on existing tunnels using PLAXIS-GiD
» In this contribution some results from a comprehensive study investigating different
geometric layouts are presented employing PLAXIS-GiD. As ground conditions in Shanghai are very challenging due to the presence of up to 60m thick layers of very soft soils advanced constitutive models have to be used to obtain reliable results. Based on these studies a better understanding of the interaction of deep excavations and tunnels has been obtained, which could serve as basis for developing appropriate counter measures to avoid damage on existing structures.
Description of analysis and material parametersGeometric layout and numerical modelIn order to get a first understanding of the problem a series of 2D plane strain analyses have been performed varying the relative position of excavation and tunnel. Figure 2 depicts two of these possible scenarios investigated in 2D.
As an example of this 2D study bending moments in the tunnel lining are shown in Figure 2 before and after construction of the deep excavation for the case illustrated in Figure 1. More details of these findings can be found in Huang et al. (2009).
Of course the plane strain assumption is not very realistic because firstly the deep excavation has a limited length and secondly the axis of the excavation is not necessarily parallel to the tunnel axis. It is obvious that for arbitrary positions of the deep excavation with respect to the tunnel present versions of 3DTunnel or 3D Foundation cannot handle the problem. Thus PLAXIS-GiD was used for the study presented here. Figure 3 shows
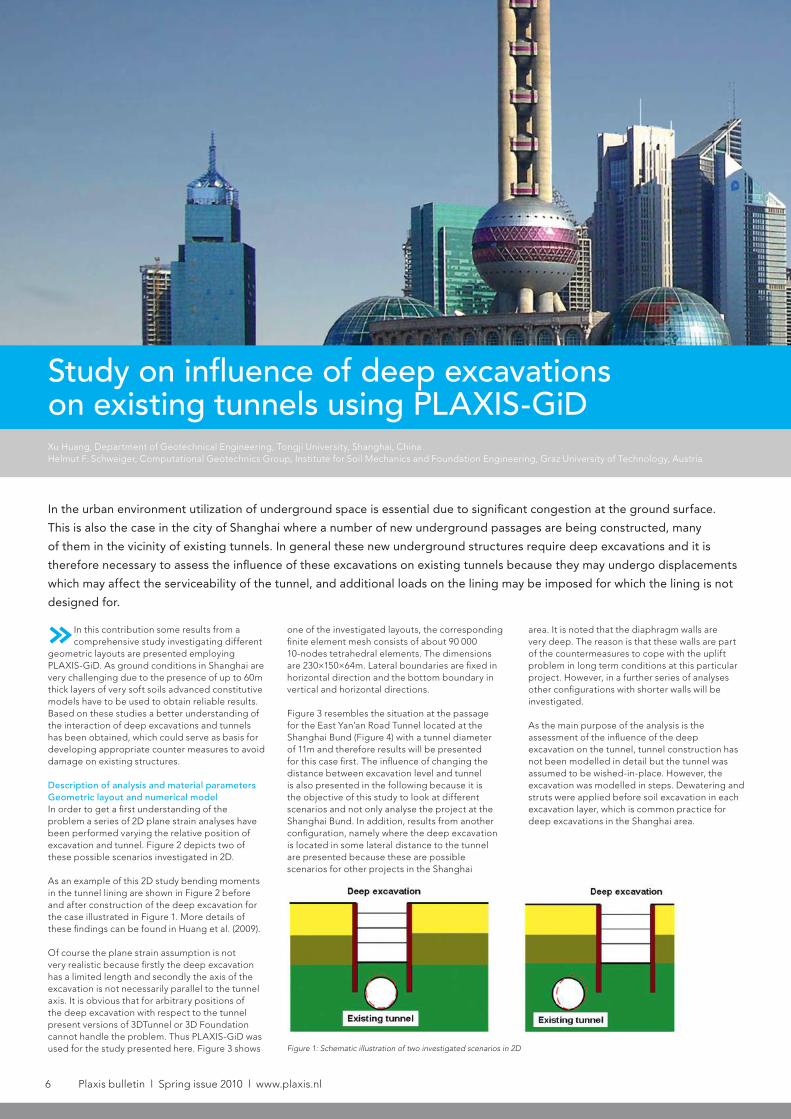
In the urban environment utilization of underground space is essential due to significant congestion at the ground surface.
This is also the case in the city of Shanghai where a number of new underground passages are being constructed, many
of them in the vicinity of existing tunnels. In general these new underground structures require deep excavations and it is
therefore necessary to assess the influence of these excavations on existing tunnels because they may undergo displacements
which may affect the serviceability of the tunnel, and additional loads on the lining may be imposed for which the lining is not
designed for.
Xu Huang, Department of Geotechnical Engineering, Tongji University, Shanghai, ChinaHelmut F. Schweiger, Computational Geotechnics Group, Institute for Soil Mechanics and Foundation Engineering, Graz University of Technology, Austria
Figure 1: Schematic illustration of two investigated scenarios in 2D
www.plaxis.nl l Spring issue 2010 l Plaxis bulletin 7
Soil profile and parametersThe complex soil conditions of the Shanghai area have been simplified for this study into three dominant layers: soft clay until a depth of 18m below surface, followed by a 30m thick clayey silt layer and 6m of sandy silt. The parameters for the Hardening Soil model, based on experimental data and experience from back analyses, are summarized in Table 1. Parameters for retaining wall, tunnel lining and struts are given in Tables 2 and 3 respectively. It should be noted that for the shield tunnel lining, due to the existence of joints, bending rigidity is reduced compared to a homogeneous tube and therefore a reduced bending stiffness has been used in order to account for this in an approximate manner.
Figure 3: Geometric layout of model
Figure 4: Bund passage crossing East Yan’an road tunnel
Figure 2: Change in distribution of bending moments in tunnel lining due to deep excavation.
8 Plaxis bulletin l Spring issue 2010 l www.plaxis.nl
Plaxis Practice: Study on influence of deep excavations on existing tunnels using PLAXIS-GID
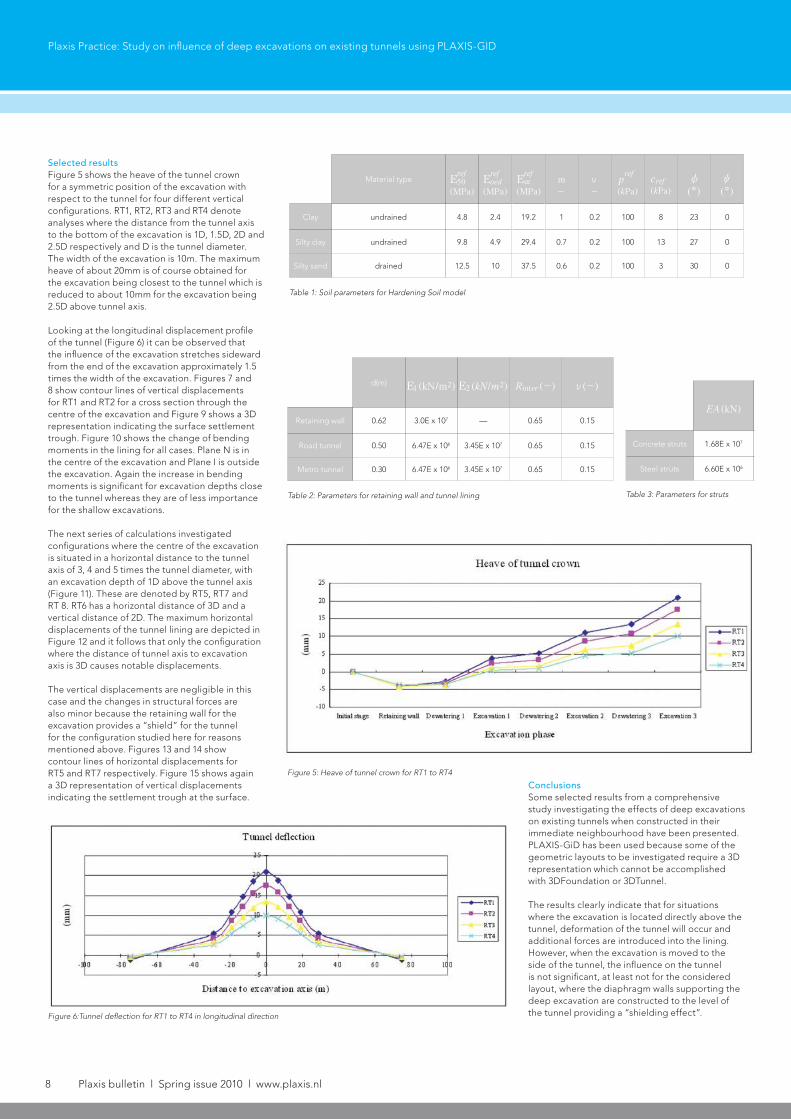
ConclusionsSome selected results from a comprehensive study investigating the effects of deep excavations on existing tunnels when constructed in their immediate neighbourhood have been presented. PLAXIS-GiD has been used because some of the geometric layouts to be investigated require a 3D representation which cannot be accomplished with 3DFoundation or 3DTunnel.
The results clearly indicate that for situations where the excavation is located directly above the tunnel, deformation of the tunnel will occur and additional forces are introduced into the lining. However, when the excavation is moved to the side of the tunnel, the influence on the tunnel is not significant, at least not for the considered layout, where the diaphragm walls supporting the deep excavation are constructed to the level of the tunnel providing a “shielding effect”.
Selected resultsFigure 5 shows the heave of the tunnel crown for a symmetric position of the excavation with respect to the tunnel for four different vertical configurations. RT1, RT2, RT3 and RT4 denote analyses where the distance from the tunnel axis to the bottom of the excavation is 1D, 1.5D, 2D and 2.5D respectively and D is the tunnel diameter. The width of the excavation is 10m. The maximum heave of about 20mm is of course obtained for the excavation being closest to the tunnel which is reduced to about 10mm for the excavation being 2.5D above tunnel axis.
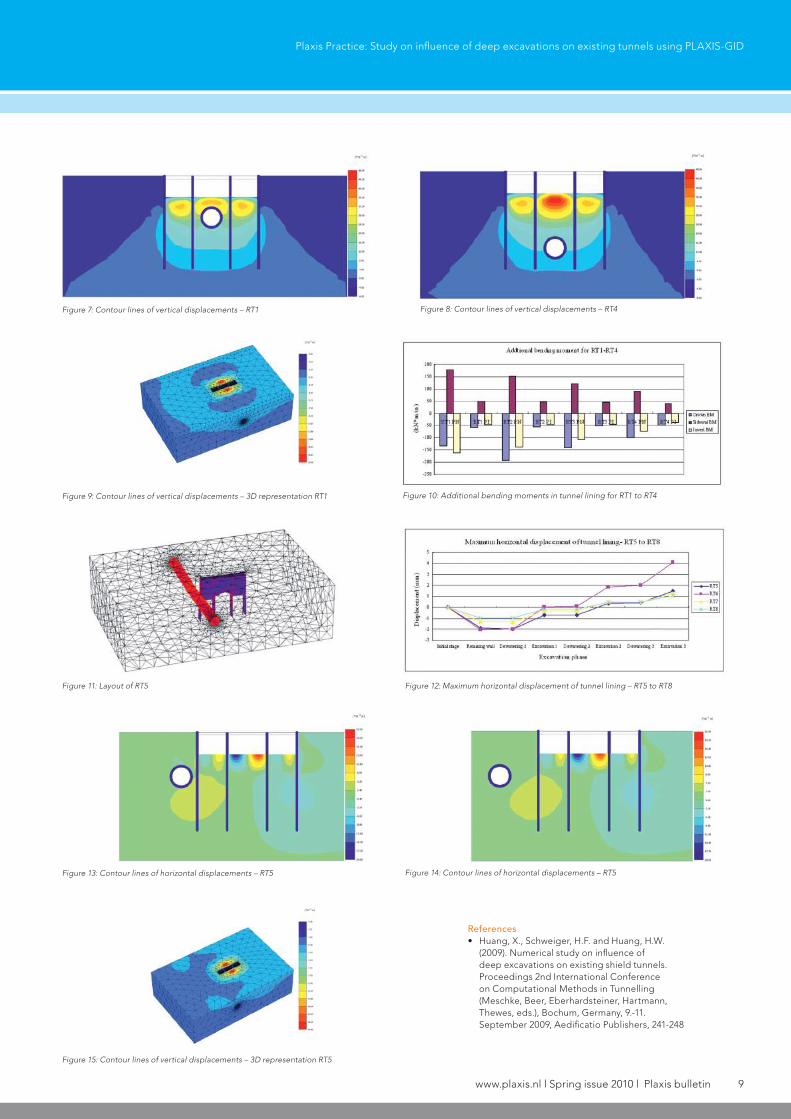
Looking at the longitudinal displacement profile of the tunnel (Figure 6) it can be observed that the influence of the excavation stretches sideward from the end of the excavation approximately 1.5 times the width of the excavation. Figures 7 and 8 show contour lines of vertical displacements for RT1 and RT2 for a cross section through the centre of the excavation and Figure 9 shows a 3D representation indicating the surface settlement trough. Figure 10 shows the change of bending moments in the lining for all cases. Plane N is in the centre of the excavation and Plane I is outside the excavation. Again the increase in bending moments is significant for excavation depths close to the tunnel whereas they are of less importance for the shallow excavations.
The next series of calculations investigated configurations where the centre of the excavation is situated in a horizontal distance to the tunnel axis of 3, 4 and 5 times the tunnel diameter, with an excavation depth of 1D above the tunnel axis (Figure 11). These are denoted by RT5, RT7 and RT 8. RT6 has a horizontal distance of 3D and a vertical distance of 2D. The maximum horizontal displacements of the tunnel lining are depicted in Figure 12 and it follows that only the configuration where the distance of tunnel axis to excavation axis is 3D causes notable displacements.
The vertical displacements are negligible in this case and the changes in structural forces are also minor because the retaining wall for the excavation provides a “shield” for the tunnel for the configuration studied here for reasons mentioned above. Figures 13 and 14 show contour lines of horizontal displacements for RT5 and RT7 respectively. Figure 15 shows again a 3D representation of vertical displacements indicating the settlement trough at the surface.
Load Case Material type
( )MPa
ref50E
( )MPaoedrefE
( )MPaurrefE
-
m
-
o
( )Pak
pref
( )Pak
cref( )cz
( )c}
Clay undrained 4.8 2.4 19.2 1 0.2 100 8 23 0
Silty clay undrained 9.8 4.9 29.4 0.7 0.2 100 13 27 0
Silty sand drained 12.5 10 37.5 0.6 0.2 100 3 30 0
Load Case d(m) (kN/m )1E 2 ( / )kN m2E 2 ( )Rinter - ( )o -
Retaining wall 0.62 3.0E x 107 — 0.65 0.15
Road tunnel 0.50 6.47E x 106 3.45E x 107 0.65 0.15
Metro tunnel 0.30 6.47E x 106 3.45E x 107 0.65 0.15
Load Case (kN)EA
Concrete struts 1.68E x 107
Steel struts 6.60E x 106
Table 1: Soil parameters for Hardening Soil model
Table 2: Parameters for retaining wall and tunnel lining Table 3: Parameters for struts
Figure 5: Heave of tunnel crown for RT1 to RT4
Figure 6:Tunnel deflection for RT1 to RT4 in longitudinal direction
www.plaxis.nl l Spring issue 2010 l Plaxis bulletin 9
Plaxis Practice: Study on influence of deep excavations on existing tunnels using PLAXIS-GID
References• Huang, X., Schweiger, H.F. and Huang, H.W.
(2009). Numerical study on influence of deep excavations on existing shield tunnels. Proceedings 2nd International Conference on Computational Methods in Tunnelling (Meschke, Beer, Eberhardsteiner, Hartmann, Thewes, eds.), Bochum, Germany, 9.-11. September 2009, Aedificatio Publishers, 241-248
Figure 7: Contour lines of vertical displacements – RT1
Figure 9: Contour lines of vertical displacements – 3D representation RT1
Figure 11: Layout of RT5
Figure 13: Contour lines of horizontal displacements – RT5
Figure 15: Contour lines of vertical displacements – 3D representation RT5
Figure 14: Contour lines of horizontal displacements – RT5
Figure 12: Maximum horizontal displacement of tunnel lining – RT5 to RT8
Figure 8: Contour lines of vertical displacements – RT4
Figure 10: Additional bending moments in tunnel lining for RT1 to RT4Table 3: Parameters for struts
10 Plaxis bulletin l Spring issue 2010 l www.plaxis.nl
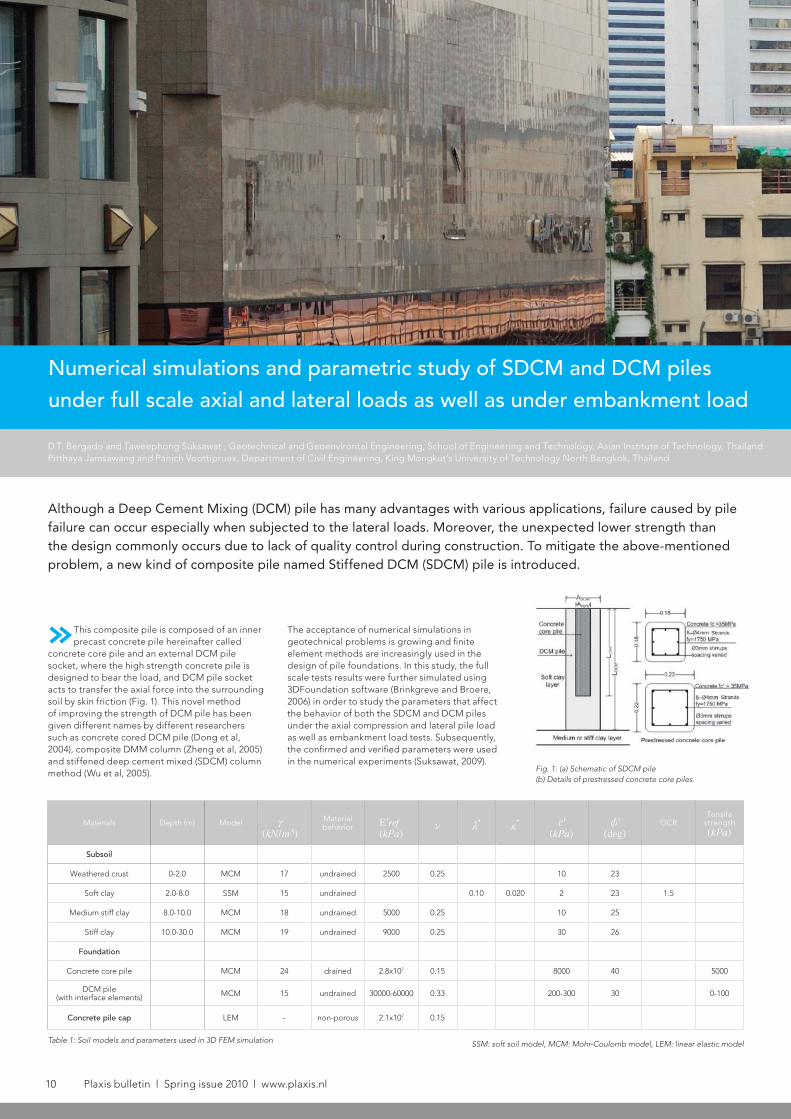
»This composite pile is composed of an inner precast concrete pile hereinafter called
concrete core pile and an external DCM pile socket, where the high strength concrete pile is designed to bear the load, and DCM pile socket acts to transfer the axial force into the surrounding soil by skin friction (Fig. 1). This novel method of improving the strength of DCM pile has been given different names by different researchers such as concrete cored DCM pile (Dong et al, 2004), composite DMM column (Zheng et al, 2005) and stiffened deep cement mixed (SDCM) column method (Wu et al, 2005).
The acceptance of numerical simulations in geotechnical problems is growing and finite element methods are increasingly used in the design of pile foundations. In this study, the full scale tests results were further simulated using 3DFoundation software (Brinkgreve and Broere, 2006) in order to study the parameters that affect the behavior of both the SDCM and DCM piles under the axial compression and lateral pile load as well as embankment load tests. Subsequently, the confirmed and verified parameters were used in the numerical experiments (Suksawat, 2009).
Although a Deep Cement Mixing (DCM) pile has many advantages with various applications, failure caused by pile failure can occur especially when subjected to the lateral loads. Moreover, the unexpected lower strength than the design commonly occurs due to lack of quality control during construction. To mitigate the above-mentioned problem, a new kind of composite pile named Stiffened DCM (SDCM) pile is introduced.
Numerical simulations and parametric study of SDCM and DCM piles under full scale axial and lateral loads as well as under embankment load
Table 1: Soil models and parameters used in 3D FEM simulation SSM: soft soil model, MCM: Mohr-Coulomb model, LEM: linear elastic model
D.T. Bergado and Taweephong Suksawat , Geotechnical and Geoenvirontal Engineering, School of Engineering and Technology, Asian Institute of Technology, Thailand Pitthaya Jamsawang and Panich Voottipruex, Department of Civil Engineering, King Mongkut’s University of Technology North Bangkok, Thailand
Materials Depth (m) Model( / )kN m3c Material
behavior( )kPa'refE o m
)l)
( )kPa'c
(deg)'z OCR
Tensilestrength( )kPa
Subsoil
Weathered crust 0-2.0 MCM 17 undrained 2500 0.25 10 23
Soft clay 2.0-8.0 SSM 15 undrained 0.10 0.020 2 23 1.5
Medium stiff clay 8.0-10.0 MCM 18 undrained 5000 0.25 10 25
Stiff clay 10.0-30.0 MCM 19 undrained 9000 0.25 30 26
Foundation
Concrete core pile MCM 24 drained 2.8x10⁷ 0.15 8000 40 5000
DCM pile(with interface elements) MCM 15 undrained 30000-60000 0.33 200-300 30 0-100
Concrete pile cap LEM - non-porous 2.1x10⁷ 0.15
Fig. 1: (a) Schematic of SDCM pile(b) Details of prestressed concrete core piles
www.plaxis.nl l Spring issue 2010 l Plaxis bulletin 11
Project site and subsoil profileThe full scale axial and lateral pile load tests were performed by Shinwuttiwong (2007) and Jamsawang (2009) and the full scale embankment load test was conducted by Jamswang et al (2009) within the campus of Asian Institute of Technology (AIT). The site is situated in the central plains of Thailand famous for its thick layer deposit of soft Bangkok clay. The uppermost 2.0 m thick layer is the weathered crust, which is underlain by 6.0 m thick soft to medium stiff clay layer. A stiff clay layer is found at the depth of 8.0 m from the surface. The undrained shear strength of the soft clay obtained the from field vane test was 20 kPa and the strength of the stiff clay layer below the depth of 8.0 m from the surface is more than 40 kPa (Bergado et al., 1990). Other parameters are shown in Table 1.
The strength of the concrete piles was found from the laboratory tests by compression test to be 35 MPa. Two lengths of core piles were used in the field test namely: 4.0 m and 6.0 m. However, for the numerical simulation the length of the concrete pile was varied from 1.00 m to 7.00 m with 1.0 m increase to evaluate the effect of the lengths of the core pile on the capacity of the SDCM pile. The Mohr-Coulomb model was recommended to simulate for mass concrete core pile instead of linear elastic model because its stiffness can be overestimated if the tensile strain is large enough to crack the concrete (Tand et al, 2008).
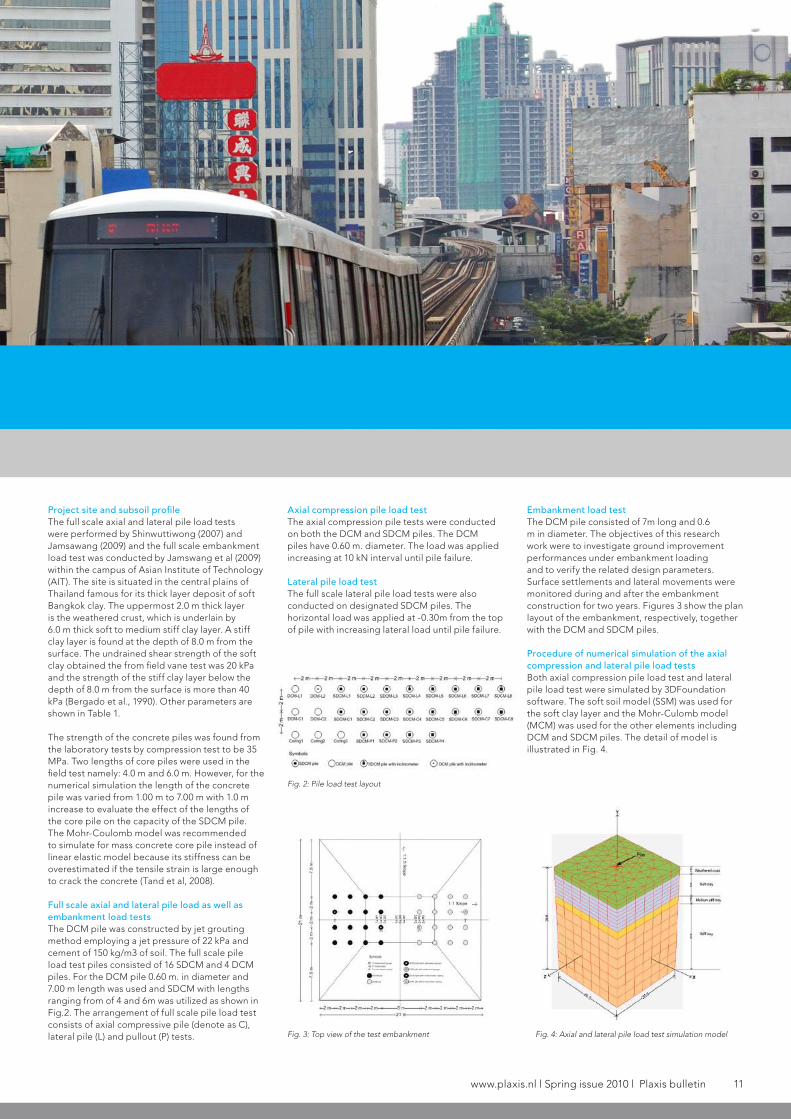
Full scale axial and lateral pile load as well as embankment load testsThe DCM pile was constructed by jet grouting method employing a jet pressure of 22 kPa and cement of 150 kg/m3 of soil. The full scale pile load test piles consisted of 16 SDCM and 4 DCM piles. For the DCM pile 0.60 m. in diameter and 7.00 m length was used and SDCM with lengths ranging from of 4 and 6m was utilized as shown in Fig.2. The arrangement of full scale pile load test consists of axial compressive pile (denote as C), lateral pile (L) and pullout (P) tests.
Axial compression pile load testThe axial compression pile tests were conducted on both the DCM and SDCM piles. The DCM piles have 0.60 m. diameter. The load was applied increasing at 10 kN interval until pile failure.
Lateral pile load testThe full scale lateral pile load tests were also conducted on designated SDCM piles. The horizontal load was applied at -0.30m from the top of pile with increasing lateral load until pile failure.
Embankment load testThe DCM pile consisted of 7m long and 0.6 m in diameter. The objectives of this research work were to investigate ground improvement performances under embankment loading and to verify the related design parameters. Surface settlements and lateral movements were monitored during and after the embankment construction for two years. Figures 3 show the plan layout of the embankment, respectively, together with the DCM and SDCM piles.
Procedure of numerical simulation of the axial compression and lateral pile load testsBoth axial compression pile load test and lateral pile load test were simulated by 3DFoundation software. The soft soil model (SSM) was used for the soft clay layer and the Mohr-Culomb model (MCM) was used for the other elements including DCM and SDCM piles. The detail of model is illustrated in Fig. 4.
Fig. 1: (a) Schematic of SDCM pile(b) Details of prestressed concrete core piles Fig. 2: Pile load test layout
Fig. 3: Top view of the test embankment Fig. 4: Axial and lateral pile load test simulation model
12 Plaxis bulletin l Spring issue 2010 l www.plaxis.nl
Plaxis Practice: Numerical simulations and parametric study of SDCM and DCM piles
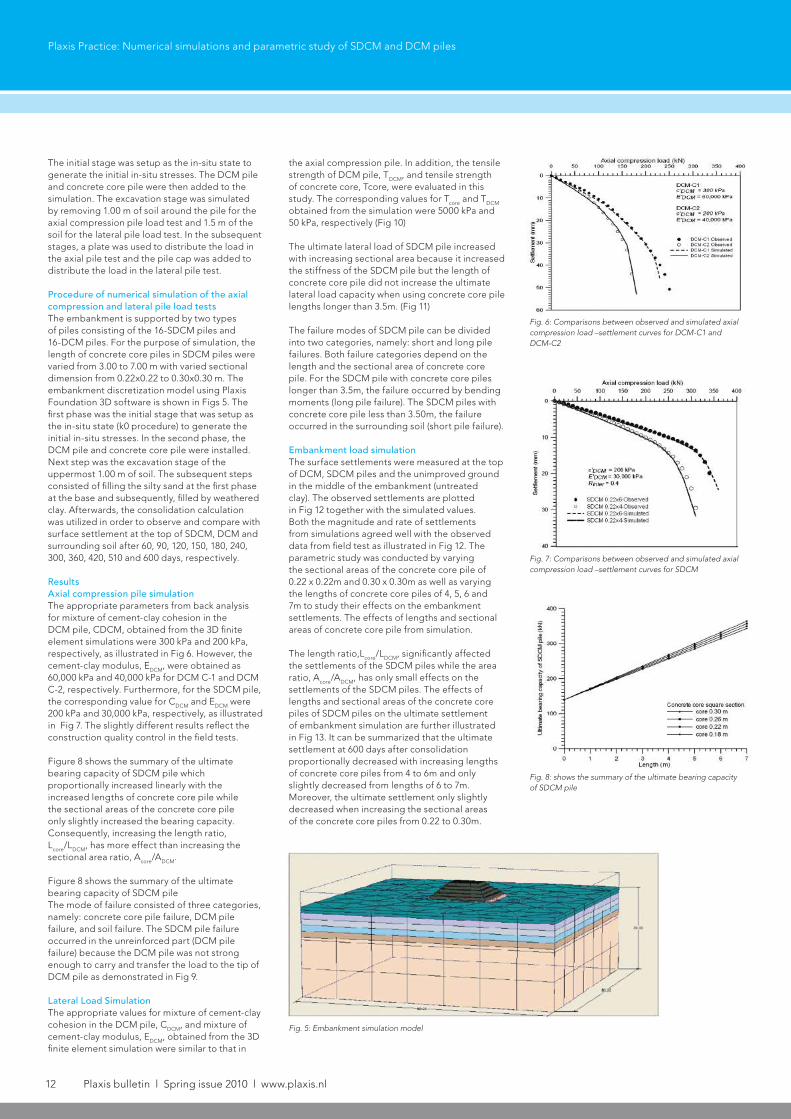
the axial compression pile. In addition, the tensile strength of DCM pile, TDCM, and tensile strength of concrete core, Tcore, were evaluated in this study. The corresponding values for Tcore and TDCM obtained from the simulation were 5000 kPa and 50 kPa, respectively (Fig 10)
The ultimate lateral load of SDCM pile increased with increasing sectional area because it increased the stiffness of the SDCM pile but the length of concrete core pile did not increase the ultimate lateral load capacity when using concrete core pile lengths longer than 3.5m. (Fig 11)
The failure modes of SDCM pile can be divided into two categories, namely: short and long pile failures. Both failure categories depend on the length and the sectional area of concrete core pile. For the SDCM pile with concrete core piles longer than 3.5m, the failure occurred by bending moments (long pile failure). The SDCM piles with concrete core pile less than 3.50m, the failure occurred in the surrounding soil (short pile failure).
Embankment load simulationThe surface settlements were measured at the top of DCM, SDCM piles and the unimproved ground in the middle of the embankment (untreated clay). The observed settlements are plotted in Fig 12 together with the simulated values. Both the magnitude and rate of settlements from simulations agreed well with the observed data from field test as illustrated in Fig 12. The parametric study was conducted by varying the sectional areas of the concrete core pile of 0.22 x 0.22m and 0.30 x 0.30m as well as varying the lengths of concrete core piles of 4, 5, 6 and 7m to study their effects on the embankment settlements. The effects of lengths and sectional areas of concrete core pile from simulation.
The length ratio,Lcore/LDCM, significantly affected the settlements of the SDCM piles while the area ratio, Acore/ADCM, has only small effects on the settlements of the SDCM piles. The effects of lengths and sectional areas of the concrete core piles of SDCM piles on the ultimate settlement of embankment simulation are further illustrated in Fig 13. It can be summarized that the ultimate settlement at 600 days after consolidation proportionally decreased with increasing lengths of concrete core piles from 4 to 6m and only slightly decreased from lengths of 6 to 7m. Moreover, the ultimate settlement only slightly decreased when increasing the sectional areas of the concrete core piles from 0.22 to 0.30m.
The initial stage was setup as the in-situ state to generate the initial in-situ stresses. The DCM pile and concrete core pile were then added to the simulation. The excavation stage was simulated by removing 1.00 m of soil around the pile for the axial compression pile load test and 1.5 m of the soil for the lateral pile load test. In the subsequent stages, a plate was used to distribute the load in the axial pile test and the pile cap was added to distribute the load in the lateral pile test.
Procedure of numerical simulation of the axial compression and lateral pile load testsThe embankment is supported by two types of piles consisting of the 16-SDCM piles and 16-DCM piles. For the purpose of simulation, the length of concrete core piles in SDCM piles were varied from 3.00 to 7.00 m with varied sectional dimension from 0.22x0.22 to 0.30x0.30 m. The embankment discretization model using Plaxis Foundation 3D software is shown in Figs 5. The first phase was the initial stage that was setup as the in-situ state (k0 procedure) to generate the initial in-situ stresses. In the second phase, the DCM pile and concrete core pile were installed. Next step was the excavation stage of the uppermost 1.00 m of soil. The subsequent steps consisted of filling the silty sand at the first phase at the base and subsequently, filled by weathered clay. Afterwards, the consolidation calculation was utilized in order to observe and compare with surface settlement at the top of SDCM, DCM and surrounding soil after 60, 90, 120, 150, 180, 240, 300, 360, 420, 510 and 600 days, respectively.
ResultsAxial compression pile simulationThe appropriate parameters from back analysis for mixture of cement-clay cohesion in the DCM pile, CDCM, obtained from the 3D finite element simulations were 300 kPa and 200 kPa, respectively, as illustrated in Fig 6. However, the cement-clay modulus, EDCM, were obtained as 60,000 kPa and 40,000 kPa for DCM C-1 and DCM C-2, respectively. Furthermore, for the SDCM pile, the corresponding value for CDCM and EDCM were 200 kPa and 30,000 kPa, respectively, as illustrated in Fig 7. The slightly different results reflect the construction quality control in the field tests.
Figure 8 shows the summary of the ultimate bearing capacity of SDCM pile which proportionally increased linearly with the increased lengths of concrete core pile while the sectional areas of the concrete core pile only slightly increased the bearing capacity. Consequently, increasing the length ratio, Lcore/LDCM, has more effect than increasing the sectional area ratio, Acore/ADCM.
Figure 8 shows the summary of the ultimate bearing capacity of SDCM pile The mode of failure consisted of three categories, namely: concrete core pile failure, DCM pile failure, and soil failure. The SDCM pile failure occurred in the unreinforced part (DCM pile failure) because the DCM pile was not strong enough to carry and transfer the load to the tip of DCM pile as demonstrated in Fig 9.
Lateral Load SimulationThe appropriate values for mixture of cement-clay cohesion in the DCM pile, CDCM, and mixture of cement-clay modulus, EDCM, obtained from the 3D finite element simulation were similar to that in
Fig. 6: Comparisons between observed and simulated axial compression load –settlement curves for DCM-C1 and DCM-C2
Fig. 7: Comparisons between observed and simulated axial compression load –settlement curves for SDCM
Fig. 8: shows the summary of the ultimate bearing capacity of SDCM pile
Fig. 5: Embankment simulation model

www.plaxis.nl l Spring issue 2010 l Plaxis bulletin 13
Plaxis Practice: Numerical simulations and parametric study of SDCM and DCM piles
ConclusionsIncreasing the length ratio,Lcore/LDCM, has more effect on the bearing capacity of SDCM pile than increasing the sectional area ratio, Acore/ADCM. For the DCM pile, the maximum load developed at the top 1m and rapidly decreased until the depth of 4m from the pile top and constant load of 10% of the ultimate load until the tip of DCM pile. Thus, the failure takes place at the top in the case of DCM pile. The SDCM pile failure occurred in the unreinforced part (DCM pile failure) because the DCM pile is not strong enough to transfer load to the tip of DCM pile.
The ultimate lateral load of SDCM pile increased with increasing sectional area because it increased the stiffness of the pile but the length of concrete core pile did not increase the ultimate lateral load capacity when using the lengths longer than 3.5m. For the SDCM pile with lengths longer than 3.5m, the failure occurred by bending moment (long pile failure) while the short pile failed by surrounding soil failure.The longer core pile can reduced the vertical displacement and increased the bearing capacity of SDCM pile. The length and cross-sectional area of concrete core pile of SDCM pile significantly affected the lateral movement of the embankment
Reference• Brinkgreve, R.B., and Broere, W. (2006).
3DFoundation Version 1.6 Manual. Balkema, A. A., Rotterdam, Brookfield, Netherland.
• Dong P., Qin R. and Chen Z. (2004). Bearing capacity and settlement of concrete-cored DCM pile in soft ground. Geotechnical and Geological Engineering, Vol. 22, No. 1, Kluwer Academic Publishers, The Netherlands
• Jamsawang, P. (2008), Full Scale Tests On Stiffened Deeep Cement Mixing (Sdcm) Pile Including 3d Finite Element Simulation, D. Eng. Diss No GE-08-01, Asian Institute of Technol-ogy, Bangkok, Thailand.
• Jamsawang,P., Bergado, D.T. and Voottipruex, P. (2009). “Laboratory and field behavior of stiffened deep cement mixing (SDCM) pile.” Ground Improvement Journal, (Accepted).
• Shinwuttiwong, W. (2007), Full Scale Behavior of SDCM Piles under Axial and Lateral Loading with Simulations, M. Eng. Thesis No GE-07-04, Asian Institute of Technology, Bangkok, Thailand.
• Suksawat, T. (2008), Numerical simulation of SDCM and DCM piles under axial and lateral loads and under embankment load: A paramet-ric study, M. Eng. Thesis No GE-08-09, Asian Institute of Technology, Bangkok,Thailand.
• Tand, K.E., and Vipulanandan, C. (2008). Comparison of computed vs. measured lateral load/deflection response of ACIP piles. Plaxis Bulletin, issue 23, pp: 10-13.
• Wu M., Zhao X. and Dou Y.M. (2005). Applica-tion of stiffened deep cement mixed column in ground improvement. Proceedings Internation-al Conference on Deep Mixing Best Practices and Recent Advances, Stockholm, Sweden.
• Zheng, G. and Gu, X.L. (2005). Development and practice of composite DMM column in China. Proceedings 16th International Conference on Soil Mechanics and Geotechnical Engineering. Vol. 3, pp.1295-1300, Osaka, Japan.
Fig. 9: Relative shear stresses of 0.22 x 0.22 m core piles at failure load from simulations
Fig. 11: Effect of lengths and sectional areas of concrete core piles on the ultimate lateral load of SDCM pile
Fig. 12: Comparison of observed and simulated surface settlements
Fig. 13: Effect of lengths and sectional areas concrete core pile on ultimate settlements of SDCM pile
Fig. 10: Comparisons between observed and simulated lateral piles load –settlement curves for SDCM

14 Plaxis bulletin l Spring issue 2010 l www.plaxis.nl
Recent activities
Product updates After a successful ‘cosmetic launch’ of PLAXIS 3D during the ISSMGE 2009 in Alexandria, Egypt from 5-9 October 2009, Plaxis started a tour around the globe to introduce this new program to our users and prospects. During the London Seminars in November 2009 and the GeoFlorida 2010 conference in February 2010 Plaxis representatives demonstrated the new PLAXIS 3D program to a significant number of consulting engineers, professors and students. Furthermore we could officially launch the new PLAXIS 3D at a special software demonstration seminar during the Plaxis Users Days in November 2009. All participating users took home a beta version of PLAXIS 3D and shared their experiences with us. Some of the previewers of these beta version already decided to become an early adopters by buying the new
PLAXIS 3D program which is to be released at the end of May. Check our agenda on regular base to see when we will be in your neighbourhood for the technical introduction of the challenging features of PLAXIS 3D. Furthermore Plaxis released a 64-bit kernel for PLAXIS VIP users of 3DFoundation and for the Plaxis-GiD users. This group of users can now easily analyse large models with significantly more than one hundred thousand elements.
News from our user groupsThe Dutch Plaxis user association (PGV) organised their annual meeting successfully in February of this year. The meeting took place in the office of Fugro Leidschendam, and included a number of presentations and a workshop on parameter
determinations using the Plaxis soil test module. Arny Lengkeek gave an overview of simulation results that were obtained by the SBW research program. Richard de Jager presented the simulation of advanced triaxial tests on sand and Flip Hoefsloot gave a nice presentation on soil testing in engineering practice. The participants simulated drained and un-drained triaxial tests and compared their results with actual test results. The case showed that a good fit could be found by adjusting the hardening soil parameters. The case also clearly illustrated that a good understanding of the theory on constitutive modelling is required, as a number of combinations of soil-parameters might produce near optimal results. To help user, Plaxis offers indications on physically admissible sets of parameters, which should be considered.
www.plaxis.nl l Spring issue 2010 l Plaxis bulletin 15
Plaxis launches webshop on www.plaxis.nl Since February 2010 the new webshop on www.plaxis.nl is up and running. Now ordering Plaxis software online is simple, fast, and secure through our website. The webshop can be found when browsing for information about our products. Next to each product on the right there is a price list and button to “place in cart”. All of our standard 2D and 3D products are available in the webshop and you can choose whether or not to subscribe your licence to our PLAXIS VIP service. The webshop is designed to quickly and easily guide you through all the steps to finalize your purchase.
Furthermore the first PLAXIS course is now also available via the webshop. This means you can
simply and easily register for courses online, and pay directly. At the moment this feature will only be available for certain courses, starting with the Standard Course on Computational Geotechnics in Manchester, to be held from June 22 till June 24 this year. Use the subscribe button near the top of the course page on our website to register for a course. We look forward to receiving your order and course registration.
Plaxis AsiaA two-day standard Plaxis course was jointly organised by our Asia office and Taiwan Agent from 5-6 Nov 2009. There were about 40 participants from both local consultants and academician attending the two-day course. The two-day course is so overwhelming that we
are planning another Plaxis course at the end of 2010. Plaxis has sponsored an International Symposium on Geotechnical Engineering, Ground Improvement, and Geosynthetics for Sustainable Mitigation and Adaptation to Climate Change Including Global Warming which was held from 3 to 4 December 2009 in Sofitel Centara Grand, Bangkok, Thailand. Plaxis has also delivered a paper on FEM application during the conference. Furthermore a Plaxis seminar was successfully organised by our Hong Kong Agent on 25th Nov 2009. There were almost 80 participants attended this seminar. There was also a one-day hands-on PLAXIS 3D course on the following day, which was well attended by 50 participants.
Title
16 Jalan Kilang Timor#05-08 Redhill Forum
159308 Singapore
P.O. Box 572 2600 AN Delft
The Netherlands
www.plaxis.nlTel +31 (0)15 2517 720Fax +31 (0)15 2573 107
Plaxis AsiaSingapore
Tel +65 6325 4191
Plaxis bvDelftechpark 53
2628 XJ Delft
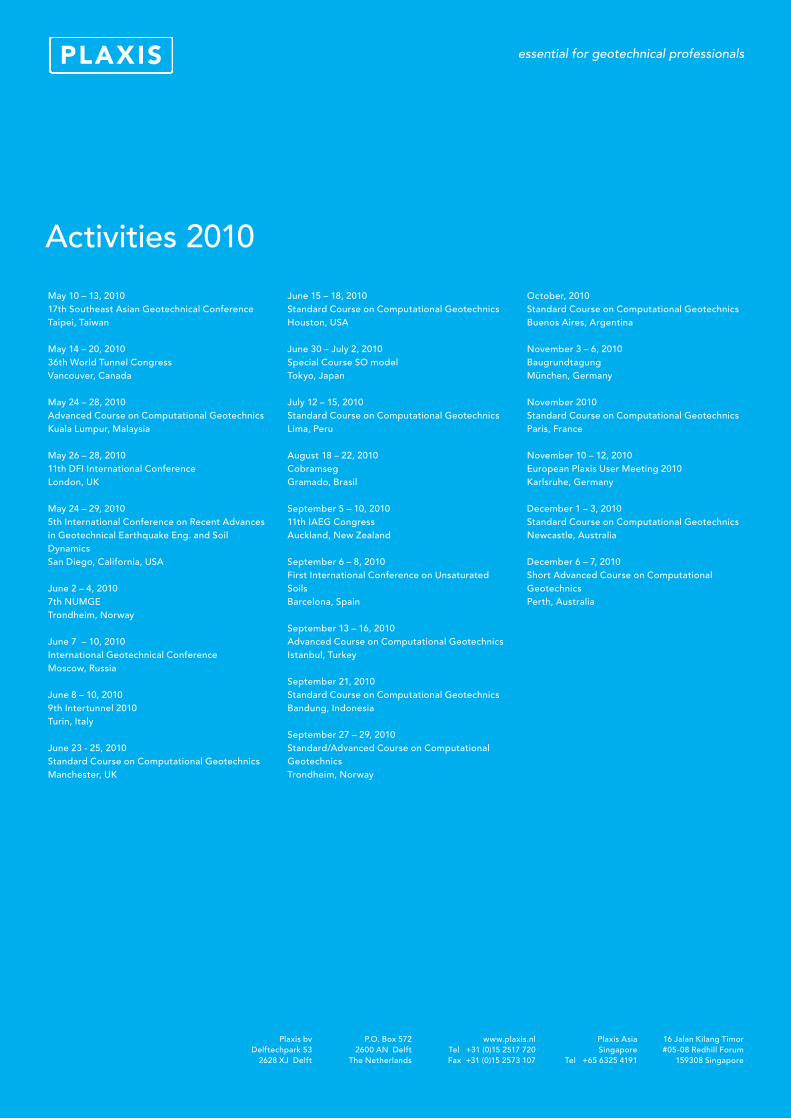
May 10 – 13, 201017th Southeast Asian Geotechnical ConferenceTaipei, Taiwan
May 14 – 20, 201036th World Tunnel CongressVancouver, Canada
May 24 – 28, 2010Advanced Course on Computational GeotechnicsKuala Lumpur, Malaysia
May 26 – 28, 201011th DFI International ConferenceLondon, UK
May 24 – 29, 20105th International Conference on Recent Advances in Geotechnical Earthquake Eng. and Soil DynamicsSan Diego, California, USA
June 2 – 4, 20107th NUMGETrondheim, Norway
June 7 – 10, 2010International Geotechnical ConferenceMoscow, Russia
June 8 – 10, 20109th Intertunnel 2010Turin, Italy
June 23 - 25, 2010Standard Course on Computational GeotechnicsManchester, UK
June 15 – 18, 2010Standard Course on Computational GeotechnicsHouston, USA
June 30 – July 2, 2010Special Course SO modelTokyo, Japan
July 12 – 15, 2010Standard Course on Computational GeotechnicsLima, Peru
August 18 – 22, 2010CobramsegGramado, Brasil
September 5 – 10, 201011th IAEG CongressAuckland, New Zealand
September 6 – 8, 2010 First International Conference on Unsaturated Soils Barcelona, Spain
September 13 – 16, 2010Advanced Course on Computational GeotechnicsIstanbul, Turkey
September 21, 2010Standard Course on Computational GeotechnicsBandung, Indonesia
September 27 – 29, 2010Standard/Advanced Course on Computational GeotechnicsTrondheim, Norway
October, 2010Standard Course on Computational GeotechnicsBuenos Aires, Argentina
November 3 – 6, 2010BaugrundtagungMünchen, Germany
November 2010Standard Course on Computational GeotechnicsParis, France
November 10 – 12, 2010European Plaxis User Meeting 2010Karlsruhe, Germany
December 1 – 3, 2010Standard Course on Computational GeotechnicsNewcastle, Australia
December 6 – 7, 2010Short Advanced Course on Computational GeotechnicsPerth, Australia
Activities 2010